awwa water loss control committee (wlcc) free water audit ... · non-revenue water as percent by...
TRANSCRIPT

THE FOLLOWING KEY APPLIES THROUGHOUT: Value can be entered by user
Value calculated based on input data
These cells contain recommended default values
Please begin by providing the following information, then proceed through each sheet in the workbook:
NAME OF CITY OR UTILITY: COUNTRY:
REPORTING YEAR: 2009 START DATE(MM/YYYY): 10/2008 END DATE(MM/YYYY): 09/2009
NAME OF CONTACT PERSON: E-MAIL:Ext.
PLEASE SELECT PREFERRED REPORTING UNITS FOR WATER VOLUME:
Click to advance to sheet… Click here: for help about units and conversions
Comments:
If you have questions or comments regarding the software please contact us at: [email protected]
Scotts Valley Water District
AWWA Water Loss Control Committee (WLCC) Free Water Audit Software v4.1
USE: The spreadsheet contains several separate worksheets. Sheets can be accessed using the tabs towards the bottom of the screen,or by clicking the buttons on the left below. Descriptions of each sheet are also given below.
PURPOSE: This spreadsheet-based water audit tool is designed to help quantify and track water losses associated with water distribution systems and identify areas for improved efficiency and cost recovery. It provides a "top-down" summary water audit
format, and is not meant to take the place of a full-scale, comprehensive water audit format.
USA
831.438.2363TELEPHONE:
Acre-feet
Enter the required data on this worksheet to calculate the water balance
Jessica Perak [email protected]
The current sheet
The values entered in the Reporting Worksheet are used to populate the water balance
Depending on the confidence of audit inputs, a grading is assigned to the audit score
Use this sheet to understand terms used in the audit process
Use this sheet to interpret the results of the audit validity score and performance indicators
Diagrams depicting possible customer service connection configurations
Instructions
Reporting Worksheet
Loss Control Planning
Water Balance
Definitions
Copyright © 2010, American Water Works Association. All Rights Reserved. WAS v4.1
?
Grading Matrix
Add comments here to track additional
supporting information, sources or names of
participants
Service Connections
AWWA Water Loss Control Committee Instructions 1

Water Audit Report for: Scotts Valley Water DistrictReporting Year:
All volumes to be entered as: ACRE-FEET PER YEAR
WATER SUPPLIED
Volume from own sources: 8 1,507.000 acre-ft/yrMaster meter error adjustment (enter positive value): 8
Water imported: n/a 0.000 acre-ft/yr
Water exported: n/a 0.000 acre-ft/yr
WATER SUPPLIED: 1,507.000 acre-ft/yr.
AUTHORIZED CONSUMPTIONBilled metered: 10 1,339.000 acre-ft/yr
Billed unmetered: 10 0.000 acre-ft/yrUnbilled metered: 10 10.000 acre-ft/yr Pcnt: Value:
Unbilled unmetered: 18.838 acre-ft/yr 1.25%
AUTHORIZED CONSUMPTION: 1,367.838 acre-ft/yr
WATER LOSSES (Water Supplied - Authorized Consumption) 139.163 acre-ft/yr
Apparent Losses Pcnt: Value:Unauthorized consumption: 3.768 acre-ft/yr 0.25%
Customer metering inaccuracies: 8 0.000 acre-ft/yr
Systematic data handling errors: 9 0.250 acre-ft/yr
Apparent Losses: 4.018
Real Losses (Current Annual Real Losses or CARL)Real Losses = Water Losses - Apparent Losses: 135.145 acre-ft/yr
WATER LOSSES: 139.163 acre-ft/yr
NON-REVENUE WATERNON-REVENUE WATER: 168.000 acre-ft/yr
= Total Water Loss + Unbilled Metered + Unbilled Unmetered
SYSTEM DATA
Length of mains: 7 62.0 milesNumber of active AND inactive service connections: 8 3,859
Connection density: 62 conn./mile mainAverage length of customer service line: 8 33.0 ft
Average operating pressure: 7 120.0 psi
COST DATA
Total annual cost of operating water system: 8 $4,627,200 $/Year
Customer retail unit cost (applied to Apparent Losses): 9 $8.71Variable production cost (applied to Real Losses): 8 $1,994.21 $/acre-ft/yr
PERFORMANCE INDICATORS
Financial IndicatorsNon-revenue water as percent by volume of Water Supplied: 11.1%Non-revenue water as percent by cost of operating system: 7.3%
Annual cost of Apparent Losses: $11,402Annual cost of Real Losses: $269,508
Operational Efficiency Indicators
Apparent Losses per service connection per day: 0.93 gallons/connection/day
Real Losses per service connection per day*: 31.26 gallons/connection/day
Real Losses per length of main per day*: N/A
Real Losses per service connection per day per psi pressure: 0.26 gallons/connection/day/psi
Unavoidable Annual Real Losses (UARL): 47.97 million gallons/year
From Above, Real Losses = Current Annual Real Losses (CARL): 135.15 million gallons/year
0.92
* only the most applicable of these two indicators will be calculated
WATER AUDIT DATA VALIDITY SCORE:
PRIORITY AREAS FOR ATTENTION:
1: Volume from own sources
2: Unauthorized consumption
3: Customer metering inaccuracies
Default option selected for Unbilled unmetered - a grading of 5 is applied but not displayed
AWWA WLCC Free Water Audit Software: Reporting Worksheet
2009 10/2008 - 9/2009
<< Enter grading in column 'E'
acre-ft/yr
Default option selected for unauthorized consumption - a grading of 5 is applied but not displayed
Choose this option to enter a percentage of
billed metered consumption. This is NOT a default value
$/1000 gallons (US)
A weighted scale for the components of consumption and water loss is included in the calculation of the Water Audit Data Validity Score
Based on the information provided, audit accuracy can be improved by addressing the following components:
*** YOUR SCORE IS: 83 out of 100 ***
Infrastructure Leakage Index (ILI) [CARL/UARL]:
?
?
?
?
?
? Click to access definition
?
?
?
?
?
?
Back to Instructions
Please enter data in the white cells below. Where available, metered values should be used; if metered values are unavailable please estimate a value. Indicate your confidence in the accuracy of the input data by grading each component (1-10) using the drop-down list to the left of the input cell. Hover the mouse over the cell to obtain a description of the grades
?
?
?
???
?
?
?
(pipe length between curbstop and customer meter or property boundary)
Use buttons to selectpercentage of water supplied
ORvalue
?Click here: for help using option buttons below
For more information, click here to see the Grading Matrix worksheet
?
Copyright © 2010, American Water Works Association. All Rights Reserved.
?
?
?
?
WAS v4.1
AWWA Water Loss Control Committee Reporting Worksheet 2
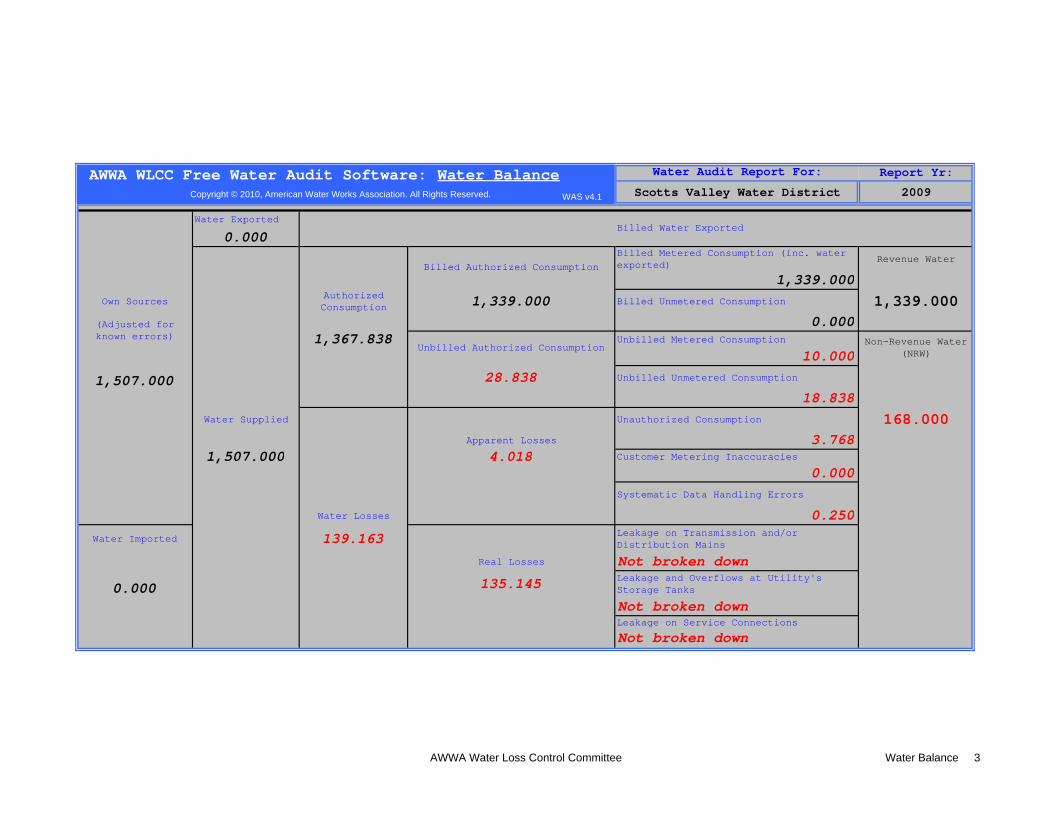
Water Audit Report For: Report Yr:
Scotts Valley Water District 2009
Water Exported
0.000Billed Metered Consumption (inc. water exported)
Revenue Water
1,339.000Own Sources
Authorized Consumption 1,339.000 Billed Unmetered Consumption 1,339.000
0.0001,367.838 Unbilled Metered Consumption
10.000
1,507.000 28.838 Unbilled Unmetered Consumption
18.838Water Supplied Unauthorized Consumption 168.000
Apparent Losses 3.7681,507.000 4.018 Customer Metering Inaccuracies
0.000Systematic Data Handling Errors
Water Losses 0.250
Water Imported 139.163 Leakage on Transmission and/or Distribution Mains
Real Losses Not broken down
0.000 135.145 Leakage and Overflows at Utility's Storage Tanks
Not broken downLeakage on Service Connections
Not broken down
Non-Revenue Water (NRW)
AWWA WLCC Free Water Audit Software: Water Balance
Billed Authorized Consumption
Unbilled Authorized Consumption
(Adjusted for known errors)
Billed Water Exported
Copyright © 2010, American Water Works Association. All Rights Reserved. WAS v4.1
AWWA Water Loss Control Committee Water Balance 3

n/a 1 2 3 4 5 6 7 8 9 10
Volume from own sources:
Select this grading only if the water
utility purchases/imports
all of its water resources (i.e. has no sources of its
own)
Less than 25% of water production sources are
metered, remaining sources are estimated. No regular
meter accuracy testing.
25% - 50% of treated water production sources are metered;
other sources estimated. No regular meter accuracy testing.
Conditions between 2 and 4
50% - 75% of treated water production sources are metered,
other sources estimated. Occasional meter accuracy testing
Conditions between 4 and 6
At least 75% of treated water production sources are metered, or at least 90% of the source flow is derived from metered sources.
Meter accuracy testing and/or electronic calibration conducted
annually. Less than 25% of tested meters are found outside of +/-
6% accuracy.
Conditions between 6 and 8
100% of treated water production sources are metered, meter
accuracy testing and electronic calibration conducted annually,
less than 10% of meters are found outside of +/- 6% accuracy
Conditions between 8 and 10
100% of treated water production sources are metered, meter
accuracy testing and electronic calibration conducted semi-annually, with less than 10%
found outside of +/- 3% accuracy.
Improvements to attain higher data grading for "Volume from
own Sources" component:
to qualify for 2:Organize efforts to begin to collect data for determining volume from own sources
to maintain 10:Standardize meter accuracy test
frequency to semi-annual, or more frequent, for all meters. Repair or replace meters outside of +/- 3%
accuracy. Continually investigate/pilot improving
metering technology.
Master meter error adjustment:
Select n/a only if the water utility fails to have meters on
its sources of supply, either its
own source, and/or imported
(purchased) water sources
Inventory information on meters and paper records of measured volumes in crude
condition; data error cannot be determined
No automatic datalogging of production volumes; daily
readings are scribed on paper records. Tank/storage elevation
changes are not employed in calculating "Volume from own sources" component. Data is adjusted only when grossly evident data error occurs.
Conditions between 2 and 4
Production meter data is logged automatically in electronic format
and reviewed at least on a monthly basis. "Volume from own
sources" tabulations include estimate of daily changes in
tanks/storage facilities. Meter data is adjusted when gross data errors occur, or occasional meter
testing deems this necessary.
Conditions between 4 and 6
Hourly production meter data logged automatically & reviewed on at least a weekly basis. Data adjusted to correct gross error
from equipment malfunction and error confirmed by meter accuracy
testing. Tank/storage facility elevation changes are
automatically used in calculating a balanced "Volume from own
sources" component.
Conditions between 6 and 8
Continuous production meter data logged automatically & reviewed daily. Data adjusted to correct
gross error from equipment malfunction & results of meter
accuracy testing. Tank/storage facility elevation changes are automatically used in "Volume from own sources" tabulations.
Conditions between 8 and 10
Computerized system (SCADA or similar) automatically balances
flows from all sources and storages; results reviewed daily.
Mass balance technique compares production meter data
to raw (untreated) water and treatment volumes to detect
anomalies. Regular calibrations between SCADA and sources meters ensures minimal data
transfer error.
Improvements to attain higher data grading for "Master meter error adjustment" component:
to qualify for 2:Develop plan to restructure
recordkeeping system to capture all flow data; set
procedure to review data daily to detect input errors
to maintain 10:Monitor meter innovations for
development of more accurate and less expensive flowmeters.
Continue to replace or repair meters as they perform outside of
desired accuracy limits.
Water Imported:
Select n/a if the water utility's supply is exclusively from
its own water resources (no bulk
purchased/ imported water)
Less than 25% of imported water sources are metered,
remaining sources are estimated. No regular meter
accuracy testing.
25% - 50% of imported water sources are metered; other
sources estimated. No regular meter accuracy testing.
Conditions between 2 and 4
50% - 75% of imported water sources are metered, other
sources estimated. Occasional meter accuracy testing
Conditions between 4 and 6
At least 75% of imported water sources are metered, meter
accuracy testing and/or electronic calibration conducted annually. Less than 25% of tested meters
are found outside of +/- 6% accuracy.
Conditions between 6 and 8
100% of imported water sources are metered, meter accuracy
testing and/or electronic calibration conducted annually,
less than 10% of meters are found outside of +/- 6% accuracy
Conditions between 8 and 10
100% of imported water sources are metered, meter accuracy
testing and/or electronic calibration conducted semi-annually, with less than 10%
found outside of +/- 3% accuracy.
Improvements to attain higher data grading for "Water
Imported Volume" component:
to qualify for 2:Review bulk water purchase
agreements with partner suppliers; confirm
requirements for use and maintenance of accurate
metering. Identify needs for new or replacement meters
with goal to meter all imported water sources.
to maintain 10:Standardize meter accuracy test
frequency to semi-annual, or more frequent, for all meters. Repair or replace meters outside of +/- 3%
accuracy. Continually investigate/pilot improving
metering technology.
to qualify for 10:Maintain annual meter accuracy testing for all
meters. Repair or replace meters outside of +/- 6% accuracy. Investigate new meter
technology; pilot one or more replacements with innovative meters in attempt to improve
meter accuracy.
to qualify for 10:Maintain annual meter accuracy testing for all
meters. Repair or replace meters outside of +/- 6% accuracy. Investigate new meter
technology; pilot one or more replacements with innovative meters in attempt to improve
meter accuracy.
to qualify for 4:Locate all water production sources on maps and in field, launch meter accuracy testing for
existing meters, begin to install meters on unmetered water production sources and
replace any obsolete/defective meters
to qualify for 6 :Formalize annual meter accuracy testing for all source meters. Complete installation of meters
on unmetered water production sources and complete replacement of all obsolete/defective
meters.
to qualify for 8:Conduct annual meter accuracy testing on all meters. Complete project to install new, or
replace defective existing, meters so that entire production meter population is metered. Repair or replace meters outside of +/- 6% accuracy.
to qualify for 10 :Link all production and tank/storage facility
elevation change data to a Supervisory Control & Data Acquisition (SCADA) System, or similar computerized monitoring/control system, and establish automatic flow balancing algorithm and regularly calibrate between SCADA and
source meters.
to qualify for 4 :Install automatic datalogging equipment on production meters. Identify tanks/storage
facilities and include estimated daily volume of water added to, or subtracted from, "Water Supplied" volume based upon changes in
storage
To qualify for 4:Locate all imported water sources on maps and
in field, launch meter accuracy testing for existing meters, begin to install meters on
unmetered imported water interconnections and replace obsolete/defective meters
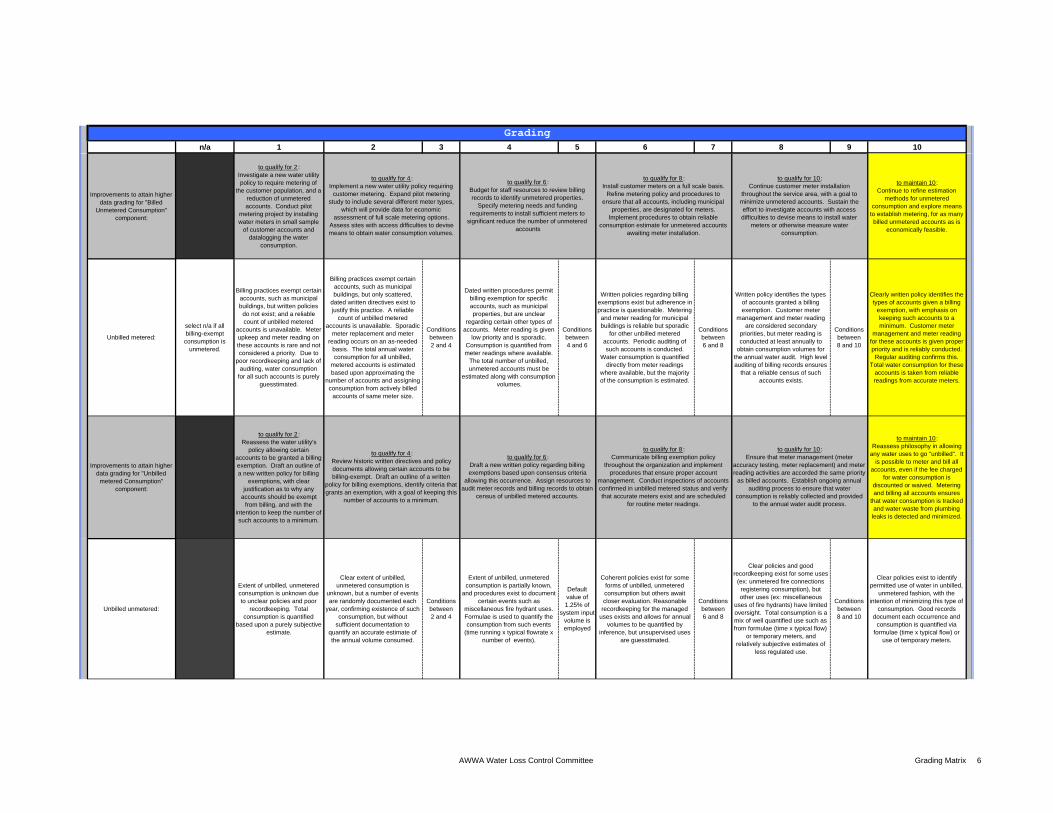
AWWA WLCC Free Water Audit Software: Grading Matrix
In the Reporting Worksheet, grades were assigned to each component of the audit to describe the confidence and accuracy of the input data. The grading assigned to each audit component and the corresponding recommended improvements and actions are highlighted in yellow. Audit accuracy is likely to be improved by prioritizing those items shown in red
Grading
to qualify for 6 :Review hourly production meter data for gross
error on, at least, a weekly basis. Begin to install instrumentation on tanks/storage facilities
to record elevation changes. Use daily net storage change to balance flows in calculating
"Water Supplied" volume.
to qualify for 8 :Complete installation of elevation
instrumentation on all tanks/storage facilities. Continue to use daily net storage change in
calculating balanced "Volume from own sources" component. Adjust production meter data for gross error and inaccuracy confirmed
by testing.
to qualify for 6 :Formalize annual meter accuracy testing for all imported water meters. Continue installation of
meters on unmetered exported water interconnections and replacement of
obsolete/defective meters.
to qualify for 8 :Complete project to install new, or replace
defective, meters on all imported water interconnections. Maintain annual meter
accuracy testing for all imported water meters. Repair or replace meters outside of +/- 6%
accuracy.
Back to InstructionsCopyright © 2010, American Water Works Association. All Rights Reserved. WASv 4.1
Back to Instructions
AWWA Water Loss Control Committee Grading Matrix 4

n/a 1 2 3 4 5 6 7 8 9 10
Grading
Water Exported:
Select n/a if the water utility sells no
bulk water to neighboring water
utilities (no exported water sales)
Less than 25% of exported water sources are metered,
remaining sources are estimated. No regular meter
accuracy testing.
25% - 50% of exported water sources are metered; other
sources estimated. No regular meter accuracy testing.
Conditions between 2 and 4
50% - 75% of exported water sources are metered, other
sources estimated. Occasional meter accuracy testing
Conditions between 4 and 6
At least 75% of exported water sources are metered, meter
accuracy testing and/or electronic calibration conducted annually. Less than 25% of tested meters
are found outside of +/- 6% accuracy.
Conditions between 6 and 8
100% of exported water sources are metered, meter accuracy
testing and/or electronic calibration conducted annually,
less than 10% of meters are found outside of +/- 6% accuracy
Conditions between 8 and 10
100% of exported water sources are metered, meter accuracy
testing and/or electronic calibration conducted semi-annually, with less than 10%
found outside of +/- 3% accuracy.
Improvements to attain higher data grading for "Water
Exported Volume" component:
to qualify for 2:Review bulk water sales agreements with partner
suppliers; confirm requirements for use & upkeep of accurate metering. Identify
needs to install new, or replace defective meters as needed.
to maintain 10:Standardize meter accuracy test
frequency to semi-annual, or more frequent, for all meters. Repair or replace meters outside of +/- 3%
accuracy. Continually investigate/pilot improving
metering technology.
Billed metered:
n/a (not applicable). Select n/a only if
the entire customer population is not metered and is billed for water
service on a flat or fixed rate basis. In such a case the volume entered must be zero.
Less than 50% of customers with volume-based billings from meter readings; flat or
fixed rate billed for the majority of the customer population
At least 50% of customers with volume-based billing from meter reads; flat rate billed for others.
Manual meter reading, under 50% read success rate, remainder
estimated. Limited meter records, no regular meter testing or replacement. Billing data
maintained on paper records, with no auditing.
Conditions between 2 and 4
At least 75% of customers with volume-based billing from meter reads; flat or fixed rate billed for
remainder. Manual meter reading used, at least 50% meter read success rate, failed reads are estimated. Purchase records verify age of customer meters;
only very limited meter accuracy testing is conducted. Customer
meters replaced only upon complete failure. Computerized billing records, but only periodic
internal auditing conducted.
Conditions between 4 and 6
At least 90% of customers with volume-based billing from meter reads; remaining accounts are estimated. Manual customer
meter reading gives at least 80% customer meter reading success rate, failed reads are estimated. Good customer meter records, limited meter accuracy testing, regular replacement of oldest meters. Computerized billing
records with routine auditing of global statistics.
Conditions between 6 and 8
At least 97% of customers with volume-based billing from meter reads. At least 90% customer
meter read success rate; or minimum 80% read success rate with planning and budgeting for
trials of Automatic Metering Reading (AMR) in one or more
pilot areas. Good customer meter records. Regular meter accuracy
testing guides replacement of statistically significant number of
meters each year. Routine auditing of computerized billing records for global and detailed
statistics; verified periodically by third party.
Conditions between 8 and 10
At least 99% of customers with volume-based billing from meter reads. At least 95% customer meter reading success rate; or minimum 80% meter reading success rate, with Automatic Meter Reading (AMR) trials
underway. Statistically significant customer meter testing and
replacement program in place. Computerized billing with routine, detailed auditing, including field investigation of representative
sample of accounts. Annual audit verification by third party.
Improvements to attain higher data grading for "Billed Metered Consumption"
component:
If n/a is selected because the
customer meter population is unmetered,
consider establishing a new policy to meter the
customer population and
employ water rates based upon
metered volumes.
to qualify for 2 :Conduct investigations or trials of customer meters to select appropriate meter models. Budget funding for meter installations. Investigate volume based water rate
structures.
to maintain 10:Regular internal and third party auditing, and meter accuracy testing ensures that accurate customer meter readings are
obtained and entered as the basis for volume based billing. Stay
abreast of improvements in Advanced Metering Infrastructure
(AMI) and information management. Plan and budget
for justified upgrades in metering, meter reading and billing data
management.
Billed unmetered:
Select n/a if it is the policy of the water utility to meter all
customer connections and it
has been confirmed by detailed auditing that all customers do indeed have a
water meter; i.e. no unmetered
accounts exist
Water utility policy does not require customer metering; flat
or fixed fee billed. No data collected on customer
consumption. Only estimates available are derived from data
estimation methods using average fixture count multiplied by number of connections, or
similar approach.
Water utility policy does not require customer metering; flat or fixed fee billed. Some metered
accounts exist in parts of the system (pilot areas or District
Metered Areas) with consumption recorded on portable dataloggers.
Data from these sample meters are used to infer consumption for
the total customer population. Site specific estimation methods
are used for unusual buildings/water uses.
Conditions between 2 and 4
Water utility policy does require metering and volume based billing but lacks written procedures and
employs casual oversight, resulting in up to 20% of billed
accounts believed to be unmetered. A rough estimate of the annual consumption for all
unmetered accounts is included in the annual water audit, with no
inspection of individual unmetered accounts.
Conditions between 4 and 6
Water utility policy does require metering and volume based billing but exemption exist for a portion of accounts such as municipal buildings. As many as 15% of billed accounts are unmetered due to this exemption or meter installation difficulties. Only a
group estimate of annual consumption for all unmetered
accounts is included in the annual water audit, with no inspection of individual unmetered accounts.
Conditions between 6 and 8
Water utility policy requires metering and volume based billing
for all customer accounts. However, less than 5% of billed
accounts remain unmetered because because installation is
hindered by unusual circumstances. The goal is to
minimize the number of unmetered accounts. Reliable estimates of consumption are
obtained for unmetered accounts via site specific estimation
methods.
Conditions between 8 and 10
Water utility policy requires metering and volume based billing
for all customer accounts. Less than 2% of billed accounts are unmetered and exist because
meter installation is hindered by unusual circumstances. The goal exists to minimize the number of unmetered accounts to the extent
that is economical. Reliable estimates of consumption are obtained at these accounts via
site specific estimation methods.
to qualify for 4 :Purchase and install meters on unmetered
accounts. Implement policies to improve meter reading success. Catalog meter information
during meter read visits to identify age/model of existing meters. Test a minimal number of meters for accuracy. Install computerized
billing system.
to qualify for 6 :Purchase and install meters on unmetered
accounts. Eliminate flat fee billing and establish appropriate water rate structure based
upon measured consumption. Continue to achieve verifiable success in removing manual meter reading barriers. Expand meter accuracy
testing. Launch regular meter replacement program. Conduct routine audit of global
statistics.
to qualify for 8 :Purchase and install meters on unmetered
accounts. Assess cost-effectiveness of Automatic Meter Reading (AMR) system for portion or entire system; or achieve ongoing
improvements in manual meter reading success rate. Refine meter accuracy testing program.
Set meter replacement goals based upon accuracy test results. Refine routine auditing procedures based upon third party guidance.
to qualify for 10 :Purchase and install meters on unmetered
accounts. Launch Automatic Meter Reading (AMR) system trials if manual meter reading success rate of at least 95% is not achieved within a five-year program. Continue meter
accuracy testing program. Conduct planning and budgeting for large scale meter
replacement based upon meter life cycle analysis using cumulative flow target. Continue routine auditing and require annual third party
review.
To qualify for 4:Locate all exported water sources on maps and
in field, launch meter accuracy testing for existing meters, begin to install meters on
unmetered exported water interconnections and replace obsolete/defective meters
to qualify for 6 :Formalize annual meter accuracy testing for all exported water meters. Continue installation of
meters on unmetered exported water interconnections and replacement of
obsolete/defective meters.
to qualify for 8 :Complete project to install new, or replace
defective, meters on all exported water interconnections. Maintain annual meter
accuracy testing for all imported water meters. Repair or replace meters outside of +/- 6%
accuracy.
to qualify for 10:Maintain annual meter accuracy testing for all
meters. Repair or replace meters outside of +/- 6% accuracy. Investigate new meter
technology; pilot one or more replacements with innovative meters in attempt to improve
meter accuracy.
AUTHORIZED CONSUMPTION
AWWA Water Loss Control Committee Grading Matrix 5
n/a 1 2 3 4 5 6 7 8 9 10
Grading
Improvements to attain higher data grading for "Billed
Unmetered Consumption" component:
to qualify for 2 : Investigate a new water utility policy to require metering of
the customer population, and a reduction of unmetered accounts. Conduct pilot
metering project by installing water meters in small sample
of customer accounts and datalogging the water
consumption.
to maintain 10: Continue to refine estimation
methods for unmetered consumption and explore means
to establish metering, for as many billed unmetered accounts as is
economically feasible.
Unbilled metered:
select n/a if all billing-exempt consumption is
unmetered.
Billing practices exempt certain accounts, such as municipal buildings, but written policies
do not exist; and a reliable count of unbilled metered
accounts is unavailable. Meter upkeep and meter reading on these accounts is rare and not considered a priority. Due to
poor recordkeeping and lack of auditing, water consumption
for all such accounts is purely guesstimated.
Billing practices exempt certain accounts, such as municipal buildings, but only scattered,
dated written directives exist to justify this practice. A reliable
count of unbilled metered accounts is unavailable. Sporadic
meter replacement and meter reading occurs on an as-needed
basis. The total annual water consumption for all unbilled,
metered accounts is estimated based upon approximating the
number of accounts and assigning consumption from actively billed
accounts of same meter size.
Conditions between 2 and 4
Dated written procedures permit billing exemption for specific accounts, such as municipal properties, but are unclear
regarding certain other types of accounts. Meter reading is given
low priority and is sporadic. Consumption is quantified from meter readings where available.
The total number of unbilled, unmetered accounts must be
estimated along with consumption volumes.
Conditions between 4 and 6
Written policies regarding billing exemptions exist but adherence in practice is questionable. Metering and meter reading for municipal buildings is reliable but sporadic
for other unbilled metered accounts. Periodic auditing of such accounts is conducted.
Water consumption is quantified directly from meter readings
where available, but the majority of the consumption is estimated.
Conditions between 6 and 8
Written policy identifies the types of accounts granted a billing exemption. Customer meter
management and meter reading are considered secondary
priorities, but meter reading is conducted at least annually to
obtain consumption volumes for the annual water audit. High level auditing of billing records ensures
that a reliable census of such accounts exists.
Conditions between 8 and 10
Clearly written policy identifies the types of accounts given a billing
exemption, with emphasis on keeping such accounts to a minimum. Customer meter
management and meter reading for these accounts is given proper priority and is reliably conducted. Regular auditing confirms this.
Total water consumption for these accounts is taken from reliable readings from accurate meters.
Improvements to attain higher data grading for "Unbilled
metered Consumption" component:
to qualify for 2 :Reassess the water utility's
policy allowing certain accounts to be granted a billing exemption. Draft an outline of a new written policy for billing
exemptions, with clear justification as to why any
accounts should be exempt from billing, and with the
intention to keep the number of such accounts to a minimum.
to maintain 10:Reassess philosophy in allowing
any water uses to go "unbilled". It is possible to meter and bill all
accounts, even if the fee charged for water consumption is
discounted or waived. Metering and billing all accounts ensures
that water consumption is tracked and water waste from plumbing leaks is detected and minimized.
Unbilled unmetered:
Extent of unbilled, unmetered consumption is unknown due to unclear policies and poor
recordkeeping. Total consumption is quantified
based upon a purely subjective estimate.
Clear extent of unbilled, unmetered consumption is
unknown, but a number of events are randomly documented each
year, confirming existence of such consumption, but without
sufficient documentation to quantify an accurate estimate of the annual volume consumed.
Conditions between 2 and 4
Extent of unbilled, unmetered consumption is partially known,
and procedures exist to document certain events such as
miscellaneous fire hydrant uses. Formulae is used to quantify the consumption from such events
(time running x typical flowrate x number of events).
Default value of 1.25% of
system input volume is employed
Coherent policies exist for some forms of unbilled, unmetered consumption but others await closer evaluation. Reasonable
recordkeeping for the managed uses exists and allows for annual
volumes to be quantified by inference, but unsupervised uses
are guesstimated.
Conditions between 6 and 8
Clear policies and good recordkeeping exist for some uses
(ex: unmetered fire connections registering consumption), but other uses (ex: miscellaneous
uses of fire hydrants) have limited oversight. Total consumption is a mix of well quantified use such as from formulae (time x typical flow)
or temporary meters, and relatively subjective estimates of
less regulated use.
Conditions between 8 and 10
Clear policies exist to identify permitted use of water in unbilled,
unmetered fashion, with the intention of minimizing this type of
consumption. Good records document each occurrence and
consumption is quantified via formulae (time x typical flow) or
use of temporary meters.
to qualify for 8 :Install customer meters on a full scale basis.
Refine metering policy and procedures to ensure that all accounts, including municipal
properties, are designated for meters. Implement procedures to obtain reliable
consumption estimate for unmetered accounts awaiting meter installation.
to qualify for 10 :Continue customer meter installation
throughout the service area, with a goal to minimize unmetered accounts. Sustain the effort to investigate accounts with access difficulties to devise means to install water
meters or otherwise measure water consumption.
to qualify for 8 :Communicate billing exemption policy
throughout the organization and implement procedures that ensure proper account
management. Conduct inspections of accounts confirmed in unbilled metered status and verify that accurate meters exist and are scheduled
for routine meter readings.
to qualify for 10 :Ensure that meter management (meter
accuracy testing, meter replacement) and meter reading activities are accorded the same priority
as billed accounts. Establish ongoing annual auditing process to ensure that water
consumption is reliably collected and provided to the annual water audit process.
to qualify for 4 : Implement a new water utility policy requiring
customer metering. Expand pilot metering study to include several different meter types,
which will provide data for economic assessment of full scale metering options.
Assess sites with access difficulties to devise means to obtain water consumption volumes.
to qualify for 6 :Budget for staff resources to review billing records to identify unmetered properties.
Specify metering needs and funding requirements to install sufficient meters to
significant reduce the number of unmetered accounts
to qualify for 4 :Review historic written directives and policy documents allowing certain accounts to be billing-exempt. Draft an outline of a written
policy for billing exemptions, identify criteria that grants an exemption, with a goal of keeping this
number of accounts to a minimum.
to qualify for 6 :Draft a new written policy regarding billing exemptions based upon consensus criteria
allowing this occurrence. Assign resources to audit meter records and billing records to obtain
census of unbilled metered accounts.
AWWA Water Loss Control Committee Grading Matrix 6

n/a 1 2 3 4 5 6 7 8 9 10
Grading
Improvements to attain higher data grading for "Unbilled Unmetered Consumption"
component:
to qualify for 5 :Utilize accepted default value
of 1.25% of system input volume as an expedient means
to gain a reasonable quantification of this use.
to qualify for 2 :Establish a policy regarding what water uses should be
allowed as unbilled and unmetered. Consider tracking
a small sample of one such use (ex: fire hydrant flushings).
to qualify for 5 :Utilize accepted default value of 1.25% of system input volume as
expedient means to gain a reasonable quantification of all such use. This is particularly
appropriate for water utilities who are in the early stages of the
water auditing process.
to qualify for 6 or greater:
Finalize policy and
do field checks.
Proceed if top-down
audit exists and/or a
great volume of
such use is suspected.
to maintain 10:Continue to refine policy and procedures with intention of
reducing the number of allowable uses of water in unbilled and
unmetered fashion. Any uses that can feasibly become billed and metered should be converted
eventually.
Unauthorized consumption:
Extent of unauthorized consumption is unknown due to unclear policies and poor
recordkeeping. Total unauthorized consumption is
guesstimated.
Unauthorized consumption is a known occurrence, but its extent
is a mystery. There are no requirements to document
observed events, but periodic field reports capture some of these
occurrences. Total unauthorized consumption is approximated from
this limited data.
conditions between 2
and 4
Procedures exist to document some unauthorized consumption such as observed unauthorized
fire hydrant openings. Use formulae to quantify this
consumption (time running x typical flowrate x number of
events).
Default value of 0.25% of
system input volume is employed
Coherent policies exist for some forms of unauthorized
consumption but others await closer evaluation. Reasonable surveillance and recordkeeping
exist for occurrences that fall under the policy. Volumes
quantified by inference from these records. Unsupervised uses are
guesstimated.
Conditions between 6 and 8
Clear policies and good recordkeeping exist for certain
events (ex: tampering with water meters); other occurrences have
limited oversight. Total consumption is a combination of volumes from formulae (time x
typical flow) and subjective estimates of unconfirmed
consumption.
Conditions between 8 and 10
Clear policies exist to identify all known unauthorized uses of
water. Staff and procedures exist to provide enforcement of policies
and detect violations. Each occurrence is quantified via
formulae (time x typical flow) or similar methods.
Improvements to attain higher data grading for "Unauthorized
Consumption" component:
to qualify for 5 :Use accepted default of 0.25%
of system input volume.to qualify for 2 :
Review utility policy regarding what water uses are
considered unauthorized, and consider tracking a small
sample of one such occurrence (ex: unauthorized fire hydrant
openings)
to qualify for 5 :Utilize accepted default value of 0.25% of system input volume as
expedient means to gain a reasonable quantification of all such use. This is particularly
appropriate for water utilities who are in the early stages of the
water auditing process.
to qualify for 6 or greater:
Finalize policy and
do field checks.
Proceed if top-down
audit exists and/or a
great volume of
such use is suspected.
to maintain 10:Continue to refine policy and procedures to eliminate any
loopholes that allow or tacitly encourage unauthorized
consumption. Continue to be vigilant in documentation and
enforcement efforts.
Customer metering inaccuracies:
select n/a only if the entire customer
population is unmetered. In such a case the volume entered must be
zero.
Customer meters exist, but with unorganized paper records on
meters; no meter accuracy testing or meter replacement program. Workflow is driven
chaotically by customer complaints with no proactive management. Loss volume
due to aggregate meter inaccuracy is guesstimated.
Poor recordkeeping and meter oversight is recognized by water
utility management who has allotted staff and funding
resources to organize improved recordkeeping and start meter
accuracy testing. Existing paper records gathered and organized to
provide cursory disposition of meter population.
Conditions between 2 and 4
Reliable recordkeeping exists; meter information is improving as
meters are replaced. Meter accuracy testing is conducted annually for a small number of
meters. Limited number of oldest meters replaced each year.
Inaccuracy volume is largely an estimate, but refined based upon
limited testing data.
Conditions between 4 and 6
A reliable electronic recordkeeping system for meters exists. Population includes a mix of new high performing meters and dated meters with suspect accuracy. Routine, but limited,
meter accuracy testing and meter replacement occur. Inaccuracy
volume is quantified using a mix of reliable and less certain data.
Conditions between 6 and 8
Ongoing meter replacement and accuracy testing result in highly
accurate customer meter population. Testing is conducted on samples of meters at varying lifespans to determine optimum
replacement time for various types of meters.
Conditions between 8 and 10
Good records of number, type and size of customer meters; ongoing
meter replacement occurs. Regular meter accuracy testing
gives reliable measure of composite inaccuracy volume for
the system. New metering technology is embraced to keep
overall accuracy improving.
Improvements to attain higher data grading for "Customer meter inaccuracy volume"
component:
If n/a is selected because the
customer meter population is unmetered,
consider establishing a new policy to meter the
customer population and
employ water rates based upon
metered volumes.
to qualify for 2 :Gather available meter
purchase records. Conduct testing on a small number of
meters believed to be the most inaccurate. Review staffing needs of metering group and
budget for necessary resources to better organize
meter management.
to maintain 10:Increase the number of meters
tested and replaced as justified by meter accuracy test data.
Continually monitor development of new technology in Advanced Metering Infrastructure (AMI) to grasp opportunities for greater
accuracy in metering and customer consumption data.
to qualify for 4 :Implement a reliable record keeping system for
customer meter histories, preferably using electronic methods typically linked to, or part of,
the Customer Billing System or Customer Information System. Expand meter accuracy
testing to a larger group of meters.
to qualify for 6 :Standardize procedures for meter
recordkeeping with the electronic information system. Accelerate meter accuracy testing and meter replacements guided by testing results.
to qualify for 8 :Expand annual meter accuracy testing to
evaluate a statistically significant number of meter makes/models. Expand meter
replacement program to replace statistically significant number of poor performing meters
each year.
to qualify for 10 :Continue efforts to manage meter population with reliable recordkeeping, meter testing and replacement. Evaluate new meter types and
install one or more types in 5-10 customer accounts each year in order to pilot improving
metering technology.
APPARENT LOSSES
to qualify for 5 :Utilize accepted default value of 1.25% of
system input volume as an expedient means to gain a reasonable quantification of this use.
to qualify for 4 :Evaluate the documentation of events that have been observed. Meet with user groups (ex: for fire hydrants - fire departments, contractors to
ascertain their need for water from fire hydrants).
to qualify for 8 :Assess water utility policy and procedures to
ensure that fire hydrant permits are issued for use by persons outside of the utility. Create
written procedures for use and documentation of fire hydrants by water utility personnel.
to qualify for 10 :Refine written procedures to ensure that all
uses of unbilled, unmetered water are overseen by a structured permitting process managed by
water utility personnel. Reassess policy to determine if some of these uses have value in
being converted to billed and/or metered status.
to qualify for 5 :Use accepted default of 0.25% of system input
volumeto qualify for 4 :
Review utility policy regarding what water uses are considered unauthorized, and consider
tracking a small sample of one such occurrence (ex: unauthorized fire hydrant openings)
to quality for 8:Assess water utility policies to ensure that all
known occurrences of unauthorized consumption are outlawed, and that appropriate
penalties are prescribed. Create written procedures for use and documentation of
various occurrences of unauthorized consumption as they are uncovered.
to qualify for 10 :Refine written procedures and assign staff to seek out likely occurrences of unauthorized consumption. Explore new locking devices, monitors and other technologies designed to detect and thwart unauthorized consumption.
AWWA Water Loss Control Committee Grading Matrix 7

n/a 1 2 3 4 5 6 7 8 9 10
Grading
Systematic Data Handling Error:
Note: all water utilities incur some
amount of this error. Even in water
utilities with unmetered customer
populations and fixed rate billing, errors occur in annual billing
tabulations. Enter a positive value for the volume and select a grading.
Vague policy for permitting (creating new customer
accounts) and billing. Billing data maintained on paper
records which are in disarray. No audits conducted to confirm billing data handling efficiency. Unknown number of customers
escape routine billing due to lack of billing process
oversight.
Policy for permitting and billing exists but needs refinement.
Billing data maintained on paper records or insufficiently capable
electronic database. Only periodic unstructured auditing
work conducted to confirm billing data handling efficiency. Volume
of unbilled water due to billing lapses is a guess.
Conditions between 2 and 4
Policy and procedures for permitting and billing exist but
needs refinement. Computerized billing system exists, but is dated
or lacks needed functionality. Periodic, limited internal audits
conducted and confirm with approximate accuracy the
consumption volumes lost to billing lapses.
Conditions between 4 and 6
Policy for permitting and billing is adequate and reviewed
periodically. Computerized billing system in use with basic reporting
available. Any effect of billing adjustments on measured
consumption volumes is well understood. Internal checks of
billing data error conducted annually. Reasonably accurate quantification of consumption volume lost to billing lapses is
obtained.
Conditions between 6 and 8
Permitting and billing policy reviewed at least biannually. Computerized billing system
includes an array of reports to confirm billing data and system functionality. Annual internal
checks conducted with periodic third party audit. Accountability
checks flag billing lapses. Consumption lost to billing lapses
is well quantified and reducing year-by-year.
Conditions between 8 and 10
Sound policy exists for permitting of all customer billing accounts.
Robust computerized billing system gives high functionality
and reporting capabilities. Assessment of policy and data
handling errors conducted internally and audited by third
party annually, ensuring consumption lost to billing lapses is minimized and detected as it
occurs.
Improvements to attain higher data grading for "Systematic Data Handling Error volume"
component:
to qualify for 2 :Draft written policy for permitting and billing.
Investigate and budget for computerized customer billing
system. Conduct initial audit of billing records by flow-charting the basic business processes
of the customer account/billing function.
to maintain 10:Stay abreast of customer information management
developments and innovations. Monitor developments of
Advanced Metering Infrastructure (AMI) and integrate technology to
ensure that customer endpoint information is well-monitored and errors/lapses are at an economic
minimum.
Length of mains:
Poorly assembled and maintained paper as-built
records of existing water main installations makes accurate determination of system pipe length impossible. Length of
mains is guesstimated.
Paper records in poor condition (no annual tracking of installations
& abandonments). Poor procedures to ensure that new
water mains installed by developers are accurately
documented.
Conditions between 2 and 4
Sound policy and procedures for permitting and documenting new water main installations, but gaps
in management result in a uncertain degree of error in tabulation of mains length.
Conditions between 4 and 6
Sound policy and procedures exist for permitting and commissioning
new water mains. Highly accurate paper records with regular field validation; or electronic records
and asset management system in good condition. Includes system
backup.
Conditions between 6 and 8
Sound policy and procedures exist for permitting and commissioning
new water mains. Electronic recordkeeping and asset
management system are used to store and manage data.
Conditions between 8 and 10
Sound policy exists for managing water mains extensions and replacements. Geographic
Information System (GIS) data and asset management database agree and random field validation
proves truth of databases.
Improvements to attain higher data grading for "Length of Water Mains" component:
to qualify for 2 :Assign personnel to inventory current as-built records and
compare with customer billing system records and highway
plans. Assemble policy documents regarding
permitting and documentation of water main installations by
the utility and building developers; identify gaps in procedure that result in poor
documentation.
to maintain 10:Continue with standardization and random field validation to improve
knowledge of system.
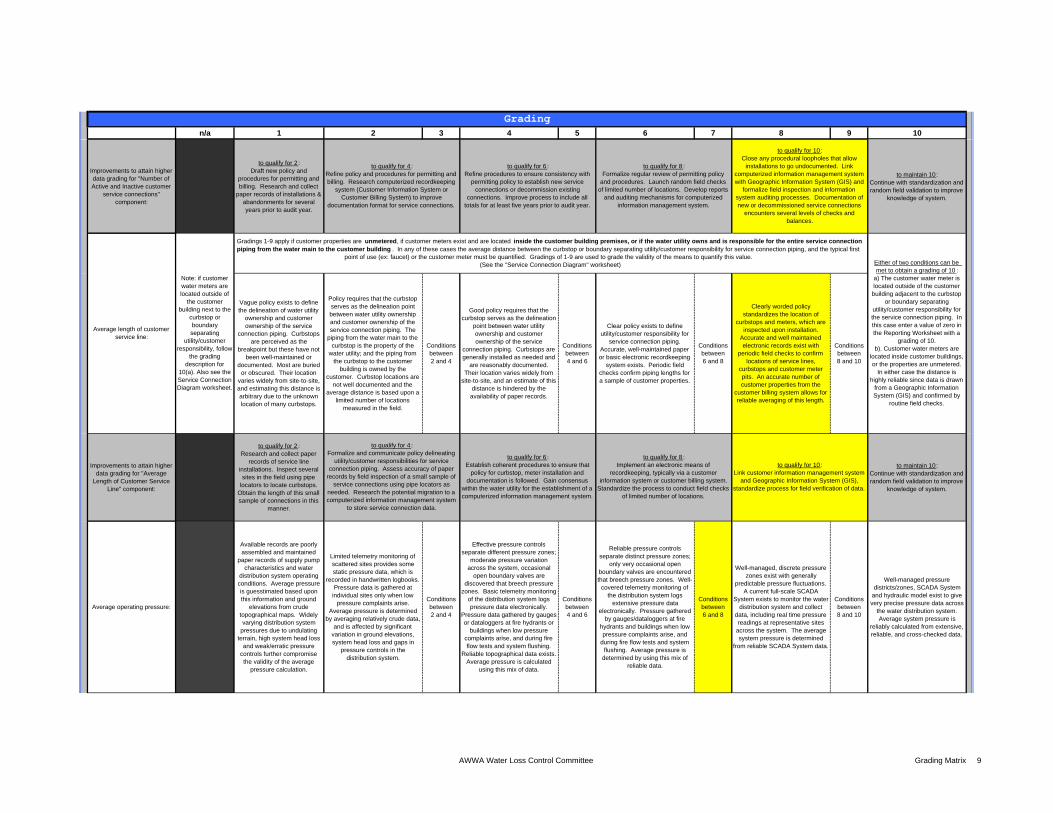
Number of active AND inactive service connections:
Vague permitting (of new service connections) policy and
poor paper recordkeeping of customer connections/billings result in suspect determination
of the number of service connections, which may be 10-15% in error from actual count.
General permitting policy exists but paper records, procedural
gaps, and weak oversight result in questionable total for number of connections, which may vary 5-
10% of actual count.
Conditions between 2 and 4
Permitting policy and procedures exist, but with some gaps in performance and oversight. Computerized information
management system is being brought online to replace dated paper recordkeeping system.
Reasonably accurate tracking of service connection installations & abandonments; but count can be
up to 5% in error from actual total.
Conditions between 4 and 6
Permitting policy and procedures are adequate and reviewed periodically. Computerized
information management system is in use with annual installations & abandonments totaled. Very
limited field verifications and audits. Error in count of number
of service connections is believed to be no more that 3%.
Conditions between 6 and 8
Permitting policy and procedures reviewed at least biannually. Well-
managed computerized information management system and routine, periodic field checks and internal system audits allows counts of connections that is no
more than 2% in error.
Conditions between 8 and 10
Sound permitting policy and well managed and audited procedures
ensure reliable management of service connection population.
Computerized information management system and
Geographic Information System (GIS) information agree; field
validation proves truth of databases. Count of connections believed to be in error by less than
1%.
to qualify for 8 :Formalize regular review of permitting and
billing practices. Enhance reporting capability of computerized billing system. Formalize
regular auditing process to reveal scope of data handling error.
to qualify for 10 :Close policy/procedure loopholes that allow
some customer accounts to go unbilled, or data handling errors to exist. Ensure that internal
and third party audits are conducted annually.
SYSTEM DATA
to qualify for 4 :Finalize written policy for permitting and billing.
Implement a computerized customer billing system. Conduct initial audit of billing records
as part of this process.
to qualify for 6 :Refine permitting and billing procedures and
ensure consistency with the utility policy regarding billing, and minimize opportunity for missed billings. Upgrade or replace customer billing system for needed functionality - ensure that billing adjustments don't corrupt the value of consumption volumes. Procedurize internal
annual audit process.
to qualify for 4 :Complete inventory of paper records of water
main installations & abandonments for a number of years prior to audit year. Review
policy and procedures for commissioning and documenting new water main installation and
abandonments.
to qualify for 6 :Finalize updates/improvements to policy and procedures for permitting/commissioning new
main installations. Confirm inventory of records for five years prior to audit year; correct any
errors or omissions.
to qualify for 8 :Launch random field checks of limited number of locations. Convert to electronic databases
with backup as justified.
to qualify for 10 :Link Geographic Information System (GIS) and
asset management databases, conduct field verification of data.
AWWA Water Loss Control Committee Grading Matrix 8
n/a 1 2 3 4 5 6 7 8 9 10
Grading
Improvements to attain higher data grading for "Number of Active and Inactive customer
service connections" component:
to qualify for 2 :Draft new policy and
procedures for permitting and billing. Research and collect
paper records of installations & abandonments for several years prior to audit year.
to maintain 10:Continue with standardization and random field validation to improve
knowledge of system.
Vague policy exists to define the delineation of water utility
ownership and customer ownership of the service
connection piping. Curbstops are perceived as the
breakpoint but these have not been well-maintained or
documented. Most are buried or obscured. Their location
varies widely from site-to-site, and estimating this distance is arbitrary due to the unknown location of many curbstops.
Policy requires that the curbstop serves as the delineation point between water utility ownership and customer ownership of the service connection piping. The
piping from the water main to the curbstop is the property of the
water utility; and the piping from the curbstop to the customer
building is owned by the customer. Curbstop locations are
not well documented and the average distance is based upon a
limited number of locations measured in the field.
Conditions between 2 and 4
Good policy requires that the curbstop serves as the delineation
point between water utility ownership and customer ownership of the service
connection piping. Curbstops are generally installed as needed and
are reasonably documented. Their location varies widely from
site-to-site, and an estimate of this distance is hindered by the
availability of paper records.
Conditions between 4 and 6
Clear policy exists to define utility/customer responsibility for
service connection piping. Accurate, well-maintained paper or basic electronic recordkeeping
system exists. Periodic field checks confirm piping lengths for a sample of customer properties.
Conditions between 6 and 8
Clearly worded policy standardizes the location of
curbstops and meters, which are inspected upon installation.
Accurate and well maintained electronic records exist with
periodic field checks to confirm locations of service lines,
curbstops and customer meter pits. An accurate number of customer properties from the
customer billing system allows for reliable averaging of this length.
Conditions between 8 and 10
Improvements to attain higher data grading for "Average
Length of Customer Service Line" component:
to qualify for 2 :Research and collect paper
records of service line installations. Inspect several sites in the field using pipe
locators to locate curbstops. Obtain the length of this small sample of connections in this
manner.
to maintain 10:Continue with standardization and random field validation to improve
knowledge of system.
Average operating pressure:
Available records are poorly assembled and maintained
paper records of supply pump characteristics and water
distribution system operating conditions. Average pressure is guesstimated based upon this information and ground
elevations from crude topographical maps. Widely varying distribution system
pressures due to undulating terrain, high system head loss
and weak/erratic pressure controls further compromise the validity of the average
pressure calculation.
Limited telemetry monitoring of scattered sites provides some static pressure data, which is
recorded in handwritten logbooks. Pressure data is gathered at
individual sites only when low pressure complaints arise.
Average pressure is determined by averaging relatively crude data,
and is affected by significant variation in ground elevations, system head loss and gaps in
pressure controls in the distribution system.
Conditions between 2 and 4
Effective pressure controls separate different pressure zones;
moderate pressure variation across the system, occasional
open boundary valves are discovered that breech pressure
zones. Basic telemetry monitoring of the distribution system logs pressure data electronically.
Pressure data gathered by gauges or dataloggers at fire hydrants or
buildings when low pressure complaints arise, and during fire flow tests and system flushing.
Reliable topographical data exists. Average pressure is calculated
using this mix of data.
Conditions between 4 and 6
Reliable pressure controls separate distinct pressure zones;
only very occasional open boundary valves are encountered that breech pressure zones. Well-
covered telemetry monitoring of the distribution system logs
extensive pressure data electronically. Pressure gathered
by gauges/dataloggers at fire hydrants and buildings when low pressure complaints arise, and
during fire flow tests and system flushing. Average pressure is
determined by using this mix of reliable data.
Conditions between 6 and 8
Well-managed, discrete pressure zones exist with generally
predictable pressure fluctuations. A current full-scale SCADA
System exists to monitor the water distribution system and collect
data, including real time pressure readings at representative sites
across the system. The average system pressure is determined
from reliable SCADA System data.
Conditions between 8 and 10
Well-managed pressure districts/zones, SCADA System
and hydraulic model exist to give very precise pressure data across
the water distribution system. Average system pressure is
reliably calculated from extensive, reliable, and cross-checked data.
to qualify for 10 :Close any procedural loopholes that allow
installations to go undocumented. Link computerized information management system with Geographic Information System (GIS) and
formalize field inspection and information system auditing processes. Documentation of new or decommissioned service connections
encounters several levels of checks and balances.
to qualify for 8 :Implement an electronic means of
recordkeeping, typically via a customer information system or customer billing system.
Standardize the process to conduct field checks of limited number of locations.
to qualify for 10 :Link customer information management system
and Geographic Information System (GIS), standardize process for field verification of data.
Average length of customer service line:
Note: if customer water meters are located outside of
the customer building next to the
curbstop or boundary separating
utility/customer responsibility, follow
the grading description for
10(a). Also see the Service Connection Diagram worksheet.
to qualify for 4 :Formalize and communicate policy delineating
utility/customer responsibilities for service connection piping. Assess accuracy of paper
records by field inspection of a small sample of service connections using pipe locators as
needed. Research the potential migration to a computerized information management system
to store service connection data.
to qualify for 6 :Establish coherent procedures to ensure that
policy for curbstop, meter installation and documentation is followed. Gain consensus
within the water utility for the establishment of a computerized information management system.
Either of two conditions can be met to obtain a grading of 10 :
a) The customer water meter is located outside of the customer building adjacent to the curbstop
or boundary separating utility/customer responsibility for the service connection piping. In this case enter a value of zero in the Reporting Worksheet with a
grading of 10.b). Customer water meters are
located inside customer buildings, or the properties are unmetered.
In either case the distance is highly reliable since data is drawn
from a Geographic Information System (GIS) and confirmed by
routine field checks.
Gradings 1-9 apply if customer properties are unmetered, if customer meters exist and are located inside the customer building premises, or if the water utility owns and is responsible for the entire service connection piping from the water main to the customer building . In any of these cases the average distance between the curbstop or boundary separating utility/customer responsibility for service connection piping, and the typical first
point of use (ex: faucet) or the customer meter must be quantified. Gradings of 1-9 are used to grade the validity of the means to quantify this value.(See the "Service Connection Diagram" worksheet)
to qualify for 4 :Refine policy and procedures for permitting and billing. Research computerized recordkeeping
system (Customer Information System or Customer Billing System) to improve
documentation format for service connections.
to qualify for 6 :Refine procedures to ensure consistency with
permitting policy to establish new service connections or decommission existing
connections. Improve process to include all totals for at least five years prior to audit year.
to qualify for 8 :Formalize regular review of permitting policy
and procedures. Launch random field checks of limited number of locations. Develop reports
and auditing mechanisms for computerized information management system.
AWWA Water Loss Control Committee Grading Matrix 9

n/a 1 2 3 4 5 6 7 8 9 10
Grading
Improvements to attain higher data grading for "Average
Operating Pressure" component:
to qualify for 2 :Employ pressure gauging
and/or datalogging equipment to obtain pressure
measurements from fire hydrants. Locate accurate
topographical maps of service area in order to confirm ground
elevations. Research pump data sheets to find pump
pressure/flow characteristics
to maintain 10: Continue to refine the hydraulic model of the distribution system
and consider linking it with SCADA System for real-time
pressure data calibration, and averaging.
to qualify for 4 : Formalize a procedure to use pressure
gauging/datalogging equipment to gather pressure data during various system events
such as low pressure complaints, or operational testing. Gather pump pressure and flow data at different flow regimes. Identify faulty pressure
controls (pressure reducing valves, altitude valves, partially open boundary valves) and plan to properly configure pressure zones. Make all
pressure data from these efforts available to generate system-wide average pressure.
to qualify for 6 : Expand the use of pressure
gauging/datalogging equipment to gather scattered pressure data at a representative set of sites, based upon pressure zones or areas.
Utilize pump pressure and flow data to determine supply head entering each pressure
zone or district. Correct any faulty pressure controls (pressure reducing valves, altitude valves, partially open boundary valves) to
ensure properly configured pressure zones. Use expanded pressure dataset from these activities to generate system-wide average
pressure.
to qualify for 8 : Install a Supervisory Control and Data
Acquisition (SCADA) System to monitor system parameters and control operations. Set regular
calibration schedule for instrumentation to insure data accuracy. Obtain accurate
topographical data and utilize pressure data gathered from field surveys to provide
extensive, reliable data for pressure averaging.
to qualify for 10 : Obtain average pressure data from hydraulic
model of the distribution system that has been calibrated via field measurements in the water
distribution system and confirmed in comparisons with SCADA System data.
AWWA Water Loss Control Committee Grading Matrix 10

n/a 1 2 3 4 5 6 7 8 9 10
Grading
Total annual cost of operating water system:
Incomplete paper records and lack of documentation on many
operating functions making calculation of water system
operating costs a pure guesstimate
Reasonably maintained, but incomplete, paper or electronic
accounting provides data to estimate the major portion of water system operating costs.
Conditions between 2 and 4
Electronic, industry-standard cost accounting system in place. Gaps
in data known to exist, periodic internal reviews conducted but not
a structured audit.
Conditions between 4 and 6
Reliable electronic, industry-standard cost accounting system in place, with all pertinent water system operating costs tracked.
Data audited periodically by utility personnel, not a Certified Public
Accountant (CPA).
Conditions between 6 and 8
Reliable electronic, industry-standard cost accounting system in place, with all pertinent water system operating costs tracked. Data audited at least annually by utility personnel, and periodically
by third-party CPA.
Conditions between 8 and 10
Reliable electronic, industry-standard cost accounting system in place, with all pertinent water system operating costs tracked. Data audited annually by utility
personnel and by third-party CPA.
Improvements to attain higher data grading for "Total Annual Cost of Operating the Water
System" component:
to qualify for 2 :Gather available records,
institute new procedures to regularly collect and audit
basic cost data of most important operations functions.
to maintain 10:Maintain program, stay abreast of expenses subject to erratic cost changes and budget/track costs
proactively
Customer retail unit cost (applied to Apparent Losses):
Antiquated, cumbersome water rate structure is use, with
periodic historic amendments that were poorly documented and implemented; resulting in classes of customers being billed inconsistent charges. The actual composite billing rate likely differs significantly from the published water rate
structure, but a lack of auditing leaves the degree of error
indeterminate.
Dated, cumbersome water rate structure, not always employed
consistently in actual billing operations. The actual composite billing rate is known to differ from the published water rate structure,
and a reasonably accurate estimate of the degree of error is determined, allowing a composite
billing rate to be quantified.
Conditions between 2 and 4
Straight-forward water rate structure in use, but not updated
in several years. Billing operations reliably employ the rate
structure. The composite billing rate is derived from a single
customer class such as residential customer accounts, neglecting the
effect of different rates from varying customer classes.
Customer population unmetered. Fixed fee charged;
single composite
number derived from
multiple customer classes.
Clearly written, up-to-date water rate structure is in force and is
applied reliably in billing operations. Composite customer
rate is determined using a weighted average residential rate using volumes of water in each
rate block.
Conditions between 6 and 8
Effective water rate structure is in force and is applied reliably in billing operations. Composite
customer rate is determined using a weighted average composite
consumption rate, including residential, commercial, industrial and any other customer classes within the water rate structure.
Conditions between 8 and 10
Third party reviewed weighted average composite consumption
rate (includes residential, commercial, industrial, etc.)
Improvements to attain higher data grading for "Customer
Retail Unit Cost" component:
to qualify for 2 :Formalize the process to implement water rates,
including a secure documentation procedure.
Create a current, formal water rate document and gain
approval from all stakeholders.
to qualify for 6 :Evaluate volume of water used in each usage block by residential users. Multiply volumes by full
rate structure.
Meter customers and charge rates based upon water
volumes
to maintain 10:Keep water rate structure current in addressing the water utility's
revenue needs. Update the calculation of the customer unit rate as new rate components,
customer classes, or other components are modified.
Variable production cost (applied to Real Losses):
Note: if the water utility
purchases/imports its entire water
supply, then enter the unit purchase cost of the bulk
water supply in the Reporting
Worksheet with a grading of 10
Incomplete paper records and lack of documentation on
primary operating functions (electric power and treatment costs most importantly) makes
calculation of variable production costs a pure
guesstimate
Reasonably maintained, but incomplete, paper or electronic
accounting provides data to roughly estimate the basic
operations costs (pumping power costs and treatment costs) and
calculate a unit variable production cost.
Conditions between 2 and 4
Electronic, industry-standard cost accounting system in place. Electric power and treatment costs are reliably tracked and
allow accurate calculation of unit variable production costs based
on these two inputs only. All costs are audited internally on a
periodic basis.
Conditions between 4 and 6
Reliable electronic, industry-standard cost accounting system in place, with all pertinent water system operating costs tracked.
Pertinent additional costs beyond power and treatment (ex: liability, residuals management, etc.) are
included in the unit variable production cost. Data audited at least annually by utility personnel.
Conditions between 6 and 8
Reliable electronic, industry-standard cost accounting system
in place, with all pertinent variable production costs tracked. Data
audited at least annually by utility personnel, and periodically by
third-party.
Conditions between 8 and 10
Either of two conditions can be met to obtain a grading of 10 :1) Third party CPA audit of all primary and secondary cost
components on an annual basis.or:
2) Water supply is entirely purchased as bulk imported water, and unit purchase cost serves as
the variable production cost.
Improvements to attain higher data grading for "Variable
Production Cost" component:
to qualify for 2 :Gather available records,
institute new procedures to regularly collect and audit basic cost data and most
important operations functions.
to maintain 10:Maintain program, stay abreast of expenses subject to erratic cost changes and budget/track costs
proactively
COST DATA
to qualify for 10 :Standardize the process to conduct a third-party
financial audit by a CPA on an annual basis.
to qualify for 4 :Implement an electronic cost accounting
system, structured according to accounting standards for water utilities
to qualify for 6 :Formalize process for regular internal audits of production costs. Assess whether additional costs (liability, residuals management, etc.)
should be included to calculate a more accurate variable production cost.
to qualify for 8 :Formalize the accounting process to include
primary cost components (power, treatment) as well as secondary components (liability,
residuals management, etc.) Conduct periodic third-party audits.
to qualify for 10 :Standardize the process to conduct a third-party
financial audit by a CPA on an annual basis.
to qualify for 10 :Conduct a periodic third-party audit of water
used in each usage block by all classifications of users. Multiply volumes by full rate structure.
to qualify for 4 :Review the water rate structure and
update/formalize as needed. Assess billing operations to ensure that actual billing
operations incorporate the established water rate structure.
to qualify for 8 :Evaluate volume of water used in each usage block by all classifications of users. Multiply
volumes by full rate structure.
to qualify for 4 :Implement an electronic cost accounting
system, structured according to accounting standards for water utilities
to qualify for 6 :Establish process for periodic internal audit of
water system operating costs; identify cost data gaps and institute procedures for tracking these
outstanding costs.
to qualify for 8 :Standardize the process to conduct routine
financial audit on an annual basis.
AWWA Water Loss Control Committee Grading Matrix 11

AWWA WLCC Free Water Audit Software: Customer Service Line Diagrams
Copyright © 2010, American Water Works Association. All Rights Reserved. WAS v4.1Back to Instructions
Average Length of Customer Service Line
The three figures shown on this worksheet display the assignment of the Average Length of Customer Service Line, Lp, for the three most common piping configurations.
Figure 1 shows the configuration of the water meter outside of the customer building next to the curbstop valve. In this configuration Lp = 0 since the distance between the curbstop and the customer metering point is essentially zero.
Figure 2 shows the configuration of the customer water meter located inside the customer building, where Lp is the distance from the curbstop to the water meter.
Figure 3 shows the configuration of an unmetered customer building , where Lp is the distance from the curbstop to the first point of customer water consumption, or, more simply, the building line.
In any water system the Lp will vary notably in a community of different structures, therefore the average Lp value is used and this should be approximated or calculated if a sample of service line measurements has been gathered.
Return to Reporting Worksheet
Figure 1
Figure 2
Figure 3
Click for more
information
AWWA Water Loss Control Committee Service Connection Diagram 12

Item Name
Apparent Losses
AUTHORIZED CONSUMPTION
Average length of customer service line
Average operating pressure
Billed Authorized Consumption
Billed metered consumption
Billed unmetered consumption
Connection density
AWWA WLCC Free Water Audit Software: Definitions
All billed consumption which is calculated based on estimates or norms but is not metered. This might be a very small component in fully metered systems (for example billing based on estimates for the period a customer meter is out of order) but can be the key consumption component in systems without universal metering. It does NOT include water sold to neighboring utilities (water exported) which is unmetered but billed.
All metered consumption which is billed. This includes all groups of customers such as domestic, commercial, industrial or institutional. It does NOT include water sold to neighboring utilities (water exported) which is metered and billed. The metered consumption data can be taken directly from billing records for the water audit period. The accuracy of yearly metered consumption data can be refined by including an adjustmentto account for customer meter reading lagtime, however additional analysis is necessary to determine the adjustment value, which may or may not be significant.
=number of connections / length of mains
Description
= unauthorized consumption + meter under-registration + data handling errors
Includes all types of inaccuracies associated with customer metering as well as data handling errors (meter reading and billing), plus unauthorized consumption (theft or illegal use).NOTE: Over-registration of customer meters, leads to under-estimation of Real Losses. Under-registration of customer meters, leads to over-estimation of Real Losses.
All consumption that is billed and authorized by the utility. This may include both metered and unmetered consumption. See "Authorized Consumption" for more information.
= billed metered + billed unmetered + unbilled metered + unbilled unmetered
The volume of metered and/or unmetered water taken by registered customers, the water supplier and others who are implicitly or explicitly authorized to do so by the water supplier, for residential, commercial and industrial purposes. This does NOT include water sold to neighboring utilities (water exported).Authorized consumption may include items such as fire fighting and training, flushing of mains and sewers, street cleaning, watering of municipal gardens, public fountains, frostprotection, building water, etc. These may be billed or unbilled, metered or unmetered.
The average pressure may be approximated when compiling the preliminary water audit. Once routine water auditing has been established, a more accurate assessment of average pressure should be pursued. If the water utility infrastructure is recorded in a Geographical Information System (GIS) the average pressure at many locations in the distribution system can be readily obtained. If a GIS does not exist, a weighted averageof pressure data can be calculated from water pressure measured at various fire hydrants scattered across the water distribution system.
Find
Back to InstructionsCopyright © 2010, American Water Works Association. All Rights Reserved. WAS v4.1
Find
Find
Find
Find
Find
Click to see Service Connection Diagram
This is entered for unmetered services and in cold or other areas where meters are installed inside homes and buildings. It is the length of customer service line either between the utility's service connection (often at the curbstop) and the meter, or to the building line (first point of customer consumption) if customers are unmetered. Note that the length of service connection between the main and customer service line isowned by the utility and its length and potential leakage is accounted for in the UARL formula by the number of service connections.
What role does the "Average Length of Customer Service Line" parameter serve in the Water Audit?In many water distribution systems the water utility has maintenance responsibility for a portion of the customer service piping from its connection point at the water main to the curbstop valve located midway to the customer building. The customer is responsibleto maintain the customer service piping from the curbstop to the building premises. When leaks arise on customer service piping, water utilities respond faster to repair leaks than customers when the leak is on piping under their responsibility. Leak durations are longer on the customer-maintained piping than the utility-maintained piping. The total length of pipe maintained by customers is one of the components of theUnavoidable Annual Real Loss (UARL) equation and is determined by multiplying the average length of customer maintained pipe, Lp by the number of customer service connections. Therefore this parameter is important to the calculation of the UARL and the Infrastructure leakage Index (ILI).
AWWA Water Loss Control Committee Definitions 13

Item Name Description
Customer metering inaccuracies
Customer retail unit cost
Infrastructure Leakage Index (ILI)
Length of mains
Master meter error adjustment
NON-REVENUE WATER
Number of active AND inactive service connections
Real Losses
Revenue Water
Systematic data handling errors
Total annual cost of operating the water system
= Apparent Losses + Real Losses + Unbilled Metered + Unbilled UnmeteredWater which does not provide any revenue to the utility
Physical water losses from the pressurized system and the utility’s storage tanks, up to the point of customer consumption. In metered systems this is the customer meter, in unmetered situations this is the first point of consumption (stop tap/tap) within the property.The annual volume lost through all types of leaks, breaks and overflows depends on frequencies, flow rates, and average duration of individual leaks, breaks and overflows.
These costs include those for operations, maintenance and any annually incurred costs forlong-term upkeep of the system, such as repayment of capital bonds for infrastructure expansion or improvement. Typical costs include employee salaries and benefits, materials, equipment, insurance, fees, administrative costs and all other costs that exist to sustain the drinking water supply. These costs should not include any costs to operate wastewater, biosolids or other systems outside of drinking water.
Apparent water losses caused by systematic data handling errors in the meter reading and billing system.
Length of all pipelines (except service connections) in the system starting from the point of system input metering (for example at the outlet of the treatment plant). It isalso recommended to include in this measure the total length of fire hydrant lead pipe. Hydrant lead pipe is the pipe branching from the water main to the fire hydrant. Fire hydrant leads are typically of a sufficiently large size that is more representative of apipeline than a service connection. The average length of hydrant leads across the entire system can be assumed if not known, and multiplied by the number of fire hydrants in the system, which can also be assumed if not known. This value can then be added to the total pipeline length. Total length of mains can therefore be calculated as:
Length of Mains, miles = (total pipeline length, miles) + [ {(average fire hydrant lead length, ft) x (number of fire hydrants)} / 5,280 ft/mile ] orLength of Mains, kilometres = (total pipeline length, kilometres) + [ {(average fire hydrant lead length, metres) x (number of fire hydrants)} / 1,000 metres/kilometre ]
Water which is charged to customers to provide revenue to the utility.
The ratio of the Current Annual Real Losses (Real Losses) to the Unavoidable Annual Real Losses (UARL). The ILI is a highly effective performance indicator for comparing (benchmarking) the performance of utilities in operational management of real losses.
Number of service connections, main to curb stop. Please note that this includes the actual number of distinct piping connections including fire connections whether active orinactive. This may differ substantially from the number of Customers (or number of accounts)
An estimate or measure of the degree of any inaccuracy that exists in the master meters measuring the Volume from own sources. Please also indicate if this adjustment is becausethe master meters under-registered (did not capture all the flow) or over-registered (overstated the actual flow). All systems encounter some degree of error in their Master Meter data. Please enter a positive value.
Apparent water losses caused by the collective under-registration of customer water meters. Many customer water meters will wear as large cumulative volumes of water are passed through them over time. This causes the meters to under-register. The auditor has two options for entering data for this component of the audit. The auditor can enter a percentage under-registration (typically an estimated value), this will apply the selected percentage to the two categories of metered consumption to determine the volume of water not recorded due to customer meter inaccuracy. Alternatively, if the auditor hassubstantial data from meter testing to arrive at their own volumes of such losses, this volume may be entered directly. Note that a value of zero will be accepted but an alert will appear asking if the customer population is unmetered. Since all metered systems have some degree of inaccuracy, then a positive value should be entered. A value of zeroin this component is valid only if the water utility does not meter its customer population.
The Customer Retail Unit Cost represents the charge that customers pay for water service.This unit cost is applied to the components of apparent loss, since these losses represent water reaching customers but not (fully) paid for. It is important to compile these costs per the same unit cost basis as the volume measure included in the water audit. For example, if all water volumes are measured in million gallons, then the unit cost should be dollars per million gallon ($/mil gal). The software allows the user to select the units that are charged to customers (either $/1,000 gallons, $/hundred cubic feet or $/1,000 litres) and automatically converts these units to the units that appear in the "WATER SUPPLIED" box. Since most water utilities have a rate structure that includes a variety of different costs based upon class of customer, a weighted average ofindividual costs and number of customer accounts in each class can be calculated to determine a single composite cost that should be entered into this cell. Finally, the weighted average cost should also include additional charges for sewer, stormwater or biocharges are based upon the volume of potable water consumed.
Find
Find
Find
Find
Find
Find
Find
Find
Find
Find
AWWA Water Loss Control Committee Definitions 14

Item Name Description
Unauthorized consumption
Unbilled Authorized Consumption
Unbilled metered consumption
Unbilled unmetered consumption
Convert From…Million Gallons (US) = 1 Million Gallons (US)
Any kind of Authorized Consumption which is neither billed nor metered. This component typically includes items such as fire fighting, flushing of mains and sewers, street cleaning, frost protection, etc. In most water utilities it is a small component which is very often substantially overestimated. It does NOT include water sold to neighboring utilities (water exported) which is unmetered and unbilled – an unlikely case. This component has many sub-components of water use which are often tedious to identify and quantify. Because of this, and the fact that it is usually a small portion of the water supplied, it is recommended that the auditor apply the default value of 1.25% of the volume from own sources. Select the default percentage to enter this value. If the water utility already has well validated data that gives a value substantially higher or lower than the default volume, then the auditor should enter their own volume. However the default approach is recommended for most water utilities. Note that a value of zero is not permitted, since all water utilities have some volume ofwater in this component occurring in their system.
Enter Units:
The user may develop an audit based on one of three unit selections: 1) Million Gallons (US)2) Megalitres (Thousand Cubic Metres)3) Acre-feetOnce this selection has been made in the instructions sheet, all calculations are made onthe basis of the chosen units. Should the user wish to make additional conversions, a unit converter is provided below (use drop down menus to select units from the yellow unit boxes):
(conversion factor = 1)
Units and Conversions
Converts to…..
1
All consumption that is unbilled, but still authorized by the utility. See "Authorized Consumption" for more information.
Metered Consumption which is for any reason unbilled. This might for example include metered consumption of the utility itself or water provided to institutions free of charge. It does NOT include water sold to neighboring utilities (water exported) which ismetered but unbilled.
Unavoidable Annual Real Losses (UARL)
The UARL is a theoretical reference value representing the technical low limit of leakagethat could be achieved if all of today's best technology could be successfully applied. It is a key variable in the calculation of the Infrastructure Leakage Index (ILI). It isnot necessary that water utilities set this level as the target level of leakage, unless water is unusually expensive, scarce or both.
NOTE: The UARL calculation has not yet been fully proven as effective for very small, or low pressure water distribution systems. If,in gallons per day:(Lm x 32) + Nc < 3000 orP <35psiin litres per day:(Lm x 20) + Nc < 3000 orP < 25mthen the calculated UARL value may not be valid. The software does not display a value of UARL or ILI if either of these conditions is true.
UARL (gallons/day)=(5.41Lm + 0.15Nc + 7.5Lc) xP, orUARL (litres/day)=(18.0Lm + 0.8Nc + 25.0Lc) xP
where:Lm = length of mains (miles or kilometres) Nc = number of service connections Lc = total length of customer service lines (miles or km) = Nc multiplied by the average distance of customer service line, Lp (miles or km)P = Pressure (psi or metres)
Includes water illegally withdrawn from hydrants, illegal connections, bypasses to consumption meter or meter reading equipment tampering. While this component has a direct impact on revenue, in most water utilities the volume is low and it is recommendedthat the auditor apply a default value of 0.25% of the volume from own sources. If the auditor has well validated data that indicates the volume from unauthorized consumption is substantially higher or lower than that generated by the default value then this valuecan be entered. However, for most water utilities it is recommended to apply the defaultvalue. Note that a value of zero will not be accepted since all water utilities have some volume of unauthorized consumption occurring in their system.
Find
Find
Find
Find
Find
Click to see Service Connection Diagram
AWWA Water Loss Control Committee Definitions 15

Item Name Description
Use of Option Buttons
Variable production cost (applied to Real Losses)
Volume from own sources
Water exported
Water imported
WATER LOSSES
= apparent losses + real losses
The difference between System Input and Authorized Consumption. Water losses can be considered as a total volume for the whole system, or for partial systems such as transmission or distribution systems, or individual zones. Water Losses consist of Real Losses and Apparent Losses.
Bulk water sold and conveyed out of the water distribution system. Typically this is water sold to a neighboring water utility. Be sure to account for any export meter inaccuracy in reporting this volume
The volume of treated water input to system from own production facilities
The cost to produce and supply the next unit of water. (E.g., $/million gallons) This cost is determined by calculating the summed unit costs for ground and surface water treatment and all power used for pumping from the source to the customer. It should also include the unit cost of bulk water purchased as an import if applicable.
Bulk water purchased to become part of the water supplied. Typically this is water purchased from a neighboring water utility or regional water authority. Be sure to account for any import meter inaccuracy in reporting this volume
Find
Find
Find
Find
Find
To use the percent value choose this button
To enter a value choose this button and enter the value in the cell to the right
NOTE: For unbilled unmetered consumption and unauthorized consumption, a recommended default value can be applied by selecting the Percent option. The default values are based on fixed percentages of water supplied and are recommended for use in this audit unless the auditor has well validated data for their system. Default values are shown by purple cells, as shown in the example above.
If a default value is selected, the user does not need to grade the item; a grading value of 3 is automatically applied (however, this grade will not be displayed).
Find
AWWA Water Loss Control Committee Definitions 16

Functional Focus Area
Audit Data Collection
Short-term loss control
Long-term loss control
Target-setting
Benchmarking
Preliminary Comparisons - can begin to rely upon the
Infrastructure Leakage Index (ILI) for performance
comparisons for real losses (see below table)
Performance Benchmarking - ILI is meaningful in comparing real
loss standing
Identify Best Practices/ Best in class - the ILI is very reliable as
a real loss performance indicator for best in class service
For validity scores of 50 or below, the shaded blocks should not be focus areas until better data validity is achieved.
Water Audit Data Validity Level / Score
Level I (0-25)
Launch auditing and loss control team; address production
metering deficiencies
Research information on leak detection programs. Begin
flowcharting analysis of customer billing system
Level II (26-50) Level V (91-100)
Analyze business process for customer metering and billing
functions and water supply operations. Identify data gaps.
Stay abreast of improvements in metering, meter reading, billing,
leakage management and infrastructure rehabilitation
Evaluate and refine loss control goals on a yearly basis
Begin to assess long-term needs requiring large
expenditure: customer meter replacement, water main
replacement program, new customer billing system or
Automatic Meter Reading (AMR) system.
Begin to assemble economic business case for long-term needs based upon improved
data becoming available throughthe water audit process.
Conduct detailed planning, budgeting and launch of
comprehensive improvements for metering, billing or
infrastructure management
Continue incremental improvements in short-term and
long-term loss control interventions
Establish long-term apparent and real loss reduction goals
(+10 year horizon)
Establish mid-range (5 year horizon) apparent and real loss
reduction goals
AWWA WLCC Free Water Audit Software: Determining Water Loss Standing
Conduct loss assessment investigations on a sample
portion of the system: customer meter testing, leak survey,
unauthorized consumption, etc.
Establish ongoing mechanisms for customer meter accuracy testing, active leakage control and infrastructure monitoring
Refine, enhance or expand ongoing programs based upon
economic justification
Water Loss Control Planning Guide
Establish/revise policies and procedures for data collection
Refine data collection practices and establish as routine
business process
Annual water audit is a reliable gauge of year-to-year water
efficiency standing
Level III (51-70) Level IV (71-90)
Back to InstructionsCopyright © 2010, American Water Works Association. All Rights Reserved. WAS v4.1
AWWA Water Loss Control Committee Loss Control Planning 17

Target ILI Range
1
1.0 - 3.0
0
2
>3.0 -5.0
0
3
>5.0 - 8.0
0
Greater than 8.0
0
4
Less than 1.0
1
Water resources are believed to be sufficient to meet long-term needs, but demand management interventions (leakage management, water conservation) are included in the long-term planning.
Water resources are plentiful, reliable, and easily extracted.
Although operational and financial considerations may allow a long-term ILI greater than 8.0, such a level of leakage is not an effective utilization of water as a resource. Setting a target level greater than 8.0 - other than as an incremental goal to a smaller long-term target - is discouraged.
If the calculated Infrastructure Leakage Index (ILI) value for your system is 1.0 or less, two possibilities exist. a) you are maintaining your leakage at low levels in a class with the top worldwide performers in leakage control. b) A portion of your data may be flawed, causing your losses to be greatly understated. This is likely if you calculate a low ILI value but do not employ extensive leakage control practices in your operations. In such cases it is beneficial to validate the data by performing field measurements to confirm the accuracy of production and customer meters, or to identify any other potential sources of error in the data.
Water resources can be developed or purchased at reasonable expense; periodic water rate increases can be feasibly imposed and are tolerated by the customer population.
Cost to purchase or obtain/treat water is low, as are rates charged to customers.
Existing water supply infrastructure capability is sufficient to meet long-term demand as long as reasonable leakage management controls are in place.
Superior reliability, capacity and integrity of the water supply infrastructure make it relatively immune to supply shortages.
Financial Considerations
Water resources are costly to develop or purchase; ability to increase revenues via water rates is greatly limited because of regulation or low ratepayer affordability.
Water Resources Considerations
Available resources are greatly limited and are very difficult and/or environmentally unsound to develop.
Operational Considerations
Operating with system leakage above this level would require expansion of existing infrastructure and/or additional water resources to meet the demand.
General Guidelines for Setting a Target ILI (without doing a full economic analysis of leakage control options)
Once data has been entered into the Reporting Worksheet, the performance indicators are automatically calculated. How does a water utility operator know how well his or her system is performing? The AWWA Water Loss Control Committee provided the following table to assist water utilities is gauging an approximate Infrastructure Leakage Index (ILI) that is appropriate for their water system and local conditions. The lower the amount of leakage and real losses that exist in the system, then the lower the ILI value will be. Note: this table offers an approximate guideline for leakage reduction target-setting. The best means of setting such targets include performing an economic assessment of various loss control methods. However, this table is useful if such an assessment is not possible.
AWWA Water Loss Control Committee Loss Control Planning 18