avalanche-like fluidization of a non-brownian particle gel
TRANSCRIPT

9026 | Soft Matter, 2015, 11, 9026--9037 This journal is©The Royal Society of Chemistry 2015
Cite this: SoftMatter, 2015,
11, 9026
Avalanche-like fluidization of a non-Brownianparticle gel†
Aika Kurokawa,a Valerie Vidal,b Kei Kurita,a Thibaut Divouxc andSebastien Manneville*bd
We report on the fluidization dynamics of an attractive gel composed of non-Brownian particles made
of fused silica colloids. Extensive rheology coupled to ultrasonic velocimetry allows us to characterize
the global stress response together with the local dynamics of the gel during shear startup experiments.
In practice, after being rejuvenated by a preshear, the gel is left to age for a time tw before being
subjected to a constant shear rate _g. We investigate in detail the effects of both tw and _g on the
fluidization dynamics and build a detailed state diagram of the gel response to shear startup flows. The
gel may display either transient shear banding towards complete fluidization or steady-state shear
banding. In the former case, we unravel that the progressive fluidization occurs by successive steps that
appear as peaks on the global stress relaxation signal. Flow imaging reveals that the shear band grows
until complete fluidization of the material by sudden avalanche-like events which are distributed
heterogeneously along the vorticity direction and correlated to large peaks in the slip velocity at the
moving wall. These features are robust over a wide range of tw and _g values, although the very details of
the fluidization scenario vary with _g. Finally, the critical shear rate _g* that separates steady-state shear-banding
from steady-state homogeneous flow depends on the width of the shear cell and exhibits a nonlinear
dependence with tw. Our work brings about valuable experimental data on transient flows of attractive
dispersions, highlighting the subtle interplay between shear, wall slip and aging whose modeling constitutes a
major challenge that has not been met yet.
1 Introduction
Yield stress materials denote assemblies of mesoscopic constitu-ents such as colloids, droplets or bubbles that display macro-scopic properties intermediate between those of fluids andsolids.1,2 At rest, or under low stress, yield stress materials displaya solid-like behaviour whereas they flow like liquids above acertain threshold, referred to as yield stress.3–5 Their solid-likebehaviour at rest originates either from a densely packed micro-structure composed of soft objects6 such as in dense emulsions,7
jammed microgels,8–10 etc., or from the existence of weak attrac-tive interactions that bind the constituents together and result in
the formation of a sample-spanning network.11 In the latter case,solid-like properties emerge even at low packing fractions. Thisdefines a category referred to as attractive gels,12 which encom-pass various systems such as clay suspensions,13–15 carbon blackgels16,17 and colloid–polymer mixtures.18 All sorts of colloids andlarger particles of different shapes and attraction potentials alsocomply with this definition.19,20
Over the past ten years, the rheological behaviour of attrac-tive gels has proved to be by far one of the most challengingaspects to understand among non-Newtonian fluids. In parti-cular, their mechanical properties at rest are strongly time-dependent: attractive gels display reversible aging dynamicsdriven by the weak attractive forces between its constituents21
and that can be reversed by shear. As a result, the elasticproperties of gels display a slow logarithmic or weak power-law increase with time,22–25 until complete demixing of thesystem, which is historically referred to as syneresis.26 To makematters worse, particles are often denser than the surroundingfluid which fosters syneresis and may trigger the collapse of thegel.27–31 Such density mismatch is further suspected to influ-ence the behaviour of these systems under flow, although clearexperimental evidence is still lacking.32 Nonetheless, it is nowwell established that the behaviour of attractive gels under
a Earthquake Research Institute, The University of Tokyo, 1-1-1 Yayoi, Bunkyo-ku,
Tokyo, Japanb Universite de Lyon, Laboratoire de Physique, Ecole Normale Superieure de Lyon,
CNRS UMR 5672 – 46 Allee d’Italie, 69364 Lyon cedex 07, France.
E-mail: [email protected] Universite de Bordeaux, Centre de Recherche Paul Pascal, CNRS UPR 8641 – 115
avenue Dr Schweitzer, 33600 Pessac, Franced Institut Universitaire de France
† Electronic supplementary information (ESI) available: Five movies and sixsupplemental figures together with their descriptions and explanations. SeeDOI: 10.1039/c5sm01259g
Received 22nd May 2015,Accepted 11th September 2015
DOI: 10.1039/c5sm01259g
www.rsc.org/softmatter
Soft Matter
PAPER
Ope
n A
cces
s A
rtic
le. P
ublis
hed
on 1
4 Se
ptem
ber
2015
. Dow
nloa
ded
on 3
/19/
2022
7:0
2:49
PM
. T
his
artic
le is
lice
nsed
und
er a
Cre
ativ
e C
omm
ons
Attr
ibut
ion-
Non
Com
mer
cial
3.0
Unp
orte
d L
icen
ce.
View Article OnlineView Journal | View Issue

This journal is©The Royal Society of Chemistry 2015 Soft Matter, 2015, 11, 9026--9037 | 9027
external shear involves heterogeneous flows that are highlysensitive to preshear history, boundary conditions, and/orfinite size effects. For instance, one can emphasize the caseof LAPONITEs suspensions whose steady-state flow propertieswere shown to be influenced by the nature of boundaries: underexternal shear, smooth walls lead to the complete fluidization ofthe gel and to linear velocity profiles, while rough boundaryconditions allow the growth of a steady shear band.33,34 More-over, as an illustration of the impact of confinement on flows ofattractive gels, one can mention the spectacular shear-inducedstructuration observed at moderate shear rates and reportedin silica suspensions,35 gels of anisotropic particles,36 attractiveemulsions37 and carbon black gels.38–40 In such cases, the gelrearranges to form a striped pattern of logrolling flocs alignedalong the vorticity direction, whose origin and formation mecha-nism are still highly debated.41
Beyond the effects of bounding walls and confinement,attractive interactions alone are also responsible for long-lastingtransients under external shear. On the one hand, experimentsperformed under constant42–46 and oscillatory43,47,48 stress revealthat the fluidization process of attractive gels, initially at rest, maytake up to tens of hours. Experiments coupled to velocimetry haverevealed that such a process is mostly activated, as evidenced by theArrhenius-like dependence of the fluidization time with the appliedshear stress,43,45 and that it is strongly heterogeneous in both thevorticity and the flow directions.48 On the other hand, attractive gelsshow an overshoot in the stress response to shear startup experi-ments. Such behaviour, which strongly depends on the preshearhistory, corresponds to the orientation and subsequent rupture ofthe gel microstructure into clusters.19,25,49–51 Beyond the yield point,attractive gels either display homogeneous or shear-banded flowsdepending on the applied shear rate and on the boundary condi-tions.52 However, only a handful of studies have investigated theinfluence of the sample age, i.e. the duration separating preshearfrom the start of the experiment, on such a shear-rate-inducedfluidization scenario.53 Recently, Martin and Hu have shown onLAPONITEs suspensions54 that aged-enough samples tend to exhi-bit long-lasting though transient shear-banding, and that shear-banding may also be trapped by the rapid aging of the non-flowingband and become permanent. The latter scenario is remarkable as itstrongly differs from the classic shear-banding scheme which relieson the mechanical instability of the sample under scrutiny.55,56 Thisstudy highlights the interplay between the sample age and the shearand strongly urges the investigation of the impact of sample age onthe shear-induced fluidization scenario in other attractive gels.
To summarize, attractive gels entirely behave neither as solidsnor as fluids over a wide range of timescales. In the landscape ofnon-Newtonian fluids, they define a rather singular category ofmaterials rightfully referred to as the ‘‘Twilight zone’’ in the earlyclassification established by L. Bilmes,57 which was recentlyadapted to complex fluids by G. H. McKinley.58 We barely startto understand the (transient) rheology of attractive gels and moreexperiments are obviously needed to shed some light on theheterogeneous flow of such highly time-dependent materials.
In the present manuscript we report spatially resolved dataon the fluidization dynamics of an attractive gel composed
of weakly attractive non-Brownian particles. Velocimetry performedin a concentric cylinder geometry simultaneously to shear startupexperiments reveals that the steady-state behaviour is a subtlefunction of both the time tw during which the system was left toage before the beginning of the experiment and the value _g of theapplied shear rate. Extensive experiments allow us to build a statediagram of steady-state flows in the (_g, tw) plane. Two distinctregions roughly emerge: (i) homogeneous flows for shear rateslarger than a critical value _g* that weakly increases with the agingtime and (ii) steady-state shear banding elsewhere. As a key result ofthis work, the complete fluidization observed in the upper region ofthe state diagram involves a transient shear band that is progres-sively eroded through a series of dramatic fluidization events.These avalanche-like processes show as large peaks in the tem-poral evolution of both the global shear stress and the slip velocitymeasured at the moving wall of the shear cell. As furtherconfirmed by two-dimensional ultrasonic imaging, this fluidiza-tion process is spatially heterogeneous and may occur at differentlocations along the vorticity direction. Finally, for a range ofparameters (_g, tw) in the vicinity of the boundary between thetwo main regions of the state diagram, we observe large fluctua-tions in the stress and slip velocity signals, although the systemdoes not reach complete fluidization. Such avalanche-like eventsare strongly coupled to variations in both the width of the shearband and the slip velocity. To our knowledge the present work isamong the first experimental evidence of local avalanche-likefluidization events in a weak attractive gel under shear. It alsoprovides an extensive data set to test the relevance of the flowstability criteria for shear banding59 and stands as a newchallenge for spatially resolved models.60–62
2 Materials and methods2.1 Experimental setup
The experimental setup allows us to perform time-resolvedvelocimetry simultaneously with standard rheometry. The rheo-logical measurements are performed in a polished Taylor–Couette (concentric cylinder) cell made of Plexiglas (gap e =2 mm) in which the inner Mooney–Couette cylinder of angle2.31, height 60 mm and radius 23 mm is connected to a stress-controlled rheometer (ARG2, TA Instruments) and positionedat 100 mm from the bottom of the outer cylinder. A solvent traplocated at the top of the rotor and a homemade lid are used toprevent evaporation efficiently up to about 9 hours. The Taylor–Couette cell is embedded in a water tank connected to athermal bath which allows us to keep the sample at a constanttemperature T = 23.5 � 0.1 1C.
Local velocity profiles across the gap of the Taylor–Couette cellare recorded simultaneously with the global rheology by means oftwo different ultrasonic probes immersed in the water tank, whichalso ensures acoustic coupling to the shear cell. The first ultrasonicprobe is a single high-frequency focused transducer that allows usto record the azimuthal velocity v as a function of the radialposition r across the gap at the middle height of the shear cell,i.e. at 30 mm from the bottom. Full technical details on this
Paper Soft Matter
Ope
n A
cces
s A
rtic
le. P
ublis
hed
on 1
4 Se
ptem
ber
2015
. Dow
nloa
ded
on 3
/19/
2022
7:0
2:49
PM
. T
his
artic
le is
lice
nsed
und
er a
Cre
ativ
e C
omm
ons
Attr
ibut
ion-
Non
Com
mer
cial
3.0
Unp
orte
d L
icen
ce.
View Article Online

9028 | Soft Matter, 2015, 11, 9026--9037 This journal is©The Royal Society of Chemistry 2015
one-dimensional ultrasonic velocimetry (1D-USV) technique canbe found in a previous publication.63 The second ultrasonic probeconsists of a linear array of 128 transducers placed vertically atabout 15 mm from the cell bottom. This transducer array is32 mm high and gives access to images of the azimuthal velocityas a function of the radial position r and vertical position z overabout 50% of the cell height. This two-dimensional ultrasonicvelocimetry (2D-USV) technique is thoroughly described in ref. 64.Both devices can be used simultaneously and roughly face eachother in the water tank, i.e. they are separated by an azimuthalangle of about 1801. While the 1D-USV setup has the advantage ofa better spatial resolution (about 40 mm against 100 mm), only the2D-USV setup allows us to detect and monitor the presence of flowheterogeneities along the vorticity direction.
Both velocimetry techniques require that the ultrasonic beamcrossing the gap of the shear cell is backscattered either by thefluid microstructure itself or by acoustic tracers added duringsample preparation when the system is acoustically trans-parent.63,64 Here, we shall emphasize that the microstructureof the sample further detailed below conveniently backscattersultrasound in the single scattering regime, which allows us tomonitor the fluid velocity in a fully non-invasive way.
2.2 Sample preparation and rheological properties
Our Ludox gels are prepared following the same recipe as that usedby Møller et al. in ref. 65. As we shall show below, the system is
composed of non-Brownian particles made of permanently fusedsilica colloids. These particles are themselves reversibly aggregatedin brine due to van der Waals forces leading to a space-spanninggel with solid-like properties at rest.
A stable suspension of silica colloids (Ludox TM-40, Sigma-Aldrich, 40 wt% in silica colloids) of typical diameter 20 nm[see Fig. 1(a) for a scanning electron microscopy (SEM) image ofa dilute sample (Supra 55, VP Zeiss)] and pH = 9.0 � 0.5 is firstpoured without any further purification into a 10 wt% deio-nized aqueous solution of sodium chloride (Merck Millipore)up to a Ludox : NaCl mass ratio of 6 : 13, corresponding to afinal volume fraction of 7% in silica colloids and a final pH of7.6 � 0.2. The mixture, which instantaneously becomes whiteand optically opaque, is then shaken intensely by hand for2 min and left at rest for at least 15 h before being studied. Sucha drastic change in the sample turbidity strongly suggests therapid formation of aggregates at the micron scale. Indeed,direct observations using different techniques confirm theexistence of a much coarser microstructure than the initialnanometric silica colloids. On the one hand, SEM images of adried droplet extracted from a fresh sample that has beenpreviously diluted in a NaCl solution unveil the presence ofparticles whose size ranges from a few microns up to a hundredmicrons [Fig. 1(b)]. On the other hand, bright-field microscopyimages (ECLIPSE Ti, Nikon) of the sample neither altered nordiluted further confirm the existence of these micron-sized
Fig. 1 SEM images of (a) the stock colloidal suspension (Ludox TM-40) used to prepare the sample and (b) the non-Brownian aggregates composing thesample which form almost instantaneously after mixing the colloidal suspension with a concentrated NaCl solution. The inset in (b) shows a single typicalaggregate made of fused silica colloids. Images are obtained as follows: both the suspension and the gel have been diluted by a factor 1000 (except forthe main figure in (b) where the gel has been diluted 100�), the first one in deionized water and the second one in 6.8 wt% NaCl which corresponds to thefinal salt concentration in the gel. The samples are then left to dry on a pin stub before being imaged. (c)–(e) Bright-field microscopy imagesrepresentative of the gel microstructure at three different magnifications. The sample has been presheared for 2 min at 500 s�1 before being imagedabout 10 minutes later in a homemade observation cell made of a glass slide topped with a cover slip and sealed with UV glue.
Soft Matter Paper
Ope
n A
cces
s A
rtic
le. P
ublis
hed
on 1
4 Se
ptem
ber
2015
. Dow
nloa
ded
on 3
/19/
2022
7:0
2:49
PM
. T
his
artic
le is
lice
nsed
und
er a
Cre
ativ
e C
omm
ons
Attr
ibut
ion-
Non
Com
mer
cial
3.0
Unp
orte
d L
icen
ce.
View Article Online

This journal is©The Royal Society of Chemistry 2015 Soft Matter, 2015, 11, 9026--9037 | 9029
particles [Fig. 1(c)–(e)], which are stable in time and robustto repeated shear, as confirmed by similar observations per-formed on samples subjected to different shear histories(images not shown).
To account for the formation of such a large scale micro-structure, which to our knowledge has not been reported in theliterature previously,65,66 we propose the following scenario.Above pH = 7, silica colloids are negatively charged and bearsilanol (Si–OH) and dissociated silanol groups that are poorlyhydrated.67 In most of the previous studies, NaCl is added in arelatively small amount (typically 0.05–0.5 M) such that electro-static repulsion is screened leading to the slow reversibleaggregation of individual colloids until the formation of acolloidal gel.68–70 Here, we add a much larger amount of salt(1.2 M) to the colloidal suspension, which leads to an ionexchange where protons are replaced by sodium ions.71,72 Theloss of hydrogen bonding between the colloids and the solventtriggers the fast and irreversible aggregation of the silica colloidsthrough the formation of interparticle siloxane bonds,73–75 result-ing in the formation of the non-Brownian particles describedabove. Finally, these non-Brownian particles also aggregate rever-sibly due to van der Waals forces and form a space-spanningnetwork, i.e. a gel, whose mechanical behaviour is studied below.Note that such a microstructure scatters ultrasound efficiently,allowing us to use both 1D- and 2D-USV without requiring anyseeding of the sample with tracer particles.
The rheological features of the gel are displayed in Fig. 2. Astrong preshear of _gp = 500 s�1 applied for 2 min fully fluidizes thesystem, which quickly rebuilds once the preshear is stopped andsubsequently shows pronounced aging. Indeed, the small ampli-tude oscillatory shear reveals that the elastic modulus G0 becomeslarger than the viscous modulus G00 within about 20 s [see Fig. S1in the ESI†] and that G0 further increases logarithmically over morethan 2 h [Fig. 2(a)]. Such aging dynamics are reproducible for agiven preshear protocol and lead to the formation of a solid-likegel. The latter shows an elastic modulus that is nearly frequencyindependent and a critical yield strain of about 7% that weaklydepends on the sample age [see Fig. S2 and S3 in the ESI†].
Such a solid-like behaviour is also reflected in the nonlinearrheology of the gel. Fig. 2(b) shows the flow curve s vs. _g measuredby sweeping down the shear rate from 103 to 10�2 s�1 and backup. The flow curve shows an apparent yield stress of a few Pascalsand displays a complex non-monotonic shape together withstrong hysteresis. Velocity profiles recorded simultaneously forthe up and down shear rate sweeps shown in Fig. 2 reveal that wallslip and heterogeneous flows are involved over a large range ofshear rates, below 20 s�1 during the decreasing ramp and up toabout 200 s�1 during the increasing ramp [see Fig. S4 in the ESI†].In particular, the large stress peak observed in Fig. 2(b) at _g C 7 s�1
while ramping up the shear rate is the signature of the partialfluidization of the sample which moves as a plug and totallyslips at both walls for 7 t _gt 100 s�1, before finally starting toflow homogeneously on the reversible branch at high shearrates, i.e. above about 200 s�1.
Furthermore, in Fig. 2(b), the shear stress s shows a mini-mum in between _gC 20 s�1 and 40 s�1 on the decreasing shear
rate sweep, which hints at the existence of a critical shear-rate_gc below which no homogeneous flow is possible.76,77 The latterresult is confirmed by performing steady-state measurementsat a constant applied shear rate starting from the liquid state,i.e. on a fully fluidized sample, in order to avoid long-lastingtransients that go along with shear startup experiments on asample at rest, and which are at the core of Section 3. Here,discrete shear rates of decreasing values ranging from 500 s�1
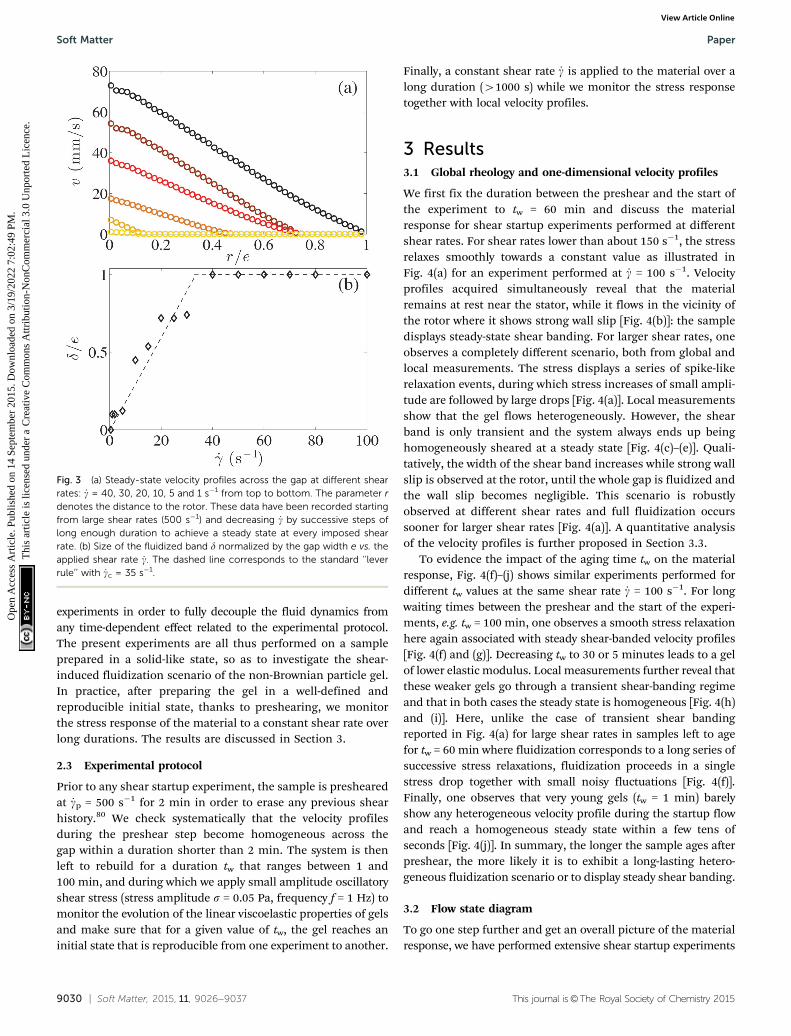
down to 0.1 s�1 are successively applied for at least 300 s each.The flow remains homogeneous down to _gc B 35 s�1 belowwhich the sample exhibits an arrested band [Fig. 3(a)]. Such avalue of _gc is comparable to the one reported in a previous workon very similar Ludox gels.65 Moreover, as the shear rate isdecreased below _gc, the size of the fluidized band d decreasesroughly linearly with _g [Fig. 3(b)] in agreement with the classical‘‘lever rule’’.65,76,77 The deviation of d from a straight line couldbe related to the wall slip that is present at the rotor.
To conclude this subsection, complex cycles of hysteresissuch as the one reported in Fig. 2 have also been reported fornumerous other attractive gels including carbon black gels45
and clay suspensions.34,78 Although significant progress hasbeen made in extracting quantitative information from hysteresisloops,79 we rather chose to focus our study on shear startup
Fig. 2 (a) Elastic modulus G0 vs. time t after a preshear at _gp = 500 s�1 for2 min. Inset: the same data set in semilogarithmic scales. Measurementsperformed under oscillatory shear stress in the linear regime with fre-quency 1 Hz and stress amplitude 0.05 Pa. (b) Flow curve s vs. _g obtainedby first decreasing _g continuously from 103 to 10�2 s�1 in 75 logarithmicallyspaced points of duration dt = 8 s (.) and then increasing _g over the samerange (m).
Paper Soft Matter
Ope
n A
cces
s A
rtic
le. P
ublis
hed
on 1
4 Se
ptem
ber
2015
. Dow
nloa
ded
on 3
/19/
2022
7:0
2:49
PM
. T
his
artic
le is
lice
nsed
und
er a
Cre
ativ
e C
omm
ons
Attr
ibut
ion-
Non
Com
mer
cial
3.0
Unp
orte
d L
icen
ce.
View Article Online
9030 | Soft Matter, 2015, 11, 9026--9037 This journal is©The Royal Society of Chemistry 2015
experiments in order to fully decouple the fluid dynamics fromany time-dependent effect related to the experimental protocol.The present experiments are all thus performed on a sampleprepared in a solid-like state, so as to investigate the shear-induced fluidization scenario of the non-Brownian particle gel.In practice, after preparing the gel in a well-defined andreproducible initial state, thanks to preshearing, we monitorthe stress response of the material to a constant shear rate overlong durations. The results are discussed in Section 3.
2.3 Experimental protocol
Prior to any shear startup experiment, the sample is preshearedat _gp = 500 s�1 for 2 min in order to erase any previous shearhistory.80 We check systematically that the velocity profilesduring the preshear step become homogeneous across thegap within a duration shorter than 2 min. The system is thenleft to rebuild for a duration tw that ranges between 1 and100 min, and during which we apply small amplitude oscillatoryshear stress (stress amplitude s = 0.05 Pa, frequency f = 1 Hz) tomonitor the evolution of the linear viscoelastic properties of gelsand make sure that for a given value of tw, the gel reaches aninitial state that is reproducible from one experiment to another.
Finally, a constant shear rate _g is applied to the material over along duration (41000 s) while we monitor the stress responsetogether with local velocity profiles.
3 Results3.1 Global rheology and one-dimensional velocity profiles
We first fix the duration between the preshear and the start ofthe experiment to tw = 60 min and discuss the materialresponse for shear startup experiments performed at differentshear rates. For shear rates lower than about 150 s�1, the stressrelaxes smoothly towards a constant value as illustrated inFig. 4(a) for an experiment performed at _g = 100 s�1. Velocityprofiles acquired simultaneously reveal that the materialremains at rest near the stator, while it flows in the vicinity ofthe rotor where it shows strong wall slip [Fig. 4(b)]: the sampledisplays steady-state shear banding. For larger shear rates, oneobserves a completely different scenario, both from global andlocal measurements. The stress displays a series of spike-likerelaxation events, during which stress increases of small ampli-tude are followed by large drops [Fig. 4(a)]. Local measurementsshow that the gel flows heterogeneously. However, the shearband is only transient and the system always ends up beinghomogeneously sheared at a steady state [Fig. 4(c)–(e)]. Quali-tatively, the width of the shear band increases while strong wallslip is observed at the rotor, until the whole gap is fluidized andthe wall slip becomes negligible. This scenario is robustlyobserved at different shear rates and full fluidization occurssooner for larger shear rates [Fig. 4(a)]. A quantitative analysisof the velocity profiles is further proposed in Section 3.3.
To evidence the impact of the aging time tw on the materialresponse, Fig. 4(f)–(j) shows similar experiments performed fordifferent tw values at the same shear rate _g = 100 s�1. For longwaiting times between the preshear and the start of the experi-ments, e.g. tw = 100 min, one observes a smooth stress relaxationhere again associated with steady shear-banded velocity profiles[Fig. 4(f) and (g)]. Decreasing tw to 30 or 5 minutes leads to a gelof lower elastic modulus. Local measurements further reveal thatthese weaker gels go through a transient shear-banding regimeand that in both cases the steady state is homogeneous [Fig. 4(h)and (i)]. Here, unlike the case of transient shear bandingreported in Fig. 4(a) for large shear rates in samples left to agefor tw = 60 min where fluidization corresponds to a long series ofsuccessive stress relaxations, fluidization proceeds in a singlestress drop together with small noisy fluctuations [Fig. 4(f)].Finally, one observes that very young gels (tw = 1 min) barelyshow any heterogeneous velocity profile during the startup flowand reach a homogeneous steady state within a few tens ofseconds [Fig. 4(j)]. In summary, the longer the sample ages afterpreshear, the more likely it is to exhibit a long-lasting hetero-geneous fluidization scenario or to display steady shear banding.
3.2 Flow state diagram
To go one step further and get an overall picture of the materialresponse, we have performed extensive shear startup experiments
Fig. 3 (a) Steady-state velocity profiles across the gap at different shearrates: _g = 40, 30, 20, 10, 5 and 1 s�1 from top to bottom. The parameter rdenotes the distance to the rotor. These data have been recorded startingfrom large shear rates (500 s�1) and decreasing _g by successive steps oflong enough duration to achieve a steady state at every imposed shearrate. (b) Size of the fluidized band d normalized by the gap width e vs. theapplied shear rate _g. The dashed line corresponds to the standard ‘‘leverrule’’ with _gc = 35 s�1.
Soft Matter Paper
Ope
n A
cces
s A
rtic
le. P
ublis
hed
on 1
4 Se
ptem
ber
2015
. Dow
nloa
ded
on 3
/19/
2022
7:0
2:49
PM
. T
his
artic
le is
lice
nsed
und
er a
Cre
ativ
e C
omm
ons
Attr
ibut
ion-
Non
Com
mer
cial
3.0
Unp
orte
d L
icen
ce.
View Article Online

This journal is©The Royal Society of Chemistry 2015 Soft Matter, 2015, 11, 9026--9037 | 9031
by varying systematically both the aging time (1 r tw r 100 min)and the applied shear rate (10 r _g r 250 s�1). The entire data setis summarized in the flow state diagram pictured in Fig. 5, wheredifferent symbols code for the three different scenarios that wemay distinguish at the end of each startup experiment lastingtypically for 1500 to 3600 s. In the steady state, the attractive gelmay either fully fluidize after a transient phase possibly involvingstrong fluctuations ( in Fig. 5), as observed in the upper part ofthe state diagram for large shear rates quite independent of thesample age, or exhibit shear banding. The boundary betweenthese two regimes defines a critical shear rate _g* that depends in anonlinear fashion on the sample age tw. Furthermore, we candiscriminate between two types of behaviour when shear bandingis observed.
First, steady shear banding ( in Fig. 5), for which both thewidth d of the shear band and the slip velocity vs at the rotordisplay negligible fluctuations in the steady state, is observed inparticular at low aging times tw t 20 min and low enoughshear rates, typically below 100 s�1. In that case, the width of
the arrested band may decrease (tw = 1 s) or remain constant(tw = 10 s and 100 s) for increasing shear rates.
Second, we have also observed unsteady shear banding ( inFig. 5). In this case both global and local measurements displaysignificant fluctuations in the steady state. These fluctuationsare strikingly similar to those observed during the transientsleading to complete fluidization in the upper part of the diagram.However here the material never gets entirely fluidized and theshear band width d does not show a systematic evolution towardsd = e so that an unsteady shear band persists in the steady state atleast within the finite duration of the experiments. These fluctua-tions are investigated in more detail in the next section.
3.3 Linking global rheology to the local dynamics
In this section, we focus on the strong fluctuations that areobserved (i) during transient regimes leading to completefluidization and (ii) during unsteady shear-banded flows atthe steady state. Global rheological data together with thedetailed analysis of the corresponding local measurements
Fig. 4 (a) Shear stress response s(t) for different applied shear rates [color, _g (s�1)]: [ , 100]; [ , 150]; [ , 200]; [–, 250]. (b)–(e) Velocity profile v(r) acrossthe gap, where r is the distance to the rotor at different times [symbol, time (s)]: [J, 200]; [&, 400]; [n, 800]; [,, 1400]. Each color corresponds to eachapplied shear rate in (a). The rotor velocity corresponds to the upper bound of the vertical axis. The sample is left to age for tw = 60 min before eachexperiment. (f) Shear stress response s(t) for different waiting times tw [color, tw (min)]: [ , 100]; [ , 30]; [ , 5]; [–, 1]. Experiments performed at_g = 100 s�1. (g)–(j) Velocity profile at different times [symbol, time (s)]: [J, 30]; [&, 400]; [n, 800]; [,, 1100]. Each color corresponds to each value of tw
in (f). The rotor velocity corresponds to the upper bound of the vertical axis.
Paper Soft Matter
Ope
n A
cces
s A
rtic
le. P
ublis
hed
on 1
4 Se
ptem
ber
2015
. Dow
nloa
ded
on 3
/19/
2022
7:0
2:49
PM
. T
his
artic
le is
lice
nsed
und
er a
Cre
ativ
e C
omm
ons
Attr
ibut
ion-
Non
Com
mer
cial
3.0
Unp
orte
d L
icen
ce.
View Article Online

9032 | Soft Matter, 2015, 11, 9026--9037 This journal is©The Royal Society of Chemistry 2015
are reported in Fig. 6 and 7 respectively, (see also the corres-ponding Movies S1 and S2 in the ESI†). Local data are analyzedas follows: linear fits of the velocity profiles in the fluidized part
of the gap are used to estimate the local shear rate andextrapolate the sample velocity v(0) at the rotor. The width dof the shear band is obtained as the abscissa of the intersectionbetween the fit and the zero velocity axis, while the slip velocityis given by vs = v0 � v(0), where v0 is the rotor velocity. Finally,the global shear rate is defined as v(0)/e.
We first discuss Fig. 6, which shows a case of full fluidiza-tion for _g = 150 s�1 on a gel left to age for tw = 30 min. The stressrelaxes by successive jumps until full fluidization, which occursat t = tf C 507 s and after that s remains roughly constant[Fig. 6(a)]. The temporal evolutions of d [Fig. 6(b)] and of thelocal shear rate [Fig. 6(c)] show that fluidization occurs bysuccessive spatial ‘‘avalanches’’ that are directly correlated tothe stress drops. During the whole fluidization process, the slipvelocity at the rotor vs decreases towards a negligible value thatis reached at t = tf, diminishing by jumps that are in phase withthe stress evolution.
Fig. 7 focuses on spatiotemporal fluctuations observed dur-ing steady-state shear-banded flows for the same aging time(tw = 30 min) as in Fig. 6 but sheared at a lower shear rate( _g = 50 s�1). The stress exhibits periods of slow increasefollowed by rapid drops [Fig. 7(a)]. Within an hour, about halfof the gap gets fluidized and the size of the fluidized bandshows a pronounced increase during a short period of times,which are synchronized with the stress drops [Fig. 7(b)]. Thedynamics of the fluid at the rotor is strongly correlated tothe global fluctuations, as evidenced by the sudden peaks ofthe slip velocity when the stress drops. Note that, although theslip velocity decreases in average over the whole duration ofthe experiment, it remains at a high level of about 20%, in
Fig. 5 Flow state diagram in the (sample age tw, applied shear rate _g) plane.In the steady state, the gel may either be fully fluidized ( , blue region) ordisplay shear banding. Steady shear banding is represented in ( ) symbolwhose size encodes the portion of the gap that is being sheared. Unsteadybanding, which denotes flows where the band width and the slip velocity at
the rotor display significant fluctuations, is represented by ( ).
Fig. 6 Full fluidization observed for _g = 150 s�1 and tw = 30 min. (a) Shearstress s (–) and slip velocity vs ( ) vs. time. (b) Width d of the fluidized shearband normalized by the gap width e vs. time. (c) Local shear rate within theshear band (–) and global shear rate ( ) vs. time. The horizontal dotted lineindicates the shear rate applied by the rheometer. In (a)–(c), the verticaldashed line indicates the fluidization time tf.
Fig. 7 Unsteady shear banding observed for _g = 50 s�1 and tw = 30 min. (a)Shear stress s (–) and slip velocity vs ( ) vs. time. (b) Width d of the fluidizedshear band normalized by the gap width e vs. time. (c) Local shear ratewithin the shear band (–) and global shear rate ( ) vs. time. The horizontaldotted line indicates the shear rate applied by the rheometer.
Soft Matter Paper
Ope
n A
cces
s A
rtic
le. P
ublis
hed
on 1
4 Se
ptem
ber
2015
. Dow
nloa
ded
on 3
/19/
2022
7:0
2:49
PM
. T
his
artic
le is
lice
nsed
und
er a
Cre
ativ
e C
omm
ons
Attr
ibut
ion-
Non
Com
mer
cial
3.0
Unp
orte
d L
icen
ce.
View Article Online

This journal is©The Royal Society of Chemistry 2015 Soft Matter, 2015, 11, 9026--9037 | 9033
noticeable contrast to the fully fluidized scenario described inthe previous paragraph. Such oscillatory dynamics in thevicinity of the rotor are reminiscent of stick-slip. Indeed, thefluidized band shows a time interval during which the localshear rate remains constant [Fig. 7(c)], while the band widthslowly decreases. As a result, the stress slowly builds up, untilthe fluidized band experiences a large slip event at the movingwall and gets rejuvenated. These dynamics look similar to thestick-slip motion reported in clays in the pioneering work ofPignon et al.81 However, in the latter case, stick-slip occursalong fracture planes located in the bulk sample, while hereslip at the wall appears to play a key role.
Finally, we shall emphasize that in both types of scenarios,the peaks in both the stress and the slip velocity are only seen inthe presence of shear banding. Although it is not clear which of theshear banding or the slip at the rotor is the cause of the oscillations,these peculiar dynamics hint toward a subtle flow-microstructurecoupling that certainly deserves more investigation.
3.4 Local scenario within an avalanche
To get better insight on the avalanche-like fluidization scenario,we now focus on the single stress drop shown in Fig. 8(a). Thisevent is extracted from the shear startup experiments performedat _g = 150 s�1 for tw = 10 min and the steady-state flowcorresponds to a fully fluidized sample [inset of Fig. 8(a)].The velocity profiles recorded simultaneously with 1D-USV areplotted as a spatiotemporal diagram in Fig. 8(b). Quite surpris-ingly the one-dimensional flow profiles before and after the
stress drop are very similar as they all show shear localizationover about half the gap. By the time the stress reaches itsmaximum value, about 80% of the gap is sheared. Then shearabruptly localizes again over about 1 mm close to the rotor atthe beginning of the stress relaxation. Therefore, although thestrong fluctuations of v(r, t) observed before the stress peakappear to be correlated to those of s(t), the drop of about15% in the stress value cannot be explained by these one-dimensional data in a straightforward manner. We emphasizethat the 1D-USV measurements are performed at a given heightof the Taylor–Couette cell so that they may reflect the evolutionof global rheology only if the flow is homogeneous along thevorticity direction. As a matter of fact, velocity profiles v(r, z, t)recorded simultaneously over the whole height of the Taylor–Couette cell through 2D-USV demonstrate that the flow isstrongly heterogeneous in the vertical direction z. Fig. 8(c)shows a spatiotemporal plot of the fluid velocity along thevertical axis z at a fixed radial position r0 = 0.2 mm close to therotor (see also Movie S3 in the ESI†). Depending on the positionalong the z-axis, the material can simultaneously be eithersolid-like as evidenced by areas of very low velocities inFig. 8(c) (see, for instance, at the top of the region of interestfor z t 5 mm) or fluid-like and flow at high velocities asobserved for z C 8 and z C 30 mm. Note that the 1D-USVmeasurements are performed at z0 C 15 mm and are fullyconsistent with the 2D-USV data. Our measurements furtherreveal that the particular avalanche-like event analyzed hereonly corresponds to partial fluidization: at the end of the stressdrop, the flow is still heterogeneous, even though arrestedregions for t t 870 s have given way to flowing regionsarranged in a vertically banded structure for t \ 890 s. In fact,the inset of Fig. 8(a) shows that several subsequent stress dropevents still have to take place before complete fluidization ofthe sample.
To test the existence of a local fluidization scenario thatwould be generic to all avalanche-like events, we analyze addi-tional experiments in the full fluidization region of the statediagram at _g = 180 and 200 s�1. The temporal evolution of theshear stress is reported, respectively, in Fig. 9(a) and 10(a) andthe corresponding 2D-USV measurements v(r0, z, t) are dis-played as spatiotemporal diagrams in Fig. 9(b) and 10(b) for aradial position r0 = 0.7 mm (see also Movies S4 and S5 in theESI†). Here again, the temporal evolution of the velocity field isstrongly heterogeneous along the vertical direction in bothexperiments. Furthermore, despite the fact that these twoexperiments are performed at comparable shear rates, the localfluidization scenario is strikingly different. In the shear startupexperiment reported in Fig. 9, the lower part of the region ofinterest is fully fluidized after the first stress relaxation whilethe upper part of the sample necessitates two supplementalavalanches to in turn fully fluidize. On the other hand, thefluidization process shown in Fig. 10 starts from the upper partof the region of interest before extending to the lower part of theTaylor–Couette cell. Here, each avalanche-like event involves largepieces of the sample with a typical vertical extension of about5 mm [see events marked by white dotted lines in Fig. 10(a)].
Fig. 8 (a) Stress s vs. time during a single stress drop event extracted fromthe shear startup experiment during which the material is fully fluidized( _g = 150 s�1, tw = 10 min). Inset: Stress vs. time for the whole experiment.The signal pictured in the main graph appears in red. (b) Spatiotemporaldiagram of the velocity data v(r, t) as a function of position r and time t.The radial position r is measured from the rotating inner wall. Dataobtained with 1D-USV. (c) Spatiotemporal diagram of the velocity datav(r0, z, t) as a function of the vertical position z and time t at r0 = 0.2 mm.Data obtained with 2D-USV. The vertical position z is measured from thetop of the transducer array. In both (b) and (c), the fluid velocity is colorcoded in mm s�1.
Paper Soft Matter
Ope
n A
cces
s A
rtic
le. P
ublis
hed
on 1
4 Se
ptem
ber
2015
. Dow
nloa
ded
on 3
/19/
2022
7:0
2:49
PM
. T
his
artic
le is
lice
nsed
und
er a
Cre
ativ
e C
omm
ons
Attr
ibut
ion-
Non
Com
mer
cial
3.0
Unp
orte
d L
icen
ce.
View Article Online

9034 | Soft Matter, 2015, 11, 9026--9037 This journal is©The Royal Society of Chemistry 2015
Some of these events only show up in the stress response as verysmall peaks while their local signature is much more impressive(see, e.g., the event at t C 600 s). For t C 400–500 s, the sample
even appears to fluidize, or at least set into motion, throughregular steps occuring from top to bottom with a characteristictime of 10–20 s. The experiments shown in Fig. 9 and 10 allow usto conclude that the peaks in the stress signal may encompassvery different local scenarios. Since both experiments were per-formed with the same aging time tw = 1 min, these resultsillustrate the high sensitivity to ‘‘initial conditions’’, i.e. to thepossibly different arrangement of the heterogeneous microstruc-ture after the aging process, and the subtle interplay betweenaging and shear banding with no systematic failure scenario alongthe cell height.
4 Discussion
On the one hand, we conclude from Section 2.2 that the gelunder scrutiny displays a discontinuous yielding transition thatis very similar to the one reported in other attractive gels.65,77,82
Indeed, one observes that, when the initial condition is acompletely fluidized state, applying a series of shear rates ofdecreasing values leads to the growth of a steady-state arrestedband below a critical shear rate _gc. The value of _gc is inherent tothe sample and results from the flow instability at low shearrates. This is fully consistent with previous results on Ludoxgels.65 On the other hand, the shear startup experimentsreported in Section 3 and performed on the sample preparedin the solid state allow us to identify a second critical shear rate_g* 4 _gc. For applied shear rates such as _gc o _go _g*, the samplegets only partially fluidized and exhibits steady-state shearbanding, while long-lasting yet transient shear banding isobserved for _g 4 _g*. Such a behaviour can be interpretedin the framework recently described by Martin and Hu forLAPONITEs samples.54 Under external shear, the sample in thevicinity of the rotor that is initially at rest gets fluidized, whilethe sample close to the stator remains at rest and keeps aging.Depending on the intensity of the shear rate, such a hetero-geneous velocity profile may either be trapped by the sampleaging and become permanent as observed below _g*, or becomehomogeneous after a transient shear-banding regime whoseduration decreases for increasing values of _g. Such an argumentallows us to understand that _g* will be sensitive to the gap sizeand to the cell geometry, which we have verified by performingidentical shear startup experiments with different gap widths.These experiments show that _g* decreases as the gap size isreduced [see Fig. S6 in the ESI†]. Therefore, steady-state shearbanding trapped by aging should be distinguished from shearbanding resulting from the intrinsic flow instability whichshould not depend on the geometry. Finally, we have shownin Section 3.2 that _g* is a nonlinear function of the sample agetw, again in contrast to _gc.
Regarding the transient fluidization dynamics, our workunravels the existence of very characteristic peaks in the globalrheological data. These peaks correspond to local avalanchesassociated with the abrupt fluidization of shear-banded velocityprofiles. An avalanche proceeds in two steps. First, the sampleages as evidenced by the slow increase of the stress indicative of
Fig. 9 (a) Stress s vs. time during a single stress relaxation episodeextracted from the shear startup experiment at the end of which thematerial is fully fluidized ( _g = 180 s�1, tw = 1 min). (b) Spatiotemporaldiagram of the velocity data v(r0, z, t) as a function of the vertical position zand time t at r0 = 0.7 mm. Data obtained with 2D-USV. The verticalposition z is measured from the top of the transducer array. The fluidvelocity is color coded in mm s�1.
Fig. 10 (a) Stress s vs. time during a single stress relaxation episodeextracted from the shear startup experiment at the end of which thematerial is fully fluidized ( _g = 200 s�1, tw = 1 min). (b) Spatiotemporaldiagram of the velocity data v(r0, z, t) as a function of the vertical position zand time t, at r0 = 0.7 mm. Data obtained with 2D-USV. The verticalposition z is measured from the top of the transducer array. The fluidvelocity is color coded in mm s�1.
Soft Matter Paper
Ope
n A
cces
s A
rtic
le. P
ublis
hed
on 1
4 Se
ptem
ber
2015
. Dow
nloa
ded
on 3
/19/
2022
7:0
2:49
PM
. T
his
artic
le is
lice
nsed
und
er a
Cre
ativ
e C
omm
ons
Attr
ibut
ion-
Non
Com
mer
cial
3.0
Unp
orte
d L
icen
ce.
View Article Online

This journal is©The Royal Society of Chemistry 2015 Soft Matter, 2015, 11, 9026--9037 | 9035
progressive consolidation, while the shear band remainsroughly fixed. Second, the sample suddenly fluidizes beforelocalizing again, at least partially, while the stress drops and theshear rate increases. This scenario strikingly recalls the transientshear banding reported on LAPONITEs clay suspensions54 andfits well with the stability criterion recently proposed by Fieldinget al.59,62 In practice though, the physical origin of the avalanche-like and successive stress relaxation events remains to be deter-mined. Aging is more pronounced in our system than in theattractive gels that have been studied previously22,83,84 as evi-denced from the large values of dG0/d log t after preshear [see theinset of Fig. 2(a)]. Therefore, syneresis driven by the aggregationand/or sedimentation of the colloidal flocs due to their densitymismatch with the surrounding fluid could also play a role andinterfere with the traditional picture of a competition betweenaging and shear rejuvenation.85 As syneresis is negligible in mostof the colloidal gels that have been the topic of rheophysicalstudies so far, it could also explain why such stress oscillationshave, to our knowledge, never been reported in the literature.
An alternative explanation for the stress oscillations couldbe related to confinement. Indeed, as the size distribution ofthe fused silica aggregates is wide and extends up to 100 mm,the sample mesostructure most likely involves aggregateswhose size becomes comparable to that of the gap, at leastfor long enough rest durations tw. In this framework, stressoscillations would result from a competition between shear-induced structuration as described in the Introduction and thestrong aging of the sample. Such an interpretation would alsoaccount for the stick-slip like motion of the fluidized band atthe moving wall. Nonetheless, despite systematic monitoring ofthe sample during shear startup experiments, no structurationor spatial pattern could be observed. Moreover, supplementalshear startup experiments in narrower gaps show that for agiven shear rate, stronger confinement leads to the disappear-ance of the stress oscillations and homogeneous velocity pro-files [see Fig. S6 in the ESI†]. This last result strongly suggeststhat confinement alone cannot account for stress oscillations.
Finally, the present study has focused on experimentsperformed under smooth boundary conditions, revealing thepresence of strong wall slip associated with heterogeneous,shear-banded flows while fully fluidized states show negligiblewall slip. Yet the roughness and/or chemical nature of the wallsare known to have a crucial influence not only on rheologicalmeasurements but also on the local flow both close to the wallsand in the bulk.33,34,45,86,87 Therefore the influence of boundaryconditions on the complex fluidization scenario reported hereappears as the next key question to address in future work. As afirst step, we report preliminary tests on the role of boundaryconditions in the above results in the ESI.† The flow curvemeasured under ‘‘rough’’ boundary conditions in a sand-blastedPlexiglas Taylor–Couette cell with a typical roughness of 1 mm(compare with a few tens of nanometers for the ‘‘smooth’’ cell usedso far) shows a smaller, yet significant hysteresis [see Fig. S1(b) inthe ESI†] as well as wall slip at low shear rates (see Fig. S5 in theESI†). Furthermore, one can see a strong difference between thevelocity profiles recorded simultaneously with the flow curve,
respectively, with the rough and smooth boundary conditions(compare Fig. S4 and S5 in the ESI†) although the surface rough-ness of the rough boundary does not match exactly the size of themicrostructure. In particular, the transient fluidization episodereported around _g C 7 s�1 with smooth boundary conditions[Fig. S2(b) and S4 in the ESI†] is absent with rough walls (seeFig. S5 in the ESI†). These preliminary results illustrate the strongimpact of the boundary conditions and urge for systematicexperiments so as to quantify the impact of the boundary condi-tions, especially on the state diagram reported in Fig. 5.
5 Conclusion
We have investigated the local scenario associated with theshear-induced fluidization of an attractive gel made of non-Brownian particles. We have identified a critical shear rate _g*that separates steady shear-banded flows from full fluidizationand that exhibits a nonlinear dependence with the sample agetw. This critical shear rate _g* is much larger than the onesignaling flow instability in experiments starting from fluidizedstates and depends on the shear cell geometry as well aspossibly on the preshear intensity imposed prior to the shearstartup experiment. As a key result, we have shown that forshear rates larger than _g*, the fluidization of the sample involvessuccessive local avalanche-like events that are heterogeneouslydistributed along the cell height and dynamics of which isstrongly coupled to both the slip behaviour at the wall and thewidth of the shear band. Such avalanches appear in the stresssignal as peaks, whose individual properties are strongly remi-niscent of stick-slip phenomena. Future work will focus on theearly stage of shear startup experiments, and in particular on thestress overshoot that occurs before the stress relaxation, as wellas on the influence of the boundaries and confinement on thefluidization scenario.
Acknowledgements
The authors thank J.-P. Chapel, B. Keshavarz and G. Ovarlez forstimulating discussions, T. Gibaud for allowing us to use hismicroscope, J. Laurent for her precious assistance with the SEMexperiments as well as two anonymous referees for their con-structive remarks on our manuscript. This work was supportedby JSPS and CNRS under the Japan-France Research CooperativeProgram (PRC CNRS/JSPS RheoVolc). A.K. acknowledges supportby JSPS Kakenhi Grant No. 265204. S.M. acknowledges fundingfrom Institut Universitaire de France and the European ResearchCouncil under the European Union’s Seventh Framework Pro-gramme (FP7/2007-2013) and ERC Grant Agreement No. 258803.
References
1 P. Coussot, J. Non-Newtonian Fluid Mech., 2014, 211, 31–49.2 D. Bonn, J. Paredes, M. Denn, L. Berthier, T. Divoux and
S. Manneville, 2015, arXiv:1502.05281.
Paper Soft Matter
Ope
n A
cces
s A
rtic
le. P
ublis
hed
on 1
4 Se
ptem
ber
2015
. Dow
nloa
ded
on 3
/19/
2022
7:0
2:49
PM
. T
his
artic
le is
lice
nsed
und
er a
Cre
ativ
e C
omm
ons
Attr
ibut
ion-
Non
Com
mer
cial
3.0
Unp
orte
d L
icen
ce.
View Article Online

9036 | Soft Matter, 2015, 11, 9026--9037 This journal is©The Royal Society of Chemistry 2015
3 P. C. F. Møller, A. Fall and D. Bonn, Europhys. Lett., 2009,87, 38004.
4 G. Ovarlez, S. Cohen-Addad, K. Krishan, J. Goyon andP. Coussot, J. Non-Newtonian Fluid Mech., 2013, 193, 68–79.
5 N. Balmforth, I. Frigaard and G. Ovarlez, Annu. Rev. FluidMech., 2014, 46, 121–146.
6 R. Bonnecaze and M. Cloitre, Adv. Polym. Sci., 2010, 236,117–161.
7 T. G. Mason, J. Bibette and D. A. Weitz, J. Colloid InterfaceSci., 1996, 179, 439–448.
8 M. Cloitre, M. Borrega, F. Monti and L. Leibler, C. R. Phys.,2003, 4, 221–230.
9 J. Seth, M. Cloitre and R. Bonnecaze, J. Rheol., 2006, 50,353–376.
10 M. Siebenburger, M. Fuchs and M. Ballauff, Soft Matter,2012, 8, 4014–4024.
11 P. Lu, E. Zaccarelli, F. Ciulla, A. B. Schofield, F. Sciortinoand D. A. Weitz, Nature, 2008, 453, 499–503.
12 P. Lu and D. Weitz, Annu. Rev. Condens. Matter Phys., 2013,4, 217–233.
13 A. Mourchid, A. Delville, J. Lambard, E. Lecolier andP. Levitz, Langmuir, 1995, 11, 1942–1950.
14 F. Pignon, A. Magnin, J.-M. Piau, B. Cabane, P. Lindner andO. Diat, Phys. Rev. E: Stat. Phys., Plasmas, Fluids, Relat.Interdiscip. Top., 1997, 56, 3281–3289.
15 E. Paineau, I. Bihannic, C. Baravian, A.-M. Philippe,P. Davidson, P. Levitz, S. Funari, C. Rochas and L. Michot,Langmuir, 2011, 27, 5562–5573.
16 V. Trappe and D. A. Weitz, Phys. Rev. Lett., 2000, 85, 449–452.17 V. Trappe, V. Prasad, L. Cipelletti, P. N. Segre and D. A.
Weitz, Nature, 2001, 411, 772–775.18 K. Pham, S. Egelhaaf, P. Pusey and W. Poon, Phys. Rev. E:
Stat., Nonlinear, Soft Matter Phys., 2004, 69, 011503.19 E. Mock and C. Zukoski, J. Rheol., 2007, 51, 541–559.20 N. Reddy, Z. Zhang, M. Lettinga, J. Dhont and J. Vermant,
J. Rheol., 2012, 56, 1153–1174.21 L. Cipelletti, S. Manley, R. C. Ball and D. A. Weitz, Phys. Rev.
Lett., 2000, 84, 2275–2278.22 C. Derec, G. Ducouret, A. Ajdari and F. Lequeux, Phys. Rev. E:
Stat., Nonlinear, Soft Matter Phys., 2003, 67, 061403.23 G. Ovarlez and X. Chateau, Phys. Rev. E: Stat., Nonlinear, Soft
Matter Phys., 2008, 77, 061403.24 A. Negi and C. Osuji, Phys. Rev. E: Stat., Nonlinear, Soft
Matter Phys., 2009, 80, 010404.25 N. Koumakis and G. Petekidis, Soft Matter, 2011, 7,
2456–2470.26 G. Scherer, J. Non-Cryst. Solids, 1989, 108, 18–27.27 S. Manley, J. Skotheim, L. Mahadevan and D. Weitz, Phys.
Rev. Lett., 2005, 94, 218302.28 R. Buscall, T. H. Choudhury, M. A. Faers, J. W. Goodwin,
P. A. Luckham and S. J. Partridge, Soft Matter, 2009, 5,1345–1349.
29 G. Brambilla, S. Buzzaccaro, R. Piazza, L. Berthier andL. Cipelletti, Phys. Rev. Lett., 2011, 106, 118302.
30 L. J. Teece, M. A. Faers and P. Bartlett, Soft Matter, 2011, 7,1341–1351.
31 P. Barlett, L. Teece and M. Faers, Phys. Rev. E: Stat., Non-linear, Soft Matter Phys., 2012, 85, 021404.
32 R. Buscall and I. McGowan, Faraday Discuss. Chem. Soc.,1983, 76, 277–290.
33 T. Gibaud, C. Barentin and S. Manneville, Phys. Rev. Lett.,2008, 101, 258302.
34 T. Gibaud, C. Barentin, N. Taberlet and S. Manneville, SoftMatter, 2009, 5, 3026–3037.
35 J. J. V. DeGroot, C. W. Macosko, T. Kume and T. Hashimoto,J. Colloid Interface Sci., 1994, 166, 404–413.
36 R. Navarrete, L. Scriven and C. Macosko, J. Colloid InterfaceSci., 1996, 180, 200–211.
37 A. Montesi, A. Pena and M. Pasquali, Phys. Rev. Lett., 2004,92, 058303.
38 C. O. Osuji, C. Kim and D. A. Weitz, Phys. Rev. E: Stat.,Nonlinear, Soft Matter Phys., 2008, 77, 060402(R).
39 A. Negi and C. Osuji, Rheol. Acta, 2009, 48, 871–881.40 V. Grenard, N. Taberlet and S. Manneville, Soft Matter, 2011,
7, 3920–3928.41 J. Vermant and M. J. Solomon, J. Phys.: Condens. Matter,
2005, 17, R187–R216.42 V. Gopalakrishnan and C. Zukoski, J. Rheol., 2007, 51,
623–644.43 T. Gibaud, D. Frelat and S. Manneville, Soft Matter, 2010, 6,
3482–3488.44 J. Sprakel, S. Lindstrom, T. Kodger and D. Weitz, Phys. Rev.
Lett., 2011, 106, 248303.45 V. Grenard, T. Divoux, N. Taberlet and S. Manneville, Soft
Matter, 2014, 10, 1555–1571.46 A. Stickland, A. Kumar, T. Kusuma, P. Scales, A. Tindley,
S. Biggs and R. Buscall, Rheol. Acta, 2015, 54, 337–352.47 H. Chan and A. Mohraz, Phys. Rev. E: Stat., Nonlinear, Soft
Matter Phys., 2012, 85, 041403.48 C. Perge, N. Taberlet, T. Gibaud and S. Manneville, J. Rheol.,
2014, 58, 1331–1357.49 P. Varadan and M. Solomon, Langmuir, 2001, 17, 2918–2929.50 A. Mohraz and M. Solomon, J. Rheol., 2005, 49, 657–681.51 B. Rajaram and A. Mohraz, Soft Matter, 2010, 6, 2246–2259.52 T. Divoux, M.-A. Fardin, S. Manneville and S. Lerouge, Annu.
Rev. Fluid Mech., 2016, 48, 81–103.53 J. S. Raynaud, P. Moucheront, J. C. Baudez, F. Bertrand,
J. P. Guilbaud and P. Coussot, J. Rheol., 2002, 46, 709–732.54 J. Martin and Y. Hu, Soft Matter, 2012, 8, 6940–6949.55 G. Ovarlez, S. Rodts, X. Chateau and P. Coussot, Rheol. Acta,
2009, 48, 831–844.56 A. Fall, J. Paredes and D. Bonn, Phys. Rev. Lett., 2010,
105, 225502.57 L. Bilmes, Nature, 1942, 150, 432–433.58 G. McKinley, Rheol. Bull., 2015, 84, 14–17.59 R. Moorcroft and S. Fielding, Phys. Rev. Lett., 2013, 110, 086001.60 J. Colombo, A. Widmer-Cooper and E. Del Gado, Phys. Rev.
Lett., 2013, 110, 198301.61 J. Colombo and E. Del Gado, J. Rheol., 2014, 58, 1089–1116.62 S. Fielding, Rep. Prog. Phys., 2014, 77, 102601.63 S. Manneville, L. Becu and A. Colin, Eur. Phys. J.: Appl. Phys.,
2004, 28, 361–373.
Soft Matter Paper
Ope
n A
cces
s A
rtic
le. P
ublis
hed
on 1
4 Se
ptem
ber
2015
. Dow
nloa
ded
on 3
/19/
2022
7:0
2:49
PM
. T
his
artic
le is
lice
nsed
und
er a
Cre
ativ
e C
omm
ons
Attr
ibut
ion-
Non
Com
mer
cial
3.0
Unp
orte
d L
icen
ce.
View Article Online

This journal is©The Royal Society of Chemistry 2015 Soft Matter, 2015, 11, 9026--9037 | 9037
64 T. Gallot, C. Perge, V. Grenard, M.-A. Fardin, N. Taberlet andS. Manneville, Rev. Sci. Instrum., 2013, 84, 045107.
65 P. C. F. Møller, S. Rodts, M. A. J. Michels and D. Bonn,Phys. Rev. E: Stat., Nonlinear, Soft Matter Phys., 2008, 77,041507.
66 M. Kobayashi, F. Juillerat, P. Galletto, P. Bowen andM. Borkovec, Langmuir, 2005, 21, 5761–5769.
67 W. Heston, R. Iler and G. Sears, J. Chem. Phys., 1960, 64,147–150.
68 J. Trompette and M. Clifton, J. Colloid Interface Sci., 2004,276, 475–482.
69 X. J. Cao, H. Z. Cummins and J. F. Morris, Soft Matter, 2010,6, 5425–5433.
70 D. Truzzolillo, V. Roger, C. Dupas, S. Mora and L. Cipelletti,E-print cond-mat/1411.2265.
71 L. Allen and E. Matijevic, J. Colloid Interface Sci., 1969, 31,287–296.
72 L. Allen and E. Matijevic, J. Colloid Interface Sci., 1970, 33,420–429.
73 J. Depasse and A. Watillon, J. Colloid Interface Sci., 1970, 33,430–438.
74 J. Depasse, J. Colloid Interface Sci., 1997, 194, 260–262.75 E. Drabarek, J. Bartlett, H. Hanley, J. Woolfrey and
C. Muzny, Int. J. Thermophys., 2002, 23, 145–160.
76 P. Coussot, J. S. Raynaud, F. Bertrand, P. Moucheront,J. P. Guilbaud, H. T. Huynh, S. Jarny and D. Lesueur, Phys.Rev. Lett., 2002, 88, 218301.
77 A. Ragouilliaux, B. Herzhaft, F. Bertrand and P. Coussot,Rheol. Acta, 2006, 46, 261–271.
78 A. ten Brinke, L. Bailey, H. Lekkerkerker and G. Maitland,Soft Matter, 2007, 3, 1145–1162.
79 T. Divoux, V. Grenard and S. Manneville, Phys. Rev. Lett.,2013, 110, 018304.
80 V. Viasnoff and F. Lequeux, Phys. Rev. Lett., 2002, 89, 065701.81 F. Pignon, A. Magnin and J.-M. Piau, J. Rheol., 1996, 40,
573–587.82 P. Coussot, Q. D. Nguyen, H. T. Huynh and D. Bonn,
J. Rheol., 2002, 46, 573–589.83 P. Coussot, H. Tabuteau, X. Chateau, L. Tocquer and
G. Ovarlez, J. Rheol., 2006, 50, 975–994.84 G. Ovarlez and P. Coussot, Phys. Rev. E: Stat., Nonlinear, Soft
Matter Phys., 2007, 76, 011406.85 P. C. F. Møller, J. Mewis and D. Bonn, Soft Matter, 2006, 2,
274–283.86 J. Seth, C. Locatelli-Champagne, F. Monti, R. Bonnecaze and
M. Cloitre, Soft Matter, 2012, 8, 140–148.87 V. Mansard, L. Bocquet and A. Colin, Soft Matter, 2014, 10,
6984–6989.
Paper Soft Matter
Ope
n A
cces
s A
rtic
le. P
ublis
hed
on 1
4 Se
ptem
ber
2015
. Dow
nloa
ded
on 3
/19/
2022
7:0
2:49
PM
. T
his
artic
le is
lice
nsed
und
er a
Cre
ativ
e C
omm
ons
Attr
ibut
ion-
Non
Com
mer
cial
3.0
Unp
orte
d L
icen
ce.
View Article Online