av referendum briefing no. 1 may 2011 1 - wordpress.com€¦ · · 2013-06-10av referendum...
TRANSCRIPT

AV Referendum Briefing No. 1 | May 2011 1
Is ‘first-past-the-post’ working?An audit of the UK’s electoral system
IntroductionOnce regarded as a fringe concern, electoral reform has become a key issue in British party politics in recent decades. Associated initially with the rise of the Liberal-SDP Alliance in the 1980s, the case for change was later to find growing support within the Labour Party. In 1997, Labour was elected on a manifesto which included a commitment to hold a referendum
on changing the voting system, although the party leadership ultimately opted not to honour this promise. The debate about electoral reform was subsequently re-awakened by the MPs’ expenses crisis in 2009. At the 2010 General Election, six of the seven largest political parties in Great Britain promised to seek reform - albeit with no consistent position on which system should be adopted. Only the Conservatives advocated the retention of ‘first-past-the-post’ elections. Following the
2010 election – at one stage interrupted by the
first ever
DEMOCRATIC
AUDI T
Whatever the result, the referendum will not resolve the debate about electoral reform in the UKStuart Wilks-Heeg and Stephen Crone
AV Referendum Briefing No. 1 | May 2011 2
public demonstrations in favour of proportional representation (PR) – the Conservatives and the Liberal Democrats adopted a coalition agreement which included a commitment to hold a referendum on whether to replace ‘first-past-the-post’ (FPTP) with ‘the alternative vote’ (AV) system.
When British voters deliver their verdict on electoral reform on 5 May 2011, the choice being put before them will therefore represent the culmination of a long campaign for change. Yet, AV is not a system which reformers, including the Liberal Democrats, have previously called for. Indeed, since it is not a form of proportional representation, AV would represent a relatively minor change when compared with the other electoral systems which reformers have advocated. Meanwhile, public interest in the referendum appears to be modest, to say the least. Nonetheless, the UK’s second-ever national referendum asks the British electorate to make an historic choice – whether to keep or replace ‘first-past-the-post’.
In this briefing, we review the evidence relating to how well FPTP serves as an electoral system in the context of contemporary British politics. To conduct this ‘audit’ of the current system, we draw on recent academic research and recognised international measures for evaluating the operation of electoral systems. We also consider the extent to which identifiable public support for reform has emerged over the past four decades.
We begin by clarifying how FPTP is supposed to work in practice, before moving to consider the conditions under which it does, and does not, deliver the benefits which its supporters claim for it. Having identified a number of problems in the operation of the system under current conditions, we go on to
identify four key symptoms of the dysfunctionality of FPTP since the late 1970s. These include:
l Increasingly excessive majorities or ‘hung parliaments’;
l Increasingly disproportional results;
l The prevention of the multi-party system which voters wish to see;
l And highly uneven ‘voter power’.
We then discuss the extent to which public opinion has responded to the growing dysfunctionality of FPTP by expressing support for electoral reform. Based on the available long-run opinion poll data, we find that there is evidence that UK voters may support electoral reform ‘in theory’, but perhaps not ‘in practice’.
The briefing concludes by noting that, whatever the result of the referendum, the issue of electoral reform is unlikely to disappear from the agenda. Without reform after May 5, the deficiencies of FPTP will remain apparent. Yet, even if AV is adopted, many of the problems we identify with the current system are likely to remain evident at future general elections.
How first-past-the-post should workThere is a case to be made for FPTP. Specifically, the advantages claimed for FPTP by its advocates are that the system:
l Renders MPs and governments highly accountable to the electorate by presenting them with a straightforward choice: either retain the incumbent MP and/or government, or ‘kick the rascals out’.
l Produces governments which reflect either broad continuity in support for the governing party or clear shifts in the ‘mood’ of the electorate towards the opposition.
l Produces strong and stable single-party governments, with a direct mandate from the electorate to implement their manifesto.
l Prevents ‘undemocratic’ coalition politics whereby government policy is forged via bargaining between political parties after the election.
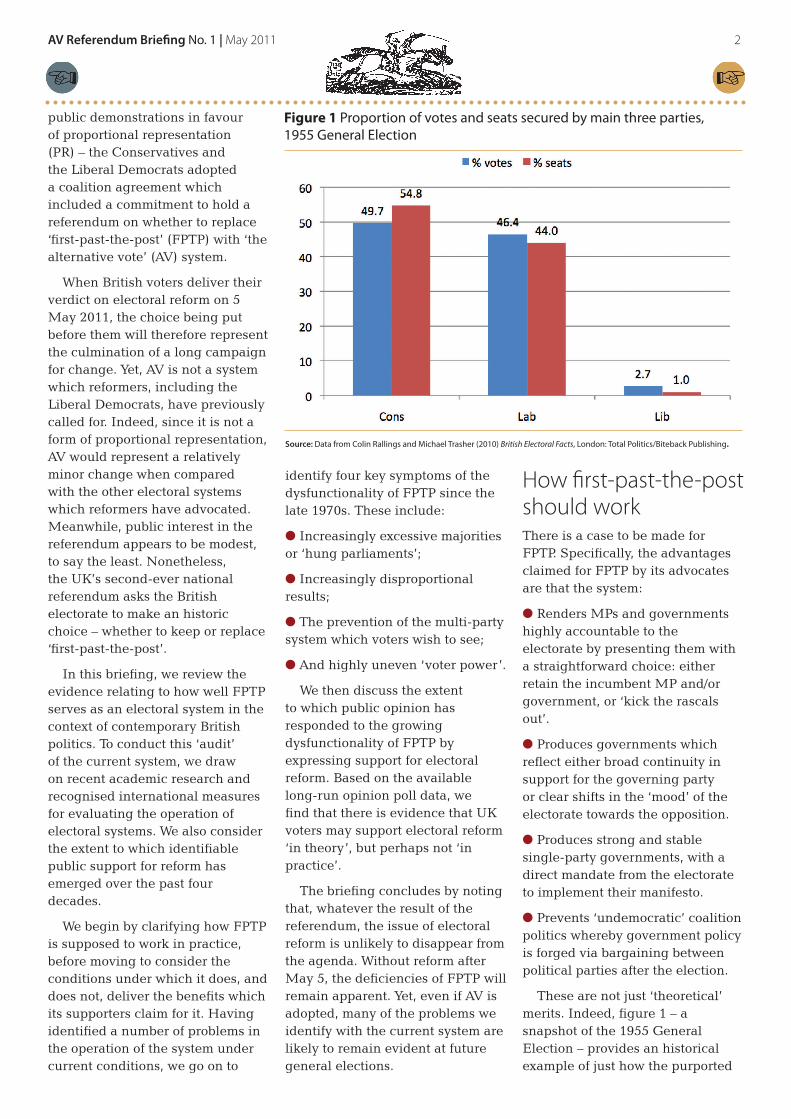
These are not just ‘theoretical’ merits. Indeed, figure 1 – a snapshot of the 1955 General Election – provides an historical example of just how the purported
Figure 1 Proportion of votes and seats secured by main three parties, 1955 General Election
Source: Data from Colin Rallings and Michael Trasher (2010) British Electoral Facts, London: Total Politics/Biteback Publishing.

AV Referendum Briefing No. 1 | May 2011 3
advantages of FPTP have been realised in the past. At this election, the Conservatives secured just under 49.7 per cent of the votes cast – a little over three percentage points ahead of Labour’s share. As the largest party, with the support of close to half of the electorate, the electoral system effectively granted the Conservatives a ‘winner’s bonus’, which enabled them to secure 54.8 per cent of the seats in the Commons. This winner’s bonus can be seen to have been at the expense of representation for the other two parties, but the overall effect is relatively modest; both Labour’s and the Liberal’s share of seats in the Commons in 1955 were broadly in line with the proportion of votes which they had secured. Thus, while FPTP is not designed to ensure proportional outcomes, the 1955 election underlines the fact that the system can produce results with a fairly high degree of proportionality.
Why first-past-the-post no longer worksHowever, while ‘first-past-the-post’ may have worked in 1955, detailed scrutiny of more recent trends raises serious questions about the system’s operation in the context of contemporary British politics. According to John Curtice,1 a number of essential conditions must be met in order for ‘first-past-the-post’ elections to operate in the manner outlined above:
l There must be clear two-party dominance, with both parties commanding roughly equal levels of popular support and very few votes or seats going to third or other parties.
l There must be a sufficient number of marginal seats to magnify the ‘swing’ from one of
1 John Curtice (2010) ‘So what went wrong with the electoral system? The 2010 results and the debate about electoral reform’, Parliamentary Affairs, 63 (4), pp.623-638. See also John Curtice (2010) ‘The last post’, Parliamentary Brief, May 2010.
the two main parties to the other – this creates a modest ‘winner’s bonus’, through which a vote share of around 45-50 per cent translates into a majority of seats in Parliament.
l Aside from the ‘winner’s bonus’, the relationship between votes and seats should not show any obvious form of bias towards either of the two main parties.
Evidence suggests that these conditions have long since disappeared. Figure 2, for instance, presents the results of the 1983 General Election for the three main parties – again in relation to both votes and seats. Unlike in 1955, it is the gross disparity between electoral support and Parliamentary representation for each party which is apparent from the 1983 result. On the basis of securing the support of only 42 per cent of the electorate, the Conservatives were able to win 61 per cent of the seats in the Commons. This arguably disproportionate winner’s bonus was gained almost entirely at the expense of the SDP-Liberal Alliance, whose 25 per cent share of the votes translated into a mere 3.5 per cent of the seats. Meanwhile, Labour’s representation, although broadly in line with their level of
electoral support, demonstrated the existence of what is effectively a ‘loser’s bonus’ – again gained at the expense of the Alliance.
The 1983 election represented a moment of significant third party breakthrough, but it was by no means an exception or an aberration. As Curtice and others have demonstrated, compelling evidence has built up over a number of years which casts doubt on whether the essential conditions required for FPTP to function properly still hold for UK Parliamentary elections – or indeed if they ever did for sustained periods of time.2 Four key trends are highlighted by these accounts which suggest that FPTP is increasingly unlikely to operate as it once did:
①Electoral support for the two main parties has diminished
sharply since the mid-1970s. A growing proportion of voters now opt for parties other than the Conservatives and Labour. As figure 3, overleaf, shows, the Conservatives and Labour won more than 40 per cent of the vote each at successive general 2 See Curtice (2010) ‘What went wrong with the electoral system’, and also Guy Lodge and Glenn Gottfried (2011) Worst of both worlds: why first-past-the-post no longer works, London: Institute for Public Policy Research.
Figure 2 Proportion of votes and seats secured by main three parties, 1983 General Election
Source: Data from Colin Rallings and Michael Trasher (2010) British Electoral Facts, London: Total Politics/Biteback Publishing.

AV Referendum Briefing No. 1 | May 2011 4
elections from 1950 to 1970, with the winning party usually securing 45 per cent or more of the popular vote. Over this period, the average share of the vote obtained by the Liberals and others was a mere eight per cent. However, the pattern since the February 1974
election, which witnessed the resurgence of the Liberal Party and a sharp growth in support for the Scottish and Welsh nationalists, has been entirely different. At no election since 1974 have the two main parties won a combined 80 per cent or more of the vote, with
the two-party share falling to just 65 per cent in 2010. For ten general elections in a row, FPTP has failed to prevent a significant proportion of votes being cast for third or other parties. This tendency has been even more obvious since the formation of the SDP-Liberal Alliance in 1983 and the eventual merger of the two parties to form the Liberal Democrats in 1988. Since 1983, the proportion of votes cast for candidates other than those representing the main two parties has averaged 29 per cent.
②Third and smaller parties have gained seats at the
expenses of the main two parties. During the 1950s and 1960s, only about 10 MPs were typically returned from outside of the two main parties. However, as a result of the growing electoral support for them, the number of MPs elected to represent parties other than Labour or the Conservatives has grown slowly but steadily. Despite the strong bias of FPTP against third and smaller parties, figure 4 shows that the number of MPs representing parties other than the main two (or sitting as Independents) has risen sharply since 1974, reaching a peak of 94 MPs in the 2005-10 Parliament. Whereas third and smaller parties once held a mere one per cent of seats in Parliament, their share has now risen to around 13 per cent.
③The number of Conservative-Labour marginals has
diminished significantly. Over time, support for the Conservatives and Labour has become more geographically concentrated, while the Liberal Democrat vote has also become slightly less evenly spread. The partial exception of the Blair years notwithstanding, the tendency for voters in Scotland and the North of England to become more solidly Labour over time is mirrored by the pattern of the Conservatives becoming
Figure 3 Party shares of the vote in UK General Elections, 1945-2010
Source: Data from Colin Rallings and Michael Trasher (2010) British Electoral Facts, London: Total Politics/Biteback Publishing.
Figure 4: Number of MPs from outside the main two parties, 1945-2010
Source: Data from Colin Rallings and Michael Trasher (2010) British Electoral Facts, London: Total Politics/Biteback Publishing.

AV Referendum Briefing No. 1 | May 2011 5
ever more dominant in the South of England. As a result of these patterns, there are now fewer seats which have any realistic prospect of changing hands between the two main parties. Whereas around 160 seats could be deemed Labour-Conservative marginals at elections from 1955-1966, this figure had been cut in half by the time of the 1983 General Election; and while Labour’s electoral recovery from 1987 onwards served to increase the number of marginal seats to around 100 from 1992-2005, by 2010 just 86 seats were defined as marginal between the two main parties.3
④ The relationship between votes and seats has been
subject to a greater degree of ‘bias’. Three main components of bias in the electoral system have become evident since 1997: Labour seats tend to contain fewer registered electors than Conservative seats; Conservative majorities tend to be numerically larger than Labour majorities; and there is a growing differential in turnout between Labour-won and Conservative-won seats.4 Boundary reviews had eradicated most, but not all, of the bias associated with variance in the size of constituency electorates by 2010, but the tendency for concentration of party support and turnout differentials to produce numerically larger Conservative majorities is still in evidence. In 2010, turnout was seven percentage points higher in seats won by the Conservatives than it was in seats won by Labour, and the average Conservative majority was 9,470 votes compared to 7,911 for Labour MPs.
In short, the operation of FPTP in UK general elections has long since departed from the essential 3 Curtice (2010) So what went wrong with the electoral system?
4 Galina Borisyuk, Colin Rallings, Michael Thrasher and Ron Johnston (2010) ‘Parliamentary Constituency Boundary Reviews and Electoral Bias: How Important Are Variations in Constituency Size?’, Parliamentary Affairs, 63 (1), pp.4-21.
conditions required for it to produce the advantages which its supporters claim for it. As demonstrated in the next section, the long-run changes in voting patterns and the operation of the electoral system highlighted above inevitably mean that FPTP has become increasingly ‘dysfunctional’ when measured against its own supposed merits.
Symptoms of dysfunctional first-past-the-post Broadly speaking, FPTP operated as it should for the seven general elections which were contested from 1950-70. As table 1 shows, during this ‘Golden Age’ of first-past-the-post, support for the two main parties was finely balanced, the two-party share of the vote averaged 92 per cent, and elections were won or lost across 150 or more marginal seats. If we compare this ‘Golden Age’ with the period of seven elections from 1979-2005, we acquire a clear sense of how the operation of the system has changed. In this ‘Dysfunctional Period’, the two-party share of the vote averaged only 73 per cent and the average number of marginals shrank by a third compared to 1950-70. Distinguishing between these two periods in this way, we may
also regard the two elections of 1974 – neither of which produced a clear majority for either party – as a ‘transitional year’ in which the two-party system began to break down. As is discussed in more detail below, it is possible that the ‘hung parliament’ produced by the 2010 General Election will also come to represent a transitional year, although it is by no means clear how the UK electoral and party systems will be transformed in the years ahead.
Having identified these distinct periods during which FPTP operated under very different conditions, it is instructive to compare the outcomes of UK general elections in the system’s ‘Golden Age’ of 1950-70 against those in the more recent ‘dysfunctional period’ from 1979-2005. Using a number of measures deployed by political scientists to monitor and compare the performance of electoral systems, four key symptoms of the dysfunctionality of FPTP are revealed.
①Recent elections have tended to produce excessively large
majorities. In the immediate post-war decades, whichever party came closest to securing 50 per cent of the votes generally secured enough seats to govern with a workable majority. During this ‘Golden Age’, government
Table 1 The operation of first-past-the-post, 1950-2010
The Golden Age, 1950-70
Transitional Year, 1974
The Dysfunctional Period, 1979-2005
Transitional Year, 2010?
Number of elections 7 2 7 1
Average Conservative vote share
46% 37% 38% 36%
Average Labour vote share
46% 38% 36% 29%
Two-party share of the vote
92% 75% 73% 65%
Average number of marginal seats
159* 109 101 85
Note: *1955-70 (5 elections)
Sources: Data derived from Colin Rallings and Michael Trasher (2010) British Electoral Facts, London: Total Politics/Biteback Publishing; John Curtice (2010) ‘So what went wrong with the electoral system? The 2010 results and the debate about electoral reform’, Parliamentary Affairs, 63 (4), pp.623-638.

AV Referendum Briefing No. 1 | May 2011 6
majorities varied between six seats (1950) and 99 seats (1959). This pattern clearly changed from the late 1970s onwards. As table 2 shows, the average share of the vote secured by the winning party from 1979-2005 was 41 per cent, a full six percentage points lower than it had been from 1950-70. Yet, the average size of government majorities from 1979-2005 (103 seats) was more than double that in 1950-70 (45 seats). Indeed, on four occasions since 1979 the winning party has secured majorities of 100, despite securing no more than 43 per cent of the vote – a scenario which would have been unthinkable in the 1950s. In short, recent decades have been characterised by a tendency for FPTP to greatly exaggerate the winner’s bonus.
②The electoral system has blocked the emergence of a
multi-party system at Westminster. While third parties have managed to increase their vote and seat share since the 1970s, FPTP nevertheless serves to stifle genuine voter choice by ensuring that the main two parties continue to secure the lion’s share of the seats in Parliament. The growing contrast between voting behaviour and the allocation of seats in the Commons is illustrated by figure 5. This graph charts two measures of the ‘Effective Number of Parties’ (ENP) at UK general elections since 1945, measured firstly by votes and secondly by seats.5 The graph shows that the two measures converged in the 1950s, indicating a close fit between the electoral system and the party system in this period. Voters opted overwhelmingly for either of the two main parties, and the two-party system at Westminster reflected these choices. However, the two measures of the ENP began to 5 The Effective Number of Parties is calculated using the Laakso/Taagepera index and takes into account both the number of parties and their relative size. See note under figure 5 for details of the formula used.
steadily widen from the early 1960s onwards. Thus, by 2010, the electorate’s desire for a multi-party system had become undeniable, yet the allocation of seats maintained the semblance of a two-party system. Table 2 summarises these trends using a further measure – the relative reduction in parties, in which the difference between ENP (votes) and ENP (seats) is calculated as a percentage of ENP (votes). This measure shows that while the squeeze on the representation of third and smaller parties was only 8 per cent from 1950-70, the effect quadrupled to 32 per cent during the period from 1979-2005.
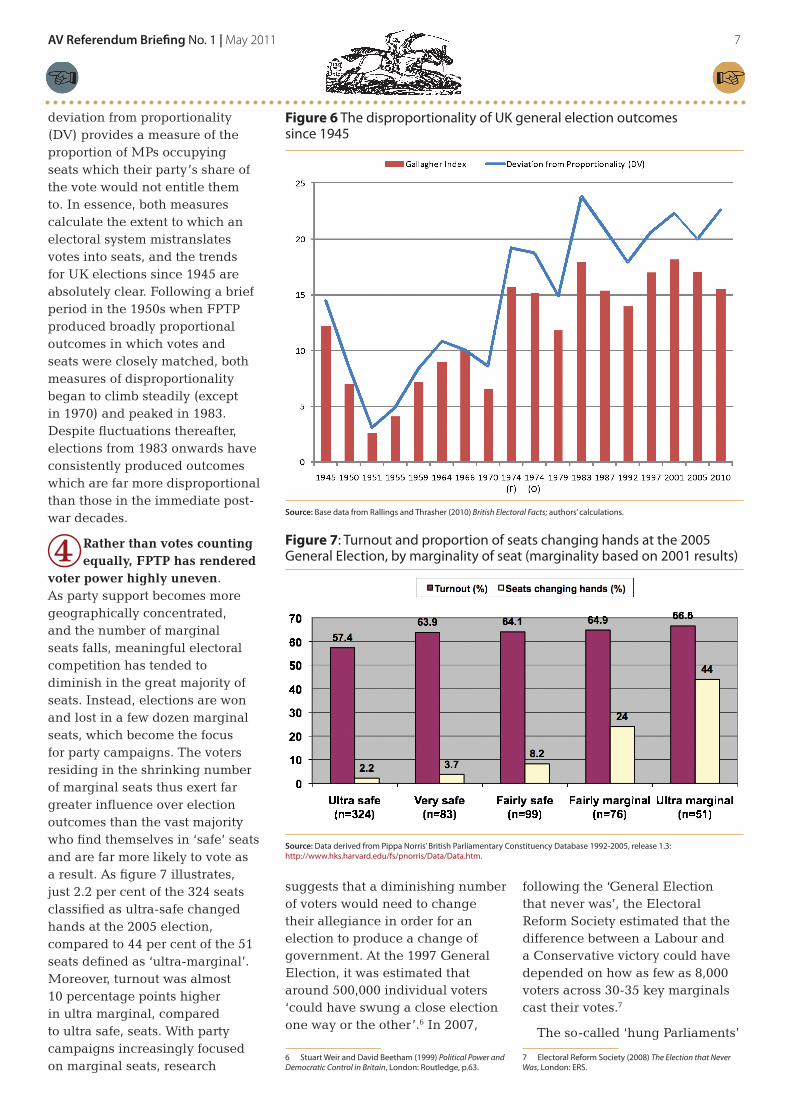
③ The results of UK general elections have become
highly disproportional. Because of the way FPTP increasingly ‘mistranslates’ votes into seats, recent elections to the Commons have produced results which are more disproportional than those in the 1950s or 1960s. Figure 6, overleaf, charts the change in two alternative measures of the disproportionality of UK general election outcomes since 1945. The first measure, based on the method devised by Michael Gallagher, uses the ‘least squares index’ to calculate the disparity between vote shares and seat shares. The second measure,
Table 2 The outcomes of first-past-the-post, 1950-2010
The Golden Age, 1950-70
Transitional Year, 1974
The Dysfunctional Period, 1979-2005
Transitional Year, 2010?
Average government majority
45 --- 103 ---
Average vote share secured by winning party
47.4% --- 41.4% ---
Average Relative Reduction in Parties (RRP)
8% 28% 32% 30%
Average Deviation from Proportionality (DV) score
12 19 20 23
Figure 5 The Effective Number of Parties, as measured by votes and by seats, 1945-2010
Note: ENP (votes) is calculated as follows: one divided by the sum of the squared percentage of votes cast for each party in a General Election. ENP (seats) is calculated as: one divided by the sum of the squared percentage seats for each party represented in Parliament.
Source: Base data from Rallings and Thrasher (2010) British Electoral Facts; authors’ calculations.
AV Referendum Briefing No. 1 | May 2011 7
deviation from proportionality (DV) provides a measure of the proportion of MPs occupying seats which their party’s share of the vote would not entitle them to. In essence, both measures calculate the extent to which an electoral system mistranslates votes into seats, and the trends for UK elections since 1945 are absolutely clear. Following a brief period in the 1950s when FPTP produced broadly proportional outcomes in which votes and seats were closely matched, both measures of disproportionality began to climb steadily (except in 1970) and peaked in 1983. Despite fluctuations thereafter, elections from 1983 onwards have consistently produced outcomes which are far more disproportional than those in the immediate post-war decades.
④Rather than votes counting equally, FPTP has rendered
voter power highly uneven. As party support becomes more geographically concentrated, and the number of marginal seats falls, meaningful electoral competition has tended to diminish in the great majority of seats. Instead, elections are won and lost in a few dozen marginal seats, which become the focus for party campaigns. The voters residing in the shrinking number of marginal seats thus exert far greater influence over election outcomes than the vast majority who find themselves in ‘safe’ seats and are far more likely to vote as a result. As figure 7 illustrates, just 2.2 per cent of the 324 seats classified as ultra-safe changed hands at the 2005 election, compared to 44 per cent of the 51 seats defined as ‘ultra-marginal’. Moreover, turnout was almost 10 percentage points higher in ultra marginal, compared to ultra safe, seats. With party campaigns increasingly focused on marginal seats, research
Figure 6 The disproportionality of UK general election outcomes since 1945
Source: Base data from Rallings and Thrasher (2010) British Electoral Facts; authors’ calculations.
suggests that a diminishing number of voters would need to change their allegiance in order for an election to produce a change of government. At the 1997 General Election, it was estimated that around 500,000 individual voters ‘could have swung a close election one way or the other’.6 In 2007,
6 Stuart Weir and David Beetham (1999) Political Power and Democratic Control in Britain, London: Routledge, p.63.
following the ‘General Election that never was’, the Electoral Reform Society estimated that the difference between a Labour and a Conservative victory could have depended on how as few as 8,000 voters across 30-35 key marginals cast their votes.7
The so-called ‘hung Parliaments’
7 Electoral Reform Society (2008) The Election that Never Was, London: ERS.
Figure 7: Turnout and proportion of seats changing hands at the 2005 General Election, by marginality of seat (marginality based on 2001 results)
Source: Data derived from Pippa Norris’ British Parliamentary Constituency Database 1992-2005, release 1.3: http://www.hks.harvard.edu/fs/pnorris/Data/Data.htm.

AV Referendum Briefing No. 1 | May 2011 8
Figure 8 Responses to opinion poll questions which invoke the general principle of PR, without referring to it explicitly
Source: Various opinion polls (Marplan, JRRT, Ipsos Mori), 1982-2010, collated by Democratic Audit.
of February 1974 and May 2010, as well as the narrow majorities obtained by Labour in October 1974 and the Conservatives in 1992, might also be regarded as a symptom of dysfunctional FPTP. It has been widely suggested that falling levels of electoral support for the two main parties points to ‘hung Parliaments’ being more likely in future, even under FPTP.8 Yet, as we have noted, the very opposite tendency has also been evident in recent decades – FPTP elections returned single-party governments with majorities of 60 or more at five out of ten elections from 1974-2010. Ironically, then, the breakdown of the core pre-conditions for the effective functioning of FPTP – notably a fall in the number of marginal seats and the emergence of forms of bias in the system – appears to make both the absence of majorities and the existence of excessive majorities more likely.
It may be helpful to regard both 1974 and 2010 as ‘transition’ years in the operation of the electoral system. The lack of a clear outcome from either of the 1974 elections reflected a sudden shift to three-party politics and preceded a period in which very large majorities became the norm. The results of the 2010 General Election also suggest that it may come to play a similar ‘transitional’ function, although the direction the system may move in is by no means clear. One possibility, with or without a reformed electoral system, is that we will enter a period in which there is a series of hung parliaments, similar to the pattern of election results in the inter-war years. Another scenario, moderately more likely under FPTP than AV, is that the experience of coalition will cause a squeeze in the Liberal Democrat vote and will see the UK return, almost certainly briefly, to a pattern of two-party dominance, 8 See Andrew Blick and Stuart Wilks-Heeg (2010) ‘Governing without majorities: Coming to terms with balanced Parliaments in UK politics’, Democratic Audit, General Election Briefing, No.1, April 2010.
similar to that apparent after 1945. Yet another possibility, which might occur under AV or FPTP, is that the decline of the two-party vote accelerates, but with the two main parties continuing to dominate Parliament.
How has public opinion responded to the dysfunctionality of FPTP?While there is widespread agreement among political scientists that FPTP elections in the UK are no longer operating as they should,9 it is by no means clear that the electorate shares this view, as there are few reliable indicators of levels of popular satisfaction with the electoral system. For example, while falling turnouts at UK general elections could be regarded as a sign of popular dissatisfaction with the electoral system, they are more likely to arise from falling levels of identification with political parties and growing public discontent with politics more generally.
Perhaps the most obvious means of assessing public attitudes 9 See Simon Hix, Ron Johnston and Ian McLean (2010) Choosing an Electoral System, London: British Academy Policy Centre, pp.115-7.
towards the electoral system is via opinion polls. We have been able to identify a total of 49 opinion polls which put questions on electoral reform to a representative sample of the British public between August 1974 and 2010. By grouping these polls according to question phrasing, it is possible to identify some indicative trends in public opinion during the ‘dysfunctional’ period of FPTP elections which we have identified.
The first set of questions which have appeared regularly in opinion polls relate to the general principle of proportionality, but without specifically citing PR, and typically ask respondents to indicate whether they agree or disagree with a statement along this lines of ‘this country should adopt a new voting system that would give parties seats in Parliament in proportion to their share of votes’. Figure 8 shows the results from eight such polls from 1982 to 2010 and indicates a consistent majority in favour of such a principle – with 60 per cent typically supporting the statement compared to around 20 per cent against and another 20 per cent responding with ‘don’t know’.
However, polls which make specific reference to proportional
AV Referendum Briefing No. 1 | May 2011 9
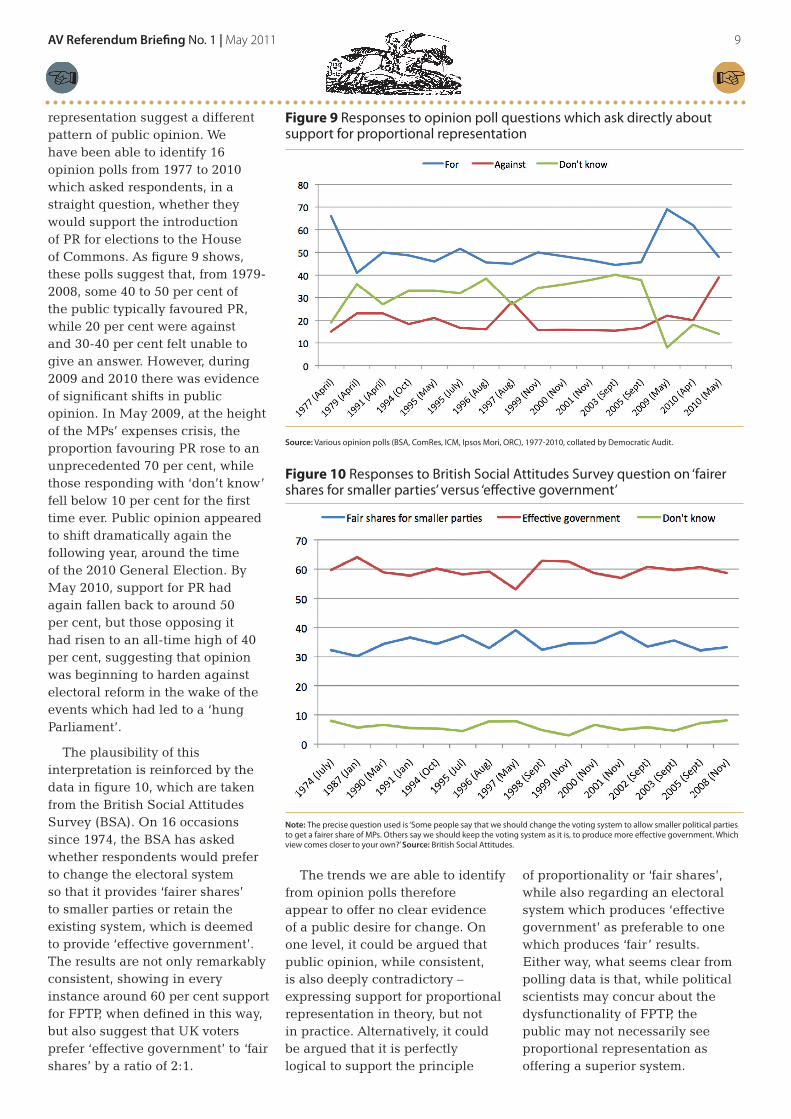
Figure 9 Responses to opinion poll questions which ask directly about support for proportional representation
Source: Various opinion polls (BSA, ComRes, ICM, Ipsos Mori, ORC), 1977-2010, collated by Democratic Audit.
representation suggest a different pattern of public opinion. We have been able to identify 16 opinion polls from 1977 to 2010 which asked respondents, in a straight question, whether they would support the introduction of PR for elections to the House of Commons. As figure 9 shows, these polls suggest that, from 1979-2008, some 40 to 50 per cent of the public typically favoured PR, while 20 per cent were against and 30-40 per cent felt unable to give an answer. However, during 2009 and 2010 there was evidence of significant shifts in public opinion. In May 2009, at the height of the MPs’ expenses crisis, the proportion favouring PR rose to an unprecedented 70 per cent, while those responding with ‘don’t know’ fell below 10 per cent for the first time ever. Public opinion appeared to shift dramatically again the following year, around the time of the 2010 General Election. By May 2010, support for PR had again fallen back to around 50 per cent, but those opposing it had risen to an all-time high of 40 per cent, suggesting that opinion was beginning to harden against electoral reform in the wake of the events which had led to a ‘hung Parliament’.
The plausibility of this interpretation is reinforced by the data in figure 10, which are taken from the British Social Attitudes Survey (BSA). On 16 occasions since 1974, the BSA has asked whether respondents would prefer to change the electoral system so that it provides ‘fairer shares’ to smaller parties or retain the existing system, which is deemed to provide ‘effective government’. The results are not only remarkably consistent, showing in every instance around 60 per cent support for FPTP, when defined in this way, but also suggest that UK voters prefer ‘effective government’ to ‘fair shares’ by a ratio of 2:1.
The trends we are able to identify from opinion polls therefore appear to offer no clear evidence of a public desire for change. On one level, it could be argued that public opinion, while consistent, is also deeply contradictory – expressing support for proportional representation in theory, but not in practice. Alternatively, it could be argued that it is perfectly logical to support the principle
of proportionality or ‘fair shares’, while also regarding an electoral system which produces ‘effective government’ as preferable to one which produces ‘fair’ results. Either way, what seems clear from polling data is that, while political scientists may concur about the dysfunctionality of FPTP, the public may not necessarily see proportional representation as offering a superior system.
Figure 10 Responses to British Social Attitudes Survey question on ‘fairer shares for smaller parties’ versus ‘effective government’
Note: The precise question used is ‘Some people say that we should change the voting system to allow smaller political parties to get a fairer share of MPs. Others say we should keep the voting system as it is, to produce more effective government. Which view comes closer to your own?’ Source: British Social Attitudes.

AV Referendum Briefing No. 1 | May 2011 10
ConclusionIn this briefing, we have highlighted something of a paradox. There is clear evidence that the UK’s existing electoral system has become dysfunctional, yet there appears to be little evidence of long-run popular support for replacing it. To what extent does this paradox matter, particularly for the outcome of the referendum on the possible adoption of AV? In particular, what does the somewhat contradictory evidence suggest about whether FPTP or AV would be the best system for the UK? And, to what extent will the referendum settle the debate about reform?
In answering these questions, we must begin by noting that the options offered in the May 2011 referendum stem neither from academic analysis of the operation of FPTP nor from detailed consideration of trends in public opinion about electoral reform. Instead, the choice between FPTP and AV reflects the fact that the latter system has acquired the status of the reform option on which compromise between the Liberal Democrats and either of the two largest political parties is most realistic. Under AV, it is likely that neither of the major parties will lose significant numbers of seats, while the Liberal Democrats can expect to make modest gains. As such, AV offers the prospects of a fairly minor readjustment in the distribution of seats between the three largest parties, while retaining the possibility of elections producing single party majorities in the House of Commons for either Labour or the Conservatives. As such, the choice between FPTP and AV is one which has been defined by the interests of the political parties, rather than on the basis of research or via public consultation about which systems might be best-suited to the UK context.
Yet, even if the referendum is best regarded as a ‘political fix’, it still leaves voters with a decision to make. In the context of our analysis of FPTP, we feel that AV would constitute an improvement over the existing system for two central reasons. First, it is almost certain that there would be fewer ‘safe’ seats under AV. As such, the system would modestly reduce the inequalities in voter power that we have highlighted. Second, adopting AV would give at least some recognition to fundamental changes we identify in voter preferences in recent decades, by ensuring that voters opting to support either the Liberal Democrats or smaller parties would be less likely to find their votes ‘wasted’. Moreover, there is a case for arguing that the patterns found in long-run opinion poll evidence point towards a system such as AV. If the public would generally prefer a voting system which is fairer to smaller parties, but are reluctant to forgo the prospect of the system returning ‘effective’, that is presumably, single-party, governments, then AV makes intuitive sense as a reform option.
However, it is also important to recognize that AV would almost certainly do little to reverse the trend towards UK election results becoming more disproportional. Neither will AV alter the tendency for the electoral system to suppress the emergence of multi-party representation in the House of Commons. Indeed, if large numbers of voters were to respond to AV by opting for smaller parties as their first preference, the mismatch between votes and seats could become even more pronounced in future.
Finally, what will happen to the debate after May 5? Many have argued that if AV is rejected, the issue of electoral reform will effectively be kicked into the
long grass for a generation or more. Based on the evidence we present in this briefing, we would argue that there is no such prospect. If FPTP showed signs of malfunctioning in 2005 and 2010, there are few grounds for believing that it will not continue to malfunction in 2015 or beyond. At the same time, however, adopting AV appears highly unlikely to provide a solution to the problems which have become apparent with the UK’s electoral system. In short, whatever the outcome, the 2011 referendum is highly unlikely to bring the UK’s long-running debate about electoral reform to an end.■

AV Referendum Briefing No. 1 | May 2011 11
Democratic Audit is a not-for-profit company, grant funded by the Joseph Rowntree Charitable Trust. Registered in England and Wales; company no. 6145962.
About Democratic Audit
Democratic auDit is an independent research organisation that carries out research into the quality of democracy in the UK. The Audit’s methodology for auditing and assessing democracy has won international acclaim. It is widely copied across the world, having been employed in at least 21 nations by governments, international bodies such as the UNDP and the Open Society Institute, universities and research institutes. Democratic Audit has published three major successive democratic audits of the UK, using the methodology, and many path-breaking reports on specific aspects of the UK’s political life from a clearly defined democratic perspective.
About the authors
Dr. Stuart WilkS-Heeg is Executive Director of Democratic Audit and Senior Lecturer in Social Policy at the University of Liverpool. He is the author of Purity of Elections in the UK: Causes for Concern (York: Joseph Rowntree Reform Trust, 2008) and co-author of Whose Town is it Anyway? The State of Local Democracy in Two Northern Towns (York: Joseph Rowntree Charitable Trust, 2006).
StepHen crone is a Research Associate with Democratic Audit. He graduated from the University of Liverpool in 2009 with a First Class degree in Politics and History. Stephen is the co-author, with Stuart Wilks-Heeg, of a recent Democratic Audit report called Funding Political Parties in Great Britain: A Pathway to Reform.
Any queries about this briefing may be directed to Stuart Wilks-Heeg: [email protected]
DEMOCRATIC
AUDI T
Democratic AuditEleanor Rathbone Building Bedford Street South Liverpool, L69 7ZA0151 794 3012www.democraticaudit.com
Designed by Tony Garrett