autos malaysia
DESCRIPTION
Autos MalaysiaTRANSCRIPT

June 26, 2012
IMPORTANT DISCLOSURES. INCLUDING ANY REQUIRED RESEARCH CERTIFICATIONS, ARE PROVIDED AT THE END OF THIS REPORT. Designed by Eight, Powered by EFA
AUTOS More vrooom to grow

AUTOS June 26, 2012
2
TABLE OF CONTENTS
1. BACKGROUND .................................................................................................................................. 6
2. OVERVIEW OF MALAYSIAN AUTOS ............................................................................................... 6
3. MALAYSIA’S AUTO SECTOR VIS-À-VIS THAILAND AND INDONESIA ....................................... 9
4. OPPORTUNITIES FOR THE MALAYSIAN AUTO PLAYERS ......................................................... 17
5. CHALLENGES AHEAD FOR THE MALAYSIAN AUTO PLAYERS ................................................ 23
6. VALUATION AND RECOMMENDATION ...................................................................................... 30

June 26, 2012
3
REGIONAL
MALAYSIA
SINGAPORE
INDONESIA
THAILAND
PHILIPPINES
CHINA, HONG KONG
AUTOS SHORT TERM (3 MTH) LONG TERM
Conviction
More vrooom to grow Despite Malaysia’s high vehicle penetration relative to Indonesia and Thailand, vehicle demand should continue to see support from the country’s favourable demographics, rising disposable incomes, new model launches and pent-up demand this year, among others.
Figure 1: Malaysia’s vehicle sales
0
100000
200000
300000
400000
500000
600000
700000
2000
2001
2002
2003
2004
2005
2006
2007
2008
2009
2010
2011
2012
F
units
SOURCES: CIMB, MAA
Further out, there are pockets of export opportunities under AFTA and the upcoming ASEAN Economic Community (AEC) 2015, which local auto players can capitalise on. We maintain our Overweight call on the sector with DRB-HICOM as our preferred pick.
Demand fundamentals are intact Malaysia has a sizeable car-buying population that presents huge opportunities. An estimated 46% of the population fall into the 20-49 age bracket. This age bracket tends to be the key driver of vehicle demand. Also, the government is seeking to transform the country into a high-income nation by 2020, which would require the annual income to rise to the equivalent of US$15,000 p.a. from US$9,700 currently. As income levels rise, so will the propensity to spend on big-ticket items like cars.
One of the lowest cost of vehicle ownership Interestingly, while Malaysia’s car prices are among the top three highest in the region, the cost of vehicle ownership is relatively low, largely due to the country’s subsidised fuel. As long as affordability levels stay low, we believe that domestic demand for cars should remain firm.
Pockets of export opportunities are present Although Malaysia lags behind Thailand and Indonesia in terms of total vehicle exports, there are pockets of export opportunities which auto players can capitalise on. We like auto players such as DRB-HICOM, which is well-poised to ride Volkswagen AG’s pursuit of the ASEAN auto market. Tan Chong also has a foothold in the Indochina auto market.
Notes from the Field
Loke Wei Wern
T (60) 3 20849946 E [email protected]
“When the market opens, there will definitely be more players that want to come in. One of the positive things about our country is the disposable income, especially with the middle class, compared with neighbouring countries”.
─ Datuk Aminar Rashid
Salleh, Managing Director
of Perodua
Highlighted Companies
DRB-HICOM With the recent acquisition of Proton, DRB’s brands now straddle the premium and mid-market segments. As Volkswagen AG’s (VW) local partner, DRB will play an integral part in VW’s expansion plans in the ASEAN region.
UMW Holdings UMW controls close to 50% of Malaysia’s total vehicle sales via Toyota and Perodua, both of which are market leaders in the non-national and national segments, respectively. UMW boasts the highest dividend yield in the sector.
Tan Chong Motor Tan Chong’s strategic expansion of its product mix is intact. By year-end, it will have a presence in the B-segment through Nissan Almera. Its presence in the small but growing Indochina market will provide additional growth opportunities.

AUTOS June 26, 2012
4
KEY CHARTS
Malaysia’s position in ASEAN Malaysia ranks third in terms of total vehicle sales in the region after Indonesia and Thailand. It is the second-largest passenger car market in ASEAN and the fourth-largest in terms of commercial vehicles.
-100,000200,000
300,000400,000500,000600,000700,000
800,000900,000
1,000,000
Brun
ei
Indo
nesi
a
Mal
aysi
a
Philip
pine
Sing
apor
e
Thai
land
Viet
nam
High vehicle penetration rate The vehicle penetration rate for Malaysia, as measured by the number of vehicles owned per capita, is relatively high. The vehicle penetration rate is estimated to be around 40%, i.e. 4 out of 10 Malaysians own some form of vehicle.
-
100,000
200,000
300,000
400,000
500,000
600,000
700,000
1995
1996
1997
1998
1999
2000
2001
2002
2003
2004
2005
2006
2007
2008
2009
2010
2011
0%
5%
10%
15%
20%
25%
30%
35%
40%
45%
Annual domestic vehicle sales (LHS) Motorcar/capita (RHS)
Sizeable car-buying population Malaysia has a sizeable car-buying population that auto players can tap. An estimated 46% of the current population falls into the 20-49 age bracket. This age bracket tends to be the key driver of vehicle demand.
43% 43% 43% 42% 42% 42% 41% 37% 37% 37% 37%
43% 43% 43% 43% 43% 43% 43% 46% 46% 46% 46%
13% 14% 14% 14% 15% 15% 15% 16% 16% 16% 16%
0%
20%
40%
60%
80%
100%
120%
2002 2003 2004 2005 2006 2007 2008 2009 2010F 2011F 2012F
0 to 19 years ('m) 20 to 49 years ('m) 50 and above ('m)
Private vehicles will stay as the dominant choice of transport, for now The utilisation of public transport (measured as a percentage of journeys during peak periods) in Malaysia is relatively low. As such, we applaud the government’s efforts to improve the country’s public transportation network in order to increase usage. But we note that these efforts will take time to bear fruit. Also, much of the improvements in the public transport network are focused on the Greater KL/Klang Valley area, which means that other populous states, like Johor and Perak, still offer good potential for auto players. - 10 20 30 40 50 60 70 80 90 100
Klang Valley
Penang
Johor Bahru
Singapore
Hong Kong
London
Toronto
SOURCE: CIMB, 10MP, PRESS REPORT

AUTOS June 26, 2012
5
Figure 2: Sector Comparisons Price Target Price
(local curr) (local curr) CY2012 CY2013 CY2012 CY2013 CY2012 CY2013 CY2014 CY2012 CY2013 CY2012 CY2013Brilliance China Automotive 1114 HK Outperform 7.07 11.70 4,579 9.7 7.0 38.2% 2.90 2.05 35.3% 34.3% 28.6% 70.0 54.9 0.0% 0.0%Dongfeng Motor Group 489 HK Neutral 12.26 15.80 13,612 8.3 7.6 6.4% 1.61 1.36 21.3% 19.4% 17.6% 3.2 2.3 1.8% 1.9%Guangzhou Auto - H 2238 HK Trading Buy 6.53 7.50 6,883 7.8 6.7 9.4% 1.02 0.92 13.7% 14.5% 14.6% 10.2 7.6 3.8% 4.5%Geely Automobile Holdings 175 HK Neutral 2.70 3.30 2,601 8.9 7.0 19.2% 1.49 1.25 18.2% 19.5% 17.8% 6.6 5.0 1.3% 1.7%Great Wall Motor 2333 HK Outperform 15.00 19.30 7,170 8.6 7.4 18.0% 1.85 1.56 23.6% 22.7% 21.0% 4.3 3.6 3.1% 3.6%Minth Group 425 HK Neutral 8.50 7.70 1,180 8.9 7.9 10.9% 1.15 1.04 13.5% 13.9% 13.9% 3.9 3.1 3.9% 4.4%Qingling Motors Company-H 1122 HK Outperform 1.81 3.50 579 9.1 7.8 16.7% 0.51 0.50 5.6% 6.4% 7.4% -3.6 -3.5 9.0% 10.5%Weichai Power Co Ltd-H 2338 HK Neutral 31.55 34.40 7,609 9.2 8.9 -2.6% 1.57 1.34 18.6% 16.3% 14.6% 3.8 3.5 0.3% 0.3%China/Hong Kong average 8.6 7.5 10.4% 1.52 1.30 19.1% 18.7% 17.4% 4.5 3.5 1.9% 2.2%Astra International ASII IJ Outperform 6,700 7,700 28,525 14.8 12.0 12.8% 3.83 3.18 27.9% 29.1% 27.3% 11.0 8.6 2.5% 2.6%Indomobil Sukses Int'l IMAS IJ Outperform 6,850 9,200 1,992 15.2 10.6 35.2% 3.27 2.56 23.7% 27.1% 24.5% 20.3 15.1 0.6% 1.0%Indonesia average 14.9 11.9 14.0% 3.79 3.13 27.6% 28.9% 27.1% 11.4 8.9 2.4% 2.5%Tan Chong Motor Holdings TCM MK Underperform 4.50 4.20 946 14.6 9.4 15.4% 1.53 1.35 11.0% 15.3% 15.4% 9.0 6.9 2.2% 2.3%UMW Holdings UMWH MK Outperform 9.02 9.55 3,298 12.5 11.9 11.0% 2.26 2.10 18.8% 18.3% 18.1% 6.6 6.3 4.8% 5.0%DRB-Hicom DRB MK Outperform 2.55 4.10 1,543 8.5 6.1 37.8% 0.49 0.44 6.4% 7.5% 7.9% -5.3 -4.5 1.9% 2.2%Malaysia average 14.6 9.4 15.4% 1.53 1.35 11.0% 15.3% 15.4% 9.0 6.9 2.2% 2.3%Average (all) 10.6 9.0 11.6% 2.07 1.76 21.2% 21.2% 19.8% 6.9 5.6 2.1% 2.3%
EV/EBITDA (x) Dividend Yield (%)Core P/E (x) 3-year EPS CAGR (%)
P/BV (x) Recurring ROE (%)Company Bloomberg Ticker
Recom. Market Cap (US$ m)
SOURCES: CIMB, COMPANY REPORTS
Calculations are performed using EFA™ Monthly Interpolated Annualisation and Aggregation algorithms to December year ends

AUTOS June 26, 2012
6
Malaysian autos 1. BACKGROUND 1.1 Where does Malaysia stand? Among the ten member nations of ASEAN (Malaysia, Thailand, Indonesia, the Philippines, Brunei, Singapore, Vietnam, Cambodia, Myanmar and Laos), only three countries, namely Thailand, Indonesia and Malaysia, are major demand centres for motorcars (excluding motorcycles and scooters). Accommodative government policies, an expanding middle-income group and rising disposable income are among the common factors helping to propel their auto industries forward. While all three countries have gained significant mileage in the auto sector and lead the other seven member nations, by perhaps leaps and bounds, in terms of annual vehicle sales and the development of the local automotive industry, future growth prospects among the three member nations differ.
In this report, we will 1) provide a brief overview of Malaysia’s auto industry, 2) study Malaysia’s auto sector vis-à-vis the other two major demand centres, i.e. Indonesia and Thailand, and 3) examine the opportunities and threats facing auto assemblers in the country.
2. OVERVIEW OF MALAYSIAN AUTOS 2.1 Brief background on Malaysia’s auto sector Malaysia’s automobile industry dates back to the 1960s when the government developed a policy to promote an integrated automotive industry to strengthen its industrial base and reduce its dependency on the agricultural sector. The country’s automobile industry comprises the following parties: 1) national car manufacturers, 2) local assemblers of foreign brands, and 3) parallel importers. Further down the supply chain are the used car dealers, whose role is to provide an avenue for vehicles to be resold, and the automotive components/parts manufacturers, who supply car parts to vehicle manufacturers and assemblers. In total, there are four vehicle manufacturers and 10 vehicle assemblers with over 15 manufacturing and assembly plants in Malaysia. There are numerous auto components and parts players.
Table of Contents 1. BACKGROUND p.4
2. OVERVIEW OF MALAYSIAN AUTOS p.4
3. MSIA VIS-À-VIS THAILAND AND INDO p.7
4. OPPORTUNITIES p.15
5. THREATS p.21
5. VALUATION AND RECOMMENDATION p.28
Notes from the Field
“There are about one billion people living in this region (Asia, outside China), so the potential to grow the business is huge”
– Jean Yves Dossal, sales director of PSA Peugeot Citroen Asian operations

AUTOS June 26, 2012
7
Figure 3: Manufacturing and assembly plants in Malaysia Assembly and manufacturing plants Vehicle makeHicom Automotive Manufacturers (Malaysia) Sdn Bhd (Plant I) Suzuki (PV)
Volkswagen (PV)Hicom Automotive Manufacturers (Malaysia) Sdn Bhd (Plant II) Mitsubishi Fuso (CV)
Mercedes Benz (PV and CV)Assembly Services Sdn Bhd Toyota (PV and CV)
Hino (CV)Honda Malaysia Sdn Bhd Honda (PV)Inokom Corporation Sdn Bhd BMW (PV)
HD5000 (CV)Hyundai-Inokom (PV and CV)Landrover (CV)Mazda (PV)
Isuzu-Hicom Malaysia Isuzu (CV)Isuzu D'Max (CV)Hicom Perkasa (CV)
Oriental Assemblers Sdn Bhd Chery (PV)Changan (PV)Dong Feng (CV)Hyundai (PV)Joy Long (PV)Tuah (CV)ZX Auto (CV)
Swedish Motor Assemblies Sdn Bhd Volvo (PV and CV)Kinglong (CV)Renault (CV)
Tan Chong Motor Assemblies (Plant I) Nissan (PV and CV)Renault (CV)Foton (CV)
Tan Chong Motor Assemblies (Plant II) Nissan (PV)Perodua Manufacturing Sdn Bhd Perodua (PV)Perusahaan Otomobil Nasional Bhd (Proton) Proton (PV and CV)Proton Tanjung Malim Sdn Bhd Proton (PV)
Kia (PV)Naza (PV)
Naza Automotive Manufacturing Sdn Bhd Peugeot (PV)Scania (Malaysia) Sdn Bhd Scania (CV)
SOURCES: CIMB, MAA
The four national car manufacturers in the country are Proton, Perodua, Inokom Corporation and Malaysian Truck & Bus. Proton and Perodua are the biggest players in the domestic market as both players control close to 56% market share combined in terms of total vehicle sales. The other 10 car assemblers assemble non-national brands. Non-national vehicle sales in Malaysia are skewed towards the Japanese brands although their market positions have been somewhat weakened by last year’s back-to-back natural disasters in Japan and Thailand and the gradual rise of the Korean brands. Assembly Services (Toyota), Tan Chong Motor (Nissan) and Honda Malaysia (Honda) are the three biggest assemblers after Proton and Perodua. They collectively control 25% of the total vehicle market.
The European brands’ presence in Malaysia is still somewhat restricted to the luxury and premium segments. The punitive tax structure on non-ASEAN imports has inflated European car prices, making their cars generally uncompetitive from a pricing point of view compared to the national car brands and other locally-assembled Japanese brands. But this is gradually changing as European car companies, such as Mercedes Benz, Volvo, Peugeot and Volkswagen AG (VW), have set up CKD operations in the country. The European brands in Malaysia control only c.6% of the country’s total vehicle sales.

AUTOS June 26, 2012
8
Figure 4: Auto players in Malaysia National players Brands assembled ShareholdersPerusahaan Otomobil Nasional Sdn Bhd ProtonPerodua Manufacturing Sdn Bhd Perodua Daihatsu & Mitsui (51%), Perodua Sdn Bhd (49%)Inokom Corporation Inokom 53%-owned by Sime DarbyMalaysian Truck & Bus Sdn Bhd HICOM and Isuzu commercial trucks DRB, Isuzu Motor, Itochu Corp, Hicom Holdings
Other car assemblersHICOM Automotive Manufacturers Malaysia Mercedes, Suzuki, Isuzu, Mitsubishi Fuso, Daewoo, Iveco, LDV, VW DRB-Hicom (93%)Assembly Services Sdn Bhd Toyota UMW (51%), Toyota Motor (49%)Honda Malaysia Sdn Bhd Honda DRB (34%), Oriental Holdings (15%), Honda (51%)Kinabalu Motor Assembly Sdn Bhd Isuzu MBM Resources (70%)Naza Automotive Manufacturing Sdn Bhd Peugeot, Kia, Naza Naza GroupOriental Assemblers Sdn Bhd Hyundai, Chery, Joy Long, LMG Oriental Holdings (97%)Swedish Motor Assemblers Sdn Bhd Ford, Mazda, Volvo Volvo Car Corporation (100%)Tan Chong Motor Assemblers Sdn Bhd Nissan, UD Tan Chong Motor (70%)Asia Automobile Industries Sdn Bhd Sinotruk Mikani HoldingsScania (Malaysia) Sdn Bhd Scania Scania CV AB (100%)
SOURCES: CIMB, MAA
Figure 5: Total vehicles sales in Malaysia in 2011 (passenger and commercial) Makes Passenger Commercial Total Market sharePerodua 179,989 - 179,989 30.0%Proton 158,601 56 158,657 26.4%Toyota 63,493 23,458 86,951 14.5%Honda 32,480 - 32,480 5.4%Nissan 25,504 6,772 32,276 5.4%Mitsubishi 3,754 8,299 12,053 2.0%Naza 9,347 - 9,347 1.6%Isuzu - 9,299 9,299 1.6%Volkswagen 7,350 - 7,350 1.2%Suzuki 7,308 - 7,308 1.2%Others (30 players) 47286 16881 64167 10.7%Total 535,112 64,765 599,877 100.0%
SOURCES: CIMB, MAA
2.2 Second-largest passenger car market in ASEAN Malaysia ranks third (600,123 units in 2011) in terms of total vehicle sales in the region after Indonesia (894,164) and Thailand (794,081). It is the second-largest passenger car market in ASEAN (sold 535,113 units in 2011), having lost the coveted first place to Indonesia (601,945) in 2010. It ranks fourth in terms of commercial vehicle sales (sold 65,010 units in 2011), after Thailand (433,640), Indonesia (292,219) and the Philippines (96,754).
Figure 6: Motor vehicle sales in ASEAN in 2011 Country Passenger vehicles Commercial vehicles 2011 2010Brunei 13,472 1,083 14,555 13,589 Indonesia 601,945 292,219 894,164 764,710 Malaysia 535,113 65,010 600,123 605,156 Philippine 44,862 96,754 141,616 168,490 Singapore 33,493 6,077 39,570 51,891 Thailand 360,441 433,640 794,081 800,357 Vietnam 64,505 45,155 109,660 111,737
SOURCES: CIMB, ASEAN AUTOMOTIVE FEDERATION

AUTOS June 26, 2012
9
Figure 7: Passenger vehicle sales in 2011 Figure 8: Commercial vehicle sales in 2011
-
100,000
200,000
300,000
400,000
500,000
600,000
700,000
Brun
ei
Indo
nesi
a
Mal
aysi
a
Philip
pine
Sing
apor
e
Thai
land
Viet
nam
-
50,000
100,000
150,000
200,000
250,000
300,000
350,000
Brun
ei
Indo
nesi
a
Mal
aysi
a
Philip
pine
Sing
apor
e
Thai
land
Viet
nam
SOURCES: CIMB, ASEAN AUTOMOTIVE FEDERATION SOURCES: CIMB, ASEAN AUTOMOTIVE FEDERATION
3. MALAYSIA’S AUTO SECTOR VIS-À-VIS THAILAND AND INDONESIA 3.1 Vehicle penetration rate is often used as a yardstick for
growth Barring years where sales were affected by the unexpected financial crises, supply shocks from natural disasters and uncertainties surrounding the National Automotive Policy (NAP), Malaysia’s vehicle sales have consistently trended up. The country’s population has achieved a CAGR of 2% over the past ten years while vehicle sales (excluding motorcycles) have outpaced it with a CAGR of 4%. From 97,262 in 1980, total vehicle sales have risen to 599,877 units in 2011.
Malaysia’s solid economic growth and high GDP per capita relative to the other member ASEAN nations (except Brunei and Singapore) were among the key factors underpinning this sales uptrend over the past three decades.
Figure 9: GDP per capita, current prices
0
2,000
4,000
6,000
8,000
10,000
1990
1991
1992
1993
1994
1995
1996
1997
1998
1999
2000
2001
2002
2003
2004
2005
2006
2007
2008
2009
2010
2011
US$
Cambodia Indonesia Lao People's Democratic Republic
Malaysia Myanmar Philippines
Thailand Vietnam
SOURCES: CIMB, IMG

AUTOS June 26, 2012
10
As a result, the vehicle penetration rate, measured by the number of vehicles owned per capita, is relatively high in Malaysia. It is estimated that a total of 21.4m motor vehicles run on our roads today, out of which 11.4m or 53% are motorcars. This translates into an estimated vehicle penetration rate of 40% (i.e. 4 out of 10 Malaysians own some form of vehicle), considerably higher than Indonesia (7%) and Thailand (21%). Since the vehicle penetration rate is often used as a yardstick for vehicle sales growth, low levels in Indonesia and Thailand suggest that there is a lot of potential for expansion in the two countries’ auto industries.
Figure 10: Estimated vehicle penetration among ASEAN’s major vehicle demand centres
2010 2011Malaysia 38.7% 39.7%Indonesia 6.3% 6.6%Thailand 19.7% 20.8%Philippines 3.5% 3.6%
SOURCES: CIMB
Figure 11: Malaysia - motorisation rate Figure 12: Thailand - motorisation rate
-
100,000
200,000
300,000
400,000
500,000
600,000
700,000
1995
1996
1997
1998
1999
2000
2001
2002
2003
2004
2005
2006
2007
2008
2009
2010
2011
0%
5%
10%
15%
20%
25%
30%
35%
40%
45%
Annual domestic vehicle sales (LHS) Motorcar/capita (RHS)
-
100,000
200,000
300,000
400,000
500,000
600,000
700,000
800,000
900,000
1995
1996
1997
1998
1999
2000
2001
2002
2003
2004
2005
2006
2007
2008
2009
2010
2011
0%
5%
10%
15%
20%
25%
Annual domestic vehicle sales (LHS) Motorcar/capita (RHS)
SOURCES: CIMB, IMF, MAA SOURCES: CIMB, IMF, AAF, JAMA
Figure 13: Indonesia - motorisation rate Figure 14: Philippines - motorisation rate
-
100,000
200,000
300,000
400,000
500,000
600,000
700,000
800,000
900,000
1,000,000
1995
1996
1997
1998
1999
2000
2001
2002
2003
2004
2005
2006
2007
2008
2009
2010
2011
0%
1%
2%
3%
4%
5%
6%
7%
Annual domestic vehicle sales (LHS) Motorcar/capita (RHS)
-
20,000
40,000
60,000
80,000
100,000
120,000
140,000
160,000
180,000
1996
1997
1998
1999
2000
2001
2002
2003
2004
2005
2006
2007
2008
2009
2010
2011
0%
1%
1%
2%
2%
3%
3%
4%
4%
Annual domestic vehicle sales (LHS) Motorcar/capita (RHS)
SOURCES: CIMB, IMF, AAF, JAMA SOURCES: CIMB, IMF, AAF, JAMA

AUTOS June 26, 2012
11
3.2 Debunking the expensive car myth The tax structure for Malaysia’s auto sector is designed to encourage the development of the local automotive sector. There are three different types of levies on vehicles: 1) import duties, 2) excise duties, and 3) sales tax. Prior to the ASEAN Free Trade Agreement (AFTA), Malaysia’s duty structure was punitive to protect the interests of the two national auto players. While the Malaysian government has gradually relaxed its protective grip on the sector, the duty structure still favours the national brands.
Figure 15: Types of taxes on motor vehicles Apart from the normal corporation tax, the government levies three other types of taxes on motor vehicles sold in Malaysia. These three types of taxes can be summarised as follows:1) Import duties - Levied on the CIF (carriage, insurance and freight) price of the vehicle. The rate depends on:a) type of vehicleb) CBU or CKDc) engine size2) Excise duties - Levied on the CIF price + local parts + local assembly costs3) Sales tax - 10% of the OMV plus excise duties and import duties
SOURCES: CIMB
Import duties of vehicles from within ASEAN have been gradually reduced to o% over the years. But vehicles in the country are still relatively more expensive compared to its peers in the region. The key culprit is the exorbitant excise duties, which the government imposed to make up for the revenue lost from the scrapping of import duties under AFTA in 2004. These excise duties range from 60% to 105%, depending on engine capacity and vehicle type. On top of this, all vehicles are slapped with a 10% sales tax. To put things into perspective, Indonesia imposes luxury tax of 0-75% on its vehicles, along with a 10% VAT, while Thailand imposes excise duties of 3-35%, in addition to a 7% VAT.
Figure 16: ASEAN car duty structure (as at Jan 10) Tax description
CKD CBU CKD CBU CKD CBU CKD CBU CKD CBUImport duty MFN rate 5%-45% 83% 10% 30% 0%-30% 80% 10% 40% 10% 30%
CEPT rate 5% 83% 0% 0% 0% 0% 0% 0% 0% 0%Excise/special consumption/luxury sales tax 45%-60% 45%-60% 60%-105% 60%-105% 17%-40% 17%-40% 30%-75% 30%-75% 2%-60% 2%-60%VAT/sales tax 10% 10% 10% 10% 7% 7% 10% 10% 12% 12%Interior tax - - - - 10% 10% - - - -
PhilippinesVietnam Malaysia Thailand Indonesia
SOURCES: CIMB, COMPANY
A comparison of the absolute prices of Honda Accord and Toyota Vios sold in selected countries in this region revealed that car prices in Singapore and Vietnam are among the highest. On fears that uncontrolled growth in the number of vehicles running on the road will cause massive traffic jams on the small island, the Singapore government has taken several measures to manage car ownership. These measures include the hefty ad valorem tax, registration fee, certificate of entitlement (COE), vehicle quota systems (VQS), road taxes and electronic road pricing (ERP), among others. Vietnam is second due to its punitive tax structure. Unlike the ASEAN-6 countries, import duties for vehicles in Vietnam have yet to be fully removed. Malaysia ranks third.

AUTOS June 26, 2012
12
Figure 17: Price comparison of similar models in ASEAN Honda Accord Local currency US$ VariantSingapore 179,900 142,332 2.4 (new facelift)Vietnam 1,435,000,000 68,858 2.4Malaysia 168,144 54,565 2.4 Vti-LIndonesia 483,500,000 51,944 2.4 Vti-LThailand 1,547,000 49,377 2.4 ELPhilippines 1,700,000 36,263 2.4 SToyota Vios Local currency US$ VariantSingapore 114,188 90,343 1.5G (with non-guaranteed COE)Vietnam 602,000,000 28,914 1.5GMalaysia 87,952 28,335 1.5GIndonesia 241,850,000 26,063 1.5GThailand 690,000 21,936 1.5GPhilippines 820,000 19,126 1.5G
SOURCES: CIMB
Interestingly, while Malaysia’s car prices are among the top three highest in the region, the cost of vehicle ownership (CVO) is said to be one of the lowest. The CVO is based on the purchase price of the car and its running costs, including fuel prices, road tax, insurance premium and vehicle registration fees. Critical to Malaysia’s low CVO is the subsidised fuel, which is the lowest compared to Thailand, Singapore, Indonesia, Vietnam and the Philippines. As such, while Malaysia’s absolute car prices are inflated by the excise duties, low running costs help to bring down the overall cost of owning a vehicle in the country. As long as affordability levels stay low, domestic demand for cars should remain intact, in our opinion.
3.3 Passenger car segment is Malaysia’s mainstay; Thailand and Indonesia focus on trucks and MPV
Due to the establishment of the national car programme, Malaysia’s auto sector is largely geared towards the production of passenger vehicles. The segment accounted for 80-90% of total vehicle sales in the country over the last 10 years. Specifically within the passenger vehicle segment in Malaysia, Perodua and Proton are the strongest players with 34% and 30% market share, respectively, followed by the three Japanese players Toyota (12%), Honda (6%) and Nissan (5%).
Figure 18: Malaysia's vehicle sales by type (passenger vs. commercial)
81% 80%
91% 91% 91% 90% 89%
19% 20%
9% 9% 9% 10% 11%
0%
10%
20%
30%
40%
50%
60%
70%
80%
90%
100%
2005 2006 2007 2008 2009 2010 2011
Passenger cars Commercial cars
SOURCES: CIMB, MAA

AUTOS June 26, 2012
13
Figure 19: Total passenger vehicle sales in 2011 Makes Total PV Market sharePerodua 179,989 33.6%Proton 158,601 29.6%Toyota 63,493 11.9%Honda 32,480 6.1%Nissan 25,504 4.8%Naza 9,347 1.7%Volkswagen 7,350 1.4%Suzuki 7,308 1.4%Hyundai 6,469 1.2%Mazda 5,716 1.1%Mercedes Benz 5,439 1.0%Peugeot 5,345 1.0%Others (17 players) 28,071 5.2%Total 535,112 100%
SOURCES: CIMB, MAA
In the commercial vehicle segment, which the national auto players are absent in, Toyota is by far the strongest player with a 36% market share. Isuzu plays second fiddle with a 14% market share, followed closely by Mitsubishi with a 13% market share.
Figure 20: Total commercial vehicle sales in 2011 Makes Total Market shareToyota 23,458 36.2%Isuzu 9,299 14.4%Mitsubishi 8,299 12.8%Nissan 6,772 10.5%Hino 5,584 8.6%Ford 2,349 3.6%Daihatsu 2,118 3.3%Mitsubishi Fuso 1,756 2.7%Hyundai-Inokom 1,519 2.3%Hicom Perkasa 1,518 2.3%Others (13 players) 2,093 3.2%Total 64,765 100.0%
SOURCES: CIMB, MAA
Within the passenger vehicle segment, there are four sub-categories, namely, 1) passenger cars (sedans, hatchbacks), the largest sub-category in terms of vehicle sales, 2) multi-purpose vehicles (MPV), 3) four-wheel drives/sports utility vehicles (4WD/SUV), and 4) window vans.
The passenger cars sub-category, which is traditionally the national auto players’ stronghold, has always dominated the passenger vehicle segment. But the market share of passenger cars has been on a downtrend over the years as more affordable people-movers muscle their way up. Two notable launches that turned the tide were Proton Exora (launched in Apr 09) and Perodua Alza (launched in Nov 09). These two were Proton’s and Perodua’s maiden MPV models and have proven to be the bullets which helped the carmakers conquer the two top spots within the MPV segment with a combined market share of 62% in 2011. In 2010, the year which captured the first full-year contribution of both the Exora and Alza, sales of the MPV segment jumped 70% yoy. In the non-national segment, Toyota and Nissan are by far the largest players in the segment with a collective market share of 29%.

AUTOS June 26, 2012
14
Figure 21: Malaysia's passenger vehicle sales by sub-category
78% 78% 76%
69% 70%
9% 10% 12%18% 16%
3%3%2%2%3%1%1%1%1%1%
-10%
0%
10%
20%
30%
40%
50%
60%
70%
80%
90%
2007 2008 2009 2010 2011
Passenger cars 4WD/SUV Window Van MPV
SOURCES: CIMB, MAA
Figure 22: PV: Passenger car sub-category Makes Passenger cars Market sharePerodua 142,587 34.1%Proton 137,535 32.9%Toyota 45,470 10.9%Honda 27,203 6.5%Nissan 10,006 2.4%Suzuki 6,940 1.7%Naza 6,933 1.7%Volkswagen 6,815 1.6%Mercedes Benz 5,377 1.3%Mazda 4,623 1.1%Ford 4,548 1.1%BMW 4,315 1.0%Peugeot 4,089 1.0%Hyundai 3,489 0.8%Hyundai/Inokom 2,866 0.7%Lexus 1,711 0.4%Chevrolet 871 0.2%Mitsubishi 787 0.2%Audi 582 0.1%Volvo 475 0.1%Mini 301 0.1%Porsche 136 0.0%Renault 71 0.0%Chery 61 0.0%Kia 26 0.0%Subaru 8 0.0%Land Rover - 0.0%Mahindra - 0.0%Ssangyong - 0.0%Total 417,825 100.0%
SOURCES: CIMB, MAA

AUTOS June 26, 2012
15
Figure 23: PV: MPV sub-category Makes MPV Market sharePerodua 37,402 40%Proton 21,064 23%Toyota 14,229 15%Nissan 12,557 13%Chery 2,662 3%Naza 2,324 2%Honda 1,170 1%Mazda 788 1%Peugeot 477 1%Mitsubishi 456 0%Volkswagen 205 0%Ssangyong 186 0%Ford 58 0%Renault 10 0%Total 93,588 100%
SOURCES: CIMB, MAA
The 4WD/SUV sub-category is entirely dominated by non-national brands. Honda is the biggest contender in this category with a market share of 22%, followed by Mitsubishi (14%) and Hyundai (11%). Market share for this sub-category has been inching up over the past five years, in line with the general trend in emerging markets.
Figure 24: PV: 4WD/SUV sub-category Makes 4WD/SUV Market shareHonda 4,107 22.3%Mitsubishi 2,511 13.6%Hyundai 2,004 10.9%Toyota 1,763 9.6%Kia 1,384 7.5%Nissan 1,088 5.9%Hyundai/Inokom 952 5.2%Peugeot 779 4.2%BMW 685 3.7%Chevrolet 401 2.2%Suzuki 368 2.0%Audi 345 1.9%Volkswagen 330 1.8%Volvo 326 1.8%Mazda 305 1.7%Porsche 279 1.5%Ford 233 1.3%Chery 187 1.0%Land Rover 133 0.7%Naza 90 0.5%Ssangyong 58 0.3%Mercedes Benz 53 0.3%Mahindra 10 0.1%Renault 10 0.1%Subaru 9 0.0%Lexus - 0.0%Mini - 0.0%Perodua - 0.0%Proton - 0.0%Total 18,410 100.0%
SOURCES: CIMB, MAA
Although the market share of the passenger car sub-category has been floundering over the past three years, a slew of new launches in this segment could tip the scales in its favour this year. The 1% pt increase in market share from 69% in 2010 to 70% in 2011 was partly due to new models, such as the all-new Myvi (launched in Jun 11) and the Proton Saga facelift (launched in Dec 2010). This year, there is a host of major launches in the passenger cars sub-category, such as Proton Preve, Honda City facelift, all-new Toyota Camry,

AUTOS June 26, 2012
16
all-new Hyundai Elantra, Toyota Prius C and the Toyota Prius facelift. These models could draw interest back to the passenger car sub-category.
Both Thailand and Indonesia do not have their own national car programmes. Largely through incentives and low tax rates, Thailand has established itself as a hub for pick-up trucks in the region, where sales are supported by the country’s agricultural activities. Thailand is also the world’s number two market for pick-up trucks after the US. Sales of this segment account for a good 41% of Thailand’s total vehicle sales. Meanwhile, Indonesia focuses on the MPV segment, where sales account for slightly over 40% of the country’s total vehicle sales.
3.4 Thailand and Indonesia are major production bases; Malaysia is largely domestic-centric
Based on the table below, Thailand’s vehicle production has historically exceeded its domestic sales. This is because many global auto players have made Thailand their production base for the region. Major auto players, such as Toyota, Nissan, Honda, Isuzu, Suzuki, Mitsubishi, General Motors and Ford, have already set up manufacturing plants in the country. Thailand’s seamless supply chain is partly the reason behind its success as a production hub for global auto players in this region. According to an industry expert, Thailand has the largest number of Japanese automotive parts suppliers investing in the country, i.e. 500 vs. Indonesia’s 160.
But Indonesia is catching up. For example, Nissan has pledged to further strengthen its presence in Indonesia to support its programme to make the country a production hub for ASEAN. Indonesian Industry Minister MS Hidayat was quoted as saying that the company planned to invest US$400m to expand the production capacity of its existing plant in the country from the current 100,000 units to 250,000 units in 2014. Indonesia’s demography, i.e. huge population base and expanding middle-income class, is one of the country’s key attractions. That said, the country’s supply chain is not as developed as Thailand’s while infrastructure such as roads is still inadequate.
On the other hand, vehicles produced in Malaysia are largely to feed domestic demand. In the past, protectionist measures prevented global auto players from penetrating the country’s automotive sector. But the landscape is slowly changing. Peugeot and more recently Volkswagen AG (VW) have expressed interest to make Malaysia their production hub for the region. Both Peugeot and VW do not currently have a manufacturing presence in the region.
Figure 25: Vehicle sales vs. vehicle production Vehicle sales
2006 2007 2008 2009 2010 2011Brunei 12,522 14,220 14,680 12,365 13,589 14,555 Indonesia 318,904 433,341 603,774 483,550 764,710 894,164 Malaysia 490,768 487,716 548,115 536,905 605,156 600,123 Philippines 99,541 117,903 124,449 132,444 168,490 141,616 Singapore 137,564 122,254 110,574 79,503 51,891 39,570 Thailand 682,161 631,251 615,270 548,871 800,357 794,081 Vietnam 40,897 80,392 110,186 119,460 111,737 109,660
Vehicle production2006 2007 2008 2009 2010 2011
Brunei - - - - - - Indonesia 296,008 411,638 600,844 464,816 702,508 837,948 Malaysia 503,048 441,678 530,810 489,269 567,715 533,515 Philippines - - 63,621 62,523 80,477 64,906 Singapore - - - - - - Thailand 1,188,044 1,287,346 1,394,029 999,378 1,645,304 1,457,795 Vietnam 35,087 75,249 115,038 107,760 106,166 100,465
SOURCES: CIMB, AAF

AUTOS June 26, 2012
17
3.5 Exposure to green technology; Thailand is ahead while Indonesia plays catch-up
The global auto market is increasingly gravitating towards green technology with Asia leading in terms of the sales of electric and hybrid vehicles. According to J.D. Power and Associates, Asia controls 56% of the hybrid/electric vehicle market, followed by North America (32%) and Europe (13%). Within Asia, Japan is the biggest market, followed by China. The hybrid/electric vehicle market in ASEAN is relatively small, although this is gradually changing. Thailand is the first ASEAN country to build hybrid vehicles with the Camry hybrid the first model it rolled out. Unfavourable tax structures have previously kept the cars expensive and beyond the reach of the masses.
To encourage the development of the green car industry and to reduce the reliance on pick-up trucks, Thailand has introduced the eco-car programme, which provides incentives to auto players that build small and fuel-efficient cars meeting Euro 4 emissions standards and consume less than 5 litres per 100km. Companies investing in the manufacturing of small eco-cars are provided up to eight years of corporate tax breaks and duty-free imports of related machinery and equipment. So far, five auto players, i.e. Nissan, Honda, Suzuki, Mitsubishi and Toyota, have signed on for the eco programme and invested. The total eco-car production capacity of these five companies is 585,000 vehicles per year.
Malaysia does not have a comprehensive green vehicle programme like Thailand. But there was no shortage of initiatives and incentives rolled out during the 2009 National Automotive Policy (NAP) and budget to encourage the manufacturing of green vehicles in the country. We also expect eco-friendly measures to feature in the upcoming revised NAP. In Malaysia, Toyota is the first mover in introducing green vehicles with the rollout of Toyota Prius. Although sales of green vehicles were still relatively negligible at less than 5%, acceptance of these vehicles is definitely improving.
Indonesia is relatively far behind in terms of green vehicle sales as the government imposes high taxes on imported cars. A 10-75% tax is slapped on vehicles which are deemed as luxury items, a category that the hybrid and electric vehicles fall under. This is on top of the 40% tax imposed on imported vehicles. But this is set to change. Indonesia’s President Susilo Bambang Yudhoyono has said that the government plans to offer various incentives to auto players to make hybrid cars more affordable, including cancelling luxury sales taxes on these green vehicles in exchange for a lower excise tax. An eco-car project is expected to hit the road this year to propel the country towards becoming a full-scale production base for hybrid vehicles by 2020.
4. OPPORTUNITIES FOR THE MALAYSIAN AUTO PLAYERS Based on the vehicle penetration rate, which is one of the yardsticks for growth for the auto sector, Malaysia’s vehicle sales growth potential could be more subdued compared to Indonesia and Thailand. The potential for exports also seem rather limited given that most of the global auto players have made either Thailand or Indonesia their production base. That said, while growth prospects seem relatively less exciting, there are trends and opportunities in Malaysia that the domestic auto players can take advantage of, such as 1) the country’s favourable demographics in the form of a large working population and rising middle-income group, 2) improved export opportunities under AFTA and the ASEAN Economic Community (AEC) in 2015, and 3) a sizeable replacement market.

AUTOS June 26, 2012
18
4.1 Favourable demographics; large working population and rising middle-income group
Malaysia has a sizeable car-buying population that auto players can tap. Over the past 10 years, Malaysia’s population has expanded at a steady clip of about 2% p.a. from 23.8m in 2001 to 28.7m in 2011. An estimated 46% (or est. 13.7m) of the current population falls into the 20-49 age bracket. This age bracket tends to be the key driver of vehicle demand as it comprises the young working population through to the more established working adults who are generally more affluent.
Figure 26: Population breakdown by age group 0 to 19 years 20 to 49 years 50 and above
('m) ('m) ('m)2002 10.6 10.6 3.32003 10.8 10.9 3.42004 10.9 11.1 3.62005 11.1 11.3 3.82006 11.2 11.5 3.92007 11.3 11.8 4.12008 11.5 12.0 4.32009 10.4 12.9 4.6
2010F 10.6 13.2 4.72011F 10.7 13.4 4.82012F 10.9 13.7 4.9
SOURCES: CIMB, CEIC
Figure 27: Population breakdown by age group (%)
43% 43% 43% 42% 42% 42% 41% 37% 37% 37% 37%
43% 43% 43% 43% 43% 43% 43% 46% 46% 46% 46%
13% 14% 14% 14% 15% 15% 15% 16% 16% 16% 16%
0%
20%
40%
60%
80%
100%
120%
2002 2003 2004 2005 2006 2007 2008 2009 2010F 2011F 2012F
0 to 19 years ('m) 20 to 49 years ('m) 50 and above ('m)
SOURCES: CIMB, CEIC
Out of the 13.7m, 20% (or 2.7m) are aged 20-24 years old. This group of people is generally either approaching the end of their tertiary education or has just joined the workforce. Given the state of Malaysia’s public transportation system, a car might be deemed essential for travelling to and from work. Therefore, we think this age group should be a good representation of first-time car buyers.
Meanwhile, youths aged 15-19 make up an estimated 9% (or est. 2.8m) of the country’s population. Since the legal driving age in Malaysia is 18, this age group represents another potential source of demand for cars. We think these two groups make good target markets for entry-level vehicles.
Less than 15% (or 3.4m) of Malaysia’s population are 55 years old and above. While the older age group, such as retirees, will still buy cars, the loss of earnings could mean more cautious spending, especially on big-ticket items.

AUTOS June 26, 2012
19
Figure 28: Breakdown of 20-49 age group (%)
21% 21% 21% 21% 21% 21% 21% 20% 20% 20% 20%
19% 18% 19% 19% 19% 19% 19% 18% 18% 18% 18%
18% 17% 17% 17% 17% 17% 17% 17% 17% 17% 18%
16% 16% 16% 16% 16% 16% 16% 16% 16% 16% 16%
14% 15% 15% 15% 15% 15% 15% 15% 15% 15% 15%
12% 12% 13% 13% 13% 13% 13% 13% 13% 13% 13%
0%
20%
40%
60%
80%
100%
120%
2002 2003 2004 2005 2006 2007 2008 2009 2010F 2011F 2012F
20 to 24 Years ('m) 25 to 29 Years ('m) 30 to 34 Years ('m) 35 to 39 Years ('m)
40 to 44 Years ('m) 45 to 49 Years ('m)
SOURCES: CIMB, CEIC
Vehicle sales are also, to a large extent, driven by income levels since income determines the purchasing capacity of households and the relative affordability of cars. Apart from Vietnam and Singapore where vehicle sales are affected by sharp changes in excise duties, taxes and COE premiums, vehicle sales in Malaysia, Thailand, Indonesia and the Philippines have largely tracked the GDP per capita.
As such, we see it as good news that the government plans to transform the country into a high-income nation by 2020, which would require the annual income to rise to the equivalent of US$15,000 p.a. from US$9,700 currently. As income levels increase, a bigger proportion of the population will be able to afford cars. This presents an opportunity for new players. National car players with entry-level cars, like Proton and Perodua, will be able to take advantage of new car buyers who were previously unable to afford the big-ticket purchase while non-national car players can take advantage of existing car owners who wish to upgrade to non-national cars.

AUTOS June 26, 2012
20
Figure 29: Malaysia - vehicle sales vs. GDP per capita (US$) Figure 30: Thailand - vehicle sales vs. GDP per capita (US$)
-
100,000
200,000
300,000
400,000
500,000
600,000
700,000
1995
1996
1997
1998
1999
2000
2001
2002
2003
2004
2005
2006
2007
2008
2009
2010
2011
0
2,000
4,000
6,000
8,000
10,000
12,000
Annual vehicle sales Gross domestic product per capita, current prices
-
100,000
200,000
300,000
400,000
500,000
600,000
700,000
800,000
900,000
1995
1996
1997
1998
1999
2000
2001
2002
2003
2004
2005
2006
2007
2008
2009
2010
2011
0
1,000
2,000
3,000
4,000
5,000
6,000
Annual vehicle sales Gross domestic product per capita, current prices
SOURCES: CIMB, IMF, AAF, VARIOUS AUTO BODIES SOURCES: CIMB, IMF, AAF, VARIOUS AUTO BODIES
Figure 31: Indonesia - vehicle sales vs. GDP per capita (US$) Figure 32: Philippines - vehicle sales vs. GDP per capita (US$)
-
100,000
200,000
300,000
400,000
500,000
600,000
700,000
800,000
900,000
1,000,000
1995
1996
1997
1998
1999
2000
2001
2002
2003
2004
2005
2006
2007
2008
2009
2010
2011
0
500
1,000
1,500
2,000
2,500
3,000
3,500
4,000
Annual vehicle sales Gross domestic product per capita, current prices
-
20,000
40,000
60,000
80,000
100,000
120,000
140,000
160,000
180,000
1996
1997
1998
1999
2000
2001
2002
2003
2004
2005
2006
2007
2008
2009
2010
2011
0
500
1,000
1,500
2,000
2,500
Annual vehicle sales Gross domestic product per capita, current prices
SOURCES: CIMB, IMF, AAF, VARIOUS AUTO BODIES SOURCES: CIMB, IMF, AAF, VARIOUS AUTO BODIES
Figure 33: Vietnam - vehicle sales vs. GDP per capita (US$) Figure 34: Singapore - vehicle sales vs. GDP per capita (US$)
-
20,000
40,000
60,000
80,000
100,000
120,000
140,000
2006
2007
2008
2009
2010
2011
0
200
400
600
800
1,000
1,200
1,400
1,600
Annual vehicle sales Gross domestic product per capita, current prices
0
20,000
40,000
60,000
80,000
100,000
120,000
140,000
1996
1997
1998
1999
2000
2001
2002
2003
2004
2005
2006
2007
2008
2009
2010
2011
0
5,000
10,000
15,000
20,000
25,000
30,000
35,000
Annual vehicle sales Gross domestic product per capita, current prices
SOURCES: CIMB, IMF, AAF, VARIOUS AUTO BODIES SOURCES: CIMB, IMF, AAF, VARIOUS AUTO BODIES

AUTOS June 26, 2012
21
4.2 Opportunities under AFTA and the ASEAN Economic Community (AEC) in 2015
To seek further growth opportunities, auto players are eyeing the overseas markets, especially within the region. The ASEAN Free Trade Agreement (AFTA), where its main objective is to create an integrated market within ASEAN in order to increase the region’s competitive edge compared to the rest of the world, has made this possible. AFTA’s main mechanism is the Common Effective Preferential Treatment (CEPT). Member countries had decided to reduce tariffs within a period of 15 years beginning 1 Jan 93 where final effective tariffs were agreed to be within the range of 0-5%. Under the CEPT, motor vehicles are eligible for concessional tariffs if it has 40% ASEAN content.
Figure 35: Import and excise duties on CKD motor vehicles for Malaysia (%)
Type/Engine capacity 2003 2004 2005 2006 2003 2004 2005 2006 2003 2004 2005 2006 2003 2004 2005 2006Passenger cars< 1800 42 25 0 0 55 60 90 75 42 35 10 10 55 60 90 751800 - 1999 42 25 0 0 55 70 120 80 42 35 10 10 55 70 120 802000 - 2499 60 25 0 0 55 80 150 90 60 35 10 10 55 80 150 902500 - 2999 70 25 0 0 55 90 200 105 70 35 10 10 55 90 200 105Above 3000 80 25 0 0 55 100 250 125 80 35 10 10 55 100 250 125MPV/Van< 1500 5 0 0 0 30 30 40 60 5 5 5 0 30 30 40 601500 - 1799 10 10 0 0 30 30 40 65 10 20 10 10 30 30 40 651799 - 1999 20 10 0 0 30 40 60 75 20 20 10 10 30 40 60 751999 - 2499 30 10 0 0 30 70 120 90 30 20 10 10 30 70 120 902499 - 2999 40 10 0 0 30 80 150 105 40 20 10 10 30 80 150 105Above 3000 40 10 0 0 30 90 170 125 40 20 10 10 30 90 170 1254WD< 1800 10 10 0 0 45 50 60 65 10 20 10 10 45 50 60 651800 - 1999 20 10 0 0 45 60 90 75 20 20 10 10 45 60 90 752000 - 2499 30 10 0 0 45 70 120 90 30 20 10 10 45 70 120 902500 - 2999 40 10 0 0 45 80 150 105 40 20 10 10 45 80 150 105Above 3000 40 10 0 0 45 90 170 125 40 20 10 10 45 90 170 125
ASEAN (CEPT) NON-ASEAN (MFN)Import Duty (ID) Excise duty (ED) Import duty Excise duty
SOURCES: CIMB, VARIOUS
Figure 36: Import and excise duties on CBU motor vehicles for Malaysia (%)
Type/Engine capacity 2003 2004 2005 2006 2006 2010 2003 2004 2005 2006 2003 2004 2005 2006 2003 2004 2005 2006Passenger cars< 1800 140 70 20 15 5 0 0 60 90 75 140 80 50 30 0 60 90 751800 - 1999 170 90 20 15 5 0 0 70 120 80 170 100 50 30 0 70 120 802000 - 2499 200 110 20 15 5 0 0 80 150 90 200 120 50 30 0 80 150 902500 - 2999 250 150 20 15 5 0 0 90 200 105 250 160 50 30 0 90 200 105Above 3000 300 190 20 15 5 0 0 100 250 125 300 200 50 30 0 100 250 125MPV/Van< 1500 60 40 20 15 5 0 0 30 40 60 60 60 50 30 0 30 40 601500 - 1799 60 40 20 15 5 0 0 30 40 65 60 60 50 30 0 30 40 651799 - 1999 80 50 20 15 5 0 0 40 60 75 80 70 50 30 0 40 60 751999 - 2499 150 90 20 15 5 0 0 70 120 90 150 100 50 30 0 70 120 902499 - 2999 180 110 20 15 5 0 0 80 150 105 180 120 50 30 0 80 150 105Above 3000 200 120 20 15 5 0 0 90 170 125 200 130 50 30 0 0 170 1254WD< 1800 60 40 20 15 5 0 0 50 60 65 60 60 50 30 0 50 60 651800 - 1999 80 50 20 15 5 0 0 60 90 75 80 70 50 30 0 60 90 752000 - 2499 150 80 20 15 5 0 0 70 120 90 150 100 50 30 0 70 120 902500 - 2999 180 100 20 15 5 0 0 80 150 105 180 120 50 30 0 80 150 105Above 3000 200 110 20 15 5 0 0 90 170 125 200 130 50 30 0 90 170 125
ASEAN (CEPT) NON-ASEAN (MFN)Import Duty (ID) Excise duty (ED) Import duty Excise duty
SOURCES: CIMB, VARIOUS
Liberalisation under AFTA-CEPT has opened up opportunities for the Malaysian auto sector. The low duties applied across all ASEAN countries provide auto players a much more sizeable market to tap. Higher production volume leads to economies of scale, which will have positive implications on the

AUTOS June 26, 2012
22
cost base. Not only that, AFTA has made it possible for foreign players to set up production bases in the region. Malaysia has been chosen as the main production hub for Peugeot right-hand-drive vehicles in ASEAN. The key beneficiary of this is Naza Group, which has been appointed its contract assembler. More recently, DRB-HICOM has been appointed the contract manufacturer for Volkswagen (VW). The VW cars will first be assembled for Malaysia, then ASEAN.
But the liberalisation of the sector, as with any other sectors, is not without its challenges. There will be a more level playing field and auto players (whether national or non-national brands) will no longer be able to enjoy favourable treatment at home. Cost structures have to be streamlined. Auto players that are able to gain mileage in export markets and increase production volumes in domestic assembly and manufacturing facilities should generally be able to achieve the economies of scale needed to lower unit production costs. Ultimately, we think auto players with the clout, scale and lower production cost base will be the ones that will be able to withstand the competition under AFTA.
Proton and Perodua are already working on growing their export markets. Other beneficiaries of increased economic cooperation under AFTA are DRB-HICOM, UMW and Tan Chong. DRB-HICOM is VW’s partner of choice for the latter’s expansion initiatives in the region. Tan Chong also has plans in place for its expansion in the Indochina region. For UMW, we think that expansion into markets like Thailand and Indonesia will be limited given Toyota Motor’s direct presence in these countries. But we think UMW will stand to benefit if Malaysia is made the hub for the production of selected models for onward export to other countries in the region.
Currently, only the ASEAN-6 (Malaysia, Thailand, Indonesia, the Philippines, Singapore and Brunei) has reduced import duties for vehicles with minimum 40% local content to 0%. The other ASEAN-4 countries (Cambodia, Myanmar, Vietnam and Laos) have not fully complied with the 0-5% duty structure under the AFTA-CEPT. The ASEAN Economic Community is expected to be enforced in 2015 where a single market and production base is to be established by the 10 ASEAN members. By implication, all 10 ASEAN members should, by then, have 0-5% import duties on ASEAN cars. The removal of duties should help facilitate cross-border sales and open up new markets for auto players.
4.3 Sizeable replacement demand The replacement market in Malaysia is sizeable. Malaysia has the second-largest passenger car market in ASEAN, which provides a good platform for auto players. Given the combination of economic uncertainty and good quality cars, the lifespan of a car before it is replaced could be creeping up. While we are unable to accurately ascertain the average lifespan of a car before it is replaced, if we assume a typical 5-year replacement cycle, an estimated 487,176 vehicles are due for replacement this year. In our analysis, we assume that 20% of owners will replace their vehicles after five years, 30% after six years and 40% after seven years. Based on these assumptions, sales from replacement demand will total about 465,592 units in 2012 alone. On top of that, we estimate that 6% of the 2.7m population within the age group of 20-24 years will purchase vehicles for the first time as this group generally consists of people who are either approaching the tail end of their tertiary education or have just joined the workforce and will need a car to commute to/from work. Based on these factors, the total vehicle sales from replacement and first-time owners will total about 625,639 units, which is marginally below our 2012 sales projection of 628,022.
If we extend our analysis to 2017 based on the same assumptions, we arrive at a vehicle sales CAGR of 4%. But again, we think this is a rough estimation of the long-term sustainable growth rate. Year-on-year growth in vehicle sales could vary depending on economic conditions, new model launches, government policies and the like.

AUTOS June 26, 2012
23
Figure 37: Estimates of sustainable vehicle demand 2012F 2013F 2014F 2015F 2016F 2017F
% of people who replace cars after five (5) years 20% 20% 20% 20% 20% 20%% of people who replace cars after six (6) years 30% 30% 30% 30% 30% 30%% of people who replace cars after seven (7) years 40% 40% 40% 40% 40% 40%Replacement demand
Replacement after five years 97,435 109,623 107,381 121,031 119,975 125,604 Replacement after six years 147,230 146,153 164,435 161,072 181,547 179,963 Replacement after seven years 220,926 196,307 194,870 219,246 214,762 242,062
Total replacement demand 465,592 452,083 466,686 501,349 516,284 547,630 New vehicle demand 160,047 186,722 213,397 213,397 213,397 213,397 % of first time buyers from the age group of 20-24 years (i.e. 2.7m) 6% 7% 8% 8% 8% 8%Implied vehicle demand (units) 625,639 638,805 680,083 714,745 729,681 761,027
SOURCES: CIMB, MAA, CEIC
5. CHALLENGES AHEAD FOR THE MALAYSIAN AUTO PLAYERS 5.1 Current public transport system makes car ownership
almost a necessity for some The country’s inadequate public transportation system has been one of the country’s vehicle demand growth drivers. This is particularly true when compared to more developed countries, like Singapore and Hong Kong. Despite improvements in the public transportation system over the years, this mode of transport has been falling out of favour. The market share of land public transport (LPT) in the morning peak hour has fallen from 34% in the 1980s to 10-12% in 2008. This share is relatively low compared to other international cities, such as Hong Kong (90% of LPT), Singapore (63% of LPT) and London (55% of LPT).
While the increase in vehicle penetration rate has resulted in a rise in congestion, door-to-door travel times for private vehicles remain competitive against the use of public transport, according to the Land Public Transport Commission (SPAD). Travel times are typically much higher by public transport. MRT Corp said that the choice of private vehicles over public transport by residents in the Greater KL and Klang Valley area is showing an uptrend. We believe these trends reflect not only the affordability of cars, rising income levels and changes in household characteristics but also the state of the country’s public transport and increase in highway network supply.
Figure 38: Summary of existing issues
Rail passengers key issuesBus passengers key issues Taxi passengers key issues
Service availability Punctuality Service availabilityService capacity Waiting and travel time Users safetyPoor integration with bus feeder services Accessibility Drivers attitudeQuality of existing track and signaling Bus condition Call serviceTicketing integration Interchange Taxi condition
Bus driver attitude Willingness to go to destinationInformation Charging according to the meterBus service
SOURCES: CIMB, SPAD

AUTOS June 26, 2012
24
Figure 39: Population density (persons per sq km)
- 1,000 2,000 3,000 4,000 5,000 6,000 7,000
Klang Valley
Penang
Johor Bahru
Singapore
Hong Kong
London
Toronto
SOURCES: CIMB, 10MP, PRESS REPORTS
Figure 40: Regional comparison (% of public transport usage)
0% 10% 20% 30% 40% 50% 60% 70% 80% 90% 100%
Kuala Lumpur
Seoul
Singapore
Manila
Tokyo
Bangladesh
SOURCES: EDGE WEEKLY
Figure 41: Public transport (% of journeys in peak periods)
- 10 20 30 40 50 60 70 80 90 100
Klang Valley
Penang
Singapore
Hong Kong
London
Toronto
SOURCES: CIMB, 10MP, PRESS REPORTS

AUTOS June 26, 2012
25
Figure 42: Vehicle density (vehicles per km per road)
- 100 200 300 400 500 600 700 800 900 1,000
Klang Valley
Penang
Johor Bahru
Singapore
Hong Kong
London
Toronto
SOURCES: CIMB, 10MP, PRESS REPORTS
Unless there is a significant overhaul in the connectivity and efficiency of the public transportation system, we think that private cars will still be the preferred mode of transport. But now that the government is stepping up its initiatives to improve the country’s public transport, what will be the implications on the future demand for cars?
Recall that improving urban public transport is one of the six National Key Result Areas (NKRAs). RM2.8bn has been allocated to this NKRA initiative, which is to be completed in the first two years of the 10th Malaysian Plan (10MP). The mass rapid transit (MRT) system, which is the biggest infrastructure project in Malaysia, is one of the key entry point projects for the NKRA. Designed to significantly improve the coverage of rail-based public transport in the Klang Valley, it will enable 50% of all trips in the Klang Valley to be done on public transport by 2020, from the current 17%. Phase 1 of the project is expected to be completed in 2017. The LPT mode share is projected to increase from the current 12% to 25% when all the three MRT lines are completed, and to 40% by 2020.
Apart from this, the existing Ampang and Kelana Jaya light railway transit (LRT) lines will also be extended. The Ampang line extension starts from the Seri Petaling station and passes through Kinrara and Puchong before ending at Putra Heights. The extension is 17.7km long with 12 new stations. Meanwhile, the Kelana Jaya line will begin from the Kelana Jaya station and pass through 13 new stations, including Subang Jaya and USJ, before ending at Putra Heights. The extension covers a distance of 17km. Both projects are expected to be completed in 2014.

AUTOS June 26, 2012
26
Figure 43: LRT extension alignment (Ampang and Kelana Jaya line)
SOURCES: CIMB, WWW.LRTEXTENSION.COM
Other plans include:
• Completion of the integrated transport terminal (ITT) in Bandar Tasik Selatan and construction of ITT in Gombak by 2012.
• Increasing transport capacity. Full delivery of 35 sets of new four-car trains will increase the capacity of the Kelang Jaya LRT line from 24k to 98k passengers/hour.
• Potential extension of the monorail system to improve connectivity between existing KTM Komuter, LRT and monorail systems.
• Implementation of 49km bus rapid transit (BRT) system in Kuala Lumpur and potential expansion to Iskandar in Johor.
• The estimated RM16.5bn high speed railway (HSR) linking Kuala Lumpur with Singapore to improve connectivity between the two cities.
As public transportation gradually improves, people should drive less. This should reduce the need for new private passenger vehicles. This can be deduced from the relatively low car penetration rate in more advanced countries, where the public transportation system is more comprehensive and developed. It is also evident in the lower vehicle density per km of road in cities such as Singapore, Hong Kong and London.
We applaud the government’s efforts to improve the country’s public transportation network. But we note that these efforts will take time to bear fruit. For example, the MRT will only be operational in 2017 while the LRT extension lines will only be completed in 2014, which is still a long wait. Also, much of the improvements in the public transport network are focused on the Greater KL/Klang Valley area, which means that other populous states, like Johor and Perak, still offer good potential for auto players. For now, we think that private cars will remain the dominant means of transport in Malaysia, although this trend looks set to shift.

AUTOS June 26, 2012
27
5.2 Improvements in highway network supply We think another reason behind the rising vehicle penetration rate is the improving highway infrastructure in the country, which helps strengthen connectivity and shorten the time to commute between two places. The 10MP has outlined seven new highways to be built over the next 4-5 years. The total value of the seven highways is estimated to be RM19bn. Our checks indicate that three urban highways are already at the planning stages. They are the Sg. Besi Ulu Kelang Expressway (Suke), Damansara-Shah Alam Highway (Dash) and Kinrara-Damansara Expressway (Kidex).
Suke Suke is a 31.8km, three-lane, dual-carriageway expressway that will start at Sri Petaling and pass through Sungai Besi, Alam Damai, Cheras-Kajang, Taman Bukit Permai, Taman Putra, Taman Permai Jaya, Taman Dagang Permai, Taman Kosas, Ampang dan Taman Hillview before ending at Ulu Kelang.
Figure 44: Details of Suke Designation : Sungai Besi-Ulu Kelang Elevated Expressway (SUKE) Length : 31.8km, 3 lane, dual carriageway (fully elevated)Total cost : UnknownTotal cost/km : UnknownTotal toll stops : 3 toll plazas,11 interchangesTotal land to be acquired : UnknownConstruction period : 4-5 yearsConcession period : UnknownConcession owner : Projek Lintasan Kota Holdings Sdn Bhd (Prolintas) - 100%-owned by PNBCoverage area : Alternative route for MRRII, linking major highways in Eastern Klang Valley
SOURCES: CIMB, COMPANY REPORTS
Dash Dash is a 20.1km, three-lane, dual-carriageway expressway that will commence at the Puncak Perdana U10 Shah Alam intersection and serve as a link for Puncak Perdana, Alam Suria, Denai Alam, Kampung Melayu Subang, Jalan Sungai Buloh, the Rubber Research Institute of Malaysia, Kota Damansara, Damansara Perdana and Mutiara Damansara. The expressway ends at the Penchala interchange.
Figure 45: Details of Dash Designation : Damansara-Shah Alam Highway (DASH)Length : 20.1km, 3 lane, dual carriageway (fully elevated)Total cost : UnknownTotal cost/km : UnknownTotal toll stops : 3 toll plazas,12 interchangesTotal land to be acquired : UnknownConstruction period : 4-5 yearsConcession period : UnknownConcession owner : Projek Lintasan Kota Holdings Sdn Bhd (Prolintas) - 100%-owned by PNBCoverage area : Link between east and west of Klang Valley: Shah Alam to Damansara Perdana
SOURCES: CIMB, COMPANY REPORTS
Kidex The Kinrara-Damansara Expressway (Kidex) will link Kinrara in Puchong and Pusat Bandar Damansara. The main purpose of this fully-elevated, 50km highway is to divert the heavy traffic on the Lebuhraya Damansara Puchong (LDP).

AUTOS June 26, 2012
28
Figure 46: Details of Kidex Designation : Kinrara-Damansara Expressway (KIDEX)Length : 50km, 3 lane, dual carriageway (fully elevated)Total cost : RM2.2bnTotal cost/km : RM44mTotal toll stops : 3 toll plazas,11 interchangesTotal land to be acquired : UnknownConstruction period : 4-5 yearsConcession period : UnknownConcession owner : UnknownCoverage area : Kinrara-Damansara
SOURCES: CIMB, COMPANY REPORTS
5.3 Risk of fuel price hike A hike in fuel prices will increase the running cost of a car and reduce affordability. In Malaysia, RON95, which is pumped by most motorists, retails at RM1.90 per litre (after a subsidy of RM1.09 per litre by the government). Our analysis below shows the impact on the cost of a full tank for vehicles of different engine capacities from a 1) 5 cents increase in RON95 from RM1.85 per litre to the current RM1.90, and 2) 10 cents increase in RON97 from RM2.80 per litre to the current RM2.90. The average impact is a 2.7% to 3.6% increase in cost. The government might not be able to fully absorb future fuel price increases, which means that there is the risk of higher fuel costs for consumers.
Figure 47: Impact of fuel price increase (5 sen for RON95, 10 sen for RON97) Before After Before AfterRON95 RON95 Change Change RON97 RON97 Change Change
CC Fuel tank capacity (L) Full tank Full tank (RM) % Full tank Full tank (RM) %659-989 RM RM RM RMPerodua Kancil 32 59.2 60.8 1.60 2.7% 89.6 92.8 3.20 3.6%Perodua Viva 36 66.6 68.4 1.80 2.7% 100.8 104.4 3.60 3.6%Perodua Myvi 40 74.0 76.0 2.00 2.7% 112.0 116.0 4.00 3.6%
1075-1597Proton Savvy 40 74.0 76.0 2.00 2.7% 112.0 116.0 4.00 3.6%Perodua Myvi 40 74.0 76.0 2.00 2.7% 112.0 116.0 4.00 3.6%Toyota Avanza 45 83.3 85.5 2.25 2.7% 126.0 130.5 4.50 3.6%
1308-1498Proton Gen 2 50 92.5 95.0 2.50 2.7% 140.0 145.0 5.00 3.6%Proton Saga 40 74.0 76.0 2.00 2.7% 112.0 116.0 4.00 3.6%Honda Civic 50 92.5 95.0 2.50 2.7% 140.0 145.0 5.00 3.6%Toyota Vios 42 77.7 79.8 2.10 2.7% 117.6 121.8 4.20 3.6%Honda City 42 77.7 79.8 2.10 2.7% 117.6 121.8 4.20 3.6%Perodua Alza 42 77.7 79.8 2.10 2.7% 117.6 121.8 4.20 3.6%Toyota Avanza 45 83.3 85.5 2.25 2.7% 126.0 130.5 4.50 3.6%Toyota Rush 50 92.5 95.0 2.50 2.7% 140.0 145.0 5.00 3.6%
1584-1799Proton Waja 60 111 114.0 3.00 2.7% 168.0 174.0 6.00 3.6%Proton Saga 40 74 76.0 2.00 2.7% 112.0 116.0 4.00 3.6%Nissan Latio 52 96.2 98.8 2.60 2.7% 145.6 150.8 5.20 3.6%Honda Civic 50 92.5 95.0 2.50 2.7% 140.0 145.0 5.00 3.6%Proton Exora 55 101.75 104.5 2.75 2.7% 154.0 159.5 5.50 3.6%Nissan Grand Livina 52 96.2 98.8 2.60 2.7% 145.6 150.8 5.20 3.6%
SOURCES: CIMB
5.4 Risk of increase in hire purchase (HP) rates A hike in HP rate is generally negative as it increases the loan servicing burden for buyers. HP rates usually track the trend in Bank Negara Malaysia’s (BNM) overnight policy rate (OPR). BNM’s OPR now stands at 3% and our economics team is not projecting a change in 2H12. We believe BNM will maintain its accommodative monetary policy for an extended period on the back of continued caution about the external environment. For next year, we are

AUTOS June 26, 2012
29
projecting OPR to hover around 3-3.5%. But we think that an increase, if any, is unlikely to throw buyers’ vehicle purchasing off track, as long as it is done gradually. Our analysis shows that a moderate interest rate hike increases car buyers’ monthly payments by just a small amount. But it could be a cause for concern if it is accompanied by rising fuel prices and heightened economic worries.
Figure 48: Hire purchase structure (rates offered by CIMB Bank) Margin of financing up to 90% of seller's invoiceFinancing tenure up to 9 years (108 months)
New car financing rates Fixed rate (p.a. flat)Types of vehiclesPassenger vehicles 2.60% to 2.70%Proton & Perodua 3.10% to 3.60%Unregistered reconditioned 2.65% to 2.80%
New commercial vehicles Fixed rate (p.a. flat)Types of vehiclesBTM up to 5,000 kg 3.25% to 3.60%BTM more than 5,000 kg 4.20% to 4.60%
SOURCES: CIMB
Figure 49: Impact of HP rate increase from 3.50% to 3.75% on yearly instalment Old scenario @ 3.50% p.a.
Year 1 2 3 4 5 Total Interest Tenure
3.50% 5 4,378 3,414 2,450 1,486 522 12,250
Principal 1 2 3 4 5 Total 70,000 12,072 13,036 14,000 14,964 15,928 70,000
Instalments 1 2 3 4 5 Total 1,371 16,450 16,450 16,450 16,450 16,450 82,250
New scenario @ 3.75% p.a.Year 1 2 3 4 5 Total
Interest Tenure 3.75% 5 4,691 3,658 2,625 1,592 559 13,125
Principal 1 2 3 4 5 Total 70,000 11,934 12,967 14,000 15,033 16,066 70,000
Instalments 1 2 3 4 5 Total 1,385 16,625 16,625 16,625 16,625 16,625 83,125
Increase /(Decrease) in yearly instalment (RM)Year 1 2 3 4 5 Total
175 175 175 175 175 875
SOURCES: CIMB
5.5 Consumer sentiment will affect decisions to buy cars The demand for vehicles is quite closely correlated with economic conditions via consumer sentiment. When times are bad, potential buyers are generally less willing to commit to big-ticket items. While the current state of the country’s public transport makes it almost a necessity to own cars for some, buyers may choose to defer purchases until the global economy recovers and job security improves. If conditions in the eurozone deteriorate more rapidly than expected, there could be sharp declines in the global asset markets and risk appetite. The spillover would dampen consumer sentiment and affect the willingness to buy cars.

AUTOS June 26, 2012
30
Figure 50: Correlation between auto industry index and vehicle sales
Figure 51: Correlation between consumer sentiment index and vehicle sales
0
20,000
40,000
60,000
80,000
100,000
120,000
140,000
160,000
180,000
1Q07
2Q07
3Q07
4Q07
1Q08
2Q08
3Q08
4Q08
1Q09
2Q09
3Q09
4Q09
1Q10
2Q10
3Q10
4Q10
1Q11
2Q11
3Q11
4Q11
1Q12
0
20
40
60
80
100
120
140
160
180
Vehicle sales (LHS) MIER auto industry index (RHS)
0
20,000
40,000
60,000
80,000
100,000
120,000
140,000
160,000
180,000
1Q07
2Q07
3Q07
4Q07
1Q08
2Q08
3Q08
4Q08
1Q09
2Q09
3Q09
4Q09
1Q10
2Q10
3Q10
4Q10
1Q11
2Q11
3Q11
4Q11
1Q12
0
20
40
60
80
100
120
140
Vehicle sales (LHS) Consumer sentiment index (RHS)
SOURCES: CIMB, MIER SOURCES: CIMB, MIER
5.6 Lowering of trade and non-trade barriers welcome more competition
Since the birth of the national car project 25 years ago, the Malaysian auto industry has been highly protected. Compared to neighbouring countries, like Thailand, Malaysia’s auto industry is characterised by high trade and non-trade barriers that shield both the national and non-national auto players, which have invested substantially in car manufacturing and assembling operations in the country. Gradual liberalisation via the lowering of trade and non-trade barriers would mean intensifying competition for local car manufacturers and assemblers as the country becomes more open to investments from foreign car companies and imports of cars and car parts into the country.
6. VALUATION AND RECOMMENDATION 6.1 Maintain OVERWEIGHT on Malaysian autos Thailand, Indonesia and Malaysia are the major demand centres for motorcars, thanks to rapid economic growth, accommodative government policies, an expanding middle-income group and rising disposable income, among other factors. Although all three countries have gained significant mileage in the auto sector in terms of the development of the industry, Indonesia’s and Thailand’s growth prospects, based on the opportunities for exports and vehicle penetration rates, seem to trump Malaysia’s. Still, the demand drivers for the Malaysian auto sector are intact. Favourable demographics in the form of a large working population and rising middle-income group, still-firm economic outlook, relatively low cost of vehicle ownership, low interest rate environment, the country’s dismal public transportation system and new model launches are among factors that should continue to support domestic buying interest. Further out, full liberalisation under AFTA and AEC in 2015 should enhance auto players’ export opportunities.
This year, we are projecting total industry volume to scale a new high of 628,022 units. This implies a 4.7% growth from the 599,877 units recorded in the disaster-stricken 2010 and is 2.1% above the Malaysian Automotive Association’s (MAA) projection of 615,000 units. Jan-May sales totalled 244,579 units. Sales in the remaining seven months of the year have to grow by about 11% yoy to hit our sales projection. We think this is achievable as we expect 1) vehicle supply to recover to meet pent-up demand, 2) new model launches to spur buying interest, and 3) banks to adapt to the tighter credit guidelines over time.
AUTOS June 26, 2012
31
Figure 52: Vehicle sales projection for 2012 Jan-May Jun-Dec Total
2012 244,579 383,443 628,022 2011 255,413 344,464 599,877 % yoy change -4% 11% 5%
SOURCES: CIMB, MAA
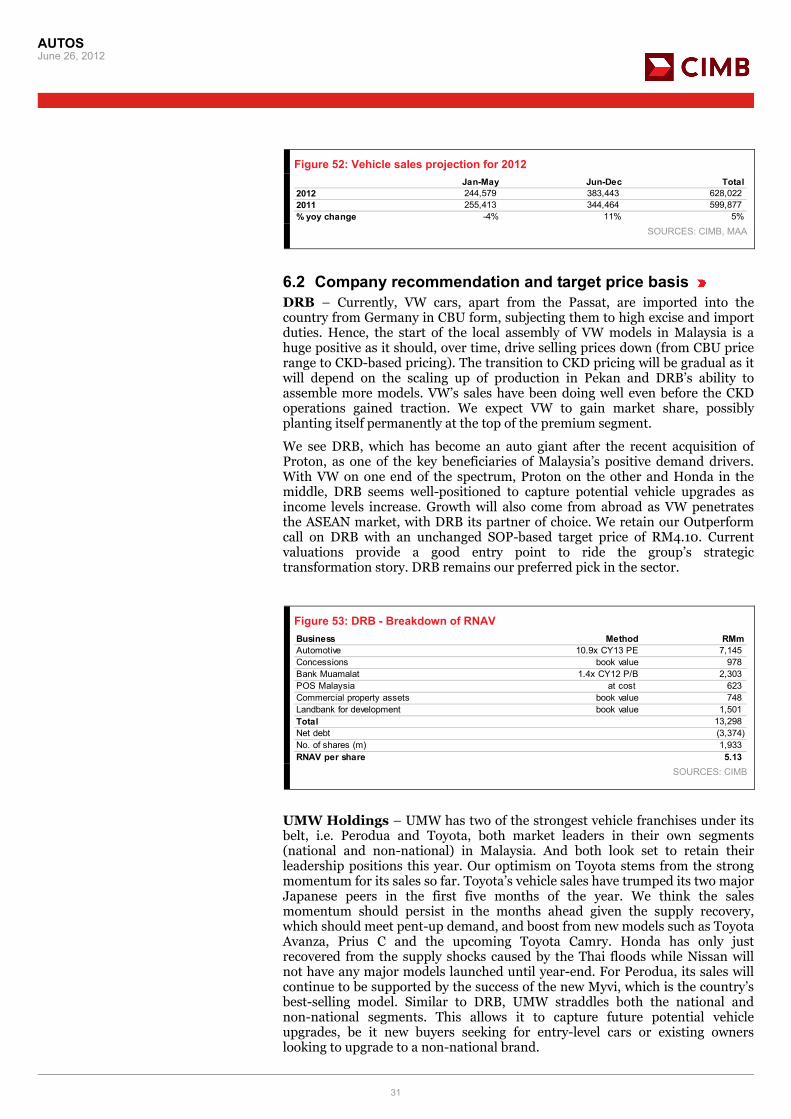
6.2 Company recommendation and target price basis DRB – Currently, VW cars, apart from the Passat, are imported into the country from Germany in CBU form, subjecting them to high excise and import duties. Hence, the start of the local assembly of VW models in Malaysia is a huge positive as it should, over time, drive selling prices down (from CBU price range to CKD-based pricing). The transition to CKD pricing will be gradual as it will depend on the scaling up of production in Pekan and DRB’s ability to assemble more models. VW’s sales have been doing well even before the CKD operations gained traction. We expect VW to gain market share, possibly planting itself permanently at the top of the premium segment.
We see DRB, which has become an auto giant after the recent acquisition of Proton, as one of the key beneficiaries of Malaysia’s positive demand drivers. With VW on one end of the spectrum, Proton on the other and Honda in the middle, DRB seems well-positioned to capture potential vehicle upgrades as income levels increase. Growth will also come from abroad as VW penetrates the ASEAN market, with DRB its partner of choice. We retain our Outperform call on DRB with an unchanged SOP-based target price of RM4.10. Current valuations provide a good entry point to ride the group’s strategic transformation story. DRB remains our preferred pick in the sector.
Figure 53: DRB - Breakdown of RNAV Business Method RMmAutomotive 10.9x CY13 PE 7,145 Concessions book value 978 Bank Muamalat 1.4x CY12 P/B 2,303 POS Malaysia at cost 623 Commercial property assets book value 748 Landbank for development book value 1,501 Total 13,298 Net debt (3,374) No. of shares (m) 1,933 RNAV per share 5.13
SOURCES: CIMB
UMW Holdings – UMW has two of the strongest vehicle franchises under its belt, i.e. Perodua and Toyota, both market leaders in their own segments (national and non-national) in Malaysia. And both look set to retain their leadership positions this year. Our optimism on Toyota stems from the strong momentum for its sales so far. Toyota’s vehicle sales have trumped its two major Japanese peers in the first five months of the year. We think the sales momentum should persist in the months ahead given the supply recovery, which should meet pent-up demand, and boost from new models such as Toyota Avanza, Prius C and the upcoming Toyota Camry. Honda has only just recovered from the supply shocks caused by the Thai floods while Nissan will not have any major models launched until year-end. For Perodua, its sales will continue to be supported by the success of the new Myvi, which is the country’s best-selling model. Similar to DRB, UMW straddles both the national and non-national segments. This allows it to capture future potential vehicle upgrades, be it new buyers seeking for entry-level cars or existing owners looking to upgrade to a non-national brand.
AUTOS June 26, 2012
32
Export opportunities for UMW Toyota do not look as compelling as it does for DRB or Tan Chong. Unlike DRB, which will play a role in driving VW’s ASEAN aspirations, or Tan Chong, which is Nissan’s vehicle in the growing Indochina, UMW Toyota’s move abroad will be limited by its principal Toyota Motor Corp’s direct presence in the key automotive markets, such as Thailand and Indonesia. But we think UMW will stand to benefit if Malaysia is made the hub for the production of selected models for onward exports to other countries in the region.
We are positive on UMW Toyota’s launch of hybrid vehicles like the Prius C, Prius and the Lexus CT200h as they gave it a headstart in terms of the offering of eco-friendly vehicles in the country. As the Malaysian government steps up on the development of the green industry in the country, more incentives to promote green technology can be expected, which will ultimately benefit first-movers like UMW Toyota.
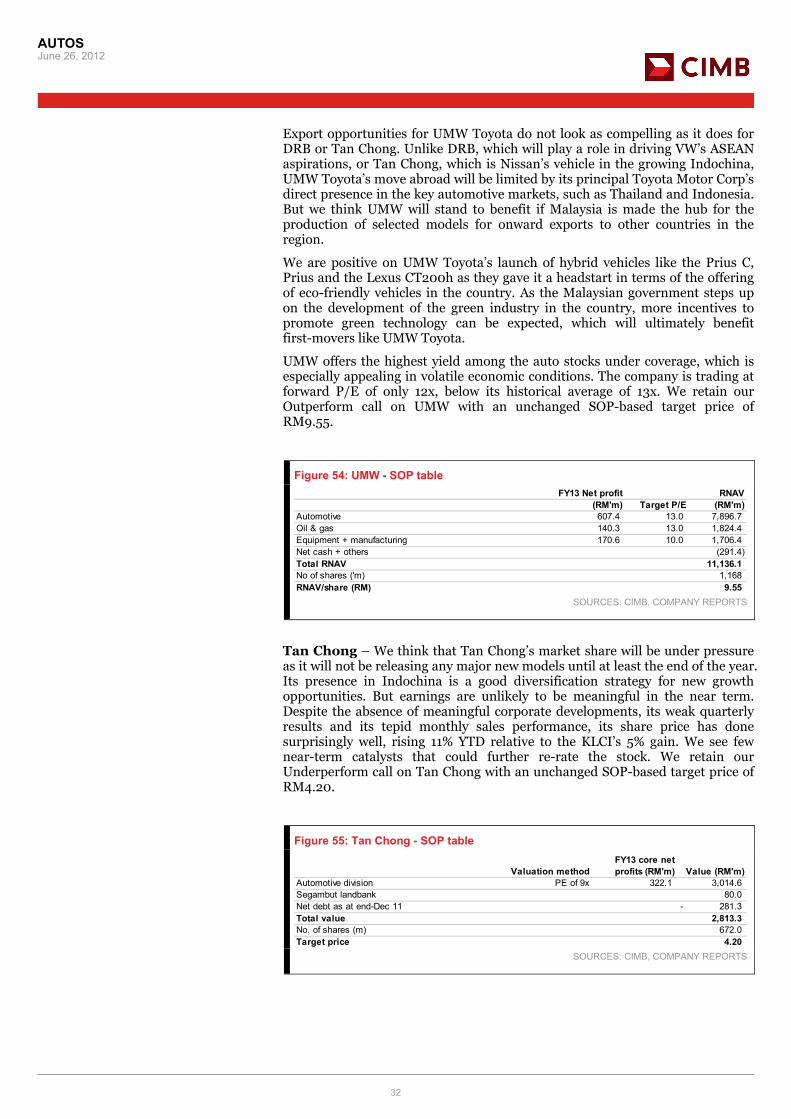
UMW offers the highest yield among the auto stocks under coverage, which is especially appealing in volatile economic conditions. The company is trading at forward P/E of only 12x, below its historical average of 13x. We retain our Outperform call on UMW with an unchanged SOP-based target price of RM9.55.
Figure 54: UMW - SOP table FY13 Net profit RNAV
(RM'm) Target P/E (RM'm)Automotive 607.4 13.0 7,896.7Oil & gas 140.3 13.0 1,824.4Equipment + manufacturing 170.6 10.0 1,706.4Net cash + others (291.4)Total RNAV 11,136.1No of shares ('m) 1,168RNAV/share (RM) 9.55
SOURCES: CIMB, COMPANY REPORTS
Tan Chong – We think that Tan Chong’s market share will be under pressure as it will not be releasing any major new models until at least the end of the year. Its presence in Indochina is a good diversification strategy for new growth opportunities. But earnings are unlikely to be meaningful in the near term. Despite the absence of meaningful corporate developments, its weak quarterly results and its tepid monthly sales performance, its share price has done surprisingly well, rising 11% YTD relative to the KLCI’s 5% gain. We see few near-term catalysts that could further re-rate the stock. We retain our Underperform call on Tan Chong with an unchanged SOP-based target price of RM4.20.
Figure 55: Tan Chong - SOP table
Valuation methodFY13 core net profits (RM'm) Value (RM'm)
Automotive division PE of 9x 322.1 3,014.6 Segambut landbank 80.0 Net debt as at end-Dec 11 281.3- Total value 2,813.3 No. of shares (m) 672.0 Target price 4.20
SOURCES: CIMB, COMPANY REPORTS

AUTOS June 26, 2012
33
6.3 Appendix 1 Figure 56: Market share (passenger vehicle sales) among ASEAN-6 countries in 2011
Figure 57: Market share (commercial vehicle sales) among ASEAN-6 countries in 2011
Brunei1%
Indonesia37%
Malaysia34%
Philippine3%
Singapore2%
Thailand23%
Brunei0%
Indonesia33%
Malaysia7%Philippine
11%Singapore
1%
Thailand48%
SOURCES: CIMB, ASEAN AUTOMOTIVE FEDERATION SOURCES: CIMB, ASEAN AUTOMOTIVE FEDERATION
6.4 Appendix 2 Figure 58: Market share of car brands in Malaysia Makes Passenger Commercial Total Market sharePerodua 179,989 - 179,989 30.0%Proton 158,601 56 158,657 26.4%Toyota 63,493 23,458 86,951 14.5%Honda 32,480 - 32,480 5.4%Nissan 25,504 6,772 32,276 5.4%Mitsubishi 3,754 8,299 12,053 2.0%Naza 9,347 - 9,347 1.6%Isuzu - 9,299 9,299 1.6%Volkswagen 7,350 - 7,350 1.2%Suzuki 7,308 - 7,308 1.2%Ford 4,839 2,349 7,188 1.2%Hyundai 6,469 - 6,469 1.1%Mazda 5,716 312 6,028 1.0%Mercedes Benz 5,439 271 5,710 1.0%Hino - 5,584 5,584 0.9%Peugeot 5,345 - 5,345 0.9%Hyundai/Inokom 3,818 1,519 5,337 0.9%BMW 5,000 - 5,000 0.8%Chery 2,997 - 2,997 0.5%Daihatsu - 2,118 2,118 0.4%Mitsubishi Fuso - 1,756 1,756 0.3%Kia 1,741 - 1,741 0.3%Lexus 1,711 - 1,711 0.3%Hicom Perkasa - 1,518 1,518 0.3%Chevrolet 1,272 - 1,272 0.2%Volvo 801 205 1,006 0.2%Audi 927 - 927 0.2%Scania - 483 483 0.1%Porsche 415 - 415 0.1%Mini 301 - 301 0.1%Man - 277 277 0.0%Ssangyong 244 13 257 0.0%Bison - 239 239 0.0%Land Rover 133 87 220 0.0%Renault 91 41 132 0.0%JBC - 87 87 0.0%Dongfeng - 19 19 0.0%Subaru 17 - 17 0.0%Mahindra 10 - 10 0.0%Tuah - 3 3 0.0%Total 535,112 64,765 599,877 100.0%
SOURCES: CIMB, MAA

AUTOS June 26, 2012
34
6.5 Appendix 3 Figure 59: Malaysian duty structure A) Motor cars
Engine capacity (cc) MFN ASEAN CEPT MFN ASEAN CEPT MFN ASEAN CEPT Excise Sales< 1800 30% 0% 10% 0% 10% n.a. 75% 10%1800 - 1999 30% 0% 10% 0% 10% n.a. 80% 10%2000 - 2499 30% 0% 10% 0% 10% n.a. 90% 10%Above 2500 30% 0% 10% 0% 10% n.a. 105% 10%
B) Four Wheel Drive Vehicle
Engine capacity (cc) MFN ASEAN CEPT MFN ASEAN CEPT MFN ASEAN CEPT Excise Sales< 1800 30% 0% 10% 0% 10% n.a. 65% 10%1800 - 1999 30% 0% 10% 0% 10% n.a. 75% 10%2000 - 2499 30% 0% 10% 0% 10% n.a. 90% 10%Above 2500 30% 0% 10% 0% 10% n.a. 105% 10%
C) Others (MPV & Van)
Engine capacity (cc) MFN ASEAN CEPT MFN ASEAN CEPT MFN ASEAN CEPT Excise Sales< 1500 30% 0% NIL 0% NIL n.a. 60% 10%1500 - 1799 30% 0% 10% 0% 10% n.a. 65% 10%1800 - 1999 30% 0% 10% 0% 10% n.a. 75% 10%2000 - 2499 30% 0% 10% 0% 10% n.a. 90% 10%Above 2500 30% 0% 10% 0% 10% n.a. 105% 10%
D) Commercial vehicles
Engine capacity (cc) MFN ASEAN CEPT MFN ASEAN CEPT MFN ASEAN CEPT Excise SalesAll 30% 0% NIL 0% NIL n.a. NIL 10%
Import duty Local taxesCBU CKD MSP CBU & CKD
Import duty Local taxesCBU CKD MSP CBU & CKD
Import duty Local taxesCBU CKD MSP CBU & CKD
Import duty Local taxesCBU CKD MSP CBU & CKD
SOURCES: CIMB, MAA

Conglomerate MALAYSIA June 26, 2012
IMPORTANT DISCLOSURES. INCLUDING ANY REQUIRED RESEARCH CERTIFICATIONS, ARE PROVIDED AT THE END OF THIS REPORT. Designed by Eight, Powered by EFA
Structural transformation story DRB-Hicom has a lot on its plate and the sudden dearth of newsflow reflects the task of transforming the various assets at hand. We believe that its share price inactivity during this interim period is a good entry point for a long-term restructuring play. We maintain our Outperform call and SOP-based target price. Apart from autos, we see potential rerating catalysts in its plans for POS Malaysia, Bank Muamalat and the property development division. DRB is our top pick in the sector.
Well-positioned to ride on rising income levels We see DRB, which has become an auto giant after the recent acquisition of Proton, as one of the key beneficiaries of Malaysia’s positive demand driver. With VW on one end of the spectrum, Proton on the other and Honda in the middle, DRB seems well-positioned to capture potential vehicle upgrades as income levels increase.
Compelling export opportunities Liberalisation under AFTA-CEPT has opened up opportunities for the Malaysian auto sector. The low duties applied across all ASEAN countries provide auto players a much more
sizeable market to tap. It has made it possible for foreign players to set up production bases and export hubs in the region. Again, DRB is a prime beneficiary of this. Being Volkswagen AG’s (VW) partner of choice, DRB is well-positioned to ride on the latter’s ASEAN aspirations. It is understood that the assembly of VW CKDs will first be for the Malaysian market and then for the ASEAN region as part of VW’s Strategy 2018 programme.
Transformation for POS Malaysia POS Malaysia recently released its 5-year strategic plan, following its takeover by DRB-Hicom late last year. The headline financial targets were 1) consecutive double-digit revenue growth right up to 2017, 2) improving its current pretax margins of 12% by “a lot higher” and 3) exploring new investments and M&A opportunities. Putting the sales growth targets and margin expansion together implies a doubling of sales and a tripling of profits within the 5-year plan.
CIMB Analyst
Loke Wei Wern
T (60) 3 20849946 E [email protected]
Lucius Chong
T (60) 3 20849869 E [email protected]
DRB-Hicom DRB MK / DRBH.KL Current RM2.55 SHORT TERM (3 MTH) LONG TERM
Market Cap Avg Daily Turnover Free Float Target RM4.10
US$1,543m US$3.33m 43.0% Previous Target RM4.10 RM4,930m RM10.31m 1,933 m shares Up/downside 60.8%
Convicti
1.5
2.0
2.5
3.0
818997104112120128135143151
Price Close Relative to FBMKLCI (RHS)
Source: Bloomberg
10203040
Jun-11 Sep-11 Dec-11 Mar-12
Vol m
Financial Summary Mar-11A Mar-12A Mar-13F Mar-14F Mar-15F
Revenue (RMm) 6,804 6,878 18,759 19,774 20,288Operating EBITDA (RMm) 379 1,680 1,270 1,651 1,830Net Profit (RMm) 473 1,292 665 862 954Core EPS (RM) 0.21 0.17 0.34 0.45 0.49Core EPS Growth 39% (22%) 107% 30% 11%FD Core P/E (x) 11.89 15.33 7.42 5.72 5.17DPS (RM) 0.044 0.045 0.050 0.059 0.068Dividend Yield 1.72% 1.77% 1.97% 2.30% 2.65%EV/EBITDA (x) (19.96) (5.57) (5.20) (4.30) (2.15)P/FCFE (x) 6.76 NA 0.95 5.72 NANet Gearing (134%) (113%) (30%) (34%) (10%)P/BV (x) 0.99 0.69 0.44 0.44 0.43Recurring ROE 7.39% 4.60% 6.84% 7.70% 7.92%% Change In Core EPS Estimates 0.000% 0.000% 0.000%CIMB/consensus EPS (x) 1.36 1.49 1.38
2.55
4.10
1.67 3.17
Target
52-week share price range
Current
SOURCE: CIMB, COMPANY REPORTS
Share price info Share price perf. (%) 1M 3M 12M
Relative 2.4 -1.1 10.8
Absolute 5.8 0 13.3
Major shareholders % held
Etika Strategi 55.9
EPF 7.7

DRB-Hicom June 26, 2012
36
Profit & Loss
(RMm) Mar-12A Mar-13F Mar-14F Mar-15FRevenue 6,878 18,759 19,774 20,288Cost Of Sales (5,223) (15,919) (16,513) (16,812)Gross Profit 1,655 2,840 3,261 3,477Total Operating Costs (192) (1,926) (2,023) (2,125)Operating Profit 1,463 914 1,237 1,352Operating EBITDA 1,680 1,270 1,651 1,830Depreciation And Amortisation (216.6) (356.1) (413.8) (478.6)Operating EBIT 1,463 914 1,237 1,352Net Interest Income (110.1) (293.0) (265.3) (346.4)Exchange Gains - - - - Other Income 79.9 84.5 89.5 89.5Associates' Profit 87.8 211.4 249.4 249.4Profit Before Tax (pre-EI) 1,521 917 1,311 1,344Exceptional Items 0.00 0.00 0.00 0.00Pre-tax Profit 1,521 917 1,311 1,344Taxation (148.0) (179.4) (354.0) (279.2)Profit After Tax 1,373 738 957 1,065Minority Interests (80.1) (73.1) (94.8) (110.7)Net Profit 1,292 665 862 954Recurring Net Profit 321.5 664.6 862.2 954.2
Balance Sheet
(RMm) Mar-12A Mar-13F Mar-14F Mar-15FFixed Assets 1,974 7,507 8,311 10,115Intangible Assets 205 1,664 2,017 162Other Long Term Assets 21,212 18,494 19,475 21,572Total Non-current Assets 23,391 27,664 29,803 31,848Total Cash And Equivalents 11,461 8,860 9,784 7,134Inventories 1,517 2,948 2,373 2,435Accounts Receivable 2,805 4,359 4,943 4,943Other Current Assets 493 498 5,336 508Total Current Assets 16,276 16,666 22,436 15,020Trade Creditors 619 2,477 2,966 2,966Short-term Debt 330.5 265.6 200.7 135.8Other Current Liabilities 25,941 22,439 29,294 23,284Total Current Liabilities 26,890 25,181 32,461 26,385Total Long-term Debt 1,678 4,813 5,212 5,676Other Liabilities 2,642 1,800 1,757 1,772Deferred Tax 85.2 104.6 124.0 143.4Total Non-current Liabilities 4,406 6,717 7,093 7,591Shareholders' Equity 7,139 11,127 11,286 11,381Minority Interests 1,232 1,305 1,400 1,511Preferred Shareholders Funds - - - - Total Equity 8,371 12,432 12,685 12,892
Cash Flow
(RMm) Mar-12A Mar-13F Mar-14F Mar-15FPre-tax Profit 1,521 917 1,311 1,344Depreciation And Non-cash Adj. 239.0 437.7 429.8 575.7Change In Working Capital (120) 2,704 472 (176)Tax Paid (148.0) (179.4) (354.0) (279.2)Other Operating Cashflow (1,189) (490) (84) (515)Cashflow From Operations 302 3,389 1,775 950Capex (350) (1,450) (1,650) (1,850)Disposals Of FAs/subsidiaries 8.20 5.70 3.20 3.20Acq. Of Subsidiaries/investments (623) (3,000) 0 0Other Investing Cashflow (3,720) 0 0 0Cash Flow From Investing (4,685) (4,445) (1,647) (1,847)Debt Raised/(repaid) 2,070 6,534 999 1,064Equity Raised/(Repaid) - - - - Dividends Paid (119.2) (132.9) (155.2) (130.8)Net Cash Interest (110.1) (293.0) (265.3) (346.4)Other Financing Cashflow 1,896 (5,433) (6) (2,422)Cash Flow From Financing 3,736 675 572 (1,835)Total Cash Generated (647) (380) 700 (2,732)Change In Net Cash (2,716) (6,914) (299) (3,796)Free Cashflow To Equity (2,423) 5,186 862 (180)
Key Ratios
Mar-12A Mar-13F Mar-14F Mar-15FRevenue Growth 1% 173% 5% 3%Operating EBITDA Growth 343% (24%) 30% 11%Operating EBITDA Margin 24.4% 6.8% 8.4% 9.0%Net Cash Per Share (RM) 4.89 1.96 2.26 0.68BVPS (RM) 3.69 5.76 5.84 5.89Gross Interest Cover 9.57 2.71 3.96 3.40Tax Rate 9.7% 19.6% 27.0% 20.8%Net Dividend Payout Ratio 6.7% 14.6% 13.1% 13.7%Accounts Receivables Days 162.0 69.7 85.9 88.9Inventory Days 79.57 51.19 58.81 52.19Accounts Payables Days 43.07 35.49 60.15 64.40ROIC (%) (29.4%) (74.5%) (41.7%) (48.5%)ROCE (%) 17.0% 6.9% 7.2% 7.6%
Key Drivers
Mar-12A Mar-13F Mar-14F Mar-15FRev. growth (%, main biz.) 0.1% 257.9% 6.2% 2.7%EBITDA mgns (%, main biz.) 6.3% 8.5% 9.0% 10.2%Rev. as % of total (main biz.) 59.0% 77.4% 78.1% 78.1%EBITDA as % of total (main biz.) 32.2% 65.2% 59.9% 71.9%Rev. growth (%, 2ndary biz.) 6.7% 6.7% 6.8% 6.8%EBITDA mgns (%, 2ndary biz.) 43.7% 27.7% 24.0% 25.6%Rev. as % of total (2ndary biz.) 19.0% 7.4% 7.5% 7.8%EBITDA as % of total (2ndary biz.) 43.7% 27.7% 24.0% 25.6%Rev. growth (%, tertiary biz.) N/A N/A N/A N/AEBITDA mgns (%, tertiary biz.) N/A N/A N/A N/ARev.as % of total (tertiary biz.) N/A N/A N/A N/AEBITDA as % of total (tertiary biz.) N/A N/A N/A N/A
SOURCE: CIMB, COMPANY REPORTS

Autos MALAYSIA June 26, 2012
IMPORTANT DISCLOSURES. INCLUDING ANY REQUIRED RESEARCH CERTIFICATIONS, ARE PROVIDED AT THE END OF THIS REPORT. Designed by Eight, Powered by EFA
In the slow lane Tan Chong’s new models such as the Navara Single Cab and NV200 Vanette have failed to give Nissan’s sales the much-needed boost. In the absence of major model launches until year-end, Tan Chong’s market share could be under pressure over the next few months. We maintain our Underperform call and SOP-based target price. Potential derating catalysts include 1) market share loss and 2) margin compression from a stronger US$ and intensifying competition. We like DRB and UMW for exposure to the auto sector.
Market share could be under pressure Among the top three Japanese brands, i.e. Toyota, Honda and Nissan, Toyota is the most active in terms of new model launches. Honda is playing catch-up now that production has restarted. It has launched the Honda City facelift. The next major model launch will be the all-new Honda Civic. Meanwhile, Tan Chong has launched the Navara Single Cab and NV200 Vanette. But going by the latest monthly sales statistics, these new models have failed to give Nissan’s sales the much-needed boost, unlike its peers’ new model launches. We are not expecting any major model launches until the B-segment model is launched at the end of the
year. As such, Tan Chong’s market share could be under pressure.
Foothold in Indochina Tan Chong’s planting of a foothold in Indochina is a good diversification strategy though earnings are unlikely to be meaningful in the near term. Nissan Vietnam Ltd (NVL) registered an operating loss before depreciation and amortisation of RM6m for FY11. We expect NVL to remain in the red this year. That said, Tan Chong’s entry into Vietnam is positive in the long term. Vietnam is a promising market with 86m people but a low penetration rate of only eight vehicles per 1,000 persons.
Lack of near-term catalysts Despite the absence of meaningful corporate developments, Tan Chong’s weak quarterly results and its tepid monthly sales performance, its share price has done surprisingly well, rising 11% YTD vs. 4% for the KLCI. In view of the lack of rerating catalysts, we retain our Underperform call on the stock.
CIMB Analyst
Loke Wei Wern
T (60) 3 20849946 E [email protected]
Tan Chong Motor Holdings TCM MK / TNCS.KL Current RM4.50 SHORT TERM (3 MTH) LONG TERM
Market Cap Avg Daily Turnover Free Float Target RM4.20
US$946.4m US$0.24m 49.6% Previous Target RM4.20 RM3,024m RM0.74m 672.0 m shares Up/downside -6.7%
Convicti
3.94.14.34.54.74.95.15.3
86909599103107112116
Price Close Relative to FBMKLCI (RHS)
Source: Bloomberg
1234
Jun-11 Sep-11 Dec-11 Mar-12
Vol m
Financial Summary Dec-10A Dec-11A Dec-12F Dec-13F Dec-14F
Revenue (RMm) 3,505 3,854 4,154 5,126 5,405Operating EBITDA (RMm) 406.8 386.3 376.4 525.9 590.7Net Profit (RMm) 244.2 216.1 207.0 322.1 366.2Core EPS (RM) 0.36 0.32 0.31 0.48 0.55Core EPS Growth 59.3% (11.5%) (4.3%) 55.6% 13.7%FD Core P/E (x) 12.38 13.99 14.61 9.39 8.26DPS (RM) 0.09 0.09 0.10 0.11 0.11Dividend Yield 2.00% 2.00% 2.17% 2.33% 2.50%EV/EBITDA (x) 8.05 8.51 8.75 6.61 5.73P/FCFE (x) 37.41 17.80 49.32 NA 15.36Net Gearing 15.5% 14.8% 14.1% 20.6% 14.7%P/BV (x) 1.80 1.64 1.53 1.35 1.20Recurring ROE 15.3% 12.3% 10.8% 15.3% 15.4%% Change In Core EPS Estimates 0.000% 0.000% 0.000%CIMB/consensus EPS (x) 0.78 0.99 1.03
4.50
4.20
4.04 5.08
Target
52-week share price range
Current
SOURCE: CIMB, COMPANY REPORTS
Share price info Share price perf. (%) 1M 3M 12M
Relative -3.4 -1.1 -6.4
Absolute 0 0 -3.9
Major shareholders % held
Tan Chong Consolidated 44.8
Nissan Motor Corp 5.6
Employees Provident Fund 7.2

Tan Chong Motor Holdings June 26, 2012
38
Profit & Loss
(RMm) Dec-11A Dec-12F Dec-13F Dec-14FRevenue 3,854 4,154 5,126 5,405Cost Of Sales (2,914) (3,150) (3,927) (4,100)Gross Profit 940 1,003 1,199 1,305Total Operating Costs (622.5) (698.6) (752.7) (805.4)Operating Profit 317.9 304.4 446.5 499.6Operating EBITDA 386.3 376.4 525.9 590.7Depreciation And Amortisation (68.41) (71.91) (79.44) (91.05)Operating EBIT 317.9 304.4 446.5 499.6Net Interest Income (13.84) (10.79) (9.98) (13.22)Exchange Gains - - - - Other Income - - - - Associates' Profit 0.97 0.97 0.97 0.97Profit Before Tax (pre-EI) 305.0 294.6 437.5 487.4Exceptional Items - - - - Pre-tax Profit 305.0 294.6 437.5 487.4Taxation (89.6) (88.4) (109.4) (121.8)Profit After Tax 215.4 206.2 328.1 365.5Minority Interests 0.72 0.72 (6.03) 0.72Net Profit 216.1 207.0 322.1 366.2Recurring Net Profit 216.1 207.0 322.1 366.2
Balance Sheet
(RMm) Dec-11A Dec-12F Dec-13F Dec-14FFixed Assets 696.3 724.4 845.0 953.9Intangible Assets - - - - Other Long Term Assets 457.7 457.7 458.7 459.7Total Non-current Assets 1,154 1,182 1,304 1,414Total Cash And Equivalents 526.8 544.9 390.4 508.8Inventories 960 1,029 1,272 1,349Accounts Receivable 396.9 539.1 677.5 727.8Other Current Assets - - - - Total Current Assets 1,884 2,113 2,340 2,586Trade Creditors 325.6 388.6 479.6 505.7Short-term Debt 520.0 546.0 573.3 602.0Other Current Liabilities 5.76 26.87 26.52 32.81Total Current Liabilities 851 961 1,079 1,140Total Long-term Debt 280.0 280.0 280.0 280.0Other Liabilities 57.13 57.13 57.13 57.13Deferred Tax - - - - Total Non-current Liabilities 337.1 337.1 337.1 337.1Shareholders' Equity 1,841 1,982 2,234 2,524Minority Interests 8.31 8.31 8.31 8.31Preferred Shareholders FundsTotal Equity 1,849 1,991 2,242 2,533
Cash Flow
(RMm) Dec-11A Dec-12F Dec-13F Dec-14FPre-tax Profit 305.0 294.6 437.5 487.4Depreciation And Non-cash Adj. 81.3 81.7 88.4 103.3Change In Working Capital 25.5 (148.2) (290.7) (101.4)Tax Paid (91.7) (89.6) (88.4) (109.4)Other Operating Cashflow (193.8) (3.0) (33.3) (11.5)Cashflow From Operations 126.4 135.6 113.5 368.4Capex (176.2) (100.0) (200.0) (200.0)Disposals Of FAs/subsidiaries - - - - Acq. Of Subsidiaries/investments - - - - Other Investing Cashflow 126.3 (0.3) (0.3) (0.3)Cash Flow From Investing (50.0) (100.3) (200.3) (200.3)Debt Raised/(repaid) 93.48 26.00 27.30 28.67Equity Raised/(Repaid) - - - - Dividends Paid (35.28) (60.48) (65.52) (70.56)Net Cash Interest - - - - Other Financing Cashflow 32.81 17.31 (29.58) (7.81)Cash Flow From Financing 91.00 (17.17) (67.80) (49.70)Total Cash Generated 167.4 18.1 (154.6) 118.4Change In Net Cash 73.9 (7.9) (181.9) 89.8Free Cashflow To Equity 169.9 61.3 (59.5) 196.8
Key Ratios
Dec-11A Dec-12F Dec-13F Dec-14FRevenue Growth 10.0% 7.8% 23.4% 5.4%Operating EBITDA Growth (5.0%) (2.6%) 39.7% 12.3%Operating EBITDA Margin 10.0% 9.1% 10.3% 10.9%Net Cash Per Share (RM) (0.41) (0.42) (0.69) (0.56)BVPS (RM) 2.74 2.95 3.32 3.76Gross Interest Cover 12.76 11.20 15.91 17.23Tax Rate 29.4% 30.0% 25.0% 25.0%Net Dividend Payout Ratio 28.0% 31.7% 21.9% 20.6%Accounts Receivables Days 34.82 41.24 43.31 47.45Inventory Days 123.1 115.5 107.0 116.7Accounts Payables Days 38.37 41.48 40.35 43.86ROIC (%) 11.3% 10.4% 14.3% 14.2%ROCE (%) 13.0% 11.7% 15.7% 15.8%
Key Drivers
Dec-11A Dec-12F Dec-13F Dec-14FASP (% chg, main prod./serv.) N/A N/A N/A N/AUnit sales grth (%, main prod./serv.) -7.2% 10.2% 29.5% 2.8%Util. rate (%, main prod./serv.) 80.0% 80.0% 80.0% 80.0%ASP (% chg, 2ndary prod./serv.) N/A N/A N/A N/AUnit sales grth (%,2ndary prod/serv) N/A N/A N/A N/AUtil. rate (%, 2ndary prod/serv) N/A N/A N/A N/AASP (% chg, tertiary prod/serv) N/A N/A N/A N/AUnit sales grth (%,tertiary prod/serv) N/A N/A N/A N/AUtil. rate (%, tertiary prod/serv) N/A N/A N/A N/A
SOURCE: CIMB, COMPANY REPORTS

Autos MALAYSIA June 26, 2012
IMPORTANT DISCLOSURES. INCLUDING ANY REQUIRED RESEARCH CERTIFICATIONS, ARE PROVIDED AT THE END OF THIS REPORT. Designed by Eight, Powered by EFA
From strength to strength UMW straddles both the national and non-national segments, allowing it to capture potential vehicle upgrades spurred by rising disposable incomes. Also encouraging is its YTD vehicle sales, which have trumped its two major Japanese peers. We maintain our Outperform call and SOP-based target price of RM9.55. Potential rerating catalysts include 1) a stronger-than-expected recovery in O&G earnings and 2) investors’ flight to high-yield stocks.
Secured by two of the strongest franchises UMW has two of the strongest vehicle franchises under its belt, i.e. Perodua and Toyota, both market leaders in their own segments (national and non-national) in Malaysia. Both look set to retain their leadership positions this year. Our optimism over Toyota stems from the strong momentum for its sales so far, which trump its two major Japanese peers. For Perodua, its sales will continue to be supported by the success of the new Myvi, which is still the country’s bestselling model.
We are also positive on the hybrid models under UMW Toyota’s stable, i.e. the Prius C, Prius and Lexus CT200h. As the Malaysian government steps up the development of the green industry in
the country, more eco-friendly incentives can be expected, which will ultimately benefit first movers like UMW Toyota.
Time for O&G division to play catch-up The O&G division rebounded from a RM45m pretax loss in 4Q11 to a RM54m pretax profit in 1Q12. We believe that this division has bottomed and its performance should improve on the back of higher day rates for Naga 3 (from Apr 12) and stronger contribution from associates such as USTPL and Zhongyou BSS. UMW’s O&G division should also be an indirect beneficiary of the various O&G projects under the Economic Transformation Programme (ETP).
Support from good yields UMW’s share price has done very well since our upgrade, outperforming the KLCI by 20%. UMW’s good yields should provide support to its share price.
CIMB Analyst
Loke Wei Wern
T (60) 3 20849946 E [email protected]
UMW Holdings UMWH MK / UMWS.KL Current RM9.02 SHORT TERM (3 MTH) LONG TERM
Market Cap Avg Daily Turnover Free Float Target RM9.55
US$3,298m US$9.19m 37.3% Previous Target RM9.55 RM10,538m RM28.58m 1,168 m shares Up/downside 5.9%
Convicti
6.06.57.07.58.08.59.09.5
9196101106111116121126
Price Close Relative to FBMKLCI (RHS)
Source: Bloomberg
2468
10
Jun-11 Sep-11 Dec-11 Mar-12
Vol m
Financial Summary Dec-10A Dec-11A Dec-12F Dec-13F Dec-14F
Revenue (RMm) 12,820 13,530 14,437 14,967 15,522Operating EBITDA (RMm) 1,491 1,580 1,824 1,931 2,027Net Profit (RMm) 526.9 503.0 834.8 872.4 926.6Core EPS (RM) 0.55 0.57 0.72 0.76 0.80Core EPS Growth 58.1% 4.1% 27.2% 4.5% 6.2%FD Core P/E (x) 16.28 15.73 12.46 11.93 11.23DPS (RM) 0.30 0.31 0.43 0.45 0.49Dividend Yield 3.33% 3.46% 4.81% 5.03% 5.43%EV/EBITDA (x) 8.02 7.65 6.68 6.39 6.14P/FCFE (x) 12.52 20.32 9.26 14.52 13.03Net Gearing 9.27% 6.45% 1.93% (1.08%) (4.32%)P/BV (x) 2.58 2.44 2.26 2.10 1.96Recurring ROE 15.9% 15.8% 18.8% 18.3% 18.1%% Change In Core EPS Estimates 0.000% 0.000% 0.000%CIMB/consensus EPS (x) 1.02 0.95 0.92
9.02
9.55
6.34 9.02
Target
52-week share price range
Current
SOURCE: CIMB, COMPANY REPORTS
Share price info Share price perf. (%) 1M 3M 12M
Relative 12.4 23.7 23.1
Absolute 15.8 24.8 25.6
Major shareholders % held
Permodalan Nasional Bhd 53.0
EPF 9.7
BBH and Co. Boston 2.9

UMW Holdings June 26, 2012
40
Profit & Loss
(RMm) Dec-11A Dec-12F Dec-13F Dec-14FRevenue 13,530 14,437 14,967 15,522Cost Of Sales (10,348) (11,042) (11,447) (11,871)Gross Profit 3,182 3,396 3,520 3,651Total Operating Costs (1,902) (1,898) (1,950) (2,020)Operating Profit 1,280 1,497 1,570 1,630Operating EBITDA 1,580 1,824 1,931 2,027Depreciation And Amortisation (300.1) (326.7) (360.7) (396.7)Operating EBIT 1,280 1,497 1,570 1,630Net Interest Income (24.55) (19.13) (12.05) (5.64)Exchange Gains - - - - Other Income - - - - Associates' Profit 125.7 192.5 234.2 266.9Profit Before Tax (pre-EI) 1,381 1,671 1,792 1,892Exceptional Items - - - - Pre-tax Profit 1,381 1,671 1,792 1,892Taxation (418.1) (384.3) (448.0) (473.2)Profit After Tax 963 1,287 1,344 1,419Minority Interests (460.2) (451.8) (471.8) (492.0)Net Profit 503.0 834.8 872.4 926.6Recurring Net Profit 656.3 834.8 872.4 926.6
Balance Sheet
(RMm) Dec-11A Dec-12F Dec-13F Dec-14FFixed Assets 3,079 3,379 3,752 4,091Intangible Assets 204.2 204.2 204.2 204.2Other Long Term Assets 1,892 1,988 2,085 2,181Total Non-current Assets 5,175 5,571 6,041 6,477Total Cash And Equivalents 2,209 2,139 2,110 2,164Inventories 1,474 1,572 1,630 1,690Accounts Receivable 893.5 916.8 950.5 985.7Other Current Assets 725.6 567.1 579.3 592.1Total Current Assets 5,302 5,196 5,270 5,433Trade Creditors 1,132 1,088 1,128 1,170Short-term Debt 658.2 540.6 487.5 439.8Other Current Liabilities 1,081 1,051 1,078 1,106Total Current Liabilities 2,872 2,680 2,693 2,715Total Long-term Debt 1,910 1,719 1,547 1,393Other Liabilities 78.56 78.56 78.56 78.56Deferred Tax 32.00 32.00 32.00 32.00Total Non-current Liabilities 2,021 1,830 1,658 1,503Shareholders' Equity 4,263 4,597 4,946 5,308Minority Interests 1,321 1,660 2,014 2,383Preferred Shareholders FundsTotal Equity 5,584 6,257 6,960 7,691
Cash Flow
(RMm) Dec-11A Dec-12F Dec-13F Dec-14FPre-tax Profit 1,381 1,671 1,792 1,892Depreciation And Non-cash Adj. 199.0 153.3 138.5 135.4Change In Working Capital (76.1) (36.8) (37.0) (38.7)Tax Paid (340.4) (418.1) (384.3) (448.0)Other Operating Cashflow 37.9 778.7 240.6 262.9Cashflow From Operations 1,202 2,148 1,750 1,803Capex (590.3) (600.0) (700.0) (700.0)Disposals Of FAs/subsidiaries - - - - Acq. Of Subsidiaries/investments (96.55) (96.55) (96.55) (96.55)Other Investing Cashflow 136.4 0.0 0.0 0.0Cash Flow From Investing (550.4) (696.6) (796.6) (796.6)Debt Raised/(repaid) (114.8) (308.7) (225.0) (202.5)Equity Raised/(Repaid) 0.0 0.0 0.0 0.0Dividends Paid (438.1) (500.9) (523.4) (556.5)Net Cash Interest (24.55) (19.13) (12.05) (5.64)Other Financing Cashflow (218.0) (140.8) (222.1) (188.9)Cash Flow From Financing (795.4) (969.5) (982.5) (953.6)Total Cash Generated (144.2) 482.0 (29.1) 53.1Change In Net Cash (29.4) 790.7 195.9 255.6Free Cashflow To Equity 512 1,124 716 799
Key Ratios
Dec-11A Dec-12F Dec-13F Dec-14FRevenue Growth 5.5% 6.7% 3.7% 3.7%Operating EBITDA Growth 6.0% 15.4% 5.8% 5.0%Operating EBITDA Margin 11.7% 12.6% 12.9% 13.1%Net Cash Per Share (RM) (0.31) (0.10) 0.07 0.29BVPS (RM) 3.70 3.99 4.29 4.60Gross Interest Cover 14.71 18.31 21.58 24.89Tax Rate 30.3% 23.0% 25.0% 25.0%Net Dividend Payout Ratio 71.5% 60.0% 60.0% 61.0%Accounts Receivables Days 23.03 22.95 22.77 22.77Inventory Days 50.62 50.49 51.05 51.04Accounts Payables Days 37.01 36.80 35.33 35.32ROIC (%) 13.4% 16.5% 16.1% 15.8%ROCE (%) 16.7% 18.7% 18.6% 18.3%
Key Drivers
Dec-11A Dec-12F Dec-13F Dec-14FASP (% chg, main prod./serv.) -0.7% 1.0% 0.0% 0.0%Unit sales grth (%, main prod./serv.) -1.4% 3.7% 4.4% 4.4%Util. rate (%, main prod./serv.) N/A N/A N/A N/AASP (% chg, 2ndary prod./serv.) N/A N/A N/A N/AUnit sales grth (%,2ndary prod/serv) N/A N/A N/A N/AUtil. rate (%, 2ndary prod/serv) N/A N/A N/A N/AASP (% chg, tertiary prod/serv) N/A N/A N/A N/AUnit sales grth (%,tertiary prod/serv) N/A N/A N/A N/AUtil. rate (%, tertiary prod/serv) N/A N/A N/A N/A
SOURCE: CIMB, COMPANY REPORTS

AUTOS June 26, 2012
41
DISCLAIMER This report is not directed to, or intended for distribution to or use by, any person or entity who is a citizen or resident of or located in any locality, state, country or other jurisdiction where such distribution, publication, availability or use would be contrary to law or regulation. By accepting this report, the recipient hereof represents and warrants that he is entitled to receive such report in accordance with the restrictions set forth below and agrees to be bound by the limitations contained herein (including the “Restrictions on Distributions” set out below). Any failure to comply with these limitations may constitute a violation of law. This publication is being supplied to you strictly on the basis that it will remain confidential. No part of this report may be (i) copied, photocopied, duplicated, stored or reproduced in any form by any means or (ii) redistributed or passed on, directly or indirectly, to any other person in whole or in part, for any purpose without the prior written consent of CIMB. CIMB, its affiliates and related companies, their directors, associates, connected parties and/or employees may own or have positions in securities of the company(ies) covered in this research report or any securities related thereto and may from time to time add to or dispose of, or may be materially interested in, any such securities. Further, CIMB, its affiliates and its related companies do and seek to do business with the company(ies) covered in this research report and may from time to time act as market maker or have assumed an underwriting commitment in securities of such company(ies), may sell them to or buy them from customers on a principal basis and may also perform or seek to perform significant investment banking, advisory or underwriting services for or relating to such company(ies) as well as solicit such investment, advisory or other services from any entity mentioned in this report. The views expressed in this report accurately reflect the personal views of the analyst(s) about the subject securities or issuers and no part of the compensation of the analyst(s) was, is, or will be directly or indirectly related to the inclusion of specific recommendations(s) or view(s) in this report. CIMB prohibits the analyst(s) who prepared this research report from receiving any compensation, incentive or bonus based on specific investment banking transactions or for providing a specific recommendation for, or view of, a particular company. However, the analyst(s) may receive compensation that is based on his/their coverage of company(ies) in the performance of his/their duties or the performance of his/their recommendations and the research personnel involved in the preparation of this report may also participate in the solicitation of the businesses as described above. In reviewing this research report, an investor should be aware that any or all of the foregoing, among other things, may give rise to real or potential conflicts of interest. Additional information is, subject to the duties of confidentiality, available on request. The term “CIMB” shall denote where applicable the relevant entity distributing the report in that particular jurisdiction where mentioned specifically below shall be a CIMB Group Sdn Bhd’s affiliates, subsidiaries and related companies. (i) As of June 25, 2012, CIMB has a proprietary position in the securities (which may include but not limited to shares, warrants, call warrants and/or any other derivatives) in the following company or companies covered or recommended in this report: (a) DRB-Hico| (ii) As of June 26, 2012, the analyst(s) who prepared this report, has / have an interest in the securities (which may include but not limited to shares, warrants, call warrants and/or any other derivatives) in the following company or companies covered or recommended in this report: (a) - | The information contained in this research report is prepared from data believed to be correct and reliable at the time of issue of this report. This report does not purport to contain all the information that a prospective investor may require. CIMB or any of its affiliates does not make any guarantee, representation or warranty, express or implied, as to the adequacy, accuracy, completeness, reliability or fairness of any such information and opinion contained in this report and accordingly, neither CIMB nor any of its affiliates nor its related persons shall be liable in any manner whatsoever for any consequences (including but not limited to any direct, indirect or consequential losses, loss of profits and damages) of any reliance thereon or usage thereof. This report is general in nature and has been prepared for information purposes only. It is intended for circulation amongst CIMB and its affiliates’ clients generally and does not have regard to the specific investment objectives, financial situation and the particular needs of any specific person who may receive this report. The information and opinions in this report are not and should not be construed or considered as an offer, recommendation or solicitation to buy or sell the subject securities, related investments or other financial instruments thereof. Investors are advised to make their own independent evaluation of the information contained in this research report, consider their own individual investment objectives, financial situation and particular needs and consult their own professional and financial advisers as to the legal, business, financial, tax and other aspects before participating in any transaction in respect of the securities of company(ies) covered in this research report. The securities of such company(ies) may not be eligible for sale in all jurisdictions or to all categories of investors. Australia: Despite anything in this report to the contrary, this research is provided in Australia by CIMB Research Pte. Ltd. (“CIMBR”) and CIMBR notifies each recipient and each recipient acknowledges that CIMBR is exempt from the requirement to hold an Australian financial services licence under the Corporations Act 2001 (Cwlth) in respect of financial services provided to the recipient. CIMBR is regulated by the Monetary Authority of Singapore under the laws of Singapore, which differ from Australian laws. This research is only available in Australia to persons who are “wholesale clients” (within the meaning of the Corporations Act 2001 (Cwlth)) and is supplied solely for the use of such wholesale clients and shall not be distributed or passed on to any other person. This research has been prepared without taking into account the objectives, financial situation or needs of the individual recipient. France: Only qualified investors within the meaning of French law shall have access to this report. This report shall not be considered as an offer to subscribe to, or used in connection with, any offer for subscription or sale or marketing or direct or indirect distribution of financial instruments and it is not intended as a solicitation for the purchase of any financial instrument. Hong Kong: This report is issued and distributed in Hong Kong by CIMB Securities (HK) Limited (“CHK”) which is licensed in Hong Kong by the Securities and Futures Commission for Type 1 (dealing in securities), Type 4 (advising on securities) and Type 6 (advising on corporate finance) activities. Any investors wishing to purchase or otherwise deal in the securities covered in this report should contact the Head of Sales at CIMB Securities (HK) Limited. The views and opinions in this research report are our own as of the date hereof and are subject to change. If the Financial Services and Markets Act of the United Kingdom or the rules of the Financial Services Authority apply to a recipient, our obligations owed to such recipient therein are unaffected. CHK has no obligation to update its opinion or the information in this research report. This publication is strictly confidential and is for private circulation only to clients of CHK. This publication is being supplied to you strictly on the basis that it will remain confidential. No part of this material may be (i) copied, photocopied, duplicated, stored or reproduced in any form by any means or (ii) redistributed or passed on, directly or indirectly, to any other person in whole or in part, for any purpose without the prior written consent of CHK. Unless permitted to do so by the securities laws of Hong Kong, no person may issue or have in its possession for the purposes of issue, whether in Hong Kong or elsewhere, any advertisement, invitation or document relating to the securities covered in this report, which is directed at, or the contents of which are likely to be accessed or read by, the public in Hong Kong (except if permitted to do so under the securities laws of Hong Kong). Indonesia: This report is issued and distributed by PT CIMB Securities Indonesia (“CIMBI”). The views and opinions in this research report are our own as of the date hereof and are subject to change. If the Financial Services and Markets Act of the United Kingdom or the rules of the Financial Services Authority apply to a recipient, our obligations owed to such recipient therein are unaffected. CIMBI has no obligation to update its opinion or the information in this research report. This publication is strictly confidential and is for private circulation only to clients of CIMBI. This publication is being supplied to you strictly on the basis that it will remain confidential. No part of this material may be (i) copied, photocopied, duplicated, stored or reproduced in any form by any means or (ii) redistributed or passed on, directly or indirectly, to any other person in whole or in part, for any purpose without the prior written consent of CIMBI. Neither this report nor any copy hereof may be distributed in Indonesia or to any Indonesian citizens wherever they are domiciled or to Indonesia residents except in compliance with applicable Indonesian capital market laws and regulations. Malaysia: This report is issued and distributed by CIMB Investment Bank Berhad (“CIMB”). The views and opinions in this research report are our own as of the date hereof and are subject to change. If the Financial Services and Markets Act of the United Kingdom or the rules of the Financial Services Authority apply to a recipient, our obligations owed to such recipient therein are unaffected. CIMB has no obligation to update its opinion or the information in this research report. This publication is strictly confidential and is for private circulation only to clients of CIMB. This publication is being supplied to you strictly on the basis that it will remain confidential. No part of this material may be (i) copied, photocopied, duplicated, stored or reproduced in any form by any means or (ii) redistributed or passed on, directly or indirectly, to any other person in whole or in part, for any purpose without the prior written consent of CIMB. New Zealand: In New Zealand, this report is for distribution only to persons whose principal business is the investment of money or who, in the course of, and for the purposes of their

AUTOS June 26, 2012
42
business, habitually invest money pursuant to Section 3(2)(a)(ii) of the Securities Act 1978.Singapore: This report is issued and distributed by CIMB Research Pte Ltd (“CIMBR”). Recipients of this report are to contact CIMBR in Singapore in respect of any matters arising from, or in connection with, this report. The views and opinions in this research report are our own as of the date hereof and are subject to change. If the Financial Services and Markets Act of the United Kingdom or the rules of the Financial Services Authority apply to a recipient, our obligations owed to such recipient therein are unaffected. CIMBR has no obligation to update its opinion or the information in this research report. This publication is strictly confidential and is for private circulation only. If the recipient of this research report is not an accredited investor, expert investor or institutional investor, CIMBR accepts legal responsibility for the contents of the report without any disclaimer limiting or otherwise curtailing such legal responsibility. This publication is being supplied to you strictly on the basis that it will remain confidential. No part of this material may be (i) copied, photocopied, duplicated, stored or reproduced in any form by any means or (ii) redistributed or passed on, directly or indirectly, to any other person in whole or in part, for any purpose without the prior written consent of CIMBR. As of June 25, 2012, CIMB Research Pte Ltd does not have a proprietary position in the recommended securities in this report.Sweden: This report contains only marketing information and has not been approved by the Swedish Financial Supervisory Authority. The distribution of this report is not an offer to sell to any person in Sweden or a solicitation to any person in Sweden to buy any instruments described herein and may not be forwarded to the public in Sweden. Taiwan: This research report is not an offer or marketing of foreign securities in Taiwan. The securities as referred to in this research report have not been and will not be registered with the Financial Supervisory Commission of the Republic of China pursuant to relevant securities laws and regulations and may not be offered or sold within the Republic of China through a public offering or in circumstances which constitutes an offer within the meaning of the Securities and Exchange Law of the Republic of China that requires a registration or approval of the Financial Supervisory Commission of the Republic of China. Thailand: This report is issued and distributed by CIMB Securities (Thailand) Company Limited (CIMBS). The views and opinions in this research report are our own as of the date hereof and are subject to change. If the Financial Services and Markets Act of the United Kingdom or the rules of the Financial Services Authority apply to a recipient, our obligations owed to such recipient therein are unaffected. CIMBS has no obligation to update its opinion or the information in this research report. This publication is strictly confidential and is for private circulation only to clients of CIMBS. This publication is being supplied to you strictly on the basis that it will remain confidential. No part of this material may be (i) copied, photocopied, duplicated, stored or reproduced in any form by any means or (ii) redistributed or passed on, directly or indirectly, to any other person in whole or in part, for any purpose without the prior written consent of CIMBS. Corporate Governance Report: The disclosure of the survey result of the Thai Institute of Directors Association (“IOD”) regarding corporate governance is made pursuant to the policy of the Office of the Securities and Exchange Commission. The survey of the IOD is based on the information of a company listed on the Stock Exchange of Thailand and the Market for Alternative Investment disclosed to the public and able to be accessed by a general public investor. The result, therefore, is from the perspective of a third party. It is not an evaluation of operation and is not based on inside information. The survey result is as of the date appearing in the Corporate Governance Report of Thai Listed Companies. As a result, the survey result may be changed after that date. CIMBS does not confirm nor certify the accuracy of such survey result. Score Range 90 – 100 80 – 89 70 – 79 Below 70 or No Survey Result Description Excellent Very Good Good N/A United Arab Emirates: The distributor of this report has not been approved or licensed by the UAE Central Bank or any other relevant licensing authorities or governmental agencies in the United Arab Emirates. This report is strictly private and confidential and has not been reviewed by, deposited or registered with UAE Central Bank or any other licensing authority or governmental agencies in the United Arab Emirates. This report is being issued outside the United Arab Emirates to a limited number of institutional investors and must not be provided to any person other than the original recipient and may not be reproduced or used for any other purpose. Further, the information contained in this report is not intended to lead to the sale of investments under any subscription agreement or the conclusion of any other contract of whatsoever nature within the territory of the United Arab Emirates. United Kingdom: This report is being distributed by CIMB Securities (UK) Limited only to, and is directed at selected persons on the basis that those persons are (a) persons falling within Article 19 of the Financial Services and Markets Act 2000 (Financial Promotions) Order 2005 (the “Order”) who have professional experience in investments of this type or (b) high net worth entities, and other persons to whom it may otherwise lawfully be communicated, falling within Article 49(1) of the Order, (all such persons together being referred to as “relevant persons”). A high net worth entity includes a body corporate which has (or is a member of a group which has) a called-up share capital or net assets of not less than (a) if it has (or is a subsidiary of an undertaking which has) more than 20 members, £500,000, (b) otherwise, £5 million, the trustee of a high value trust or an unincorporated association or partnership with assets of no less than £5 million. Directors, officers and employees of such entities are also included provided their responsibilities regarding those entities involve engaging in investment activity. Persons who do not have professional experience relating to investments should not rely on this document. United States: This research report is distributed in the United States of America by CIMB Securities (USA) Inc, a U.S.-registered broker-dealer and a related company of CIMB Research Pte Ltd solely to persons who qualify as "Major U.S. Institutional Investors" as defined in Rule 15a-6 under the Securities and Exchange Act of 1934. This communication is only for Institutional Investors and investment professionals whose ordinary business activities involve investing in shares, bonds and associated securities and/or derivative securities and who have professional experience in such investments. Any person who is not an Institutional Investor must not rely on this communication. However, the delivery of this research report to any person in the United States of America shall not be deemed a recommendation to effect any transactions in the securities discussed herein or an endorsement of any opinion expressed herein. For further information or to place an order in any of the above-mentioned securities please contact a registered representative of CIMB Securities (USA) Inc. Other jurisdictions: In any other jurisdictions, except if otherwise restricted by laws or regulations, this report is only for distribution to professional, institutional or sophisticated investors as defined in the laws and regulations of such jurisdictions.
Recommendation Framework #1 *
Stock Sector OUTPERFORM: The stock's total return is expected to exceed a relevant benchmark's total return by 5% or more over the next 12 months.
OVERWEIGHT: The industry, as defined by the analyst's coverage universe, is expected to outperform the relevant primary market index over the next 12 months.
NEUTRAL: The stock's total return is expected to be within +/-5% of a relevant benchmark's total return.
NEUTRAL: The industry, as defined by the analyst's coverage universe, is expected to perform in line with the relevant primary market index over the next 12 months.
UNDERPERFORM: The stock's total return is expected to be below a relevant benchmark's total return by 5% or more over the next 12 months.
UNDERWEIGHT: The industry, as defined by the analyst's coverage universe, is expected to underperform the relevant primary market index over the next 12 months.
TRADING BUY: The stock's total return is expected to exceed a relevant benchmark's total return by 5% or more over the next 3 months.
TRADING BUY: The industry, as defined by the analyst's coverage universe, is expected to outperform the relevant primary market index over the next 3 months.
TRADING SELL: The stock's total return is expected to be below a relevant benchmark's total return by 5% or more over the next 3 months.
TRADING SELL: The industry, as defined by the analyst's coverage universe, is expected to underperform the relevant primary market index over the next 3 months.
* This framework only applies to stocks listed on the Singapore Stock Exchange, Bursa Malaysia, Stock Exchange of Thailand and Jakarta Stock Exchange. Occasionally, it is permitted for the total expected returns to be temporarily outside the prescribed ranges due to extreme market volatility or other justifiable company or industry-specific reasons. CIMB Research Pte Ltd (Co. Reg. No. 198701620M)

AUTOS June 26, 2012
43
Recommendation Framework #2 **
Stock Sector OUTPERFORM: Expected positive total returns of 15% or more over the next 12 months.
OVERWEIGHT: The industry, as defined by the analyst's coverage universe, has a high number of stocks that are expected to have total returns of +15% or better over the next 12 months.
NEUTRAL: Expected total returns of between -15% and +15% over the next 12 months.
NEUTRAL: The industry, as defined by the analyst's coverage universe, has either (i) an equal number of stocks that are expected to have total returns of +15% (or better) or -15% (or worse), or (ii) stocks that are predominantly expected to have total returns that will range from +15% to -15%; both over the next 12 months.
UNDERPERFORM: Expected negative total returns of 15% or more over the next 12 months.
UNDERWEIGHT: The industry, as defined by the analyst's coverage universe, has a high number of stocks that are expected to have total returns of -15% or worse over the next 12 months.
TRADING BUY: Expected positive total returns of 15% or more over the next 3 months.
TRADING BUY: The industry, as defined by the analyst's coverage universe, has a high number of stocks that are expected to have total returns of +15% or better over the next 3 months.
TRADING SELL: Expected negative total returns of 15% or more over the next 3 months.
TRADING SELL: The industry, as defined by the analyst's coverage universe, has a high number of stocks that are expected to have total returns of -15% or worse over the next 3 months.
** This framework only applies to stocks listed on the Hong Kong Stock Exchange and China listings on the Singapore Stock Exchange. Occasionally, it is permitted for the total expected returns to be temporarily outside the prescribed ranges due to extreme market volatility or other justifiable company or industry-specific reasons.
Corporate Governance Report of Thai Listed Companies (CGR). CG Rating by the Thai Institute of Directors Association (IOD) in 2011. ADVANC - Excellent, AMATA - Very Good, AOT - Excellent, AP - Very Good, BANPU - Excellent , BAY - Excellent , BBL - Excellent, BCP - Excellent, BEC - Very Good, BECL - Very Good, BGH - not available, BH - Very Good, BIGC - Very Good, BTS - Very Good, CCET - Good, CK - Very Good, CPALL - Very Good, CPF - Very Good, CPN - Excellent, DELTA - Very Good, DTAC - Very Good, GLOBAL - not available, GLOW - Very Good, HANA - Very Good, HEMRAJ - Excellent, HMPRO - Very Good, ITD - Good, IVL - Very Good, KBANK - Excellent, KTB - Excellent, LH - Very Good, LPN - Excellent, MAJOR - Very Good, MCOT - Excellent, MINT - Very Good, PS - Excellent, PSL - Excellent, PTT - Excellent, PTTGC - not available, PTTEP - Excellent, QH - Excellent, RATCH - Excellent, ROBINS - Excellent, SCB - Excellent, SCC - Excellent, SCCC - Very Good, SIRI - Very Good, SPALI - Very Good, STA - Very Good, STEC - Very Good, TCAP - Very Good, THAI - Very Good, TISCO - Excellent, TMB - Excellent, TOP - Excellent, TRUE - Very Good, TUF - Very Good:

AUTOS June 26, 2012
44
Asia-Pacific Locations:
CIMB Investment Bank Bhd (18417-M) (A Participating Organisation of Bursa Malaysia Securities Bhd) 10th Floor, Bangunan CIMB Jalan Semantan Damansara Heights 50490 Kuala Lumpur, Malaysia T: +60 (3) 2084 8888 F: +60 (3) 2084 8899
CIMB Securities (S) Pte Ltd(198701621D) 50 Raffles Place #19-00 Singapore Land Tower ((S048623) Singapore T: +65 6225-1228 F: +65 6224-6906
PT CIMB Securities Indonesia(01.353.099.3-054.000) The Indonesia Stock Exchange Building Tower II, 20th Floor Jl. Jend. Sudirman, Kav. 52-53 Jakarta 12190 Indonesia T: +62 (21) 515-1330 F: +62 (21) 515-1335
CIMB Securities (HK) Ltd (290697) Units 7706-08, Level 77 International Commerce Centre 1 Austin Road West Kowloon Hong Kong T: +852 2868-0380 F: +852 2537-1928
CIMB Securities (Thailand) Co. Ltd.(0105542081800) 44 CIMB, Thai Bank Building 24-25th Floor, Soi Langsuan Lumpini, Patumwan, Bangkok 10330 Thailand T: +66 (2) 657-9000 F: +66 (2) 657-9111
CIMB in Association with SB Equities, Inc. Security Bank Centre, 18th Flr. 6776 Ayala Avenue, Makati City Philippines 0719
CIMB Private Limited Level 33, West Tower World Trade Center Echelon Square Colombo 01
CIMB Shanghai Rep Office Unit 802 AZIA Center 1233 Lujiazui Ring Road Pudong New District Shanghai 200120 China T: +862161940212 / +862161940218
International Locations:
CIMB Securities (UK) Ltd (2719607) 27 Knightsbridge London, SW1X 7YB United Kingdom T: +44 (20) 7201-2199 F: +44 (20) 7201-2191

AUTOS June 26, 2012
45