automated trading system using technical analysissystem+report+sanjeewa...an automated trading...
TRANSCRIPT

Automated Trading System using Technical Analysis
A dissertation submitted in partial fulfilment of the requirements for the MSc in Advanced Information Systems
By PRD Sanjeewa Jayathilake
Department of Computer Science and Information Systems Birkbeck College, University of London
September 2012

Automated Trading System
2
Academic declaration This report is substantially the result of my own work except where explicitly indicated in the text. I give my permission for it to be submitted to the JISC Plagiarism Detection Service. I have read and understood the sections on plagiarism in the Programme booklet and the School’s website.

Automated Trading System
3
Acknowledgment I would like to thank my supervisor Dr. Oded Lachish for the continuous help and guidance throughout this project.

Automated Trading System
4
Abstract An automated trading system is a computer system which carries out trading according to pre-defined set of rules called “Trading Strategy” on behalf of investors. It accounts for majority of the transactions in all major stock markets around the world. Automated trading is the popular option among institutional investors like pension funds, insurance companies who are called buy side traders since their interest is to buy shares as a long term investment. At the same time it is becoming more popular among sell side traders who are basically trying to make profit by selling shares of companies with falling share prices. Automated trading is better than trading by human in many ways. Better in money management, not emotional in the trading process, quick to react to the changes in the market and ability to carry out high number of transactions in a short period of time are some of the major advantages. This project is an implementation of automated share trading system by simulating the trading. It analyses both current and historic market data from online data sources to make trading decisions. The system demonstrates the usage of a trading strategy to perform buy and sell transactions or hold existing shares depending on the result of the real time analysis for each company. Trading transactions are performed using virtual money which is loaded onto each investor’s account. Investor’s account in the trading system is called Portfolio. The registered users can create and update their portfolio. In addition to simulating trading, the system also provides some other functionality including user authentication based security, personalized user account management, user portfolio management and presentation of current and historical data in the form of reports and graphs. The system is a web based application while trading process and synchronizing data with sources are executed as scheduled and automated processes in the background. System architecture is designed as “n-tier” application comprising presentation tier, middle tier and data access tier. It uses number of design patterns which are discussed in the system architecture chapter. It is a Multi-Threaded application which means it runs multiple parallel processes at the same time. This is essential to cope with high number of trading transactions. The report also includes background information required for understanding all the financial concepts used here.

Automated Trading System
5
Table of Contents
Contents Table of Contents .................................................................................................................................... 5
1 Introduction .......................................................................................................................................... 9
1.1 History .......................................................................................................................................... 9
1.2 The Project .................................................................................................................................... 9
1.3 Problem ....................................................................................................................................... 10
1.4 Project Scope .............................................................................................................................. 10
1.4.1 Technical Analysis ................................................................................................................ 10
1.4.2 London Stock Exchange (LSE) ............................................................................................... 11
1.4.3 FTSE 100 companies ........................................................................................................... 11
1.5 Historical data ............................................................................................................................. 12
1.6 Currency ...................................................................................................................................... 12
2 Automated Trading Background ........................................................................................................ 13
2.1 Trading system ............................................................................................................................ 13
2.2 Technical Analysis ...................................................................................................................... 13
2.3 Possible Transactions .................................................................................................................. 14
2.3.1 Selling short ......................................................................................................................... 14
2.3.2 Buying Share ........................................................................................................................ 14
2.4 Risk Control ................................................................................................................................ 14
2.5 Portfolio ...................................................................................................................................... 15
2.6 Moving Average ......................................................................................................................... 15
2.7 Trading signals ............................................................................................................................ 15
2.7.1 Buy Long ............................................................................................................................. 15
2.7.2 Sell short .............................................................................................................................. 15
2.7.3 Hold shares ........................................................................................................................... 15
2.8 Trading strategy .......................................................................................................................... 16
3 System Overview – System Analysis with UML .............................................................................. 18
3.1 Context Diagram – High Level overview ..................................................................................... 18
3.2 Trading manager ......................................................................................................................... 18
3.2.1 UML for Trading Manager .................................................................................................... 19
3.3 Investor Portfolio Management.................................................................................................. 20
3.3.1 UML for Portfolio Management........................................................................................... 21

Automated Trading System
6
3.2 Financial Data Consumer & Synchroniser ............................................................................ 22
3.2.1 UML for Data Consumer ............................................................................................... 23
3.4 Data Analyser and Presentation ................................................................................................. 24
4 User Interfaces ................................................................................................................................... 27
4.1 Information presentation ............................................................................................................. 27
4.1.1 Latest share prices ............................................................................................................... 27
4.1.2 Historical Price Analyser....................................................................................................... 28
4.2 Trading Manager ......................................................................................................................... 28
4.3 Portfolio Manager ....................................................................................................................... 29
4.4 User Management ....................................................................................................................... 30
4.4.1 New user Registration .......................................................................................................... 30
4.4.2 My Dashboard ...................................................................................................................... 31
4.4. 3 User Authentication and Authorization .............................................................................. 32
5 System Architecture ...................................................................................................................... 36
5.1 Application Architecture ............................................................................................................. 36
5.1.1 Data Access Tier .................................................................................................................. 38
5.1.2 Middle Tier (Business Logic) .............................................................................................. 38
5.1.3 Presentation Tier .................................................................................................................. 38
5.1.4 Database ............................................................................................................................... 38
5.2 Design Patterns ........................................................................................................................... 38
5.2.1 Factory Method Pattern ................................................................................................. 38
5.2.2 Data Transfer Objects (DTO) .............................................................................................. 38
5.2.3 Data Access Object (DAO) .................................................................................................. 39
5.2.4 Thread pool pattern (Replicated workers) ........................................................................... 39
5.3 Low Level System Design ............................................................................................................ 39
6 Implementation .................................................................................................................................. 41
6.1 Methodology ............................................................................................................................... 41
6.1.1 Agile ..................................................................................................................................... 41
6.1.2 Test Driven development (TDD) ......................................................................................... 41
6.2 Technologies used ....................................................................................................................... 42
6.3 Tools Used .................................................................................................................................. 44
6.3. 1 NetBeans ............................................................................................................................. 44
6.3.2 Apache Ant .......................................................................................................................... 44
6.3.3 Microsoft Visio .................................................................................................................... 44

Automated Trading System
7
6.3.4 Google Drive ......................................................................................................................... 44
6.4 Development challenges ....................................................................................................... 44
6.4.1 Handling of high number of trading transactions ......................................................... 44
6.4.2 Synchronizing the system with data source ................................................................. 45
6.5 Implementation Details ........................................................................................................ 45
6.5.1 Trading Manager .................................................................................................................. 45
6.5.2 User Management ................................................................................................................ 46
6.5.3 Financial Data Consumer ..................................................................................................... 46
7 Testing ............................................................................................................................................... 48
7.1 Unit Testing ................................................................................................................................ 48
7.1.1 Trading ................................................................................................................................. 48
7.1.2 User management ................................................................................................................ 49
7.1.2 Portfolio management ......................................................................................................... 50
7.2 Integrated System Testing ........................................................................................................... 51
Summary ............................................................................................................................................... 53
Conclusion ......................................................................................................................................... 53
Enhancements & Future works ......................................................................................................... 53
References ............................................................................................................................................. 54
Books ................................................................................................................................................ 54
Web ................................................................................................................................................... 54
Appendix A ........................................................................................................................................... 55
A.1 ER Diagram................................................................................................................................ 55
A.2 List of FTSE 100 Companies ........................................................................................................ 55
A.3 Full list of Yahoo finance parameters ........................................................................................ 58
Appendix B - Source Code ................................................................................................................... 59
B.1 Java Code .................................................................................................................................... 59
B.1.1.1 Service classes ................................................................................................................... 59
B.1.2 DAO Classes ......................................................................................................................... 74
B.1.3 Factory classes ......................................................................................................................... 94
B.1.4 Utility Classes ....................................................................................................................... 96
B.1.5 Servlet Classes .................................................................................................................... 103
B.2 JSP Code .................................................................................................................................. 106
B.3 Unit Testing Code ...................................................................................................................... 108

Automated Trading System
8
List of Tables & Figures Figure 2-1 FTSE 100 Index for this year ................................................................................................. 11 Figure 2--0-1 Buy and Sell points .......................................................................................................... 16 Table 2-1 Trading Strategy .................................................................................................................... 16 Figure 3-0-1 High level overview of the system .................................................................................... 18 Figure 3-2 Trading Manager Use Case Diagram .................................................................................... 19 Figure 5-3 Trading Manager Sequence Diagram .................................................................................. 20 Figure 3-4 Portfolio Management Use Case Diagram .......................................................................... 21 Figure 3-5 Portfolio Management Sequence Diagram ......................................................................... 22 Figure 3-6 Use Case Diagram for Data Consumer ................................................................................. 23 Figure 3-7 Data Consumer Sequence Diagram ..................................................................................... 24 Figure 3-8 Data Presenter Use Case Diagram ....................................................................................... 25 Figure 3-9 Data Presenter Sequence Diagram ...................................................................................... 26 Figure 4-1 Latest Share Prices ............................................................................................................... 27 Figure 4--2 Historical share prices with moving average ...................................................................... 28 Figure 4-3 My Trading Report ............................................................................................................... 29 Figure 4-4 Create / Edit Portfolio screen .............................................................................................. 30 Figure 4-5 new user registration ........................................................................................................... 31 Figure 4-6 My Dashboard ...................................................................................................................... 31 Figure 4-7 Login to the system .............................................................................................................. 32 Figure 4-8 Authentication Failure ......................................................................................................... 33 Figure 4-9 My Dashboard ...................................................................................................................... 33 Figure 4-10 User Logout ........................................................................................................................ 34 Figure 4-11 Change password ............................................................................................................... 34 Figure 4-12 My Dashboard page after a successful password change ................................................. 35 Figure 5--5-1 System Architecture ........................................................................................................ 37 Figure 5-2 UML Class diagram for Trading Manager ............................................................................ 40 Table 6-1 Iteration Details of Development Cycle ................................................................................ 41 Figure 6-0-1 Test Driven development Cycle ........................................................................................ 42 Table 6-2 Yahoo Finance Parameters used ........................................................................................... 47 Figure 7-1 Result of Test Moving Average ............................................................................................ 48 Figure 7-1 Result of Test Generate Trading Signal ................................................................................ 49 Figure 7--3 Unit Testing of Register User .............................................................................................. 49 Figure 7--4 Unit Testing of User Authentication ................................................................................... 49 Figure 7-5 Unit Testing of Change Password ........................................................................................ 50 Figure 7--6 Unit testing of create new Portfolio ................................................................................... 50 Figure 7--7 Unit testing of Update existing Portfolio ............................................................................ 51 Table 7-1 Integration Test Results ........................................................................................................ 52

Automated Trading System
9
Chapter 1
1 Introduction
1.1 History Long gone are the days when stock trading was done manually with heavy human involvement. Traders were shouting at each other trying to sell at the best price and buy at the cheapest possible price on behalf of their clients. The clients are individuals or institutional investors like pension funds, insurance companies. Institutional investors are called “Big market whales” due to huge amount of cash they invest in the market. Like mentioned in the abstract, this project works with the companies registered in London Stock Exchange which is one of the biggest markets in the world. The first and very notable change happened in the London financial market was the “Big Bang” of London Stock Exchange in 1986. That shook the entire London market. UK government by that time had made very important decision to try and make London Stock Exchange more competitive compared to others like New York and Tokyo. The government feared that existing mechanism would lead the London Financial market (The City) earning lesser amount of money which is a main source of Income for UK government. This changed the market dramatically. Looking now, it can be easily noticed that “Big Bang” has actually very successful move and it made London market more competitive. One major change of “Big Bang” was replacing the trading flow with Electronic screens. This is called screen based trading. Another change was that traders had become investment companies and outsiders were also allowed to participate in trading process. Before that time, the only way for an investor to buy or sell stocks was through a stock broker (trader). High volume of transactions and demand for the low completion time in the market led the way for the requirement of computer based stock trading i.e. Automated Trading. Due to fear traders exit too early from trading process resulting lesser profit and at the other end staying too long in the process due to greediness. Automated trading system solves this by defining clear entry and exit points. Ability to react to changes faster and carry out high number of transactions within a short period of time are some the other advantages.
1.2 The Project The project simulates trading on behalf of registered investors. It works on top 100 companies listed in London Stock Exchange called “FTSE 100” companies. For the trading, system uses a set of rules called “trading strategy”. The strategy is based on technical analysis of current and historical share prices. As a result of technical analysis, system generates “Trading Signals” which are basically instructions to the trading simulator whether to buy, sell or hold shares of a particular company. More details on the trading strategy and technical analysis are discussed in the next chapter. System uses online data sources to get current and historical market data. An automated scheduled task which is running in the background handles this process. It’s a secure web application and investors are required to register with the system to set up their account called “Portfolio”.

Automated Trading System
10
Trading is performed using the virtual cash set up in each individual user portfolio. User can also define the maximum amount of cash he wishes to spend in a single trading session in his portfolio. System presents various reports and graphs by analysing both market data and trading transactions. Chapter 4 has more details on these reports with screens of user interfaces.
1.3 Problem Making the decision of whether to buy, sell or hold a share is very difficult task due to numerous reasons. Volatility of the market and high number of known and un-known variables are the main reasons. However with a systematic approach, it’s possible to make this right with some degree of confidence. When it comes to systematic approach, there are 2 basic approaches. The first one is fundamental analysis which is studying key attributes of a company and current economic situation to make decisions. The other one is technical analysis and it focus mainly on historical prices of a particular company. This project uses technical analysis. Next chapter discusses technical analysis in detail. There are 3 possible transactions in the trading process of this system. They are Sell short, Buy long and Hold. Sell short is the mechanism of selling the shares in the hope of price will go down. Shares are sold at the current price hoping to buy them back at a cheaper price. Buying long is a long term investment hoping the price will go up. Any trading system should have a strategy. The strategy used in this project is based on the moving average of historical share prices. It compares the current share price with the moving average of historical prices. Moving average is calculated using most recent prices for specific number of days. Popular most recent number of days in the industry is 30, 50 and 60. The number used in the project is 50. Risk management is another important factor. How it is achieved in this project is by spreading the trading in shares of many companies. In case if loss is occurred, it is minimized since all money is not invested in one or few companies.
1.4 Project Scope Following sections discuss the domain and area on which the project works.
1.4.1 Technical Analysis
The project uses technical analysis for the trading strategy to make decision on whether to buy or sell. Fundamental analysis which is the study of the company attributes was also considered at the initial stage. However fundamental analysis was discarded since that is not conclusive enough to make a trading decision.

Automated Trading System
11
1.4.2 London Stock Exchange (LSE) This is the London based stock exchange facilitating trading of the shares of registered companies. It’s started in 1801 and currently the fourth largest share market in the world. There are 2 markets in the LSE. Main market is for large and established companies and there are over 1300 companies listed in his market. Alternative Investment Market (AIM) is the smaller market and it’s for small and growing companies.
1.4.3 FTSE 100 companies
FTSE 100 companies are the top 100 companied listed in London Stock Exchange. The list is updated regularly, but most of the companies have been remained within the top 100 for a long period of time. The famous FTSE 100 index is based on these 100 companies. The appendix A lists the full list of FTSE 100 company names with stock market symbol. The figure 2-1 below is taken from London Stock exchange web site (http://www.londonstockexchange.com) and it shows the performance of FTSE 100 Index for the period of 2011 September to 2012 September.
Figure 2-1 FTSE 100 Index for this year

Automated Trading System
12
1.5 Historical data
It’s important to identify an adequate amount of data for analysis which is neither too small nor too big. It has been decided that 6 years of historical data is a good set of data. The range of data is between 01 of January 2008 and present.
1.6 Currency Since all FTSE 100 companies are all UK businesses, the currency used in the system is only sterling pound.

Automated Trading System
13
Chapter 2
2 Automated Trading Background
2.1 Trading system Trading system simply facilitates buying and selling of shares of companies. This can be completely manual, completely automated or the mixture of both.
Automated trading system is automated software system, driven by well-defined set of rules. These set of rules handles the financial transactions. Because of these well-defined set of rules, it’s always possible to find out how the system had performed in the past and predict how it will perform in the future with some confidence. Not only corporate companies or institutional investors (pension funds, insurance), but general individual can also be the beneficiaries of a stock trading systems. Only very few percentage of traders can beat the market to make profit consistently. It doesn’t matter its institutional or retail traders, both are always in a risk to loose huge amount of money. This is where trading systems comes into action. It is always low in risk to use a trading system than relying on traders. However putting together a successful trading system is not an easy task. There is a huge difference between decent trading system and a profitable one. The former can be implemented with a reasonably good approach, but it doesn’t mean the system will generate profit all the times. As investing in shares is always a risky thing, the result might end up in either way. The difference between a good and profitable trading system is the risk management attached to it. The principles behind trading will have steps to minimize the loss when the thing not going in investor’s favour.
2.2 Technical Analysis
There are 2 types of analysis used in a trading strategy. They are Fundamental Analysis and Technical Analysis. Fundamental Analysis is the study of various characteristics of a company, its related financial statements and current economic factors to decide the status of the company. Those statements can be either the publications by the company itself or independent research papers by financial Analyst in other organizations. The company characteristics include growth forecast, overall health of the organization, the figures in balance sheet, credit ratings and rating outlook published by rating agencies etc.
Technical analysis is the usage of market data especially historical prices to make trading decisions. Market data discussed in this context are current price, opening price and close share price, number of shares transacted (volume) etc. These data are then analysed to find certain pattern which may end up in generating trading decisions.

Automated Trading System
14
Technical analysis strongly believes that all information is reflected in the historical prices and other hidden patterns can be recognized by analysing them. With the right amount of data and right usage of analytical technics, there are enough evidences to prove this concept.
Most of the information used in fundamental analysis is not very conclusive enough. As an example in an independent analyst research paper may mention the financial status of a company is good with decent explanation to back that. But the term “good” is relative. How investors make a decision to buy which company’s shares when multiple companies are rated as “good”? If the trader or the investor is a human, this can be somewhat less difficult as they have no tangible facts to back like common sense, but for a computer program it’s not easy as they work only with logic. Since technically analysis mainly works on numbers, it’s more computers friendly. In addition to that all required data can be retrieved in one or few sources. In the case of fundamental analysis, the system has to search for more sources to get enough information. Taking all these points into consideration, it is decided that Technical Analysis is the best approach to use in this project.
2.3 Possible Transactions
2.3.1 Selling short
Selling short is a way of making profit from a share without owning it. The share is usually borrowed from someone else. If the price of the share is expected to fall in future, the share is borrowed and sold at current price. Once the price is fallen, the same share is bought back at a lower price. The share is then returned back, but the process results in profit. The shares for selling short are borrowed from traders. There is a fee or interest to pay for it. The fee depends on number of days the share is retained. So the sooner the share is sold and bought back, higher the profit.
2.3.2 Buying Share
Share are bought in the hope of the price will go up. This is normally long term investment.
2.4 Risk Control
Risk control is one of the most important aspects of a trading system. If risks are not controlled in a right manner, heavy losses may incur and that could lead to the end of the system. Risk control should be managed in the portfolio level with clear exit points triggered by exit signals.

Automated Trading System
15
2.5 Portfolio
Portfolio represents individual user’s financial set up. This is simply money management. It include total cash amount, maximum cash amount to invest, a threshold value of percentage in share price change. Buying or selling of a particular company share is occurred only when the price change exceeds this threshold value.
2.6 Moving Average Moving average is a mechanism to suggest buying and selling points based on a share price chart. Any averaging the prices during a long period of time helps to smooth out any irregular temporary changes in price (noises). It also helps to recognize any patterns and long term characteristics. When it comes to share prices, moving average is the average of close share prices for most recent “n” number of days The popular numbers of days are 30 , 50 and 60. For n number of data points, the Moving average for a given time “t” can be expressed as Moving Average = (∑
) / n For an example, moving average for 5 days is MA5 = (P1 + P2 + P3 + P4 + P5) / 5
There are few other specific types of moving averages like Weighted Moving Average, Accumulative Average and Truncated Moving Average. These are variations of the main one, mainly attempting to purify the result. However for the simplicity purpose, only plain Moving average has been used in this project.
2.7 Trading signals Trading signals are generated using moving average of historical share prices and current share price. There are 3 types of trading signals which are explained below.
2.7.1 Buy Long When moving Average < Current share Price
2.7.2 Sell short When moving Average > Current share Price
2.7.3 Hold shares All other times

Automated Trading System
16
Below figure 2-1 shows the buy long and sells short points using moving average and share price in a chart.
Figure 2--0-1 Buy and Sell points
2.8 Trading strategy
Trading system always needs a trading strategy to. Run the trading process That is, the encapsulated logic behind the trading. It is pre-defined set of rules which make trading decisions. Below table 2-1 shows the trading strategy used in his project
Step 1 Begin with set amount of cash
Step 2 For all companies x Identify the most promising companies (companies with share price expected to rise) x Identify the least promising companies (companies with share price expected to fall)
Step 3 Invest the cash x Buy the shares of most promising companies x sell short the shares of least promising companies
Step 4 Lower any losses. Exit if loses exceed the portfolio threshold
Step 5 Go to step 2 Table 2-1 Trading Strategy

Automated Trading System
17
The trading starts for each user portfolio with its set cash amount. This is the maximum investment cash amount. So this is the entry point of the strategy. In the next step all the companies are analysed to come up with the list of most promising and least promising companies. Like mentioned before, technical analysis with the help of historical and current share prices performs this task. Then it goes to the trading process. The shares of most promising companies are bought. Shares of least promising companies are sold short. It always checks if current loss is greater than the threshold value set up in portfolio and exit immediately if that is the case. This is called Exit point.

Automated Trading System
18
Chapter 3
3 System Overview – System Analysis with UML
3.1 Context Diagram – High Level overview The figure 3-1 is the context diagram for the system. It shows each component and how they interact with each other.
Figure 3-0-1 High level overview of the system
All 4 components of the system and each section are described below using UML.
3.2 Trading manager This is the main component in the system.

Automated Trading System
19
3.2.1 UML for Trading Manager x Use Case Diagram
Figure 3-2 Trading Manager Use Case Diagram
Like shown in figure 3-2, the trading manager is basically responsible for 4 high level tasks. Analysing the share prices and then makes the decision to buy or sell. As a result of these 2 things together, it generates trading signal for the system to carry out trading. Once the trading process is complete, it updates the database with each transaction.

Automated Trading System
20
x Sequence Diagram
Figure 5-3 Trading Manager Sequence Diagram
The sequence diagram in figure 5-3 displays how each task is taking place in the order.
3.3 Investor Portfolio Management Portfolio is the investor’s trading account with the system. It maintains all attributes which are relevant trading. Registered users can create a new portfolio or make changes to the existing one.

Automated Trading System
21
3.3.1 UML for Portfolio Management
x Use Case Diagram
Figure 3-4 Portfolio Management Use Case Diagram
In Figure 3-4, the actions an investor can perform with regard to the portfolio management are explained. An investor is required to register and login to the system to begin with. Once it is done, he can create a new portfolio or update the existing one. Investor is also able to view various reports and graphs which are produced by the system.

Automated Trading System
22
x Sequence Diagram
Figure 3-5 Portfolio Management Sequence Diagram
The figure 3-5 shows each activity of portfolio maintained in the order compared to the time.
3.2 Financial Data Consumer & Synchroniser
This collects required data from data sources and processes them before loading into the database. Financial data plays a major role in the system. The consumer performs below tasks. x Collect unstructured data from data source x Transform them into the required format x Load them onto the database.

Automated Trading System
23
3.2.1 UML for Data Consumer Use Case Diagram
Figure 3-6 Use Case Diagram for Data Consumer
Figure 3-6 shows the use cases of the data consumer module. It gets the data from the source and then process and converts the unstructured data into appropriate format. Finally refresh the database with new data.

Automated Trading System
24
x Sequence Diagram
Figure 3-7 Data Consumer Sequence Diagram
Figure 3.7 presents the each sub task of the data consumer in the occurring order against time.
3.4 Data Analyser and Presentation
This is basically the most interactive and closer module to the users. By analysing the historical data, it presents various views to the users. The presentation includes current market data, graphs with historical prices and moving average for each FTSE 100 company.

Automated Trading System
25
x Use Case Diagram
Figure 3-8 Data Presenter Use Case Diagram
Figure 3-8 is the use case diagram of data presentation. The module first loads the data from database and process the dataset as required. Then the view is generated at run time and presented to user.

Automated Trading System
26
x Sequence Diagram
Figure 3-9 Data Presenter Sequence Diagram
Figure 3-9 shows how each sub function within the module works in the order compared to time line. It’s the investor first request the view. The data processor loads the data and processes it for the view generator to generate the required view. It’s then presented back to the investor.

Automated Trading System
27
Chapter 4
4 User Interfaces
This chapter explains how the system works by discussing each component with the help of user interfaces.
4.1 Information presentation
4.1.1 Latest share prices
System displays latest share prices (delayed by about 15 minutes) of all FTSE 100 companies. Both registered and guest users are able to view this information. In addition to share prices, it has a link to a different page where all historical data in a visualized graph. Figure 4-1 shows the user interface of this.
Figure 4-1 Latest Share Prices

Automated Trading System
28
4.1.2 Historical Price Analyser
Upon clicking on the link in the current price page, the historical data page is displayed. The System analyses and presents the company’s historical data along with the moving average in a graph as shown in figure 4-2 below, Company share price is in red and moving average for 50 days is in blue.
Figure 4--2 Historical share prices with moving average
4.2 Trading Manager The registered user can see the report of the trading transactions performed on their behalf. The report displays date, time, company name, transaction type , the price at which shares were sold or bought and the number of transactions. The link to this report is in the left hand side menu, available only to log in users. Figure 4-3 below shows this.

Automated Trading System
29
Figure 4-3 My Trading Report
4.3 Portfolio Manager
Portfolio manager allows the registered users to maintain their own portfolio. User can loads cache into his account, so that the system can use them to buy new stocks. Or he can sets the maximum amount to use when buying. The trading threshold is another attribute to set. The link to portfolio manager page is also in the left hand side menu and again only available to logged in users. Figure 4.4 shows a screen of portfolio manager.

Automated Trading System
30
Figure 4-4 Create / Edit Portfolio screen
4.4 User Management
To work with the systems, users need to register and log in first. User is required to provide name, email address and a password. The login process verifies the user name and password. Once authenticated and authorized to the system, users will be able to see their own personalized “My Dashboard “page. This is more like a self-catering area having access to many functions from the menu.
4.4.1 New user Registration Unregistered users have limited functions available. If an investor wants to participate in the trading, he or she needs to register with the system first. Upon registration, he will then have access to more functionality. Left hand side menu lists the functions. Guest user can register by selecting Register option from menu. Figure 4-5 shows the new registration form. User needs to provide first name, last name, email address and password.

Automated Trading System
31
Figure 4-5 new user registration
4.4.2 My Dashboard My dashboard is the logged in page for a user. User will get here either after successful login or successful register in the system. In the case of registration, the registration success message is also shown.
Figure 4-6 My Dashboard

Automated Trading System
32
4.4. 3 User Authentication and Authorization Figure 4-7 shows the UI for the Login. User has to enter the user name which is the email address provided at the registration and the password.
Figure 4-7 Login to the system
x Authentication Failure Once the Login button is pressed, the system validates user inputs first. It checks if email and password are empty and the format of the email address. If these basic validations are failed, same login page is re-loaded with an error message. If validation passed, the user name and password are checked against the values stored in the database. If they don’t match or record does not exist, an error message is displayed in the login page as shown in figure 4.8.

Automated Trading System
33
Figure 4-8 Authentication Failure
x My dashboard If the attempt to login is successful, again My Dashboard page is displayed with welcome message as shown in figure 4.9.
Figure 4-9 My Dashboard

Automated Trading System
34
x Log out
Logged in user can click on Logout button from menu to log out from the system. Once logged out, less number of functionalities in the left hand side menu will appear as shown in figure 4.10. Then the user is navigated to the login screen with successful logout acknowledgement message.
Figure 4-10 User Logout
x Change Password
Figure 4-11 shows the change password screen. It’s another functionality available for a logged in user in left hand side. User has to enter old password and new password 2 times. The system does basic validation like empty fields, if new password and confirm passwords are matched. If validation passes, the system goes ahead and stores the new password in the user record.
Figure 4-11 Change password

Automated Trading System
35
x Change password Success page After a successful password change, user will be redirected to his dashboard page with acknowledgement message as shown in figure 4-12
Figure 4-12 My Dashboard page after a successful password change

Automated Trading System
36
Chapter 5
5 System Architecture
5.1 Application Architecture The system has been designed as Multi-Tier (n-tier) enterprise application. This is also called layered architecture as layer is a synonym for tier in this context. Presentation, Business Logic (Application logic) and Data Access areas are logically separated. Each tier has been given a specific architectural responsibility. Because of the n-tier architecture, it’s much easier to make a change in one tier without affecting others. This is a big advantage when it comes to maintenance. Also it increases the reusability. As an example, function in data access layer or business logic in a function is business logic can be used by multiple clients. The “client” here is not necessarily application client; it can be component in any layer. The development process of this project has been so productive due to this architecture. It allows parallel development in multiple layers, since functionality in layers is not overlapped. This project was developed using Test Driven development (TDD) which uses unit testing for development. The n-tier architecture helps the wring and executing the unit testing, as test case has the option to test piece of functionality in one tier, rather than having to run whole function which can be too heavy to test. System is a web based application with some scheduled tasks to run in the background. It is also implemented using Multi-Threading. Trading for each portfolio is executed in a separate thread.

Automated Trading System
37
Figure 5--5-1 System Architecture
Figure 5.1 shows the system architecture as n-tier (multi-tier). Details about each tier are discussed under sub sections below.

Automated Trading System
38
5.1.1 Data Access Tier This tier is sitting close to the database and responsible for handling all database accesses.
5.1.2 Middle Tier (Business Logic) This is the place where most of the business logic has been implemented. It sits between presentation and DAO layers passing request forward and backward. Conceptually Java servlets are also fallen into this layer as they are the server side entities of presentation tier..
5.1.3 Presentation Tier Presentation tier is responsible for handling user interactions with the system. It mainly comprises of java servlets and Java server pages (JSP).
This layer mainly delegates the requests to the service layer which is the middle tier.
5.1.4 Database Database is the permanent storage (persistence) for the application. Appendix 1 shows the database table structure in an Entity Relational diagram.
5.2 Design Patterns The application is designed based on few software design patterns. Due to the nature of the application, most of them are enterprise design patterns.
5.2.1 Factory Method Pattern
Factory pattern is a creational one. It shields the business methods from complex object creation logic by encapsulating the process in a factory class. The database connection factory is responsible for creational of all new database connections in the system. Any function need a database connection, call the factory class’s getConnection() method.
5.2.2 Data Transfer Objects (DTO)
This is an enterprise design pattern usually featuring in multi-tier applications. The transfer of data between each layer has been done using transfer objects. Transfer objects are sometimes called Plain Old Java object (POJO). This doesn’t mean this pattern is only used Java enterprise applications. Transfer object has list of attributes and getters and setters for them. The data is wrapped in transfer object or collection of transfer objects and sent between each layer. Usage of this pattern makes data transfer between each tier nice and tidy. Since one single object used in method calls as opposed to a number of parameters, the API looks tidy.

Automated Trading System
39
5.2.3 Data Access Object (DAO)
All databases handling code has been encapsulated into a set of dedicated back end objects called Data Access Objects. No any other classes in the application should access database. All data access from other area of the application is done only via the DAOs. DAO pattern also provide the flexibility to replace the current database with another without affecting the other areas. Business logic in the middle tier and user interaction handling code in presentation tier do not need to worry about any change happening at the data access layer.
5.2.4 Thread pool pattern (Replicated workers) Due to high number of trading transactions occurred in the system, Multi-Threading is used. Trading for each individual portfolio is handled as a separate process or a Thread. This helps each thread to work independent of others. However again when the number of parallel threads goes high, it puts pressure on the system resources like database connections, CPU and memory. To overcome this issue “Thread Polling” has been used. With all the threads are pooled, the handler called “executor” can control number of actively running thread at any given time. This value (maximum number of active threads) is called as “Active pool size” and it is made configurable value in the application.
5.3 Low Level System Design
The below UML class diagram demonstrates how the n- tier design architecture is implemented in the class level. The figure 5-2 is class diagram is for trading task. It shows the relationships between the classes. The design is the same for other component.

Automated Trading System
40
Figure 5-2 UML Class diagram for Trading Manager

Automated Trading System
41
Chapter 6
6 Implementation As mentioned in the previous chapter, the system is designed as n-tier application. This is mainly due to the fact that it is a complex system. This architecture increases the maintainability too.
6.1 Methodology
6.1.1 Agile
Agile methodology has been used throughout the project development. Development was done in multiple iterations. Each iteration aims to deliver a set of pre-defined functionalities. Table 6-1 below summarises each iteration cycle. Iteration Duration in week Functionality area with unit testing 1 2 Development and deployment of basic web application
2 2 Data consumer
3 2 Presentation interfaces
4 3 User management – Login and authentication
5 2 User portfolio management
6 4 Trading Table 6-1 Iteration Details of Development Cycle
In agile process, iterations have shorter time span. So only one function was targeted to add to the system in each iteration. During first 2 weeks, the basic web application was put together. Once it was in place, each functionality was added gradually in each iteration.
6.1.2 Test Driven development (TDD) Development has been done using TDD with dedicated test cases for each functionality area. At the begging, a test case was created with very little code. Then the test is run and if it fails, the errors are fixed.

Automated Trading System
42
Figure 6-0-1 Test Driven development Cycle
Figure 6-1 presents the cycle of test driven development. The first thing to do was to add a test case. Like as example, test case for creating portfolio. When it runs for the first time, it failed because the code to fulfil the task is yet to add. And then code was gradually added until the test case passes. Once it passed, there were changes needed to improve the quality of code. This process is called “refactor”. Once code is refactored, it was ready and the same process was follow by adding a new test case for different functionality. Because of the test driven development, it was much easier to add new feature and test the impact of it by running new and existing unit test cases. Results of running test cases with screens are discussed in the chapter 7.
6.2 Technologies used
This section describes the technologies used to implement the project.
x JAVA
Java is the main programming language used. The main reason for selecting Java is because it is open source and hence frees to use. It is also popular selection when it comes to enterprise application development.

Automated Trading System
43
x JUnit
JUnit is a Java based technology unit testing framework. Is used for writing Unit Test classes in this project.
x Java Servlet
Java Servlet is one of the best candidates for the web tier programming component. It is part of the presentation tier but sits in the server side. So it can connect the dynamic web pages to the middle tier services while handling both HTTP Request and Response.
x JDBC – Java database connectivity
It’s Java’s solution API (Application programming Interface) to connect applications to databases from different vendors. It allows the developers to focus on the business problems , rather than having to worry about bridging the differences in database connectivity.
x My SQL – Database
Open source software (only the community edition) from Oracle which works well with Java applications. The JDBC driver connects the MySql database to the Java application.
x JSP
Java Server Pages are a Java based technology for developing dynamic web pages.
x JSTL – Java Standard Tag Library
JSTL is used in the JSP pages as a best programming practice rather than writing Java codes inside JSP pages which is a very bad practice.
x Cascade Style Sheet (CSS) CSS is used to format and style web pages. x Apache Tomcat – Web server
Open source web server for Java based web application deployment.
x Java Timer Task
Java Timer task is for scheduling periodic tasks to run in given interval.
x JFreeChart
This is an open source framework for generating graphs. Its Java based and integrated well with web applications.

Automated Trading System
44
6.3 Tools Used
6.3. 1 NetBeans NetBeans is a complete Integrated Development Environment (IDE). This made the development easy by providing automated class generation, code refactoring etc.
6.3.2 Apache Ant
Ant was used to write build scripts to compile the code bundle the application and deploy the web application to web server.
6.3.3 Microsoft Visio Visio was used for drawing UML diagrams.
6.3.4 Google Drive Google drive was used as the repository to store the project online.
6.4 Development challenges
6.4.1 Handling of high number of trading transactions
As expected the number of trading transactions per trading session is very high. If this is not handled properly, it leads to unavoidable system shutdown (crash). This was a big challenge when developing the system. This was successfully handled with the help of Multi-Threading and Thread pooling. Like discussed in the design pattern section, trading for each individual user portfolio is running as a separate independent thread. This makes sure one process doesn’t have to wait for others and it has the access to system resources without any delay. But again when high number of threads is running at the same time, it’s a burden to the system. Since resources like database connections, CPU and memory are limited, they should handle properly. Otherwise system might run out of resources and some processes (Threads) may suffer. Thread pooling was used to overcome this issue. The maximum number of active threads at any given time is set as a configurable value. After series of testing, this value was set to 5. The system integration testing revealed that Multi-threading and thread pooling has been working fine in the system handling high number of trading transactions without any issue.
Automated Trading System
45
6.4.2 Synchronizing the system with data source
Due to the nature of more frequently changing (dynamic) market position, market data always changes and data source reflects all these in its data. However it’s a big challenge to synchronize the trading system data with data source. The challenge was overcome by employing a scheduled task dedicated to synchronize the system with data source. The task runs every 10 minutes. It first fetches data from source as a web service call over the internet and then updates the system with new data.
6.5 Implementation Details
6.5.1 Trading Manager Trading manager is a background task and is scheduled to run once a day at 10am. Java Timer Task is used to implement the scheduler. Timer task triggers the trading service. The service first loads the current share prices and historical prices for all 100 companies from database. The moving average for last 50 days is then calculated for each company. The trading signal generator is then called with this information. It generates trading signal for each company using the information passed in. Then the Trading Handler is called to perform trading for each investor. It loads each investors trading portfolio from database. Now a separate Thread (process) is created to handle trading for each portfolio. Rather than starting all the threads in one go, threads are controlled using a Thread Pool. The thread pool controls the life cycle of all the threads. It has a maximum number of active threads; the pool can have at any given time. This value is used at the construction time of pool. So the thread pool makes sure that number of active threads in the system does not exceed this maximum value (pool size). Thread pool is implemented using Java Executors and Executor Service which comes with Java concurrent package (java.util.concurrent.ExecutorService, java.util.concurrent.Executors). Trading is performed based on the trading signals. As an example, if the signal is to sell, the shares of the company is short sold. More details about trading signals and trading transactions are discussed in the background chapter. The number of shares to buy is decided by the maximum amount of cash set up in user portfolio. Trading process is gracefully terminated, if the total loss has reached threshold value set up in the portfolio. This is called Exit point. To minimize the risk, cash is equally distributed to invest in all promising companies, rather than only one or few companies. Finally each trading transaction is stored in the database.

Automated Trading System
46
6.5.2 User Management The way user manager function work, is already described in the Chapter3. This section discusses the technical implementation of the same. Starting from the front end, the login page is developed as a JSP. Once the user enters data, the servlet received the request. It validates the request and shows any errors messages in the JSP page again. If the request is valid, the servlet then send the request to DAO class for back end processing. Upon receiving the request, DAO class validates the user name and password checking with database. Finally if the authentication is successful, the servlet forward the user to the personalized Dash Board page which is a JSP paged called “DashBoard.jsp”. If authentication failed, login page is shown again with an error message.
6.5.3 Financial Data Consumer
They have an API which provides various market data including historical and current share prices. An automated task has been scheduled to access the yahoo finance service and pull the data. This data is then stored in the database for the application to work with. The scheduled interval has been set to 10 minutes now. So every 10 minutes, the data in the system is refreshed from Yahoo Finance. The Yahoo Finance is a web service which is available in below URL http://download.finance.yahoo.com/d/quotes.csv It takes number of parameters allowing you to define which attributes you want to receive. One of the mandatory and most important parameter is the company symbol for which you are asking the data.
There are 2 data consumers used in the system
x Historical data Collector
This collects historical trading data for a given period and loads them into the database structure after transforming. It’s always important to have a enough set of data which is not too small nor too big. Data from the beginning of 2006 has been identified as a good data set and that’s loaded onto the database.
x Real time market data consumer
This service has been set up as a scheduled task and it consumes one of the Yahoo finance web services to download latest share price details of all 100 companies. This data is in comma separated (CSV) file formatting. Once data are downloaded, the latest share prices and volumes stocks, they are transformed to a structured data and then loaded to the database table. Like mentioned in the system architecture, Data consumer perform 3 major tasks. They are
x Fetch data from source x Convert unstructured data x Store data in Database
Automated Trading System
47
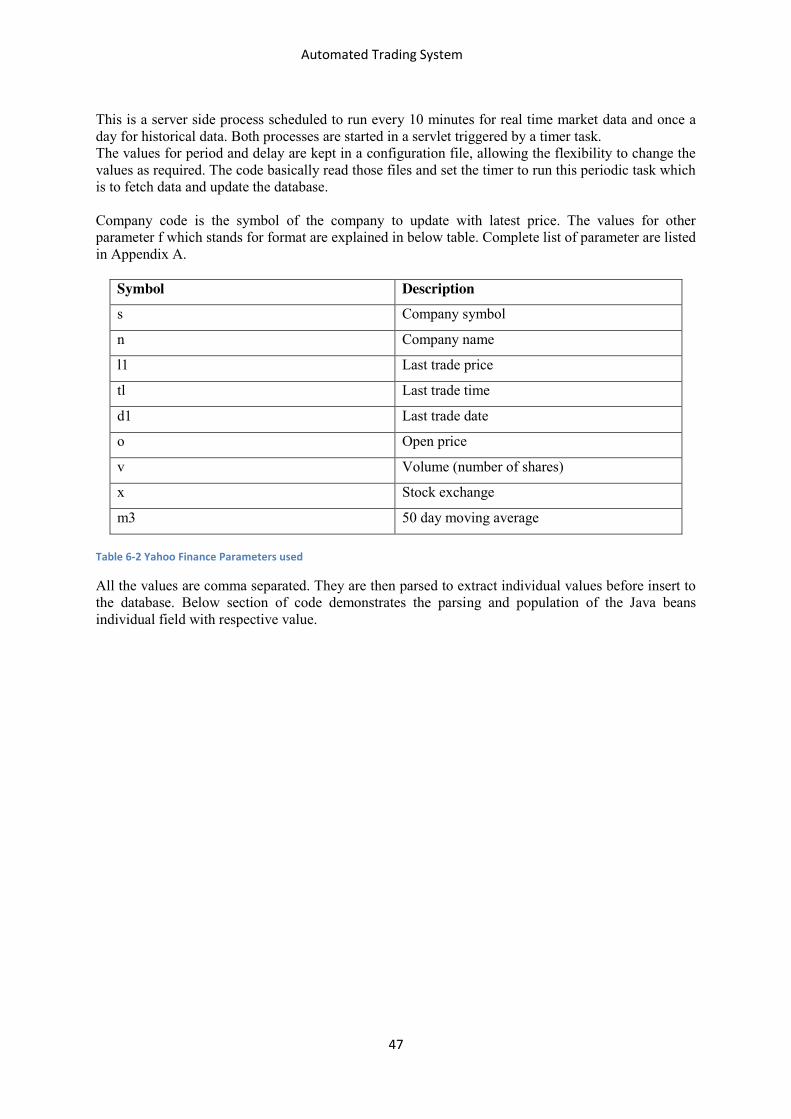
This is a server side process scheduled to run every 10 minutes for real time market data and once a day for historical data. Both processes are started in a servlet triggered by a timer task. The values for period and delay are kept in a configuration file, allowing the flexibility to change the values as required. The code basically read those files and set the timer to run this periodic task which is to fetch data and update the database. Company code is the symbol of the company to update with latest price. The values for other parameter f which stands for format are explained in below table. Complete list of parameter are listed in Appendix A.
Symbol Description s Company symbol
n Company name
l1 Last trade price
tl Last trade time
d1 Last trade date
o Open price
v Volume (number of shares)
x Stock exchange
m3 50 day moving average Table 6-2 Yahoo Finance Parameters used
All the values are comma separated. They are then parsed to extract individual values before insert to the database. Below section of code demonstrates the parsing and population of the Java beans individual field with respective value.

Automated Trading System
48
Chapter 7
7 Testing
7.1 Unit Testing As test driven development (TDD) was used as the development process, unit testing play a major role. Netbeans was used to run the test cases. All the test cases were written using JUnit 4 which is the latest version. Below sections discuss the test strategy for each individual test cases and screen shots of the successfully passing test runs.
7.1.1 Trading
x Test Case – Calculate Moving Average This test case tests the method of calculate moving average. The method takes company code of a company and number of most recent days as parameters. It gets the historical data from database for the given company and calculates moving average using closing shares prices for most recent given number of days. The requirement to pass the test is that calculated moving average is greater than 0. Figure 7-1 shows the result of the test.
Figure 7-1 Result of Test Moving Average
x Test Case – Calculate Generate Trading Signal
This test case tests the method of generate trading signals. It takes moving average and current share price as parameters. It then generates the trading signal based on those values. Possible results are -1 for sell, 1 for buy and 0 for hold. The requirement to pass the test is to match expected result with actual result returned by the method. Figure 7-2 shows the result of test.

Automated Trading System
49
Figure 7-1 Result of Test Generate Trading Signal
7.1.2 User management
x Test case - Register a new user Here the testing Strategy is check the number of users already in the system just before create a new user. And then again check the new count of users just after creating the user. The test checks if the new count is greater than the old count by 1 as the condition to pass the test case. Figure 7.3 shows the successful result of the test case.
Figure 7--3 Unit Testing of Register User
x Test Case – Authenticate User In here, the data used to create the user account is also used to authenticate. An authentication is done by the same email address and password. For a successful login, the function returns a record of user account with its entire attributes. The last name of result and last name used to create the account are matched to check if test is succeeded. Figure 7-4 shows the screen of successfully run test case.
Figure 7--4 Unit Testing of User Authentication

Automated Trading System
50
x Test Case – Change Password The new password is used as the expected result here. Once the change password function is carried out, subsequent user authentication is performed using new password. If the authentication succeeds, the user account had been updated with new password. The password of user record returned by authentication is then compared with expected result. Figure 7-5 shows successful run of the test case.
Figure 7-5 Unit Testing of Change Password
7.1.2 Portfolio management
x Test Case – Create new portfolio This tests the creation of a new portfolio for a given user Id. The number of portfolio records in the database is checked before and after the test. Test passes if the after count is greater than before count by 1. Figure 7-6 shows the result of the test.
Figure 7--6 Unit testing of create new Portfolio
x Test case – Update Portfolio This tests the update of portfolio for a given portfolio Id. The method updates the portfolio by changing the value of “maximum amount of cash to invest” property ( 675.0 in the example below). After the update, it checks the new value stored in the database record. If the new value in the database is equals to the value used to update the portfolio (expected value), test passes.

Automated Trading System
51
Figure 7-7 shows the result of test.
Figure 7--7 Unit testing of Update existing Portfolio
7.2 Integrated System Testing
Once all unit testing were passed, the reliably of functionality is assured. However integrated testing is the way of testing how all individual functionality work together as the system. Table 7-1 shows the results of system integration testing. Test cases in the table are ordered the way it should be tested. Since User Interfaces in the chapter 4 shows the successful testing results, no user screens are added here. Test case Details Outcome View Current latest price
a) User selects Latest share prices link from menu b) User should see latest share price, last trade date and time for all 100 companies. Test 2 – This test also covers the automated functionality of synchronisation of the latest price from data source functionality as well. This can be verified by last trade date and time.
Pass
View Historical Share price
a) User view latest share prices. b) Click “Historical price” link for any company. c) User sees the graph showing historical share prices from 2008 along with moving average. Test 2 - This test also covers the automated functionality of synchronisation of the Historical share prices from data source functionality as well. This can be verified by the coverage of historical data. The graph should include most recent trading.
Pass

Automated Trading System
52
Register in system
a) User selects the Register page from menu. b) Enter first name, last name, email and password. c) Hit Register button. d) User should see the registration success message in My Dashboard page.
Pass
Login to system
a) Enter user name and password. b) Hit Login Button. c) User should get to My Dashboard page. d) User should see more functions now available in the le
left hand side menu
Pass
Create Portfolio
a) User selects My Portfolio link. b) Enter total amount, maximum amount, threshold c) Hit Update button. d) User should see the updated portfolio.
Pass
Update Portfolio
a) User selects My Portfolio link. b) Enter total amount, maximum amount, threshold c) Hit Update button. d) User should see the updated portfolio.
Pass
View My trading report
a) User selects My Trading Report link b) User should see all trading performed by system on behalf of him. Report should include trading date, time, company, transaction type, transacted share price and number of shares. Test 2 – This test also covers the automated trading task. This can be verified by latest transaction date and time.
Pass
Log Out
a) User selects Log Out function from menu
b) User should see login page with successful log out message.
c) User should see less functions now available in the left hand side menu
Pass
Table 7-1 Integration Test Results

Automated Trading System
53
Summary
Conclusion By implementing this project, it is shown how Technical Analysis using historical share prices can be used as a successful trading strategy to simulate trading transactions.
Enhancements & Future works The trading strategy used in this project with moving average is somewhat simpler one. The strategy can be enhanced to a complex one by introducing further mathematical modelling. Bollinger Bands, Moving Average Convergence Divergence (MVCD) are some examples.
However it should be noted that being complex doesn’t mean that the strategy is a better one. Only comprehensive testing would reveal how successful a strategy would be.

Automated Trading System
54
References
Books
1) Jaekle,Urban & Tomasini, Emilio Trading systems, (Harriman House)
2) Stoakes , Christopher, All you need to know about the City, ( Longtail Publishing, 2011)
3) Kaufman ,Perry J, New Trading Systems and Methods, Fourth Edition, 4) (John Wiley & Sons ,2005)
5) Tridsman, Thomas, Tradinghyuks, (Wiley, 2001)
Web
1) Marketwatch on trading strategy http://www.marketwatch.com/trading-strategies 2) JFreeChart is an open source Java project to generate graphs and charts http://www.jfree.org/jfreechart 3) Yahoo Finance http://uk.finance.yahoo.com

Automated Trading System
55
Appendix A
A.1 ER Diagram Here is the Entity relation showing all the tables and their relationship in the database.
A.2 List of FTSE 100 Companies
company symbol company name AAL.L ANGLO AMERICAN ABF.L ASSOCIAT BRIT FOODS ADM.L ADMIRAL GROUP AGK.L AGGREKO AMEC.L AMEC ANTO.L ANTOFAGASTA ARM.L ARM HOLDINGS ASHM.L ASHMORE GRP AV.L AVIVA AZN.L ASTRAZENECA BA.L BAE SYSTEMS BARC.L BARCLAYS

Automated Trading System
56
BATS.L BRIT AMER TOBACCO BG.L BG GROUP BLND.L BRIT LAND CO REIT BLT.L BHP BILLITON BNZL.L BUNZL BP.L BP BRBY.L BURBERRY GROUP BSY.L B SKY B GROUP BT-A.L BT GROUP CCL.L CARNIVAL CNA.L CENTRICA CNE.L CAIRN ENERGY CPG.L COMPASS GROUP CPI.L CAPITA GRP CRH.L CRH PLC CSCG.L CAP SHOP CENTRES DGE.L DIAGEO EMG.L MAN GROUP ENRC.L EURASIAN NATURAL ESSR.L ESSAR ENERGY EXPN.L EXPERIAN FRES.L FRESNILLO GFS.L G4S GKN.L GKN GLEN.L GLENCORE INTL GSK.L GLAXOSMITHKLINE HL.L HARGREAVES LANS HMSO.L HAMMERSON REIT HSBA.L HSBC HLDG IAG.L INTL. CONS. AIR GRP IAP.L ICAP IHG.L INTERCONT HOTELS IMI.L IMI PLC IMT.L IMPERIAL TOBACCO IPR.L INTERNATIONAL POWER ITRK.L INTERTEK GROUP ITV.L ITV JMAT.L JOHNSON MATTHEY PLC KAZ.L KAZAKHMYS KGF.L KINGFISHER LAND.L LAND SEC R.E.I.T. LGEN.L LEGAL & GENERAL LLOY.L LLOYDS BANKING GRP MGGT.L MEGGITT MKS.L MARKS & SPENCER

Automated Trading System
57
MRW.L MORRISON SUPERMKTS NG.L NATIONAL GRID NXT.L NEXT OML.L OLD MUTUAL PFC.L PETROFAC POLY.L POLYMETAL INTL PRU.L PRUDENTIAL PSON.L PEARSON RB.L RECKITT BENCK GRP RBS.L ROYAL BK SCOTL GR RDSB.L ROYAL DUTCH SHELL-B REL.L REED ELSEVIER PLC REX.L REXAM RIO.L RIO TINTO RR.L ROLLS-ROYCE HLDGS RRS.L RANDGOLD RESOURCES RSA.L RSA INSUR GRP RSL.L RESOLUTION NPV SAB.L SABMILLER SBRY.L SAINSBURY SDR.L SCHRODERS SDRC.L SCHRODERS NVTG SGE.L SAGE GRP SHP.L SHIRE SL.L STANDARD LIFE SMIN.L SMITHS GROUP SN.L SMITH & NEPHEW SRP.L SERCO GROUP SSE.L SSE STAN.L STANDARD CHARTERED SVT.L SEVERN TRENT TATE.L TATE & LYLE TLW.L TULLOW OIL TSCO.L TESCO PLC ULVR.L UNILEVER UU.L UNITED UTILITIES GR VED.L VEDANTA RESOURCES VOD.L VODAFONE GRP WEIR.L WEIR GROUP WOS.L WOLSELEY WPP.L WPP WTB.L WHITBREAD XTA.L XSTRATA

Automated Trading System
58
A.3 Full list of Yahoo finance parameters a Ask a2 Average Daily Volume a5 Ask Size b Bid b2 Ask (Real-time) b3 Bid (Real-time) b4 Book Value b6 Bid Size c Change & Percent Change c1 Change c3 Commission c6 Change (Real-time)
c8 After Hours Change (Real-time) d Dividend/Share d1 Last Trade Date
d2 Trade Date e Earnings/Share e1 Error Indication (returned for symbol changed / invalid)
e7 EPS Estimate Current Year e8 EPS Estimate Next Year e9 EPS Estimate Next Quarter f6 Float Shares g Day's Low h Day's High j 52-week Low k 52-week High g1 Holdings Gain Percent
g3 Annualized Gain g4 Holdings Gain g5 Holdings Gain Percent (Real-time)
g6 Holdings Gain (Real-time) i More Info i5 Order Book (Real-time) j1 Market Capitalization j3 Market Cap (Real-time) j4 EBITDA
j5 Change From 52-week Low j6 Percent Change From 52-week Low k1 Last Trade (Real-time) With
Time k2 Change Percent (Real-time) k3 Last Trade Size k4 Change From 52-week High
k5 Percebt Change From 52-week High l Last Trade (With Time) l1 Last Trade (Price Only)
l2 High Limit l3 Low Limit m Day's Range m2 Day's Range (Real-time) m3 50-day Moving Average m4 200-day Moving Average
m5 Change From 200-day Moving Average m6 Percent Change From 200-day
Moving Average m7 Change From 50-day Moving Average
m8 Percent Change From 50-day Moving Average n Name n4 Notes
o Open p Previous Close p1 Price Paid p2 Change in Percent p5 Price/Sales p6 Price/Book q Ex-Dividend Date r P/E Ratio r1 Dividend Pay Date r2 P/E Ratio (Real-time) r5 PEG Ratio r6 Price/EPS Estimate Current Year
r7 Price/EPS Estimate Next Year s Symbol s1 Shares Owned
s7 Short Ratio t1 Last Trade Time t6 Trade Links t7 Ticker Trend t8 1 yr Target Price v Volume v1 Holdings Value v7 Holdings Value (Real-time) w 52-week Range
w1 Day's Value Change w4 Day's Value Change (Real-time) x Stock Exchange
y Dividend Yield

Automated Trading System
59
Appendix B - Source Code
B.1 Java Code
B.1.1.1 Service classes
x TradingTask.java
package com.ultimum.trading.service;
import com.ultimum.trading.dao.PortfolioDAO;
import java.util.Timer;
import java.util.TimerTask;
import java.util.List;
import java.util.ArrayList;
import com.ultimum.trading.dto.StockPrice;
import com.ultimum.trading.dao.StockDAO;
import com.ultimum.trading.dto.HistoricalPrice;
import com.ultimum.trading.dto.UserPortfolio;
import com.ultimum.trading.handler.TradingHandler;
import java.util.concurrent.ExecutorService;
import java.util.concurrent.Executors;
/**
*
* @author SJayathi
*/
public class TradingTask extends TimerTask {

Automated Trading System
60
private long period;
private long delay;
private Timer timer;
// the pool size
private final static int THREAD_POOL_SIZE = 5;
private ExecutorService threadExecutor;
/**
* Constructor
* @param delay
* @param period
*/
public TradingTask(String delay, String period) {
this.period = Integer.parseInt(period);
this.delay = Integer.parseInt(delay);
timer = new Timer();
timer.schedule(this, this.delay, this.period);
threadExecutor = Executors.newFixedThreadPool(THREAD_POOL_SIZE);
}
/**
* Run Method
*/
@Override
public void run() {
List<StockPrice> priceList = new ArrayList<StockPrice>();

Automated Trading System
61
PortfolioDAO portfolioDAO = new PortfolioDAO();
List<StockPrice> stockPriceList = new StockDAO().getPriceDetails();
int buyCount = 0;
int sellCount = 0;
for (StockPrice stockPrice : stockPriceList) {
// calculate moving average for 50 days
double movingAverage = calculateMovingAverage(stockPrice.getCompanySymbol(), 50);
System.out.println("Trading company code : " + stockPrice.getCompanySymbol() + " , moving average: " + movingAverage);
int tradingSignal = generateTradingSignal(movingAverage, stockPrice.getStockPrice());
System.out.println("Trading > currentPrice: " + stockPrice.getStockPrice() + " , tradingSignal: " + tradingSignal);
stockPrice.setCurrentTradingSignal(tradingSignal);
if (tradingSignal == 1) {
buyCount++;
} else if (tradingSignal == -1) {
sellCount++;
}
}
// Find the portfolios
List<UserPortfolio> portfolioList = portfolioDAO.getAllPortfolio();
// Actiual trading for each perforlio
for (UserPortfolio portfolio : portfolioList) {

Automated Trading System
62
System.out.println("Trading for Portfolio id : " + portfolio.getPortfolioId());
TradingHandler handler = new TradingHandler(portfolio, buyCount, stockPriceList);
// Now add each handler to executor
threadExecutor.execute(handler);
}
}
/**
* Calculate the moving average
* @param companyCode
* @param noOfDays
* @return
*/
private double calculateMovingAverage(String companyCode, int noOfDays) {
double totalPrice = 0;
double movingAverage = 0;
List<HistoricalPrice> historicalPriceList = new StockDAO().getHistoricalData(companyCode);
for (int i = 0; i < noOfDays; i++) {
if (historicalPriceList.size() > i) {
totalPrice += historicalPriceList.get(i).getClosePrice();
}
}
movingAverage = totalPrice / noOfDays;

Automated Trading System
63
return movingAverage;
}
/**
* Generate Trading signals
* @param movingAverage
* @param currentPrice
* @return
*/
private int generateTradingSignal(double movingAverage, double currentPrice) {
int signal = 0;
// sell short
if (currentPrice < movingAverage) {
signal = -1;
} // buy long
else if (currentPrice > movingAverage) {
signal = 1;
}
return signal;
}
public void cancelTimer() {
timer.cancel();
cancel();
}
}

Automated Trading System
64
x PriceUpdateHandler.java /* * To change this template, choose Tools | Templates * and open the template in the editor. */ package com.ultimum.trading.service; import java.util.Timer; import java.util.TimerTask; import java.io.BufferedReader; import java.io.InputStreamReader; import java.net.URL; import java.net.URLConnection; import java.util.List; import java.util.ArrayList; import com.ultimum.trading.dto.StockPrice; import com.ultimum.trading.dao.StockDAO; /** * * @author SJayathi */ public class PriceUpdateHandler extends TimerTask { private long period; private long delay; private Timer timer; public PriceUpdateHandler(String delay, String period) { this.period = Integer.parseInt(period); this.delay = Integer.parseInt(delay); timer = new Timer(); timer.schedule(this, this.delay, this.period); } public void run() { List<StockPrice> priceList = new ArrayList<StockPrice>();

Automated Trading System
65
StockDAO stockDAO = new StockDAO(); List<String> companyCodes = stockDAO.getCompanySymbols(); for (String companyCode : companyCodes) { priceList.add(getStockDetails(companyCode)); } // Now update the price List stockDAO.updatePriceList(priceList); } /** * * @param companySymbol * @return */ private StockPrice getStockDetails(String companySymbol) { StockPrice stockPrice = new StockPrice(); // @See http://www.gummy-stuff.org/Yahoo-data.htm // @See http://search.cpan.org/~edd/Finance-YahooQuote/YahooQuote.pm String yahooRequest = "http://download.finance.yahoo.com/d/quotes.csv?s=" + companySymbol + "&f=snl1t1d1m3lohgvwx"; try { URL url = new URL(yahooRequest); URLConnection conn = url.openConnection(); BufferedReader br = new BufferedReader(new InputStreamReader(conn.getInputStream())); String yahooResponse = null; while ((yahooResponse = br.readLine()) != null) { System.out.println("Output: " + yahooResponse); String[] responseArray = yahooResponse.split(",");

Automated Trading System
66
stockPrice.setCompanySymbol(responseArray[0].replace("\"", "")); stockPrice.setCompanyName(responseArray[1].replace("\"", "")); stockPrice.setStockPrice(Double.parseDouble(responseArray[2])); stockPrice.setLastTradeTime(responseArray[3].replace("\"", "")); stockPrice.setLastTradeDate(responseArray[4].replace("\"", "")); stockPrice.setMovingAverage50Day(Double.parseDouble(responseArray[5])); } } catch (Exception e) { e.printStackTrace(); } return stockPrice; } public void cancelTimer() { timer.cancel(); cancel(); } }
HistoricalDataUpdater.java
package com.ultimum.trading.service;
import com.ultimum.trading.factory.DBConnectionFactory;
import com.ultimum.trading.dao.StockDAO;
import java.io.BufferedReader;
import java.io.InputStreamReader;
import java.net.URL;
import java.net.URLConnection;
import java.sql.Connection;

Automated Trading System
67
import java.sql.PreparedStatement;
import java.util.GregorianCalendar;
import java.util.List;
import java.util.StringTokenizer;
/**
*
* @author SJayathi
*/
public class HistoricalDataUpdater {
public static void main(String[] args) {
try {
System.out.println("Testing started ==");
GregorianCalendar cal = new GregorianCalendar();
int yearStart = 2008;//cal.get(Calendar.YEAR);
int yearEnd = 2008;//cal.get(Calendar.YEAR);
System.out.println(">>> Year - " + yearEnd);
int monthStart = 0;//cal.get(Calendar.MONTH);
int monthEnd =11;// cal.get(Calendar.MONTH);
System.out.println(">>> Month - " + monthEnd);
int dayStart = 1;//4;//cal.get(Calendar.DAY_OF_MONTH);
int dayEnd = 31;//cal.get(Calendar.DAY_OF_MONTH);

Automated Trading System
68
System.out.println(">>> day - " + dayEnd);
List<String> companyCodes = new StockDAO().getCompanySymbols();
Connection connection = DBConnectionFactory.getConnection();
for (String companyCode : companyCodes) {
try {
String symbol = companyCode;
double openPrice = 0;
double highPrice = 0;
double lowPrice = 0;
double closePrice = 0;
double adjustmentPrice = 0;
String currentDate = null;
long volume = 0;
String pageUrl = "http://ichart.finance.yahoo.com/table.csv?s=" + symbol + "&a=" + monthStart + "&b=" + dayStart + "&c=" + yearStart + "&d=" + monthEnd + "&e=" + dayEnd + "&f=" + yearEnd + "&g=d&ignore=.csv";
System.out.println(">>>>> Fething URL - " + pageUrl);
URL url = new URL(pageUrl);
URLConnection conn = url.openConnection();

Automated Trading System
69
BufferedReader br = new BufferedReader(new InputStreamReader(conn.getInputStream()));
String output = null;
String strLine = "";
StringTokenizer st = null;
int lineNumber = 0, tokenNumber = 0;
while ((strLine = br.readLine()) != null) {
System.out.println("Output: " + strLine);
lineNumber++;
if (lineNumber > 1) {
//break comma separated line using ","
st = new StringTokenizer(strLine, ",");
while (st.hasMoreTokens()) {
//display csv values
tokenNumber++;
switch (tokenNumber) {
case 1: {
currentDate = st.nextToken();
System.out.println("Line # " + lineNumber

Automated Trading System
70
+ ", Token # " + tokenNumber
+ ", Date : " + currentDate);
break;
}
case 2: {
openPrice = Double.parseDouble(st.nextToken());
System.out.println("Line # " + lineNumber
+ ", Token # " + tokenNumber
+ ", Open : " + openPrice);
break;
}
case 3: {
highPrice = Double.parseDouble(st.nextToken());
System.out.println("Line # " + lineNumber
+ ", Token # " + tokenNumber
+ ", High : " + highPrice);
break;
}
case 4: {
lowPrice = Double.parseDouble(st.nextToken());
System.out.println("Line # " + lineNumber

Automated Trading System
71
+ ", Token # " + tokenNumber
+ ", Low : " + lowPrice);
break;
}
case 5: {
closePrice = Double.parseDouble(st.nextToken());
System.out.println("Line # " + lineNumber
+ ", Token # " + tokenNumber
+ ", Close : " + closePrice);
break;
}
case 6: {
volume = Long.parseLong(st.nextToken());
System.out.println("Line # " + lineNumber
+ ", Token # " + tokenNumber
+ ", Volume : " + volume);
break;
}
case 7: {
adjustmentPrice = Double.parseDouble(st.nextToken());
System.out.println("Line # " + lineNumber

Automated Trading System
72
+ ", Token # " + tokenNumber
+ ", Adj Close : " + adjustmentPrice);
break;
}
} // switch
} // hasMoreToken
//reset token number
tokenNumber = 0;
// Update to datebase
// Process Login the DB
PreparedStatement s;
s = connection.prepareStatement("INSERT INTO historical_price"
+ "(company_symbol,trade_date,open_price,high_price,low_price,close_price,volume,"
+ "adj_close)"
+ " VALUES(?,?,?,?,?,?,?,?)");
java.text.SimpleDateFormat sdf = new java.text.SimpleDateFormat("MM/dd/yyyy");
java.text.SimpleDateFormat sdf2 = new java.text.SimpleDateFormat("h:mma");

Automated Trading System
73
s.setString(1, symbol);
s.setString(2, currentDate);
s.setDouble(3, openPrice);
s.setDouble(4, highPrice);
s.setDouble(5, lowPrice);
s.setDouble(6, closePrice);
s.setLong(7, volume);
s.setDouble(8, adjustmentPrice);
s.executeUpdate();
} // if line number > 1
} // while each line
} catch (Exception e) {
e.printStackTrace();
}
}
} catch (Exception e) {
e.printStackTrace();
}
}
}

Automated Trading System
74
B.1.2 DAO Classes
x TradingDAO.java
package com.ultimum.trading.dao;
import com.ultimum.trading.factory.DBConnectionFactory;
import com.ultimum.trading.dto.Trading;
import java.sql.Connection;
import java.sql.PreparedStatement;
import java.sql.ResultSet;
import java.util.ArrayList;
import java.util.List;
/**
*
* @author sjayathi
*/
public class TradingDAO {
/**
* Insert Trading Record
* @param trading
*/
public void insertTrading(Trading trading) {
Connection conn = DBConnectionFactory.getConnection();
try {
// Process Login the DB
PreparedStatement s;
s = conn.prepareStatement("INSERT INTO trading(company_symbol, trade_date, trade_time, user_id, share_price, share_volume, trade_action) values(?,?,?,?,?,?,?) ");

Automated Trading System
75
s.setString(1, trading.getCompanySymbol());
s.setString(2, trading.getTradeDate());
s.setString(3, trading.getTradeTime());
s.setInt(4, trading.getUserId());
s.setDouble(5, trading.getSharePrice());
s.setInt(6, trading.getShareVolume());
s.setString(7, trading.getTradeAction());
s.executeUpdate();
} catch (Exception e) {
e.printStackTrace();
} finally {
try {
conn.close();
} catch (Exception ex) {
ex.printStackTrace();
}
}
}
/**
* Search Trading for a given user
* @param userId
* @return
* @throws Exception
*/
public List<Trading> findTradingsByUser(int userId) throws Exception {

Automated Trading System
76
List<Trading> tradingList = new ArrayList<Trading>();
try {
Connection connection = DBConnectionFactory.getConnection();
PreparedStatement s;
s = connection.prepareStatement("SELECT * FROM trading"
+ " WHERE user_id = ? ORDER BY trade_date DESC, trade_time DESC");
s.setInt(1, userId);
s.executeQuery();
ResultSet rs = s.getResultSet();
while (rs.next()) {
Trading trading = new Trading();
trading.setTradingId(rs.getInt("trade_id"));
trading.setCompanySymbol(rs.getString("company_symbol"));
trading.setSharePrice(rs.getDouble("share_price"));
trading.setShareVolume(rs.getInt("share_volume"));
trading.setTradeAction(rs.getString("trade_action"));
trading.setTradeDate(rs.getString("trade_date"));
trading.setTradeTime(rs.getString("trade_time"));
trading.setUserId(rs.getInt("user_id"));
tradingList.add(trading);
}
} catch (Exception ex) {
ex.printStackTrace();
throw ex;
}
return tradingList;

Automated Trading System
77
}
}
x PortfolioDAO.java
/* * To change this template, choose Tools | Templates * and open the template in the editor. */ package com.ultimum.trading.dao; import com.ultimum.trading.factory.DBConnectionFactory; import com.ultimum.trading.dto.UserPortfolio; import java.sql.Connection; import java.sql.PreparedStatement; import java.sql.ResultSet; import java.util.ArrayList; import java.util.List; /** * * @author sjayathi */ public class PortfolioDAO { /** * Insert Portfolio records * @param portfolio * @throws Exception */ public void createPortfolio(UserPortfolio portfolio) throws Exception { try { Connection connection = DBConnectionFactory.getConnection(); PreparedStatement s; s = connection.prepareStatement("INSERT INTO user_potfolio " + "(total_invetment_amount, max_invetment_amount, trading_threshold, user_id)" + " VALUES(?,?,?,?)"); s.setDouble(1, portfolio.getTotalAmount()); s.setDouble(2, portfolio.getMaximumAmount()); s.setDouble(3, portfolio.getTradingThreshold()); s.setInt(4, portfolio.getUserId()); s.executeUpdate();

Automated Trading System
78
} catch (Exception ex) { ex.printStackTrace(); throw ex; } } /** * Update Portfolio records * @param portfolio * @throws Exception */ public void updatePortfolio(UserPortfolio portfolio) throws Exception { try { Connection connection = DBConnectionFactory.getConnection(); PreparedStatement s; s = connection.prepareStatement("UPDATE user_potfolio SET " + "total_invetment_amount = ?, max_invetment_amount = ?, trading_threshold = ? " + " WHERE portfolio_id = ?"); s.setDouble(1, portfolio.getTotalAmount()); s.setDouble(2, portfolio.getMaximumAmount()); s.setDouble(3, portfolio.getTradingThreshold()); s.setInt(4, portfolio.getPortfolioId()); s.executeUpdate(); } catch (Exception ex) { ex.printStackTrace(); throw ex; } } /** * Return All Portfolio records * @return */ public List<UserPortfolio> getAllPortfolio() { List<UserPortfolio> portfolioList = new ArrayList<UserPortfolio>(); try { Connection connection = DBConnectionFactory.getConnection(); PreparedStatement s;

Automated Trading System
79
s = connection.prepareStatement("SELECT * FROM user_potfolio"); s.executeQuery(); ResultSet rs = s.getResultSet(); while (rs.next()) { UserPortfolio portfolio = new UserPortfolio(); portfolio.setTotalAmount(rs.getDouble("total_invetment_amount")); portfolio.setMaximumAmount(rs.getDouble("max_invetment_amount")); portfolio.setTradingThreshold(rs.getDouble("trading_threshold")); portfolio.setPortfolioId(rs.getInt("portfolio_id")); portfolio.setUserId(rs.getInt("user_id")); portfolioList.add(portfolio); } } catch (Exception ex) { ex.printStackTrace(); } return portfolioList; } /** * Find portfolio record by User Id * @param userId * @return * @throws Exception */ public UserPortfolio findPortfolio(int userId) throws Exception { UserPortfolio portfolio = new UserPortfolio(); portfolio.setUserId(userId); try { Connection connection = DBConnectionFactory.getConnection(); PreparedStatement s; s = connection.prepareStatement("SELECT * FROM user_potfolio" + " WHERE user_id = ? "); s.setInt(1, userId);

Automated Trading System
80
s.executeQuery(); ResultSet rs = s.getResultSet(); if (rs != null && rs.next()) { if (rs.getString("total_invetment_amount") != null) { portfolio.setTotalAmount(rs.getDouble("total_invetment_amount")); } if (rs.getString("max_invetment_amount") != null) { portfolio.setMaximumAmount(rs.getDouble("max_invetment_amount")); } if (rs.getString("trading_threshold") != null) { portfolio.setTradingThreshold(rs.getDouble("trading_threshold")); } if (rs.getString("portfolio_id") != null) { portfolio.setPortfolioId(rs.getInt("portfolio_id")); } if (rs.getInt("user_id") != 0) { portfolio.setUserId(rs.getInt("user_id")); } } } catch (Exception ex) { ex.printStackTrace(); throw ex; } return portfolio; } /** * Get Portfolio Record Count * @return * @throws Exception */ public int getPortfolioCount() throws Exception { // Establishing the DB connection Connection conn = DBConnectionFactory.getConnection(); int usercount = 0; try { // Process Login the DB PreparedStatement s;

Automated Trading System
81
s = conn.prepareStatement("SELECT COUNT(*) AS USR_COUNT FROM user_potfolio"); s.executeQuery(); ResultSet rs = s.getResultSet(); if (rs != null && rs.next()) { usercount = rs.getInt("USR_COUNT"); } } catch (Exception e) { e.printStackTrace(); throw e; } finally { try { conn.close(); } catch (Exception e) { e.printStackTrace(); } } return usercount; } }
x StockDAO.java
package com.ultimum.trading.dao;
import com.ultimum.trading.factory.DBConnectionFactory;
import com.ultimum.trading.dto.HistoricalPrice;
import com.ultimum.trading.dto.StockPrice;
import java.sql.Connection;
import java.sql.PreparedStatement;
import java.sql.ResultSet;
import java.util.ArrayList;
import java.util.List;
public class StockDAO {

Automated Trading System
82
/**
* Get all company symbols
* @return
*/
public List<String> getCompanySymbols() {
List<String> companySymbols = new ArrayList<String>();
Connection conn = null;
try {
// Process Login the DB
PreparedStatement s;
conn = DBConnectionFactory.getConnection();
s = conn.prepareStatement("SELECT company_symbol FROM stock_price ORDER BY company_symbol");
s.executeQuery();
ResultSet rs = s.getResultSet();
while (rs.next()) {
String companyCode = rs.getString("company_symbol").trim();
companySymbols.add(companyCode);
}
} catch (Exception e) {
e.printStackTrace();
} finally {
try {

Automated Trading System
83
conn.close();
} catch (Exception ex) {
ex.printStackTrace();
}
}
return companySymbols;
}
/**
* Return All Price details
* @return
*/
public List<StockPrice> getPriceDetails() {
List<StockPrice> stockPriceList = new ArrayList<StockPrice>();
Connection conn = null;
try {
// Process Login the DB
PreparedStatement s;
conn = DBConnectionFactory.getConnection();
s = conn.prepareStatement("SELECT * FROM stock_price ORDER BY company_symbol");
s.executeQuery();
ResultSet rs = s.getResultSet();
while (rs.next()) {
StockPrice stockPrice = new StockPrice();

Automated Trading System
84
stockPrice.setCompanySymbol(rs.getString("company_symbol").trim());
stockPrice.setCompanyName(rs.getString("company_name").trim());
stockPrice.setStockPrice(rs.getDouble("stock_price"));
stockPrice.setLastTradeDate(String.valueOf(rs.getString("price_date")));
stockPrice.setLastTradeTime(String.valueOf(rs.getString("price_time")));
stockPrice.setMovingAverage50Day(rs.getDouble("moving_avg"));
stockPriceList.add(stockPrice);
}
} catch (Exception e) {
e.printStackTrace();
} finally {
try {
conn.close();
} catch (Exception ex) {
}
}
return stockPriceList;
}
/**
* Update the stock price
* @param priceList
*/

Automated Trading System
85
public void updatePriceList(List<StockPrice> priceList) {
Connection conn = null;
try {
// Process Login the DB
PreparedStatement s;
conn = DBConnectionFactory.getConnection();
s = conn.prepareStatement("UPDATE stock_price SET stock_price= ?, price_date= ?, price_time= ?, moving_avg = ? WHERE company_symbol = ?");
for (StockPrice stockPrice : priceList) {
s.setDouble(1, stockPrice.getStockPrice());
s.setString(2, stockPrice.getLastTradeDate());
s.setString(3, stockPrice.getLastTradeTime());
s.setDouble(4, stockPrice.getMovingAverage50Day());
s.setString(5, stockPrice.getCompanySymbol());
s.executeUpdate();
}
} catch (Exception ex) {
ex.printStackTrace();
} finally {
try {
conn.close();
} catch (Exception ex) {
}
}
}
/**

Automated Trading System
86
* Get historical prices
* @param companyCode
* @return
*/
public List<HistoricalPrice> getHistoricalData(String companyCode) {
List<HistoricalPrice> historicalPriceList = new ArrayList<HistoricalPrice>();
Connection conn = null;
try {
// Process Login the DB
PreparedStatement s;
StringBuilder query = new StringBuilder("SELECT * FROM historical_price ");
if (companyCode != null) {
query.append(" WHERE company_symbol = ? ");
}
query.append(" ORDER BY TRADE_DATE DESC");
conn = DBConnectionFactory.getConnection();
s = conn.prepareStatement(query.toString());
if (companyCode != null) {
s.setString(1, companyCode);
}
s.executeQuery();
ResultSet rs = s.getResultSet();
while (rs.next()) {
HistoricalPrice historicalPrice = new HistoricalPrice();

Automated Trading System
87
historicalPrice.setCompanySymbol(rs.getString("company_symbol").trim());
historicalPrice.setTradeDate(rs.getString("trade_date").trim());
historicalPrice.setOpenPrice(rs.getDouble("open_price"));
historicalPrice.setHighPrice(rs.getDouble("high_price"));
historicalPrice.setLowPrice(rs.getDouble("low_price"));
historicalPrice.setClosePrice(rs.getDouble("close_price"));
historicalPrice.setAdjustmentClosingPrice(rs.getDouble("adj_close"));
historicalPrice.setVolume(rs.getLong("volume"));
historicalPriceList.add(historicalPrice);
}
} catch (Exception e) {
e.printStackTrace();
} finally {
try {
conn.close();
} catch (Exception ex) {
}
}
return historicalPriceList;
}
}
x UserDAO.java
package com.ultimum.trading.dao;
import com.ultimum.trading.factory.DBConnectionFactory;

Automated Trading System
88
import com.ultimum.trading.dto.User;
import java.sql.Connection;
import java.sql.PreparedStatement;
import java.sql.ResultSet;
public class UserDAO {
public User authenticateUser(String userName, String password) {
User user = new User();
// Establishing the DB connection
Connection conn = null;
try {
conn = DBConnectionFactory.getConnection();
// Process Login the DB
PreparedStatement s;
s = conn.prepareStatement("SELECT * FROM trd_user WHERE user_email=?");
s.setString(1, userName);
s.executeQuery();
ResultSet rs = s.getResultSet();
if (rs != null && rs.next()) {
// rs.next();
String user_email = "";
String userRole = "";
Automated Trading System
89
String firstName = "";
String lastName = "";
int userId = 0;
String Password_db = rs.getString("password").trim();
if (rs.getString("first_name") != null) {
firstName = rs.getString("first_name").trim();
}
if (rs.getString("last_name") != null) {
lastName = rs.getString("last_name").trim();
}
user_email = rs.getString("user_email").trim();
//userRole = rs.getString("user_role").trim();
userId = rs.getInt("user_id");
user.setPassword(rs.getString("password").trim());
if ((userName.equals(user_email)) && (password.equals(Password_db))) {
//System.out.println("User name & password match ");
user.setEmailAddress(user_email);
user.setFirstName(firstName);
user.setUserRole(userRole);
user.setUserId(userId);
user.setLastName(lastName);
} else {

Automated Trading System
90
user.setErrorMessage("Login failed due to incorrect email/password.");
}
}
} catch (Exception e) {
e.printStackTrace();
user.setErrorMessage("database error occurred while login");
} finally {
try {
conn.close();
} catch (Exception e) {
e.printStackTrace();
}
}
return user;
}
public void changePassword(int userId, String newPassword) throws Exception {
// Establishing the DB connection
Connection conn = DBConnectionFactory.getConnection();
try {
// Process Login the DB
PreparedStatement s;
s = conn.prepareStatement("UPDATE trd_user SET password = ? WHERE user_id= ?");
s.setString(1, newPassword);
s.setInt(2, userId);

Automated Trading System
91
s.executeUpdate();
} catch (Exception e) {
e.printStackTrace();
throw e;
} finally {
try {
conn.close();
} catch (Exception e) {
e.printStackTrace();
}
}
}
public void createUser(String firstName, String lastName, String email, String password) throws Exception {
Connection conn = DBConnectionFactory.getConnection();
try {
PreparedStatement s;
System.out.println(" >>> IN createUser DAO, email: " + email);
s = conn.prepareStatement("INSERT INTO trd_user "
+ "(user_email, password, first_name, last_name)"
+ " VALUES(?,?,?,?)");
s.setString(1, email);
s.setString(2, password);
s.setString(3, firstName);
s.setString(4, lastName);

Automated Trading System
92
s.executeUpdate();
} catch (Exception ex) {
ex.printStackTrace();
throw ex;
} finally {
try {
conn.close();
} catch (Exception e) {
e.printStackTrace();
}
}
}
public void deleteUser(int userId) throws Exception {
// Establishing the DB connection
Connection conn = DBConnectionFactory.getConnection();
try {
// Process Login the DB
PreparedStatement s;
s = conn.prepareStatement("DELETE FROM trd_user WHERE user_id= ?");
s.setInt(1, userId);
s.executeUpdate();
} catch (Exception e) {
e.printStackTrace();

Automated Trading System
93
throw e;
} finally {
try {
conn.close();
} catch (Exception e) {
e.printStackTrace();
}
}
}
public int getUserCount() throws Exception {
// Establishing the DB connection
Connection conn = DBConnectionFactory.getConnection();
int usercount = 0;
try {
// Process Login the DB
PreparedStatement s;
s = conn.prepareStatement("SELECT COUNT(*) AS USR_COUNT FROM trd_user");
s.executeQuery();
ResultSet rs = s.getResultSet();
if (rs != null && rs.next()) {
usercount = rs.getInt("USR_COUNT");
}
} catch (Exception e) {
e.printStackTrace();

Automated Trading System
94
throw e;
} finally {
try {
conn.close();
} catch (Exception e) {
e.printStackTrace();
}
}
return usercount;
}
}
B.1.3 Factory classes
DBConnectionFactory.java
package com.ultimum.trading.factory;
import com.ultimum.trading.util.PropertyReader;
import java.sql.Connection;
import java.sql.DriverManager;
/**
*
* @author SJayathi
*/
public class DBConnectionFactory {

Automated Trading System
95
/**
* Return a connection to the database
* @return
*/
public static Connection getConnection() {
// Establishing the DB connection
Connection conn = null;
try {
String dbUserName = PropertyReader.getPropertValue("db.user");
// "itsanje_appusr";
String dbPassword = PropertyReader.getPropertValue("db.password");
// "stock321";
String databaseName = PropertyReader.getPropertValue("db.name");
//"stock_trading";
String url = "jdbc:mysql://localhost/" + databaseName;
Class.forName("com.mysql.jdbc.Driver").newInstance();
conn = DriverManager.getConnection(url, dbUserName, dbPassword);
} catch (Exception e) {
e.printStackTrace();

Automated Trading System
96
}
return conn;
}
}
B.1.4 Utility Classes
x PropertyReader.java
package com.ultimum.trading.util;
import java.io.*;
import java.util.*;
/**
*
* @author SJayathi
*/
public class PropertyReader {
static Properties pro = null;
static PropertyReader propertyReader = null;
private PropertyReader() {
try {
pro = new Properties();

Automated Trading System
97
InputStream in = this.getClass().getClassLoader().getResourceAsStream("trading.properties");
pro.load(in);
} catch (IOException e) {
System.out.println(e.getMessage());
}
}
public static String getPropertValue(String key) {
String value = null;
if (propertyReader == null) {
propertyReader = new PropertyReader();
}
value = pro.getProperty(key);
return value;
}
}
x HistoricalDataParser.java
package com.ultimum.trading.util;
import com.ultimum.trading.factory.DBConnectionFactory;
import java.io.BufferedReader;
import java.io.File;
import java.io.FileReader;
import java.sql.Connection;
import java.sql.PreparedStatement;

Automated Trading System
98
import java.util.StringTokenizer;
/**
*
* @author SJayathi
*/
public class HistoricalDataParser {
public static void main(String[] args) {
try {
String path = "D:/sanjeewa/Trade_system/historical data";
String symbol = null;
double openPrice = 0;
double highPrice = 0;
double lowPrice = 0;
double closePrice = 0;
double adjustmentPrice = 0;
String currentDate = null;
long volume = 0;
File folder = new File(path);
File[] allFiles = folder.listFiles();
Connection connection = DBConnectionFactory.getConnection();
for (File currentFile : allFiles) {
if (currentFile.isFile()) {

Automated Trading System
99
//csv file containing data
int index = currentFile.getName().lastIndexOf('.');
if (index > 0 && index <= currentFile.getName().length() - 2) {
symbol = currentFile.getName().substring(0, index).trim();
System.out.println("Symbol: " + symbol);
}
// System.out.println("#### File Name: " + currentFile.getAbsoluteFile());
//create BufferedReader to read csv file
BufferedReader br = new BufferedReader(new FileReader(currentFile));
String strLine = "";
StringTokenizer st = null;
int lineNumber = 0, tokenNumber = 0;
//read comma separated file line by line
while ((strLine = br.readLine()) != null) {
lineNumber++;
if (lineNumber > 1) {
//break comma separated line using ","
st = new StringTokenizer(strLine, ",");
while (st.hasMoreTokens()) {
//display csv values
tokenNumber++;

Automated Trading System
100
switch (tokenNumber) {
case 1: {
currentDate = st.nextToken();
System.out.println("Line # " + lineNumber
+ ", Token # " + tokenNumber
+ ", Date : " + currentDate);
break;
}
case 2: {
openPrice = Double.parseDouble(st.nextToken());
System.out.println("Line # " + lineNumber
+ ", Token # " + tokenNumber
+ ", Open : " + openPrice);
break;
}
case 3: {
highPrice = Double.parseDouble(st.nextToken());
System.out.println("Line # " + lineNumber
+ ", Token # " + tokenNumber
+ ", High : " + highPrice);
break;
}
case 4: {

Automated Trading System
101
lowPrice = Double.parseDouble(st.nextToken());
System.out.println("Line # " + lineNumber
+ ", Token # " + tokenNumber
+ ", Low : " + lowPrice);
break;
}
case 5: {
closePrice = Double.parseDouble(st.nextToken());
System.out.println("Line # " + lineNumber
+ ", Token # " + tokenNumber
+ ", Close : " + closePrice);
break;
}
case 6: {
volume = Long.parseLong(st.nextToken());
System.out.println("Line # " + lineNumber
+ ", Token # " + tokenNumber
+ ", Volume : " + volume);
break;
}
case 7: {
adjustmentPrice = Double.parseDouble(st.nextToken());
System.out.println("Line # " + lineNumber
+ ", Token # " + tokenNumber
+ ", Adj Close : " + adjustmentPrice);
break;

Automated Trading System
102
}
}
}
//reset token number
tokenNumber = 0;
// Process Login the DB
PreparedStatement s;
s = connection.prepareStatement("INSERT INTO historical_price"
+ "(company_symbol,trade_date,open_price,high_price,low_price,close_price,volume,"
+ "adj_close)"
+ " VALUES(?,?,?,?,?,?,?,?)");
java.text.SimpleDateFormat sdf = new java.text.SimpleDateFormat("MM/dd/yyyy");
java.text.SimpleDateFormat sdf2 = new java.text.SimpleDateFormat("h:mma");
s.setString(1, symbol);
s.setString(2, currentDate);
s.setDouble(3, openPrice);
s.setDouble(4, highPrice);
s.setDouble(5, lowPrice);
s.setDouble(6, closePrice);
s.setLong(7, volume);
s.setDouble(8, adjustmentPrice);
s.executeUpdate();
}
}
}

Automated Trading System
103
}
} catch (Exception e) {
System.out.println("Exception while reading csv file: " + e);
e.printStackTrace();
}
}
}
B.1.5 Servlet Classes
package com.ultimum.trading.servlet;
import com.keypoint.PngEncoder;
import com.ultimum.trading.dao.StockDAO;
import com.ultimum.trading.dto.HistoricalPrice;
import java.awt.Color;
import java.awt.image.BufferedImage;
import java.util.Calendar;
import java.util.List;
import javax.servlet.ServletException;
import javax.servlet.http.HttpServlet;
import javax.servlet.http.HttpServletRequest;
import javax.servlet.http.HttpServletResponse;
import org.jfree.chart.ChartFactory;
import org.jfree.chart.ChartRenderingInfo;
import org.jfree.chart.JFreeChart;
import org.jfree.data.time.Day;
import org.jfree.data.time.MovingAverage;

Automated Trading System
104
import org.jfree.data.time.TimeSeries;
import org.jfree.data.time.TimeSeriesCollection;
public class GraphServlet extends HttpServlet {
protected void doGet(HttpServletRequest request, HttpServletResponse response)
throws ServletException, java.io.IOException {
String companySymbol = request.getParameter("company_code");
// create the timeSeries
final JFreeChart chart = createLineChart(companySymbol);
// set custom color
ChartRenderingInfo info = null;
try {
// create RenderingInfo object
response.setContentType("image/png");
// send the picture
BufferedImage chartImage = chart.createBufferedImage(940, 450, info);
PngEncoder encoder = new PngEncoder(chartImage, false, 0, 9);
response.getOutputStream().write(encoder.pngEncode());
} catch (Exception e) {
e.printStackTrace();
}
}
/**
* Create the line chart
* @param companySymbol
* @return

Automated Trading System
105
*/
public JFreeChart createLineChart(String companySymbol) {
JFreeChart stockDataChart = null;
try {
TimeSeries timeSeries = new TimeSeries("Closing price ", Day.class);
Calendar calendar = Calendar.getInstance();
calendar.set(2003, 0, 0);
List<HistoricalPrice> historicalPriceList = new StockDAO().getHistoricalData(companySymbol);
java.text.SimpleDateFormat sdf = new java.text.SimpleDateFormat("yyyy-MM-dd");
for (HistoricalPrice historicalPrice : historicalPriceList) {
timeSeries.add(new Day(sdf.parse(historicalPrice.getTradeDate())), historicalPrice.getClosePrice());
calendar.add(Calendar.DATE, 1);
}
final TimeSeries mav = MovingAverage.createMovingAverage(timeSeries, "30 day moving average", 30, 30);
final TimeSeriesCollection dataset = new TimeSeriesCollection();
dataset.addSeries(timeSeries);
dataset.addSeries(mav);
stockDataChart = ChartFactory.createTimeSeriesChart("Closing price vs Moving Average", "Date", "Close Price(pence)", dataset, true, true, true);
stockDataChart.setBackgroundPaint(Color.white);
} catch (Exception ex) {
ex.printStackTrace();
}
return stockDataChart;

Automated Trading System
106
}
}
B.2 JSP Code
x ShowGraph.jsp
<%--
Document : showGraph
Created on : 07-Aug-2012, 00:20:13
Author : SJayathi
--%>
<%@page import="java.awt.image.BufferedImage,com.keypoint.PngEncoder" %>
<html>
<head>
<%@include file="header.jsp" %>
<meta http-equiv="Content-Type" content="text/html; charset=UTF-8">
<title>Price Movement Graph</title>
</head>
<body >
<%@include file="leftHandMenu.jsp" %>
<div class="content-section">
<div class="heading-text"><%= request.getParameter("company_name")%> Share Price</div>
<img src='http://localhost:8080/trading/graph?company_code=<%= request.getParameter("company_code")%>' />

Automated Trading System
107
<%@include file="footer.jsp" %>
</div>
</body>
</html>
Index.jsp
<html>
<head>
<%@include file="header.jsp" %>
<meta http-equiv="Content-Type" content="text/html; charset=UTF-8">
<title> Welcome to Ultimum Trading</title>
</head>
<body class="container">
<% String loginFailMesssage = (String) request.getSession().getAttribute("loginFailMesssage");
request.getSession().removeAttribute("loginFailMesssage");
String loginAckMesssage = (String) request.getSession().getAttribute("loginAckMesssage");
request.getSession().removeAttribute("loginAckMesssage");
%>
<%@include file="leftHandMenu.jsp" %>
<div class="content-section">
<div class="heading-text"> Login to the System </div>
<form action="/trading/userManagement/" method="POST">
<% if (loginFailMesssage != null) {%>
<div class="error-message">
<% out.println(loginFailMesssage);%>
</div>
<% }%>

Automated Trading System
108
<% if (loginAckMesssage != null) {%>
<div class="ack-message">
<% out.println(loginAckMesssage);%>
</div>
<% }%>
<table>
<tr/>
<tr>
<td/><td>Email Address: </td><td><input type="text" name="userName" /></td>
</tr>
<tr>
<td/> <td>Password: </td> <td> <input type="password" name="password"/></td>
</tr> <tr/> <tr/>
<tr>
<td/> <td/> <td> <input type="submit" value="Login"></td>
</tr>
</table>
</form>
</div>
</body>
<br/>
<div class="footer">
<%@include file="footer.jsp" %>
</div>
</html>
B.3 Unit Testing Code

Automated Trading System
109
x PortfolioTest.java
package com.ultimum.trading.dao;
import com.ultimum.trading.dto.UserPortfolio;
import java.util.List;
import org.junit.After;
import org.junit.AfterClass;
import org.junit.Before;
import org.junit.BeforeClass;
import org.junit.Test;
import static org.junit.Assert.*;
/**
*
* @author sjayathi
*/
public class PortfolioTest {
int userId = 12;
double totalCash = 3000.00;
double maxCash = 600.00;
double threashold = 4.00;
public PortfolioTest() {
}

Automated Trading System
110
/**
* Test of createPortfolio method, of class PortfolioDAO.
*/
@Test
public void testCreatePortfolio() throws Exception {
System.out.println("createPortfolio");
UserPortfolio portfolio = new UserPortfolio();
portfolio.setUserId(userId);
portfolio.setMaximumAmount(maxCash);
portfolio.setTotalAmount(totalCash);
portfolio.setTradingThreshold(threashold);
PortfolioDAO instance = new PortfolioDAO();
int beforeCount = instance.getPortfolioCount();
System.out.println("Before count: " + beforeCount);
System.out.println("Creating Portfolio for User Id: " + userId);
instance.createPortfolio(portfolio);
int afterCount = instance.getPortfolioCount();
System.out.println("After count: " + afterCount);
assertEquals("Create Portfolio Failed: " , (beforeCount + 1) , afterCount);
}
/**
* Test of updatePortfolio method, of class PortfolioDAO.
*/
@Test

Automated Trading System
111
public void testUpdatePortfolio() throws Exception {
System.out.println("updatePortfolio");
PortfolioDAO instance = new PortfolioDAO();
// Find the portfolio
UserPortfolio portfolio = instance.findPortfolio(userId);
System.out.println("Portfolio Id: "+ portfolio.getPortfolioId());
double expectedResult = 675.00;
System.out.println("Expected Result: "+ expectedResult);
// Set the expected Result
portfolio.setMaximumAmount(expectedResult);
instance.updatePortfolio(portfolio);
UserPortfolio portfolio2 = instance.findPortfolio(userId);
double actualResult = portfolio2.getMaximumAmount();
System.out.println("Actaul Result after update: "+ actualResult);
// The maximum value expected and actual can deviate
// This due to flotingpoint number comparison in Java
double delta = 1.5;
assertEquals(expectedResult , actualResult, 1.5);
}
/**
* Test of getAllPortfolio method, of class PortfolioDAO.
*/
@Test
public void testGetAllPortfolio() {
System.out.println("getAllPortfolio");

Automated Trading System
112
PortfolioDAO instance = new PortfolioDAO();
List expResult = null;
List result = instance.getAllPortfolio();
assertEquals(expResult, result);
// TODO review the generated test code and remove the default call to fail.
fail("The test case is a prototype.");
}
/**
* Test of findPortfolio method, of class PortfolioDAO.
*/
@Test
public void testFindPortfolio() throws Exception {
System.out.println("findPortfolio");
int userId = 0;
PortfolioDAO instance = new PortfolioDAO();
UserPortfolio expResult = null;
UserPortfolio result = instance.findPortfolio(userId);
assertEquals(expResult, result);
// TODO review the generated test code and remove the default call to fail.
fail("The test case is a prototype.");
}
}
x TradingTaskTest.java
package com.ultimum.trading.service;

Automated Trading System
113
import org.junit.Test;
import static org.junit.Assert.*;
public class TradingTaskTest {
private String companyCode = "BARC.L";
private int noOfDays = 50;
public TradingTaskTest() {
}
/**
* Test of calculateMovingAverage method, of class TradingTask.
*/
@Test
public void testCalculateMovingAverage() {
System.out.println("Testing calculateMovingAverage()");
TradingHelper instance = new TradingHelper();
double expResult = 0.0;
System.out.println("Test input Values: \n companyCode: " + companyCode + " \n noOfDays: " + noOfDays);
double result = instance.calculateMovingAverage(companyCode, noOfDays);
System.out.println("Moving Average is : " + result);
assertNotSame("Moving Average is 0!", expResult, result);
}
/**

Automated Trading System
114
* Test of generateTradingSignal method, of class TradingTask.
*/
@Test
public void testGenerateTradingSignal() {
System.out.println("Testing generateTradingSignal()");
double movingAverage = 175.4;
double currentPrice = 196.2;
TradingHelper instance = new TradingHelper();
int expResult = 1;
System.out.println("Test input Values: \n movingAverage: " + movingAverage + " \n currentPrice: " + currentPrice);
int result = instance.generateTradingSignal(movingAverage, currentPrice);
System.out.println("Expected result : " + expResult);
System.out.println("Trading signal (Actaul Value) : " + result);
assertEquals(expResult, result);
}
}