automated perimetry
TRANSCRIPT
AUTOMATED PERIMETRY SIVATEJA CHALLA
INTRODUCTION
• Automated way of mapping the visual field• Important diagnostic test in glaucoma• Diagnosing and monitoring progression of other disease
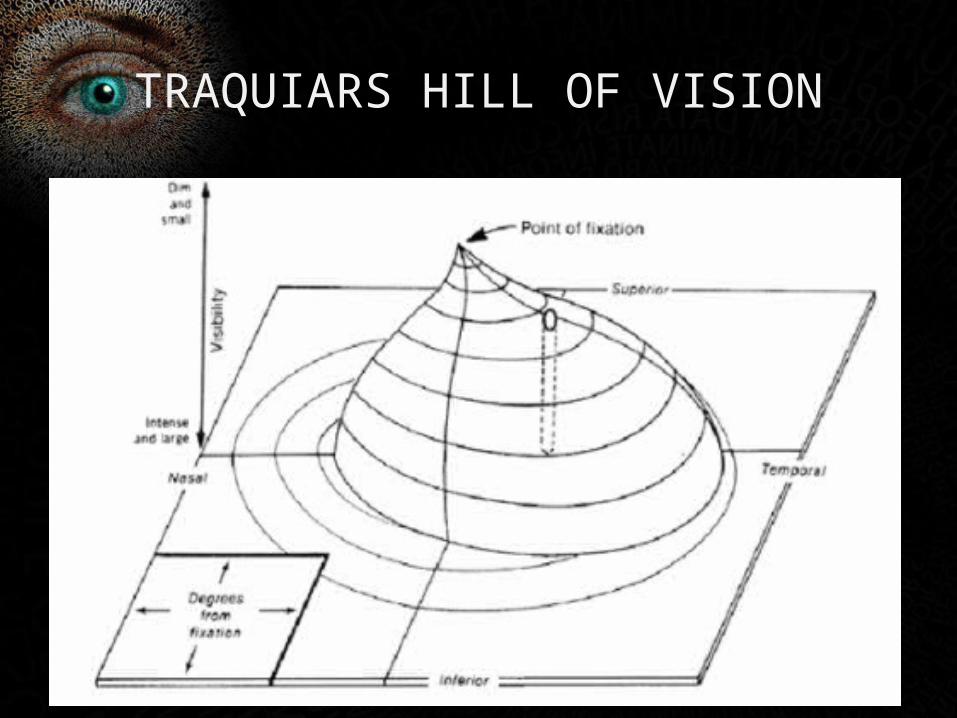
TRAQUIARS HILL OF VISION

NORMAL VISUAL FIELD
BASICS
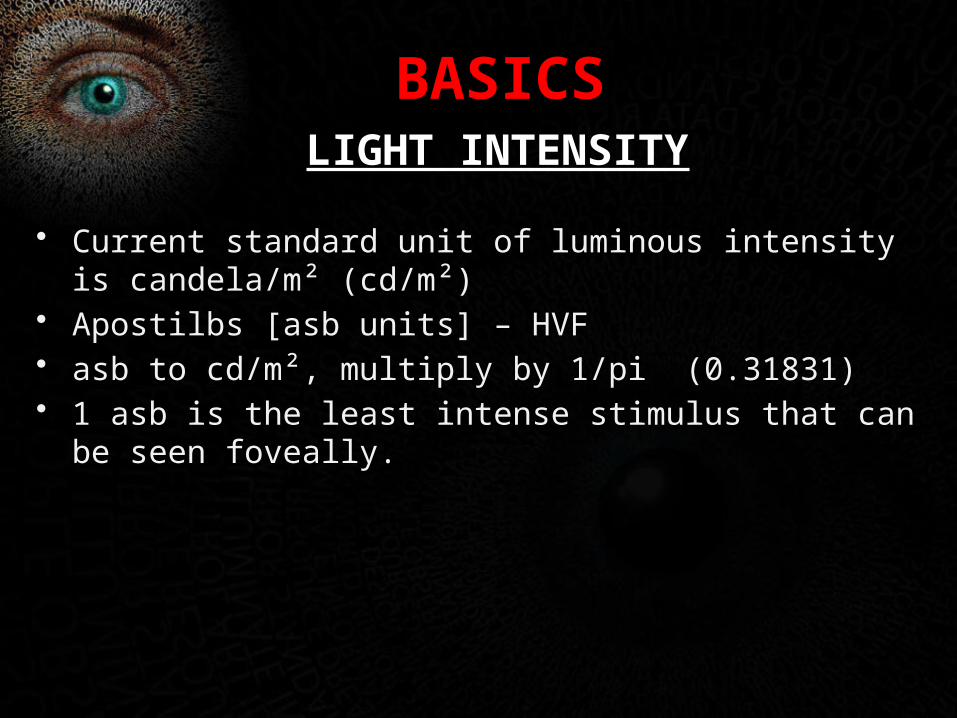
• Current standard unit of luminous intensity is candela/m² (cd/m²)
• Apostilbs [asb units] – HVF• asb to cd/m², multiply by 1/pi (0.31831)• 1 asb is the least intense stimulus that can be seen foveally.
LIGHT INTENSITY
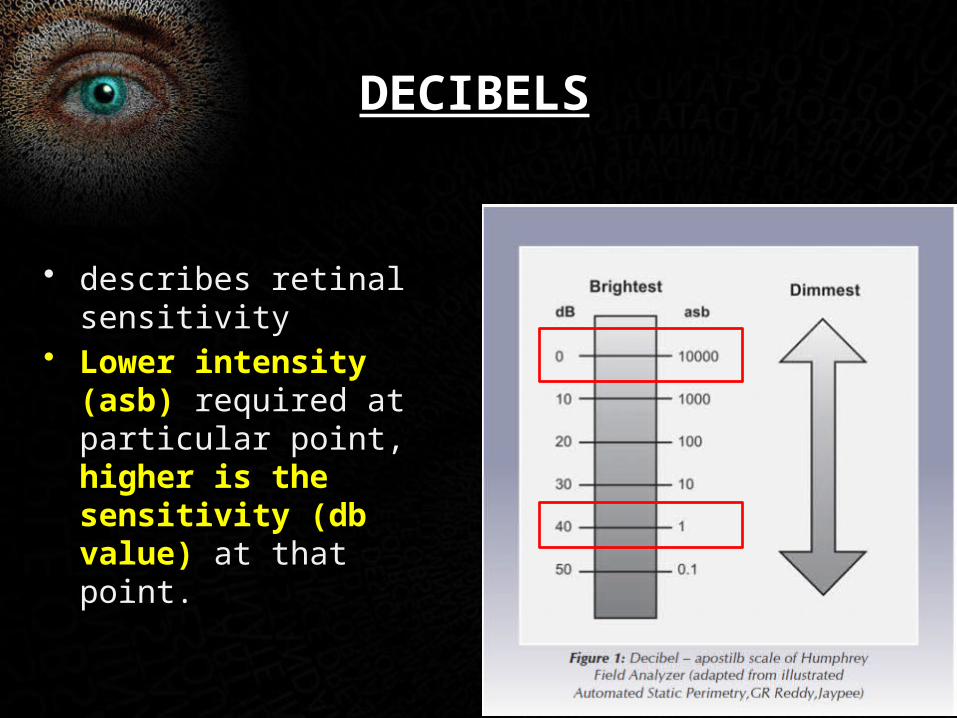
• describes retinal sensitivity
• Lower intensity (asb) required at particular point, higher is the sensitivity (db value) at that point.
DECIBELS
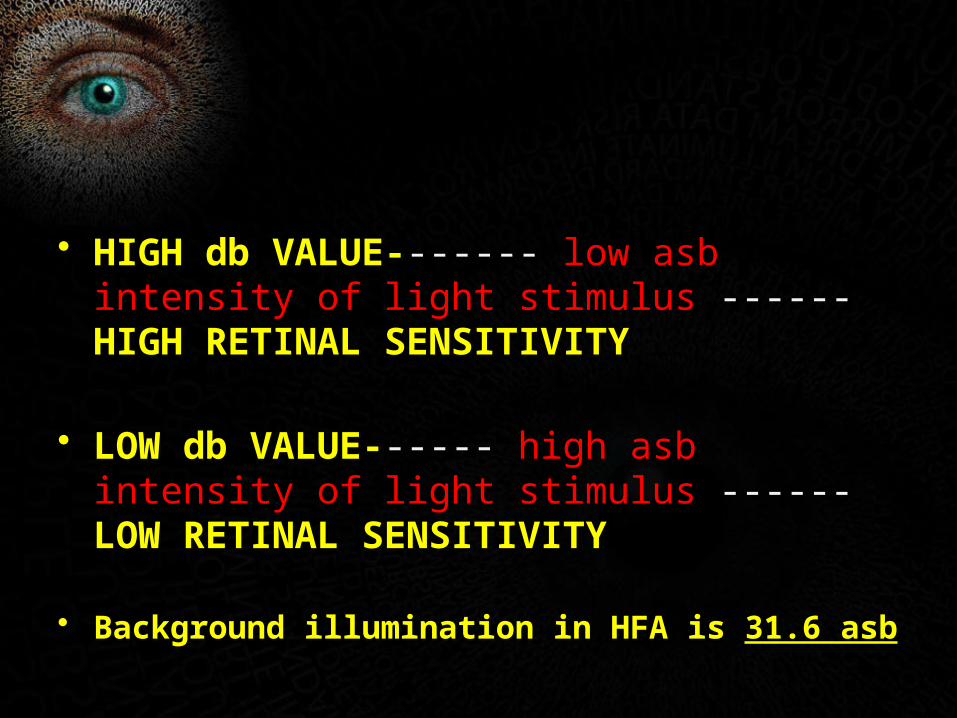
• HIGH db VALUE------- low asb intensity of light stimulus ------ HIGH RETINAL SENSITIVITY
• LOW db VALUE------ high asb intensity of light stimulus ------ LOW RETINAL SENSITIVITY
• Background illumination in HFA is 31.6 asb
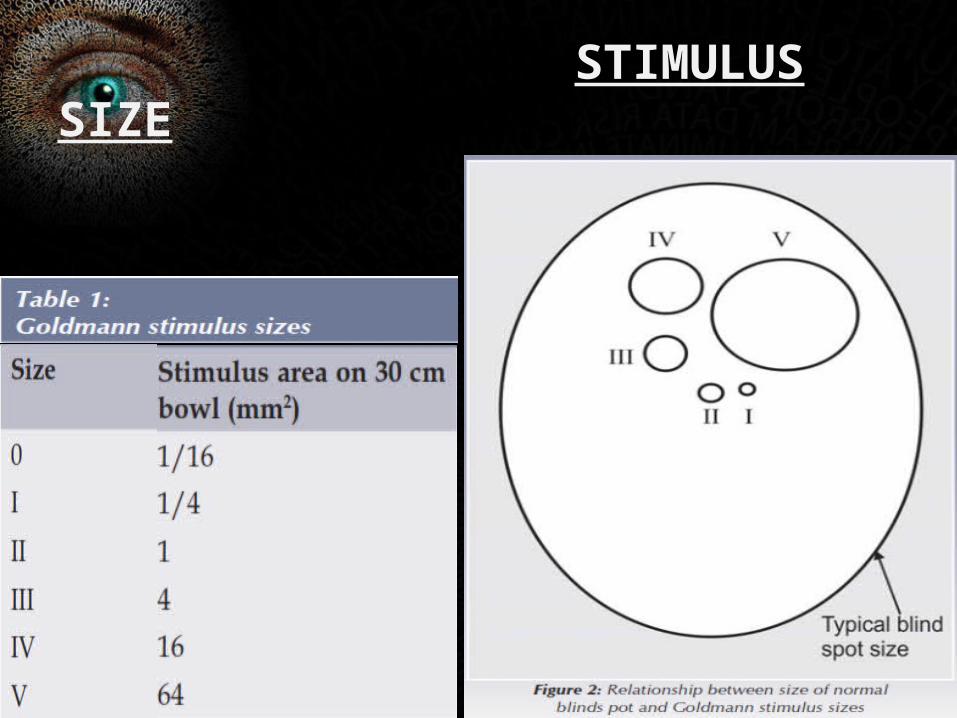
STIMULUS SIZE
THRESHOLD
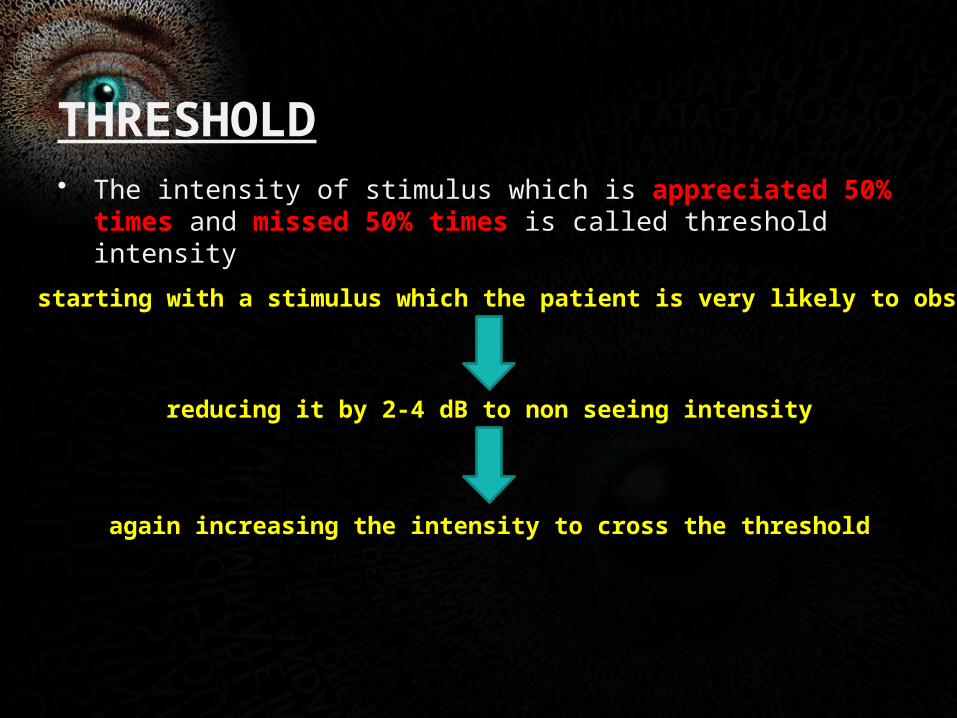
• The intensity of stimulus which is appreciated 50% times and missed 50% times is called threshold intensity
starting with a stimulus which the patient is very likely to observe
reducing it by 2-4 dB to non seeing intensity
again increasing the intensity to cross the threshold
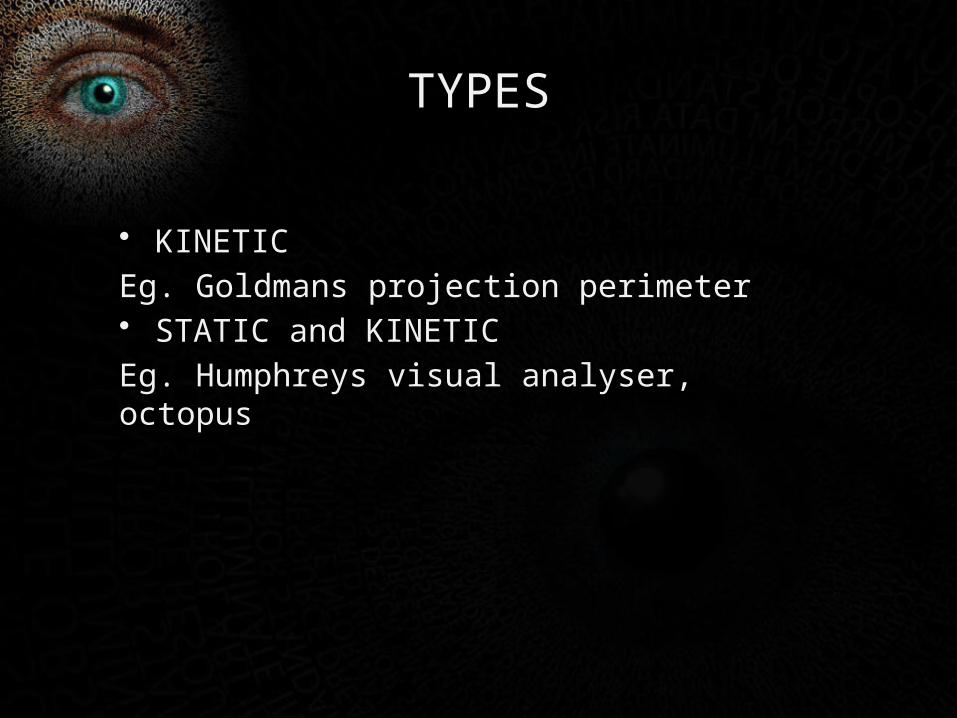
TYPES
• KINETIC
Eg. Goldmans projection perimeter• STATIC and KINETIC
Eg. Humphreys visual analyser, octopus
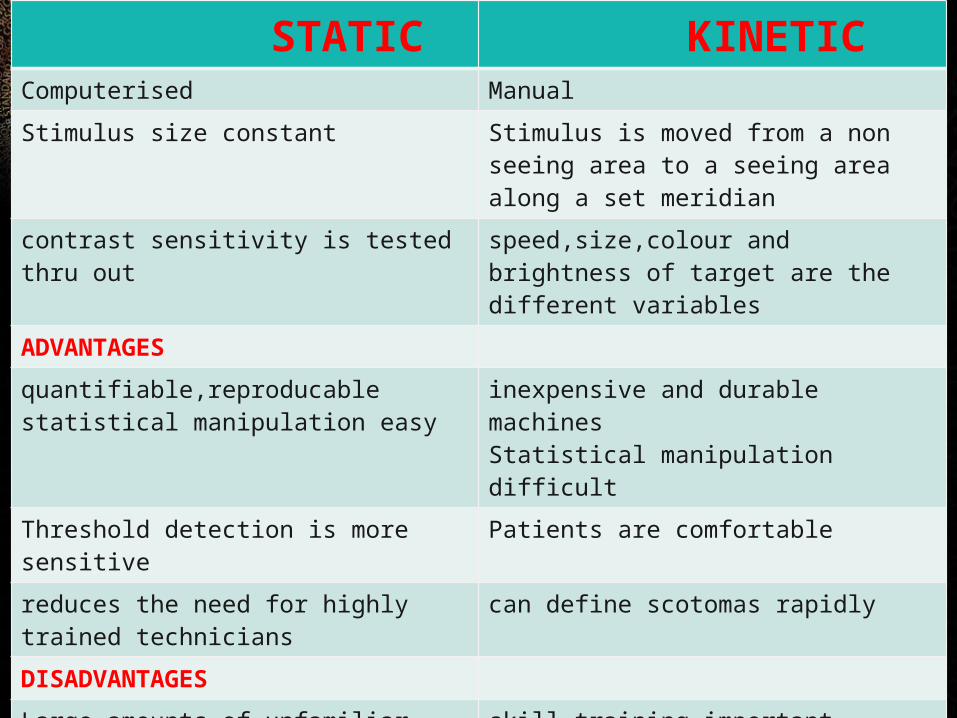
STATIC KINETICComputerised Manual
Stimulus size constant Stimulus is moved from a non seeing area to a seeing area along a set meridian
contrast sensitivity is tested thru out speed,size,colour and brightness of target are the different variables
ADVANTAGES
quantifiable,reproducablestatistical manipulation easy
inexpensive and durable machinesStatistical manipulation difficult
Threshold detection is more sensitive Patients are comfortable
reduces the need for highly trained technicians
can define scotomas rapidly
DISADVANTAGES
Large amounts of unfamiliar data interpretation difficult
skill,training important
tedious and time consuming and expensive
early or subtle changes can be overlooked
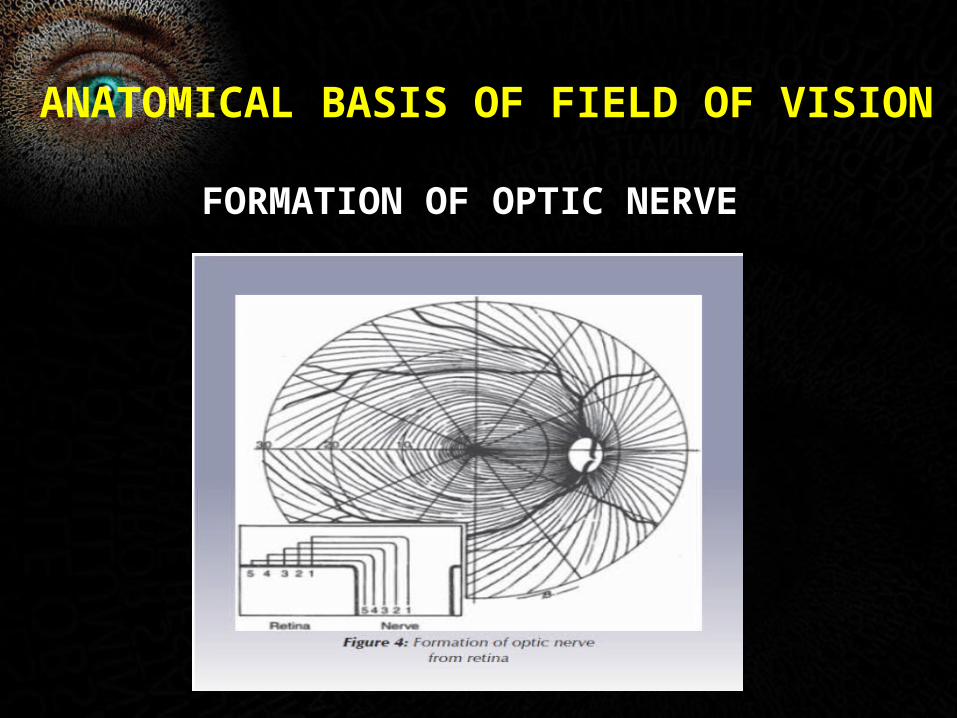
ANATOMICAL BASIS OF FIELD OF VISION
FORMATION OF OPTIC NERVE
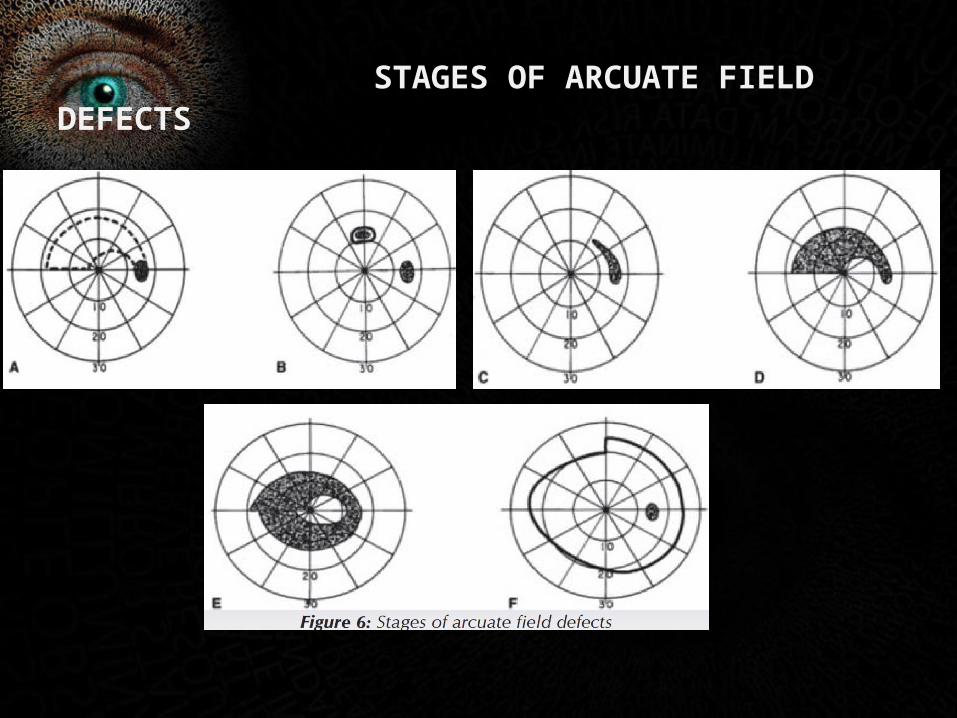
STAGES OF ARCUATE FIELD DEFECTS
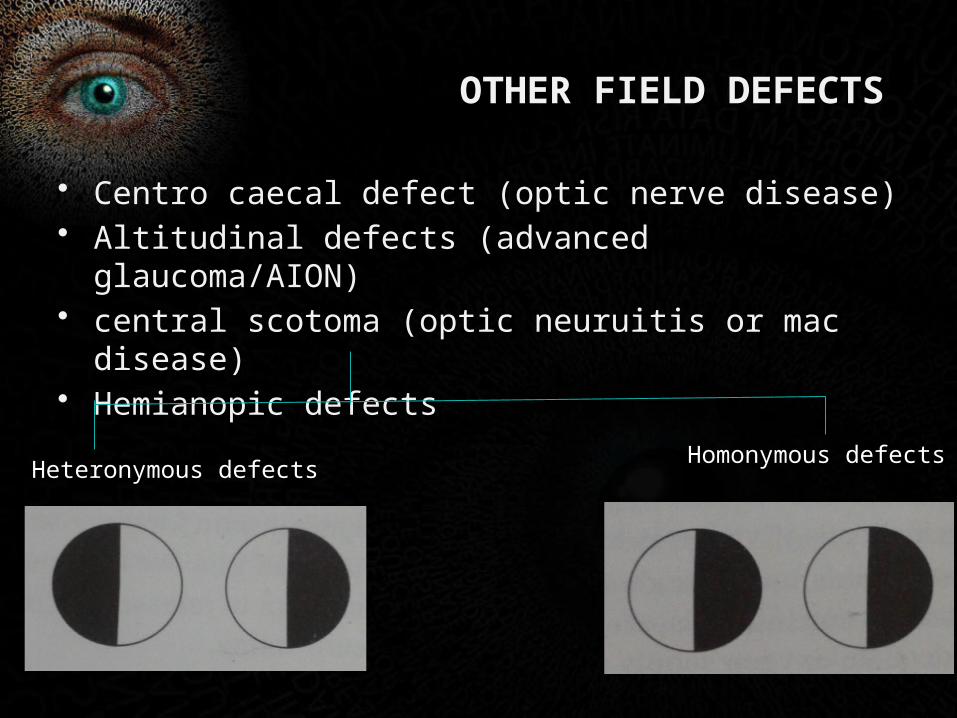
OTHER FIELD DEFECTS
• Centro caecal defect (optic nerve disease)• Altitudinal defects (advanced glaucoma/AION)• central scotoma (optic neuruitis or mac disease)• Hemianopic defects
Heteronymous defectsHomonymous defects
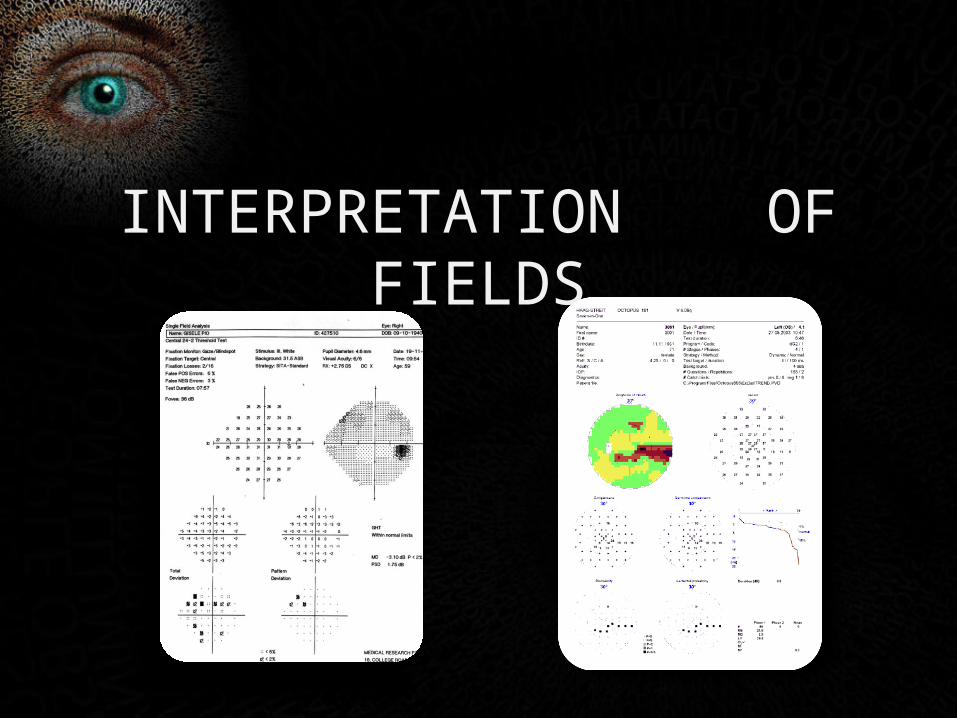
INTERPRETATION OF FIELDS
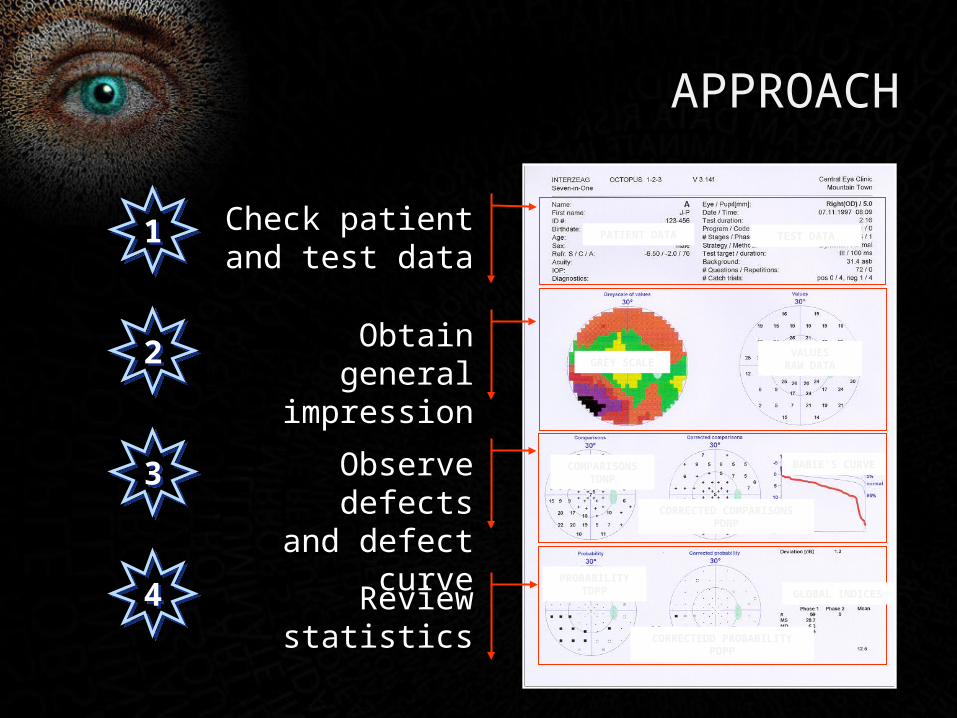
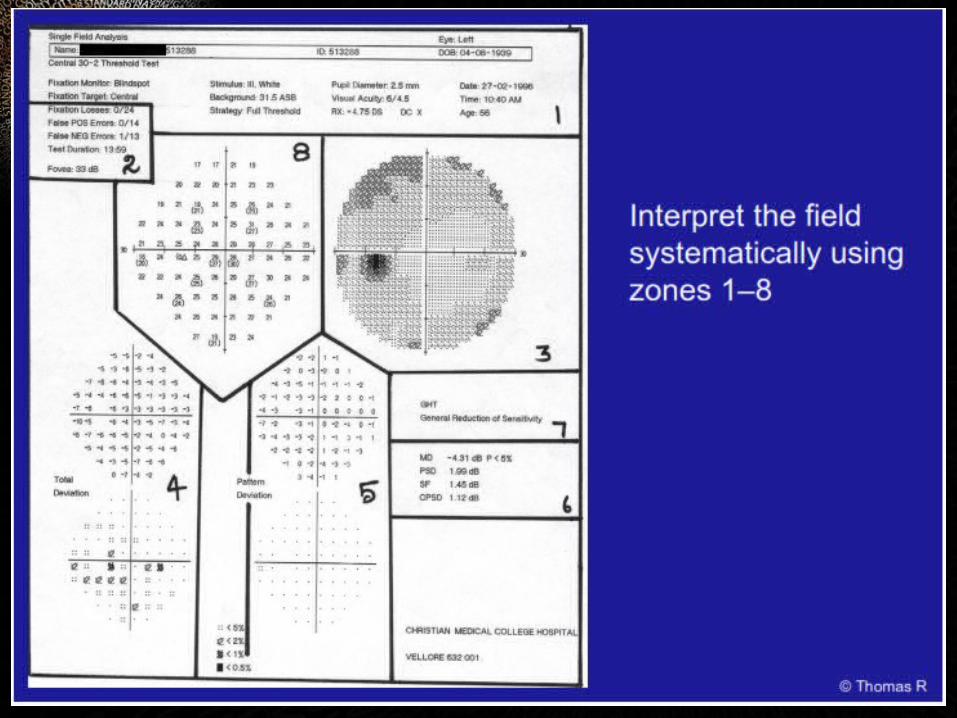
APPROACH
11 Check patient and test data
Obtain general impression
22
Observe defectsand defect curve
33
Review statistics44
PATIENT DATA
CORRECTED COMPARISONSPDNP
COMPARISONSTDNP
PROBABILITYTDPP
CORRECTEDD PROBABILITYPDPP
GLOBAL INDICES
GREY SCALEVALUES
RAW DATA
BABIE’S CURVE
TEST DATA
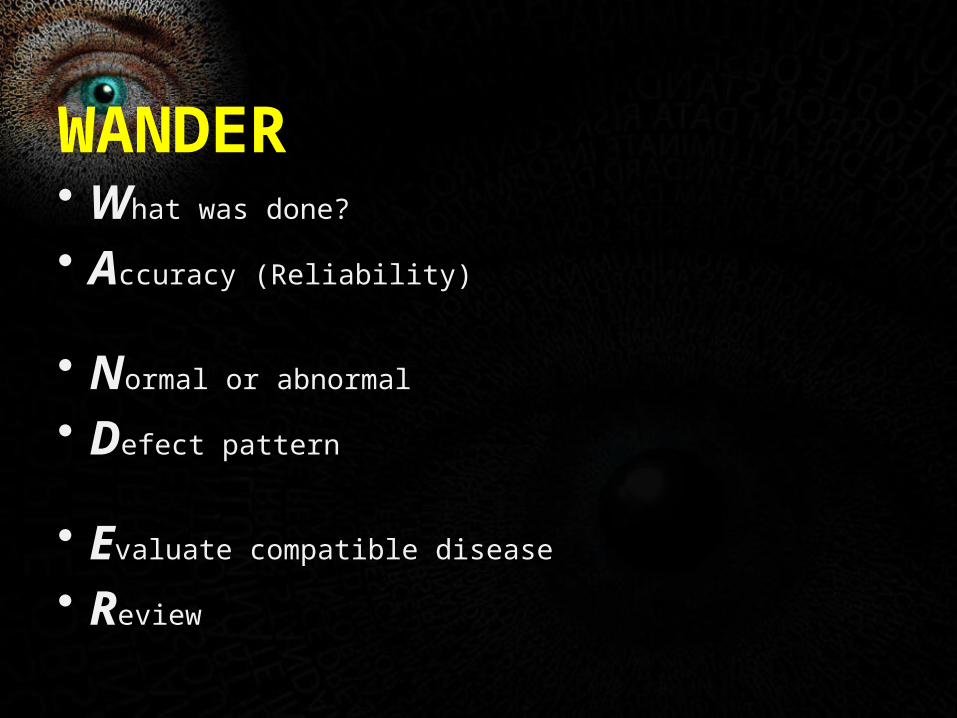
WANDER
• What was done?
• Accuracy (Reliability)
• Normal or abnormal
• Defect pattern
• Evaluate compatible disease
• Review
ZONE 1 Patient data and test parameters
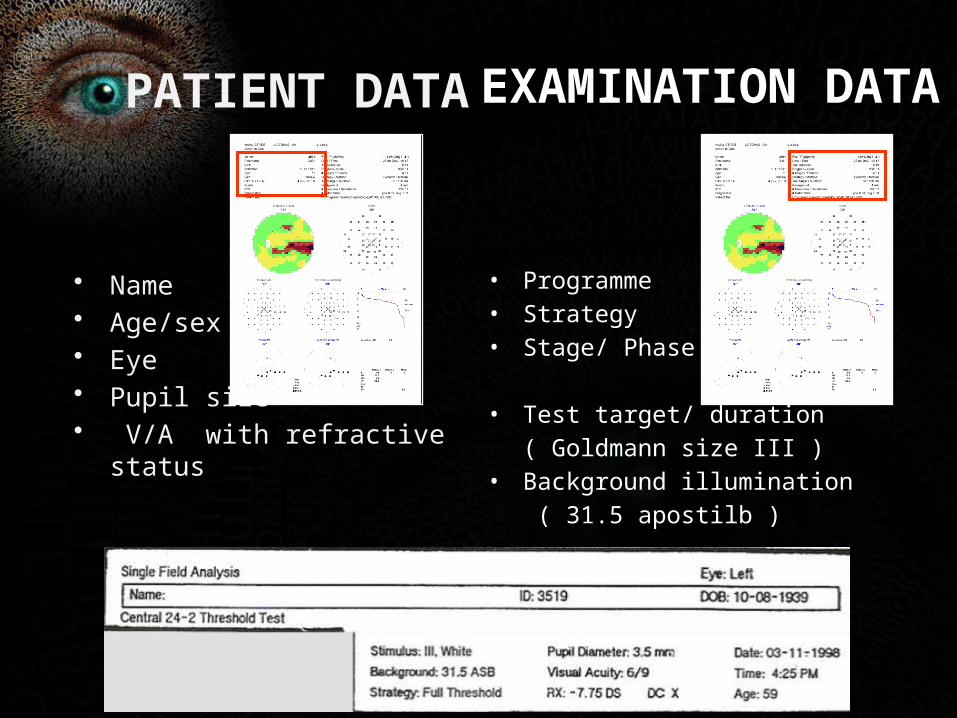
PATIENT DATA
• Name• Age/sex• Eye• Pupil size• V/A with refractive status
EXAMINATION DATA
• Programme• Strategy• Stage/ Phase
• Test target/ duration
( Goldmann size III )• Background illumination
( 31.5 apostilb )
ZONE 2reliability indices
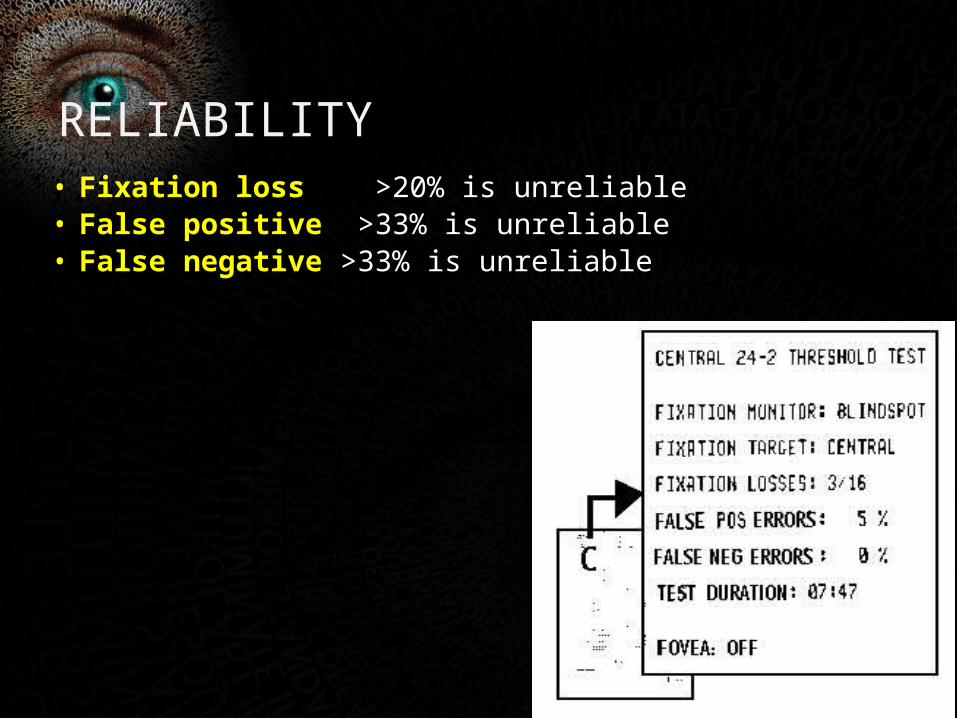
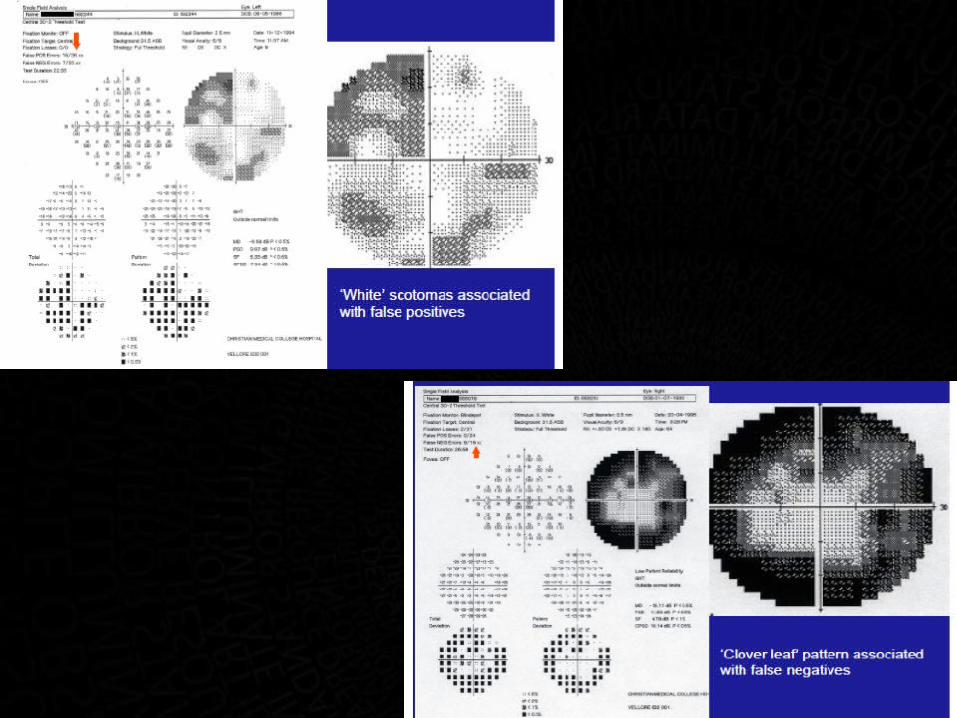
RELIABILITY
• Fixation loss >20% is unreliable• False positive >33% is unreliable• False negative >33% is unreliable
ZONE 3Grey scale
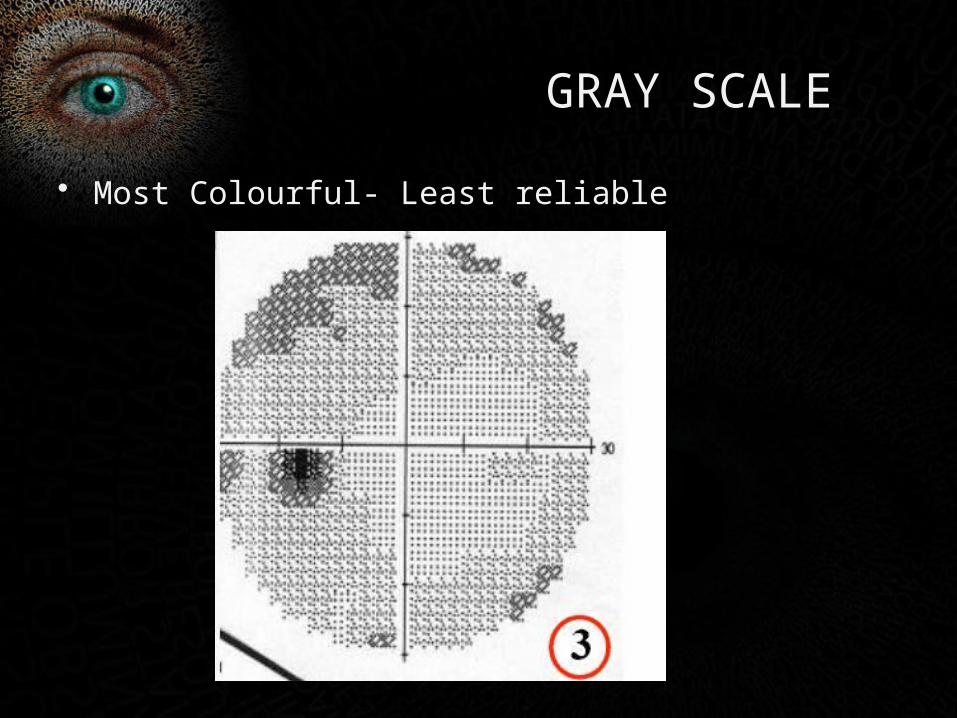
GRAY SCALE
• Most Colourful- Least reliable
ZONE 4total deviation
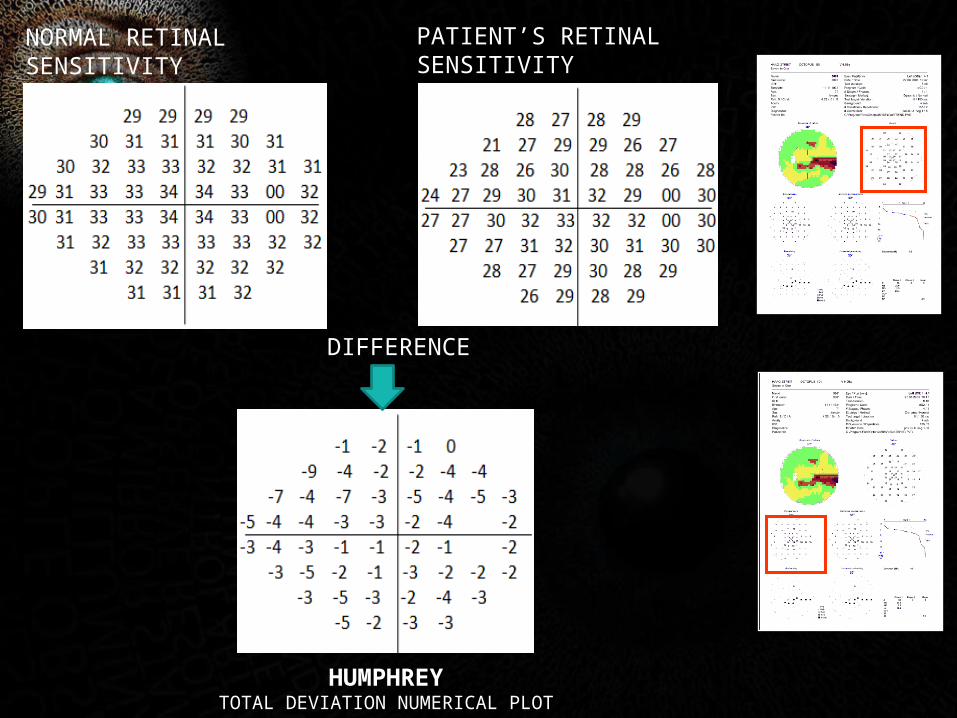
NORMAL RETINAL SENSITIVITY
PATIENT’S RETINAL SENSITIVITY
DIFFERENCE
HUMPHREYTOTAL DEVIATION NUMERICAL PLOT
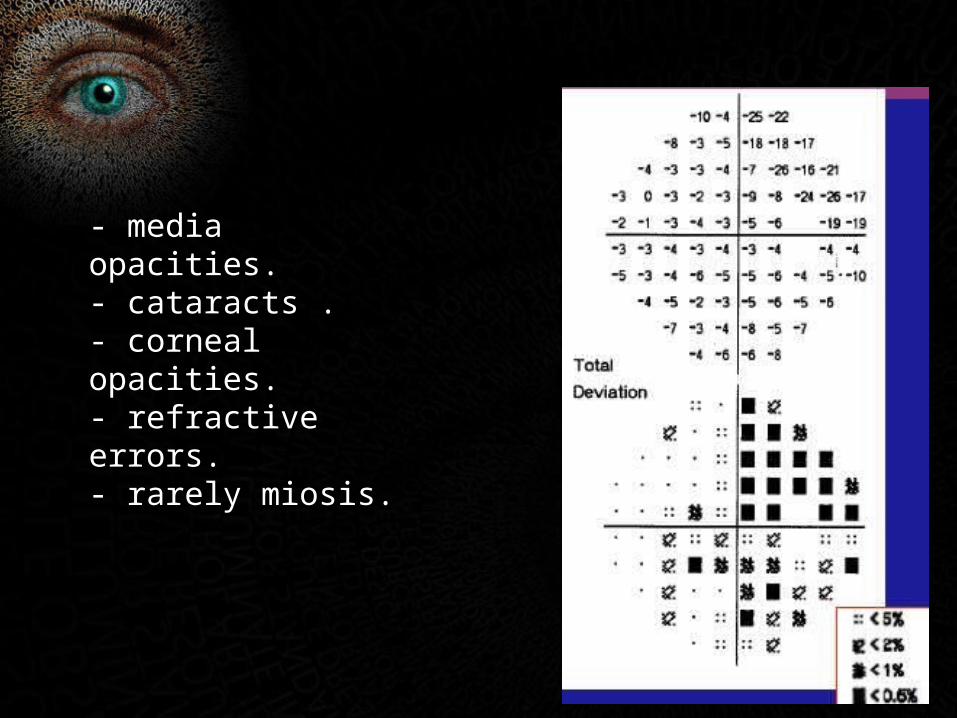
- media opacities.- cataracts .- corneal opacities.- refractive errors.- rarely miosis.
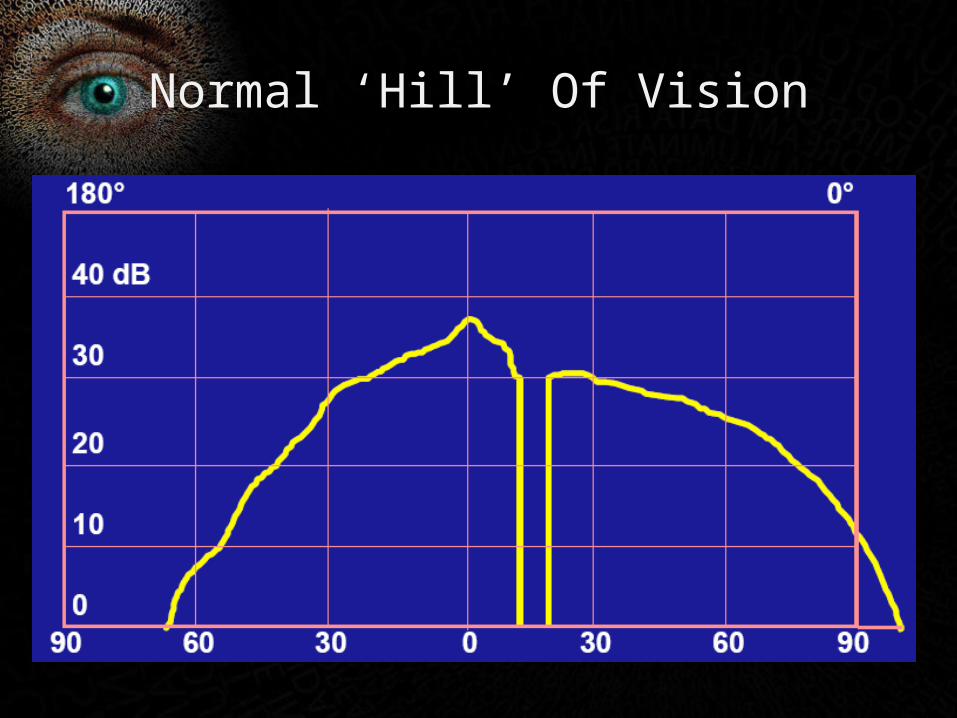
Normal ‘Hill’ Of Vision
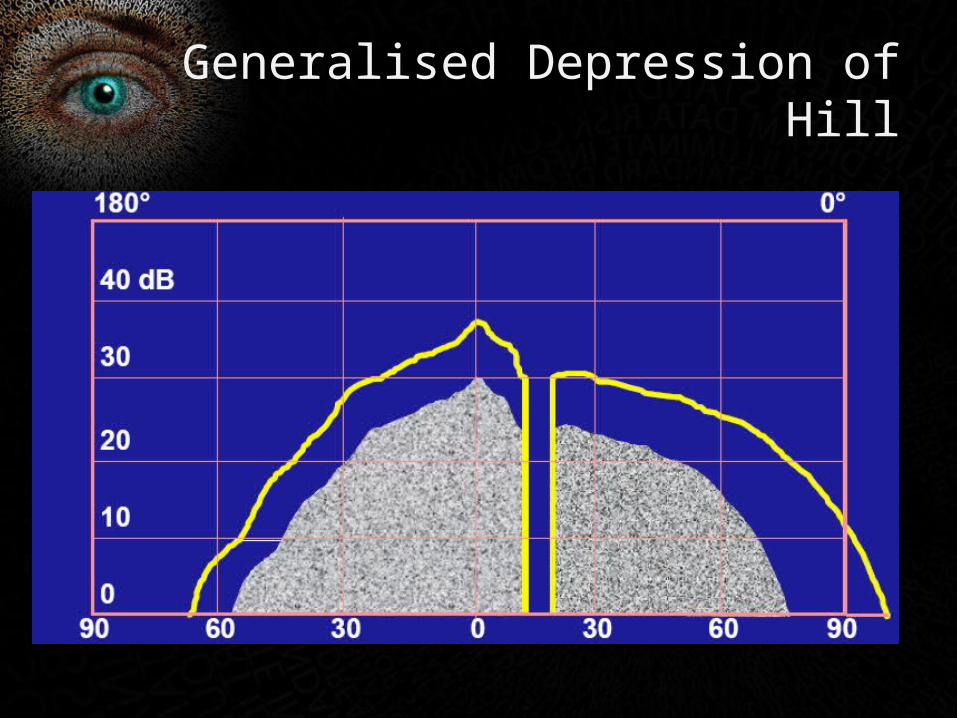
Generalised Depression of Hill
ZONE 5pattern deviation
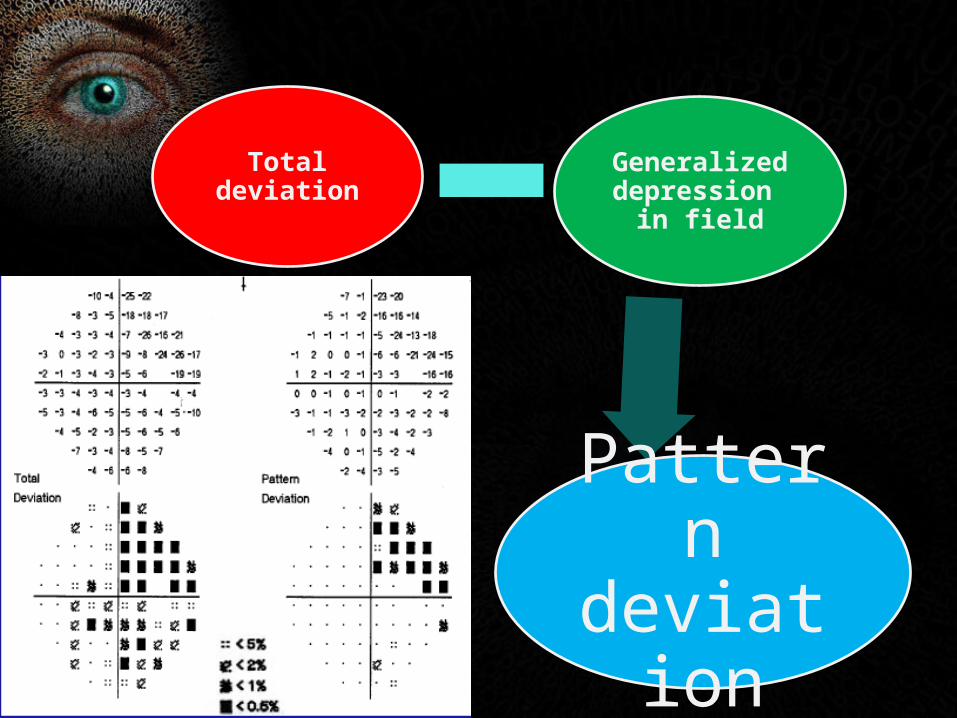
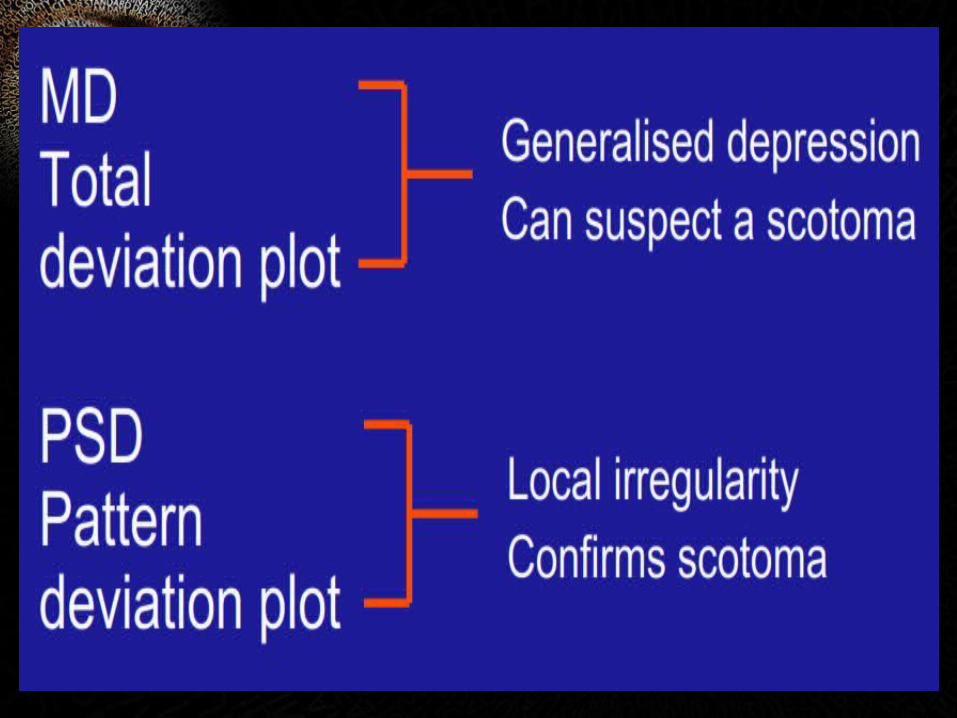
Total deviation
Generalized depression in
field
Pattern deviation
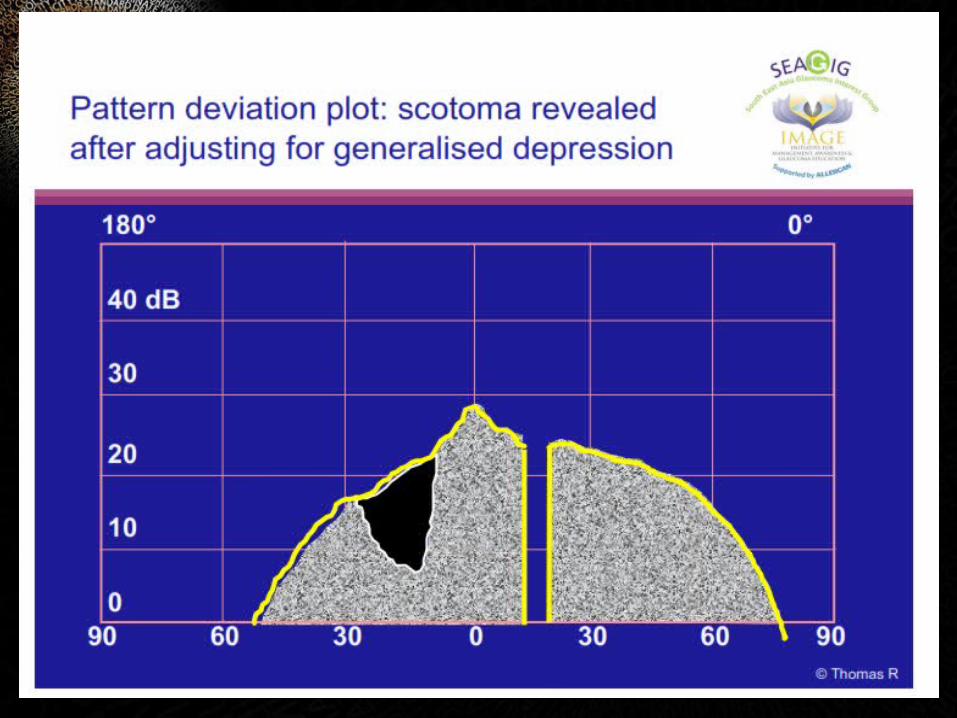
• Probability values (P) :Indicates the significance of the defects .
• Shown as P< 5%, P< 2% , P<1% and P< 0.5%.
• The lower the P value, the greater is its clinical significance
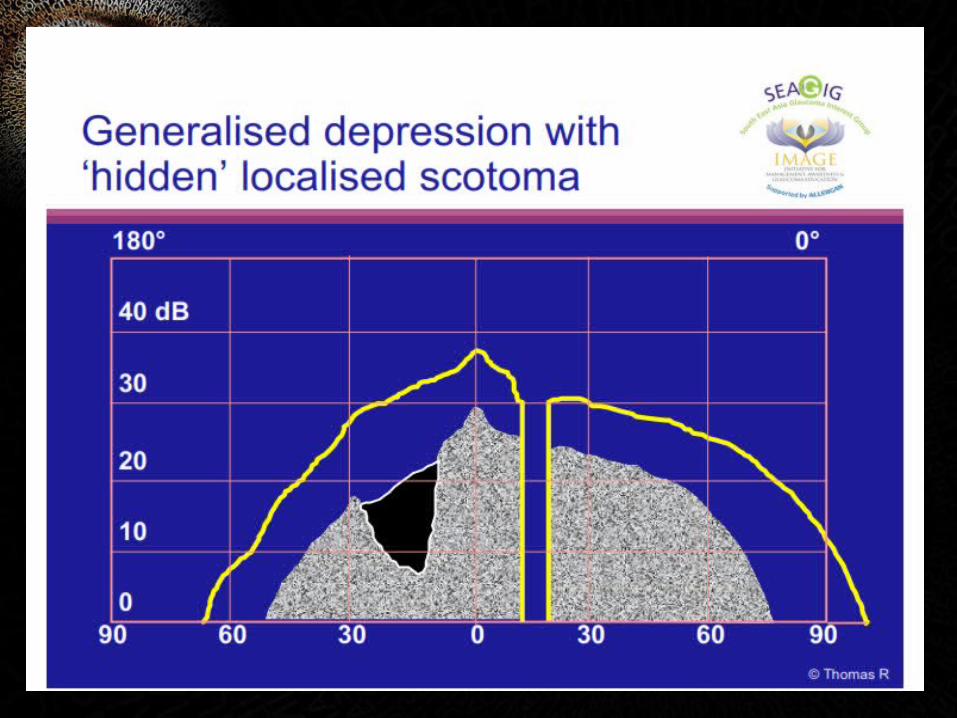
clinical significance : if there are abnormal points in total deviation plot that persist in the pattern deviation plot, we are looking at scotomas .
ZONE 6global indices

GLOBAL INDICES - MD
A
B
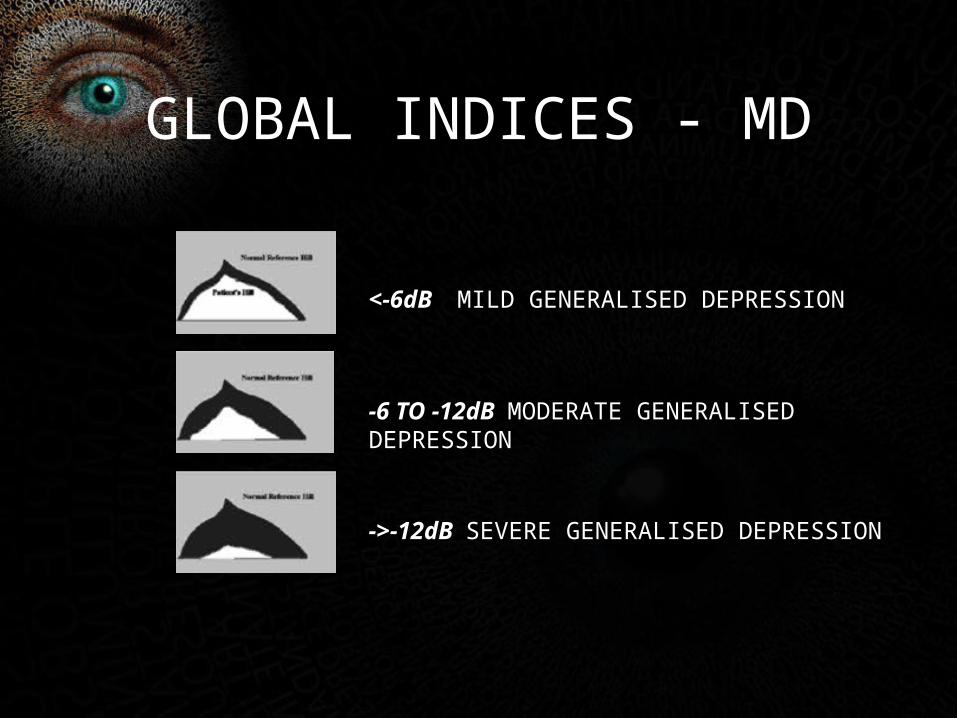
<-6dB MILD GENERALISED DEPRESSION
-6 TO -12dB MODERATE GENERALISED DEPRESSION
->-12dB SEVERE GENERALISED DEPRESSION
GLOBAL INDICES - MD
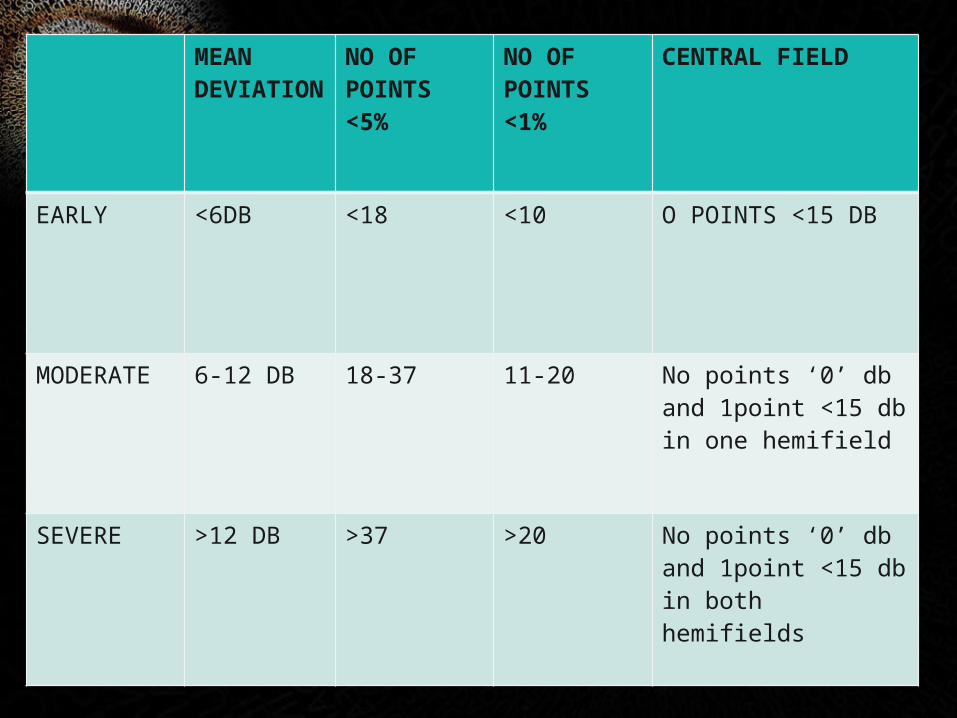
MEAN DEVIATION
NO OF POINTS <5%
NO OF POINTS <1%
CENTRAL FIELD
EARLY <6DB <18 <10 O POINTS <15 DB
MODERATE 6-12 DB 18-37 11-20 No points ‘0’ db and 1point <15 db in one hemifield
SEVERE >12 DB >37 >20 No points ‘0’ db and 1point <15 db in both hemifields
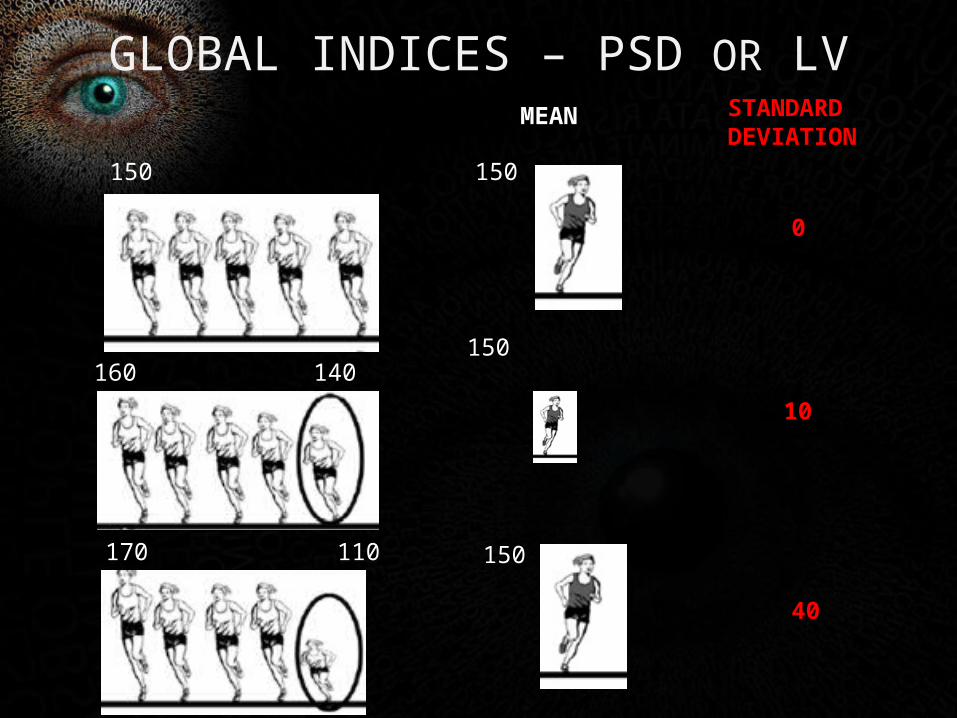
GLOBAL INDICES – PSD OR LV
150
160150
150
150
140
170 110
MEAN STANDARDDEVIATION
0
10
40
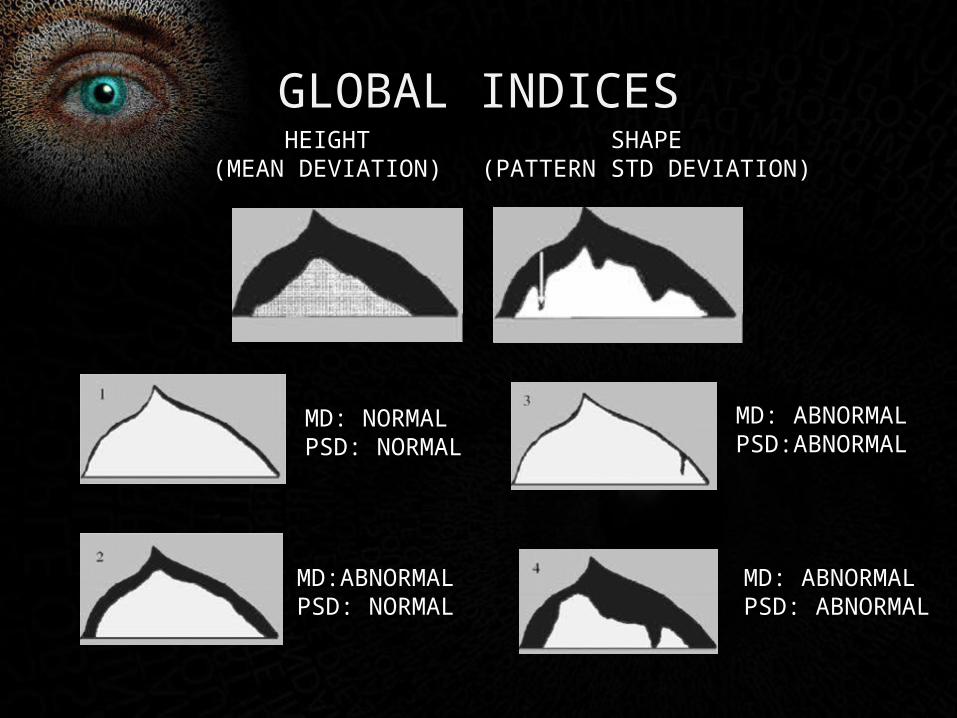
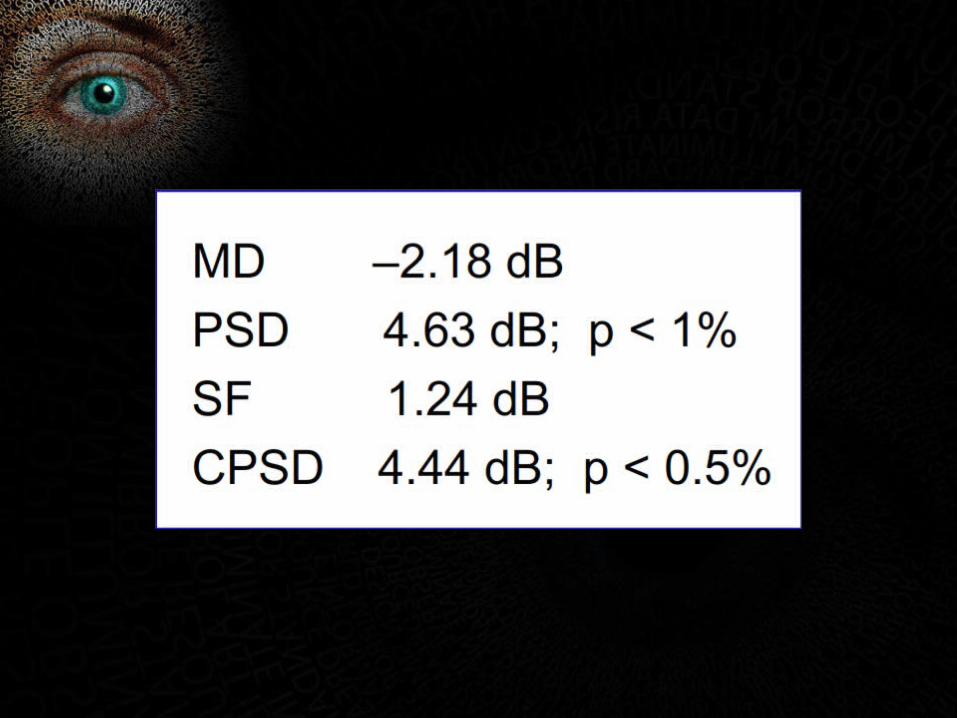
GLOBAL INDICES
MD: NORMALPSD: NORMAL
MD:ABNORMALPSD: NORMAL
MD: ABNORMALPSD:ABNORMAL
MD: ABNORMALPSD: ABNORMAL
SHAPE(PATTERN STD DEVIATION)
HEIGHT(MEAN DEVIATION)
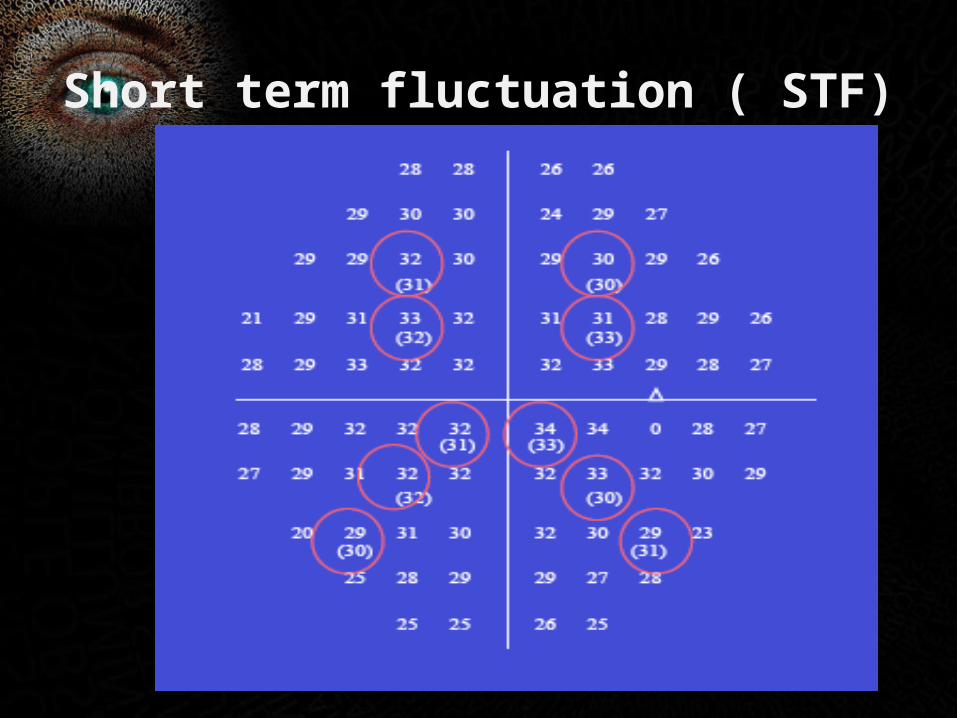
Short term fluctuation ( STF)
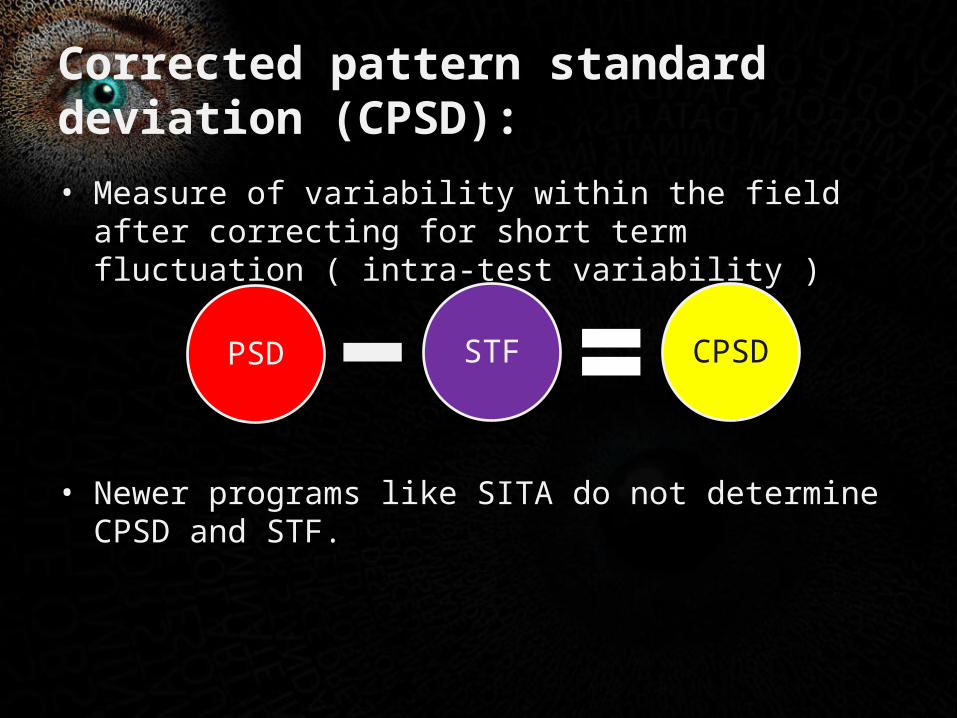
Corrected pattern standard deviation (CPSD):
• Measure of variability within the field after correcting for short term fluctuation ( intra-test variability )
• Newer programs like SITA do not determine CPSD and STF.
PSD STF CPSD
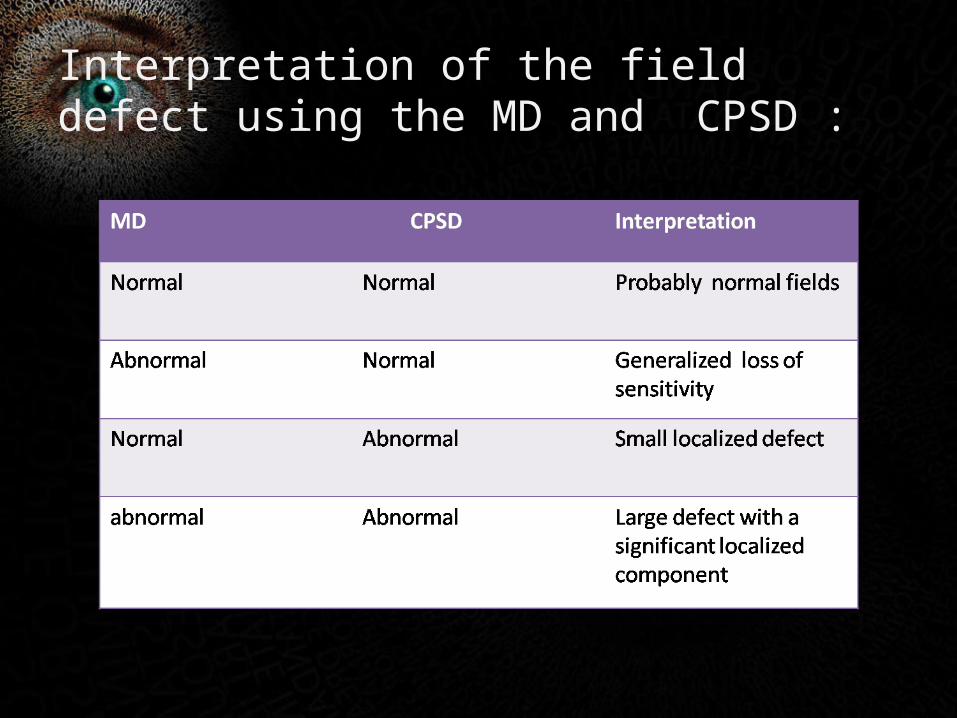
Interpretation of the field defect using the MD and CPSD :
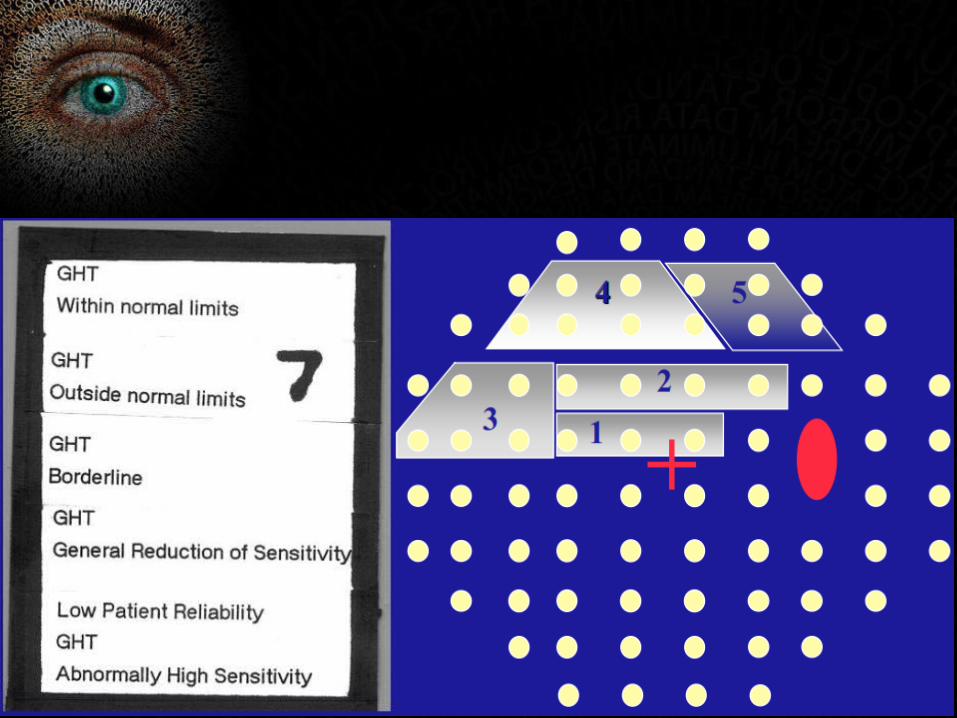
ZONE 7Glaucoma hemifield test

ZONE 8Numerical display
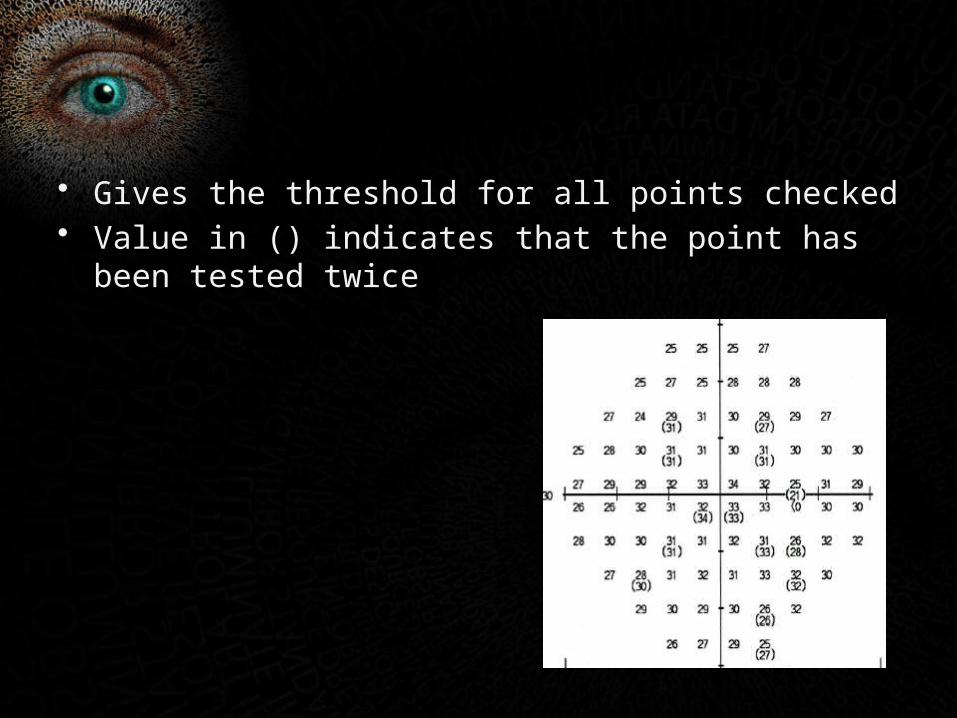
• Gives the threshold for all points checked• Value in () indicates that the point has been tested twice
IS THE DEFECT DUE TO GLAUCOMA??
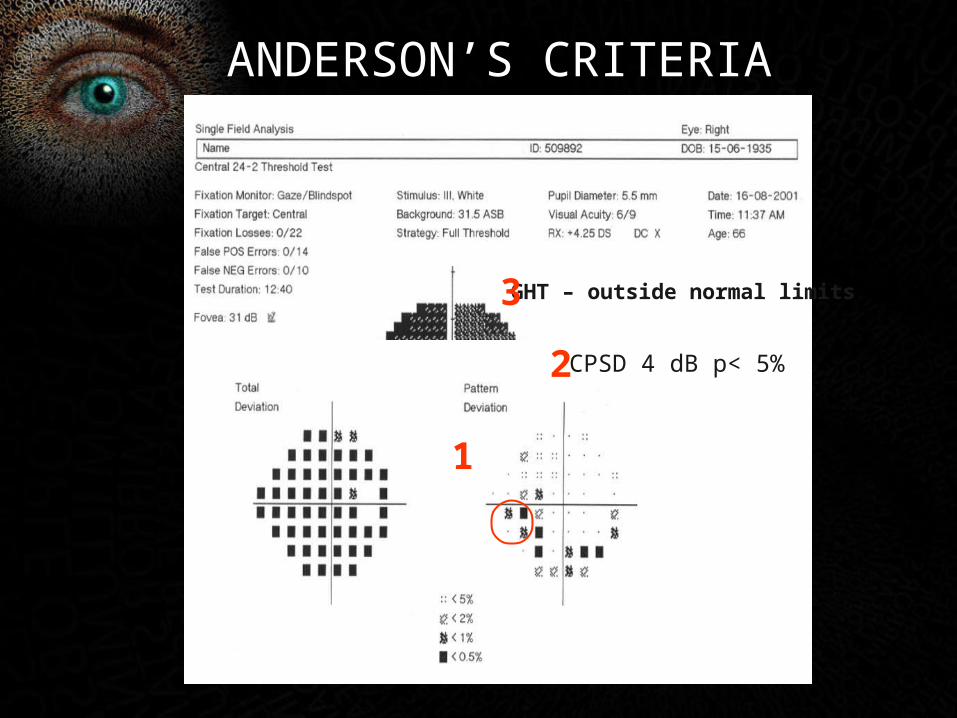
CPSD 4 dB P <5%
GHT – outside normal limits
ANDERSON’S CRITERIA
1
2
3
CPSD 4 dB p< 5%
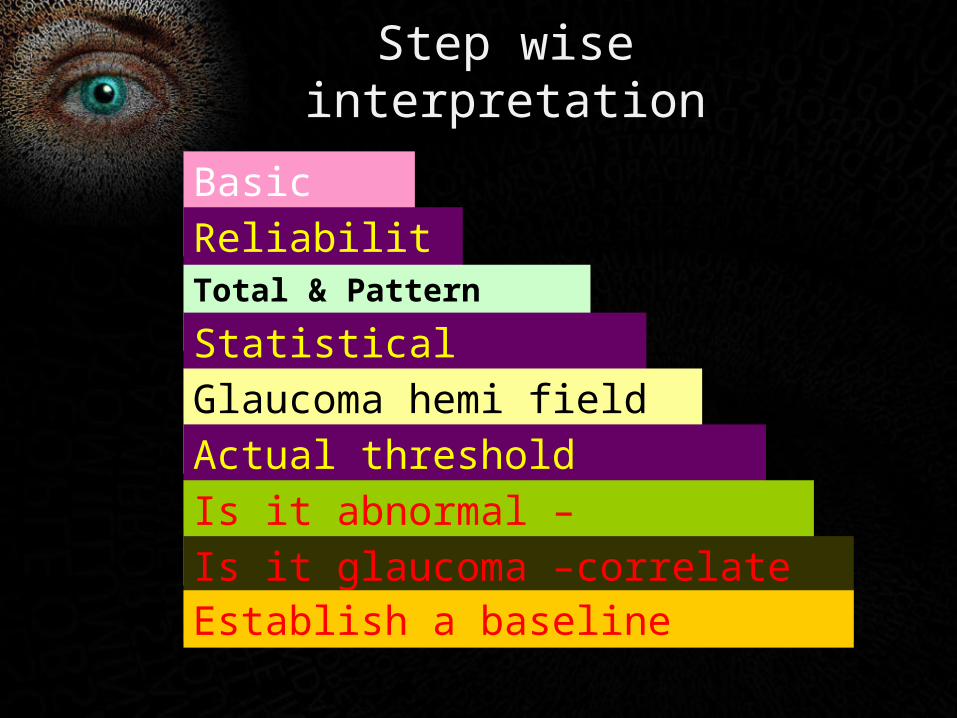
Step wise interpretation
Basic data
ReliabilityTotal & Pattern deviation
Statistical indices
Glaucoma hemi field test
Actual threshold values/fovea
Is it abnormal –Anderson’s criteria
Is it glaucoma –correlate clinicallyEstablish a baseline

TEST 30-2 24-2 10-2 MAC PROGRAMME
TEST POINTS 76 54 68 16
DENSITY(DEGREES)
6 6 2 2
BARE AREA AROUND FIXATION PT
3 DEGREES 3 1 1
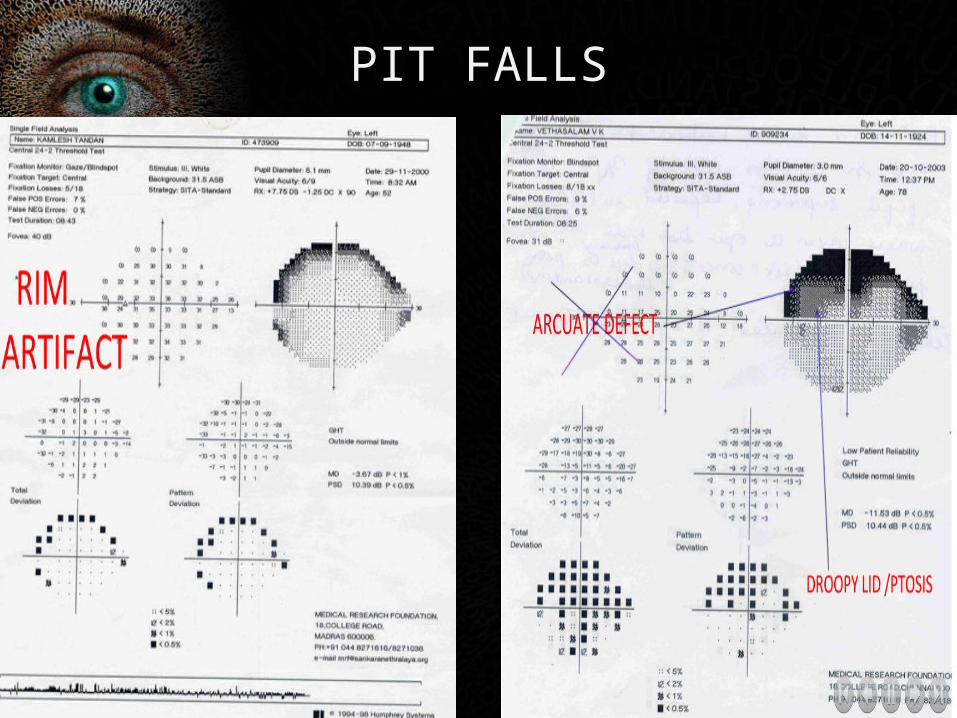
PIT FALLS


ARTEFACTS
• OBSTRUCTION
RIM ARTEFACTS
PTOSIS
MEDIA OPACITIES
ANGIOSCOTOMA
• MIOSIS
• REFRACTION ARTEFACTS• HIGH POWER PLUS AND MINUS LENSES

PRACTICAL PEARLS(DURING RECORDING)
• pause the test in between if he/she is tired• >50% stimulus will not be seen so that he is reassured
and does not press the trigger due to impatience• Should have taken enough rest,may be given coffee,
ensure he is attentive• Give practice sessions esp to glaucoma patients• Close other eye well• If test is abnormal repeat• Always record same program which was done earlier

T h a n k Y o u !!