autistic children exhibit decreased levels of essential
TRANSCRIPT
Autistic Children Exhibit Decreased Levelsof Essential Fatty Acids in Red Blood Cells
The Harvard community has made thisarticle openly available. Please share howthis access benefits you. Your story matters
Citation Brigandi, Sarah A., Hong Shao, Steven Y. Qian, Yiping Shen, Bai-LinWu, and Jing X. Kang. 2015. “Autistic Children Exhibit DecreasedLevels of Essential Fatty Acids in Red Blood Cells.” InternationalJournal of Molecular Sciences 16 (5): 10061-10076. doi:10.3390/ijms160510061. http://dx.doi.org/10.3390/ijms160510061.
Published Version doi:10.3390/ijms160510061
Citable link http://nrs.harvard.edu/urn-3:HUL.InstRepos:17295751
Terms of Use This article was downloaded from Harvard University’s DASHrepository, and is made available under the terms and conditionsapplicable to Other Posted Material, as set forth at http://nrs.harvard.edu/urn-3:HUL.InstRepos:dash.current.terms-of-use#LAA
Int. J. Mol. Sci. 2015, 16, 10061-10076; doi:10.3390/ijms160510061
International Journal of
Molecular Sciences ISSN 1422-0067
www.mdpi.com/journal/ijms
Article
Autistic Children Exhibit Decreased Levels of Essential Fatty Acids in Red Blood Cells
Sarah A. Brigandi 1, Hong Shao 2, Steven Y. Qian 3, Yiping Shen 2, Bai-Lin Wu 2 and
Jing X. Kang 1,*
1 Laboratory of Lipid Medicine and Technology, Department of Medicine,
Massachusetts General Hospital and Harvard Medical School, Boston, MA 02129, USA;
E-Mail: [email protected] 2 Genetics Diagnostic Lab, Department of Laboratory Medicine and Pathology,
Children’s Hospital Boston and Harvard Medical School, Boston, MA 02114, USA;
E-Mails: [email protected] (H.S.); [email protected] (Y.S.);
[email protected] (B.-L.W.) 3 Department of Pharmaceutical Science, North Dakota State University, Fargo, ND 58108, USA;
E-Mail: [email protected]
* Author to whom correspondence should be addressed; E-Mail: [email protected];
Tel.: +1-617-726-8509; Fax: +1-617-726-6144.
Academic Editor: Giuseppe Astarita
Received: 27 February 2015 / Accepted: 29 April 2015 / Published: 4 May 2015
Abstract: Omega-6 (n-6) and omega-3 (n-3) polyunsaturated fatty acids (PUFA) are
essential nutrients for brain development and function. However, whether or not the levels
of these fatty acids are altered in individuals with autism remains debatable. In this study,
we compared the fatty acid contents between 121 autistic patients and 110 non-autistic,
non-developmentally delayed controls, aged 3–17. Analysis of the fatty acid composition
of red blood cell (RBC) membrane phospholipids showed that the percentage of total
PUFA was lower in autistic patients than in controls; levels of n-6 arachidonic acid (AA)
and n-3 docosahexaenoic acid (DHA) were particularly decreased (p < 0.001). In addition,
plasma levels of the pro-inflammatory AA metabolite prostaglandin E2 (PGE2) were higher
in a subset of the autistic participants (n = 20) compared to controls. Our study demonstrates
an alteration in the PUFA profile and increased production of a PUFA-derived metabolite
in autistic patients, supporting the hypothesis that abnormal lipid metabolism is implicated
in autism.
OPEN ACCESS
Int. J. Mol. Sci. 2015, 16 10062
Keywords: polyunsaturated fatty acids; omega-6 and omega-3 fatty acids; prostaglandin E2;
lipid metabolism; neuroinflammation; autism
1. Introduction
Autism spectrum disorders (ASD) are a group of related neurological developmental disorders that
affect approximately 45 to 110 individuals per 10,000 [1]. ASD includes Autism, Asperger Syndrome,
and pervasive developmental disorder, not otherwise specified (PDD-NOS). Autism symptoms arise
early in childhood and include varying degrees of communication and social interaction impairments,
limited and repetitive behaviors, and often issues with motor coordination [2,3]. Autism has been
classified as a heterogeneous disease that likely results from the complex interaction of multiple genes
with environmental factors [4]. While some studies suggest that genetics play a role in the majority of
autism cases [4], only 10% of cases can be explained by known chromosomal abnormalities [5].
Further, a recent study of twins suggests that genetic involvement may be overestimated in literature and
that environmental factors may play a larger role than previously described [6]. Potential environmental
risk factors include maternal diet [7], maternal hospital-associated bacterial infections during
pregnancy [8], maternal exposure to air pollutants [9], parental age [4], and infant nutrition [10].
Recent studies have also shown relationships between maternal anti-cerebellar antibodies and the
severity in autism in children [11].
Post-mortem analyses and neuroimaging studies of individuals with autism have provided insight
into the pathology of the disease, including dysfunctional neuronal synapses, decreased cerebellar
gray and white matter, enlargement of the amygdala, and abnormal growth patterns in the frontal
cortex [4,12]. The mechanism by which these neurological effects take place is still unanswered; over
the last decade, particular interest has emerged in studying the potential connection between levels of
different fatty acids in body tissues and the occurrence of autism, as fatty acids play a crucial role in
brain development [10,12–14]. Fatty acids make up 60% of the dry weight of the brain, and 20% are
long-chain polyunsaturated fatty acids (PUFA) [14,15]. The two most abundant PUFA in the brain are
omega-3 docosahexaenoic acid (C22:6 n-3; DHA) and omega-6 arachidonic acid (C20:4 n-6; AA).
These PUFA play an important role in the composition of neuronal membranes, which in turn affects
membrane fluidity and the structure and function of transmembrane proteins. One class of affected
transmembrane proteins is the G-coupled protein receptors (GPCRs), which modulate propagation of
signals at neuronal synapses and affect downstream signaling pathways and gene expression [16,17].
Concentration of DHA is high at neuronal synapses and has been shown to positively correlate with
sodium potassium pump activity in the brain, demonstrating its importance in the maintenance of
neuronal membrane potentials [13,16]. Phospholipids are a particularly relevant type of lipid to be
studied in relation to autism, as they are highly abundant in the neuronal membranes and their fatty
acid composition is known to reflect long-term fat intake and storage [18,19]. The red blood cell
(RBC) phospholipid fatty acid profile is also thought to be a reliable biomarker for fatty acid status in
tissues and organs, including the brain [20].
Int. J. Mol. Sci. 2015, 16 10063
Small studies comparing the PUFA levels of plasma or RBC phospholipids between autistic and
control individuals have reported mixed results. For example, Vancassel et al. [14] compared
plasma phospholipid levels between 15 autistic children and 18 mentally delayed control participants.
They found that total n-3 PUFA were significantly lower in the autistic test group, while AA and DHA
levels were moderately reduced. Similarly, Bell et al. [18] found significantly lower AA levels in the
RBC phospholipids of individuals with regressive autism (n = 18) than in controls (n = 55). A more
recent study by Bell and colleagues [21] found that total n-6 PUFA were lower in the autistic test
group (n = 45) than in pair-matched developmentally delayed controls. Conversely, Bu et al. [22]
showed no significant differences in RBC membrane phospholipids of PUFA levels between autistic
individuals and age-matched controls (n = 20). The largest study to date comparing plasma
phospholipids of autistic (n = 153) and typically developing children (n = 97) was conducted by Weist
and colleagues in 2009 [5]. They found that in the phospholipid class of phosphatidylcholine, DHA
was significantly lower in the autistic group than in the general population, while phospholipid AA
levels were not significantly different between the groups, although AA was found to be significantly
lower in free fatty acids of the autistic participants.
While both plasma and RBC phospholipids have been found to correlate with the PUFA status of
other tissues, PUFA levels in plasma and in RBC phospholipids have also been found to differ
considerably from each other [19,23]. Notably, data produced by Bell et al. [21] indicates that weight
percentages of phospholipid PUFA differed between plasma and RBC samples in autistic individuals.
Since the largest fatty acid profiling study to date only analyzed plasma PUFA, a large study of the
PUFA content of RBC phospholipids in autism is warranted.
One hypothesis regarding a potential mechanism for lower PUFA levels in autistic individuals is that
the PUFA metabolism pathway may be overactive in autism, leading to rapid conversion from AA and
DHA to their respective eicosanoids [24]. Altered lipid metabolism has been linked to other neurological
disorders, including attention deficit disorder and schizophrenia [18,25,26]. Small studies with autism
have also shown that children with autism have increased markers of lipid peroxidation [27], evidence of
mitochondrial dysfunction [28], and increased levels of AA metabolites [29]. An increased level of the
pro-inflammatory AA metabolite, prostaglandin E2 (PGE2), increases the risk of neuroinflammation,
which can lead to excessive production of reactive oxygen species (ROS). High levels of ROS
can cause DNA damage, proteolysis, and lipid damage, affecting the growth, development, and
migration of neurons [30,31]. In a small study, Meguid et al. [30] found that autistic children had
lower levels of the antioxidants glutathione peroxidase and superoxide dismutase, necessary to combat
ROS damage. Importantly, DHA has been found to increase levels of the anti-oxidant glutathione [31].
Further, lipoxins derived from AA and resolvins and neuroprotectins derived from DHA help
counteract neuroinflammation [16,31]. Rapid PUFA metabolism may therefore decrease levels of these
anti-inflammatory molecules.
As the pathway of PUFA metabolism in Figure 1 shows, metabolism of both n-6 and n-3 PUFA
occurs through the same pathway of desaturase and elongase enzyme activity, which convert the
essential substrate n-6 linoleic (LA) and n-3 α-linolenic (ALA) PUFA into longer-chain fatty acids,
notably n-6 AA and n-3 EPA/DHA, respectively. Through the cyclooxygenase (COX) and
lipoxygenase (LOX) pathways, AA and EPA are converted into eicosanoids and lipid mediators.
Since PUFA are critically important in brain maturation, rapid conversion of these fatty acids to their
Int. J. Mol. Sci. 2015, 16 10064
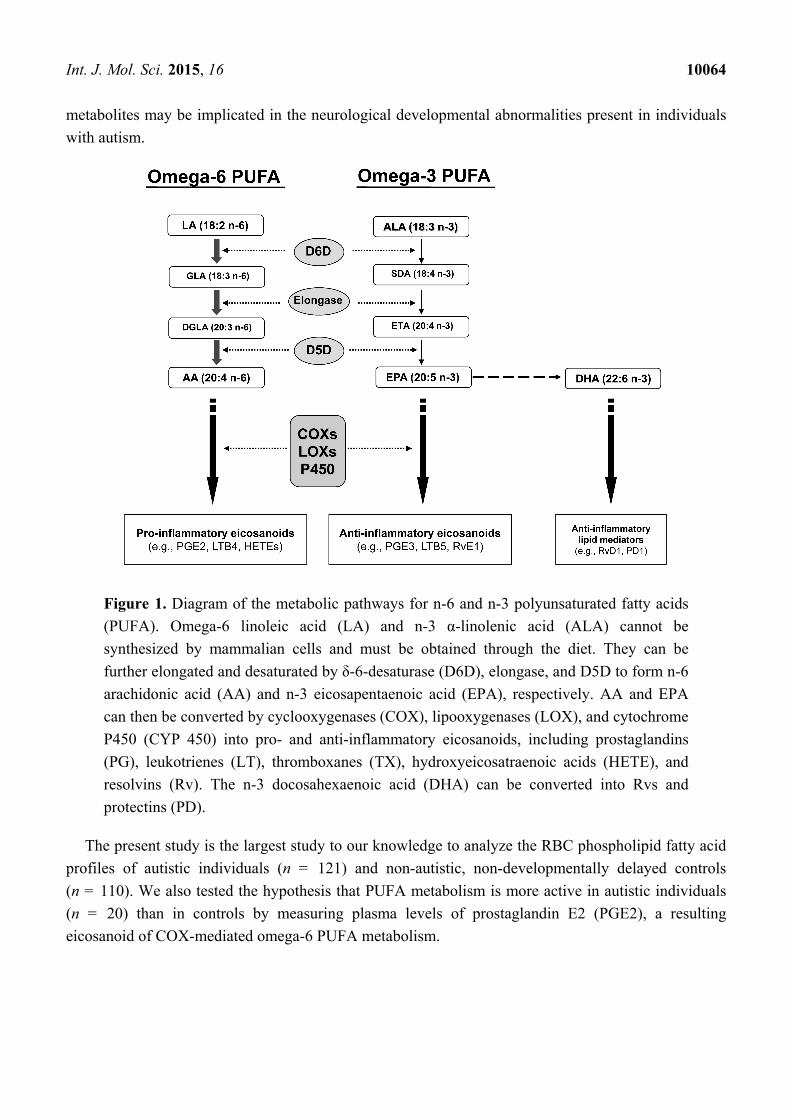
metabolites may be implicated in the neurological developmental abnormalities present in individuals
with autism.
Figure 1. Diagram of the metabolic pathways for n-6 and n-3 polyunsaturated fatty acids
(PUFA). Omega-6 linoleic acid (LA) and n-3 α-linolenic acid (ALA) cannot be
synthesized by mammalian cells and must be obtained through the diet. They can be
further elongated and desaturated by δ-6-desaturase (D6D), elongase, and D5D to form n-6
arachidonic acid (AA) and n-3 eicosapentaenoic acid (EPA), respectively. AA and EPA
can then be converted by cyclooxygenases (COX), lipooxygenases (LOX), and cytochrome
P450 (CYP 450) into pro- and anti-inflammatory eicosanoids, including prostaglandins
(PG), leukotrienes (LT), thromboxanes (TX), hydroxyeicosatraenoic acids (HETE), and
resolvins (Rv). The n-3 docosahexaenoic acid (DHA) can be converted into Rvs and
protectins (PD).
The present study is the largest study to our knowledge to analyze the RBC phospholipid fatty acid
profiles of autistic individuals (n = 121) and non-autistic, non-developmentally delayed controls
(n = 110). We also tested the hypothesis that PUFA metabolism is more active in autistic individuals
(n = 20) than in controls by measuring plasma levels of prostaglandin E2 (PGE2), a resulting
eicosanoid of COX-mediated omega-6 PUFA metabolism.
Int. J. Mol. Sci. 2015, 16 10065
2. Results and Discussion
2.1. Fatty Acid Profiling
To test the hypothesis that PUFA would be lower in the RBC membrane phospholipids of autistic
individuals compared to controls, we conducted an independent-samples t-test assuming unequal
variance to compare fatty acid compositions of the phospholipids of autistic individuals (n = 121) to
those of non-autistic, non-developmentally delayed controls (n = 110). All subjects were aged 3–17
and most were Caucasian. The mean fatty acid percentages of all fatty acids tested are shown in
Table 1. We found significant differences in several fatty acids between the autistic individuals and
controls. Notably, a number of PUFA, mainly AA and DHA, were significantly lower in autistic
individuals than in controls. The mean percentage of AA in autistic individuals was 11.736, compared
to a control mean of 12.896 (p = 0.001). Similarly, the mean percentage of DHA in autistic individuals
was 1.404, compared to a control mean of 1.757 (p = 0.001). The sum total of all tested n-6 and n-3
fatty acids were both significantly lower in autistic individuals compared to controls (Table 1).
When AA and DHA data were re-analyzed after the removal of outliers (data more than two standard
deviations from the mean), p values became even more significant (p < 0.00001). A scatterplot
showing the distribution of AA, DHA, and total PUFA percentages is shown in Figure 2.
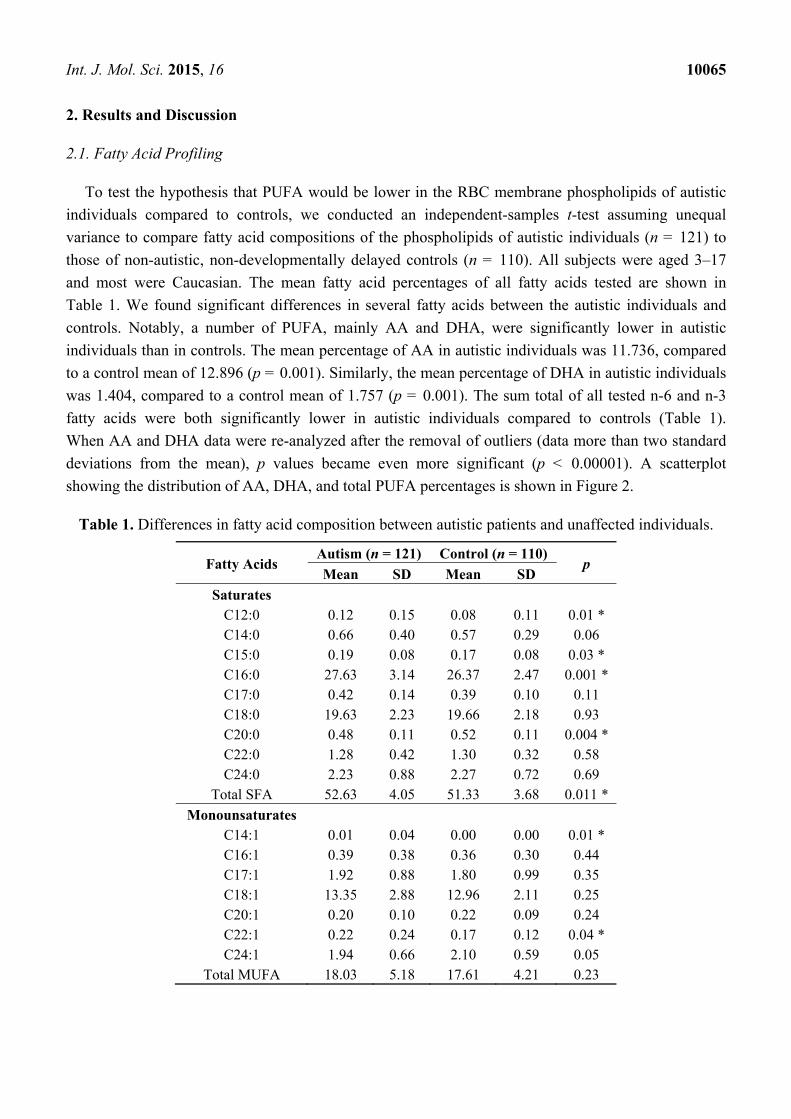
Table 1. Differences in fatty acid composition between autistic patients and unaffected individuals.
Fatty Acids Autism (n = 121) Control (n = 110)
p Mean SD Mean SD
Saturates C12:0 0.12 0.15 0.08 0.11 0.01 * C14:0 0.66 0.40 0.57 0.29 0.06 C15:0 0.19 0.08 0.17 0.08 0.03 * C16:0 27.63 3.14 26.37 2.47 0.001 * C17:0 0.42 0.14 0.39 0.10 0.11 C18:0 19.63 2.23 19.66 2.18 0.93 C20:0 0.48 0.11 0.52 0.11 0.004 * C22:0 1.28 0.42 1.30 0.32 0.58 C24:0 2.23 0.88 2.27 0.72 0.69
Total SFA 52.63 4.05 51.33 3.68 0.011 *
Monounsaturates C14:1 0.01 0.04 0.00 0.00 0.01 * C16:1 0.39 0.38 0.36 0.30 0.44 C17:1 1.92 0.88 1.80 0.99 0.35 C18:1 13.35 2.88 12.96 2.11 0.25 C20:1 0.20 0.10 0.22 0.09 0.24 C22:1 0.22 0.24 0.17 0.12 0.04 * C24:1 1.94 0.66 2.10 0.59 0.05
Total MUFA 18.03 5.18 17.61 4.21 0.23
Int. J. Mol. Sci. 2015, 16 10066
Table 1. Cont.
Fatty Acids Autism (n = 121) Control (n = 110)
p Mean SD Mean SD
Polyunsaturates C18:2 n-6 11.25 2.11 11.00 2.13 0.36 C18:3 n-6 0.01 0.03 0.01 0.02 0.3 C18:3 n-3 0.15 0.14 0.23 0.51 0.12 C20:2 n-6 0.20 0.11 0.22 0.09 0.37 C20:3 n-6 1.44 0.41 1.64 0.55 0.003 *
C20:4 n-6 (AA) 11.74 2.79 12.90 2.43 0.001 * C20:3 n-3 0.01 0.06 0.00 0.01 0.36 C20:5 n-3 0.22 0.22 0.22 0.22 0.98 C22:2 n-6 0.01 0.03 0.02 0.06 0.04 * C22:4 n-6 1.93 0.72 2.11 0.73 0.07 C22:5 n-3 0.97 0.39 0.97 0.39 0.97
C22:6 n-3 (DHA) 1.40 0.74 1.76 0.89 0.001 * Total n-6 26.59 4.75 27.89 4.02 0.026 * Total n-3 2.75 1.14 3.18 1.17 0.005 *
Total n-6:n-3 11.02 4.06 10.05 4.00 0.068 Total PUFA 29.34 5.31 31.06 4.21 0.007 *
* p < 0.05; Mean values are given as percentages of total fatty acid content measured; PUFA: polyunsaturated
fatty acids.
Figure 2. Cont.
Int. J. Mol. Sci. 2015, 16 10067
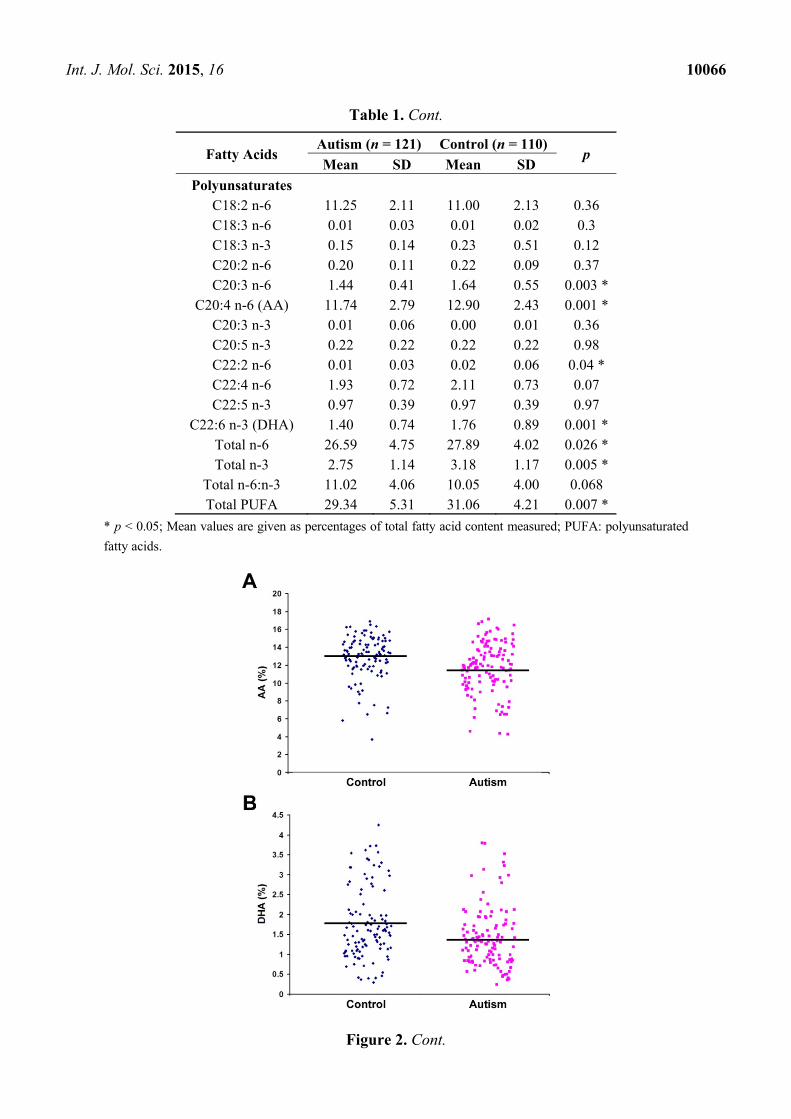
Figure 2. Scatterplot showing the distribution of fatty acid percentages of AA (A);
docosahexaenoic acid (DHA) (B); and total PUFA (C) between control and autism groups.
Phospholipids were extracted from red blood cell (RBC) samples of control subjects
(n = 110) and autism patients (n = 121) and analyzed by gas chromatography. Bars
represent the mean values (refer to Table 1 for significance).
2.2. Quantification of PGE2 Concentration
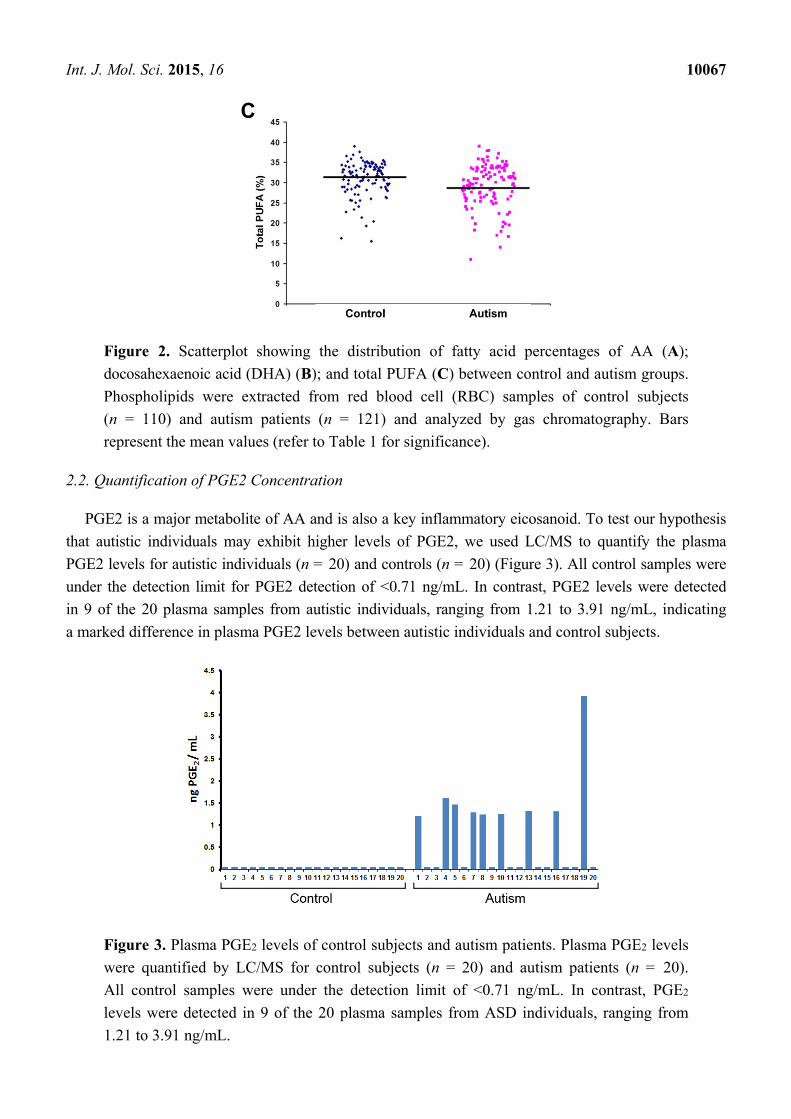
PGE2 is a major metabolite of AA and is also a key inflammatory eicosanoid. To test our hypothesis
that autistic individuals may exhibit higher levels of PGE2, we used LC/MS to quantify the plasma
PGE2 levels for autistic individuals (n = 20) and controls (n = 20) (Figure 3). All control samples were
under the detection limit for PGE2 detection of <0.71 ng/mL. In contrast, PGE2 levels were detected
in 9 of the 20 plasma samples from autistic individuals, ranging from 1.21 to 3.91 ng/mL, indicating
a marked difference in plasma PGE2 levels between autistic individuals and control subjects.
Figure 3. Plasma PGE2 levels of control subjects and autism patients. Plasma PGE2 levels
were quantified by LC/MS for control subjects (n = 20) and autism patients (n = 20).
All control samples were under the detection limit of <0.71 ng/mL. In contrast, PGE2
levels were detected in 9 of the 20 plasma samples from ASD individuals, ranging from
1.21 to 3.91 ng/mL.
Int. J. Mol. Sci. 2015, 16 10068
To our knowledge, the present study is the largest investigation of RBC phospholipids in autistic
individuals. We demonstrated that levels of both n-6 and n-3 PUFA were significantly lower in autistic
individuals than in non-autistic, non-developmentally delayed controls. We also found that plasma levels
of the n-6 AA metabolite PGE2 were higher in autistic individuals than in controls. Because PUFA are
integral for neuronal development and signaling, lower levels of these fatty acids and higher levels of
a key n-6 metabolite suggest that fatty acid metabolism may be abnormal in individuals with autism.
Our findings of an altered phospholipid PUFA profile are consistent with previous findings of lower
levels of total n-3 PUFA [14,18], n-6 AA [18], n-3 DHA [5], and total n-6 PUFA [21] in autistic
individuals than in controls. Differences in total results among studies may result from different types
of blood samples used, varying subsets of autism studied, and the type of control group recruited.
For example, Vancassel and colleagues [14] analyzed plasma phospholipids and recruited mentally
delayed individuals as the control group, while Weist et al. [5] compared plasma phospholipids
between autistic individuals and the general population. Both Bell et al. [18] and the present study
analyzed RBC phospholipids. The data by Bell and colleagues [21] provide interesting insight into
the effect that different blood sampling types and control groups can have on the study outcome.
This research team compared the differences in both erythrocyte phospholipids and plasma polar lipids
between 45 autistic individuals and pair-matched typically developing controls. They also made a
similar comparison using developmentally delayed (DD) individuals as the control group instead.
They found that total n-6 PUFA were significantly lower only in the erythrocytes of the autistic group
compared to DD controls. The essential PUFA precursor of AA, LA (C18:2 n-6), was significantly
lower only in the erythrocytes of autistic patients compared to pair-matched typically developing
controls. No PUFA were found to be significantly different when plasma samples were compared
between groups. This data highlights the complexities of studying fatty acid profiles and the necessary
caution that must be taken in making comparisons among studies.
A potential limitation of the present study is that we did not conduct an age-matched nor
gender-matched analysis between the autistic and control groups. Gender-specific fatty acid
differences in other studies demonstrate this limitation [5]. In addition, a study comparing RBC
phospholipids of 88 healthy children aged 1–15 indicated that while most fatty acids stabilized after
age two, ALA (C18:3 n-3) and trans fatty acids continued to increase throughout childhood [32].
In analyzing PUFA content, we specifically chose to analyze the fatty acid composition of RBC
membrane phospholipids because they are known to reflect long-term lipid storage and therefore
should not be affected by food intake directly prior to the participants’ blood drawing [19].
However, we cannot discount the possible effects of long-term fatty acid profile differences as a result
of restricted food preferences of individuals with autism [33,34].
Another major finding of our study is the increase in plasma levels of PGE2 in autistic patients.
We focused our analysis on the n-6 AA metabolite PGE2, rather than n-3 PUFA metabolites, due to
the much higher levels of n-6 PUFA in RBC membranes than n-3 PUFA. Since PUFA levels have
been found to positively correlate with levels of their metabolites [35,36], we expected n-6 PUFA
metabolite levels to be easier to quantify. Our finding that plasma PGE2 levels are higher in autistic
individuals than in controls is in agreement with a previous study by El-Ansary et al. [29]. As shown
in Figure 1, COX and LOX enzymes convert n-6 and n-3 PUFA into pro- and anti-inflammatory
eicosanoids, respectively. Because tissue levels of n-6 PUFA are much higher than levels of n-3
Int. J. Mol. Sci. 2015, 16 10069
PUFA, rapid fatty acid metabolism would be expected to produce more pro-inflammatory eicosanoids,
such as PGE2, than anti-inflammatory metabolites. Therefore, our findings that PUFA levels are lower
in autistic individuals, and our findings that metabolite PGE2 levels were only detectable in the plasma
of autistic individuals, support the hypothesis that lipid metabolism may be more active in autistic
individuals than in controls. Increased levels of pro-inflammatory PGE2 in autistic patients may also
be involved in increased neuroinflammation [31], which is thought to impair brain development and
has been linked to autism in a number of studies [37–39]. Further existing evidence of abnormal lipid
metabolism in autism includes the increased presence of the phospholipase enzyme responsible for
breaking down phospholipids [18] and increased oxidative stress in autistic individuals compared to
controls [27,30,40]. While lipid peroxidation levels are known to be a key marker of lipid degradation
by oxidative stress, we were unable to measure lipid peroxidation directly due to varying levels of
hemolysis in the plasma samples, which interfered with the colorimetric test for malondialdehyde,
a marker for lipid peroxidation and oxidative stress.
Closer analysis is necessary to further investigate the potential presence of overactive lipid
metabolism in autism. While we found PGE2 levels to be higher overall in autistic patients than
controls, the number of samples tested was relatively small (n = 20 for each group). In addition,
PGE2 has been recently measured in plasma [29], but PGE2 analysis may be more accurately
performed using urine, due to the short half-life of prostaglandins in plasma [41]. We also cannot
assume that our observations of both decreased PUFA levels and increased PGE2 levels in autistic
individuals represent a cause-effect relationship, as PGE2 levels can be influenced by other factors
such as diet [35,36]. For example, many children with autism suffer from gastrointestinal issues,
including inflammation [42], which may involve increased production of pro-inflammatory
prostaglandins such as PGE2 [43]. Larger studies are necessary to test multiple n-6 and n-3 markers
of the PUFA metabolism pathway in order to better elucidate whether abnormal metabolism is
responsible for the decreased PUFA levels and increased PGE2 levels in autistic individuals, or if
dietary factors play a role in these findings.
Although we did not collect dietary information from the study participants, we do not expect
dietary differences between the groups to be the primary explanation for the significantly lower PUFA
levels in the RBC membranes and higher PGE2 levels in the plasma of autistic individuals. If diet were
the primary cause of this result, then we would expect lower PGE2 levels in autistic individuals
compared to controls, because levels of the AA metabolite, PGE2, have been shown to positively
correlate with AA intake levels [35,36]. However, we found the opposite; autistic individuals had
higher PGE2 levels in their plasma than controls, as we would expect if fatty acid metabolism were
overactive in individuals with autism.
If overactive PUFA metabolism is indeed lowering PUFA levels in the tissues of autistic
individuals, then supplementation with n-3 DHA may be a useful intervention as an alternative
approach to the management of autism. DHA, one of the PUFA found in this study to be significantly
lower in autistic individuals than controls, is integral for neuronal development and reduces tissue
inflammation. Small clinical studies testing the effects of n-3 PUFA supplementation on individuals
with autism have produced mixed results. Some small studies have demonstrated that n-3 PUFA
supplementation may help ameliorate clinical symptoms of autism. For example, Yui et al. [44] found
that combined AA and DHA supplementation improved social withdrawal and communication in
Int. J. Mol. Sci. 2015, 16 10070
individuals with autism compared to individuals who received a placebo. In addition, Meguid et al. [30]
found that supplementation with a supplement high in DHA significantly decreased the CARS score in
individuals with autism, indicating behavioral improvement after n-3 supplementation. A recent
meta-analysis concluded that, to date, there is not enough quality evidence to support n-3 PUFA
supplementation in the treatment of autism, citing sample size and control measures as weaknesses in
existing studies [45]. Larger clinical studies are therefore necessary to determine whether or not n-3
supplementation improves the symptoms of ASD and reduces markers of neuroinflammation.
Our study also highlights the importance of fatty acids in brain structure and function associated
with disease development. Jones et al. [46] recently reported that a maternal diet rich in n-6 PUFA and
deficient in n-3 PUFA during gestation and lactation may produce autistic-like deficits in offspring,
supporting the notion that PUFA are key factors in prenatal and early life brain development related to
social behaviors.
In conclusion, autism is a highly complex disorder with many unanswered questions about its
pathogenesis. PUFA metabolism is an important area of ASD research because PUFA are fatty acids
necessary for brain development and PUFA metabolites modulate the inflammatory response in the
brain. The present study demonstrates that key PUFA required for brain development are significantly
lower in individuals with autism compared to individuals without ASD, potentially due to overactive
metabolism of PUFA in individuals with autism.
3. Experimental Section
3.1. Collection and Transportation of Blood Samples
Whole blood samples were collected at Children’s Hospital Boston as part of the patients’ clinical
diagnostic workup for autism. Diagnosis of autism was based on the Diagnostic and Statistical Manual
for Mental Retardation (DSM-IV) and the Childhood Autism Rating Scale (CARS). Blood samples
from children aged 3–17 that met the DSM-IV and CARS scores for autism were considered our
autistic test group. Patients on the broader autism spectrum, including those with Asperger Syndrome
and PDD-NOS, were not included in the study. The control group consisted of children aged 3–17 who
went to Children’s Hospital Boston for genetic testing unrelated to developmental delay, such as
hearing loss without overlapping features of autism. Test and control samples were not age nor
gender-matched, although autism samples were collected at a male:female ratio of 4:1. Fasting was not
a requirement prior to blood draws. All blood samples in this study were leftover samples from the
clinical diagnostic work-ups. 121 whole blood samples from autistic patients and 110 control samples
were frozen at −80 °C and transported to Massachusetts General Hospital (MGH) on dry ice for RBC
phospholipid analysis.
For plasma PGE2 analysis, 40 fresh whole blood samples (20 from autistic group and 20 controls)
were obtained to reduce hemolysis. The fresh whole blood samples were temporarily stored at 4 °C,
and transported to MGH on wet ice. Upon arrival at MGH, plasma was separated from whole blood by
centrifuging at 3000 rpm for 10 min at 4 °C; RBC and plasma were then stored separately at −80 °C
for further analysis.
Int. J. Mol. Sci. 2015, 16 10071
The basic research portion of the project, conducted at Massachusetts General Hospital, was exempt
from IRB approval, as all samples were coded to exclude all patient information.
3.2. Lipid Analysis of RBC Membrane Phospholipids
3.2.1. Lipid Extraction
Lipid extraction and methylation were performed as previously described [47]. Whole blood sample
was thawed on ice. 200 μL was transferred to a 10 mL capped glass vial and centrifuged at 3000 rpm
for 10 min at 4 °C to pellet the cells. Supernatant was removed and the pellet was washed with 1 mL of
0.9% saline solution. Centrifugation and supernatant removal were repeated once. 1 mL of miliQ water
was added to the pellet to lyse the cells. The solution was vortexed and centrifuged again at
3000 rpm for 10 min at 4 °C. Supernatant was discarded. 5 mL of lipid extraction reagent
(chloroform:methanol 2:1 plus 0.005% butylated hydroxytoluene) was added to the cell pellet; the vial
was sealed under nitrogen and vortexed at 4 °C for 30 min. 5 mL of 0.9% saline solution was added
to the vial. The solution was vortexed and centrifuged at 3000 rpm for 10 min at room temperature
(RT) to separate aqueous and organic layers. The organic chloroform (bottom) layer was transferred to
a glass culture tube and allowed to dry under a steady flow of nitrogen and reconstituted in 40 μL of
lipid extraction reagent.
3.2.2. Thin Layer Chromatography (TLC)
Phospholipid isolation was performed with TLC under the following conditions: before sample
loading, the silica gel-coated glass TLC plate was dried at 80 °C for 1 h; development buffer makeup
was 80 mL petroleum ether: 20 mL diethyl ether: 1 mL acetic acid. After development, the plate was
sprayed with anilino naphthalene sulfonic acid (ANSA) coloring reagent and visualized under UV
light. The phospholipid layer was extracted from the gel and transferred to a clean 10 mL glass vial.
3.2.3. Fatty Acid Methylation
To the extracted phospholipid silica gel layer, 1.5 mL hexane and 1.5 mL 14% boron
triflouride-methanol solution was added. The vial was sealed under nitrogen, capped tightly, and
heated on a dry heat block at 100 °C for 1 h to convert the fatty acids of phospholipids to fatty acid
methyl esters. Once cool, 1 mL of miliQ water was added to the vial; the vial was vortexed and
centrifuged at 3000 rpm for 10 min at RT. The hexane layer containing the fatty acids was extracted,
transferred to a glass culture tube, and dried under a steady stream of nitrogen gas. The dried fatty acid
samples were then reconstituted in 50 μL of hexane for GC analysis.
3.2.4. Gas Chromatography
Fatty acid profiles were determined using gas chromatography. The fatty acid methyl esters were
injected onto a fully automated Agilent 6890N Network GC system, with a 7683 Series Injector, equipped
with a flame ionization detector (Agilent Technologies, Santa Clara, CA, USA). The chromatography
used an Omegawax 250 capillary column (30.0 m × 250 µm × 0.25 µm nominal) (Cat. No. 24136;
Int. J. Mol. Sci. 2015, 16 10072
Sigma-Aldrich, St. Louis, MO, USA). Samples were injected at a volume of 2.0 µL and a split ratio of
15:1. The total run time was 57 min, with the following conditions: initial oven temperature of 130 °C,
hold for 3 min, ramp at 5 °C/min up to 180 °C, ramp at 2.5 °C/min up to 200 °C, hold for 15 min, ramp
at 1 °C/min up to 210 °C, hold for 5 min, ramp at 5 °C/min up to 240 °C. Peaks of the resolved fatty
acids were identified by comparison of retention time with a reference standard (Cat. No. GLC-461;
Nu-chek-Prep, Inc., Elysian, MN, USA), and area percentage for all resolved peaks was analyzed by
using a Perkin-Elmer M1 integrator (Boston, MA, USA).
3.2.5. Statistical Analysis
An independent t-test assuming unequal variance was performed to compare RBC phospholipid
content (measured as percentages of total quantified fatty acids) between autistic and non-autistic
individuals. Statistical significance was set as p < 0.05. In order to ensure that outliers did not skew the
data of the AA and DHA fatty acids, data points that fell more than 2 standard deviations away from
the mean (four and nine outliers for AA and DHA, respectively) were removed and the t-test was
repeated to confirm significance.
3.3. Quantification of PGE2 from Human Plasma Samples
3.3.1. Extraction
An aliquot of 350 μL plasma sample were added to 2.2 mL water. 20 μL of internal standard
(D4-PGE2, 5 μg/mL, in ethanol) and 0.45 mL MeOH were added into the solution, vortexed for 1 min,
and let to stand on ice for 1 h. The solution was centrifuged at 3000 rpm for 15 min, supernatant was
collected and adjusted to pH 3.0 with 0.2 N HCl. The sample solution was then loaded on C-18 SPE
column (preconditioned with 2 mL water and 2 mL MeOH) and washed with 1 mL water. PGE2 was
then eluted with 2 mL ethyl acetate, condensed to dryness, and re-dissolved with 100 μL ETOH for
LC/MS analysis.
3.3.2. LC/MS Condition
Mobile Phase: A: 0.01% HOAc-H2O, B: 0.01% HOAc-ACN; Gradient: 0–14 min, 32% B, 16–20 min,
95% B, 22–25 min, 32% B; Flow Rate: 0.8 mL/min; Injection: 20 μL; Electrospray ionization in
negative mode; Full scan from m/z 50 to m/z 500; Target: m/z 351; Nebulizer Pressure: 15.0 psi;
Dry Gas: 5.0 L/min; Dry Temperature: 325 °C; Compound Stability: 20%; Average: 50.
3.3.3. Quantification of PGE2
The level of PGE2 was quantified using an internal standard curve (concentration of PGE2 vs. the
peak area ratio of PGE2 to D4-PGE2).
3.3.4. Reagent Information
Acetonitrile (HPLC Grade) purchased from VWR International (Radnor, PA, USA); Water (HPLC
Grade) purchased from VWR International; PGE2 standard and Internal standard D4-PGE2 purchased
Int. J. Mol. Sci. 2015, 16 10073
from Cayman Chemical; High Performance C-18 Solid Phase Extraction cartridge purchased from
Agilent Technology.
Acknowledgments
This study was supported by the United States Department of Defense (DoD) Autism Research
Program Idea Award (W81XWh-10-1-0788). The authors are also grateful to Marina Kang for her
editorial assistance.
Author Contributions
Sarah A. Brigandi performed the experiments, analyzed the data, and drafted the manuscript;
Hong Shao recruited the patients, collected samples, and performed the experiments; Steven Y. Qian
performed the experiments and analyzed the data; Yiping Shen and Bai-Lin Wu recruited the patients
and collected the samples; and Jing X. Kang conceived and designed the study and prepared
the manuscript.
Conflicts of Interest
The authors declare no conflict of interest.
References
1. Duchan, E.; Patel, D.R. Epidemiology of autism spectrum disorders. Pediatr. Clin. N. Am. 2012,
59, 27–43.
2. Silver, W.G.; Rapin, I. Neurobiological basis of autism. Pediatr. Clin. N. Am. 2012, 59, 45–61.
3. Verhoeven, J.S.; de Cock, P.; Lagae, L.; Sunaert, S. Neuroimaging of autism. Neuroradiology
2010, 52, 3–14.
4. Gadad, B.S.; Lewitson, L.; Young, K.A.; German, D.C. Neuropathology and animal models of autism:
Genetic and environmental factors. Autism Res. Treat. 2013, 2013, doi:10.1155/2013/731935.
5. Weist, M.M.; German, J.B.; Harvey, D.J.; Watkins, S.M.; Hertz-Picciotto, I. Plasma fatty acid
profiles in autism: A case-control study. Prostaglandins Leukot. Essent. Fatty Acids 2009, 80,
221–227.
6. Hallmayer, J.; Cleaveland, S.; Torres, A.; Phillips, J.; Cohen, B.; Torigoe, T.; Miller, J.; Fedele, A.;
Collins, J.; Smith, K.; et al. Genetic heritability and shared environmental factors among twin
pairs with autism. Arch. Gen. Psychiatry 2011, 68, 1095–1102.
7. Lyall, K.; Munger, K.L.; O’Reilly, E.J.; Santangelo, S.L.; Ascherio, A. Maternal dietary fat intake
in association with autism spectrum disorders. Am. J. Epidemiol. 2013, 178, 209–220.
8. Zerbo, O.; Qian, Y.; Yoshida, C.; Grether, J.K.; van de Water, J.; Croen, L.A. Maternal infection
during pregnancy and autism spectrum disorders. J. Autism Dev. Disord. 2013, in press.
9. Raz, R.; Roberts, A.L.; Lyall, K.; Hart, J.E.; Just, A.C.; Laden, F.; Weisskopf, M.G. Autism
Spectrum Disorder and particular matter before, during, and after pregnancy: A nested case-control
analysis within the nurses’ health study II cohort. Environ. Health Perspect. 2015, 123, 264–270.
Int. J. Mol. Sci. 2015, 16 10074
10. Innis, S.M. The role of dietary n-6 and n-3 fatty acids in the developing brain. Dev. Neurosci.
2008, 22, 474–480.
11. Piras, I.S.; Haapanen, L.; Napolioni, V.; Sacco, R.; van de Water, J.; Persico, A.M. Anti-brain
antibodies are associated with more severe cognitive and behavioral profiles in Italian children
with Autism Spectrum Disorder. Brain Behav. Immun. 2014, 38, 91–99.
12. Das, U.N. Autism as a disorder of deficiency of brain-derived neurotrophic factor and altered
metabolism of polyunsaturated fatty acids. Nutrition 2013, 29, 1175–1185.
13. Richardson, A.J. Long-chain polyunsaturated fatty acids in childhood developmental and
psychiatric disorders. Lipids 2004, 39, 1215–1222.
14. Vancassel, S.; Durand, G.; Barthelemy, C.; Lejeune, B.; Martineau, J.; Guilloteau, D.; Andrès, C.;
Chalon, S. Plasma fatty acid levels in autistic children. Prostaglandins Leukot. Essent. Fatty Acids
2001, 65, 1–7.
15. Meguid, N.A.; Atta, H.M.; Gouda, A.S.; Khalil, R.O. Role of polyunsaturated fatty acids in the
management of Egyptian children with autism. Clin. Biochem. 2008, 41, 1044–1048.
16. Bradbury, J. Docosahexaenoic acid (DHA): An ancient nutrient for the modern human brain.
Nutrients 2011, 3, 529–554.
17. Schudardt, J.P.; Huss, M.; Stauss-Grabo, M.; Hahn, A. Significance of long-chain polyunsaturated
fatty acids (PUFAs) for the development and behaviour of children. Eur. J. Pediatr. 2010, 169,
149–164.
18. Bell, J.G.; MacKinlay, E.E.; Dick, J.R.; MacDonald, D.J.; Boyle, R.M.; Glen, A.C. Essential fatty
acids and phospholipase A2 in autistic spectrum disorders. Prostaglandins Leukot. Essent.
Fatty Acids 2004, 71, 201–204.
19. Sun, Q.; Ma, J.; Campos, H.; Hankinson, S.E.; Hu, F.B. Comparison between plasma and
erythrocyte fatty acid content as biomarkers of fatty acid intake in US women. Am. J. Clin. Nutr.
2007, 86, 74–81.
20. Kuratko, C.N.; Salem, N., Jr. Biomarkers of DHA status. Prostaglandins Leukot. Essent. Fatty Acids
2009, 81, 111–118.
21. Bell, J.G.; Miller, D.; MacDonald, D.J.; MacKinlay, E.E.; Dick, J.R.; Cheseldine, S.; Boyle, R.M.;
Graham, C.; O’Hare, A.E. The fatty acid compositions of erythrocyte and plasma polar lipids in
children with autism, developmental delay or typically developing controls and the effect of fish
oil intake. Br. J. Nutr. 2010, 103, 1160–1167.
22. Bu, B.; Ashwood, P.; Harvey, D.; King, I.B.; van de Water, J.; Jin, L.W. Fatty acid compositions of
red blood cell phospholipids in children with autism. Prostaglandins Leukot. Essent. Fatty Acids
2006, 74, 215–221.
23. Vlaardingerbroek, H.; Hornstra, G. Essential fatty acids in erythrocyte phospholipids during
pregnancy and at delivery in mothers and their neonates: Comparison with plasma phospholipids.
Prostaglandins Leukot. Essent. Fatty Acids 2004, 71, 363–374.
24. Tamiji, J.; Crawford, D.A. The neurobiology of lipid metabolism in autism spectrum disorders.
Neurosignals 2010, 18, 98–112.

Int. J. Mol. Sci. 2015, 16 10075
25. Khan, M.M.; Evans, D.R.; Gunna, V.; Scheffer, R.E.; Parikh, V.V.; Mahadik, S.P. Reduced
erythrocyte membrane essential fatty acids and increased lipid peroxides in schizophrenia at the
never-medicated first-episode of psychosis and after years of treatment with antipsychotics.
Schizophr. Res. 2002, 58, 1–10.
26. Stevens, L.J.; Zentall, S.S.; Deck, J.L. Essential fatty acid metabolism in boys with attention-deficit
hyperactivity disorder. Am. J. Clin. Nutr. 1995, 62, 761–768.
27. Chauhan, A.; Chauhan, V.; Brown, W.T.; Cohen, I. Oxidative stress in autism: Increased lipid
peroxidation and reduced serum levels of ceruloplasmin and transferrin-the antioxidant proteins.
Life Sci. 2004, 75, 2539–2549.
28. Pastural, E.; Ritchie, S.; Lu, Y.; Jin, W.; Kavianpour, A.; Khine Su-Myat, K.; Heath, D.;
Wood, P.L.; Fisk, M.; Goodenowe, D.B. Novel plasma phospholipid biomarkers of autism:
Mitochondrial dysfunction as a putative causative mechanism. Prostaglandins Leukot. Essent.
Fatty Acids 2009, 81, 253–264.
29. El-Ansary, A.; Al-Ayadhi, L. Lipid mediators in plasma of autism spectrum disorders.
Lipids Health Dis. 2012, 11, doi:10.1186/1476-511X-11-160.
30. Meguid, N.A.; Dardir, A.A.; Abdel-Raouf, E.R.; Hashish, A. Evaluation of oxidative stress in
autism: Defective antioxidant enzymes and increased lipid peroxidation. Biol. Trace Elem. Res.
2011, 143, 58–65.
31. Tassoni, D.; Kaur, G.; Weisinger, R.S.; Sinclair, A.J. The role of eicosanoids in the brain.
Asia Pac. J. Clin. Nutr. 2008, 17, 220–228.
32. Laryea, M.; Cieslicki, P.; Diekmann, E.; Wendel, U. Age-dependent fatty acid composition of
erythrocyte membrane phospholipids in healthy children. Z Ernahrungswiss 1990, 29, 284–294.
33. Schreck, K.A.; Williams, K.; Smith, A.F. A comparison of eating behaviors between children with
and without autism. J. Autism Dev. Disord. 2004, 34, 433–438.
34. Marshall, J.; Hill, R.J.; Ziviani, J.; Dodrill, P. Features of feeding difficulty in children with
Autism Spectrum Disorder. Int. J. Speech Lang. Pathol. 2013, 16, 151–158.
35. Kelley, D.S.; Taylor, P.C.; Nelson, G.J.; Mackey, B.E. Arachidonic acid supplementation
enhances synthesis of eicosanoids without suppressing immune functions in young healthy men.
Lipids 1998, 33, 125–130.
36. Elmes, M.; Green, L.R.; Poore, K.; Newman, J.; Burrage, D.; Abayasekara, D.R.; Cheng, Z.;
Hanson, M.A.; Wathes, D.C. Raised dietary n-6 polyunsaturated fatty acid intake increases
2-series prostaglandin production during labour in the ewe. J. Physiol. 2005, 562, 583–592.
37. Vargas, D.L.; Nascimbene, C.; Krishnan, C.; Zimmerman, A.W.; Pardo, C.A. Neuroglial
activation and neuroinflammation in the brain of patients with autism. Ann. Neurol. 2005, 57,
67–81.
38. Hagberg, H.; Gressens, P.; Mallard, C. Inflammation during fetal and neonatal life: Implications
for neurologic and neuropsychiatric disease in children and adults. Ann. Neurol. 2012, 71,
444–457.
39. El-Ansary, A.; Al-Ayadhi, L. Neuroinflammation in autism spectrum disorders. J. Neuroinflamm.
2012, 9, 265.
Int. J. Mol. Sci. 2015, 16 10076
40. Essa, M.M.; Guillemin, G.J.; Waly, M.I.; Al-Sharbati, M.M.; Al-Farsi, Y.M.; Hakkim, F.L.;
Ali, A.; Al-Shafaee, M.S. Increased markers of oxidative stress in autistic children of the
Sultanate of Oman. Biol. Trace Elem. Res. 2012, 147, 25–27.
41. Frolich, J.C.; Wilson, T.W.; Sweetman, B.J.; Smigel, M.; Nies, A.S.; Carr, K.; Watson, J.T.;
Oates, J.A. Urinary prostaglandins: Identification and origin. J. Clin. Investig. 1975, 55, 763–770.
42. Wasilewska, J.; Jarocka-Cyrta, E.; Kaczmarski, M. Gastrointestinal abnormalities in children with
autism. Pol. Merkur. Lekarski. 2009, 27, 40–43.
43. Verma, G.; Marella, A.; Shaquiquzzaman, M.; Alam, M.M. Immunoinflammatory responses in
gastrointestinal tract injury and recovery. Acta Biochim. Pol. 2013, 60, 143–149.
44. Yui, K.; Koshiba, M.; Nakamura, S.; Kobayashi, Y. Effects of large doses of arachidonic acid
added to docosahexaenoic acid on social impairment in individuals with autism spectrum
disorders: A double-blind, placebo-controlled, randomized trial. J. Clin. Psychopharmacol. 2012,
32, 200–206.
45. James, S.; Montgomery, P.; Williams, K. Omega-3 fatty acids supplementation for autism
spectrum disorders (ASD). Cochrane Database Syst. Rev. 2011, 11, doi:10.1002/14651858.
CD007992.pub2.
46. Jones, K.L.; Will, M.J.; Hecht, P.M.; Parker, C.L.; Beversdorf, D.Q. Maternal diet rich in
omega-6 polyunsaturated fatty acids during gestation and lactation produces autistic-like
sociability deficits in adult offspring. Behav. Brain Res. 2013, 238, 193–199.
47. Kang, J.X.; Wang, J. A simplified method for analysis of polyunsaturated fatty acids.
BMC Biochem. 2005, 6, 5.
© 2015 by the authors; licensee MDPI, Basel, Switzerland. This article is an open access article
distributed under the terms and conditions of the Creative Commons Attribution license
(http://creativecommons.org/licenses/by/4.0/).