author's personal copy - steel research group
TRANSCRIPT

This article appeared in a journal published by Elsevier. The attachedcopy is furnished to the author for internal non-commercial researchand education use, including for instruction at the authors institution
and sharing with colleagues.
Other uses, including reproduction and distribution, or selling orlicensing copies, or posting to personal, institutional or third party
websites are prohibited.
In most cases authors are permitted to post their version of thearticle (e.g. in Word or Tex form) to their personal website orinstitutional repository. Authors requiring further information
regarding Elsevier’s archiving and manuscript policies areencouraged to visit:
http://www.elsevier.com/copyright

Author's personal copy
3D modeling of subsurface fatigue crack nucleation potency of primary inclusionsin heat treated and shot peened martensitic gear steels
Rajesh Prasannavenkatesan a, Jixi Zhang c, David L. McDowell a,b,*, Gregory B. Olson d,e, Herng-Jeng Jou e
a George W. Woodruff School of Mechanical Engineering, Georgia Institute of Technology, Atlanta, GA 30332-0405, USAb School of Materials Science and Engineering, Georgia Institute of Technology, Atlanta, GA 30332-0245, USAc Department of Mechanical Engineering, University of Nevada, Reno, NV 89557, USAd Department of Materials Science and Engineering, Robert R. McCormick School of Engineering and Applied Science, Northwestern University, Evanston, IL 60208-3108, USAe Questek Innovations LLC, Evanston, IL 60201, USA
a r t i c l e i n f o
Article history:Received 29 July 2008Received in revised form 25 November 2008Accepted 3 December 2008Available online 13 December 2008
Keywords:Shot peeningResidual stress3D finite element analysisFatigue crack nucleationSubsurface crackingInclusions
a b s t r a c t
A computational strategy is developed to characterize the driving force for fatigue crack nucleation atsubsurface primary inclusions in carburized and shot peened C61� martensitic gear steels. Experimentalinvestigation revealed minimum fatigue strength to be controlled by subsurface fatigue crack nucleationat inclusion clusters under cyclic bending. An algorithm is presented to simulate residual stress distribu-tion induced through the shot peening process following carburization and tempering. A methodology isdeveloped to analyze potency of fatigue crack nucleation at subsurface inclusions. Rate-independent 3Dfinite element analyses are performed to evaluate plastic deformation during processing and service. Thespecimen is subjected to reversed bending stress cycles with R = 0.05, representative of loading on a geartooth. The matrix is modeled as an elastic–plastic material with pure nonlinear kinematic hardening. Theinclusions are modeled as isotropic, linear elastic. Idealized inclusion geometries (ellipsoidal) are consid-ered to study the fatigue crack nucleation potency at various subsurface depths. Three distinct types ofsecond-phase particles (perfectly bonded, partially debonded, and cracked) are analyzed. Parametricstudies quantify the effects of inclusion size, orientation and clustering on subsurface crack nucleationin the high cycle fatigue (HCF) or very high cycle fatigue (VHCF) regimes. The nonlocal average valuesof maximum plastic shear strain amplitude and Fatemi–Socie (FS) parameter calculated in the proximityof the inclusions are considered as the primary driving force parameters for fatigue crack nucleation andmicrostructurally small crack growth. The simulations indicate a strong propensity for crack nucleation atsubsurface depths in agreement with experiments in which fatigue cracks nucleated at inclusion clusters,still in the compressive residual stress field. It is observed that the gradient from the surface of residualstress distribution, bending stress, and carburized material properties play a pivotal role in fatigue cracknucleation and small crack growth at subsurface primary inclusions. The fatigue potency of inclusionclusters is greatly increased by prior interfacial damage during processing.
� 2008 Elsevier Ltd. All rights reserved.
1. Introduction
Although much progress has been made, development of quan-titative descriptions of potency of primary inclusions for fatiguecrack nucleation and early stages of growth in high strength steelsrequires further understanding to support quantitative materialsdesign. Carburization and shot peening are well established tech-niques for improving high cycle fatigue strength of steel compo-nents [1–7]. The fact that bending fatigue strength of steel gearteeth is increased considerably by carburization and shot peening
has been extensively utilized in industry [8–11]. With carburiza-tion and shot peening, crack initiation (nucleation and earlygrowth at the scale of the primary inclusion) is observed to shiftfrom the surface toward the subsurface of the carburized gears;this is primarily due to presence of high compressive residualstress and comparatively high hardness at the surface. It is widelyobserved that cracks in unnotched specimens nucleate at non-metallic inclusions and other microstructure inhomogeneities.Such second-phase particles often serve as fatigue crack startersin a variety of metallic materials [12–18]. Extensive experimentalobservations have been reported earlier on subsurface crack initi-ation [19–23].
Toyada et al. [21] performed a series of rotating-bending fatiguetests on Cr–Mo steels and estimated the influence of the inclusionson the fatigue strength by employing the projected
ffiffiffiffiffiffiffiffiffiffiareap
0142-1123/$ - see front matter � 2008 Elsevier Ltd. All rights reserved.doi:10.1016/j.ijfatigue.2008.12.001
* Corresponding author. Address: George W. Woodruff School of MechanicalEngineering, Georgia Institute of Technology, Atlanta, GA 30332-0405, USA; Tel.: +1404 894 5128; fax: +1 404 894 0186.
E-mail address: [email protected] (D.L. McDowell).
International Journal of Fatigue 31 (2009) 1176–1189
Contents lists available at ScienceDirect
International Journal of Fatigue
journal homepage: www.elsevier .com/locate / i j fa t igue

Author's personal copy
approach suggested by Murakami and Endo [13], with necessarymodifications to incorporate the residual stress effects. They ar-gued that there exists a critical inclusion size that initiates subsur-face fatigue failure within the specimen. The semi-empiricalMurakami and Endo model has successfully predicted upper andlower bounds on service lives for specimens containing inclusions.The fracture mechanics approach has also been widely applied forbending fatigue analysis of carburized steel components [24–26].Kim and co-workers [24] studied the effect of surface residualstress on fatigue life by analyzing the change in stress intensity fac-tor due to residual stress. Sharma and co-workers [25] presented adetailed study of various factors influencing K1c of case steelsincluding alloying elements, retained austenite and carbon con-tent. Lin et al. [26] investigated the general methodology of bend-ing fatigue life prediction using strain-life and linear elasticfracture mechanics (LEFM) approaches for SAE 8620 steel. Both ap-proaches were reported to predict the fatigue lives very well,although the strain-life approach proved to be more conservativein its predictions. Life prediction schemes based on nominalstrain-life or LEFM are insufficient to fully reflect the mechanismsfor crack nucleation at non-metallic inclusions; as such, they can-not serve to quantify the microstructure-level details of thresholdcondition on cyclic stress amplitude to form a fatigue crack whichcan propagate away from the inclusion. More detailed analyses ofthe inclusion size and shape, interface characteristics, local resid-ual stresses, contrast of elastic and thermal properties, and evensurrounding microstructure of the matrix are necessary to explorethis issue in more detail.
Mackaldener and co-workers [27] developed a two-dimensionalplane strain gear tooth FE model and studied the stress state his-tory at every point within the tooth during a single contact load cy-cle. The residual stress induced through case hardening wassimulated by applying a thermal load cycle and the McDiarmidcritical plane approach [28] was employed to predict fatigue crackinitiation at various depths with necessary modifications to incor-porate shot peening effects. They reported that the tensile residualstresses due to case hardening led to high risk of fatigue crack ini-tiation in the interior of the tooth. Although the method was effec-tive computationally and considered various aspects of surfacetreatment in the macroscopic analysis, it was not able to describethe root cause for subsurface crack initiation where the residualstresses are still compressive and the role of microstructural inho-mogeneity in such failure scenarios. Borbeley et al. [29] attemptedto study the cause for subsurface failures initiating from pores inAZ91 magnesium alloys through 3D FE simulations. Results of localstresses and plastic strains in the vicinity of the pores showed acritical size for pores just beneath the surface with a maximumtendency to initiate cracks. Wang and co-workers [16] developeda deterministic model to correlate the total fatigue life and subsur-face failure for six different ultra-high strength steels. Although the
method was successful in obtaining a good correlation betweeninclusion size and fatigue life, it is insufficient to address manyother factors which play a pivotal role, e.g., particle clustering, ori-entation with respect to principal stresses, and residual stresses.
Residual stresses play a pivotal role in affecting crack initiationand propagation. Considerable effort has been made to accuratelymodel the residual stresses and account for their influence on ser-vice life of the component [30–37]. Some previous work has consid-ered the effects of damaged particles or inclusions on fatigue crackformation and early growth in the micronotch root field of crackedor debonded inclusions [17,18,38–41]. As mentioned above, a sim-ple assumption that fatigue cracks form immediately at such inclu-sions as a precursor to application of LEFM ignores the complexitiesof the details of inclusion geometry, damage state, interface condi-tion, and microstructure, all of which can play a role in the near-threshold regime of fatigue strength of these materials. This isimportant for HCF or very high cycle fatigue (VHCF) applications.
In support of a new generation of high fidelity materials designtools, the aim of the present work is to develop a 3D modelingstrategy for a comparative parametric study of the potency fornucleation of fatigue cracks at damaged primary inclusions in car-burized and shot peened martensitic gear steels. Specific attentionis devoted to the case of Al2O3 inclusions in carburized and shotpeened C61 alloy gear steel [42]. A new algorithm is presented tomodel representative residual stresses induced via plastic defor-mation due to shot peening. Case hardening (carburization andtempering) is considered by varying the material properties fromsurface to core. To determine quantitative relationships betweenlocal plastic strains and far-field loading, representative 3D finiteelement meshes are constructed which contain inclusions sur-rounded by carburized matrix. Both cracked and debonded inclu-sions are considered, consistent with experimental findings. Wefocus on processes of crack formation and early growth in the ma-trix under the influence of the strain concentration of the inclusionnotch root field, and do not include the fracture mechanics prob-lem of physically small and long crack growth away from the par-ticle. The former (nucleation and early growth) establish the crackorigin and often a majority of the fatigue life in HCF and VHCF. Wedefine nucleation as the formation of a crack within the matrix inthe region of highest cyclic plastic strain localization near the ma-trix–inclusion interface; this is considered heuristically as a zone ofsubcritical crack formation and growth to a stable nucleus thatwould be amenable to propagation analysis via fracture mechanics.
Relative fatigue crack nucleation potency at various case depthsis compared with experimental findings regarding subsurfacedepths at which cracks form. Nonlocal average values of plasticshear strain range [18,38,41] and the Fatemi–Socie parameter[43] are considered as the candidate driving forces for fatigue cracknucleation. All simulations were performed using the ABAQUS [44]finite element code.
Nomenclature
rys uniaxial cyclic yield strengthrij stress tensor componentseij strain tensor componentsSij deviatoric stress tensor componentsrh hydrostatic stressaij back stress tensor components�r Mises uniaxial effective stressa0ij deviatoric back stress tensor components
ah hydrostatic part of the back stress tensor_ee� elastic strain rate tensor_ep� plastic strain rate tensor
_�ep equivalent plastic strain raterres residual stress magnitudeea applied strain amplitudeE Young’s modulusm Poisson’s ratioc engineering shear strainDcp�
max nonlocal maximum plastic shear strain rangeDC Fatemi–Socie (FS) parameterrn
max maximum stress normal to plane of maximum shearstrain range in a loading cycle
R. Prasannavenkatesan et al. / International Journal of Fatigue 31 (2009) 1176–1189 1177
Author's personal copy
2. Experimental observations of fatigue in case hardened steel
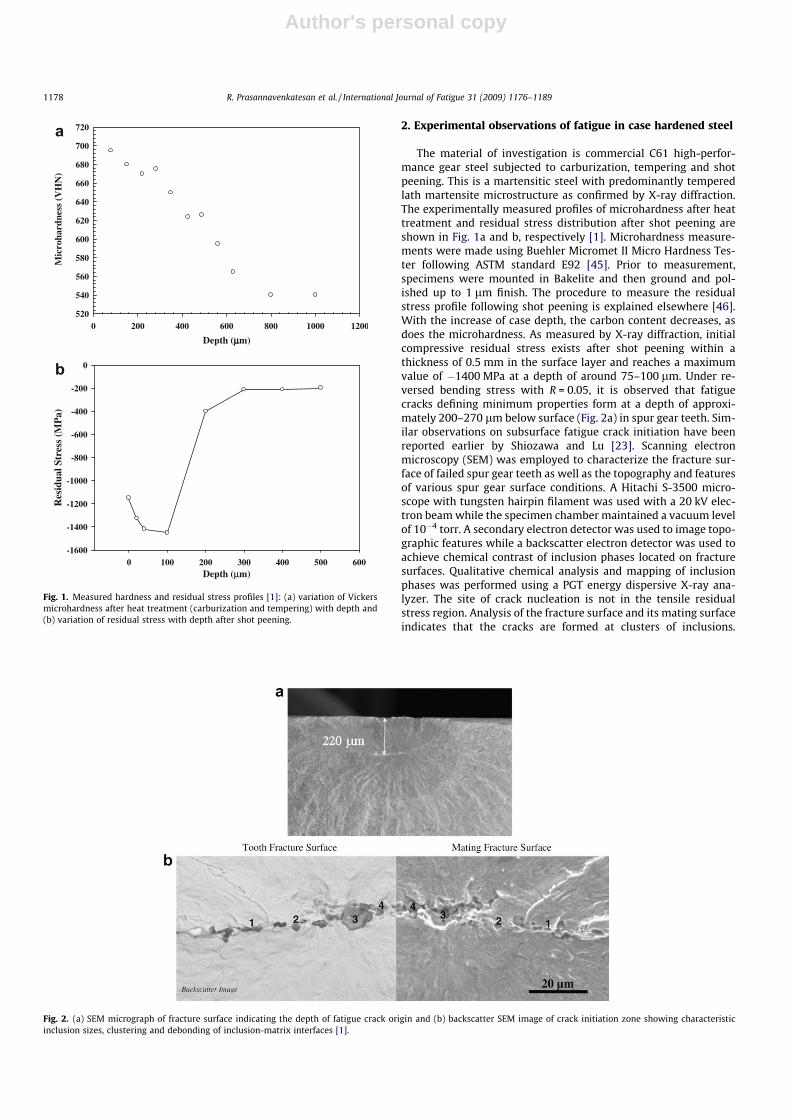
The material of investigation is commercial C61 high-perfor-mance gear steel subjected to carburization, tempering and shotpeening. This is a martensitic steel with predominantly temperedlath martensite microstructure as confirmed by X-ray diffraction.The experimentally measured profiles of microhardness after heattreatment and residual stress distribution after shot peening areshown in Fig. 1a and b, respectively [1]. Microhardness measure-ments were made using Buehler Micromet II Micro Hardness Tes-ter following ASTM standard E92 [45]. Prior to measurement,specimens were mounted in Bakelite and then ground and pol-ished up to 1 lm finish. The procedure to measure the residualstress profile following shot peening is explained elsewhere [46].With the increase of case depth, the carbon content decreases, asdoes the microhardness. As measured by X-ray diffraction, initialcompressive residual stress exists after shot peening within athickness of 0.5 mm in the surface layer and reaches a maximumvalue of �1400 MPa at a depth of around 75–100 lm. Under re-versed bending stress with R = 0.05, it is observed that fatiguecracks defining minimum properties form at a depth of approxi-mately 200–270 lm below surface (Fig. 2a) in spur gear teeth. Sim-ilar observations on subsurface fatigue crack initiation have beenreported earlier by Shiozawa and Lu [23]. Scanning electronmicroscopy (SEM) was employed to characterize the fracture sur-face of failed spur gear teeth as well as the topography and featuresof various spur gear surface conditions. A Hitachi S-3500 micro-scope with tungsten hairpin filament was used with a 20 kV elec-tron beam while the specimen chamber maintained a vacuum levelof 10�4 torr. A secondary electron detector was used to image topo-graphic features while a backscatter electron detector was used toachieve chemical contrast of inclusion phases located on fracturesurfaces. Qualitative chemical analysis and mapping of inclusionphases was performed using a PGT energy dispersive X-ray ana-lyzer. The site of crack nucleation is not in the tensile residualstress region. Analysis of the fracture surface and its mating surfaceindicates that the cracks are formed at clusters of inclusions.
Depth (μμm)
Depth (μm)
0 200 400 600 800 1000 1200
Mic
roha
rdne
ss (
VH
N)
520
540
560
580
600
620
640
660
680
700
720
0 100 200 300 400 500 600
Res
idua
l Str
ess
(MP
a)
-1600
-1400
-1200
-1000
-800
-600
-400
-200
0
a
b
Fig. 1. Measured hardness and residual stress profiles [1]: (a) variation of Vickersmicrohardness after heat treatment (carburization and tempering) with depth and(b) variation of residual stress with depth after shot peening.
Fig. 2. (a) SEM micrograph of fracture surface indicating the depth of fatigue crack origin and (b) backscatter SEM image of crack initiation zone showing characteristicinclusion sizes, clustering and debonding of inclusion-matrix interfaces [1].
1178 R. Prasannavenkatesan et al. / International Journal of Fatigue 31 (2009) 1176–1189

Author's personal copy
A single row of Al2O3 inclusions (particle 1,2,3 &4) on the toothfracture surface and the corresponding location of cavities on themating surface are shown for clarity in Fig. 2b [1]. The large parti-cle (#3), about 10 lm in size, could be the favorable site for fatiguecrack nucleation [13]. Debonding of particles was observed, withuncracked particles on the fracture surface and corresponding cav-ities on the mating surface. Inclusion clustering observed at the ini-tiation site indicates a potential role for inclusion interaction.Furthermore, the variation in material properties, distribution ofresidual stress, and magnitude and gradient of applied stress affectthe fatigue crack nucleation process in the subsurface in a cooper-ative manner. The aforementioned brief introduction of the essen-tial experimental results on microhardness, XRD residual stressmeasurements, fatigue tests, and SEM micrographs of fracture sur-face should suffice to convey the problem we intend to address.
3. Characterization of mechanical properties of matrix andinclusions
Three-dimensional FE analyses were performed to understandthe mechanisms of fatigue crack nucleation within the temperedmartensite matrix. Detailed description of heat treatment, surfacetreatment and composition of the material is presented by Tiemens[1,2]. The inclusions were assumed to be isotropic linear elasticwith Young’s modulus E = 400 GPa and Poisson’s ratio m = 0.2.The matrix was modeled as a rate-independent elastic-plasticmaterial with a nonlinear kinematic hardening law cast in a formatof hardening with dynamic recovery. The variation of carbon con-tent from the surface to core following carburization has signifi-cant influence on local mechanical properties of the material.Elastic modulus, yield strength and work hardening rate dependon carbon content. Donzella et al. [47] and Pedersen et al. [48] pre-sented an empirical relation between yield strength and microh-ardness for case hardened steel. However, for carbon steelsubjected to cyclic loading, softening occurs and thus the yieldstrength may be scaled down by 15–35% from the initial value[49]. Considering the experimental observations and applying theempirical relations, the material parameters of C61 steel were esti-mated for purposes of FE analyses. It is acknowledged that anaccurate measurement of material property gradients in the carbu-rized layer is tedious; in view of the desire to account for the effectof carburization we adopt the aforementioned strategy. In thiswork, we present some primary results and focus more on thedevelopment of the methodology. The variations of materialparameters with depth adopted in the current investigation arelisted in Table 1. Fig. 3 shows the simulated monotonic tensionstress–strain curves at various depths for the material considered.
4. General outline of elasto-plastic framework
The rate-independent plasticity model with combined kine-matic-isotropic hardening for the matrix is based on the simpleMises yield surface
F ¼ f ðr��a�Þ � r2
ys ð1Þ
with F = 0 during plastic flow. Here, r�
and a�
are the stress and backstress tensors, respectively, and rys is the uniaxial yield strength.The function f in Eq. (1) is defined by
f ðr��a�Þ ¼ 3
2ðS��a0�Þ : ðS
��a0�Þ ¼ 3
2ðSij � a0ijÞðSij � a0ijÞ ð2Þ
The associative plastic flow rule is given by
_ep� ¼
ffiffiffi32
r_�ep oF
or�
oFor�
������������
�������������1
¼ffiffiffi32
r_�ep N�¼
ffiffiffi32
r_�epðSij � a0ijÞjjðSij � a0ijÞjj
ð3Þ
where _�ep is defined by
_�ep ¼ffiffiffiffiffiffiffiffiffiffiffiffiffiffiffiffiffi23
_e�
p : _e�
p
rð4Þ
The evolution equation for the back stress tensor a�
is expressedas [50]
_a�¼ c
rysðr��a�Þ _�ep � r a
�_�ep ð5Þ
where c and r are material parameters. Here, c is the initial kine-matic hardening modulus and r determines the rate of dynamicrecovery of the back stress with increasing plastic deformation. Iso-tropic hardening is neglected in view of the desire to simulate cycli-cally stable response in parametric studies with pure kinematichardening. The elastic response is given by
r�¼ C�
: e�
e ð6Þ
where e�
e denotes the elastic strain tensor and C�
is the isotropic elas-tic stiffness tensor.
5. Imposition of initial residual stress: modeling the effect ofshot peening process
During processing, heat treatment (carburization and temper-ing) and surface treatment (shot peening) introduce a lateral com-pressive residual stress field at and near the surface.Comparatively, the residual stress introduced by carburizationand tempering (�100 MPa to �300 MPa) is much less than that
Table 1Variation of material properties with the depth from surface.
Depth (m) E (MPa) ys (MPa) c (MPa) r
0 (Surface) 193,000 998 112,000 200110 193,550 970 112,428 200150 193,750 942 113,083 200170 193,850 927 113,517 200190 193,950 912 114,018 200200 194,000 904 114,292 200220 194,100 890 114,883 200250 194,250 867 115,872 200275 194,375 860 116,780 200300 194,500 850 117,756 200325 194,625 840 118,790 200350 194,750 830 119,875 2001000 (core) 198,000 800 120,000 200
1600
1400
1200
1000
800
600
400
200
0
Stre
ss (
MPa
)
0.0350.0300.0250.0200.0150.0100.0050.000
Strain
Surface
110μm200μm
300μmCore
Fig. 3. Simulated monotonic tension stress–strain curves as a function of depthfrom surface. Depth of core is 1.0 mm below surface.
R. Prasannavenkatesan et al. / International Journal of Fatigue 31 (2009) 1176–1189 1179

Author's personal copy
introduced through shot peening, especially close to the surfacelayer of the specimen [1,51]. A series of nonequilibrium thermo-mechanical processes, such as diffusion, temperature-inducedphase transformation, dynamic elastic–plastic deformation, anddeformation-induced phase transformation are potentially in-volved during carburization, tempering and shot peening. As a re-sult, it is very complex to simulate the evolution of residual stressbased on the physical mechanisms. Although mechanism-based FEsimulation of residual stress is effective for two-dimensional calcu-lations, three-dimensional simulations become computationallymore demanding. Alternatively, a simplified scheme is followedto impose the residual stresses.
After carburization, the mechanical properties vary only withthe depth. Kobayashi and co-workers [52] considered that the shotpeening process effectively induces equi-biaxial residual compres-
sive stresses within the specimen by virtue of plastic deformation.It is reasonable to assume that the residual stress in the steel ma-trix near the surface after shot peening is also equi-biaxial; ofcourse, very near the surface the material may undergo tribologicaltransformation (phase transformation, extensive shear, refinementof structure, etc.), but this zone is typically small (<30 lm or so)compared to the depths at which fatigue cracks form. Fig. 4a showsa schematic of the shot peening process. Fig. 4b shows an equiva-lent volume element of the plastic zone (subsurface affected byshot peening) divided into multiple ‘subsurface elements’, eachcorresponding to a depth d below surface. The residual elasticstrains in the subsurface correspond to a self-equilibrating residualstress field, with compression near the surface and a tensile stressstate deeper into the subsurface. During shot peening the principalstress components are compressive. With these observations andidealizations, a methodology is developed to simulate residualstresses within the material induced by shot peening with respectto the surface coordinate system XYZ (Fig. 5). The procedure issummarized as follows:
1. Consider a homogeneous matrix subsurface element of thespecimen at a depth d below surface, initially without inclu-sions, as shown in Fig. 5a. The carburized material propertiescorresponding to the depth d is assigned to the subsurfaceelement.
2. Imposing the boundary conditions shown in Fig. 5, the subsur-face element is subjected to uniaxial compression in direction Yto strain levels calculated from the elasto-plastic constitutiverelations, in connection with the following step (eload
yy inFig. 5b). The total strain components (elastic plus plastic) inthe X and Z directions are assumed as zero at each stage ofthe process, in accordance with overall constraints.
3. The compression is followed by unloading in direction Y (efinalyy in
Fig. 5b) to elastic strain levels that match the measured macro-scopic residual stress distribution in the material as a functionof depth (Fig. 5c).
D
Direction of impact during shot peening
R Surface
Plastic zone
Surface
Subsurface element
d
a
b
L2
d
D< 1
Y
Z X
Fig. 4. (a) A schematic showing a metallic ball impacting the specimen surfaceduring shot peening, inducing constrained plastic deformation to a depth D belowsurface and (b) an equivalent volume element of the plastic zone divided intoseveral subsurface layers (‘elements’), each corresponding to a depth d below thesurface at which shot peening and fatigue simulations are performed.
L1
L2
L3
Y
Z
X
ux= 0 on planes X = 0, L1. uy= 0 on plane Y = 0. uz= 0 on planes Z = 0, L3.
Boundary conditions
Elastic strain
Plastic strain 0
resxx zz
yy
σ = σ = σσ ≈
Stress state after shot peening
a
yyε
yyσ
0 loadyyε
finalyyε
b
In the subsurface element.
ε negative
In the subsurface element.
Subsurface element at a depth d below surface.
negative positive
( )xx zzorσ σ
0 positive
resσ
cFig. 5. Methodology to simulate the shot peening process: (a) schematic showing a subsurface element on which the strains are imposed, (b) ryy vs eyy response in thesubsurface element during shot peening simulation, and (c) variation of elastic and plastic strain in X and Z directions in the subsurface element during shot peening.
1180 R. Prasannavenkatesan et al. / International Journal of Fatigue 31 (2009) 1176–1189
Author's personal copy
4. The resulting strain–time history is then applied as boundaryconditions on the same subsurface element with embeddedinclusions that are intact, debonded or cracked to assess thelocal residual stresses and strains in the vicinity of inclusionsas initial conditions for subsequent fatigue simulations. This isrepeated for each subsurface depth of interest.
When considering the embedded inclusion(s) in Step 4, thedimensions of the subsurface element are chosen to be sufficientlylarge that the inclusion experiences negligible boundary interac-tion effects (i.e., boundary conditions obtained from Steps 1–3are adequate). There is an additional consideration that the gradi-ent of the residual stress state cannot be too large compared to thethickness of the subsurface volume element selected in Step 1; thisis dictated by inclusion size. A detailed derivation of the approachoutlined in Steps 1–3 above appears in Appendix A. The followingdirection convention holds for all subsequent 3D calculations:
� Direction of impact (shot peening) –Y direction� Equibiaxial residual stress state –X and Z directions� Cyclic loading – bending stress along Z direction
It is noted that damage (cracking or debonding) can occur toinclusions during primary forming or shot peening. We thereforepursue the strategy of simulating inclusions that are assumed tobe already cracked or debonded at the beginning of the shot peen-ing process as a means of assessing their influence on the localresidual stress state and the driving forces for fatigue crack nucle-ation at the inclusion.
6. Fatigue crack nucleation analysis under cyclic loading
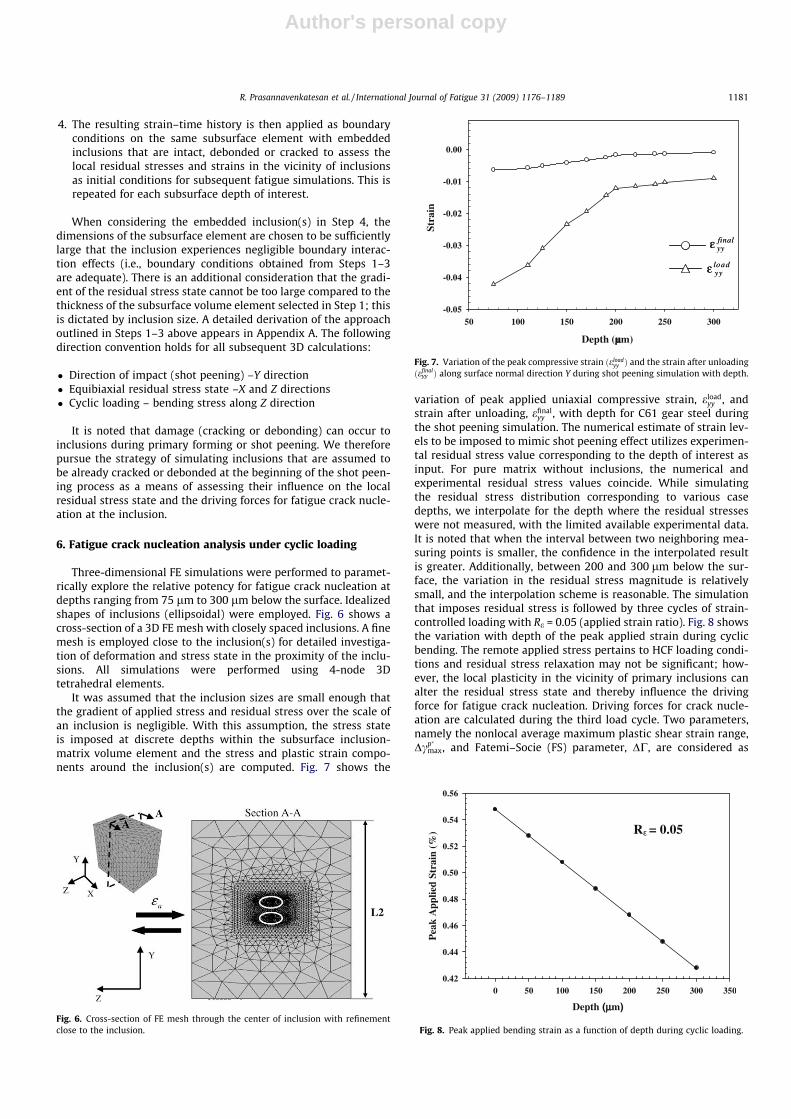
Three-dimensional FE simulations were performed to paramet-rically explore the relative potency for fatigue crack nucleation atdepths ranging from 75 lm to 300 lm below the surface. Idealizedshapes of inclusions (ellipsoidal) were employed. Fig. 6 shows across-section of a 3D FE mesh with closely spaced inclusions. A finemesh is employed close to the inclusion(s) for detailed investiga-tion of deformation and stress state in the proximity of the inclu-sions. All simulations were performed using 4-node 3Dtetrahedral elements.
It was assumed that the inclusion sizes are small enough thatthe gradient of applied stress and residual stress over the scale ofan inclusion is negligible. With this assumption, the stress stateis imposed at discrete depths within the subsurface inclusion-matrix volume element and the stress and plastic strain compo-nents around the inclusion(s) are computed. Fig. 7 shows the
variation of peak applied uniaxial compressive strain, eloadyy , and
strain after unloading, efinalyy , with depth for C61 gear steel during
the shot peening simulation. The numerical estimate of strain lev-els to be imposed to mimic shot peening effect utilizes experimen-tal residual stress value corresponding to the depth of interest asinput. For pure matrix without inclusions, the numerical andexperimental residual stress values coincide. While simulatingthe residual stress distribution corresponding to various casedepths, we interpolate for the depth where the residual stresseswere not measured, with the limited available experimental data.It is noted that when the interval between two neighboring mea-suring points is smaller, the confidence in the interpolated resultis greater. Additionally, between 200 and 300 lm below the sur-face, the variation in the residual stress magnitude is relativelysmall, and the interpolation scheme is reasonable. The simulationthat imposes residual stress is followed by three cycles of strain-controlled loading with Re = 0.05 (applied strain ratio). Fig. 8 showsthe variation with depth of the peak applied strain during cyclicbending. The remote applied stress pertains to HCF loading condi-tions and residual stress relaxation may not be significant; how-ever, the local plasticity in the vicinity of primary inclusions canalter the residual stress state and thereby influence the drivingforce for fatigue crack nucleation. Driving forces for crack nucle-ation are calculated during the third load cycle. Two parameters,namely the nonlocal average maximum plastic shear strain range,Dcp�
max, and Fatemi–Socie (FS) parameter, DC, are considered as
Fig. 6. Cross-section of FE mesh through the center of inclusion with refinementclose to the inclusion.
Depth (µµm)
50 100 150 200 250 300
Stra
in
-0.05
-0.04
-0.03
-0.02
-0.01
0.00
loadyyε
finalyyε
loadyyε
finalyyε
Fig. 7. Variation of the peak compressive strain ðeloadyy Þ and the strain after unloading
ðefinalyy Þ along surface normal direction Y during shot peening simulation with depth.
Depth (μμm)
0 50 100 150 200 250 300 350
Pea
k A
pplie
d S
trai
n (%
)
0.42
0.44
0.46
0.48
0.50
0.52
0.54
0.56
R = 0.05
Fig. 8. Peak applied bending strain as a function of depth during cyclic loading.
R. Prasannavenkatesan et al. / International Journal of Fatigue 31 (2009) 1176–1189 1181

Author's personal copy
possible driving force parameters for fatigue crack nucleation atvarious depths. The latter parameter includes limited consider-ation of small crack propagation [53]. The FS parameter considersthe effect of the maximum normal stress rmax
n perpendicular tothe plane of maximum cyclic plastic shear strain, and has provento be a very effective correlative parameter for multiaxial fatigue[54]. It has been generalized by McDowell [55] and Shenoy et al.[56] to form the basis for microstructure-sensitive small crackgrowth laws, with the latter study using computational microme-chanics to compute the FS parameter within individual grains in apolycrystalline Ni-base superalloy. Good correlations with experi-ments have been obtained in terms of fatigue lives of differentmetallic materials using the FS critical plane approach [57–62].The FS parameter is defined by
DC ¼ Dcph
21þ k
rmaxn
rys
� �ð7Þ
where, k = 0.6 is a material parameter [43].In local FE analyses, the micronotch root maximum plastic
shear strain amplitude is mesh sensitive. Furthermore, fatiguecracks form over some finite region of intense shear, typically onthe order of a micron in scale. Moreover, for cracks growing in anotch root field, a transition crack length on the order of 10–20%of the notch root radius is often invoked, below which it is as-sumed that the local notch root field controls behavior and abovewhich the notch becomes part of the crack. It is therefore necessaryto introduce a nonlocal volume averaging procedure over integra-tion points in the mesh to (i) effectively remove mesh dependenceand (ii) to accord with the physical process zone for subcriticalcrack formation processes. Motivated by earlier work [18,38] themaximum plastic shear strain amplitude is averaged over 1 lm3
(unit cube), which corresponds to about 10% of the volume of aninclusion of minimum size in the present study, and in each simu-lation is selected as that particular volume of matrix material atthe notch root that maximizes the nonlocal plastic shear strainamplitude. We employ this nonlocal volume for all the cases exam-ined in this parametric computational study. Naturally, such asmall volume is considered in terms of evaluating the probabilityto form a crack, and larger domains would be necessary to considerpropagation resistance.
At every integration point lying within the nonlocal averagingregion, the plastic shear strain cp
h is computed on the plane-h byprojecting onto it the plastic strain tensor ep
ij at each integrationpoint, i.e.,
cph
2¼ niep
ijtj h ¼ 1 . . . N ð8Þ
where ni and tj are the unit normal and tangent vectors, respec-tively, on the plane- h, and N is the number of discrete planes.The nonlocal average plastic shear strain is then calculated by aver-aging over the volume V of the nonlocal region, i.e.,
cp�
h ¼1V
ZVcp
hdV ð9Þ
The nonlocal cyclic plastic shear strain range for every plane iscalculated during the third load cycle of the simulation. The non-local maximum cyclic plastic shear strain range, is defined by
Dcp�max ¼max
hðDcp�
h Þ ð10Þ
Once the critical plane and corresponding nonlocal maximumplastic shear strain range are determined, DC is calculated usingEq. (7) at every integration point on the critical plane and a volumeaverage is performed in the nonlocal region similar to Eq. (9); thiseffectively results in a nonlocal FS parameter. Alternatively, directmaximization of DC could be considered instead of first maximiz-
ing Dcp�max. A simple local form of the Coffin-Manson law has been
used to correlate the number of cycles for nucleation of fatiguecracks with the candidate driving forces [41,63], but of coursemore complex analyses can be conceived that reflect lower scaledetails of microstructure and slip irreversibility.
7. Results and Discussion
7.1. Cracked inclusion analyses
Subsurface layers with cracked ellipsoidal inclusions, embeddedin the elasto-plastic matrix, were subjected to boundary conditionsduring shot peening based on the analyses conducted withoutinclusions, as described earlier. Ellipsoidal inclusions were chosento facilitate parametric studies; however, inclusion morphologycan influence the local stresses and cyclic plastic strain distribu-tion. Investigation of realistic particle shape and distribution willbe performed in future. Each layer was then subjected to three cy-cles of strain-controlled cycling with amplitude appropriate foreach depth, and an R ratio of 0.05. Simulations were also performedwith intact particles and results showed negligibly small drivingforce in this study for all case depths below the surface. Similarobservations were reported by Gall and co-workers [18] for A356aluminum alloy. This may be due to the fact that the peak appliedbending stress is less than 60.8rys and hence the stress amplitudeis well below the elastic limit of C61 gear steel. Also, localization ofstresses and plastic strains around intact particles are not as in-tense as that observed near damaged particles. In addition to theaforementioned observations, it is important to note that fatiguecrack nucleation in the high cycle fatigue regime is highly hetero-geneous at the grain scale [63]. Investigation of the potency of in-tact particles to nucleate fatigue cracks while operating close to afatigue limit associated with nonpropagating cracks demandsmore detailed scale-dependent, discrete dislocation plasticity sim-ulations; J2 plasticity assumption may not be sufficient to reflectsuch failure scenarios. Accordingly, this ideal case study focuseson cracks nucleating from damaged particles (cracked and partiallydebonded inclusions) for which plastic strain localization in thematrix is of sufficient magnitude to merit treatment with simpleJ2 plasticity to facilitate parametric comparisons.
Fig. 9 illustrates the three-dimensional boundary conditionsand orientation of a cracked particle with respect to the directionof applied bending stress and the surface. It was assumed thatinclusions tend to crack when the major axis of the ellipsoidal par-ticle is oriented parallel to the applied stress direction. Table 2summarizes the list of cases considered while analyzing the effectof cracked particles on fatigue crack nucleation in the matrix atvarious subsurface depths. In Tables 2 and 3, 2a and 2b representthe major and minor axis dimensions of the ellipsoidal inclusion,respectively, 2c and 2d represent those of the neighboring inclu-sion, and L is the longitudinal end-to-end spacing between theinclusions, chosen to be 1 lm in this limited parametric study.For convenience, all cases and results presented in the subsequentsections will be addressed with the ‘case pointer’ listed in Table 2.For example, Fig. 10a shows the equivalent plastic strain contourplot around the cracked inclusions located at 250 lm below sur-face, at the end of the third loading cycle for case R1. The studycases listed in Tables 1 and 2 were chosen in order to examinethe factors that affect the severity of plastic strain localization atnon-metallic primary inclusions which include inclusion spacing,size, and orientation. The aforementioned factors are importantin HCF [63]. A frictionless surface-to-surface contact is used tomodel all debonded interfaces in this study.
Plastic strain intensification is observed to occur in the matrixnear the intersection of the cracked particle with the matrix. The
1182 R. Prasannavenkatesan et al. / International Journal of Fatigue 31 (2009) 1176–1189

Author's personal copy
severity of stresses and plastic strain localization was observed todepend on the size of the inclusion and inclusion spacing. Thehighest values of stresses and plastic strains were observed in caseR1 as compared to cases P1 and Q1 in the vicinity of cracked par-ticle. Stress intensification arising due to interaction of inclusionscould magnify the crack driving force and thereby reduce the fati-gue crack nucleation and early growth life relative to the case of asingle inclusion. An example of a detailed investigation of the ef-fect of particle shape, alignment, spacing and configuration on localstress distribution under cyclic loading can be found elsewhere[64].
Fig. 11 shows the variation of the nonlocal maximum plasticshear strain amplitude, Dcp�
max /2, and nonlocal FS parameter, DC,with depth for case P1. Interestingly, the maximum value of theseparameters corresponds to a depth of about 250 lm below the sur-face, which falls within the range of depths observed in experi-ments for C61 gear steels. Note that this depth is still within theregime of initial compressive residual stress following shot peen-ing. The driving forces are negligibly small at depths between 75
and 150 lm even though the applied strain amplitude is higherclose to the surface. Shot peening suppresses the fatigue cracknucleation at the surface and shifts the crack nucleation site tosubsurface depths. The critical depth depends on residual stressdistribution, applied stress, and property gradients. Presence ofother inhomogeneities such as pores and soft inclusions (sulfideparticles) could alter the favorable site for crack nucleationdepending on the intensity of localization around such inclusions.
The nonlocal maximum plastic shear strain amplitude and FSparameter were also calculated for cases with two cracked inclu-sions closely spaced (case Q1and R1); results are shown in Figs.12 and 13, respectively. The trends are similar to that of the singlecracked inclusion (case P1) but the values are an order of magni-tude higher due to size and interaction of inclusions. Increase ofthe fatigue crack nucleation driving force with increase in inclusionsize (case R1 compared to case Q1) supports the observation ofToyoda and co-workers [21] relating the inclusion size to thresholdfatigue strength. The sensitivity of potency of fatigue crack nucle-ation to the size and number of particles (clustering) is most
Cracked region
εaX
Z b
Elasto-plastic matrix
Inclusions
X
Y
a
c
Z
Y
εa
Cracked region
Debonded surface
Debonded surface
Fig. 9. Cross-sectional views of the 3D section with embedded inclusions, showing the debonded and cracked surfaces, boundary conditions for bending, and cyclic loadingdirection. Views on (a) XY, (b) XZ, and (c) YZ cutting planes through the center of the inclusion.
Table 2List of cases analyzed in the study of cracked inclusions.
Case pointer No of inclusions Shape of inclusion 2a (lm) 2b (lm) 2c (lm) 2d (lm) L (lm)
P1 1 Ellipsoidal 5 2 – – –Q1 2 Ellipsoidal 5 2 5 2 1R1 2 Ellipsoidal 5 2 10 4 1
Table 3List of cases analyzed in the study of partially debonded inclusions.
Case Pointer No. of Inclusions Shape of inclusion 2a (lm) 2b (lm) 2c (lm) 2d (lm) L (lm) /1 /2
A1 1 Ellipsoidal 5 2 – – – 0� –B1 2 Ellipsoidal 5 2 5 2 1 0� 0�C1 2 Ellipsoidal 5 2 5 2 1 90� 90�D1 2 Ellipsoidal 5 2 10 4 1 0� 0�E1 2 Ellipsoidal 5 2 10 4 1 90� 90�
/1 and /2 represent the orientation of inclusion 1 and inclusion 2, respectively)
R. Prasannavenkatesan et al. / International Journal of Fatigue 31 (2009) 1176–1189 1183

Author's personal copy
pronounced at lower stress levels than at stress levels above mac-roscopic yielding [41]. Several other factors affect the HCF cracknucleation life, including inclusion shape and orientation[17,40,64]. However, detailed investigation of all the factors influ-encing subsurface fatigue crack nucleation in shot peened C61steel is beyond the scope of the present parametric study.
7.2. Partially debonded inclusion analyses
Three-dimensional FE analyses were performed involving par-tially debonded inclusions (ellipsoidal) embedded in an elasto-plastic matrix. McDowell et al. [17] showed for A356-T6 Al alloythat partially debonded inclusions offer the most conservative(i.e., severe) scenario for assessment of fatigue potency. Fig. 14 de-scribes the convention followed to represent ellipsoidal inclusionorientation in XY plane denoted by angle u. In all cases, the ellip-soidal inclusions were aligned such that the major axis of the inclu-sion was perpendicular to the direction of applied bending stress.Fig. 9 shows cross-sectional views of the 3D domain, elaboratingon the boundary conditions, loading direction, and debonded sur-face of the inclusion considered in the parametric study.
Each subsurface volume element was subjected to similar load-ing conditions as described in cracked inclusion analyses. Table 3summarizes the different cases of a partially debonded inclusionanalyzed in the parametric study. All the cases presented in the fol-lowing plots and discussion will be addressed with the ‘case poin-ter’ listed in Table 3. For example, Fig. 10b shows the equivalentplastic strain contour plot for case E1 at the end of the third loadingcycle. Intensified plastic strain at the intersection of the debondedand bonded surfaces of the matrix can be observed in the contourplot. The intensification is due to the crack-like defect present atthe tip of the debond seam coupled with the constraint and contactof embedded inclusions. It was mentioned by Gall et al. [18] thathigh stresses around cracked inclusions can facilitate debondingat the particle matrix interface. It was also shown that once acracked particle begins to debond, the local plastic strains areintensified in the matrix with the same order of magnitude as acrack-free but partially debonded inclusion. Similar to crackedinclusion analyses, the severity of stress and plastic strain localiza-tion was influenced by particle size and spacing. The magnitudes ofplastic strains and stresses in the matrix encompassing the par-tially debonded alumina inclusion were highest in cases D1 andE1 compared to all other cases listed in Table 3.
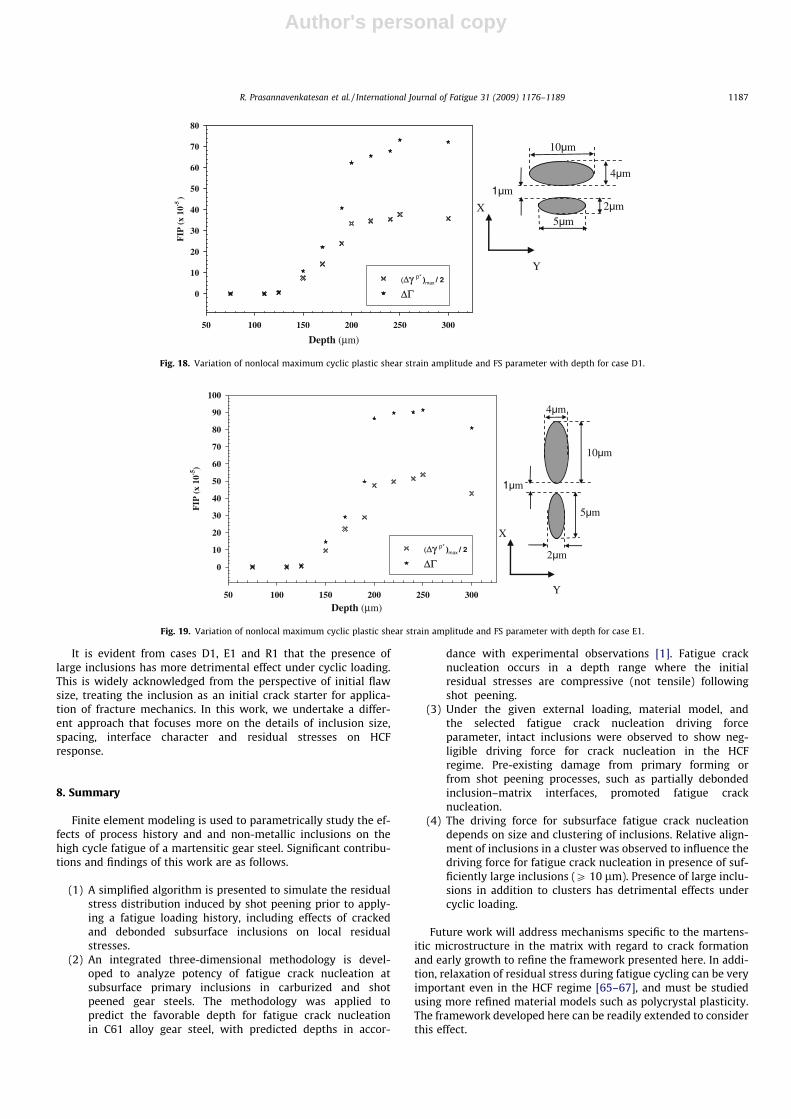
Fig. 15 shows the variation of nonlocal maximum plastic shearstrain amplitude and nonlocal FS parameter with depth for case A1.Similar to the results obtained in the cracked inclusion analyses,the critical depth for fatigue crack nucleation trends towards250 lm. The debonded inclusion is observed to facilitate higherplastic strains under monotonic loading, which in turn leads tohigher local stress states. Consequently, reversed yielding occursmore readily near the debonded inclusion. Consistent results wereobtained for all the cases listed in Table 3 (see Figs. 16–19) where
Fig. 10. Contour plot of the equivalent plastic strain at the end of third loading cycleat a depth of 250 lm below surface: (a) case R1 and (b) case E1.
Depth (μm)
50 100 150 200 250 300
FIP
(x10
- 5)
0.0
0.2
0.4
0.6
0.8
1.0
1.2
(Δγ p* )max / 2
ΔΓ
5µm
2µm
Z
Y
Fig. 11. Variation of nonlocal maximum cyclic plastic shear strain amplitude and FS parameter with depth for case P1.
1184 R. Prasannavenkatesan et al. / International Journal of Fatigue 31 (2009) 1176–1189

Author's personal copy
the predicted critical depth for subsurface fatigue crack nucleationwas in accordance with experimental observations. Size and spac-ing of partially debonded inclusions are observed to play a signifi-cant role in fatigue crack nucleation potency at subsurface depths.Case E1 is observed to be most detrimental under cyclic loadingamong all cases analyzed in this parametric study. This is due tothe presence of a large partially debonded inclusion coupled withintensification arising due to interaction with neighboring inclu-sion. The variations arising due to spatial alignment of inclusionsin a cluster (comparing case D1 and case E1) will be addressed la-ter. The predictions and observations reported in this parametricstudy emphasize the importance of inclusion-matrix interfacecharacter on fatigue crack nucleation potency. Comparing the sin-gle cracked particle results (case P1) in Fig. 11 and single partially
debonded inclusion results (case A1) in Fig. 15 for which the inclu-sion size was equal, the driving force for fatigue crack nucleation isrelatively higher in presence of partially debonded inclusions. Sim-ilar observations can be made by comparing different cases of par-tially debonded and cracked inclusions with equal size andspacing; it is evident that cracked inclusions do not localize plasticstrains and stresses in the matrix as severely as partially debondedinclusions.
The use of ellipsoidal inclusions in this parametric study facil-itates assessment of the effect of inclusion alignment in a clusterwith respect to loading direction on fatigue crack nucleation.Although partially debonded inclusions were aligned such thatthe major axis of the ellipsoid was perpendicular to loadingdirection, some disparity in the driving force for fatigue cracknucleation arises by varying the relative alignment of inclusionsin the XY plane. The differences were significant between caseD1 (Fig. 18) and case E1 (Fig. 19). The driving force parametersare relatively higher at subsurface depths for case E1. Since theplastic strain localization is most severe at the inclusion notchroot in ellipsoidal particles, the magnitudes of these parametersare expected to be relatively higher when the inclusions arealigned such that the major axis of individual inclusions coin-cides (as in case E1). Comparing cases B1 and C1 in Figs. 16and 17, respectively, the difference in the magnitudes of FIPsare relatively small. This observation suggests that the effect of
Depth (μm)
50 100 150 200 250 300
FIP
(x
10 - 5
)
0
2
4
6
8
10
(Δγ p* )max / 2
ΔΓ
2µm
Z
Y
1µm
5µm
5µm
3µm
Fig. 12. Variation of nonlocal maximum cyclic plastic shear strain amplitude and FS parameter with depth for case Q1.
Depth (μm)50 100 150 200 250 300
FIP
(x10
- 5)
0
2
4
6
8
10
12
14
16
(Δγ p* )max / 2
ΔΓ
Z
Y1µm
4µm
10µm
5µm
2µm
Fig. 13. Variation of nonlocal maximum cyclic plastic shear strain amplitude and FS parameter with depth for case R1.
X
Y ϕ = 0˚
X
Y ϕ = 90˚
Fig. 14. Convention followed to represent the orientation of inclusion. Angle u ismeasured with respect to X axis (axis of applied bending strain along Z direction).Direction Y is normal to the surface.
R. Prasannavenkatesan et al. / International Journal of Fatigue 31 (2009) 1176–1189 1185

Author's personal copy
relative spatial alignment of inclusions in a cluster on fatiguecrack nucleation is more pronounced for large inclusions(P10 lm) and can be regarded as a second-order effect. The dis-parity in fatigue response arising due to variations in spatialarrangement of inclusions in a cluster can be a major contributorto the scatter in HCF lives observed in experiments. In addition
to the intensification of the driving force for nucleation, the sizeof the embryo for long crack growth is on the order of the clus-ter size, which can be substantially larger than the size of indi-vidual primary inclusions (see Fig. 2). Study of subcritical crackformation and growth within inclusion clusters of more complexcharacter is a topic of ongoing work.
Depth (μm)50 100 150 200 250 300
FIP
(x
10- 5
)
0.0
0.2
0.4
0.6
0.8
1.0
1.2
1.4
(Δγ p* )max / 2
ΔΓ
5µm
2µm
Y
X
Fig. 15. Variation of nonlocal maximum cyclic plastic shear strain amplitude and FS parameter with depth for case A1.
Depth (μm)
50 100 150 200 250 300
FIP
(x
10- 5
)
0
5
10
15
20
25
30
(Δγ p* )max / 2
ΔΓ
2µm
Y
X
1µm
5µm
5µm
3µm
Fig. 16. Variation of nonlocal maximum cyclic plastic shear strain amplitude and FS parameter with depth for case B1.
Depth (μm)50 100 150 200 250 300
FIP
(x10
-5)
0
5
10
15
20
25
30
35
(Δγ p* )max / 2
ΔΓ
5µm
1µm
5µm
2µm
2µm
Y
X
Fig. 17. Variation of nonlocal maximum cyclic plastic shear strain amplitude and FS parameter with depth for case C1.
1186 R. Prasannavenkatesan et al. / International Journal of Fatigue 31 (2009) 1176–1189
Author's personal copy
It is evident from cases D1, E1 and R1 that the presence oflarge inclusions has more detrimental effect under cyclic loading.This is widely acknowledged from the perspective of initial flawsize, treating the inclusion as an initial crack starter for applica-tion of fracture mechanics. In this work, we undertake a differ-ent approach that focuses more on the details of inclusion size,spacing, interface character and residual stresses on HCFresponse.
8. Summary
Finite element modeling is used to parametrically study the ef-fects of process history and and non-metallic inclusions on thehigh cycle fatigue of a martensitic gear steel. Significant contribu-tions and findings of this work are as follows.
(1) A simplified algorithm is presented to simulate the residualstress distribution induced by shot peening prior to apply-ing a fatigue loading history, including effects of crackedand debonded subsurface inclusions on local residualstresses.
(2) An integrated three-dimensional methodology is devel-oped to analyze potency of fatigue crack nucleation atsubsurface primary inclusions in carburized and shotpeened gear steels. The methodology was applied topredict the favorable depth for fatigue crack nucleationin C61 alloy gear steel, with predicted depths in accor-
dance with experimental observations [1]. Fatigue cracknucleation occurs in a depth range where the initialresidual stresses are compressive (not tensile) followingshot peening.
(3) Under the given external loading, material model, andthe selected fatigue crack nucleation driving forceparameter, intact inclusions were observed to show neg-ligible driving force for crack nucleation in the HCFregime. Pre-existing damage from primary forming orfrom shot peening processes, such as partially debondedinclusion–matrix interfaces, promoted fatigue cracknucleation.
(4) The driving force for subsurface fatigue crack nucleationdepends on size and clustering of inclusions. Relative align-ment of inclusions in a cluster was observed to influence thedriving force for fatigue crack nucleation in presence of suf-ficiently large inclusions (P 10 lm). Presence of large inclu-sions in addition to clusters has detrimental effects undercyclic loading.
Future work will address mechanisms specific to the martens-itic microstructure in the matrix with regard to crack formationand early growth to refine the framework presented here. In addi-tion, relaxation of residual stress during fatigue cycling can be veryimportant even in the HCF regime [65–67], and must be studiedusing more refined material models such as polycrystal plasticity.The framework developed here can be readily extended to considerthis effect.
Depth (μm)
50 100 150 200 250 300
FIP
(x
10-5
)
0
10
20
30
40
50
60
70
80
(Δγ p* )max / 2
ΔΓ
1µm
4µm
10µm
5µm 2µm
Y
X
Fig. 18. Variation of nonlocal maximum cyclic plastic shear strain amplitude and FS parameter with depth for case D1.
Y
X
1µm
5µm
2µm
10µm
4µm
Depth (μm)50 100 150 200 250 300
FIP
(x10
- 5)
0
10
20
30
40
50
60
70
80
90
100
(Δγ p* )max / 2
ΔΓ
Fig. 19. Variation of nonlocal maximum cyclic plastic shear strain amplitude and FS parameter with depth for case E1.
R. Prasannavenkatesan et al. / International Journal of Fatigue 31 (2009) 1176–1189 1187
Author's personal copy
Acknowledgments
The authors are grateful for the support of the ONR/DARPA D3Dtools consortia (J. Christodoulou, monitor), under contract# N00014-05-C-0241. The authors also thank Mahesh Shenoy forthe helpful discussions during the course of this work.
Appendix A
The stress state at any subsurface depth after shot peening isgiven by
rxx ¼ rzz ¼ rres
ryy ¼ 0sxy ¼ sxz ¼ syz ¼ 0axy ¼ axz ¼ ayz ¼ 0
ðA:1Þ
During plastic deformation (shot peening), the following quan-tities and their differential increments always satisfy
epxy ¼ ep
xz ¼ epyz ¼ 0 dep
xy ¼ depxz ¼ dep
yz ¼ 0
epxx þ ep
yy þ epzz ¼ 0 and dep
xx þ depyy þ dep
zz ¼ 0 ðincompressibilityÞ
epxx ¼ ep
zz ¼ �12ep
yy depxx ¼ dep
zz ¼ �12
depyy
ðA:2Þ
During the shot peening process the shear strain componentsare zero in the XYZ principal coordinate frame, i.e.,
exy ¼ eyz ¼ ezx ¼ 0 ðA:3Þ
Expanding the yield function in Eq. (1) gives
F ¼ 2ðrxx � axxÞ � ðryy � ayyÞ � ðrzz � azzÞ� �2
þ 2ðrzz � azzÞ � ðrxx � axxÞ � ðryy � ayyÞ� �2
þ 2ðryy � ayyÞ � ðrxx � axxÞ � ðrzz � azzÞ� �2 � 6r2
ys
¼ 0 ðA:4Þ
Due to equi-biaxial deformation, the following relationshipshold during the entire process of shot peening:
rxx � axx ¼ rzz � azz
Sxx � a0xx ¼ Szz � a0zz
epxx ¼ ep
zz; _epxx ¼ _ep
zz
ðA:5Þ
Inserting Eq. (A.5) into Eq. (A.4) the yield function reduces to
F ¼ ½ðrxx � axxÞ � ðryy � ayyÞ�2 � r2ys ¼ 0 or
jðrxx � axxÞ � ðryy � ayyÞj ¼ rys
ðA:6Þ
Using the relation in Eq. (A.2) the increment of equivalent plas-tic strain is given by,
d�ep ¼ jdepyyj ¼ 2jdep
xxj ðA:7Þ
Using the three-dimensional Hooke’s law, the elastic and plasticstrains at the end of shot peening process can be obtained byapplying the boundary conditions shown in Fig. 5, i.e.,
ee;finalxx ¼ rres
Eð1� mÞ ¼ �ep;final
xx
ee;finalzz ¼ rres
Eð1� mÞ ¼ �ep;final
zz
ee;finalyy ¼ �m
Eð2rresÞ
ðA:8Þ
Here, the superscript ‘final’ corresponds to final strain state atthe end of shot peening. Coupling Eqs. (A.2), (A.7), and (A.8), thefinal strain component along direction Y after unloading can beobtained as
efinalyy ¼
�mEð2rresÞ þ 2ee;final
xx ðA:9Þ
In order to obtain the peak uniaxial compressive strain to be im-posed along direction Y ðeload
yy Þ to induce the target residual stresslevel, the above equations coupled with the nonlinear kinematichardening relation described in Eq. (5) are solved numerically.We employ the method of successive substitution along with aninterval-halving scheme to iteratively solve the set of equations.The return mapping scheme to solve the elasto-plastic relations(Eqs (1)–(6)) is implemented along the lines proposed by Kobay-ashi and Ohno [68].
References
[1] Tiemens BL. Performance optimization and computational design of ultra-highstrength gear steels. Department of materials science and engineering. PhDthesis, Evanston (IL): Northwestern University, 2006.
[2] Tiemens BL, Sachdev AK, Olson GB. Performance of computationally designedultra-hard steel for transmission gear applications. Collaborate report CL -04/41/MPL, GM Research and Development Center, August 2004.
[3] Ceschini L, Minak G. Fatigue behaviour of low temperature carburised AISI316L austenitic stainless steel. Surf Coat Technol 2008;202(9):1778–84.
[4] Tokaji K, Akita M. Effect of carburizing on notch fatigue behaviour in AISI 316austenitic stainless steel. Surf Coat Technol 2006;200(20-21):6073–8.
[5] Farfan S, Rubio-Gonzalez C, Cervantes-Hernandez T, Mesmacque G. High cyclefatigue, low cycle fatigue and failure modes of a carburized steel. Int J Fatigue2004;26(6):673–8.
[6] Kawagoishi N, Nagano T, Moriyama M. Effect of shot peening on fatiguestrength of maraging steel. Sixth international conference on computermethods and experimental measurements for surface treatmenteffects,Crete, Greece 2003; 7:99–108.
[7] Iwata N, Tomota Y, Katahira K, Suzuki H. Effect of shot peening on fatiguefracture for an as quenched martensitic steel. Mater Sci Technol2002;18(6):629–32.
[8] Brown J. Shot peening increases gear life. Power Transmission Des1996;38(5):61–4.
[9] Benedetti M, Fontanari V, Hohn BR, Oster P, Tobie T. Influence of shot peeningon bending tooth fatigue limit of case hardened gears. Int J Fatigue2002;24(11):1127–36.
[10] Almen JO. Fatigue weakness of surfaces. Prod Eng 1950;21(11):117–40.[11] Sieber R. Bending fatigue performance of carburized gear steels. SAE
International congress and exposition detroit, MI. Warrendale (PA), SAE;1992: p. 1–18.
[12] Kunio T, Shimizu M, Yamada K, Sakura K, Yamamoto T. Early stage of fatiguecrack growth in martensitic steel. Int J Fracture 1981;17(2):111–9.
[13] Murakami Y, Endo T. Effects of small defects on fatigue strength of metals. Int JFatigue 1980;2(1):23–30.
[14] Murakami Y, Endo M. Quantitative evaluation of fatigue strength of metalscontaining various small defects or cracks. Eng Fracture Mech1983;17(1):1–15.
[15] Umezawa O, Nagai K. Deformation structure and subsurface fatigue crackgeneration in austenitic steels at low temperature. Metall Mater Trans A (PhysMetall Mater Sci) 1998;29A(3):809–22.
[16] Wang QY, Bathias C, Kawagoishi N, Chen Q. Effect of inclusion on subsurfacecrack initiation and gigacycle fatigue strength. Int J Fatigue2002;24(12):1269–74.
[17] McDowell DL, Gall K, Horstemeyer MF, Fan J. Microstructure-based fatiguemodeling of cast A356-T6 alloy. Eng Fract Mech 2003;70(1):49–80.
[18] Gall K, Horstemeyer MF, Degner BW, McDowell DL, Fan J. On the driving forcefor fatique crack formation from inclusion and voids in a cast A356 aluminumalloy. Int J Fracture 2001;108(3):207–33.
[19] Torres MAS, Voorwald HJC. An evaluation of shot peening, residual stress andstress relaxation on the fatigue life of AISI 4340 steel. Int J Fatigue2002;24(8):877–86.
[20] Shaw BA, Aylott C, O’Hara P, Brimble K. In: Hyannis MA, editor. The role ofresidual stress on the fatigue strength of high performance gearing, vol.25. United States: Elsevier; 2003. p. 1279–83.
[21] Toyoda T, Matsui T, Murakami Y. A study of inclusions causing fatiguecracks in steels for carburized and shot peened gears. JSAE Review1990;11:50–4.
[22] Nishijima S, Kanazawa K. Stepwise S-N curve and fish-eye failure in gigacyclefatigue. Fatigue Fracture Eng Mater Struct 1999;22(7):601–7.
[23] Shiozawa K, Lu L. Very high-cycle fatigue behaviour of shot-peened high-carbon-chromium bearing steel. Fatigue Fracture Eng Mater Struct 2002;25(8-9):813–22.
1188 R. Prasannavenkatesan et al. / International Journal of Fatigue 31 (2009) 1176–1189

Author's personal copy
[24] Kim C, Diesburg DE, Eldis GT. Effect of residual stress on fatigue behavior ofcarburized steels- an analytical model. In: ASTM STP 776, Residual stress effectin fatigue; 1982; p. 224-234.
[25] Sharma VK, Walter GH, Breen DH. Factors influencing fracture toughness ofhigh carbon martensitic steels. Gear Technol 1989:7–18.
[26] Lin H, Fett GA, Binoniemi RR. Bending fatigue life analysis of carburizedcomponents using strain life and fracture mechanics approaches. J MaterManuf 2004;112:154–64.
[27] MackAldener M, Olsson M. Tooth interior fatigue fracture – computational andmaterial aspects. Int J Fatigue 2001;23(4):329–40.
[28] McDiarmid DL. General criterion for high cycle multiaxial fatigue failure.Fatigue Fracture Eng Mater Struct 1991;14(4):429–53.
[29] Borbely A, Mughrabi H, Eisenmeier G, Hoppel HW. A finite element modellingstudy of strain localization in the vicinity of near-surface cavities as a cause ofsubsurface fatigue crack initiation. Int J Fracture 2002;115(3):227–32.
[30] Ogawa K, Asano T. Theoretical prediction of residual stress produced by shotpeening and experimental verification for carburized steel. Mater Sci Res Int2000;6(1):55–62.
[31] Inoue K, Kato M. Crack growth resistance due to shot peening in carburizedgears. J Propul Power 1995;11(5):973–9.
[32] Blarasin A, Guagliano M, Vergani L. Fatigue crack growth prediction inspecimens similar to spur gear teeth. Fatigue Fracture Eng Mater Struct1997;20(8):1171–82.
[33] Chaboche JL, Jung O. Application of a kinematic hardening viscoplasticitymodel with thresholds to the residual stress relaxation. Int J Plasticity1997;13(10):785–807.
[34] Li JK, Yao M, Wang D. Mechanical approach to the residual stress field inducedby shot peening. Mater Sci Eng A (Struct Mater: Properties, MicrostructProcess) 1991;A147(2):167–73.
[35] Meguid SA, Shagal G, Stranart JC, Liew KM, Ong LS. Relaxation of peeningresidual stresses due to cyclic thermo-mechanical overload. J Eng MaterTechnol, Trans ASME 2005;127(2):170–8.
[36] Fathallah R, Laamouri A, Sidhom H, Braham C. High cycle fatigue behaviorprediction of shot-peened parts. Int J Fatigue 2004;26(10):1053–67.
[37] Yanhuai L, Jian L, Kewei X. Calculation of relaxation of residual stress andchange of yield strength in shot peened layer. Mater Sci Forum 2005;490–491:396–403.
[38] Shenoy MM, Kumar RS, McDowell DL. Modeling effects of nonmetallic inclusionson LCF in DS nickel-base superalloys. Int J Fatigue 2005;27(2):113–27.
[39] Melander A. Finite element study of short cracks with different inclusion typesunder rolling contact fatigue load. Int J Fatigue 1997;19(1):13–24.
[40] Gall K, Yang N, Horstemeyer M, McDowell DL, Jinghong F. The debonding andfracture of Si particles during the fatigue of a cast Al–Si alloy. Metall MaterTrans A (Phys Metall Mater Sci) 1999;30A(12):3079–88.
[41] Fan J, McDowell DL, Horstemeyer MF, Gall K. Cyclic plasticity at pores andinclusions in cast Al-Si alloys. Eng Fract Mech 2003;70(10):1281–302.
[42] Kuehmann CJ, Olson GB. Advanced gear steels by computer-aided design. AdvMater Process 1998;153:40–3.
[43] Fatemi A, Socie DF. A critical plane approach to multiaxial fatigue damageincluding out-of-phase loading. Fatigue Fracture Eng Mater Struct1988;11(3):149–65.
[44] ABAQUS (Ver 6.5).Hibbitt, Karlsson, and Sorensen Inc., Providence, RI; 2005.[45] ASTM E92-82 standard test method for Vickers hardness of metallic materials;
2003.
[46] Qian Y, Almer J, Lienert U, Tiemens BL, Olson GB. Nondestructive residualstress distribution measurements in nanostructured ultrahigh-strength gearsteels. In: 5th International conference on synchrotron radiation in materialsscience, Chicago; 2006.
[47] Donzella G, Pola A, Solazzi L, Marconi GP. Effect of shot peening on carburizedsurfaces. Int J Mater Prod Technol 2000;15(1-2):117–30.
[48] Pedersen R, Rice SL. ‘‘Case crushing” of carburized and hardened gears. NewYork (NY): Society of Automotive Engineers (SAE); 1960.
[49] Boller C, Seeger T. Materials data for cyclic loading, part b: low alloysteels. New York: Elsevier; 1987.
[50] ABAQUS/Standard User’s Manual (Ver. 6.5). Providence, (RI): HKS Inc., 2005.[51] Xiao H, Chen Q, Shao E, Wu D, Chen Z, Wang Z. The effect of shot peening on
rolling contact fatigue behaviour and its crack initiation and propagation incarburized steel. Wear 1991;151(1):77–86.
[52] Kobayashi M, Matsui T, Murakami Y. Mechanism of creation of compressiveresidual stress by shot peening. Int J Fatigue 1998;20(5):351–7.
[53] McDowell DL, Berard JY. A DJ based approach to biaxial fatigue. FatigueFracture Eng Mater Struct 1992;15(8):719–41.
[54] McDowell DL. Multiaxial Fatigue Strength. ASM Handbook; 1996;p.263–273.
[55] McDowell DL. Multiaxial small fatigue crack growth in metals. Int J Fatigue1997;19:127–35.
[56] Shenoy M, Zhang J, McDowell DL. Estimating fatigue sensitivity topolycrystalline Ni-base superalloy microstructures using a computationalapproach. Fatigue Fracture Eng Mater Struct 2007;30(10):889–904.
[57] Jiang Y, Hertel O, Vormwald M. An experimental evaluation of three criticalplane multiaxial fatigue criteria. Int J Fatigue 2007;29(8):1490–502.
[58] Kim KS, Park JC. Shear strain based multiaxial fatigue parameters applied tovariable amplitude loading. Int J Fatigue 1999;21(5):475–83.
[59] Findley KO, Saxena A. Low cycle fatigue in Rene 88DT at 650 C: cracknucleation mechanisms and modeling. Metall Mater Trans A (Phys MetallMater Sci) 2006;37A(5):1469–75.
[60] Chen X, Gao Q, Sun XF. Damage analysis of low-cycle fatigue under non-proportional loading. Int J Fatigue 1994;16(3):221–5.
[61] Kwon JD, Park JC. Multiaxial fatigue life prediction of duplex stainless steelswith thermal aging at 430 �C under axial-torsional load. Key Eng Mater2004;270-273:1183–8.
[62] Reis L, De Freitas M. Analytical and experimental studies on fatigue crack pathunder complex multi-axial loading. Fatigue Fracture Eng Mater Struct2006;29(4):281–9.
[63] McDowell DL. Simulation-based strategies for microstructure-sensitive fatiguemodeling. Mater Sci Eng A 2007;468-470:4–14.
[64] Gall K, Horstemeyer M, McDowell DL, Fan J. Finite element analysis of thestress distributions near damaged Si particle clusters in cast Al–Si alloys. MechMater 2000;32(5):277–301.
[65] Teodosio JR, Fonseca MC, Pedrosa PD. Relaxation of residual stresses duringfatigue cycles in steels. Mater Sci Forum 2003;426-432:3981–6.
[66] Zhuang WZ, Halford GR. Investigation of residual stress relaxation under cyclicload. Int J Fatigue 2001;23:S31–7.
[67] Almer JD, Cohen JB, Moran B. The effects of residual macrostresses andmicrostresses on fatigue crack initiation. Mater Sci Eng A 2000;284:268–79.
[68] Kobayashi M, Ohno N. Implementation of cyclic plasticity models based on ageneral form of kinematic hardening. Int J Numer Methods Eng2002;53(9):2217–38.
R. Prasannavenkatesan et al. / International Journal of Fatigue 31 (2009) 1176–1189 1189