author's personal copy - school of...
TRANSCRIPT

This article appeared in a journal published by Elsevier. The attachedcopy is furnished to the author for internal non-commercial researchand education use, including for instruction at the authors institution
and sharing with colleagues.
Other uses, including reproduction and distribution, or selling orlicensing copies, or posting to personal, institutional or third party
websites are prohibited.
In most cases authors are permitted to post their version of thearticle (e.g. in Word or Tex form) to their personal website orinstitutional repository. Authors requiring further information
regarding Elsevier’s archiving and manuscript policies areencouraged to visit:
http://www.elsevier.com/authorsrights

Author's personal copy
Automated finite element model updating of full-scale structures withPARameter Identification System (PARIS)
Masoud Sanayei a,⇑, Peeyush Rohela b,1
a Department of Civil and Environmental Engineering, Tufts University, Medford, MA 02155, USAb Alfred Benesch & Company, 50 Redfield Street, Suite 102, Boston, MA 02122, USA
a r t i c l e i n f o
Article history:Received 16 April 2013Received in revised form 18 August 2013Accepted 8 September 2013Available online 29 September 2013
Keywords:Finite element model updatingParameter estimationInverse problemsFull-scale structuresApplication Programming Interface (API)PARameter Identification System (PARIS)
a b s t r a c t
This paper presents a software framework, PARIS (PARameter Identification System), developed for auto-mated finite element model updating for structural health monitoring. With advances in Application Pro-gramming Interfaces (API) for modern computing, the traditional boundaries between differentstandalone software packages hardly exist. Now complex problems can be distributed between differentsoftware platforms with advanced and specialized capabilities. PARIS takes advantage of the advance-ments in the computing environment and interfacing capabilities provided by commercial software tosystematically distribute the structural parameter estimation problem into an iterative optimizationand finite element analysis problem across different computing platforms. Three validation examplesusing simulated nondestructive test data for updating full-scale structural models under typicallyencountered damage scenarios are included. The results of model updating process for realistic structuralmodels and their systematic treatment provide enhanced understanding of the aforementioned param-eter estimation process and an encouraging path towards its feasible field application for structuralhealth monitoring and structural condition assessment.
� 2013 Elsevier Ltd. All rights reserved.
1. Introduction
The American Society of Civil Engineers’ 2013 Infrastructure Re-port Card [1] rated America’s infrastructure at D+ and its existingbridges at C+ with an estimated total investment of 3.6 trillion dol-lars needed for infrastructure maintenance by 2020. The design lifeof these structures is determined based on the applicable designcodes. Through their service life, these structures may experienceimpacts of climate variation, seismic events, corrosive environ-ment, and other unexpected transient and long term loading, lead-ing to structural deterioration. Structural health monitoring (SHM)is increasingly gaining emphasis in response to the continuallydeteriorating state of our transport infrastructure. SHM has the po-tential to be used in conjunction with the current methods ofinspection to add a layer of confidence in objective decision mak-ing with regards to structural management and maintenance. Un-like limited visual inspections, it can provide a continuous streamof measured data to help benchmark structural condition and eval-uate long term trends and performance.
There is considerable volume of published research in the fieldof SHM based on a wide array of approaches to achieve the same
end goal. Researchers at the Los Alamos National Laboratory havepublished state-of-the-art reports of on damage identification [2],damage prognosis [3], and health monitoring [4] of structures.ASCE recently published a book with comprehensive set of casestudies of structural health monitoring (Editor: Catbas et al. [5]),This book reviewed contemporary Structural-Identification (St-Id)methods under research and organized them into distinct stepslike modeling, data processing, and parameter identification.
Techniques used for damage assessment are broadly classifiedas global and local. A review of global SHM and local non-destruc-tive evaluation methods and their shortcomings is provided byChang et al. [6] and Chang and Liu [7] respectively. Local SHMmethods like acoustics and electromechanical impedance basedSHM methods, often sophisticated and precise, require pre-identi-fication of damage and are most effective in localized regions ofdamage. Global methods, however, use global characteristics of astructure’s response to determine either the extent or location ofdamage or both in a structure. Mengelkamp and Fritzen [8] com-bined the local ultrasonic wave propagation method with the glo-bal stochastic subspace fault detection method (SSFDM) toinvestigate and detect artificially introduced cracks and delamina-tions in a stiffened aluminum plate and a GFRP plate.
SHM techniques are further categorized as model based andnon-model based. There are various methods for the non-modelbased approach. As an example, Farrar and Worden [9] discussedrecent research that identifies SHM problem primarily as a
0965-9978/$ - see front matter � 2013 Elsevier Ltd. All rights reserved.http://dx.doi.org/10.1016/j.advengsoft.2013.09.002
⇑ Corresponding author. Tel.: +1 (617) 627 4116; fax: +1 (617) 627 3994.E-mail addresses: [email protected] (M. Sanayei), [email protected]
com (P. Rohela).1 Former graduate student at Tufts University.
Advances in Engineering Software 67 (2014) 99–110
Contents lists available at ScienceDirect
Advances in Engineering Software
journal homepage: www.elsevier .com/locate /advengsoft
Author's personal copy
Statistical Pattern Recognition problem. Deraemaeker et al. [10]used output-only vibration measurements under variable environ-mental conditions for damage detection using a numerical exam-ple of a bridge. The feasibility of using self organization andlearning capabilities of neural networks for structural damageassessment has also been explored by researchers like Wu et al.[11].
A set of model based methods for SHM relies on observingchanges in the structure’s stiffness, mass, and damping parametersto correlate predicted and measured response. Parameter estima-tion is the process of updating the parameters of an a priori math-ematical model to correlate its predicted response with themeasured data at selected observation points for a given set ofexcitations. This is called the inverse problem and is unlike the for-ward analysis problem, which is to determine response of a struc-ture to a known excitation as a function of known physicalparameters of the model. An acceptable method for solving in-put–output inverse problems is by minimizing the residual be-tween the predicted response from a mathematical model andthe measured response of the actual system constituting the ob-served data set. The process thus involves starting with an a priorimathematical model based on certain assumptions of the initialvalues of the parameters. Key structural parameters of the modelare first considered to be unknown and then iteratively updatedfor minimizing the residual and updating the unknown parametersuntil their best fit values are achieved. The updated parameter esti-mates are reflective of actual state of the structure and can thus beused to assess the level of damage in the structure.
Catbas and Aktan [12] discussed several promising indices andexperimental constraints for condition and damage assessment.Focusing on bridges, they stated that a successful condition anddamage assessment can be achieved with the appropriate set ofexperiments and judicial use of indices in structural identificationframework. Kaouk and Zimmerman [13] adopted the MinimumRank Perturbation Theory (MRTP) index for locating damage anddetermining its extent from measured eigenvalues and eigenvec-tors. Using vibrational test data, Doebling et al. [14] presentedthe problem of determining local stiffness parameters as a well-determined linear least square problem based on the decomposi-tion of the flexibility matrix. Wang et al. [15] presented a structuraldamage identification algorithm for Damage Signature Matching(DMS) using change in static displacement response as a functionof perturbation in stiffness matrix and changes in natural fre-quency. In order to consolidate research efforts in SHM further,the IASC-ASCE Task Group created a series of benchmark problems.The first phase of this study was based on using only simulatedacceleration response data from the scaled physical model of a fourstory building frame. Caicedo et al. [16] used the Natural ExcitationTechnique (NExT) and Eigensystem Realization Algorithm (ERA) foridentification of modal parameters for damage assessment on theIASC-ASCE benchmark problem.
The reliance of comprehensive infrastructural inspection andmonitoring methods for objective condition evaluation on ad-vanced technologies demands modern computational tools capa-ble of analyzing larger structural systems more efficiently andaccurately. Some examples of SHM and parameter estimation soft-ware are DIAMOND and FEMtools. DIAMOND [17] from Los AlamosNational Laboratory is a software toolbox with several vibrationbased damage identification algorithms for vibration tests simula-tion, modal data analysis, finite element correlation, and compari-son of both linear and nonlinear damage identification techniques.Its successor, DIAMOND II [18] is a collection of algorithms fortreatment of SHM as a statistical pattern recognition problem.FEMtools [19], a commercial FE model updating software thatinterfaces with FEA packages like ABAQUS and NASTRAN is devel-oped by Dynamic Design Solutions. The development of a software
platform for full-scale finite element (FE) model based parameterestimation using non-destructive test (NDT) data is the subjectmatter of this paper, addressing important aspects of FE model cal-ibration for structural health monitoring and structural conditionsassessment.
PARameter Identification System (PARIS) is a MATLAB� basedprogram that integrates seamlessly with the commercially avail-able Finite Element Analysis (FEA) program, SAP2000�, to evaluatestructural health at elemental level by observing a structure’s glo-bal response in a NDT. A unique feature of this program is utiliza-tion of interactive functionality of existing commercial softwarepackages, SAP2000 and MATLAB. SAP2000 serves as the Finite Ele-ment Analysis (FEA) solver and with an integrated Graphical UserInterface (GUI) for 3D model creation and validation. MATLAB isa fourth generation programming environment with exhaustivefunction optimization options. The APIs from SAP2000 developersenables MATLAB to use SAP2000 as a slave program for FEA. Addi-tionally, visualization capabilities of the Graphical User Interface(GUI) of SAP2000 are used for FE model creation, verification, anal-ysis, and post processing. This combination facilitated develop-ment of a platform for automated FE model updating of full-scalestructures in the form of PARIS computer program. PARIS calibratesthe FE model iteratively and automatically by minimizing theresidual between the predicted response of the FE model and themeasured response from NDT data. PARIS, as a research freeware,is posted at the SHM research website of Civil and EnvironmentalEngineering Department at Tufts University at http://engineer-ing.tufts.edu/cee/shm/software.asp.
This research is based on the parameter estimation formula-tions developed by researchers at Tufts University for PARIS(PARameter Identification System). This work is also divided intotwo distinct phases. Phase-I is the computer program developmentwith capabilities for full-scale bridge FE model updating. The pro-gram itself uses Application Programming Interface (API) ofSAP2000 for two-way automatic data exchange between MATLABand SAP2000. Phase-II includes testing the program with simulatedNDT data to validate its functionality. Model updating using simu-lated NDT data for FE models of full-scale structures falls underPhase-II.
2. PARIS (PARameter Identification System)
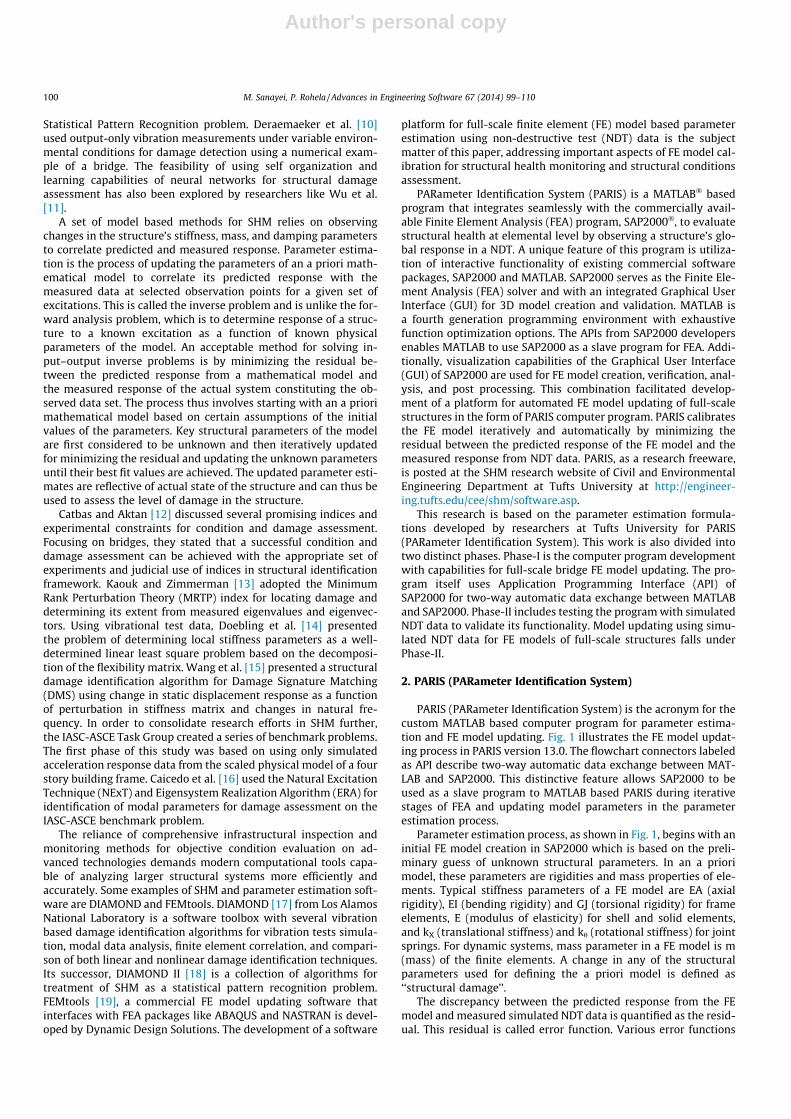
PARIS (PARameter Identification System) is the acronym for thecustom MATLAB based computer program for parameter estima-tion and FE model updating. Fig. 1 illustrates the FE model updat-ing process in PARIS version 13.0. The flowchart connectors labeledas API describe two-way automatic data exchange between MAT-LAB and SAP2000. This distinctive feature allows SAP2000 to beused as a slave program to MATLAB based PARIS during iterativestages of FEA and updating model parameters in the parameterestimation process.
Parameter estimation process, as shown in Fig. 1, begins with aninitial FE model creation in SAP2000 which is based on the preli-minary guess of unknown structural parameters. In an a priorimodel, these parameters are rigidities and mass properties of ele-ments. Typical stiffness parameters of a FE model are EA (axialrigidity), EI (bending rigidity) and GJ (torsional rigidity) for frameelements, E (modulus of elasticity) for shell and solid elements,and kX (translational stiffness) and kh (rotational stiffness) for jointsprings. For dynamic systems, mass parameter in a FE model is m(mass) of the finite elements. A change in any of the structuralparameters used for defining the a priori model is defined as‘‘structural damage’’.
The discrepancy between the predicted response from the FEmodel and measured simulated NDT data is quantified as the resid-ual. This residual is called error function. Various error functions
100 M. Sanayei, P. Rohela / Advances in Engineering Software 67 (2014) 99–110
Author's personal copy
are stacked for multi-response FE model updating. A scalar objec-tive function is formed using the error functions and is optimizedin MATLAB. Unknown parameter values are updated iterativelysuch that the updated model in one cycle becomes the initial mod-el for the next. In each iteration of the optimization process forparameter estimation, the SAP2000 model is invoked by MATLABfor calculating the FE responses. The iterations continue until allpre-defined convergence criteria are met. Successful convergenceindicates that the physical model closely assimilates the real struc-ture’s behavior. The following paragraphs describe various mathe-matical concepts and formulations used in PARIS in the sequencein which they are encountered in the FE model updating process.
2.1. Finite element model creation and analysis options
The model updating capabilities of PARIS include models com-prised of frame, quadrilateral shell, and cuboid solid elementsusing static and/or modal data. Its usefulness lies in availabilityof advanced FE types for modeling. While solid elements may bebetter suited for modeling problems without geometrical oversim-plification, shell elements, on other hand, provide greater conve-nience in modeling in addition to reduced analysis time. Themodel updating options have also been extended to update jointspring and 2-node link element stiffness in the FE model. Any com-bination of active DOFs for analysis can also be selected by theuser.
2.2. Error functions
Error functions are a measure of residual between the predictedresponse from the FE model and experimental data. They are for-mulated in terms of unknown parameters of the a priori FE modeland they serve to estimate its unknown parameters. Generally, anerror function is expressed as the difference between analyticaland measured physical quantities as (1),
eðpÞ ¼ qpredicted � qmeasured ð1Þ
where ‘q’ denotes a response quantity which can either be strain ortranslation and rotation under a set of known static loads or modalexcitation. Static and modal error functions are further subdividedas stiffness and flexibility based error functions. In essence, the stiff-ness based error functions measure the residual between appliedforces and the flexibility based error functions quantify residual be-tween measured displacements. Static strain error function can alsobe categorized under flexibility based error function as strains arerelated directly to displacements.
2.3. Static stiffness (SS)
Sanayei and Onipede [20] developed the static stiffness errorfunction. They showed that the predicted displacement responsefrom applied static test loads at one subset of degrees of freedom(DOF) and measured displacement response at another subset ofDOF could be used to detect damage in the structures at the ele-ment level. Based on the partitioning of the force–displacementrelationship as per measured and unmeasured displacements gi-ven by Eq. (2), the static stiffness error function is written as Eq.(3),
fa
fb
� �¼
Kaa Kab
Kba Kbb
� �ua
ub
� �ð2Þ
eSSðpÞ ¼ ðKaa � KabK�1bb KbaÞua þ KabK�1
bb fb � fa ð3Þ
where vectors ua and ub are vectors of measured and unmeasureddisplacements. Submatrices Kaa, Kab, Kba, and Kbb represent the par-titioned terms of the stiffness matrix and fa and fb represent the par-titioned applied load force vector depending on measured andunmeasured displacements at ‘a’ and ‘b’ subsets of degrees offreedom.
Fig. 1. PARIS flowchart.
M. Sanayei, P. Rohela / Advances in Engineering Software 67 (2014) 99–110 101

Author's personal copy
2.4. Static flexibility (SF)
Sanayei et al. [21] developed the static flexibility error function.
eSFðpÞ ¼ ðKaa � KabK�1bb KbaÞ
�1ðfa � KabK�1bb fbÞ � ua ð4Þ
It is based on the inverse force–displacement relationship and itcompares predicted and measured displacements at a subset ofDOFs using Eq. (4).
2.5. Static strain (SSTR)
Sanayei and Saletnik [22] developed the static strain error func-tion. It is defined as the difference between predicted and mea-sured strains at selected observation points as,
eSSTRðpÞ ¼ BaK�1fa � ea ð5Þ
where Ba is the mapping matrix from the relation e = Ba q and isused to calculate strains from displacements for frame elements.However, for shell elements in PARIS, a more direct approachhas been adopted to calculate strains from FE model stresses usingHooke’s Law. SAP2000 calculates stresses at the four integrationpoints for shell elements and extrapolates them to the cornernodes for output. Internally in PARIS, strain calculated at a partic-ular node is averaged based on shell elements surrounding thatnode.
2.6. Modal stiffness (MS)
Sanayei et al. [23] developed the modal stiffness error function.The eigenvalue problem shown in Eq. (6) forms the basis of modalstiffness error function.
K/i ¼ kM/i ð6Þ
In Eq. (6), K and M are the stiffness and the mass matrices,respectively. Vector /i represents the ith natural mode shape andki is the square of the ith natural frequency.
eMSðpÞi ¼ ½ðKaa � kiMaaÞ � ðKab � kiMabÞðKbb � kiMbbÞ�1
ðKba � kiMbaÞ�/ai ð7Þ
After partitioning Eq. (6) similar to Eq. (2) and condensing outunmeasured mode shapes, the modal stiffness error function is gi-ven by Eq. (7) as a residual of modal forces. Vector /ai is defined asthe measured modal displacements at subset ‘a’ of DOFs at ithiteration.
2.7. Modal flexibility (MF)
Sanayei et al. [24] developed modal flexibility based error func-tion by condensing the characteristic equation written in terms ofthe flexibility matrix. Hjelmstad [25] also arrived at a similar mod-al flexibility based error function formulation by only partitioningthe mass matrix at measured and unmeasured DOF without usingcondensation. Similar to static flexibility, the modal flexibility errorfunction includes the inverse of stiffness matrix, K, in its formula-tion. Modal flexibility error function, as formulated by Sanayeiet al. [24], is shown in Eq. (8).
eMFðpÞi ¼ ½k2i DabðI � kiDbbÞ�1Dba þ kiDaa � I�/ai ð8Þ
The matrix D in Eq. (8) is the dynamic matrix given by the rela-tionship D = K�1M.
2.8. Scalar objective function
The quadratic scalar objective function J(p) defined in Eq. (9) isused to judge convergence or divergence of the iterative modelupdating process.
JðpÞ ¼ eðpÞT eðpÞ ð9Þ
A declining value of J(p) over successive iterations denotesconvergence.
2.9. Normalization
The difference in the order of magnitudes of various types ofparameters, measured quantities, and error functions used, canpotentially give rise to numerical difficulties by making the inverseproblem ill-conditioned. Two types of normalization methods areavailable in PARIS: parameter normalization and error functionnormalization.
Parameters that define structural element properties are nor-malized with respect to their initial values to give them the sameweight in parameter estimation. Normalizing parameter values to1.0 by dividing them by initial estimated values is called parameternormalization. An estimated value of 0 indicates complete damage.Additionally, a statistical method for adjusting to measurement er-rors is to normalize an error function based on the observability ofeach measurement. Sanayei and DiCarlo [26] implemented thisnormalization scheme for all three static error functions in PARISand demonstrated a higher confidence level in estimated parame-ters especially in presence of measurement errors.
JðpÞ ¼ eðpÞTR�1e eðpÞ ð10Þ
Using Eq. (10), in whichP
e is the covariance matrix of mea-sured response data, the static error functions in PARIS are bothweighted and normalized depending on the level of measurementerror. The results of this process approximate that of a maximumlikelihood estimator.
2.10. Objective function minimization
Minimizing J(p) using hill climbing method is based on the ana-lytical derivatives of the error functions defined in Eqs. (3), (4), (5),(7), and (8). The analytical sensitivities are presented in Refs. [20–24]. The general from of the sensitivities is defined based on thefirst derivatives of the error function as shown in Eq. (11),
SðpÞ ¼ @feðpÞg@p
� �ð11Þ
The minimization process results in newer estimate of un-known parameters (p + Dp) which take the place of initial esti-mates (p) for the next iteration. PARIS provides the option ofminimizing J(p) by using analytical sensitivities formulated in Refs.[20–24]. The change in parameter values, Dp is obtained from theiterative solution of algebraically nonlinear system of Eq. (12)using the Gauss–Newton method.
SðpÞDp ¼ �eðpÞ ð12Þ
where S(p) is the analytical sensitivity matrix obtained by takingthe derivative of the error function vector e(p) with respect to theunknown parameters. The sensitivity matrix S(p) is of sizeNM � NUP, where NM is defined as the total number of measure-ments and NUP is the number of unknown parameters in the prob-lem. The change in parameter values, Dp, in the ith iteration, isobtained from solving the over determined system of equations in(12) leading to (13),
piþ1 ¼ pi þ Dpi ð13Þ
102 M. Sanayei, P. Rohela / Advances in Engineering Software 67 (2014) 99–110

Author's personal copy
An alternative to using analytical sensitivity matrices is usingnumerical sensitivity matrices by utilizing the MATLAB Optimiza-tion Toolbox. It is successfully implemented by using the algorithmfor constrained minimization of the algebraically non-linear multi-variable error function, fmincon, available in MATLAB. It uses inte-rior point algorithm which is suited for large and sparse problemsas well as for small and dense problems (MATLAB Documentation).It satisfies upper and lower bound on parameters at all stages andcan recover from undefined and infinite values if encountered inthe optimization process. This algorithm requires the target func-tion to be defined in terms of unknown parameters that returnsa scalar value, which in PARIS is the scalar objective function J(p).
2.11. Convergence criteria
Convergence criteria are required for terminating the optimiza-tion routine. The dissimilarity between the updated unknownparameter values and true values is reconciled within reasonablelimits at this level. Convergence criteria used in PARIS are givenby Eqs. (14) and (15).piþ1 � pi
p16 relativeDp tolerance ð14Þ
JðpÞiþ1 � JðpÞiJðpÞ1
6 relativeDJðpÞtolerance ð15Þ
Relative Dp tolerance for convergence is the change in the valueof unknown parameter value with respect to its initial value be-tween two successive iterations. Similarly, relative DJ(p) toleranceis the change in the objective function value with respect to its ini-tial value.
2.12. Parameter grouping
In analytical sensitivity matrix based objective function mini-mization, the sensitivity matrix S(p) is post-multiplied by a bool-ean group transformation matrix, GT, to map the elements of thesensitivity matrix according to the unknown parameter groups de-fined by the user. This step reduces the size of S(p) from NM � NUPto NM � NPG, where NPG is the number of parameter groups. Inthe case of constrained function minimization using MATLAB Opti-mization Toolbox, fmincon, the objective function J(p) takes the in-put argument as a smaller vector of grouped unknown parameterspG of size NPG � 1 rather than the original vector of unknownparameters p of size NUP � 1. The number of unknown indepen-dent variables in the resulting multivariable optimization problemin both cases is thus significantly reduced in comparison to the ori-ginal problem without grouping.
2.13. Multi-response parameter estimation
Multi-response parameter estimation refers to the use of differ-ent sets of measurements for different load cases and subset of mea-surements as well as using different types of static and modal datawith their corresponding error functions [27]. In PARIS, stacking isimplemented by default using Eqs. (16) and (17) whenever a combi-nation of different load cases and/or different error functions is used.
eðpÞ ¼ f eðpÞT1 eðpÞT2 ::: eðpÞTn gT ð16Þ
½SðpÞ� ¼ ½ SðpÞT1 SðpÞT2 ::: SðpÞTn �T ð17Þ
Observing different types of responses simultaneously to esti-mate a set of unknown parameters is an effective approach as it in-creases the amount of information used in the parameterestimation process by simultaneously using esf, esstr, emf or ess, ems
error functions in groups.
2.14. Measurement errors
The parameter estimation process is sensitive to the accuracy ofmeasurements collected during a NDT. The sensors and instru-ments can either be erroneous due to defects in the manufacturingprocess or become faulty in their handling and installation. Nor-mally, a bound on accuracy of a measuring device is stated bythe manufacturer. This bound on the level of errors, however, canbe exceeded due to difficulties in sensor installation and connec-tion losses [28]. Although there is no way to accurately model ac-tual measurement errors, the options to introduce uniformly ornormally distributed errors in simulated data are available in PARISto study the influence of measurement errors on estimated param-eters. While uniform error distribution resembles a banded type oferror with equal probabilities of occurrence throughout, the nor-mal error distribution is a non-banded type of error with its prob-abilities of occurrence being higher closer to true values [29]. Eqs.(18) and (19) are used for contaminating simulated NDT data withproportional and absolute errors, respectively.
qm ¼ q 1þ 12
eq � Rq
� �ð18Þ
qm ¼ qþ 12
eq � Rq ð19Þ
In the equations above, q is the vector of measured forces orsimulated response. eq represents the percentage level of measure-ment error in Eq. (18) whereas in Eq. (19) it represents absolute er-ror with units as defined by the user. The vector Rq is fullypopulated either with uniformly distributed random numbers be-tween 0 and 1 or normally distributed random numbers with 0mean and standard deviation of 0.5. The symbol � denotes ele-ment-wise vector multiplication.
3. Verification examples
The IASC-ASCE SHM Benchmark Structure is the leading con-temporary example of a framed building structure. Currently inits second phase (Dyke et al. [30]), it provides a platform forresearchers to test their hypotheses on damage identification andassessment for structural health monitoring. The FHWA’s bridgeinspection program has inspired the SHM community to developand test novel tools and techniques for bridge monitoring andmaintenance. Cardini and DeWolf [31] present, in one example,the use of strain data from a multi-girder composite steel bridgefor long-term SHM. Farrar and Jauregui [32] performed compara-tive analysis of various damage based assessment method usingmodal data from a damaged and an undamaged bridge.
Three full-scale FE model updating examples using simulatedNDT data are presented to illustrate the range of capabilities ofthe PARIS program using Application Programing Interfaces (API)for automated and systematic parameter estimation. These exam-ples are the IASC-ASCE scale model benchmark building comprisedof frame and shell elements, girder-3 of the Powder Mill Bridgemade with solid (concrete deck) and shell (steel girder) elements,and the complete model of Powder Mill Bridge using shell ele-ments (concrete deck) and frame (steel girder) elements. The com-bination of program features covered in each example is shown inTable 1. This section contains the description of the structures,model updating problem formulation, and parameter estimatesfor all three examples.
The first column in Table 1 presents various features of PARISwhich are further expanded in column two. Verification examplesusing these features of the program are shown in columns three tofive for the FE model of the IASC-ASCE SHM Benchmark Structure,
M. Sanayei, P. Rohela / Advances in Engineering Software 67 (2014) 99–110 103

Author's personal copy
the Powder Mill Bridge (PMB) Girder-3 model, and the full-scalePMB model, respectively.
3.1. IASC-ASCE SHM Benchmark Structure
An analytical model based on the Phase-I study of the IASC-ASCE SHM Benchmark Problem was updated using PARIS as thefirst verification example. The global geometry and member prop-erties as well as damage scenarios 1 and 2 to simulate damage aretaken from Black and Ventura [33] and Johnson et al. [34]. The FEmodel used in this research is slightly different than the actualanalytical model. Originally, two finite element models weredeveloped by IASC-ASCE SHM Task Group. The first model was a12 DOFs shear-building model in which only two horizontal trans-lations and one rotation was permitted for each floor. The secondmodel had 120 DOFs which constrained all nodes at each floor onlyfor the same horizontal translations and in-plane rotations [34].The structural model used here has 1944 DOFs because of greaterdiscretization of shell elements at the floor levels and also from thefact that all rotational and translational DOFs are made active inanalysis.
3.2. Structure and model description
Fig. 2 shows the FE model of the experimental steel framehoused in the Earthquake Engineering Research Laboratory at theUniversity of British Columbia. It is a 4-story, 3.6 m high structurewith two bays in orthogonal lateral directions with each bay mea-suring 1.25 m. The sections are made out of hot rolled grade 300 Wsteel with 300 MPa nominal yield stress. Steel sections that consti-tute the structure are B100 � 9 (columns), S75 � 11 (beams), andL25 � 25 � 3 (braces). The floor slab at each story is comprised of4 square slab panels. Mass of each panel is 800 kg at the first floorand 600 kg at the second and the third floor. The fourth floor has 3panels of 400 kg mass and 1 panel that has a mass of 550 kg. Eachof the 4 slab panels measuring 1.25 m � 1.25 m is modeled using16 thin-shell elements. The columns are oriented with their weakaxis (y) along the global X axis in the SAP2000 model. All beamsconnect rigidly to the columns while the braces are pin connectedand thus behave as axial members. All columns are fixed at thebase.
3.3. Damage scenarios
PARIS was used to estimate the unknown stiffness and/or massparameters for four simulated damage scenarios as summarized inTable 2. In first damage case, the first floor braces with 8 unknownEA parameters were grouped into 4 different unknown parametergroups. Error functions SS, SF, and SSTR were run individually. Inthe second damage case, 3 EIzz and 3 EIyy parameters of the basecolumns at Grid-A were paired as two groups. Error functions SS,SF, and SSTR were run again individually. In the third damage casein which mass of one slab panel is the unknown parameter, modalerror functions were used one at a time to estimate the reducedmass of 16 shell elements making up that panel as one group. Inthe fourth damage case, both stiffness and mass parameters wereestimated using SS and MS error functions simultaneously. Theeight braces on one side of the frame (at Grid A) of the model werepaired into 4 unknown stiffness parameter groups based on theirstory level. The four mass parameter groups comprised of four floorslab panels at each of the 4 story levels.
3.4. Load cases and measurement locations
Diagnostic static test loads were applied under four load cases.Table 3 shows the location and magnitude of loads for all four loadcases. The prefix ‘S’ refers to a story. Reference is made to grid linesfrom Fig. 2.
Displacement and strain measurement locations for static loadcases used with damage cases 1, 2, and 4 are listed in Table 4and Table 5.
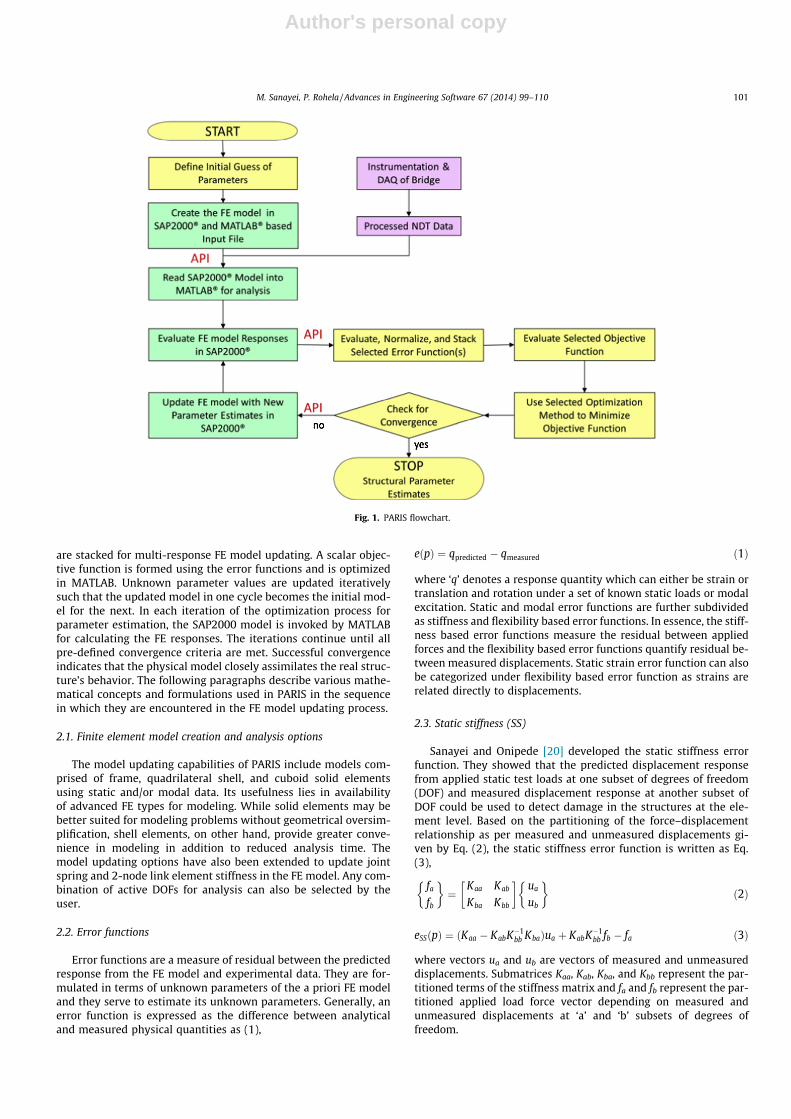
For estimating the unknown mass parameters for damage cases3 and 4, mode shapes 1 to 3 were utilized. Mode 1 and 2 are
Table 1PARIS verification examples.
Feature Type/description IASC-ASCEScalemodel
Girder-3 PMBmodel
Full-ScalePMBmodel
Finite elements Frame U U
Shell U U U
Solid U
Spring U U
Error functions Damage cases ? 1 2 3 4 1 2 1 2SS U U U U
SF U U U
SSTR U U U U U U
MS U U
MF U
Normalization Maximumlikelihood
U
Measurementerrors
Errors in appliedforces
U
Errors inmeasurements
U
Parametergrouping
U U U U U U U U
Stacking U U
Fig. 2. IASC-ASCE SHM Benchmark Structure.
Table 2Damage case summary for benchmark structure.
Damagecase
Damage case description Errorfunction
1 100% axial rigidity (EA) loss in all 8 braces at first story SS, SF,SSTR
2 30% bending rigidity (EIzz and EIyy) in columns at GridA at first story level
SS, SF,SSTR
3 Reduction in mass of the 550 kg slab panel at fourthstory to 400 kg
MS, MF
4 40% Reduction in mass of all floor slabs and 100% EAloss in 8 braces on one side of the frame at Grid A
SS + MS
104 M. Sanayei, P. Rohela / Advances in Engineering Software 67 (2014) 99–110
Author's personal copy
bending modes in the global Y and the X directions, respectively.Mode 3 is the torsional mode about Z axis. Mode shapes 1 through3 and their associated natural frequencies for un-damped vibra-tions are shown in Fig. 3.
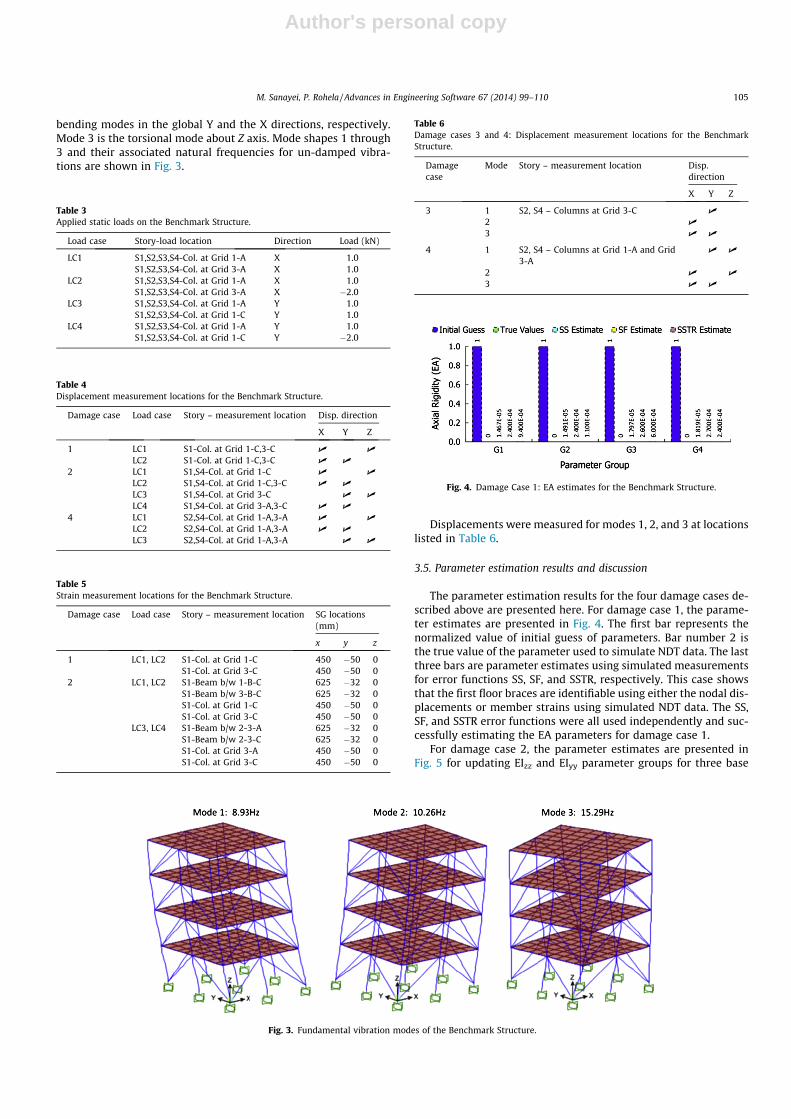
Displacements were measured for modes 1, 2, and 3 at locationslisted in Table 6.
3.5. Parameter estimation results and discussion
The parameter estimation results for the four damage cases de-scribed above are presented here. For damage case 1, the parame-ter estimates are presented in Fig. 4. The first bar represents thenormalized value of initial guess of parameters. Bar number 2 isthe true value of the parameter used to simulate NDT data. The lastthree bars are parameter estimates using simulated measurementsfor error functions SS, SF, and SSTR, respectively. This case showsthat the first floor braces are identifiable using either the nodal dis-placements or member strains using simulated NDT data. The SS,SF, and SSTR error functions were all used independently and suc-cessfully estimating the EA parameters for damage case 1.
For damage case 2, the parameter estimates are presented inFig. 5 for updating EIzz and EIyy parameter groups for three base
Table 3Applied static loads on the Benchmark Structure.
Load case Story-load location Direction Load (kN)
LC1 S1,S2,S3,S4-Col. at Grid 1-A X 1.0S1,S2,S3,S4-Col. at Grid 3-A X 1.0
LC2 S1,S2,S3,S4-Col. at Grid 1-A X 1.0S1,S2,S3,S4-Col. at Grid 3-A X �2.0
LC3 S1,S2,S3,S4-Col. at Grid 1-A Y 1.0S1,S2,S3,S4-Col. at Grid 1-C Y 1.0
LC4 S1,S2,S3,S4-Col. at Grid 1-A Y 1.0S1,S2,S3,S4-Col. at Grid 1-C Y �2.0
Table 4Displacement measurement locations for the Benchmark Structure.
Damage case Load case Story – measurement location Disp. direction
X Y Z
1 LC1 S1-Col. at Grid 1-C,3-C U U
LC2 S1-Col. at Grid 1-C,3-C U U
2 LC1 S1,S4-Col. at Grid 1-C U U
LC2 S1,S4-Col. at Grid 1-C,3-C U U
LC3 S1,S4-Col. at Grid 3-C U U
LC4 S1,S4-Col. at Grid 3-A,3-C U U
4 LC1 S2,S4-Col. at Grid 1-A,3-A U U
LC2 S2,S4-Col. at Grid 1-A,3-A U U
LC3 S2,S4-Col. at Grid 1-A,3-A U U
Table 5Strain measurement locations for the Benchmark Structure.
Damage case Load case Story – measurement location SG locations(mm)
x y z
1 LC1, LC2 S1-Col. at Grid 1-C 450 �50 0S1-Col. at Grid 3-C 450 �50 0
2 LC1, LC2 S1-Beam b/w 1-B-C 625 �32 0S1-Beam b/w 3-B-C 625 �32 0S1-Col. at Grid 1-C 450 �50 0S1-Col. at Grid 3-C 450 �50 0
LC3, LC4 S1-Beam b/w 2-3-A 625 �32 0S1-Beam b/w 2-3-C 625 �32 0S1-Col. at Grid 3-A 450 �50 0S1-Col. at Grid 3-C 450 �50 0
Fig. 3. Fundamental vibration modes of the Benchmark Structure.
Table 6Damage cases 3 and 4: Displacement measurement locations for the BenchmarkStructure.
Damagecase
Mode Story – measurement location Disp.direction
X Y Z
3 1 S2, S4 – Columns at Grid 3-C U
2 U
3 U U
4 1 S2, S4 – Columns at Grid 1-A and Grid3-A
U U
2 U U
3 U U
Fig. 4. Damage Case 1: EA estimates for the Benchmark Structure.
M. Sanayei, P. Rohela / Advances in Engineering Software 67 (2014) 99–110 105

Author's personal copy
columns. All three static error functions estimated the groupedbending rigidities along the major and minor axes of the columns.The convergence criterion for relative DJ(p) tolerance was main-tained at 10E�10 while that for relative Dp tolerance was10E�06 for all damage cases. This case shows that column mo-ments of inertia are identifiable using any of SS, SF, and SSTR errorfunctions when the NDT loads were applied to the structure tocause bending of the columns with unknown EI parameters andmeasurements were taken to observe these parameters. The accu-racy of the parameter estimates relates to good observability of theunknown parameters by the the measurements at the selectednodes or members.
For damage case 3, the mass parameter of one roof slab panelwas updated from an initial guess of 550 kg to a final value of400 kg using modal stiffness and modal flexibility error function.Modal stiffness error function converged faster in 7 iterations thanthe modal flexibility error function that took 13 iterations. Thisdamage case shows that mass parameter is also identifiable usingmodal error function MS and MF independently. Changes in massalter the modal frequencies of the structure. PARIS detected thechange and updated the mass parameter appropriately to mini-mize the residual.
For damage case 4, the combined stiffness and mass parameterupdating capability of PARIS and the resulting parameter estimatesare shown in Fig. 6. The parameter groups G1 through G4 are theunknown EA parameters for braces. Groups G5 through G8 repre-sent unknown floor mass parameters with an estimated valueequal to true value of 0.6. In this case, advantage of using a smallernumber of unknown parameters was achieved by grouping thesimilar parameters together. the mass matrix and the stiffness ma-trix were updated iteratively in PARIS until the objective functionvalue was reduced to a level below the convergence limit. At thisstage, the predicted response measured well with the measured re-sponse from the simulated NDT data.
3.6. Parameter estimation in presence of measurement errors
Table 7 compares the EA parameter estimates and number ofiterations required for FE model updating for damage case 1 shownin Fig. 4 in presence of 2% normally distributed proportional mea-surement errors in forces and displacements. Damage case 1 sim-ulated a 100% axial rigidity loss in all 8 braces at the first storyas shown in Table 2. The parameter estimates using SF and SSTRare shown, first separately and then stacked together.
The merit of multi-response parameter estimation is seen inreduction of the number of iterations required when SF and SSTRerror functions are stacked.
Fig. 7a and 7b represent the parameter estimates for damagecase 2 using static error functions in presence of 2% normally dis-tributed proportional measurement error in forces and displace-ments. In this damage case, bending rigidity loss of 30% incolumns at Grid A at the first story level was present. Fig. 7a showshigh scatter in the parameter estimates in presence of measure-
ment errors. However, the EIzz and EIyy parameter estimates usingstatistical error function normalization were closer to the trueparameter values in presence of measurement errors. The resultsin Fig. 7b demonstrate the robustness of the statistical normaliza-tion method proposed by Sanayei and DiCarlo [26]. The authorsrecommend the use of the statistical normalization method forparameter estimation.
After successful completion of the IASC-ASCE SHM BenchmarkStructure using four damage cases with and without measurementerrors, a full scale bridge is studied first using shell and solidelements for modeling one composite girder and then the fullbridge is modeled using shell and frame elements. Several damagecases using various error functions is used for parameters estima-tion and FE model updating.
Fig. 5. Damage Case 2: EIzz and EIyy estimates for the Benchmark Structure.Fig. 6. Damage Case 4: EA and mass estimates for the Benchmark Structure.
Fig. 7a. Damage Case 2: Noisy parameter estimates w/o normalization.
Fig. 7b. Damage Case 2: Noisy parameter estimates with normalization.
Table 7Damage case 1 with stacked error functions.
EA estimates Error function(s)
SF SSTR SF + SSTR
G1 1.36E�03 2.40E�04 9.80E�04G2 1.80E�04 4.21E�05 1.37E�03G3 2.60E�04 1.90E�04 3.60E�04G4 4.70E�04 8.55E�03 4.10E�04Iterations 29 26 24
106 M. Sanayei, P. Rohela / Advances in Engineering Software 67 (2014) 99–110
Author's personal copy
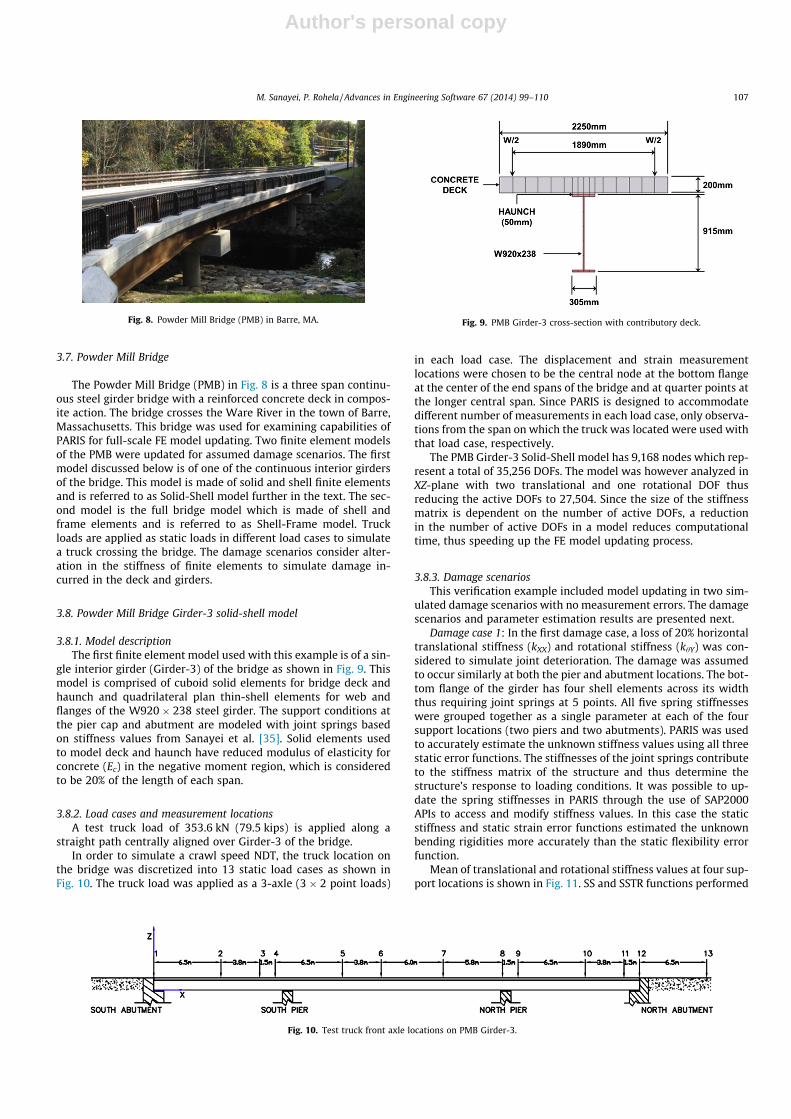
3.7. Powder Mill Bridge
The Powder Mill Bridge (PMB) in Fig. 8 is a three span continu-ous steel girder bridge with a reinforced concrete deck in compos-ite action. The bridge crosses the Ware River in the town of Barre,Massachusetts. This bridge was used for examining capabilities ofPARIS for full-scale FE model updating. Two finite element modelsof the PMB were updated for assumed damage scenarios. The firstmodel discussed below is of one of the continuous interior girdersof the bridge. This model is made of solid and shell finite elementsand is referred to as Solid-Shell model further in the text. The sec-ond model is the full bridge model which is made of shell andframe elements and is referred to as Shell-Frame model. Truckloads are applied as static loads in different load cases to simulatea truck crossing the bridge. The damage scenarios consider alter-ation in the stiffness of finite elements to simulate damage in-curred in the deck and girders.
3.8. Powder Mill Bridge Girder-3 solid-shell model
3.8.1. Model descriptionThe first finite element model used with this example is of a sin-
gle interior girder (Girder-3) of the bridge as shown in Fig. 9. Thismodel is comprised of cuboid solid elements for bridge deck andhaunch and quadrilateral plan thin-shell elements for web andflanges of the W920 � 238 steel girder. The support conditions atthe pier cap and abutment are modeled with joint springs basedon stiffness values from Sanayei et al. [35]. Solid elements usedto model deck and haunch have reduced modulus of elasticity forconcrete (Ec) in the negative moment region, which is consideredto be 20% of the length of each span.
3.8.2. Load cases and measurement locationsA test truck load of 353.6 kN (79.5 kips) is applied along a
straight path centrally aligned over Girder-3 of the bridge.In order to simulate a crawl speed NDT, the truck location on
the bridge was discretized into 13 static load cases as shown inFig. 10. The truck load was applied as a 3-axle (3 � 2 point loads)
in each load case. The displacement and strain measurementlocations were chosen to be the central node at the bottom flangeat the center of the end spans of the bridge and at quarter points atthe longer central span. Since PARIS is designed to accommodatedifferent number of measurements in each load case, only observa-tions from the span on which the truck was located were used withthat load case, respectively.
The PMB Girder-3 Solid-Shell model has 9,168 nodes which rep-resent a total of 35,256 DOFs. The model was however analyzed inXZ-plane with two translational and one rotational DOF thusreducing the active DOFs to 27,504. Since the size of the stiffnessmatrix is dependent on the number of active DOFs, a reductionin the number of active DOFs in a model reduces computationaltime, thus speeding up the FE model updating process.
3.8.3. Damage scenariosThis verification example included model updating in two sim-
ulated damage scenarios with no measurement errors. The damagescenarios and parameter estimation results are presented next.
Damage case 1: In the first damage case, a loss of 20% horizontaltranslational stiffness (kXX) and rotational stiffness (khY) was con-sidered to simulate joint deterioration. The damage was assumedto occur similarly at both the pier and abutment locations. The bot-tom flange of the girder has four shell elements across its widththus requiring joint springs at 5 points. All five spring stiffnesseswere grouped together as a single parameter at each of the foursupport locations (two piers and two abutments). PARIS was usedto accurately estimate the unknown stiffness values using all threestatic error functions. The stiffnesses of the joint springs contributeto the stiffness matrix of the structure and thus determine thestructure’s response to loading conditions. It was possible to up-date the spring stiffnesses in PARIS through the use of SAP2000APIs to access and modify stiffness values. In this case the staticstiffness and static strain error functions estimated the unknownbending rigidities more accurately than the static flexibility errorfunction.
Mean of translational and rotational stiffness values at four sup-port locations is shown in Fig. 11. SS and SSTR functions performed
Fig. 10. Test truck front axle locations on PMB Girder-3.
Fig. 8. Powder Mill Bridge (PMB) in Barre, MA. Fig. 9. PMB Girder-3 cross-section with contributory deck.
M. Sanayei, P. Rohela / Advances in Engineering Software 67 (2014) 99–110 107

Author's personal copy
better in terms of accuracy of the parameter estimates. The num-ber of iterations required for model updating for damage case 1were 27 for the SS error function, 96 for SF error function, and 37for the SSTR error function.
Damage case 2: A loss of 20% of the girder’s stiffness was as-sumed to occur at the entire south span of 11.75 m length as a glo-bal deterioration case. Since girder is comprised of shell elements,the damage in finite element model would then be reflected inreduction of modulus of elasticity (Es) of steel. The 624 shell ele-ments making up the south span of the girder in the FE model weregrouped into 8 groups with 78 elements in each group. The ele-ments were grouped along the length of the girder with equalnumber of elements in each group. Static strain error functionwas used to estimate 20% reduction in Es. The PMB Girder-3 Modelwas updated using only SSTR error function for damage case 2. Themean of estimated parameters values of Es for shell elements was0.8035 from the expected value of 0.8 and had a 0.0148 standarddeviation. Unlike translational displacement measurements, strainmeasurements are reference-independent making them a pre-ferred measurable response quantity. Strain gauges are also alow cost option when compared to both contact and non-contactdevices required for measuring displacements.
One particular aspect that deserves attention is the ability todiscretize the FE model to a satisfactory level that leads to a largenumber of elements in the model. Normally it is not feasible toidentify all elements in a finite element with a fine mesh using acoarse set of measurements points. Grouping of similar unknownparameters allow solving of the inverse problem. At the same timewhen a localized damaged region is observed, it is possible to un-group the parameters of those areas to zoom in damage severity atsmaller locations.
3.9. Powder Mill Bridge shell-frame model
3.9.1. Structure and model descriptionA full-scale FE model of the PMB comprised of frame and shell
elements was updated for two damage scenarios. Frame elementswere used to model the six main girders of the bridge as well as thediaphragms and outriggers at the north end of the bridge. Offsetwas applied to frame elements for modeling supports at the bot-tom flange of the girder. The shell elements constituted the con-crete bridge deck. The shell elements were offset upwards byhalf the shell thickness to model the deck resting on top flangeof the girders. The PMB Shell-Frame model is shown in plan inFig. 12 with gridlines 1 through 6 representing girder numbersand S1 through S4 representing abutment (S1 and S4) and piersupport (S2 and S3) locations. Darker longitudinal lines indicategirders and darker transverse lines indicate diaphragms.
The static load cases were applied in a fashion similar to that forthe solid-shell girder model with the addition of four test truckpaths across the width of the bridge. Eight sets of truck loads weremodeled in each of the five test truck paths on the bridge.
3.9.2. Damage scenariosDamage case 1: A damage case that considers a theoretical 20%
reduction in bending capacity of girders 4 and 5 was consideredfirst. The entire length of these two girders was assumed to havea reduced EI33 value. Since each of the two girders in the modelis comprised of 36 smaller frame elements connected at ends,the elements were grouped together into three groups where eachgroup represents one span length. Starting with the initial guessesof EI33 of girders 4 and 5, the unknown moment of inertias con-verged to values very close to the true values of EI33 that were usedfor simulating NDT data.
The results from model updating for shell-frame model usingSSTR error function are shown in Fig. 13. The bending rigidity offrame elements representing girders 4 and 5 converged with amean error of -1.33%. However maximum error in groups 3 and6, which represents the north spans of the girders, was higher thanfor the center and south spans. This could be attributed to smallerdeformations from increased stiffness at the north end of thebridge leading to lower sensitivity in estimating parameter values.
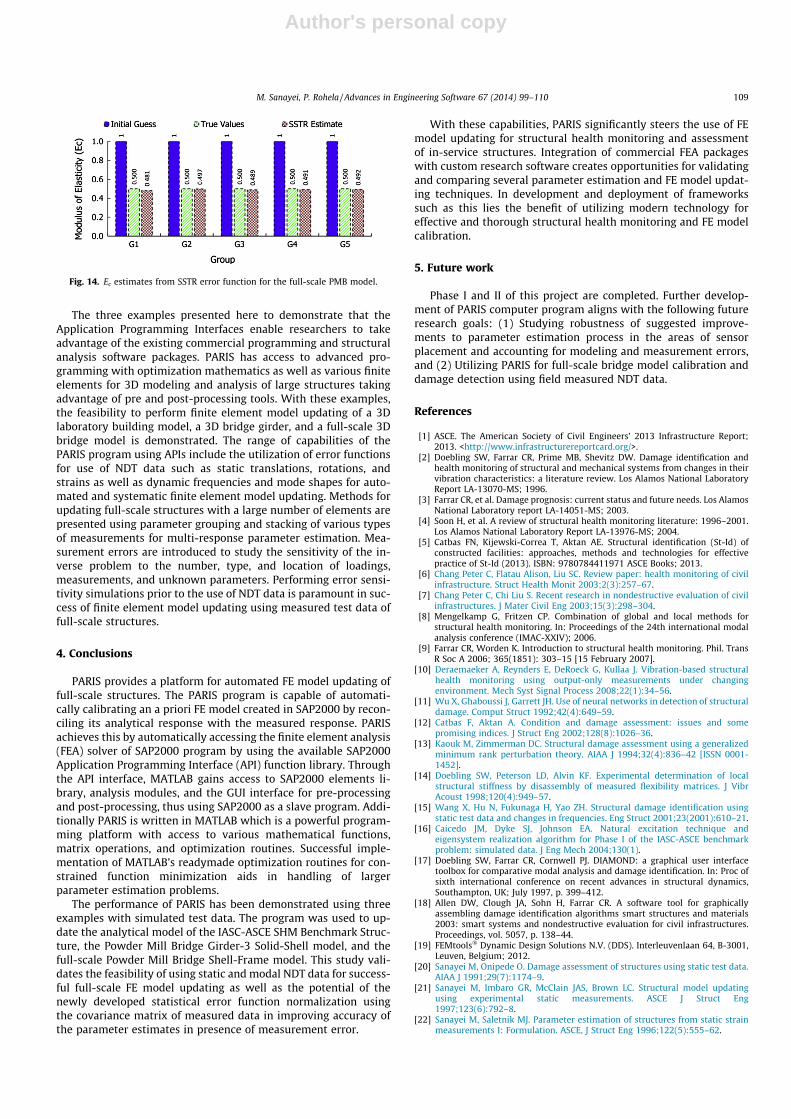
Damage case 2: Damage to the bridge deck is a prominent typeof damage in bridges. This type of damage can be caused by trafficloads, environmental factors including diurnal and seasonal tem-perature variation, and water infiltration through expansion jointsor poor quality control during construction. To simulate this dam-age scenario, a cluster of 30 shell elements equivalent to deck sur-face of 44.04 m2 were grouped together to simulate damage. Itrepresents a patch beginning at length 3.92 m from south end till11.75 m length and lies on the right lane looking north. The dam-age level is taken to be 50% of the initial shell elasticity modulus(Ec). The concrete modulus of elasticity for all five deck groupswas successfully estimated (see Fig. 14).
Ec estimates for loss of 50% deck stiffness for a cluster of shellelements described under damage case 2 were quite accurate.The model updating process was automatically terminated whenrelative change in parameter values between two iterations be-came less than 10E�12. It took 13 iterations for the convergencecriteria to be met.
Fig. 11. Bearing pad stiffness (kXX and khY) estimates for PMB Girder-3 model.
Fig. 12. PMB shell-frame model plan.
Fig. 13. EI33 estimates from SSTR error function for the full-scale PMB model.
108 M. Sanayei, P. Rohela / Advances in Engineering Software 67 (2014) 99–110
Author's personal copy
The three examples presented here to demonstrate that theApplication Programming Interfaces enable researchers to takeadvantage of the existing commercial programming and structuralanalysis software packages. PARIS has access to advanced pro-gramming with optimization mathematics as well as various finiteelements for 3D modeling and analysis of large structures takingadvantage of pre and post-processing tools. With these examples,the feasibility to perform finite element model updating of a 3Dlaboratory building model, a 3D bridge girder, and a full-scale 3Dbridge model is demonstrated. The range of capabilities of thePARIS program using APIs include the utilization of error functionsfor use of NDT data such as static translations, rotations, andstrains as well as dynamic frequencies and mode shapes for auto-mated and systematic finite element model updating. Methods forupdating full-scale structures with a large number of elements arepresented using parameter grouping and stacking of various typesof measurements for multi-response parameter estimation. Mea-surement errors are introduced to study the sensitivity of the in-verse problem to the number, type, and location of loadings,measurements, and unknown parameters. Performing error sensi-tivity simulations prior to the use of NDT data is paramount in suc-cess of finite element model updating using measured test data offull-scale structures.
4. Conclusions
PARIS provides a platform for automated FE model updating offull-scale structures. The PARIS program is capable of automati-cally calibrating an a priori FE model created in SAP2000 by recon-ciling its analytical response with the measured response. PARISachieves this by automatically accessing the finite element analysis(FEA) solver of SAP2000 program by using the available SAP2000Application Programming Interface (API) function library. Throughthe API interface, MATLAB gains access to SAP2000 elements li-brary, analysis modules, and the GUI interface for pre-processingand post-processing, thus using SAP2000 as a slave program. Addi-tionally PARIS is written in MATLAB which is a powerful program-ming platform with access to various mathematical functions,matrix operations, and optimization routines. Successful imple-mentation of MATLAB’s readymade optimization routines for con-strained function minimization aids in handling of largerparameter estimation problems.
The performance of PARIS has been demonstrated using threeexamples with simulated test data. The program was used to up-date the analytical model of the IASC-ASCE SHM Benchmark Struc-ture, the Powder Mill Bridge Girder-3 Solid-Shell model, and thefull-scale Powder Mill Bridge Shell-Frame model. This study vali-dates the feasibility of using static and modal NDT data for success-ful full-scale FE model updating as well as the potential of thenewly developed statistical error function normalization usingthe covariance matrix of measured data in improving accuracy ofthe parameter estimates in presence of measurement error.
With these capabilities, PARIS significantly steers the use of FEmodel updating for structural health monitoring and assessmentof in-service structures. Integration of commercial FEA packageswith custom research software creates opportunities for validatingand comparing several parameter estimation and FE model updat-ing techniques. In development and deployment of frameworkssuch as this lies the benefit of utilizing modern technology foreffective and thorough structural health monitoring and FE modelcalibration.
5. Future work
Phase I and II of this project are completed. Further develop-ment of PARIS computer program aligns with the following futureresearch goals: (1) Studying robustness of suggested improve-ments to parameter estimation process in the areas of sensorplacement and accounting for modeling and measurement errors,and (2) Utilizing PARIS for full-scale bridge model calibration anddamage detection using field measured NDT data.
References
[1] ASCE. The American Society of Civil Engineers’ 2013 Infrastructure Report;2013. <http://www.infrastructurereportcard.org/>.
[2] Doebling SW, Farrar CR, Prime MB, Shevitz DW. Damage identification andhealth monitoring of structural and mechanical systems from changes in theirvibration characteristics: a literature review. Los Alamos National LaboratoryReport LA-13070-MS; 1996.
[3] Farrar CR, et al. Damage prognosis: current status and future needs. Los AlamosNational Laboratory report LA-14051-MS; 2003.
[4] Soon H, et al. A review of structural health monitoring literature: 1996–2001.Los Alamos National Laboratory Report LA-13976-MS; 2004.
[5] Catbas FN, Kijewski-Correa T, Aktan AE. Structural identification (St-Id) ofconstructed facilities: approaches, methods and technologies for effectivepractice of St-Id (2013). ISBN: 9780784411971 ASCE Books; 2013.
[6] Chang Peter C, Flatau Alison, Liu SC. Review paper: health monitoring of civilinfrastructure. Struct Health Monit 2003;2(3):257–67.
[7] Chang Peter C, Chi Liu S. Recent research in nondestructive evaluation of civilinfrastructures. J Mater Civil Eng 2003;15(3):298–304.
[8] Mengelkamp G, Fritzen CP. Combination of global and local methods forstructural health monitoring. In: Proceedings of the 24th international modalanalysis conference (IMAC-XXIV); 2006.
[9] Farrar CR, Worden K. Introduction to structural health monitoring. Phil. TransR Soc A 2006; 365(1851): 303–15 [15 February 2007].
[10] Deraemaeker A, Reynders E, DeRoeck G, Kullaa J. Vibration-based structuralhealth monitoring using output-only measurements under changingenvironment. Mech Syst Signal Process 2008;22(1):34–56.
[11] Wu X, Ghaboussi J, Garrett JH. Use of neural networks in detection of structuraldamage. Comput Struct 1992;42(4):649–59.
[12] Catbas F, Aktan A. Condition and damage assessment: issues and somepromising indices. J Struct Eng 2002;128(8):1026–36.
[13] Kaouk M, Zimmerman DC. Structural damage assessment using a generalizedminimum rank perturbation theory. AIAA J 1994;32(4):836–42 [ISSN 0001-1452].
[14] Doebling SW, Peterson LD, Alvin KF. Experimental determination of localstructural stiffness by disassembly of measured flexibility matrices. J VibrAcoust 1998;120(4):949–57.
[15] Wang X, Hu N, Fukunaga H, Yao ZH. Structural damage identification usingstatic test data and changes in frequencies. Eng Struct 2001;23(2001):610–21.
[16] Caicedo JM, Dyke SJ, Johnson EA. Natural excitation technique andeigensystem realization algorithm for Phase I of the IASC-ASCE benchmarkproblem: simulated data. J Eng Mech 2004;130(1).
[17] Doebling SW, Farrar CR, Cornwell PJ. DIAMOND: a graphical user interfacetoolbox for comparative modal analysis and damage identification. In: Proc ofsixth international conference on recent advances in structural dynamics,Southampton, UK; July 1997, p. 399–412.
[18] Allen DW, Clough JA, Sohn H, Farrar CR. A software tool for graphicallyassembling damage identification algorithms smart structures and materials2003: smart systems and nondestructive evaluation for civil infrastructures.Proceedings, vol. 5057, p. 138–44.
[19] FEMtools� Dynamic Design Solutions N.V. (DDS). Interleuvenlaan 64, B-3001,Leuven, Belgium; 2012.
[20] Sanayei M, Onipede O. Damage assessment of structures using static test data.AIAA J 1991;29(7):1174–9.
[21] Sanayei M, Imbaro GR, McClain JAS, Brown LC. Structural model updatingusing experimental static measurements. ASCE J Struct Eng1997;123(6):792–8.
[22] Sanayei M, Saletnik MJ. Parameter estimation of structures from static strainmeasurements I: Formulation. ASCE, J Struct Eng 1996;122(5):555–62.
Fig. 14. Ec estimates from SSTR error function for the full-scale PMB model.
M. Sanayei, P. Rohela / Advances in Engineering Software 67 (2014) 99–110 109

Author's personal copy
[23] Sanayei M, Wadia-Fascetti S, McClain JAS, Santini EM. Structural parameterestimation incorporating modal data and boundary conditions. J Struct Eng1999;125(9):1048–55.
[24] Sanayei M, Wadia-Fascetti S, Arya B, Santini EM. Significance of modeling errorin structural parameter estimation. Comput-Aided Civil Infrastr Eng2001;16(1):12–26.
[25] Hjelmstad KD. On the uniqueness of modal parameter estimation. J Sound Vibr1996;192(2):581–98.
[26] Sanayei M, DiCarlo C. Finite element model updating of scale bridge modelusing measured modal response data. In: Proceedings of the ASCE, structurescongress 2009, Austin, Texas; 2009.
[27] Bell ES, Sanayei M, Rao N. Model updating of UCF benchmark using PARIS. In:International modal analysis conference, IMAC XXV, Orlando, Florida;February 19–22, 2007.
[28] Smith IFC. Multiple-model structural identification. Encyclopedia of structuralhealth monitoring. Chichester, UK: Wiley. Reference IMAC-CHAPTER-2009-001; 2009. p. 2199–2208.
[29] Sanayei M, Onipede O, Babu SR. Selection of noisy measurement locations forerror reduction in static parameter identification. AIAA J 1992;30(9):2299–309.
[30] Dyke SJ, Bernal D, Beck J, Ventura C. Experimental phase II of the structuralhealth monitoring benchmark problem. In: Proceedings of the 16th ASCEengineering mechanics conference; 2003.
[31] Cardini AJ, DeWolf JT. Long-term structural health monitoring of a multi-girder steel composite bridge using strain data. Struct Health Monit2009;8(1):47–58.
[32] Farrar CR, Jauregui DA. Comparative study of damage identification algorithmsapplied to a bridge: I. Experiment. Smart Mater Struct 1998;7:704.
[33] Black CJ, Ventura CE. Blind test on damage detection of a steel frame structure.In: 16th International modal analysis conference (IMAC XVI), Santa Barbara,California. Proceedings; ; February 2–5, 1998. p. 623–629.
[34] Johnson EA, Lam HF, Katafygiotis LS, Beck JL. Phase I IASC-ASCE structuralhealth monitoring benchmark problem using simulated data. J Eng Mech2004;130(1):45.
[35] Sanayei M, Phelps JE, Sipple J, Bell E, Brenner B. Instrumentation, non-destructive testing and finite element model updating for bridge evaluationusing strain measurements. J Bridge Eng 2010;17(1):130–8.
110 M. Sanayei, P. Rohela / Advances in Engineering Software 67 (2014) 99–110