1. introduction - school of...
TRANSCRIPT

Determination of bridge foundation type from structural response measurements
Kenneth It Maser, Masoud Sanayei, Abba Lichtenstein, and Steven B. Chase
INFRASENSEInc., 14 Kensington Rd. Arlington MA 02174-8016Tufts University, Department of Civil and Environmental Engineering, 1 13 Anderson Hall, Medford, MA 02155
26 Trafalgar Rd. Tenafly, NJ 07670US DOT FHWA, Turner-Fairbanks Highway Research Center, McLean VA 22101
ABSTRACTEvaluation of bridge substructures for vulnerability to scour or other potential sources of damage requires knowledge offoundation conditions beneath piers and abutments that are often unknown. This paper presents a potential method fordetermining unknown foundation conditions which is simple and inexpensive. The method is based on strain and rotationmeasurements which are used to compute a stiffness matrix for the unknown foundation. The stiffness coefficients in thematrix are then matched with values previously determined for known foundations. The objective of the reported work hasbeen to demonstrate the feasibility of this method. Finite element models for representing pile and spread footing conditionshave been used to characterize the difference in stiffness properties between the two foundation types. Field measurementsof strains, displacements, and rotations have been taken on two bridges in Massachusetts: one with a spread footing and theother with a pile foundation. Parameter estimation models have been developed and used in conjunction with this field datato calculate the foundation stiffness properties. The paper describes the models, the numerical results, and the results offield testing.
Keywords: bridge foundations, unknown foundations, bridge testing, parameter estimation
1. INTRODUCTION
The objective of the work described in this paper has been to develop and demonstrate a simple, low-cost method fordetermining unknown bridge foundations. Such a method would be of great value in the assessment of the foundations ofbridges which are vulnerable to scour and other sources of foundation degradation. Many bridges in the United States havefoundation conditions beneath piers, headwalls, and abutments that are unknown. For the most part, these bridges are theolder ones off the federal aid system for which "as-built" drawings are not available. There is a critical need for a simple,low-cost system which can be used to determine the presence or absence of piles. If the foundation type is known, it is alsodesirable to determine the area and thickness or the footing, the soil conditions beneath the footing, and the number, depth,spacing, and condition of piles.
Past research into determining unknown foundation conditions have focused on the use of dynamic and seismic techniquesfor evaluating foundation components. These involve creating vibrations and sending stress waves into the foundation, andcarrying out time-and frequency-domain analyses of the responses (8). These techniques are complex, they require veryspecialized equipment, and they can only be carried out by a small number of highly specialized individuals and companies.Therefore, dynamic and seismic methods may be limited in their ability to meet a broad demand with budget constraints.
The proposed method is based on conventional strain, displacement, and rotation measurements at key locations caused bytruck and thermal loading The measurements are used to compute a foundation stiffness matrix for the unknownfoundation using either direct inversion or parameter estimation (1) (2) (7) (13). The advantage of parameter estimation isthat it allows for the use of fewer, simpler measurements. The unknown foundation conditions and properties are thendetermined by observing the ratios between the foundation stiffness coefficients and by matching the measured values withthose of known foundations which have been previously calculated.
Parameter estimation is a technique for determining unknown properties of a structure from measured responses. Parameterestimation is the reverse of conventional structural analysis, in that it assumes that the loadings and certain displacementsare known, and that certain aspects of the structure are unknown. The methodology includes a standard predictive structuralmodel to compute displacement from applied loads, and an iterative/optimization scheme for updating the unknownstructural properties to match the observed measurements (1) (2) (3) (4) (5)(6) (7) (13). The key unknown in the model isthe foundation stiffness matrix [K] of a soil-substructure superelement (SSS). The components of [K] are then matched
SPIE Vol. 3400 • 0277786X1981$10.00 SPIE Vol. 3400 / 55
Downloaded from SPIE Digital Library on 01 Aug 2011 to 130.64.82.105. Terms of Use: http://spiedl.org/terms

with previously determined patterns generated through a combination of field data and analytic foundation models, for avariety of foundation types and conditions. The best pattern match will determine the type and properties of the unknownfoundation. The matching process will be supported by other available information, including measurements of thefoundation footprint area (e.g. using GPR), estimation of dead loads to determine soil pressure (or pile loadings), and soilproperty and bedrock depth information from borings
The concept is illustrated in two dimensions in Figure 1 for the case of characterizing the type and condition of a pierfoundation. The figure shows a 2-dimensional free..body diagram of a pier, showing the loads transmitted by thesuperstructure and the reactions at the foundation. The relationships between the foundation reactions and the foundationdisplacements and rotations can be expressed as: {F} [K]{U}, where {F} {Fh, F, M} is the vector of reactions atthe foundation {U} = {dh, q } is the vector afdisplacements and rotations at the foundation; and [KJ is the soil-substructure stiffness matrix. In finite element terminology, all of the stiffness properties of the foundation have beenlumped into the SSS, and [K] represents the stiffness matrix c this superelement. The SSS element attempts to capture thebehavior of a complex soil-structure system in a simplified form, which, in two dimensions, are summarized by a 3x3matrix as follows:
The elements af [K] represent the resistance to movement produced by the foundation, and can be calculated frommeasured rotations using parameter estimation techniques. These elements (six in 2D and 21 in 3D) can then be used todetermine the structural characteristics of the foundation. It is anticipated that each type of foundation (e.g. spread footingon soil, spread footing on rock, friction pile, and end-bearing pile) will have a unique pattern of stiffness coefficients.
(b) pile foundation
Figure 1- Pier Foundation Model -- SpreadFooting versus Pile
The objective of the work described in this paper was to demonstrate that the foundation stiffness' can be measured usingstandard field instrumentation and that these measured stiffness' can distinguish different foundation types. This objectivewas achieved using finite element foundation models, parameter estimation studies, and field testing, as described in theremainder of the paper.
K55 = Ksym.
KHO
K0K
(1)
(a) spread footingFsv
I
lFsv
Mf9F [Ksss]
Fh
Ms, Fsh, Fsvmcinad aixi fcesfranztnittedbysup&tructure(ca1ilatedththngages)
Fe,,Mfristancecfindatii0 = rcaflaic(thefmdafli(measuredIy ti1tmet)&h,&v- f*indaticii &snts[K888J
56 1 SPIE Vol. 3400
Downloaded from SPIE Digital Library on 01 Aug 2011 to 130.64.82.105. Terms of Use: http://spiedl.org/terms

2. FOUNDATION STIFFNESS VERSUS FOUNDATION TYPE
A pier or abutment foundation is characterized in this work by the stiffness at the contact point between the bridge and thepier at the soil interface. This stiffness is then characterized by the soil-substructure-superelement (SSS) element stiffnesswhich, in two dimensions, is actually a symmetric 3x3 mathx shown in equation (1) above. The entries of the stiffnessmatrix represent lumped stiffness between certain loads and responses. For example, K is the horizontal resistance of thefoundation to horizontal loads. The off diagonal terms such as KHO, represent interaction between different degrees c(freedom (DOE). KHO is the rotational resistance of the foundation to horizontal loads. These individual stiffness' can beestimated from applied static loads and measured responses.
Finite element models made with SIGMA/W, a geotechnical finite element package developed by GEO-SLOPE, have beenused to estimate foundation stiffness from physical models of the foundation and the surrounding soiL Various models havebeen created including simple spread footings, friction pile footings, and end-bearing pile footings. Soil strength has alsobeen varied in these models. In order to assess the feasibility of using foundation stiffness' to identify unknown foundationtypes, six finite element models offoundations using Sigma/W were constructed. The six models are:
Case 1 - SF-S - Spread footing on dry silty sandFor dry silty sand use E 300 ksf, v 0.35
Case 2 - SF-C- Spread footing on dry dense sand and gravelFor dense sand and gravel use E = 3,000 ksf, v = 0.35
Case 3 - SF-R- Spread footing on rock (shale)For shale use E = 30,000 ksf, v 0.35
Case 4 - FP-S- Friction pile foundation on dry silty sandFordrysiltysanduseE= 300ksf, v 0.35Assume steel pipe piles filled with concrete, L = 30ft. D = 16 in, t = 0.75 in
Case 5 - EP-S- End bearing pile foundation on dry silty sand - pilesbearing on rock (shale)For dry silty sand use E 300 ksf, v 0.35Assume steel pipe piles filled with concrete, L = 30ft. D 16 in, t 0.75 in
Case 6 -EP-O- End bearing pile foundation on organic soil -piles bearing on rock (shale)For dry organic soil use E 100 ksf, v 0.35Assume steel pipe piles filled with concrete, L 30 ft. D 16 in, t 0.75 in
where E,V, L, D, and t are the elastic modulus, Poisson's ration, pile length, pile diameter, pile pipe thicknesscorrespondingly. The foundation stiffness' have been defined by KJ = [F] [U]' where:
[UI = displacementson Sigma/W model (3 x 3)IFI = forces applied to Sigma/W model (3 x 3)IKI = calculatedstiffness matrix (3 x 3)
The results of the modeling effort for the six cases described above are sununarized in Table 1 below.
Table 1 - Stiffness Coefficients from Sigma/W for the Six Models
MODELS K(k/ft)
K(k/It)
K(kipft)
K(k/It)
K(kips)
K(kips)
(1) SF-S 354 301 16,400 0 1,409 0(2) SF-C 2,825 2,881 59,180 0 6,350 0
(3) SF-R 18,880 22,240 125,000 0 13,417 0
(4) FP-S 409 757 33,500 0 2,054 0(5) EP-S 501 8,548 76,110 0 3,127 0(6) EP-O 182 7,655 31,260 0 928 0
SPIE Vol. 3400 I 57
Downloaded from SPIE Digital Library on 01 Aug 2011 to 130.64.82.105. Terms of Use: http://spiedl.org/terms

The results show distinct differences in stiffness coefficients for the different foundation types. In practice, it may be usefulto utilize the ratios of the stiffness coefficients as indicators ofthefoundation types.
3. DETERMINATION OF FOUNDATION STIFFNESSES FROM FIELD MEASUREMENTS
The primary method pursued in this research for detennination of foundation stiffnesses from field data is ParameterEstimation. This method allows the user to chose a more favorable type of measurement, and to limit the total number ofmeasurement required. The computational procedure, however, is relatively new and has not been routinely applied to theinterpretation offield measurements.
A parameter estimation simulation was carried out to identify which static measurements would be required to determinethe foundation stiffness'. One of bridges later tested as part of this work was used as a test case for this study. The piers aremodeled using properties of concrete while the deck, which consists of steel orders and a concrete slab acting as acomposite section, is modeled as an equivalent steel cross-section The actual model consisted of 94 elements and 279degrees of freedom. At the deck-pier interface, the three joining elements are modeled to be rigid, to simulate the decksupport at the top of the pier. A schematic of the model is shown in Figure 2.
In the model, the bridge was loaded with a 43.6 kip truck(front axle 11.3 kips, rear axle 32.3 kips) at four different loadingpositions on the deck
Vehicle Loads Deck and SuPerarUctUre
1
I ,
Nodes—- Elements
7
81
'— =nFigure 2 - Schematic ofBridge Model using Frame and Founthtion Elements
The intent of the simulations is to identify what static measurements are required to determine the foundation stiffness' ofthe east (left) pier of the bridge. Use of rotations for the simulated data was investigated extensively since rotations aresimple to measure in comparison with horizontal and vertical translations. Thirty cases were studied, each representingdifferent combinations of loadings, measurements, and assumed unknown parameters. The results of interest were for thosecases which were numerically well conditioned, and in which the maximum number of stiffness coefficients can bedetermined with the minimum number of measurements. Based on these criteria, it was shown that all 6 foundationstiffness' can be computed by measuring rotations at nodes 2, 6, and 8 in Figure 2 for four truck loading positions. Theresults also showed that a 50% error in the foundation stiffness assumed for the west pier does not effect the parameterevaluation of the east pier foundation.
The above study has shown that parameter estimation can yield foundation stiffness coefficients with considerably simplermeasurements than required for the direct method. Therefore, it will be desirable to utilize parameter estimation forevaluation of the stiffness' of unknown bridge foundations.
4. FIELD MEASUREMENT PROGRAM
The objective of the field measurement program was to verify that foundation stiffness' could be measured withconventional instrumentation, and to confirm the theoretical differences between stiffness' calculated for spread footing andpile foundations. Tests involved a loaded dump truck with measured axle loads would driving siowly across the bridge, withmeasurements continuously made. The bridge was closed to traffic briefly while the truck was crossing. Two bridges ineastern Massachusetts swre testei The characteristics of the two test bridges are summarized in Table 3 below. All spans of
58/SPIE Vol. 3400
Downloaded from SPIE Digital Library on 01 Aug 2011 to 130.64.82.105. Terms of Use: http://spiedl.org/terms

both bridges are simply supported, and the superstructures are designed with shear connectors between the girders and thedeck, so that composite behavior between the girders and decks can be expected.
Table 2 Characteristics of the Test Bridges
Bridge No. of
SpansSpan Lengths Girder Type Girder # &
SpacingPier Tested Deck Skew
FruitStreet
3 1 - 98'6"2 - 69'9"3- 101'9"
54" P1 girder36WF 13554" P1 girder
5 at 7'3" betweenspans I and2
8" concrete2/2" asphalt
28°+
WinterStreet
4 1 - 28'lO"2- 80'5"3 - 80'S"4-29'O"
36WF 15036WF23036WF23036WF150
5 @7'lO.S"
betweenspans I and2
7.5" concretel/4" asphalt
23°+
The instrumentation was selected to adequately measure the foundation stiffness' using the "direct method", which requiresthe measurement of rotation, bending moment, horizontal and vertical displacement, and horizontal and vertical forces atthe foundation level. Rotations and displacements can be measured directly with conventional gages. Forces and bendingmoments must be computed from strains, and are consequently calculated from the output of strain gages. Theinstrumentation selected was the following: 4 Tiltmeters (Applied Geomechanics) 4 Strain Transducers (BridgeDiagnostics, Inc.). 2 Linear Variable Differential Transformers (LVDT) (Transtek): and 2 Temperature Transducers(Generic Thermisters). Figures 7 and 9 show the instrumentation layout for each of the tested bridges
The data acquisition system assembled for the field measurements had to be capable of handing the instrumentationdescribed above. Data acquisition involves both the hardware for signal condition, digitization. and storage of the data, andthe software through which the user controls the system. The selected system was a commercial low power data acquisitionwith embedded controller system and memory. The commercial system chosen was the Onset Computer's Model 8"Tattletale" combined with Peripheral Issue's PCMCIA Flash memory card called the "Persistor". These two componentswould then be coupled with some external circuitry to perform required functions channel selection, gain ranging, andoffset voltage cancellation.
4.1 Testing methodThe Fruit Street bridge pier consists of 3 columns as shown in Figure 4. The tests were carried out by instrumenting thecenter column, and adjusting the stiffness results to represent the stiffness of the entire pier. The truck loading was alongthe centerline of the deck, and so symmetry could be assumed for the two side columns. Measurements were made on one
51'!! Vol. !400 / 59
Fruit Street Bridge Winter Street Brisg
Figure 3 - Photographs of the Bridges showing the Tested Piers
Downloaded from SPIE Digital Library on 01 Aug 2011 to 130.64.82.105. Terms of Use: http://spiedl.org/terms
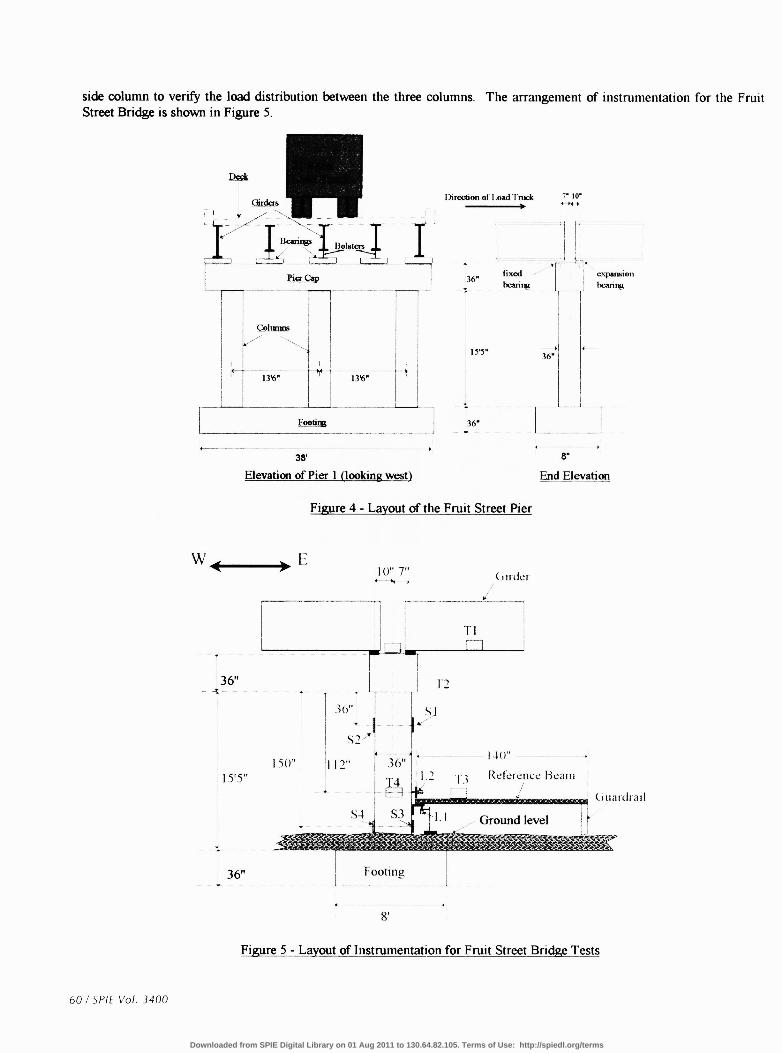
side column to verify the load distribution between the three columns. The arrangement of instrumentation for the FruitStreet Bridge is shown in Figure 5.
Cbrdcm
- 2—--- -- - - - -
—
llOI?t4 I- [--_
----
1_____i 1-___ 1.36.38
Elevation of Pier 1 (looking west)
1)ire1ionof1.oad!njck 10"
• 4M*
I -fixed expansionbca bean
60 / SPIL Vol. 3400
Figure 4 - Layout of the Fruit Street Pier
(i der
(iuaidraij
De
36"
155"
8"
End Elevation
W______ F 07'
36°
155"
12
36'
12"15(1"4(1"
F3 ca Ill
36"
Figure 5 - Layout of Instrumentation for Fruit Street Bridge Tests
Downloaded from SPIE Digital Library on 01 Aug 2011 to 130.64.82.105. Terms of Use: http://spiedl.org/terms

Two strain gage pairs were attached at two different heights of the test column. This arrangement permitted the calculationof bending moments at tv different heights, which then allowed for the calculation of the horizontal (shear) force on thecolumn. Axial force can also be calculated from either strain gage pair. A reference beam was used to calculate horizontaland vertical displacement. The reference beam was attached to a guardrail 140 inches from the column, and it supported anLVDT (L2) and a tiltmeter (T3). L2 measured the horizontal movement of the column, and T3 measured the beam rotationwhich would be caused by the vertical displacement of the column. Since the reference beam support was still within thezone of influence of the foundation movement, it was expected that the displacement would be underestimated using thismethod. An LVDT (Li) was mounted to a stand resting on the ground at the base of the column. It was anticipated that thebase of the stand would move up and down with the column, but there was interest in confirming this expectation.
Two tiltmeters were mounted to the Pier. Tiltmeter T2 was a "platform mount" unit which rested on top of the pier cap.Tiltmeter T4 was a "wall mount" unit, and was attached to the side of the column. Tiltmeter Ti was a platform mount unitwhich rested on top of the bottom flange of the center girder of the east span. The objective of this positioning was to userotation of the girder to measure the vertical movement of the pier, when the load was on the west span. This represented abackup measurement for the one being made by tiltmeter T3 on the reference beam. Thermisters i and 2 were attached tothe top and bottom of the deck, respectively.
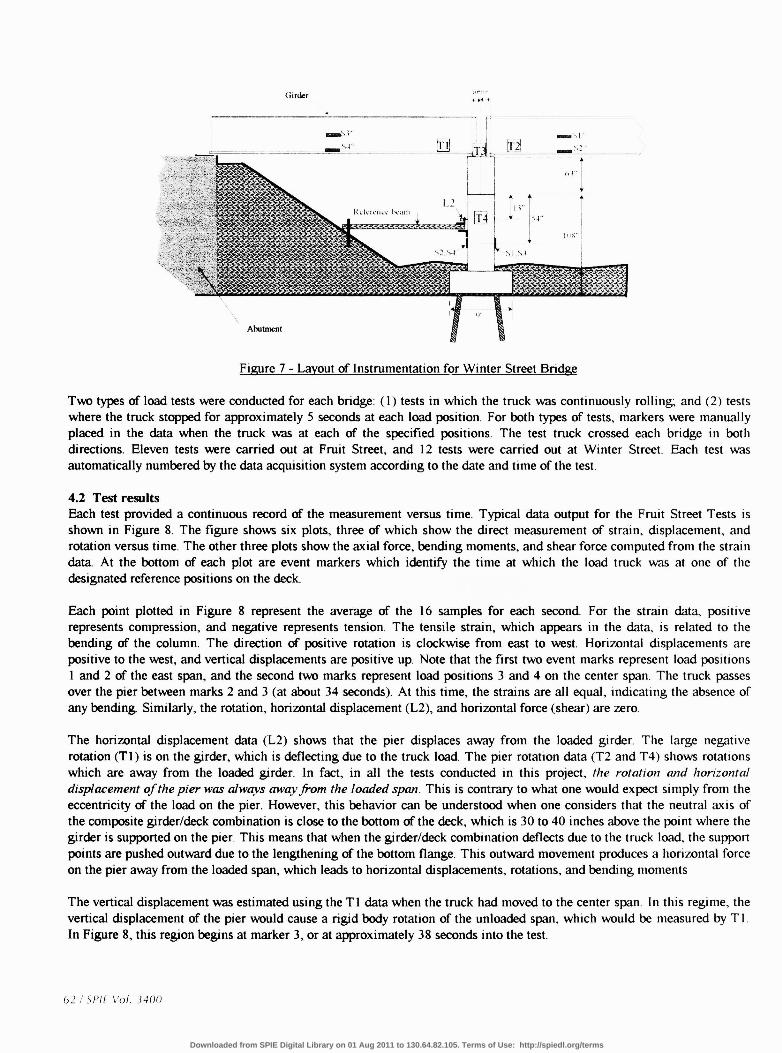
The Winter Street Bridge pier was made up of two columns as shown in Figure 6. The columns are nine and one half feetlong and 4 feet square. Thus, the aspect ratio prevented the use of beam theory to determine the horizontal force in acolumn. For Winter Street, one pair of strain gages was attached at mid-height on either side of each column. In this waythe strain gages could be used to calculate the axial force and to estimate the bending moment. The horizontal force on thepier was then estimated by statics using the eccentricity of the loading from the girder. Figure 7 shows the instrumentationlayout for the Winter Street Bridge Pier. One pair of strain gages was placed on the opposite faces of each column (S1-S2 onthe west column and S3-S4 on the east column). Tiltmeters were placed on the top of the pier cap and on one column, asdone in the Fruit Street Test. Tiltmeters were also placed on the center girder on each side of the pier, as a means formeasuring vertical displacement. A tiltmeter was not placed on the reference beam because it was vibrating excessively dueto wind, and it was felt that useful measurements could not be made. All tiltmeters were set up to read positive rotation tothe north (clockwise in the figure).
Elevation of Pier 1 (looking north) End Elevation (looking west)
Si4c_lk10 1
? —
I 63
11TH1
FQ& 48.._;__ -—4-.--*
28'
Piles ---
Figure 6 - Layout of the Winter Street Bridge Pier
SPIL Vol. 3400/61
Downloaded from SPIE Digital Library on 01 Aug 2011 to 130.64.82.105. Terms of Use: http://spiedl.org/terms
Girder
IT
Figure 7 - Layout of Instrumentation for Winter Street Bridge
Two types of load tests were conducted for each bridge: (1) tests in which the truck was continuously rolIing and (2) testswhere the truck stopped for approximately 5 seconds at each load position. For both types of tests, markers were manuallyplaced in the data when the truck was at each of the specified positions. The test truck crossed each bridge in bothdirections. Eleven tests were carried out at Fruit Street, and 12 tests were carried out at Winter Street. Each test wasautomatically numbered by the data acquisition system according to the date and time of the test.
4.2 Test resultsEach test provided a continuous record of the measurement versus time. Typical data output for the Fruit Street Tests isshown in Figure 8. The figure shows six plots, three of which show the direct measurement of strain, displacement, androtation versus time. The other three plots show the axial force, bending moments, and shear force computed from the straindata. At the bottom of each plot are event markers which identif' the time at which the load truck was at one of thedesignated reference positions on the deck.
Each point plotted in Figure 8 represent the average of the 16 samples for each second. For the strain data, positiverepresents compression, and negative represents tension. The tensile strain, which appears in the data, is related to thebending of the column. The direction of positive rotation is clockwise from east to west. Horizontal displacements arepositive to the west, and vertical displacements are positive up. Note that the first two event marks represent load positionsI and 2 of the east span, and the second two marks represent load positions 3 and 4 on the center span. The truck passesover the pier between marks 2 and 3 (at about 34 seconds). At this time, the strains are all equal, indicating tile absence ofany bending. Similarly, the rotation, horizontal displacement (L2), and horizontal force (shear) are zero.
The horizontal displacement data (L2) shows that the pier displaces away from the loaded girder. The large negativerotation (TI) is on the girder, which is deflecting due to the truck load. The pier rotation data (T2 and T4) shows rotationswhich are away from the loaded girder. In fact, in all the tests conducted in this project, the rotation and horizontaldisplacement of the pier was aiwavs away from the loaded span. This is contrary to what one would expect simply from theeccentricity of the load on the pier. However, this behavior can be understood when one considers that the neutral axis ofthe composite girder/deck combination is close to the bottom of the deck, which is 30 to 40 inches above the point where tilegirder is supported on the pier. This means that when the girder/deck combination deflects due to the truck load, the supportpoints are pushed outwaird due to the lengthening of the bottom flange. This outward movement produces a horizontal forceon the pier away from the loaded span, which leads to horizontal displacements, rotations, and bending moments
The vertical displacement was estimated using the Ti data when the truck had moved to the center span. In this regime, thevertical displacement of the pier would cause a rigid body rotation of the unloaded span, which would be measured by T I.In Figure 8, this region begins at marker 3, or at approximately 38 seconds into the test.
62 I SPIL Vol. 3400
— '. 4
.ITAL1
4<t titiRt w .11112
Abutment I
Downloaded from SPIE Digital Library on 01 Aug 2011 to 130.64.82.105. Terms of Use: http://spiedl.org/terms

5. FIELD DATA ANALYSIS
The data from the tests was analyzed to determine the relationships between loads and displacements, and to estimate theobserved foundation stiffness coefficients. The initial procedure was to estimate the diagonal elements of the foundationstiffness matrix by plotting each force and moment against the corresponding displacement and rotation. The followingsections describe the results obtained using this procedure for the Fruit and Winter Street Tests.
Force-displacement and moment-rotation piots for a Fruit Street load test are shown in Figure 9. The Fruit Street results areshown for the Test 04301310, the same Rolling Westbound Test whose raw data was shown in Figure 8. From top to bottomthe three plots show horizontal (shear) force versus horizontal displacement, vertical (axial) force versus verticaldisplacement, and bending moment versus rotation. There is a separate plot for the axial force computed from each straingage pair. The vertical displacement is computed from the girder rotation Ti when then load is on the adjacent span, andthus only a subset of the total number af data points are available for this plot The bending moment is CalCulated at thelocation of the tiltmeter T4 from the bending moments CalCUlated from the two strain pairs, and the rotation is T4.
The relationships shown in Figure 9 are reasonably linear, and the results of a linear regression are shown with each dataset The regression line is shown along with the slope, the intercept, and a measure of the quality of the fit (R2) for theregression. Note that the R2 values are high, indicating that there is a good linear fit. As discussed in Section 3, the slope ofeach regression line can be considered as a first approximation to the diagonal stiffness coefficients, K K, and Kq, Ofthe foundation stiffness matrix. With this in mind, the data from all of the load tests was analyzed in the same way asshown in Figure 9. A summary of the regression results are shown in Table 3.
Table 3 shows the calculation of K K, and Kq for all of the Fruit Street and Winter Street Load Tests. Also shown onthe table are the R-squared values for each calculation. Note that most of the R-squares are above 0.9, indicating a fairlygood set of correlations. At the bottom of the table is a summary of the statistics for the best data. The best data has beendefined as that for which there were no gage problems, and for which the R-squared was greater than 0.80. The summaryfrom Fruit Street shows a maximum 6%deviation in the calculation &Kq from the mean value, with corresponding valuesof 24% and 33% in the calculations ofK and K respectively.
An analysis similar to that described above has been carried out for the Winter Street Load Tests. The average diagonalstiffness values for both Fruit Street and Winter Street Tests are summarized in Table 4 below. For Fruit Street, the value istaken as the mean cfthe two Kvalues determined in Table 3. In Table 5, the stiffness values are shown in both the unitsdetermined from the field data, and in the units employed in the finite element analysis of section 2. This conversion hasbeen made for the purpose of comparison, as discussed below.
In order to compare the field data to theoretical predictions, cases 2 and 5 of the finite element model of Section 2 weremodified to represent the specific foundation properties of the Fruit Street and Winter Street Bridges. The computedstiffness values turned out to be similar to those shown in Table 1 for cases 2 and 5. The ratios of the stiffness valuesobtained using these modified analyses are presented in Table 5belowalong with the ratios of the stiffness values obtainedfrom the field data. The units are in kips, feet, and radians. Given the assumptions involved in developing the finite elementmodel, one would not expect direct agreement between analysis and theory. However, the table shows that the pattern ofdifferences between the Fruit Street and Winter Street foundation stiffness' determined from field data is similar to theprediction. For example, the ratio KfK which was shown in theory to much larger for the pile foundation than for thespread footing actually turned out that way when computed from the field data A similar pattern was observed for the ratioKqq/KIIH. The agreement is not as strong with KfKv,, yet the measured difference between the t foundations is still inthe same direction as predicted by theory.
The data in Table 5 supports the possibility Of using foundation stiffness data to determine foundation type. For example,one could establish a rule which states that if the ratios of Kvv/K and KfI( exceed specified threshold levels, then thefoundation is on end bearing piles. The threshold levels could be established by an analytiCal model in combination with apreviously developed field database. Additional field data will be required to confirm the patterns observed here, and toestablish a database which can be used to calibrate the theoretical modeling The off-diagonal terms which were notcomputed here could also provide additional information on stiffness patterns to support the foundation type determination.
SPIE Vol. 3400 / 63
Downloaded from SPIE Digital Library on 01 Aug 2011 to 130.64.82.105. Terms of Use: http://spiedl.org/terms

.1oo
-150
N
U)
—200
—250
64/SPIEVo!. 3400
Figure 9 -Forces and Moment versus Displacements and Rotationwith Regression Data (Fruit Street test 04301310
2500 04301310 diaplaout'
2000 .. —11: - 12
1500 , , . —mark1000 :£!500I
—500'N05TT
;_
—1000 .-.
-50 A A A. 4tt— (.w)
50
0
—50
1.5
1
0.5I
2 04301310 ahssx force
—V (kipm)!mark
—0.5
—1
—1 .5 ti (sc
Figure 8 - LoadTest Data from Fruit Street Bridge(Test 04301310, Rolling Test Westhound)
100
.80
60
;I
40
. 20
I
Horizontal Di.placeunt (in)
—2072 0
. &43
020 40 6
y = 1.8679xR2 0.9768
2 1Rot&tion (trad)
Downloaded from SPIE Digital Library on 01 Aug 2011 to 130.64.82.105. Terms of Use: http://spiedl.org/terms

Also, it was originally hoped that parameter estimation would be used to calculate the foundation stiffness' from the fielddata But time limitations prevented the completion af this step in the current project.
Table 3 - Summary ofDiagonal Stiffness Data for Fruit Street Tests
Test Stiffness' I R-Squared
FruitStreet
Kqq Kin-kips/ mrad kips/in. kips/in.
Kqq K
4301149
4301155
4301212
4301223
43013484301217
4301229
4301310
4301313
4301400
1.880 ** 540.71.764 109.35 607.0
1.673 171.07 572.8
1.720 ** 700.1n.a 248.52 n.a.
1.671 122.43 587.7
2.748 108.67 857.1
1.868 190 743.3
1.761 119.34 652.0
n.a 152.74 n.a
0.964 0.923
0.981 0.949 0.9602
0.984 0.9843 0. 9582
0.976 0.9663
0.7162
0.952 0.9397 0.9434
0.849 0.9211 0.9178
0.977 0.9563 0.9767
0.955 0.9399 0.97
0.9855
Statistics for Best Data
Kcig K Kmiii 1.673 108.67 541
max 1.880 171.07 857mean 1.778 138.08 658
Test Stiffness' R-Squared
WinterStreet
Kqq K Kin-kips/ kips/in kipS/in
mrad
Kqq K
5071221
5071225
5071230
5071234
5071242
5071246
5071258
50713055071327
5071330
5071333
5071337
2.973 2831.8 616.6
3.386 1777.80 414.0
3.001 1459.20 346.4
3.781 1871.90 619.7
3.251 923.71 391.1
3.290 1213.40 286.0
3.605 2073. 10 409. 13.728 2081.7 604.0
3.463 2087.00 506.8
3.604 2174.70 368.4
3.717 1928.60 408.7
3.581 2218.20 344.6
0.97 0.76 0.90
0.78 0.94 0.97
0.87 0.92 0.86
0.94 0.74 0.96
0.90 0.61 0.84
0.86 0.53 0.85
0.93 0.95 0.900.87 0.90 0.86
0.97 0.97 0.92
0.97 0.97 0.92
0.97 0.73 0.94
0.96 0.81 0.69
Statistics for Best Data
Kqg Kmm 2.97 924 286
max 3.78 2832 620mean 3.45 2050 452
SPIE Vol.3400 I 65
Downloaded from SPIE Digital Library on 01 Aug 2011 to 130.64.82.105. Terms of Use: http://spiedl.org/terms

Table 4 - Summary of Averaged Foundation Stiffness' Data
Test Kqq Kvv Kim
(in-kips/ (ft.kips/ (kips/in) (kips/fi) (kips/in) (kipS/ft)mradian) radian)
FruitStreet 1.778 148,167 138 1656 658 7896
Winter Street 3.45 287,500 2050 24600 452 5424
Table 5 - Diagonal Stiffness Ratios -- Theoryversus Field Measurement
Bridge K/KTheory Measured
KidKimTheory Measured
KJKwTheory Measured
Fruit StreetWinter Street
1.2 0.2113.8 4.54
19.9 18.76136.7 53.00
16.7 89.479.9 11.69
6. CONCLUSIONS AND RECOMMENDATIONSA method has been proposed for identifying unknown foundations through static testing by calculating and evaluatingfoundation stiffness coefficients. These coefficients represent the overall resistance of the foundation to vertical, horizontal,and rotational loadings, and have been investigated as a means of characterizing the foundation type. Knowledge of thesefoundation stiffness coefficients is useful not only for determining foundation type, but also for evaluating foundationconditions and for determining baselines for future condition evaluations. The work carried out under this Phase I programhas generated a number of significant results which will have an impact on the future development of this method. Theseconclusions are summarized below
1. It has been shown that, in theory, foundation stiffness matrix coefficients can provide a basis for distinguishing spreadfootings from pile supported foundations. The pattern of stiffness coefficients is distinctly different for these twofoundation types.
2. It has been shown from field measurements on two bridges, one with a spread footing and one with a pile supportedfoundation, that the pattern of stiffness coefficients is distinctly different for the two foundation types. The differenceswere in the same direction and of similar orders of magnitude as those predicted by theory.
3. The field tests involved measurements of pier rotations, displacements, and strains, and calculation of forces andmoments from the measured strains. Rotations proved to be the most reliable and repeatable measurement.
4. A method, called parameter estimation, was proposed as a means for calculating foundation stiffness coefficients withan optimal number of the most desirable types of gages. A numerical parameter estimation simulation study based onone of the tested bridges showed that the six independent foundation stiffness coefficients can be obtained from rotationmeasurements alone. Such parameter estimation is planned as the scope of a follow-up project.
7. ACKNOWLEDGEMENT
The authors would like to acknowledge the FHWA for their support of this work under contract DTRS-57-96-C-00087. Theauthors would also like to acknowledge the contributions of Mr. Shane MPalmquist of Tufts, for his help in implementingthe finite element and parameter estimation modeling efforts; Professor Lewis Edgers of Tufts for his assistance in settingup the finite element foundation models; Ms. Laura McGrath of INFRASENSEfor her assistance in analysis of the fielddata; Mr. Bruce Ambuter, Consultant, for his design and assembly c4 the data acquisition system and Mr. Gerard Grippo ofkG. Lichtenstein and Associates for his assistance with selection of the bridges and conduct of the field tests. The authors
66 1 SPIE Vol. 3400
Downloaded from SPIE Digital Library on 01 Aug 2011 to 130.64.82.105. Terms of Use: http://spiedl.org/terms

/9 I OOI •IOA 1IdS
9861 '8tZl 'LItZI L 'C6LI98-VS 'MS thd J7JOZUlpdj SJadU.Z'U aJJoWoJ7Zvfo (ja;aog IIwp S32 3!WS 91jdWO0UI WOJJ S9SSU3S flIGWGjG m3P JO UO3E3JUGpJ1 9I 'UOS!9N jU } 'I9AEUB (jj
•S661 SflflV '•3 •ci 'UO1UfljSBj 'UIJOJJ tj3J9SG c1Mqqj QAItuQdoo jBUO 'T 'pBflOqr puB ' 'SOOujimf (j c661
'XI 'I 'u;sto Ac panxbid 'ç-j flIHJN 'uocb'a iua '11suopunoj pug utouuç jo uoiuiuuj1, >jjjN (zi
t661 't63ffI Yd 'qsnqsutj 'ujuoj pug uowuj •Jc1JGI SUOJid PU U!MS QflWGS 'QD UGPIOD :spug nbiuj qj jo uuouuoj,s uiiIi. .o 'usnEqzjo (j
c661 'SttW 1u!i99u!Ua UGSj O 1o1oo-a-co-19HLLu PPU0D %J{ '.1UI2S UUOUUOy pU UOWfljEA 1'flIS P!' VMH (ot
9861 'UOPEUOdSIICJJJO d9Q Sf1 'UOIW13S1UHUp (eMq IPzi 8ZZ-c8-g1-VMHI °N UOI SGpUg J2Mq}{ JOJ EUGW3 WGUJQAON 9jJjO çTJtJ{J (6
L61 '3Q 'uo2uqsB 'uoimiodsuwj , uQuq1BdQ VMHI somt!E±L 2pig Jo so pirn strn aq Amuums tss y, j 1umj (8
i'661 'DSV '2u.iaau.i2ug punpniig j 1spdst juoindwoj :j id 'SUOdSGJ 33S WO.IJ SQJfl$3flJ3S JO UOWUIS9 J9UI1J11 Q( 'pE3SWjQf}{ '>j ejs 'uug '>j o 'uimg (L
1661 icjnf '6LJI-iL1Jdd 'L°N '6Z1°A 'IDUAnOf VVIV '11EWQ SQj U!fl SQJfl3ftI3 JP U1c[ 'P°!"O 0 P T '!M1S @
zoI '01-8 1 'OJOjO3 '1AUQ 'liIc1!cI!p)J 3RP2OO , IBJfl43tU3S PUB S3IUtj3Q 3PS!JEOJJII UO 3SV 'I pQJosuodS 'aU94afUO3 ICJ/17!OddS iiixis aipfo s2u;paao.j
N*GWV U1[ JOJ SUOflEOO'J UQUIGJflSG}4 uawaojdscj ptm aio o uop ' 'Aiut (ç
Z661 JQQWaIdGS '6OZ-66ZZ tic! '6 •°tI 'ot: i°A 'ftJUJflOf VVIJ7r 'uonjnuopj iui.mj 3!WIS m UO!3flPQ JOJi 1OJ $UOiB3O 1UUIJflSBQ} ASION uopj,, 'nqtg - iu o 'idnio ' 'us (17
.s1aQu!ua !!AO D Jco3os U3!1WV am ci pQqs!Iqnd 'c661 ci PidY 'yj 'uosog gj ssa#2uo on.qgfo spaao.ij
'puoiCQg pile 3LIQUI 2ujflqQJ14 'ioup ' ''ues c661 'cc ii.idv 'rjy 'uojsog 'jjji ssa.iuo sacz,wn.q :idsv '11sJn23m1S I11H JOJ QAU3IUISWUON J usoa 5iuiis T T PUB TP'I '!AtU8S (
9661 'tLc-9c ' 0M 'UI bA 'ZUUadUl2U3 luJnpn4sfo IvuAnof :?3SV '11s!sJclcuc AIAflISUG
ioiia : 1Jd UGWGJflS9JA UIJ PS U10J 1113S UOIUII3S J9QUrmd11 "iws T w iu 'iAiu (z
9661 'z9c-ccc ' °!4 'ZZI bA '2u/J29ulZug pzinpn4gfo puinoj '11uopEjnuuoj
ma s1uwainseQJi UIBJ2S WS tUOlJ SaUU3fl.I1 Jo UOUUS 1GUIWtf11 ')jIU19j1 T pu TN 'SUBS (1
SNIII 8
03 ssaooe u p!AoJd JoJ Aouy sasnosj 3IM GOUB2S!SSB UIpIAo1d ioj (JRJ 3uui3mcbcJ Ae&qrj susnqssy 93 pjMompi o PIflOM
Downloaded from SPIE Digital Library on 01 Aug 2011 to 130.64.82.105. Terms of Use: http://spiedl.org/terms