author’s accepted manuscript - researchportal.port.ac.uk · rempstone 1 and old dalby 1 well logs...
TRANSCRIPT

Author’s Accepted Manuscript
Total Organic Carbon Evaluation of the BowlandShale Formation in the Upper Bowland of theWidmerpool Gulf
Michael Kenomore, Mohamed Hassan, HomDhakal, Amjad Shah
PII: S0920-4105(16)30614-3DOI: http://dx.doi.org/10.1016/j.petrol.2016.11.040Reference: PETROL3772
To appear in: Journal of Petroleum Science and Engineering
Received date: 7 October 2016Revised date: 28 November 2016Accepted date: 30 November 2016
Cite this article as: Michael Kenomore, Mohamed Hassan, Hom Dhakal andAmjad Shah, Total Organic Carbon Evaluation of the Bowland Shale Formationin the Upper Bowland of the Widmerpool Gulf, Journal of Petroleum Scienceand Engineering, http://dx.doi.org/10.1016/j.petrol.2016.11.040
This is a PDF file of an unedited manuscript that has been accepted forpublication. As a service to our customers we are providing this early version ofthe manuscript. The manuscript will undergo copyediting, typesetting, andreview of the resulting galley proof before it is published in its final citable form.Please note that during the production process errors may be discovered whichcould affect the content, and all legal disclaimers that apply to the journal pertain.
www.elsevier.com/locate/petrol

Page 1 of 24
Total Organic Carbon Evaluation of the Bowland Shale Formation in the Upper Bowland of
the Widmerpool Gulf.
Michael Kenomore*, Dr Mohamed Hassan, Dr Hom Dhakal, Dr Amjad Shah
University of Portsmouth, School of Engineering, Anglesea Building, Anglesea Road,
Portsmouth, PO1 3DJ
*Corresponding Author.
1 Abstract
Widmerpool Gulf is one of the basins in the carboniferous Bowland Hodder shale in
Central Britain. The area of interest in the Widmerpool Gulf is the Bowland Shale
Formation within the Upper Bowland. This paper focuses on evaluating the total
organic carbon (TOC) from Rempstone 1 and Old Dalby 1 both penetrating the
Bowland Shale Formation using Passey’s delta Log R method. TOC is an essential
property needed to have a productive shale gas play - accurate characterisation of
TOC is critical in evaluating the potential of shale gas reservoirs because it closely
relates to the amount of kerogen and therefore total gas content. Passey’s method
involves the use of well logs to obtain the organic richness i.e. TOC. It relies on the
response of well logs to organic matter using an overlay of porosity logs and
resistivity logs. Which causes a separation i.e. a delta Log R separation. The
reasons for the delta Log R separation in an organic rich reservoir/non reservoir
rocks is due to the presence of low density, high transit time kerogen and the
presence of formation fluid i.e. oil, gas or water. Immature source rocks also observe
a separation but only from the porosity log whilst non source rocks observe no
separation. Rempstone 1 and Old Dalby 1 well logs were exported on Interactive
Petrophysics to analyze the lithology of the intervals before been exported to
Microsoft Excel to evaluate the parameters of Passey’s equation to enable TOC
determination. TOC estimates for the Upper Bowland Shale section in the

Page 2 of 24
Widmerpool Gulf and was found comparable to estimates obtained from British
Geological Society (BGS) RockEval core analysis report. This method proved to be a
suitable way of estimating the total organic carbon using simple well logs.
2 Abbreviation
Tmax (deg C), Maximum Temperature for thermal release of hydrocarbon
3 Keywords: Total Organic Carbon; Widmerpool Gulf; Bowland Shale
Formation; Passey delta Log R; Shale Gas; Unconventional Reservoirs.
4 Introduction
Shale reservoirs are described as unconventional reservoirs because commercial
rates of hydrocarbons cannot be achieved without hydraulic stimulation. Shale is not
a rock type rather it is a term widely used to describe rocks i.e. mudstones that
contain extremely fine grains typically less than 4µm in diameter. Some shales could
also contain different amount of silt size particles which are up to 62.5µm. However
conventional sandstone rocks are composed of grains which can vary between
62.5µm and 2000µm in diameter . These shales contain a variety of mineral grains
e.g. clay, quartz, feldspar, and heavy minerals like pyrite . The composition of these
minerals will be more heterogeneous in mudstones compared to sandstones.
Adequate characterisation of a shale gas formation is needed to have a productive
and commercial play. The work carried out by reported key properties necessary to
have productive shale gas play are illustrated on (Table 1).
Table 1: Essential and Desirable Property of a Shale Gas Play
Essential Property Desirable Property
Organic Richness Brittleness/Mineralogy
Thermal Maturity Permeability

Page 3 of 24
Organic matter type Natural fractures
Free gas
Gas in place
Shale thickness
Low water saturation
Reservoir Pressure
The identification of sweet spots increases the success of the hydraulic fracture
process. Sweet spots are locations on the shale play which possess the essential
and desirable properties. They are notably characterised by low clay volume, mid to
high kerogen content (organic richness), high effective porosity, low water saturation,
high Young’s Modulus and Low Poisson’s Ratio . A petro physical model is then
necessary to obtain a complete evaluation of a shale formation. It typically consists
of open-hole log data calibrated with laboratory core data to build a representation of
the shale gas formation .
This paper focuses on evaluating the total organic carbon (TOC), for the Bowland
Shale Formation in the Upper Bowland using conventional well logs (sonic and
resistivity logs) from two wells namely, Rempstone 1 and Old Dalby 1 (Table 2) using
Passey’s delta Log R method proposed by . The results will then be compared to
laboratory core results to validate the study.
In this paper, mature source rocks consists of the rock matrix, solid organic matter,
and the fluid type contained in the pore space . An immature source rock consists of
the rock matrix, solid organic matter and water contained in the matrix . Non-source
rocks consists of the matrix and formation water within the matrix.

Page 4 of 24
Previous study using this method to evaluate TOC was carried out on the Jurassic
Shales of the Weald Basin but no study was done on the Carboniferous Bowland
Shale hence the need for this paper.
Table 2: Specified intervals of interest
Well Depth Interval MD
(m)
Bowland Hodder
Unit
Basin Located
Old Dalby 1 1270 – 1300 Upper Bowland
Shale Unit
Widmerpool Gulf
Rempstone 1 750-800 Upper Bowland
Shale Unit
Widmerpool Gulf
5 Methods and Materials
1. Well log data were obtained from Rempstone 1 and Old Dalby 1 as they both
penetrated the Bowland Shale Formation in the Upper Bowland. These logs
were exported on Interactive Petrophysics to analyze the lithology of the
intervals before been exported to Microsoft Excel to evaluate the parameters
of Passey’s equation to enable TOC determination (A).
2. Thermal maturity value for the Bowland Shale Formation through Rempstone
1 were not available. However, , provided Tmax values of five samples (at an
average of 437C) at different depths within the Morridge Formation of
Rempstone 1 in the Upper Bowland. Therefore, this value of 437C was
assumed for the Bowland Shale Formation within the Upper Bowland. Using
(Equation 1), Ro was estimated to be 0.71. This resulted in a level of Maturity
(LOM) of 9.33 using (Equation 3).

Page 5 of 24
3. In Old Dalby 1, the thermal maturity of the Bowland Shale Formation was
assumed to be 0.6 (a lower estimate) based on the range between 0.6 and
0.7 suggested by . This resulted in a Level of Maturity (LOM) of 8.45 using
(Equation 3).
4. The baseline sonic and resistivity values were fixed for both wells at 70
and 7ohm-m respectively. The baseline sonic travel time was chosen
arbitrarily as a minimum for both wells based on the sonic travel times across
the specified intervals. This was because, it was impossible to determine the
baseline intervals from the well log data. The challenge sometimes, in defining
the baseline interval needed to implement Passey’s method was also
highlighted by .
5. The cut-offs applied by in the British Geological Society (BGS) Bowland study
for thermal maturity were also used in this paper i.e. Ro values greater than
0.6 indicates thermal maturity for oil and thermal maturity greater than 1.1
indicates thermal maturity for gas. Depths less than 1500m were also
assumed to be immature for gas generation based on criteria.
6 Theory
The shale intervals considered in this paper were from Rempstone 1 and Old Dalby
1 which penetrate the Bowland Shale Formation in the Widmerpool Gulf (or trough)
(Figure 1). According to British Geological Society (BGS) reports, the Widmerpool
Gulf, generally exhibit high TOC’s (> 3wt. %) compared to other basins within the
Bowland Hodder Shale.

Page 6 of 24
Figure 1: Location of basins and wells within the Bowland Hodder Shale
The depth intervals of interest all exhibited high gamma ray signatures and
correlation from , (Figure 2)
Figure 2: Bowland Shale Formation across Rempstone 1 and Old Dalby 1
Page 7 of 24
These shales typically began as organic rich muds which are deposited in marine
environments, in lakes, or in swamps and mires along sea or lake margins . The
presence of organic matter make shales source rocks - source rocks like shales1
contain appreciable amounts of organic matter, up to 50wt%, while non-source rocks
also contains some organic matter but are not significant i.e. less than 1wt%
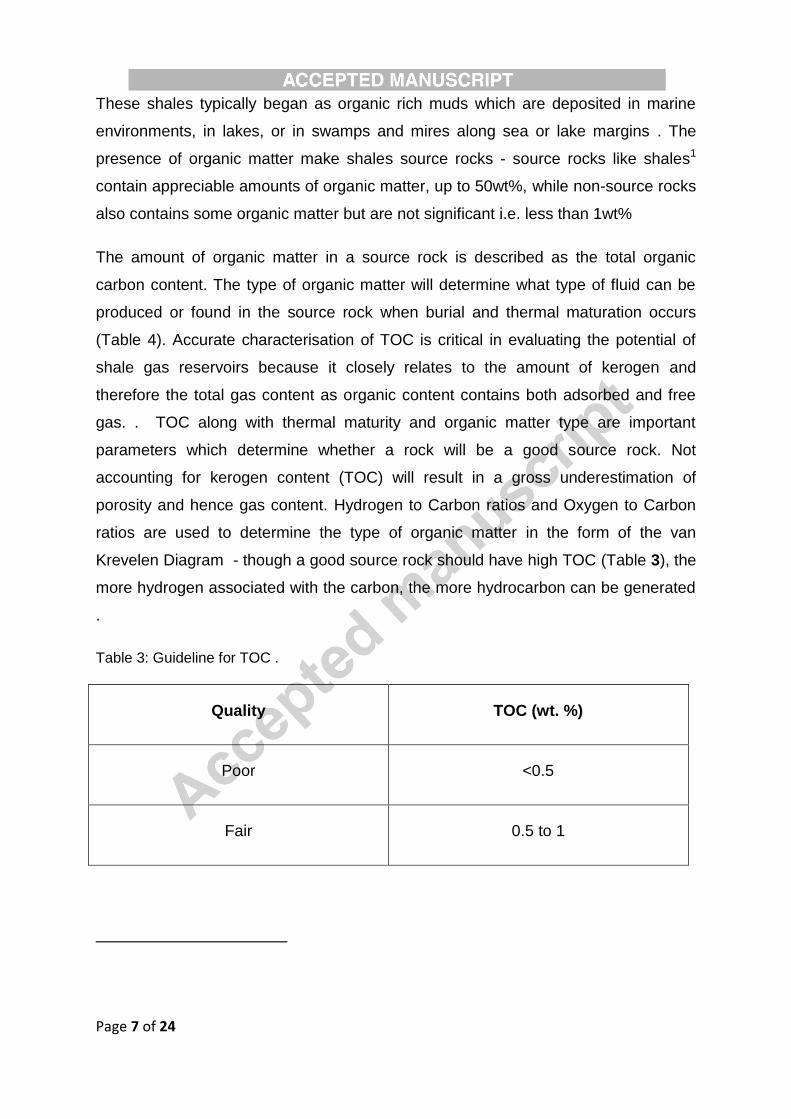
The amount of organic matter in a source rock is described as the total organic
carbon content. The type of organic matter will determine what type of fluid can be
produced or found in the source rock when burial and thermal maturation occurs
(Table 4). Accurate characterisation of TOC is critical in evaluating the potential of
shale gas reservoirs because it closely relates to the amount of kerogen and
therefore the total gas content as organic content contains both adsorbed and free
gas. . TOC along with thermal maturity and organic matter type are important
parameters which determine whether a rock will be a good source rock. Not
accounting for kerogen content (TOC) will result in a gross underestimation of
porosity and hence gas content. Hydrogen to Carbon ratios and Oxygen to Carbon
ratios are used to determine the type of organic matter in the form of the van
Krevelen Diagram - though a good source rock should have high TOC (Table 3), the
more hydrogen associated with the carbon, the more hydrocarbon can be generated
.
Table 3: Guideline for TOC .
Quality TOC (wt. %)
Poor <0.5
Fair 0.5 to 1

Page 8 of 24
Good 1 to 2
Very good 2 to 4
Excellent >4
Table 4: Characteristics of the main types of Kerogen .
Kerogen Type H:C Ratio O:C Ratio Origin of
Organic
Material
Fluid Type
Type I 1.7-0.3 0.1-0.02 Algal sources in
lakes and
lagoons
Light high
quality oil
Type II 1.4-0.3 0.2-0.02 Mixture of plant
debris,
phytoplankton
and bacteria in
marine
sediments
Main and
common
source of
crude oil.
Type III 1.0-0.3 0.4-0.02 Land plants in
coaly
sediments
Predominantly
natural gas
Type IV 0.45-0.3 0.3-0.02 Oxidised plant
remains and
charred wood
from forest fires
No petroleum
potential

Page 9 of 24
The Bowland Shale Formation across both wells i.e. Rempstone 1 and Old Dalby 1
were generally classified as containing Type II Kerogen . These shales are deposited
in marine conditions and typically contain large quantities of uranium, which is a
good indicator of organic richness. The high uranium content contributes to very high
gamma ray intensity (> 200API was observed in the specified intervals of interest) in
Type II shales). As hydrocarbons can be generated from these shales, they are
described as source rocks - all the oil/gas trapped in conventional reservoirs around
the world have been generated from these source rocks. For shale gas reservoirs,
the gas is unable to migrate to conventional traps for various reasons:
The ultra-low permeability nature tends to limit migration
Absence of migration path due to regional geological processes (Figure 3)
Figure 3: Extensive sections of the shale source rock have no migration
6.1 Thermal Maturity (Ro)
Thermal maturity represents an essential property necessary to identify a productive
shale gas play. It indicates the maximum temperature reached by a source rock
during burial over time as well as the thermal stress on the kerogen over time which
controls the rate of organic matter transformation to hydrocarbons. “Vitrinite
reflectance is the most common method of evaluating thermal maturity and is
performed through microscopic inspection of kerogen and analysis of the reflectivity
of the particles using a photomultiplier ”.

Page 10 of 24
Another method to evaluate thermal maturity is the RockEval Tmax which can be
converted into a Vitrinite reflectance equivalent value (Equation 1).
(Equation 1)
‘Ro values from 1.1 – 3.5% are widely accepted as the ‘gas window’ (Figure 4) .
Figure 4: Thermal Maturity
6.2 Passey’s Delta Log R Method
Passey’s method simply involves the use of well logs to obtain the organic richness.
It relies on the response of well logs to organic matter using an overlay of porosity
logs and resistivity logs. This method showed that a combination of sonic curve and
resistivity curve provided the best results as the sonic log is not severely affected by
in-hole conditions compared to the density or neutron readings. An overlay of sonic
and resistivity curve over a mature organic rich intervals causes a separation i.e. a

Page 11 of 24
delta Log R separation occurs (Equation 2) (Figure 5). The delta Log R separation is
directly proportional to TOC and is a function of maturity(Equation 3 and 4). This
means that the separation can be converted to TOC providing the Level of Maturity
(LOM) is known – the latter is dependent on estimating thermal maturity through
Tmax or Ro (Equation 3).
(
)
(Equation 2)
(Equation 3)
(Equation 4)
Prior to overlaying the curves, the curves need to be appropriately scaled such that 1
resistivity cycle corresponds to -50 (-164 . After scaling, the curves also
needs to be base lined – a baseline condition occurs when the curves directly overlie
each other or track each other in a fine grained non–source rock over a significant
depth range. A baseline interval is an interval with approximately zero or minimum
TOC (~0.8 wt. %). In this paper, the background TOC of (~0.8 wt. %) were not added
to the TOC value estimated.
There are two reasons for the delta Log R separation in an organic rich reservoir/non
reservoir rocks;
1. The porosity curve responds to the presence of low density, high transit
time kerogen;
2. While the resistivity curve respond to the formation fluid i.e. oil or gas.

Page 12 of 24
In an immature organic rich rock with no hydrocarbons generated, a separation also
occurs but only from the porosity curve(Figure 5).

Page 13 of 24
Figure 5: Bowland Shale Formation Delta Log R separation in Rempstone 1 (top)
and Old Dalby 1 (bottom)
SONIC
LLD
GR
SONIC LLD GR

Page 14 of 24
The original empirical equation developed by Passey in 1990 (Equation 4) was
calibrated for source rocks in the oil maturity window i.e. for Ro values between 0.6-
0.9 and Level of Maturity (LOM) 6-10.5. Therefore, using this equation in over
mature intervals i.e. Level of Maturity (LOM) >10.5 or Ro>0.9 can lead to
underestimation of TOC.
A correction multiplier greater than or equal to 1 was proposed by to account for the
original limitation. Core data is needed to evaluate the magnitude of the multiplier.
6.2.1 Log response to shale gas reservoirs
There are key signatures which needs to be observed from the well logs before
implementing the Passey delta Log R method (Table 5).
Table 5: Logging tool response in organic rich reservoirs
Logging Tool Response in Shale Gas
Reservoirs/Organic rich intervals
Gamma Ray Log High Gamma Ray values often greater
than 70API.
Density Log In organic rich intervals, low density
readings will be observed compared to
the surrounding rock matrix.
Sonic Log Increased transit time is observed in
organic rich intervals.
Neutron Log Organic matter increases the apparent
neutron porosity – increased hydrogen

Page 15 of 24
content.
Resistivity Log Organic matter is not conductive
therefore resistivity increases in the
presence of TOC. As maturation
increases, resistivity increases rapidly
(e.g. in gas).
6.2.2 Anomalous Delta Log R Separation
6.2.2.1 Influence of Pyrite
When Pyrite is present in the organic rich intervals, TOC is underestimated using
Passey’s method . This is because Pyrite is conductive and reduces the resistivity of
the rock and subsequently reduces the Delta Log R term hence TOC declines .
Pyrite has a very high density approximately 5g/cm3 and no density up to 5 g/cm3
was observed in the intervals studied across the two wells in this paper.
6.2.2.2 Reservoir Intervals
Sandstone intervals can sometimes show a high gamma ray intensity due to the
presence of feldspar or mica which can be mistaken for the presence of organic
matter. However absence of high transit times (greater than 230 ) tend to
suggest the absence of organic matter. In this situation, neutron-density cross plot or
other log methods can be used to distinguish between organic rich or lean zones. In
this paper, only organic rich shale zones were considered.

Page 16 of 24
6.2.2.3 Poor Boreholes
Poor boreholes can cause cycle skipping which would result in anomalous delta log
R values. When transit times exceed approximately 150 (500 ) . This
transit time value is also applicable to uncompacted shales. No value exceeding
150 (500 ) was observed in this paper (A).
6.2.2.4 Low Porosity Intervals
When the porosity of the formation is less than 3-4%, the resistivity increases greatly
because of the absence of electrically conducting fluid - hence delta log R separation
can be very high and should not be used . According to , these low porosity intervals
can easily be identified by their short transit times, around, 50-55 or 164-
180 . In this paper, no transit times were used within that range (A).
7 Results and Discussions
7.1 Rempstone 1
In this paper, an average TOC value of 4.2 wt. % was obtained for Rempstone 1
using Passey’s delta log R method compared an average TOC value of 5 wt. % from
British Geological Society (BGS) RockEval core analysis (Figure 6) – this
represented a 0.8wt. % difference compared to the value obtained from core
analysis. This variation was because the thermal maturity used in core analysis was
from a shallower depth (Morridge Formation) within the Upper Bowland (Figure 2)
and was then assumed to be the same for the depth interval considered in this
paper. Owing to the multiple subsidence and inversion experienced in the Bowland
Hodder Shale, the linear relationship between Ro and depth does not always hold
across the area hence thermal maturity could have been higher or lower. Another
reason for the difference could be associated with the shallower depths (665m to
668m) from which the samples used were obtained for core analysis compared to
depth interval (750m to 800m) used in this paper using Passey’s method hence
there could have been some maturation of organic matter which reduced the value
obtained using Passey’s method.

Page 17 of 24
Of the sixteen selected wells chosen for TOC analysis by British Geological Society
(BGS), the wells i.e. Rempstone 1 and Old Dalby 1 within the Widmerpool Gulf
exhibited higher TOC values compared to other basins (Figure 6).
Figure 6: Core analysis TOC values from the British Geological Society (BGS)
7.2 Old Dalby 1
The value obtained for Old Dalby 1 from Passey’s method in this paper was 3.7 wt.
% compared to the core analysis estimate of 3.5 wt. % obtained from British
Geological Society (BGS) RockEval core analysis (Figure 6) – this represents a
minor difference between both methods. It is important to note that the average
value of TOC from core analysis was predominantly from the Lower Bowland at a
greater depth (1390m to 1455m) compared to depths of 1270m to 1295m from the
Upper Bowland used in this paper hence maturation in the lower section could have
resulted in the reduction of organic carbon content. The thermal maturity value for
Old Dalby 1 was also assumed (see section 2) which might have had an influence on
the results.

Page 18 of 24
The final summary of results from this paper are shown on Table 6. For the full set of
data used to obtain the data on Table 6, please see appendix A
Table 6: Final summary of results
Well Name Baseline Values Thermal
Maturity
TOC Range
(wt. %)
Average TOC
(wt. %)
Rempstone 1 70 , 7ohm-
m
0.71 2.61 - 7.04 4.2
Old Dalby 1 70 , 7ohm-
m
0.60 2.71 - 4.48 3.7
The maximum TOC obtained for upper Bowland in the Widmerpool Gulf (or Trough)
in this paper was 7 wt. % similar to a maximum of 8 wt. % obtained by British
Geological Society (BGS). Results from this paper showed that Passey’s method is a
suitable method to estimate total organic carbon as the value bears a close
resemblance to estimates obtained from core analysis by British Geological Society
(BGS).
8 Conclusion
Based on the findings observed from this paper, the following conclusions were
evident;
1. The TOC values obtained for the Bowland Shale Formation through both
wells were both in the range of “very good to excellent” based on the
guidelines by in section 3.
2. The average TOC obtained for the Bowland Shale Formation in the Upper
Bowland between 3.7wt. % - 4.2wt %. A maximum of 7 wt. % was observed

Page 19 of 24
compared to 8 wt. % observed by British Geological Society (BGS) for the
Bowland Shale.
3. Passey’s method, yet simple, poses a challenge when attempting to find the
baseline interval needed to estimate TOC.
4. Passey’s method provided a good and economic alternative to obtaining total
organic carbon content in the absence of core analysis.
9 Acknowledgements
We would like to thank Kayode Adeoye-Akinde on helping to proof read the paper.
This research did not receive any specific grant from funding agencies in the public,
commercial, or not-for-profit sectors.
10 Appendix A
Table of Results for Old Dalby 1
Depth (m) Sonic us/ft. Resistivity (ohm-m) Delta Log R TOC wt. %
1270 91.6874 10.2714 0.600279602 4.48428892
1271 89.8771 8.4765 0.480660526 3.59069451
1272 79.4791 10.4365 0.363038837 2.712021248
1273 71.4778 15.3735 0.371230712 2.773217286
1274 75.8588 15.6039 0.465311118 3.476029311
1275 80.0399 13.7966 0.495472033 3.701341408
1276 83.6214 11.2297 0.477698114 3.568564304
1277 86.005 11.2416 0.525830088 3.928126208
1278 85.5928 12.0574 0.548011629 4.093829717
1279 88.7749 9.9505 0.528244864 3.94616539

Page 20 of 24
1280 89.7601 10.382 0.566384985 4.231084816
1281 85.7537 10.1105 0.474748594 3.546530399
1282 87.3383 9.5782 0.482951861 3.607811546
1283 86.9258 11.7923 0.565016479 4.220861625
1284 82.121 13.3657 0.523313669 3.909327717
1285 76.9171 15.1473 0.473579187 3.537794542
1286 85.2898 11.6678 0.527686936 3.941997482
1287 88.2718 9.1125 0.479975501 3.585577145
1288 89.2572 8.6328 0.47619764 3.557355256
1289 88.6454 7.5287 0.404529952 3.021973717
1290 85.2383 9.528 0.438669708 3.27700909
1291 87.2219 9.8223 0.491553155 3.672066077
1292 88.4068 10.0901 0.52693343 3.936368543
1293 88.3937 10.3833 0.539111362 4.027341756
1294 87.7819 10.6853 0.53932668 4.028950252
1295 77.788 15.7372 0.507589424 3.791862362
Table of Results for Rempstone 1
Depth (m) Sonic (us/ft.) Resistivity (ohm-
m)
Delta Log R TOC wt.%
750 93.9611 9.8491 0.627520507 3.329844269

Page 21 of 24
751 106.667 9.7256 0.876158364 4.649204088
753 103.2289 7.7317 0.707754954 3.755596436
755 87.5398 13.5578 0.637887183 3.384853495
756 80.651 16.1406 0.575841635 3.055618018
758 87.8866 15.8278 0.712054514 3.778411408
760 80.5315 28.9258 0.826817339 4.387383277
762 75.6959 37.5516 0.843448406 4.475633562
763 86.0427 13.9973 0.621800231 3.299490474
764 109.2029 10.1328 0.944689431 5.012854006
765 95.1128 11.0421 0.700209636 3.715558325
767 86.972 16.952 0.723562904 3.839478968
769 80.7835 23.419 0.740140307 3.927444492
770 82.563 23.1457 0.77063228 4.089245614
772 100.392 10.45 0.78185825 4.148814558
774 97.3705 12.447 0.79737665 4.231160636
775 97.9786 12.2616 0.803021104 4.261112096
776 98.9368 12.5432 0.832046307 4.415130019
777 98.8651 13.269 0.855042154 4.537154062
779 77.1984 15.6095 0.492258952 2.612098939
781 81.6273 26.4181 0.80934954 4.294692997
782 94.9801 13.395 0.781446678 4.14663061
783 93.5974 12.9858 0.74031867 3.92839095

Page 22 of 24
784 98.1938 10.718 0.748891713 3.973882527
786 94.8936 12.5919 0.752865226 3.994967385
788 95.0061 13.4175 0.782695564 4.153257638
789 91.5293 17.7336 0.834284868 4.427008611
793 94.239 15.7375 0.836617703 4.439387452
794 94.1194 16.2927 0.849283021 4.506594077
795 92.5199 20.0116 0.906581773 4.810641389
796 91.4575 31.5033 1.082408009 5.743637165
798 90.611 21.1525 0.892483664 4.735831866
800 74.8339 118.6324 1.325783276 7.035071837
References
Andrews, I.J. 2013. The Carboniferous Bowland Shale Gas Study: geology and
resource estimation. London: British Geological Survey/Department of Energy
and Climate Change.
Chelini, Valter, Maurizio, Mele Muttoni Alda, Elio Rossi, Roberto Galimberti, and
Andrea Ortenzi. 2010. “Gas Shale Reservoir Characterisation: A North Africa
Case.” SPE 134292 1-12.
GeoExpro. 2013. GeoExpro. Accessed July 2, 2015.
www.geoexpro.com/articles/2013/09/a-workflow-for-success-in-shales.
Jenkins, Creties D, and Charles, M Boyer II. 2008. “Coal Bed and Shale Gas
Reservoirs.” SPE Distinguised Author Series 1-8.
Kundert, Donald, and Mike Mullen. 2009. “Proper Evaluation of Shale Gas
Reservoirs Leads to a More Effective Hydraulic Fracture Stimulation.” SPE
123586 1-11.

Page 23 of 24
Liu, Yexin, Zhuoheng Chen, Kezhen Hu, and Chris Liu. 2013. Quantifying total
organic carbon (TOC) from well logs using support vector regression.
Canada: CSPG/CSEG/CWLS/Geoconvention, AAPG Search and Discovery .
Passey, Q,R, K,M Bohacs, W,L Esch, R Klimentidis, and S Sinha. 2010. “From Oil-
Prone Source Rock to Gas-Producing Shale Reservoir - Geologic and
Petrophysical Characterization of Unconventional Shale Gas Reservoirs.”
SPE131350 1-29.
Passey, Q.R, S Creaney, J.B Kulla, F.J Moretti, and Stroud J.D. 1990. “A Practical
Model for Organic Richness From Porosity and Resistivity Logs.” The
Association of Petroleum Geologists Bulletin, 14 August: 1777-1794.
Ruble, Tim, and Richard J, Heck, William, A Drozd. 2015. Practical Geochemical
Methods to Assess Unconventional Reservoirs. Weatherford International Ltd.
doi:http://www.wtgs.org/files/245/.
Sondergeld, C.H, K.E Newsham, J.T Comisky, M.C Rice, and C.S Rai. 2010.
“Petrophysical Considerations in Evaluating and Producing Shale Gas
Resources.” SPE 131768 1-34.
The Open University. 2015. Open Learn. Accessed August 13, 2015.
http://www.open.edu/openlearn/science-maths-
technology/science/environmental-science/earths-physical-resources-
petroleum/content-section-2.1.2.
TOTAL. 2015. Energise and Expertise - Atypical Reservoirs. Accessed August 13,
2015. http://www.total.com/en/energies-expertise/oil-gas/exploration-
production/strategic-sectors/unconventional-gas/presentation/three-main-
sources-unconventional-gas.
Witkowsky, Jim, James Galford, John Quirein, and Jerome Truax. 2012. “Predicting
Pyrite and Total Organic Carbon from Well Logs for Enhancing Shale Reservoir
Interpretation.” SPE 161097 1-14
Highlights

Page 24 of 24
Passey’s delta Log R method can be used to evaluate total organic
carbon using simple logs in the absence of core geochemical results.
Accurate selection of the baseline values in the Passey’s method is
essential in obtaining accurate results.
The Bowland Shale Formation had a very good to excellent source
rock quality based on the estimates of total organic carbon content
obtained.
Results from Passey’s method was found comparable to core analysis
estimates and was deemed suitable in estimating total organic carbon.