author query form - unipa · 2019-11-12 · author query form book title: (m39) the eruption of...
TRANSCRIPT

Author Query Form
Book title: (M39) The Eruption of Soufriere Hills Volcano, Montserrat from 2000 – 2010Author: D. Delle Donne et al.Chapter: 09
The following queries have arisen during copy-editing your manuscript. Please provide ananswer in the right-hand column below and on your proofs. Many thanks for your help.
QueryNo.
QueryResponse
Q1 Please check this proof carefully for other errors because onceit is published online the only further change will be the additionof page numbers. In particular, check that figures, tables andequations are correct. Also, please check your proof to ensureyou have acknowledged your funding source (if applicable).
Q2 Please check that the meaning of this sentence has not beenchanged.
Q3 We have changed Druitt et al. 2003 to Druitt et al. 2002 as perthe References, is this correct? If not, please insert fullpublication details of Druitt et al. 2003 into the References anddelete here.
Q4 Are these velocities a range (i.e. 20 to 55–75 m s21)? Pleaseclarify the meaning here.
Q5 Please cite Garces et al. 1999 in the text or delete here.

123456789101112131415161718192021222324252627282930313233343536373839404142434445464748495051525354555657585960616263646566676869
Chapter 9
Thermal, acoustic and seismic signals from pyroclastic density currents and Vulcanianexplosions at Soufriere Hills Volcano, MontserratQ1
D. DELLE DONNE1, M. RIPEPE1*, S. DE ANGELIS2, P. D. COLE3,4,
G. LACANNA1, P. POGGI5 & R. STEWART4
1Dipartimento Scienze della Terra, Universita’ di Firenze, via G. La Pira, 4, 50121 Firenze, Italy2Geophysical Institute University of Alaska Fairbanks 903 Koyukuk Drive, Fairbanks, AK 99775-7320, USA
3Montserrat Volcano Observatory, Flemmings, Montserrat, West Indies4Seismic Research Centre, The University of the West Indies, St Augustine, Trinidad & Tobago, West Indies
5INO (Istituto Nazionale di Ottica), Largo E. Fermi, 6, 50125 Firenze, Italy
*Corresponding author (e-mail: [email protected])
Abstract: We show two examples of how integrated analysis of thermal and infrasound signal can be used to obtain, in real time, infor-mation on volcanic activity. Soufriere Hills Volcano (SHV) on Montserrat offers the opportunity to study a large variety of processesrelated to lava-dome activity, such as pyroclastic density currents (PDCs) and large Vulcanian eruptions. Infrasound and thermal analysisare used to constrain the propagation of PDCs and their velocities, which are calculated here to range between 15 and 75 m s21. Duringthe Vulcanian eruption of 5 February 2010, infrasound and thermal records allow us to identify an approximately 13 s seismic precursorpossibly related to the pressurization of the conduit before the explosion onset. The associated very long period (VLP) seismic signal iscorrelated with the gas-thrust phase detected by thermal imagery, and may reflect change in the upwards momentum induced by the massdischarge. Moreover, from infrasound and thermal analysis, we estimate a gas-thrust phase lasting 22 s, with an initial plume velocity ofapproximately 170 m s21 and a mean volumetric discharge rate of 0.3 � 105–9.2 � 105 m3 s21. This information provided in real timegives important input parameters for modelling the tephra dispersal into the atmosphere.
Lava-dome eruptions represent a style of volcanism of distinctiveinterest because of their potential consequences, such as the gener-ation of pyroclastic density currents (PDCs) down the volcano’sflanks and large explosive eruptions following partial-dome col-lapse. Lava domes are formed by silica-rich lava that is tooviscous to flow and, instead, builds-up over the point of extrusion.The hazards from lava-dome eruptions are well known owing tounpredictable transitions from the slow extrusion of viscous lavato vigorous explosions, and to the propensity of lava domes tosuddenly collapse, spawning devastating PDCs down the flanksof volcanic edifices (Young et al. 1998; Sparks & Young 2002).As a lava dome grows, parts of it may collapse because of gravita-tional instability or as the result of gas explosions within the domeitself, thus forming PDCs. The ability to detect and track the propa-gation of these fast-moving density currents is of utmost impor-tance in understanding the evolution of lava-dome eruptions andmitigating related hazards.
Methods for the location of PDCs, based on seismic amplitudes,have been proposed in the past (e.g. Jolly et al. 2002) and haveproved quite effective for the characterization of large collapseevents. These techniques require dense seismic networks andoptimal azimuthal coverage; both conditions are rarely met onlava dome volcanoes where seismic networks are sparse becauseof the restrictions imposed by rough terrain and eruptionhazards. The use of seismic amplitudes requires understandingof local site effects and frequency-dependent attenuation, thusintroducing another layer of complexity. Finally, these methodsare not designed for unsupervised application in real-time;events classification and location require visual inspection of theseismograms, and manual intervention of a seismic analyst.
Ripepe et al. (2009) recently demonstrated the use of infrasoundarray technology to detect and track the evolution of PDC activityin real time. In this chapter we extend their work by introducingmethods based on the integrated analyses of thermal imageryand an infrasound array data to evaluate, with unprecedented
resolution, the propagation velocity of PDCs. We show ourresults are in good agreement with predictions from theoreticalmodels.
We use a thermo-acoustic method to constrain the duration ofthe gas-thrust phase, and the plume exit velocities at the ventduring a Vulcanian eruption. Here we show how the integratedinfrasound and thermal analysis for a large Vulcanian eruptionthat occurred at Soufriere Hills Volcano (SHV) on 5 February2010 helps to better understand the associated seismic signal.Our aim is also to give an estimate of the plume exit velocityand volume flux that are important input parameters for thetephra dispersal predictive models evaluating the amount of vol-canic ash emitted into the atmosphere.
Thermal camera and infrasonic array at MVO
A thermal camera and an infrasound array (Fig. 9.1) wereco-located at Montserrat Volcano Observatory (MVO) at a dis-tance of approximately 5.6 km from SHV. The camera is a FLIRA20 model, and is equipped with 348 � 258 optical lens of9.2 mm and a maximum thermal resolution of 0.1 8C in the 7.5–13 mm wavelength interval. The camera field of view (FOV)above SHV is approximately 3.5 � 2.5 km, and it allows monitor-ing of both PDC activity towards the west (Plymouth), the NE(Old Airport) and to the north (Tyre’s Ghaut and Belham Val-ley) as well as the explosive activity (Fig. 9.1). The thermalimage acquisition and processing system has been designed tofulfil the specific needs of the MVO personnel, and is able toprocess, in real time, the large 352 � 244 pixel thermal imagesat two frames s21. A global positioning system (GPS) time-stampon each frame allows synchronization with all other sensorsrecorded by the MVO seismic network (Luckett et al. 2007).This allows successful integration of thermal camera informationwithin the MVO monitoring network, thus assisting observatory
From: Wadge, G., Robertson, R. E. A. & Voight, B. (eds) 2014. The Eruption of Soufriere Hills Volcano, Montserrat from 2000 to 2010.
Geological Society, London, Memoirs, 39, 167–176. http://dx.doi.org/10.1144/M39.9
# The Geological Society of London 2014. Publishing disclaimer: www.geolsoc.org.uk/pub_ethics
707172737475767778798081828384858687888990919293949596979899100101102103104105106107108109110111112113114115116117118119120121122123124125126127128129130131132133134135136137138
staff with decision making during volcanic crises. This couldinclude providing advice to local authorities about the ongoingeruptive activity, and prompting the evacuation of local populationfrom areas potentially at risk from PDCs.
Volcanic activity is also monitored by an infrasonic arrayinstalled close to the MVO (Fig. 9.1) and at the same distance,approximately 5600 m, from the SHV lava dome. The array hasa four-element ‘L’ geometry, with a total aperture of 220 m.Each element of the array is equipped with ‘Item-prs’ differentialpressure transducers, with a sensitivity of 25 mV Pa21 at 1 Hz,250 Pa of full-scale range, a flat instrument response in the fre-quency band of 0.01–100 Hz, and a noise level of 1022 Pa. Theinfrasonic signals are digitized with a resolution of 16 bits at50 Hz sampling rate. The satellite sensors are connected to thereceiver unit by fibre-optic cables. The use of fibre-optic technol-ogy provides an optimal signal-to-noise ratio (SNR), and protectsthe network from lightning hazards. Data are sent via RS-232 tothe MVO where they are also processed in real time, archivedand broadcast via the Internet (Ripepe et al. 2010).
Thermal image processing
Thermal imagery is processed measuring both the propagationvector field of PDCs and the upwards velocities of the tephra-plume. This is accomplished by: (1) converting thermal pixels tometres; (2) back-projecting pixels to the topography using adigital elevation model (DEM); and (3) tracking the vertical andhorizontal propagation of the thermal anomalies associated withPDCs and volcanic plumes in successive frames.
The processing used is based on the thermal analysis method ofsingle images. This method analyses the propagation front at
different temperature levels (Marchetti et al. 2009; Pistolesiet al. 2011; Delle Donne & Ripepe 2012). In summary, thermalimages, It(t, x, y) are converted into binary images, Ib(t, x, y)(Fig. 9.2) according to the following formulae:
Ib(t; x; y)
1; It(t; x; y) . Tbkg
0; It(t; x; y) � Tbkg
8<:
9=; ð1Þ
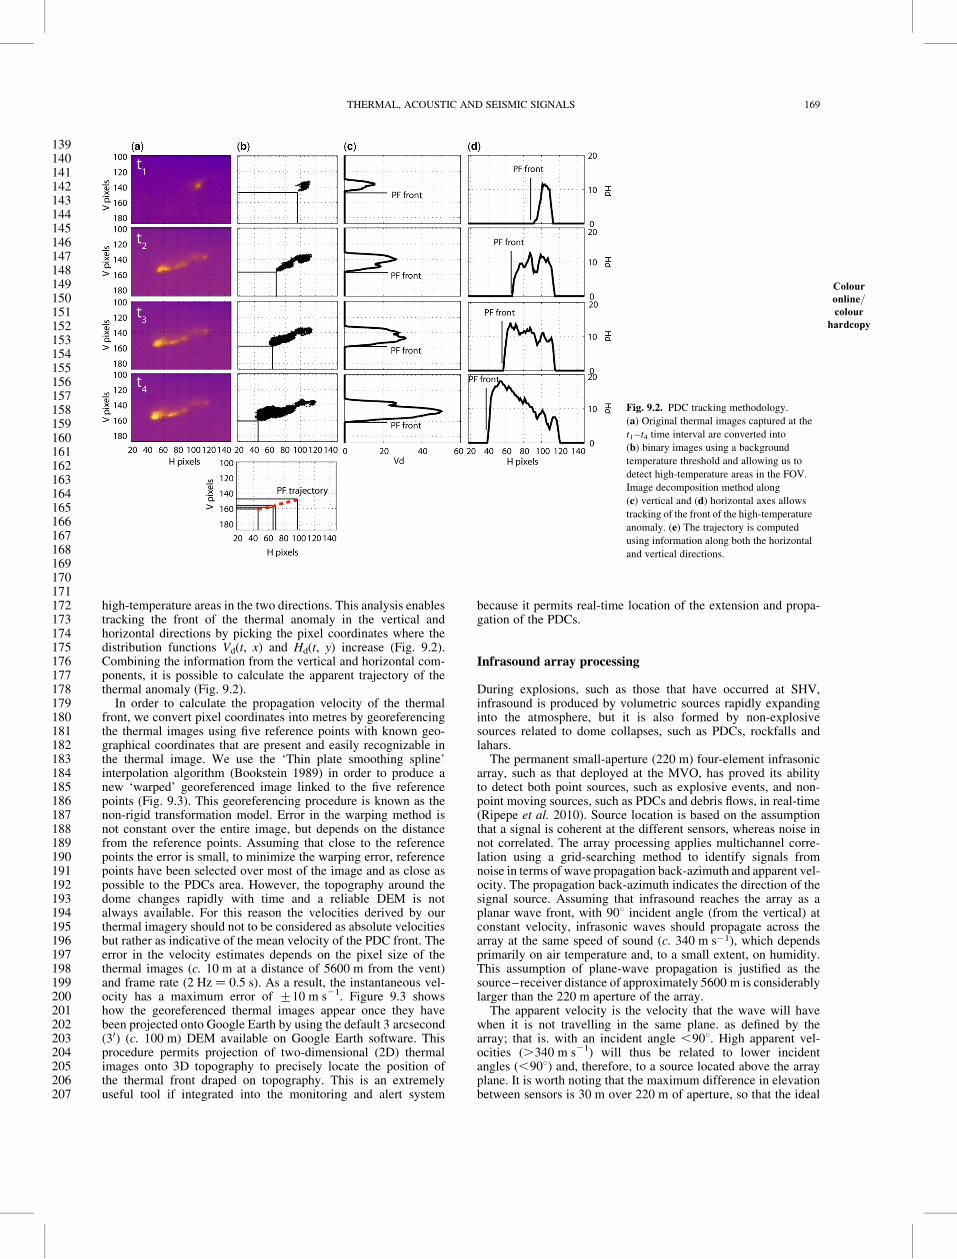
where Tbkg is the ambient background temperature. Thus, for eachframe It(t) we obtain the distribution (x, y) of pixels characterizedby temperatures higher than the background Tbkg and consider thatthey are related to volcanic material (e.g. pyroclasts, juvenile ash).It is worth noting that the temperatures given by thermal imagesare apparent because the cores of PDCs or volcanic plumes canbe masked by the cloud exterior. We then estimate the high-temperature pixel distribution in the vertical, Vd, and horizontal,Hd, axis by adding up all the pixels, Ib, along the same row andfor each column of the image (Fig. 9.2):
Vd t; xð Þ ¼Py¼Y
y¼1
Ib t; x; yð Þ
Hd t; yð Þ ¼Px¼X
x¼1
Ib t; x; yð Þð2Þ
where X and Y are the horizontal (352 pixels) and the vertical(244 pixels) size of the image, respectively. Vd(t, x) and Hd(t, y)are the distribution functions representing the number of pixelswith temperature above Tbkg along every horizontal and verti-cal line in the FOV, and thus represent the extension of the
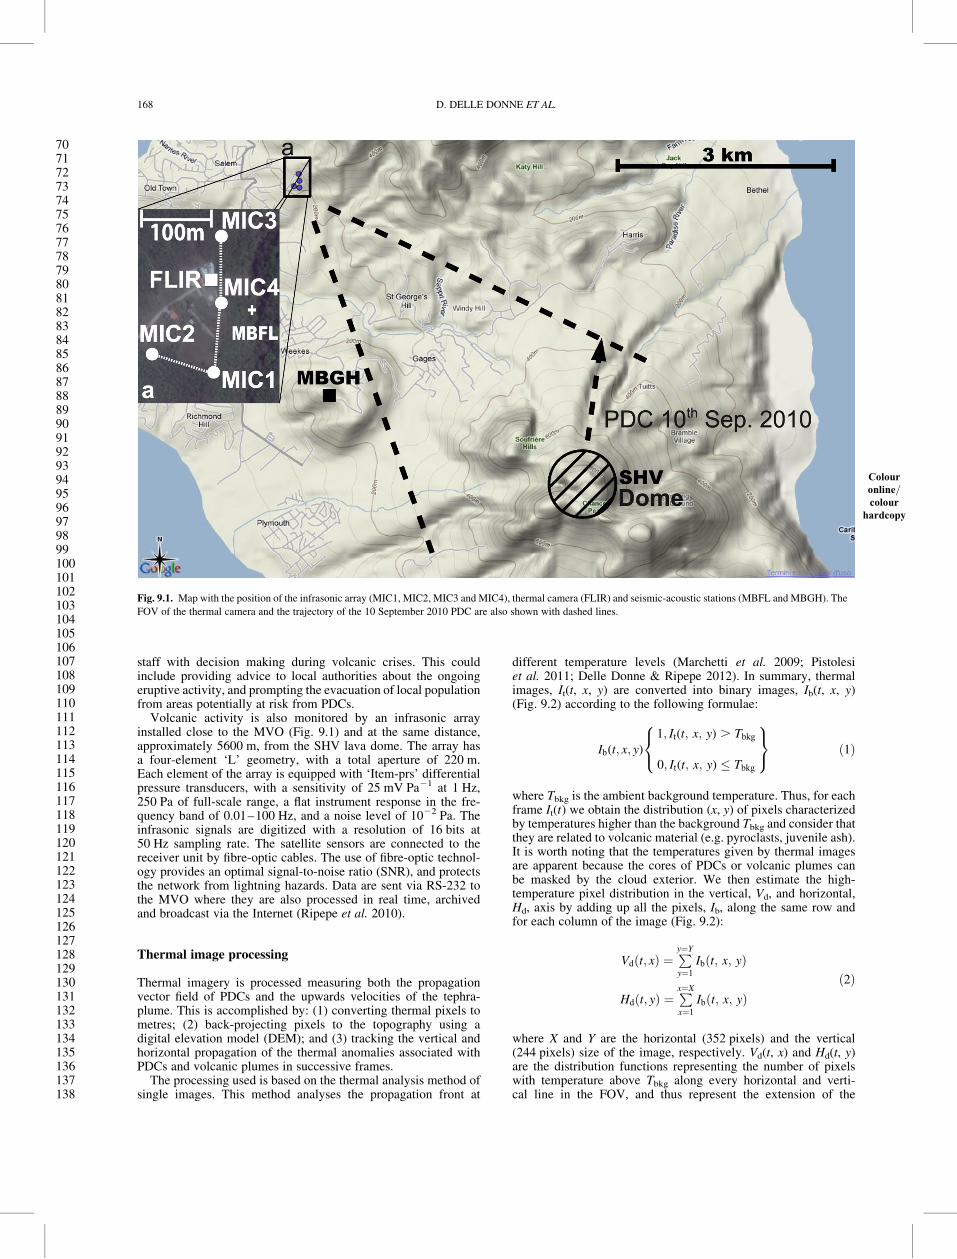
Fig. 9.1. Map
Colour
online=colour
hardcopy
with the position of the infrasonic array (MIC1, MIC2, MIC3 and MIC4), thermal camera (FLIR) and seismic-acoustic stations (MBFL and MBGH). The
FOV of the thermal camera and the trajectory of the 10 September 2010 PDC are also shown with dashed lines.
D. DELLE DONNE ET AL.168
139140141142143144145146147148149150151152153154155156157158159160161162163164165166167168169170171172173174175176177178179180181182183184185186187188189190191192193194195196197198199200201202203204205206207
high-temperature areas in the two directions. This analysis enablestracking the front of the thermal anomaly in the vertical andhorizontal directions by picking the pixel coordinates where thedistribution functions Vd(t, x) and Hd(t, y) increase (Fig. 9.2).Combining the information from the vertical and horizontal com-ponents, it is possible to calculate the apparent trajectory of thethermal anomaly (Fig. 9.2).
In order to calculate the propagation velocity of the thermalfront, we convert pixel coordinates into metres by georeferencingthe thermal images using five reference points with known geo-graphical coordinates that are present and easily recognizable inthe thermal image. We use the ‘Thin plate smoothing spline’interpolation algorithm (Bookstein 1989) in order to produce anew ‘warped’ georeferenced image linked to the five referencepoints (Fig. 9.3). This georeferencing procedure is known as thenon-rigid transformation model. Error in the warping method isnot constant over the entire image, but depends on the distancefrom the reference points. Assuming that close to the referencepoints the error is small, to minimize the warping error, referencepoints have been selected over most of the image and as close aspossible to the PDCs area. However, the topography around thedome changes rapidly with time and a reliable DEM is notalways available. For this reason the velocities derived by ourthermal imagery should not to be considered as absolute velocitiesbut rather as indicative of the mean velocity of the PDC front. Theerror in the velocity estimates depends on the pixel size of thethermal images (c. 10 m at a distance of 5600 m from the vent)and frame rate (2 Hz ¼ 0.5 s). As a result, the instantaneous vel-ocity has a maximum error of +10 m s21. Figure 9.3 showshow the georeferenced thermal images appear once they havebeen projected onto Google Earth by using the default 3 arcsecond(30) (c. 100 m) DEM available on Google Earth software. Thisprocedure permits projection of two-dimensional (2D) thermalimages onto 3D topography to precisely locate the position ofthe thermal front draped on topography. This is an extremelyuseful tool if integrated into the monitoring and alert system
because it permits real-time location of the extension and propa-gation of the PDCs.
Infrasound array processing
During explosions, such as those that have occurred at SHV,infrasound is produced by volumetric sources rapidly expandinginto the atmosphere, but it is also formed by non-explosivesources related to dome collapses, such as PDCs, rockfalls andlahars.
The permanent small-aperture (220 m) four-element infrasonicarray, such as that deployed at the MVO, has proved its abilityto detect both point sources, such as explosive events, and non-point moving sources, such as PDCs and debris flows, in real-time(Ripepe et al. 2010). Source location is based on the assumptionthat a signal is coherent at the different sensors, whereas noise innot correlated. The array processing applies multichannel corre-lation using a grid-searching method to identify signals fromnoise in terms of wave propagation back-azimuth and apparent vel-ocity. The propagation back-azimuth indicates the direction of thesignal source. Assuming that infrasound reaches the array as aplanar wave front, with 908 incident angle (from the vertical) atconstant velocity, infrasonic waves should propagate across thearray at the same speed of sound (c. 340 m s21), which dependsprimarily on air temperature and, to a small extent, on humidity.This assumption of plane-wave propagation is justified as thesource–receiver distance of approximately 5600 m is considerablylarger than the 220 m aperture of the array.
The apparent velocity is the velocity that the wave will havewhen it is not travelling in the same plane. as defined by thearray; that is. with an incident angle ,908. High apparent vel-ocities (.340 m s21) will thus be related to lower incidentangles (,908) and, therefore, to a source located above the arrayplane. It is worth noting that the maximum difference in elevationbetween sensors is 30 m over 220 m of aperture, so that the ideal
Fig. 9.2. PDC
Colour
online=colour
hardcopy
tracking methodology.
(a) Original thermal images captured at the
t1– t4 time interval are converted into
(b) binary images using a background
temperature threshold and allowing us to
detect high-temperature areas in the FOV.
Image decomposition method along
(c) vertical and (d) horizontal axes allows
tracking of the front of the high-temperature
anomaly. (e) The trajectory is computed
using information along both the horizontal
and vertical directions.
THERMAL, ACOUSTIC AND SEISMIC SIGNALS 169

208209210211212213214215216217218219220221222223224225226227228229230231232233234235236237238239240241242243244245246247248249250251252253254255256257258259260261262263264265266267268269270271272273274275276
plane defined by the array is very close to the horizontal. Variationin apparent velocity will indicate a change in the altitude and,hence, a moving source. Furthermore, high apparent velocities(.400 m s21) correspond to steep incident angles that representunrealistic sources originating from the volcano.
The degree of signal correlation across the array is controlledby the time residual. The time residual is the sum of the delaysbetween three array sensor pairs calculated in real time by multiplecross-correlation. Highly correlated signals (.0.8) have a timeresidual approaching 0. This procedure (see Ulivieri et al. 2011among others) is performed for all the possible triplets of sensorsof the array, and we consider a detection to be valid if the meanof time residuals is below the consistency threshold of 0.015 s,which corresponds to a 70% correlation for a signal with a peakfrequency of 1 Hz. The propagation back-azimuth and apparentvelocity is calculated as the mean value between all the possi-ble combination of sensors within the different triplets using thedistances and the time delays, and assuming a constant propaga-tion velocity (see Cansi 1995; Ulivieri et al. 2011 for details).The accuracy of the array back-azimuth depends on the array aper-ture, sampling rate, frequency content of the infrasonic signal andthe signal-to-noise ratio. For a 220 m aperture array and consid-ering a frequency content of 1 Hz, typical of infrasound gener-ated by volcanic activity, the expected azimuth resolution is ofapproximately 0.98, which corresponds to 88 m at 5600 m ofslant distance.
The use of a small-aperture infrasonic array improves thecapabilities of volcano observatories for monitoring activitiesduring eruption crises (e.g. Ripepe et al. 2007; Johnson &Ripepe 2011), and also provides useful corroboration for other
geophysical parameters (mainly seismic signals, ground visibleand thermal cameras, and gas monitoring) (Garces et al. 2000;Vergniolle & Caplan-Auerbach 2006; Johnson 2007).
This location procedure is performed in real time using 5 smoving windows with 90% overlap on all possible triplets ofsensors in the array, and allows detection and tracking of infra-sound generated by PDCs. Once a coherent arrival across thearray is detected, we use back-azimuth and incident angle infor-mation to map the source onto the DEM.
Thermo-acoustic tracking of the propagation of PDCs
The propagation of the PDCs is mainly controlled by three par-ameters: topography, basal friction angle (an empirical propertyof two contacting materials) and initial velocity. While the topo-graphy is well known, and the basal friction angle can be estimatedto be of the order of 128–16.58 (Nikolkina et al. 2011), data ofinitial velocities of the PDCs from the SHV are poorly documen-ted. Average velocities of propagation have been measured inthe range of 5–35 m s21 (Calder et al. 2002; Cole et al. 2002;Carn et al. 2004), but modelling suggests that initial velocities ofdome-collapse-induced PDCs can be much higher, reachingapproximately 50–70 m s21 (Wadge et al. 1998; Calder et al.1999; Hooper & Mattioli 2001). The estimation of propagationvelocity of PDCs is crucial to estimating hazards as velocity con-trols the run-out and the extents of the affected area of the PDC.
The combined thermal and infrasonic methods previouslydescribed are used here to analyse the kinematics of a PDCformed on 10 September 2010 by gravitational instability of the
Fig. 9.3. Six
Colour
online=colour
hardcopy
snapshots associated with the
PDC that occurred on 10 September 2010
and running towards the NE along the
collapse scar produced by the 11 February
2010 partial dome collapse, as detected by
the FLIR thermal camera and associated 3D
Google Earth view after thin smoothing
spline georeferentiation.
D. DELLE DONNE ET AL.170
277278279280281282283284285286287288289290291292293294295296297298299300301302303304305306307308309310311312313314315316317318319320321322323324325326327328329330331332333334335336337338339340341342343344345
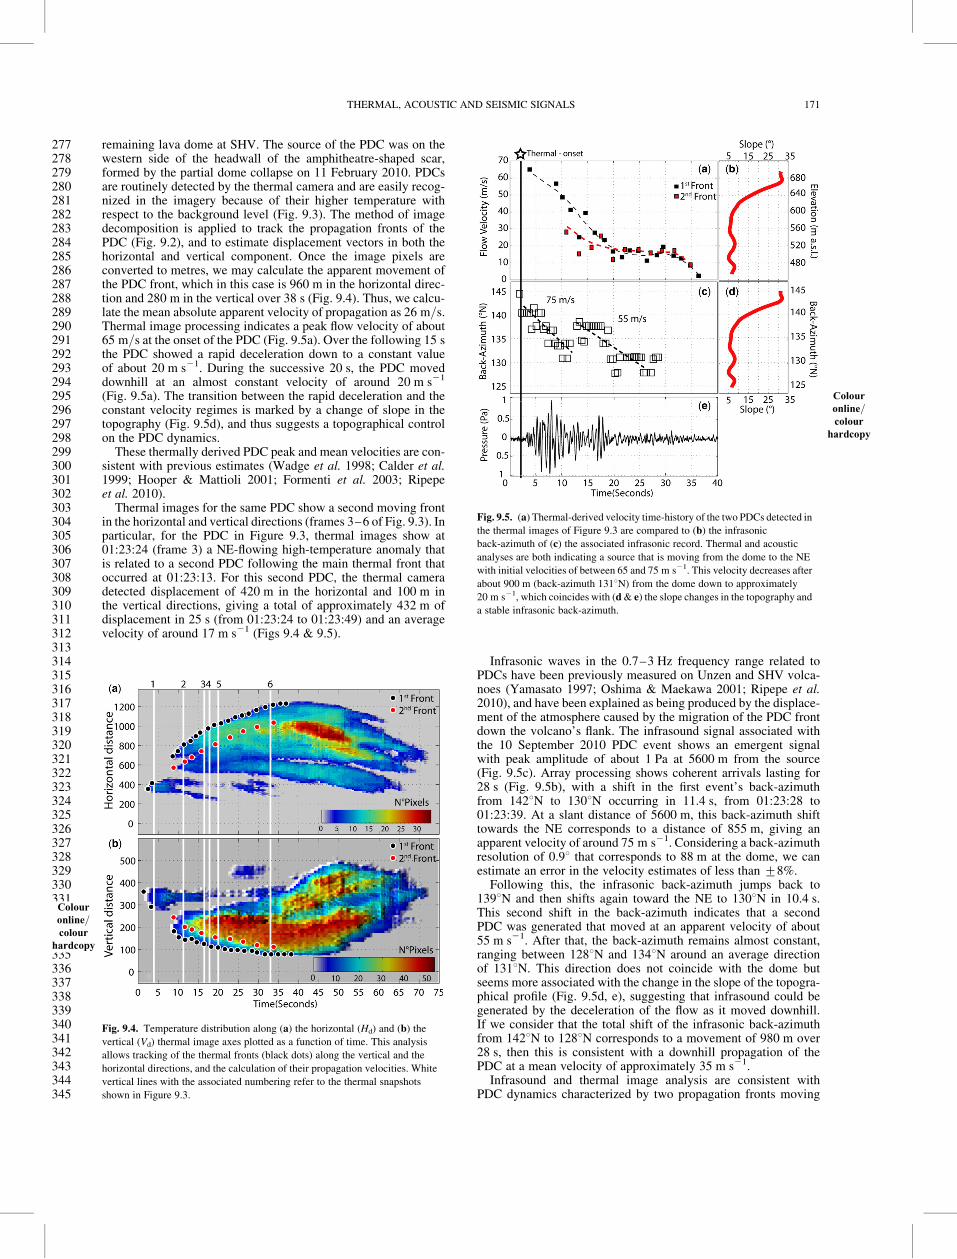
remaining lava dome at SHV. The source of the PDC was on thewestern side of the headwall of the amphitheatre-shaped scar,formed by the partial dome collapse on 11 February 2010. PDCsare routinely detected by the thermal camera and are easily recog-nized in the imagery because of their higher temperature withrespect to the background level (Fig. 9.3). The method of imagedecomposition is applied to track the propagation fronts of thePDC (Fig. 9.2), and to estimate displacement vectors in both thehorizontal and vertical component. Once the image pixels areconverted to metres, we may calculate the apparent movement ofthe PDC front, which in this case is 960 m in the horizontal direc-tion and 280 m in the vertical over 38 s (Fig. 9.4). Thus, we calcu-late the mean absolute apparent velocity of propagation as 26 m/s.Thermal image processing indicates a peak flow velocity of about65 m/s at the onset of the PDC (Fig. 9.5a). Over the following 15 sthe PDC showed a rapid deceleration down to a constant valueof about 20 m s21. During the successive 20 s, the PDC moveddownhill at an almost constant velocity of around 20 m s21
(Fig. 9.5a). The transition between the rapid deceleration and theconstant velocity regimes is marked by a change of slope in thetopography (Fig. 9.5d), and thus suggests a topographical controlon the PDC dynamics.
These thermally derived PDC peak and mean velocities are con-sistent with previous estimates (Wadge et al. 1998; Calder et al.1999; Hooper & Mattioli 2001; Formenti et al. 2003; Ripepeet al. 2010).
Thermal images for the same PDC show a second moving frontin the horizontal and vertical directions (frames 3–6 of Fig. 9.3). Inparticular, for the PDC in Figure 9.3, thermal images show at01:23:24 (frame 3) a NE-flowing high-temperature anomaly thatis related to a second PDC following the main thermal front thatoccurred at 01:23:13. For this second PDC, the thermal cameradetected displacement of 420 m in the horizontal and 100 m inthe vertical directions, giving a total of approximately 432 m ofdisplacement in 25 s (from 01:23:24 to 01:23:49) and an averagevelocity of around 17 m s21 (Figs 9.4 & 9.5).
Infrasonic waves in the 0.7–3 Hz frequency range related toPDCs have been previously measured on Unzen and SHV volca-noes (Yamasato 1997; Oshima & Maekawa 2001; Ripepe et al.2010), and have been explained as being produced by the displace-ment of the atmosphere caused by the migration of the PDC frontdown the volcano’s flank. The infrasound signal associated withthe 10 September 2010 PDC event shows an emergent signalwith peak amplitude of about 1 Pa at 5600 m from the source(Fig. 9.5c). Array processing shows coherent arrivals lasting for28 s (Fig. 9.5b), with a shift in the first event’s back-azimuthfrom 1428N to 1308N occurring in 11.4 s, from 01:23:28 to01:23:39. At a slant distance of 5600 m, this back-azimuth shifttowards the NE corresponds to a distance of 855 m, giving anapparent velocity of around 75 m s21. Considering a back-azimuthresolution of 0.98 that corresponds to 88 m at the dome, we canestimate an error in the velocity estimates of less than +8%.
Following this, the infrasonic back-azimuth jumps back to1398N and then shifts again toward the NE to 1308N in 10.4 s.This second shift in the back-azimuth indicates that a secondPDC was generated that moved at an apparent velocity of about55 m s21. After that, the back-azimuth remains almost constant,ranging between 1288N and 1348N around an average directionof 1318N. This direction does not coincide with the dome butseems more associated with the change in the slope of the topogra-phical profile (Fig. 9.5d, e), suggesting that infrasound could begenerated by the deceleration of the flow as it moved downhill.If we consider that the total shift of the infrasonic back-azimuthfrom 1428N to 1288N corresponds to a movement of 980 m over28 s, then this is consistent with a downhill propagation of thePDC at a mean velocity of approximately 35 m s21.
Infrasound and thermal image analysis are consistent withPDC dynamics characterized by two propagation fronts moving
Fig. 9.4. Temperature
Colour
online=colour
hardcopy
distribution along (a) the horizontal (Hd) and (b) the
vertical (Vd) thermal image axes plotted as a function of time. This analysis
allows tracking of the thermal fronts (black dots) along the vertical and the
horizontal directions, and the calculation of their propagation velocities. White
vertical lines with the associated numbering refer to the thermal snapshots
shown in Figure 9.3.
Fig. 9.5. (a)
Colour
online=colour
hardcopy
Thermal-derived velocity time-history of the two PDCs detected in
the thermal images of Figure 9.3 are compared to (b) the infrasonic
back-azimuth of (c) the associated infrasonic record. Thermal and acoustic
analyses are both indicating a source that is moving from the dome to the NE
with initial velocities of between 65 and 75 m s21. This velocity decreases after
about 900 m (back-azimuth 1318N) from the dome down to approximately
20 m s21, which coincides with (d & e) the slope changes in the topography and
a stable infrasonic back-azimuth.
THERMAL, ACOUSTIC AND SEISMIC SIGNALS 171

346347348349350351352353354355356357358359360361362363364365366367368369370371372373374375376377378379380381382383384385386387388389390391392393394395396397398399400401402403404405406407408409410411412413414
toward the NE at a mean velocity ranging between 20 and35 m s21, and with a peak initial down-slope velocity of55–75 m s21 (Fig. 9.5b, c).
Thermal and acoustic observation of a Vulcanian
explosion
Combined analysis of acoustic and thermal images can alsoprovide valuable information on the dynamics of eruptivecolumns (Yokoo & Iguchi 2010; Delle Donne & Ripepe 2012).Both techniques can be used to constrain the eruptive onset,plume exit velocity and volumetric flux. Furthermore, the corre-lation of infrasound with thermal imagery can provide an impor-tant contribution to interpreting the associated seismic activity.Here we present the results of real-time processing of infrasoundand thermal data associated with a Vulcanian explosion occurringat around 17:49 UTC on 5 February 2010 (Fig. 9.6). The seismicsignal associated with this event lasted approximately 7 min,sending a tephra column to an elevation of 7.3 km above sealevel (asl) into the atmosphere (Cole et al. 2014). Direct obser-vations showed extensive ballistic fragments showering the north-ern and western flanks of the volcano up to distances of around1 km. The vent area of the explosion was the western side of thelava-dome summit. The largest PDC associated with this explosionreached the sea (run-out of .4 km) at Aymers Ghaut, and minorPDC activity (run-out of ,2 km) also occurred in several othervalleys, including Tyre’s Ghaut (Cole et al. 2014).
Thermal image analysis
The thermal camera imagery captured the main phases of theexplosion dynamics (Fig. 9.6), with the initial injection of tephrainto the atmosphere (frames 1–4) at 17:49:02, followed byplume collapse at 17:49:36 (frames 4–9). It is of note thatwithin about 22 s of the onset (frame 4) the thermal camerashows a decrease in the integrated temperature in the FOV, indicat-ing that the tephra-column cooling related to a convective airentrainment mechanism and/or to an increase of cold ash in theatmosphere, which was preventing the detection of the volcanicactivity at the domeQ2 .
Explosive eruptions are generally described by two main gasdynamic phases. During the first phase, the volcanic plume is
driven into the atmosphere by the gas thrust. Following this, theplume keeps rising at a relatively constant velocity by buoyancy,slowly expanding into the atmosphere while entraining air(Wilson 1980; Patrick 2007). The gas-thrust phase feeds hottephra into the plume and is responsible for the increase in thetemperature within the thermal camera FOV. The buoyancyphase is, however, associated with the reduction in the temperaturein the FOV as no new volcanic material is ejected, but, rather, theplume rises at constant velocity by convective air entrainment witha consequent reduction of its internal temperature Q2(Wilson 1980;Patrick 2007; Marchetti et al. 2009; Delle Donne & Ripepe 2012).
Thermal analysis provides the vertical rise velocity of the erup-tive plume front, and the time-history of the plume-integratedtemperature (Fig. 9.7e, f ). This analysis shows that this Vulcanian
Fig. 9.6. Thermal
Colour
online=colour
hardcopy
snapshots related to the Vulcanian eruption that occurred on
5 February 2010. The thermal gas-thrust phase is represented in the frames 1–4,
after which the volcanic plume starts to collapse, generating large PDCs.
Fig. 9.7. Seismic-, acoustic- and thermal-derived signals associated with the
5 February 2010 Vulcanian eruption. (a) Seismic VLP ground displacement
(using non-causal filter of Fig. 9.8) associated with the eruption onset. This
signal is not evident but is still visible in the raw data (b), which have a strong
high-frequency (1–20 Hz) amplitude component. Seismic onset is highlighted
by the dashed black line and preceding the explosion (thermal and infrasound)
onset of 13 s. Infrasound filtered between 0.2 and 20 Hz (d) indicate a
high-frequency cigar-shape signal associated with PDC activity induced by the
plume collapse that is correlated with the high-frequency seismic signal (b).
Unfiltered infrasound (c) and thermal camera image processing (e, plume
velocity; f, mean temperature) detected the eruption onset at 17:49:02, which
was characterized by an exit velocity of 170 m s21 (e) and a sharp positive
compressive acoustic signal (c). Temperature (f ) above the vent increased for
approximately 13 s (point 4) in agreement with the duration of the seismic VLP
(a), infrasonic broadband compression (c) and plume velocity (e). We suggest
this is the duration of the eruptive gas-thrust phase (grey area) followed by the
plume collapse and the generation of the PDCs.
D. DELLE DONNE ET AL.172
415416417418419420421422423424425426427428429430431432433434435436437438439440441442443444445446447448449450451452453454455456457458459460461462463464465466467468469470471472473474475476477478479480481482483
explosion is characterized by the ejection of gas and fragments intothe atmosphere with initial velocities of about 170 m s21, which isfollowed by a sharp deceleration phase lasting approximately 13 s.The plume velocity becomes nearly constant at around 27 m s21,during which the gas thrust is still feeding the plume for aboutother 9 s, as also evidenced by the progressive increase of the inte-grated temperature (Fig. 9.7e, f, grey marked phase) for a total dur-ation of 22 s. These plume velocities are fully consistent withprevious estimates of 40–140 m s21 using image analysis ofvideo camera records for several Vulcanian explosions occurringat SHV during the 1997 eruptive sequence (Druitt et al. 2002Q3 ; For-menti et al. 2003).
At the end of the gas-thrust phase, the eruptive dynamics aremarked by the collapse of the plume that generates impressivePDCs (frames 4–9 in Fig. 9.6), which reached the sea with arun-out of .4 km. We interpret this collapse as being responsiblefor the decrease in the integrated temperature in the thermal trace(Fig. 9.7).
Infrasonic and seismic records
This Vulcanian explosion was recorded both with the MVO broad-band seismic network and with the infrasonic sensor at the MBFLstation at the MVO (Fig. 9.8). The seismic signal shows a mainduration of about 7 min (Fig. 9.8a), which includes both the pre-eruptive phase, the gas-thrust phase (i.e. injection of tephra intothe atmosphere) and the plume collapse with the propagation ofthe PDCs.
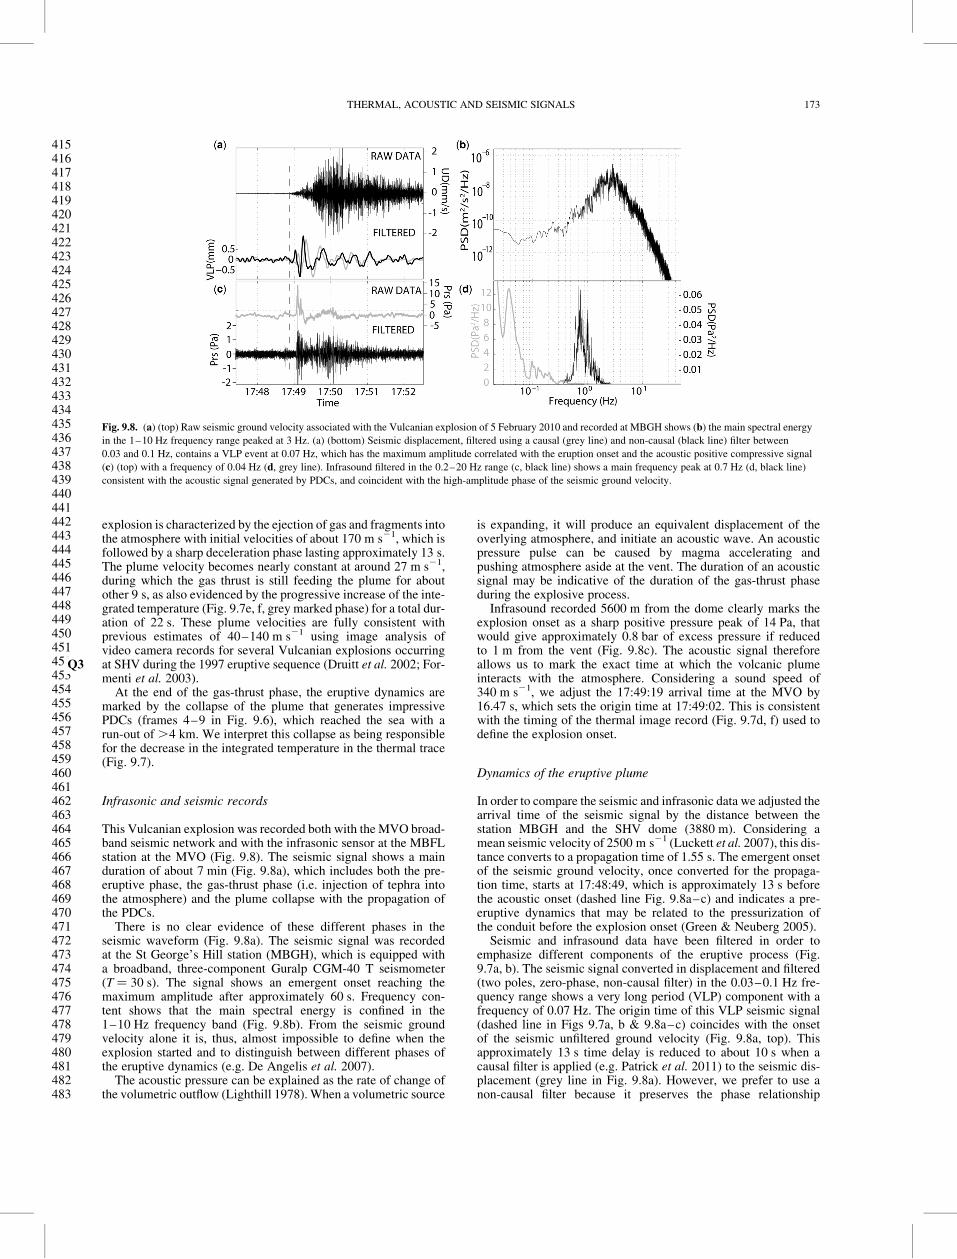
There is no clear evidence of these different phases in theseismic waveform (Fig. 9.8a). The seismic signal was recordedat the St George’s Hill station (MBGH), which is equipped witha broadband, three-component Guralp CGM-40 T seismometer(T ¼ 30 s). The signal shows an emergent onset reaching themaximum amplitude after approximately 60 s. Frequency con-tent shows that the main spectral energy is confined in the1–10 Hz frequency band (Fig. 9.8b). From the seismic groundvelocity alone it is, thus, almost impossible to define when theexplosion started and to distinguish between different phases ofthe eruptive dynamics (e.g. De Angelis et al. 2007).
The acoustic pressure can be explained as the rate of change ofthe volumetric outflow (Lighthill 1978). When a volumetric source
is expanding, it will produce an equivalent displacement of theoverlying atmosphere, and initiate an acoustic wave. An acousticpressure pulse can be caused by magma accelerating andpushing atmosphere aside at the vent. The duration of an acousticsignal may be indicative of the duration of the gas-thrust phaseduring the explosive process.
Infrasound recorded 5600 m from the dome clearly marks theexplosion onset as a sharp positive pressure peak of 14 Pa, thatwould give approximately 0.8 bar of excess pressure if reducedto 1 m from the vent (Fig. 9.8c). The acoustic signal thereforeallows us to mark the exact time at which the volcanic plumeinteracts with the atmosphere. Considering a sound speed of340 m s21, we adjust the 17:49:19 arrival time at the MVO by16.47 s, which sets the origin time at 17:49:02. This is consistentwith the timing of the thermal image record (Fig. 9.7d, f) used todefine the explosion onset.
Dynamics of the eruptive plume
In order to compare the seismic and infrasonic data we adjusted thearrival time of the seismic signal by the distance between thestation MBGH and the SHV dome (3880 m). Considering amean seismic velocity of 2500 m s21 (Luckett et al. 2007), this dis-tance converts to a propagation time of 1.55 s. The emergent onsetof the seismic ground velocity, once converted for the propaga-tion time, starts at 17:48:49, which is approximately 13 s beforethe acoustic onset (dashed line Fig. 9.8a–c) and indicates a pre-eruptive dynamics that may be related to the pressurization ofthe conduit before the explosion onset (Green & Neuberg 2005).
Seismic and infrasound data have been filtered in order toemphasize different components of the eruptive process (Fig.9.7a, b). The seismic signal converted in displacement and filtered(two poles, zero-phase, non-causal filter) in the 0.03–0.1 Hz fre-quency range shows a very long period (VLP) component with afrequency of 0.07 Hz. The origin time of this VLP seismic signal(dashed line in Figs 9.7a, b & 9.8a–c) coincides with the onsetof the seismic unfiltered ground velocity (Fig. 9.8a, top). Thisapproximately 13 s time delay is reduced to about 10 s when acausal filter is applied (e.g. Patrick et al. 2011) to the seismic dis-placement (grey line in Fig. 9.8a). However, we prefer to use anon-causal filter because it preserves the phase relationship
Fig. 9.8. (a) (top) Raw seismic ground velocity associated with the Vulcanian explosion of 5 February 2010 and recorded at MBGH shows (b) the main spectral energy
in the 1–10 Hz frequency range peaked at 3 Hz. (a) (bottom) Seismic displacement, filtered using a causal (grey line) and non-causal (black line) filter between
0.03 and 0.1 Hz, contains a VLP event at 0.07 Hz, which has the maximum amplitude correlated with the eruption onset and the acoustic positive compressive signal
(c) (top) with a frequency of 0.04 Hz (d, grey line). Infrasound filtered in the 0.2–20 Hz range (c, black line) shows a main frequency peak at 0.7 Hz (d, black line)
consistent with the acoustic signal generated by PDCs, and coincident with the high-amplitude phase of the seismic ground velocity.
THERMAL, ACOUSTIC AND SEISMIC SIGNALS 173
484485486487488489490491492493494495496497498499500501502503504505506507508509510511512513514515516517518519520521522523524525526527528529530531532533534535536537538539540541542543544545546547548549550551552
between the original and filtered seismic signals, as shown inFigure 9.7 a, b. The correlation between the VLP signal and theeruptive process is more evident when we compare the VLPsignal with the infrasound (Fig. 9.7d).
Infrasound is characterized by a low-frequency spectral peak(Fig. 9.8d) at 0.04 Hz (25 s), and it clearly corresponds to theexplosion onset with a sharp positive pressure peak lastingaround 13 s. This compressive phase is followed by a longer nega-tive coda lasting 29 s.
The maximum amplitude of the VLP seismic displacement(independent of the filter used) coincides (grey marked area inFig. 9.7) with the positive infrasonic peak, indicating that theVLP seismic signal originated during the initial gas-thrust phaseof the explosion. The analysis of the thermal images reveals thatthe duration of the seismic and infrasonic signals coincides withthe duration of the temperature increase (Fig. 9.7f ) and with theplume velocity decrease from 170 m s21 to a more constantplume flow of about 27 m s21. This time corresponds to frame 4in the thermal sequence of Figure 9.7, and marks the beginningof the column collapse and the onset of the PDCs. Thermal andacoustic data thus suggest that the VLP signal could be generatedby a co-eruptive source represented by the downwards force of theexplosion (Kanamori et al. 1984).
Seismic and acoustic signature of PDCs
PDCs at SHV are generally characterized by infrasound in thefrequency range of between 0.4 and 2 Hz (Ripepe et al. 2010).We have filtered the infrasound above 0.2 Hz to highlight thecontribution of the PDC (Fig. 9.7d). However, the explosivedynamics also radiate in this frequency band. The filteredsignal shows a sharp infrasonic onset and a pressure peak ofapproximately 2.5 Pa. This initial signal dies out at the end ofthe gas-thrust phase but only after the peak of the thermalanomaly (Fig. 9.7f, grey marked area). After that, the infrasounddecreases to a minimum amplitude (Fig. 9.7d), which is fol-lowed by a second phase of emergent and gradual amplitudeincrease up to 1 Pa. This second phase represents the infrasoundgenerated by the PDCs, and coincides with the duration andshape of the seismic signal (Fig. 9.7a). This similarity indicatesthat the seismic signal is dominated by a frequency band above1 Hz related to PDC activity more than by the explosive process.Moreover, the duration of the high-frequency seismic signal ofapproximately 7 min coincides to the duration of the infrasoundabove 1 Hz.
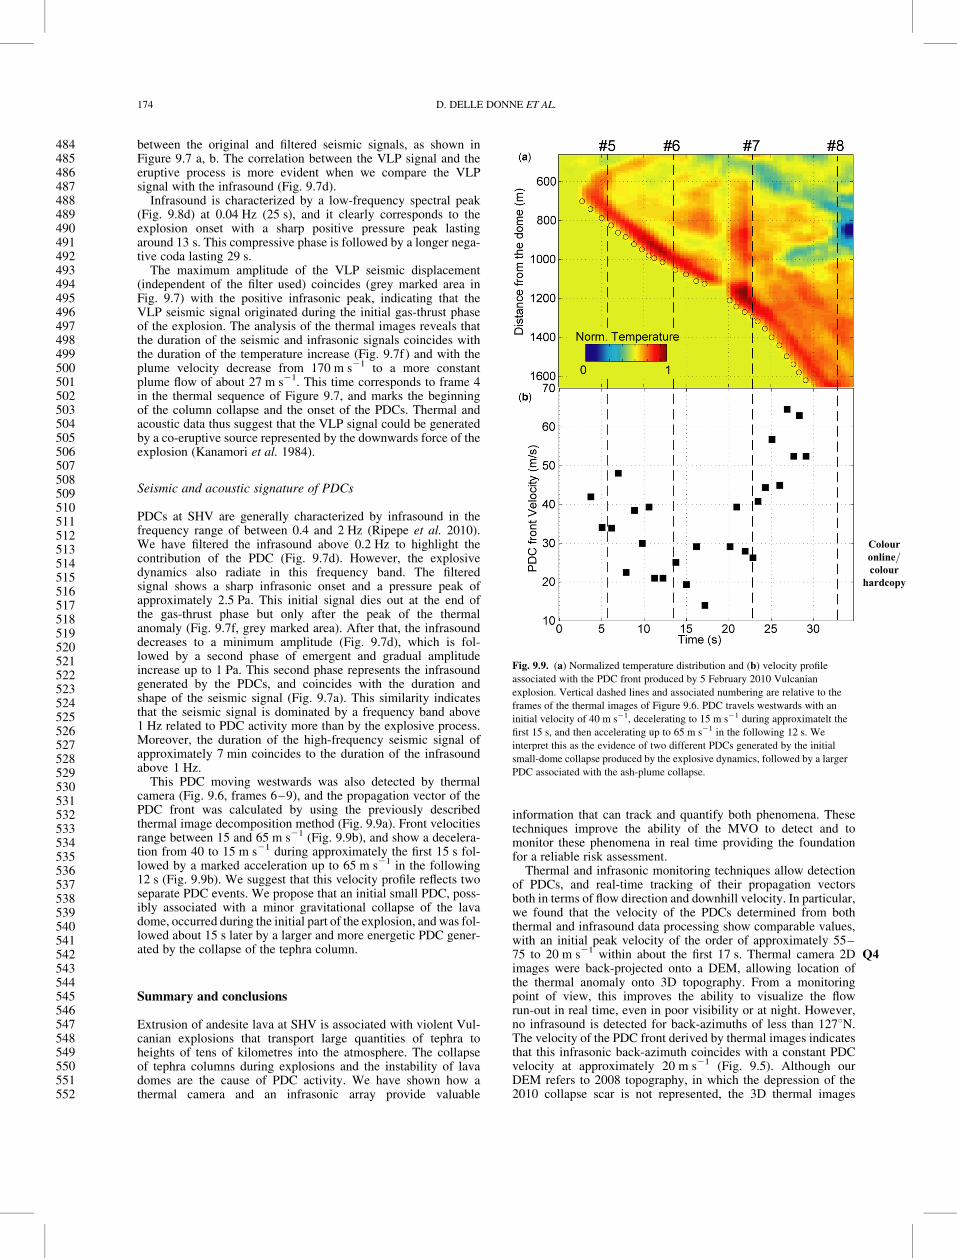
This PDC moving westwards was also detected by thermalcamera (Fig. 9.6, frames 6–9), and the propagation vector of thePDC front was calculated by using the previously describedthermal image decomposition method (Fig. 9.9a). Front velocitiesrange between 15 and 65 m s21 (Fig. 9.9b), and show a decelera-tion from 40 to 15 m s21 during approximately the first 15 s fol-lowed by a marked acceleration up to 65 m s21 in the following12 s (Fig. 9.9b). We suggest that this velocity profile reflects twoseparate PDC events. We propose that an initial small PDC, poss-ibly associated with a minor gravitational collapse of the lavadome, occurred during the initial part of the explosion, and was fol-lowed about 15 s later by a larger and more energetic PDC gener-ated by the collapse of the tephra column.
Summary and conclusions
Extrusion of andesite lava at SHV is associated with violent Vul-canian explosions that transport large quantities of tephra toheights of tens of kilometres into the atmosphere. The collapseof tephra columns during explosions and the instability of lavadomes are the cause of PDC activity. We have shown how athermal camera and an infrasonic array provide valuable
information that can track and quantify both phenomena. Thesetechniques improve the ability of the MVO to detect and tomonitor these phenomena in real time providing the foundationfor a reliable risk assessment.
Thermal and infrasonic monitoring techniques allow detectionof PDCs, and real-time tracking of their propagation vectorsboth in terms of flow direction and downhill velocity. In particular,we found that the velocity of the PDCs determined from boththermal and infrasound data processing show comparable values,with an initial peak velocity of the order of approximately 55–75 to 20 m s21 Q4within about the first 17 s. Thermal camera 2Dimages were back-projected onto a DEM, allowing location ofthe thermal anomaly onto 3D topography. From a monitoringpoint of view, this improves the ability to visualize the flowrun-out in real time, even in poor visibility or at night. However,no infrasound is detected for back-azimuths of less than 1278N.The velocity of the PDC front derived by thermal images indicatesthat this infrasonic back-azimuth coincides with a constant PDCvelocity at approximately 20 m s21 (Fig. 9.5). Although ourDEM refers to 2008 topography, in which the depression of the2010 collapse scar is not represented, the 3D thermal images
Fig. 9.9. (a)
Colour
online=colour
hardcopy
Normalized temperature distribution and (b) velocity profile
associated with the PDC front produced by 5 February 2010 Vulcanian
explosion. Vertical dashed lines and associated numbering are relative to the
frames of the thermal images of Figure 9.6. PDC travels westwards with an
initial velocity of 40 m s21, decelerating to 15 m s21 during approximatelt the
first 15 s, and then accelerating up to 65 m s21 in the following 12 s. We
interpret this as the evidence of two different PDCs generated by the initial
small-dome collapse produced by the explosive dynamics, followed by a larger
PDC associated with the ash-plume collapse.
D. DELLE DONNE ET AL.174
553554555556557558559560561562563564565566567568569570571572573574575576577578579580581582583584585586587588589590591592593594595596597598599600601602603604605606607608609610611612613614615616617618619620621
(Fig. 9.3) suggest that the 1278N infrasonic back-azimuth and thedeceleration of the PDC front could coincide with a slope changein the topography (Fig. 9.5c). Infrasound associated with the PDCseems to be produced by the rapid changes of the PDC front vel-ocity induced by topography.
Infrasound data and thermal camera imagery allow the identifi-cation of the onset of Vulcanian explosions and provides con-straints on the different phases of the explosive dynamics. Thisinformation is more difficult to extract from seismic signalsalone, and thus thermal images and infrasound can help in theinterpretation of explosion dynamics. In the case of the 5 February2010 explosion, thermal camera imagery reveals a temperatureincrease above the dome lasting for 22 s, which coincides withthe onset and the duration of the positive compressive infrasonicsignal in the low-frequency band ,1 Hz. Furthermore, thermaldecomposition of the camera imagery shows a rapid decelerationof the plume velocity from the initial approximately 170 m s21
to a more constant ascent rate of around 27 m s21.We attribute this initial eruptive phase as being dominated
by the gas-thrust feeding tephra into the atmosphere with avelocity, U(t), which gives an average volumetric dischargerate, F(t) ¼pR2U(t), ranging between 3.3 � 104 and 9.2 �105 m3 s21, assuming a vent radius, R, of between 15 and 25 mbased on the dimensions of spines extruded from the dome(Watts et al. 2002). To estimate the mass flux we need to knowdensity of the plume. This parameter can be achieved by fall-outdistribution and tephra dispersal analysis. Estimations of plumedensity in Vulcanian explosions with comparable magnitude aregiven by Ripepe & Harris (2008) and by Pistolesi et al. (2011)for the 5 April 2003 and 15 March 2007 Stromboli explosions,respectively. For these explosions, authors estimate a plumedensity of 6.7 and 13.5 kg m23, respectively. Using these plume-density values, the mass fluxes of the 5 February 2010 explosionat SHV would be between 0.2 � 106 and 13.3 � 106 kg s21.Accordingly, the total discharged plume volume of 0.8 � 106–20.2 � 106 m3 is estimated by integrating the volume flux on the22 s-long gas-thrust phase, that would give a total dischargedmass of 5.4 � 106–272 � 106 kg. This is in agreement with pre-vious estimates using different methods from other Vulcanianeruptions at SHV (Druitt et al. 2002; Formenti et al. 2003; Komor-owski et al. 2010; Cole et al. 2014).
The seismic signal associated with the gas-thrust phase becomesevident only when filtered below 0.1 Hz in the 0.03–0.1 fre-quency band. This VLP seismic signal with a frequency of0.04 Hz seems to be a typical feature of large Vulcanian explosionsat SHV, at least in the 2008–2010 period (Cole et al. 2013), but notpreviously reported. Nevertheless, ultra-low-period (ULP .100 s)seismic signals have been recorded by broadband seismometers atSHV (Green & Neuberg 2005) and explained as being related tothe pressurization of the upper conduit, presumably by a trappedgas phase.
The fragmentation of overpressurized magmatic foam allowsrapid expansion of the magma in the conduit driving materialout the vent and into the atmosphere. The ground will react to achange in the upwards momentum induced by the mass dischargewith a downwards-orientated counter force (Kanamori et al. 1984),which is probably the source of the VLP seismic signal. The cor-relation with the plume velocity derived by thermal image analy-sis (Fig. 9.7a, e) seems to support this interpretation.
When eruptive dynamics are no longer able to sustain thecolumn, ejection velocity drops down to 10 m s21 (Fig. 9.7e)and the plume collapses generating PDCs (Fig. 9.6, frames 4–10). Infrasound above 0.2 Hz reveals a high-frequency emergentsignal at 0.7 Hz reaching maximum pressure amplitude approxi-mately 60 s after the eruption onset (Fig. 9.7d). The seismicsignal mimics the infrasonic waveform, suggesting that the PDCsource is strongly coupled with both the atmosphere and theground. This indicates that the seismic signal above 1 Hz is notrelated to the explosive dynamics but is rather caused by the
PDC activity. Therefore, the amplitude and duration of theseismic signal (.1 Hz) is not related to the energy and the durationof the explosive process, but, rather, they are related to the amp-litude and duration of PDCs that were generated during theplume collapse.
We thank C. ‘Pyiko’ Williams, N. Fournier and A. Finizola for invaluable support
in the field and the scientific discussions on thermal images and acoustic waves.
The manuscript has been improved by the critical comments of M. Patrick and
J. Johnson.
References
Bookstein, F. L. 1989. Principal warps: thin-plate splines and thedecomposition of deformations. IEEE Transactions on PatternAnalysis and Machine Intelligence, 11, 567–585.
Calder, E. S., Cole, P. D. et al. 1999. Mobility of Pyroclastic Flowsand Surges at the Soufriere Hills Volcano, Montserrat. GeophysicalResearch Letters, 26, 537–540 http://dx.doi.org/10.1029/1999GL900051
Calder, E. S., Luckett, R., Sparks, R. S. J. & Voight, B. 2002. Mech-anisms of lava dome instability and generation of rock-falls andpyroclastic flows at Soufriere Hills Volcano, Montserrat. In:Druitt, T. H. & Kokelaar, B. P. (eds) The Eruption of SoufriereHills Volcano, Montserrat, from 1995 to 1999. Geological Society,London, Memoirs, 21, 173–190.
Cansi, Y. 1995. An automatic seismic event processing for detection andlocation; the P.M.C.C. method. Geophysical Research Letters, 22,1021–1024.
Carn, S. A., Watts, R. B., Thompson, G. & Norton, G. E. 2004.Anatomy of a Lava Dome Collapse: the 20 March 2000 Event at Sou-friere Hills Volcano, Montserrat. Journal of Volcanology andGeothermal Research, 131, 241–264, http://dx.doi.org/10.1016/S0377-0273(03)00364-0
Cole, P. D., Calder, E. S. et al. 2002. Deposits from dome-collapse andfountain-collapse pyroclastic flows at Soufriere Hills Volcano, Mon-tserrat. In: Druitt, T. H. & Kokelaar, B. P. (eds) The Eruption ofSoufriere Hills Volcano, Montserrat, from 1995 to 1999. GeologicalSociety London, Memoirs, 21, 231–262.
Cole, P. D., Smith, P. J., Stinton, A. J., Odbert, H. M., Bernstein,M. L., Komorowski, J. C. & Stewart, R. 2014. Vulcanianexplosions at Soufriere Hills Volcano, Montserrat between 2008and 2010. In: Wadge, G., Robertson, R. E. A. & Voight, B. (eds)The Eruption of Soufriere Hills Volcano, Montserrat from 2000 to2010. Geological Society, London, Memoirs, 39, 93–109, http://dx.doi.org/10.1144/M39.5
De Angelis, S., Bass, V., Hards, V. & Ryan, G. 2007. Seismic charac-terization of pyroclastic flow activity at Soufriere Hills Volcano,Montserrat, 8 January 2007. Natural Hazards Earth SystemsScience, 7, 467–472.
Delle Donne, D. & Ripepe, M. 2012. High-frame rate thermal imageryof Strombolian explosions: implications for explosive and infrasonicsource dynamics. Journal of Geophysical Research, 117, B09206,http://dx.doi.org/10.1029/2011JB008987
Druitt, T., Young, S. et al. 2002. Episodes of cyclic Vulcanian explo-sive activity with fountain collapse at Soufriere Hills Volcano, Mon-tserrat. In: Druitt, T. & Kokelaar, B. (eds) The Eruption ofSoufriere Hills Volcano, Montserrat, from 1995 to 1999. GeologicalSociety, London, Memoirs, 21, 281–306.
Formenti, Y., Druitt, T. H. & Kelfoun, K. 2003. Characterisation ofthe 1997 Vulcanian explosions of Soufriere Hills Volcano, Montser-rat, by video analysis. Bulletin of Volcanology, 65, 587–605, http://dx.doi.org/10.1007/s00445-003-0288-8
Garces, Q5M. A., Iguchi, M., Ishihara, K., Morrissey, M., Sudo, Y. &Tsutsui, T. 1999. Infrasonic precursors to a Vulcanian eruption atSakurajima Volcano, Japan. Geophysical Research Letters, 26,2537–2540.
Garces, M. A., McNutt, S. R., Hansen, R. A. & Eichelberger, J. C.2000. Application of wave-theoretical seismoacoustic models to theinterpretation of explosion and eruption tremor signals radiated by
THERMAL, ACOUSTIC AND SEISMIC SIGNALS 175

622623624625626627628629630631632633634635636637638639640641642643644645646647648649650651652653654655656657658659660661662663664665666667668669670671672673674675676677678679680681682683684685686687688689690
Pavlov Volcano, Alaska. Journal of Geophysical Research, 105,3039–3058.
Green, D. N. & Neuberg, J. 2005. Seismic and infrasonic signals associ-ated with an unusual collapse event at the Soufriere Hills volcano,Montserrat. Geophysical Research Letters, 32, L07308, http://dx.doi.org/10.1029/2004GL022265
Hooper, D. M. & Mattioli, G. S. 2001. Kinematic modeling ofpyroclastic flows produced by gravitational Dome Collapse at Sou-friere Hills Volcano, Montserrat. Natural Hazards, 23, 65–86.
Jolly, A. D., Thompson, G. & Norton, G. E. 2002. Locating pyro-clastic flows on Soufriere Hills Volcano, Montserrat, West Indies,using amplitude signals from high dynamic range instru-ments. Journal of Volcanology and Geothermal Research, 118,299–317.
Johnson, J. B. 2007. On the relation between infrasound, seismicity, andsmall pyroclastic explosions at Karymsky Volcano. Journal ofGeophysical Research, 112, B08203, http://dx.doi.org/10.1029/2006JB004654
Johnson, J. B. & Ripepe, M. 2011. Volcano Infrasound: a review. Journalof Volcanology and Geothermal Research, 206, 61–69, http://dx.doi.org/10.1016/j.jvolgeores.2011.06.006
Kanamori, H., Given, J. W. & Lay, T. 1984. Analysis of seismic bodywaves excited by the Mount St. Helens eruption of May 18, 1980.Journal of Geophysical Research, 89, 1856–1866.
Komorowski, J. C., Legendre, Y. et al. 2010. Insights into processesand deposits of hazardous vulcanian explosions at Soufriere HillsVolcano during 2008 and 2009 (Montserrat, West Indies). Geophysi-cal Research Letters, 37, L00E19, http://dx.doi.org/10.1029/2010GL042558
Lighthill, M. J. 1978. Waves in Fluids. Cambridge University Press,New York.
Luckett, R., Baptie, B. & Ottemoller, L. 2007. Seismic monitoring atSoufriere Hills Volcano, Montserrat. Seismological Research Letters,78, 192–200, http://dx.doi.org/10.1785/gssrl.78.2.192
Marchetti, E., Ripepe, M., Harris, A. J. L. & Delle Donne, D. 2009.Tracing the differences between Vulcanian and Strombolianexplosions using infrasonic and thermal radiation energy. Earth Pla-netary Science Letters, 279, 273–281, http://dx.doi.org/10.1016/j.epsl.2009.01.004
Nikolkina, I., Zahibo, N., Talipova, T. & Pelinovsky, E. 2011. Pyro-clastic flow from Soufriere Hills Volcano, Montserrat: Solid BlockModel. International Journal of Geosciences, 2, 326–335.
Oshima, H. & Maekawa, T. 2001. Excitation process of infrasonic wavesassociated with Merapi-type pyroclastic flow as revealed by a newrecording system. Geophysical Research Letters, 28, 1099–1102.
Patrick, M. R. 2007. Dynamics of Strombolian ash plumes fromthermal video: motion, morphology, and air entrainment. Journal ofGeophysical Research, 112, B06202, http://dx.doi.org/10.1029/2006JB004387
Patrick, M. R., Wilson, D., Fee, D., Orr, T. & Swanson, D. 2011.Shallow degassing events as a trigger for very-long-period seismicityat Kılauea Volcano, Hawai’i. Bulletin of Volcanology, 73,1179–1186, http://dx.doi.org/10.1007/s00445-011-0475-y
Pistolesi, M., Delle Donne, D., Pioli, L., Rosi, M. & Ripepe, M. 2011.The 15 March 2007 explosive crisis at Stromboli Volcano, Italy:
assessing physical parameters through a multidisciplinary approach.Journal of Geophysical Research, 116, B12206, http://dx.doi.org/10.1029/2011JB008527
Ripepe, M. & Harris, A. J. L. 2008. Dynamics of the 5 April 2003 explo-sive paroxysm observed at Stromboli by a near-vent thermal, seismicand infrasonic array. Geophysical Research Letters, 35, L07306,http://dx.doi.org/10.1029/2007GL032533
Ripepe, M., Marchetti, E. & Ulivieri, G. 2007. Infrasonic monitoringat Stromboli volcano during the 2003 effusive eruption: insights onthe explosive and degassing process of an open conduit system.Journal of Geophysical Research, 112, B09207, http://dx.doi.org/10.1029/2006JB004613
Ripepe, M., De Angelis, S. et al. 2009. Tracking Pyroclastic Flowsat Soufriere Hills Volcano. Eos, Transactions of the AmericanGeophysical Union, 90, 229–230, http://dx.doi.org/10.1029/2009EO270001
Ripepe, M., De Angelis, S., Lacanna, G. & Voight, B. 2010. Obser-vation of infrasonic and gravity waves at Soufriere Hills Volcano,Montserrat. Geophysical Research Letters, 37, L00E14, http://dx.doi.org/10.1029/2010GL042557
Sparks, R. S. J. & Young, S. R. 2002. The eruption of Soufriere HillsVolcano, Montserrat (1995–1999): overview of scientific results.In: Druitt, T. H. & Kokelaar, B. P. (eds) The Eruption of SoufriereHills Volcano, Montserrat, from 1995 to 1999. Geological SocietyLondon, Memoirs, 21, 45–69.
Ulivieri, G., Marchetti, E., Ripepe, M., Chiambretti, I., De Rosa, G.& Segor, V. 2011. Monitoring snow avalanches in NorthwesternItalian Alps using an infrasound array. Cold Regions Science andTechnology, 69, 177–183.
Vergniolle, S. & Caplan-Auerbach, J. 2006. Basaltic thermals andsubplinian plumes: constraints from acoustic measurements atShishaldin volcano, Alaska. Bulletin of Volcanology, 68, 611–630.
Wadge, G., Jackson, P., Bower, S. M., Woods, W. & Calder, E. 1998.Computer simulations of pyroclastic flows from dome collapse.Geophysical Research Letters, 25, 3677–3680.
Watts, R. B., Herd, R. A., Sparks, R. S. J. & Young, S. R. 2002.Growth patterns and emplacement of the andesite lava dome atSoufriere Hills Volcano, Montserrat. In: Druitt, T. H. & Kokelaar,B. P. (eds) The Eruption of Soufriere Hills Volcano, Montserrat,from 1995 to 1999. Geological Society London, Memoirs, 21,115–152.
Wilson, L. 1980. Relationships between pressure, volatile content andejecta velocity in three types of volcanic explosion. Journal of Volca-nology and Geothermal Research, 8, 297–313.
Yamasato, H. 1997. Quantitative analysis of pyroclastic flows using infra-sonic and seismic data at Unzen volcano, Japan. Journal of Physics ofthe Earth, 45, 397–416.
Yokoo, A. & Iguchi, M. 2010. Using infrasound waves from eruptionvideo to explain ground deformation preceding the eruption of Suwa-nosejima volcano, Japan. Journal of Volcanology and GeothermalResearch, 196, 287–294.
Young, S. R., Sparks, R. S. J., Aspinall, W. P., Lynch, L. L., Miller, A.D., Robertson, R. E. A. & Shepherd, J. B. 1998. Overview of theeruption of Soufriere Hills volcano, Montserrat, July 18 1995 toDecember 1997. Geophysical Research Letters, 25, 3389–3392.
D. DELLE DONNE ET AL.176