australian rainforests - the library of...
TRANSCRIPT
Australianrainforests
Islands of green in a land of fire
D.M.J.S. BowmanNorthern Territory University, Australia
PUBLISHED BY THE PRESS SYNDICATE OF THE UNIVERSITY OF CAMBRIDGE
The Pitt Building, Trumpington Street, Cambridge, United Kingdom
CAMBRIDGE UNIVERSITY PRESS
The Edinburgh Building, Cambridge CB2 2RU, UK www.cup.cam.ac.uk
40 West 20th Street, New York, NY 10011-4211, USA www.cup.org
10 Stamford Road, Oakleigh, Melbourne 3166, Australia
Ruiz de Alarcon 13, 28014 Madrid, Spain
© D.M.J.S. Bowman 2000
This book is in copyright. Subject to statutory exception
and to the provisions of relevant collective licensing agreements,
no reproduction of any part may take place without
the written permission of Cambridge University Press.
First published 2000
Printed in the United Kingdom at the University Press, Cambridge
Typeface 9.25/14pt. minion
A catalogue record for this book is available from the British Library
Library of Congress Cataloguing in Publication data
Bowman, D. M. J. S.
Australian rainforests: islands of green in a land of fire /
D.M.J.S. Bowman.
p. cm.
Includes bibliographical references.
ISBN 0 521 46568 0 (hb)
1. Rain forest ecology – Australia. 2. Fire ecology – Australia.
3. Fragmented landscapes – Australia. I. Title.
QK431.B67 2000
577.34'0994–dc21 99–24978−CIP
ISBN 0 521 46568 0 hardback
Contents
Preface page ix1 Introduction 12 What is Australian rainforest? 253 The sclerophyll problem 484 The edaphic theory I. The control of rainforest by
soil phosphorus 685 The edaphic theory II. Soil types, drainage, and fertility 846 The climate theory I. Water stress 997 The climate theory II. Light and temperature 1348 The fire theory I. Field evidence 1569 Thefire theoryII. Fire,nutrientcycling,and topography 185
10 The fire theory III. Fire frequency, succession, andecological drift 196
11 The fire theory IV. Aboriginal landscape burning 21812 The fire theory V. Aridity and the evolution of
flammable forests 25013 The fire theory VI. Fire management and rainforest
conservation 27914 Summary 285References 289Index 327
MMMM
1
Introduction
The existence of patches of rainforest embedded in tracts of Eucalyptus forests
have long perplexed and sometimes astonished Weld biologists. The abrupt
rainforest boundaries often rise up like ‘a dark wall’ (Figure 1.1) in the relatively
open Eucalyptus forest (Herbert 1932) and literally confront ecologists with the
question ‘what determines the position of the boundaries?’ The Xoristic diVeren-
ces between rainforest and Eucalyptus forests can be ‘so great as to suggest
separate geographic and historical origins in spite of their growing side by side’
(Herbert 1932). The purpose of this book is to investigate the deceptively simple
question of why rainforests have such limited and fragmentary coverage in
Australia (Figure 1.2). This basic geographic question raises other questions such
as:
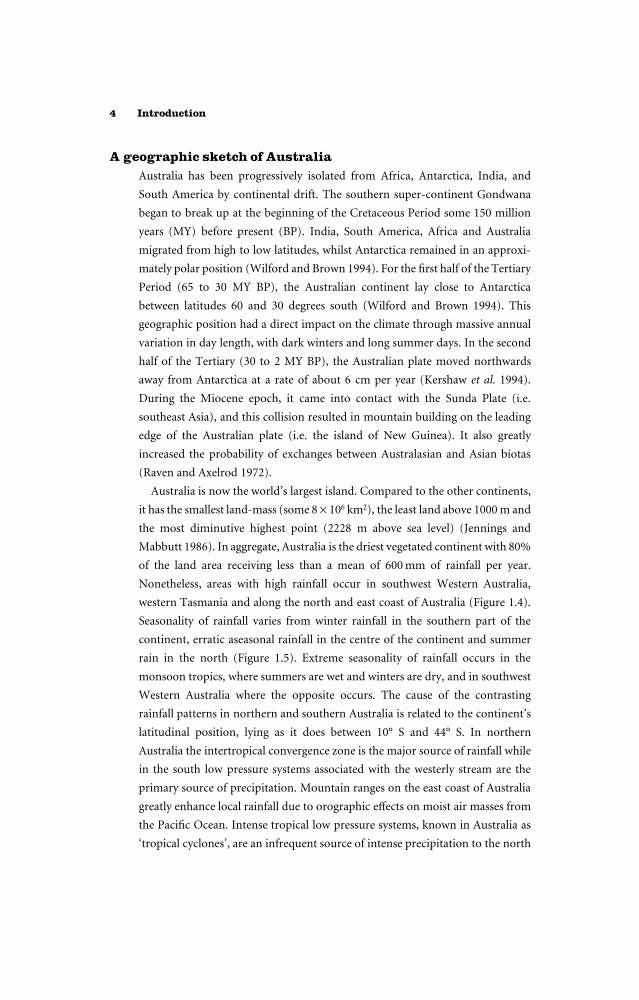
(i) Why should Eucalyptus and Acacia dominate the great bulk of
Australian woody vegetation (Figure 1.3)?
(ii) How should rainforest be deWned in Australia?
(iii) What environmental factors control the local extent of rainforest?
As will become apparent in this book, these questions are central issues in
Australian vegetation science. The rainforest-boundary question occurs in nearly
all the major arguments about Australian woody vegetation. Indeed, a number of
important theories about the ecology of Australian woody vegetation have
explicitly sought to resolve this problem of sharply contrasting forest types
growing side by side. I recognise that the Australian rainforest boundary problem
is a subset of the global biogeographic question concerning the cause of the
diVerentiation between forest and savanna. The forest–savanna boundary is a
problem of ‘bewildering complexity’ (Richards 1952) and has stimulated a
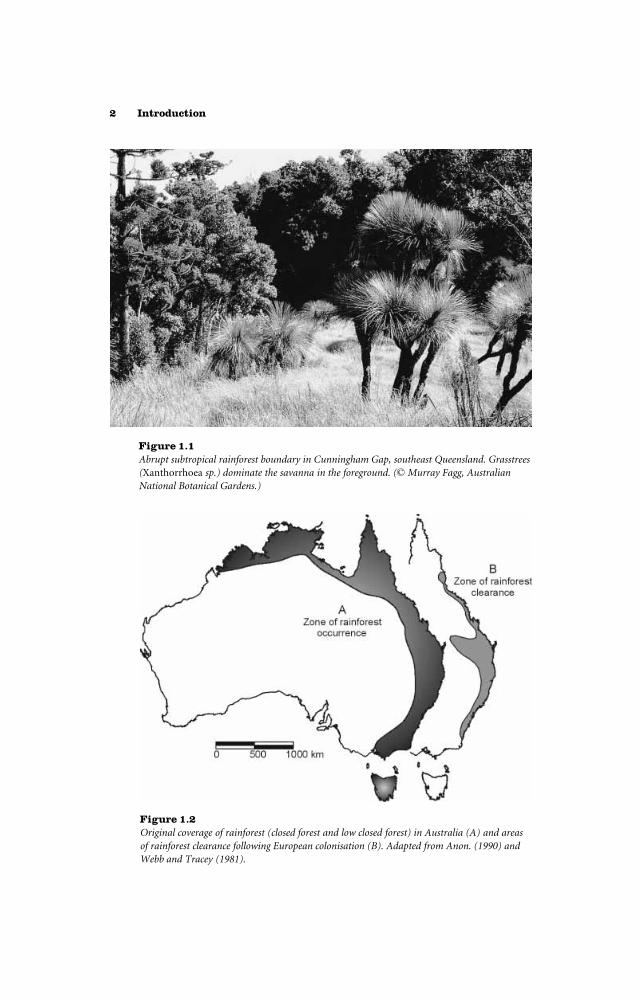
Figure 1.2Original coverage of rainforest (closed forest and low closed forest) in Australia (A) and areasof rainforest clearance following European colonisation (B). Adapted from Anon. (1990) andWebb and Tracey (1981).
Figure 1.1Abrupt subtropical rainforest boundary in Cunningham Gap, southeast Queensland. Grasstrees(Xanthorrhoea sp.) dominate the savanna in the foreground. (© Murray Fagg, AustralianNational Botanical Gardens.)
2 Introduction
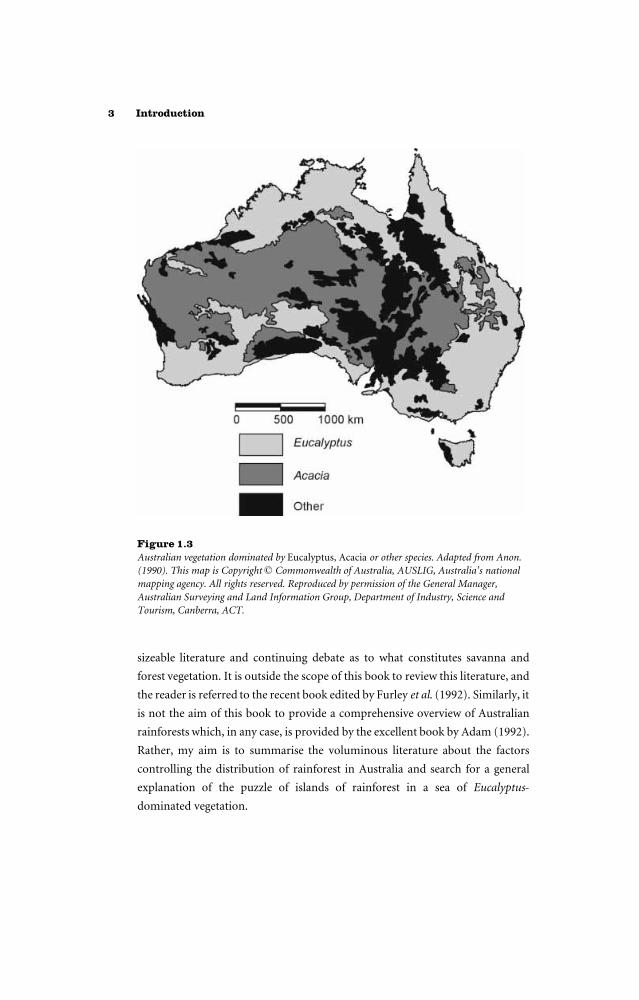
Figure 1.3Australian vegetation dominated by Eucalyptus, Acacia or other species. Adapted from Anon.(1990). This map is Copyright © Commonwealth of Australia, AUSLIG, Australia’s nationalmapping agency. All rights reserved. Reproduced by permission of the General Manager,Australian Surveying and Land Information Group, Department of Industry, Science andTourism, Canberra, ACT.
sizeable literature and continuing debate as to what constitutes savanna and
forest vegetation. It is outside the scope of this book to review this literature, and
the reader is referred to the recent book edited by Furley et al. (1992). Similarly, it
is not the aim of this book to provide a comprehensive overview of Australian
rainforests which, in any case, is provided by the excellent book by Adam (1992).
Rather, my aim is to summarise the voluminous literature about the factors
controlling the distribution of rainforest in Australia and search for a general
explanation of the puzzle of islands of rainforest in a sea of Eucalyptus-
dominated vegetation.
3 Introduction
A geographic sketch of AustraliaAustralia has been progressively isolated from Africa, Antarctica, India, and
South America by continental drift. The southern super-continent Gondwana
began to break up at the beginning of the Cretaceous Period some 150 million
years (MY) before present (BP). India, South America, Africa and Australia
migrated from high to low latitudes, whilst Antarctica remained in an approxi-
mately polar position (Wilford and Brown 1994). For the Wrst half of the Tertiary
Period (65 to 30 MY BP), the Australian continent lay close to Antarctica
between latitudes 60 and 30 degrees south (Wilford and Brown 1994). This
geographic position had a direct impact on the climate through massive annual
variation in day length, with dark winters and long summer days. In the second
half of the Tertiary (30 to 2 MY BP), the Australian plate moved northwards
away from Antarctica at a rate of about 6 cm per year (Kershaw et al. 1994).
During the Miocene epoch, it came into contact with the Sunda Plate (i.e.
southeast Asia), and this collision resulted in mountain building on the leading
edge of the Australian plate (i.e. the island of New Guinea). It also greatly
increased the probability of exchanges between Australasian and Asian biotas
(Raven and Axelrod 1972).
Australia is now the world’s largest island. Compared to the other continents,
it has the smallest land-mass (some 8 × 10⁶ km2), the least land above 1000 m and
the most diminutive highest point (2228 m above sea level) (Jennings and
Mabbutt 1986). In aggregate, Australia is the driest vegetated continent with 80%
of the land area receiving less than a mean of 600 mm of rainfall per year.
Nonetheless, areas with high rainfall occur in southwest Western Australia,
western Tasmania and along the north and east coast of Australia (Figure 1.4).
Seasonality of rainfall varies from winter rainfall in the southern part of the
continent, erratic aseasonal rainfall in the centre of the continent and summer
rain in the north (Figure 1.5). Extreme seasonality of rainfall occurs in the
monsoon tropics, where summers are wet and winters are dry, and in southwest
Western Australia where the opposite occurs. The cause of the contrasting
rainfall patterns in northern and southern Australia is related to the continent’s
latitudinal position, lying as it does between 10° S and 44° S. In northern
Australia the intertropical convergence zone is the major source of rainfall while
in the south low pressure systems associated with the westerly stream are the
primary source of precipitation. Mountain ranges on the east coast of Australia
greatly enhance local rainfall due to orographic eVects on moist air masses from
the PaciWc Ocean. Intense tropical low pressure systems, known in Australia as
‘tropical cyclones’, are an infrequent source of intense precipitation to the north
4 Introduction

Figure 1.4Mean annual precipitation in Australia. Adapted from Adam (1992).
of 30° S. Cyclones are an ecologically signiWcant factor in coastal regions because
of their enormously destructive winds.
The aridity of most of Australia is attributable to the belt of subtropical
high-pressure systems that track across the centre of the continent during the
winter and across southern Australia in the summer. These subtropical high-
pressure systems produce cloudless skies and dry winds, and are responsible
for the high air temperatures and great evaporative potential across much of
Australia.
No month in northern Australia has an average air temperature below 18°C.
Only southeastern Australia including Tasmania, a narrow coastal belt in south-
western Western Australia and a montane area in central New South Wales have
5 A sketch of Australian environments
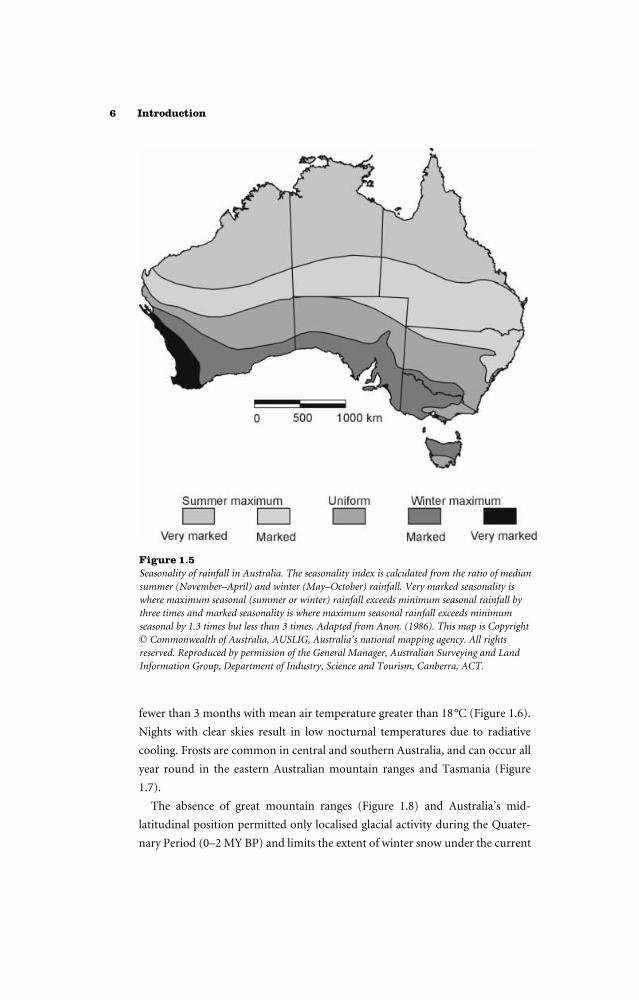
Figure 1.5Seasonality of rainfall in Australia. The seasonality index is calculated from the ratio of mediansummer (November–April) and winter (May–October) rainfall. Very marked seasonality iswhere maximum seasonal (summer or winter) rainfall exceeds minimum seasonal rainfall bythree times and marked seasonality is where maximum seasonal rainfall exceeds minimumseasonal by 1.3 times but less than 3 times. Adapted from Anon. (1986). This map is Copyright© Commonwealth of Australia, AUSLIG, Australia’s national mapping agency. All rightsreserved. Reproduced by permission of the General Manager, Australian Surveying and LandInformation Group, Department of Industry, Science and Tourism, Canberra, ACT.
fewer than 3 months with mean air temperature greater than 18°C (Figure 1.6).
Nights with clear skies result in low nocturnal temperatures due to radiative
cooling. Frosts are common in central and southern Australia, and can occur all
year round in the eastern Australian mountain ranges and Tasmania (Figure
1.7).
The absence of great mountain ranges (Figure 1.8) and Australia’s mid-
latitudinal position permitted only localised glacial activity during the Quater-
nary Period (0–2 MY BP) and limits the extent of winter snow under the current
6 Introduction
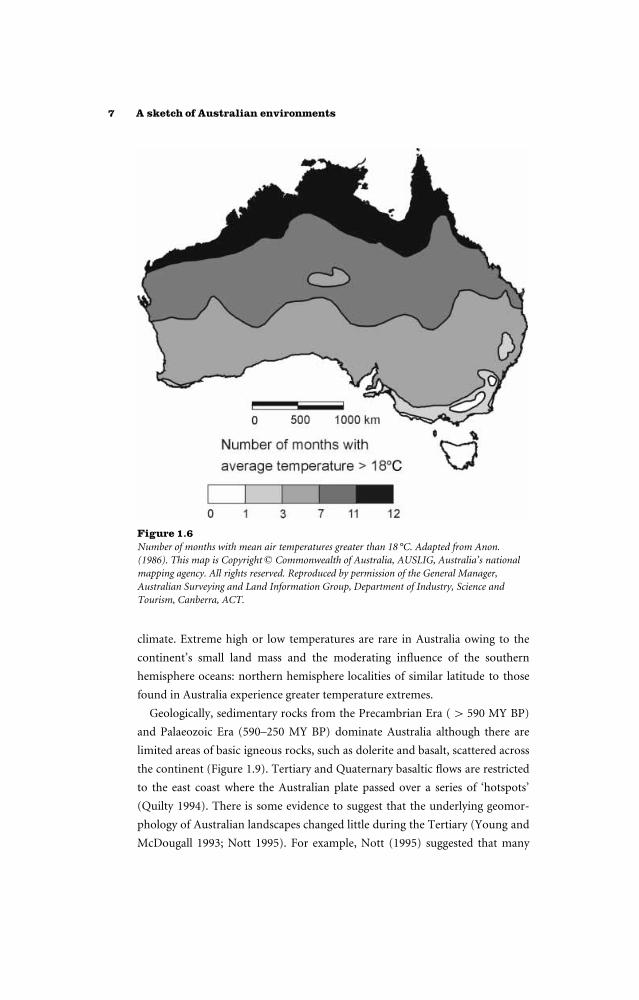
Figure 1.6Number of months with mean air temperatures greater than 18 °C. Adapted from Anon.(1986). This map is Copyright © Commonwealth of Australia, AUSLIG, Australia’s nationalmapping agency. All rights reserved. Reproduced by permission of the General Manager,Australian Surveying and Land Information Group, Department of Industry, Science andTourism, Canberra, ACT.
climate. Extreme high or low temperatures are rare in Australia owing to the
continent’s small land mass and the moderating inXuence of the southern
hemisphere oceans: northern hemisphere localities of similar latitude to those
found in Australia experience greater temperature extremes.
Geologically, sedimentary rocks from the Precambrian Era ( [ 590 MY BP)
and Palaeozoic Era (590–250 MY BP) dominate Australia although there are
limited areas of basic igneous rocks, such as dolerite and basalt, scattered across
the continent (Figure 1.9). Tertiary and Quaternary basaltic Xows are restricted
to the east coast where the Australian plate passed over a series of ‘hotspots’
(Quilty 1994). There is some evidence to suggest that the underlying geomor-
phology of Australian landscapes changed little during the Tertiary (Young and
McDougall 1993; Nott 1995). For example, Nott (1995) suggested that many
7 A sketch of Australian environments

Figure 1.7The median number of days per year when frosts are recorded. Adapted from Anon. (1986).This map is Copyright © Commonwealth of Australia, AUSLIG, Australia’s national mappingagency. All rights reserved. Reproduced by permission of the General Manager, AustralianSurveying and Land Information Group, Department of Industry, Science and Tourism,Canberra, ACT.
northern Australian landscapes, including ‘ranges, plains and valleys’, have
changed little in the last 100 MY! The stability of the land surface allowed the
production of very deeply weathered proWles (i.e. laterites to [ 50 m) through-
out Australia (including Tasmania, albeit where they are uncommon) (Taylor
1994). It is diYcult to age lateritic surfaces, although isotopic dating of basalt
Xows in north-east Queensland enabled Coventry et al. (1985) to demonstrate
that some lateritic proWles are ‘considerably older than 6.3 MY’. Although it is
widely assumed that deep weathering reXects hot, humid conditions, this may
not be the case. Taylor (1994) noted that deep weathering might also occur
under cold, humid conditions. The dominance of tectonically stable, ancient
sedimentary rocks and very limited glaciation during the Mesozoic Era (250–65
MY BP) and Cainozoic Era ( \ 65 MY BP) have resulted in large areas of
8 Introduction

Figure 1.8Areas greater than 600 m above sea level. Adapted from Taylor (1994) and reprinted with thepermission of Cambridge University Press.
Australia having extremely old and infertile soils. SigniWcant exceptions are
fertile soils developed on basalt Xows and alluvial plains.
During the Quaternary ice ages, lower sea levels exposed a vast continental
shelf which increased Australia’s land mass by more than 40% and united the
mainland with the islands of Tasmania to the south and New Guinea to the
north. These allowed the ancestors of the modern Aborigines to colonise the
continent from southeast Asia about 50 000 years BP. Remarkably little is known
about these ice-age Australians, indeed there is considerable debate as to the
exact timing of their colonisation. Although variable across the continent,
Aboriginal cultures were characteristically nomadic, tracking seasonal resource
availability: no group of Aborigines practised agriculture. European colonisation
occurred following the Wrst settlements in 1788. Europeans have greatly trans-
formed the Australian continent through intentional and unintentional intro-
duction of numerous plants, animals and diseases, large scale clearance of native
vegetation (Figures 1.2 and 1.10) and by draining wetlands, damming rivers
and increasing local supplies of water by irrigation and tapping aquifers. Kirk-
patrick (1994) has concisely summarised many of these profound ecological
9 A sketch of Australian environments

Figure 1.9Area of basic to ultrabasic volcanic rocks (i.e. basalt, minor agglomerate, tuV) and basic toultrabasic intrusive (dolerite, serpentine, minor norite, gabbro) in Australia, regardless ofgeological age. Adapted from Anon. (1988). This map is Copyright © Commonwealth ofAustralia, AUSLIG, Australia’s national mapping agency. All rights reserved. Reproduced bypermission of the General Manager, Australian Surveying and Land Information Group,Department of Industry, Science and Tourism, Canberra, ACT.
transformations. These changes are ongoing, but have had little direct eVect on
large areas of northern Australia. There European population densities remain
very low and Aboriginal populations are relatively high. Nonetheless, the break-
down of Aboriginal Wre-management practices, weed invasion, decline of some
mammal and bird species and damage by feral and domesticated stock suggest
that the apparently intact north Australian ecosystems have been degraded since
European colonisation.
Geographic pattern of Australian rainforestPutting aside the vexatious issue of rainforest deWnition for the moment, I shall
brieXy describe the distribution patterns of Australian rainforest at the continen-
tal, regional and local scales. Australian rainforests have a fragmentary distribu-
10 Introduction
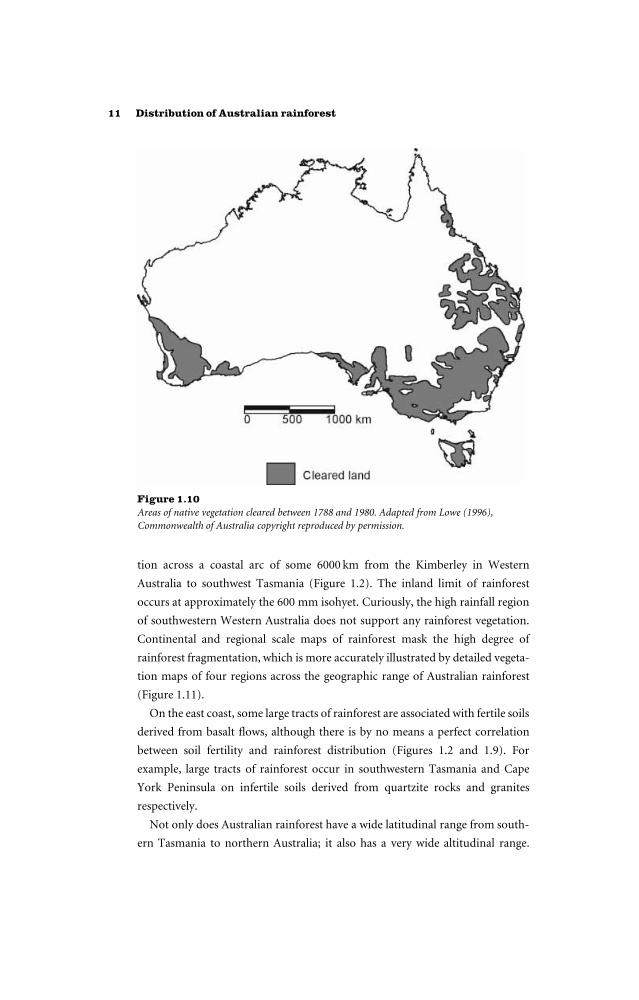
Figure 1.10Areas of native vegetation cleared between 1788 and 1980. Adapted from Lowe (1996),Commonwealth of Australia copyright reproduced by permission.
tion across a coastal arc of some 6000 km from the Kimberley in Western
Australia to southwest Tasmania (Figure 1.2). The inland limit of rainforest
occurs at approximately the 600 mm isohyet. Curiously, the high rainfall region
of southwestern Western Australia does not support any rainforest vegetation.
Continental and regional scale maps of rainforest mask the high degree of
rainforest fragmentation, which is more accurately illustrated by detailed vegeta-
tion maps of four regions across the geographic range of Australian rainforest
(Figure 1.11).
On the east coast, some large tracts of rainforest are associated with fertile soils
derived from basalt Xows, although there is by no means a perfect correlation
between soil fertility and rainforest distribution (Figures 1.2 and 1.9). For
example, large tracts of rainforest occur in southwestern Tasmania and Cape
York Peninsula on infertile soils derived from quartzite rocks and granites
respectively.
Not only does Australian rainforest have a wide latitudinal range from south-
ern Tasmania to northern Australia; it also has a very wide altitudinal range.
11 Distribution of Australian rainforest

12 Introduction

Figure 1.11Maps showing the eVect of spatial scale on the distribution of rainforest in four regions acrossthe arc of rainforest in Australia. Adapted from Adam (1992), Kirkpatrick (1977), Dodson andMyers (1986), Ash (1988), and Clayton-Greene and Beard (1985).
13 Distribution of Australian rainforest
Throughout its range, rainforest occurs from sea level to the altitudinal limit of
woody vegetation; indeed some types of rainforest are restricted to high elevation
sites (e.g. montane tropical rainforests, and alpine rainforests in Tasmania).
Webb et al. (1984) undertook a numeric biogeographical analysis of Austra-
lian rainforests based on Xoristic lists collected across the geographic range of the
vegetation. They identiWed three broad classiWcatory groups of rainforest that
correspond to climatic zones which they described as ‘ecoXoristic regions’: their
‘Group A’ was mainly temperate but includes some areas in the humid sub-
tropics; ‘Group B’ was characterised by tropical forests; and ‘Group C’ was
characterised by rainforests in the subtropics. However, within these three broad
groups Webb et al. (1984) identiWed a total of eight further subdivisions which
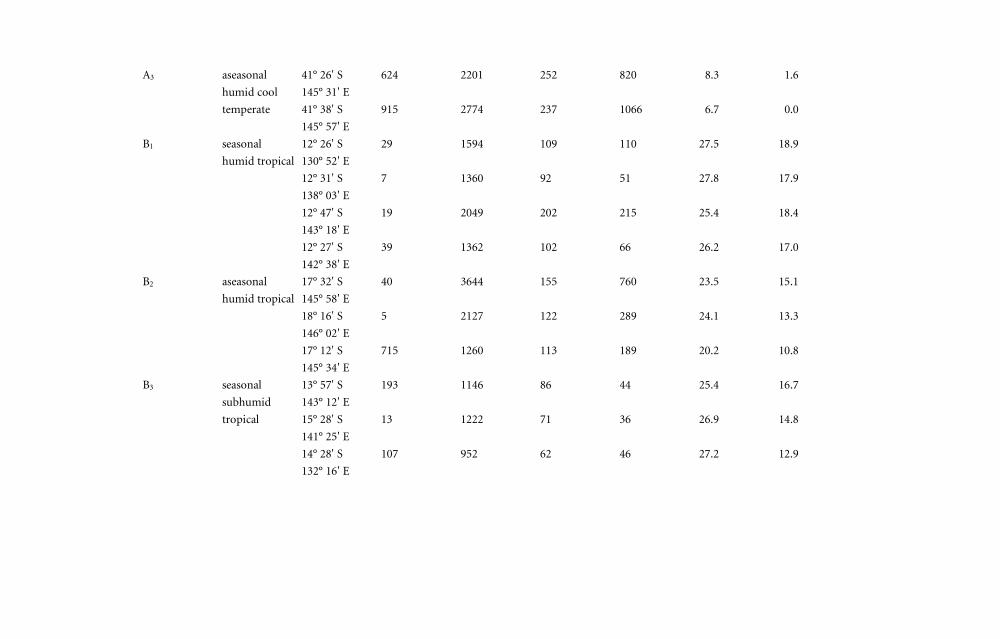
they described as ‘ecoXoristic provinces’ (see Table 1.1 and Figure 1.12). Only
three (A3; B3; C2) of these eight groups were geographically distinct (Figures 1.13
and 1.14). The other groups, which all occur on the east coast, overlap to greater
or less amounts (Figure 1.15). They explained the overlap between the various
‘ecoXoristic provinces’ as being a consequence of habitat heterogeneity in eastern
Australia associated with steep altitudinal and rainfall gradients and the juxtapo-
sition of sites with contrasting geology and hence soil fertility. They also sugges-
ted that some of the overlaps might be explained as the result of long-term
climatic changes that have resulted in ‘relictual’ or environmentally-discordant
distributions of some rainforest types. Clearly, the complex distribution patterns
of rainforest types prohibit the rigid application of simple climatic classiWcations
such as tropical and subtropical rainforest. In any case, Webb et al. (1984)
demonstrated that Australian rainforests can legitimately be seen as a Xoristic
continuum with a considerable number of species and genera co-occurring
between ‘ecoXoristic regions’ (Figure 1.16). For example, about 13% of the
rainforest tree species occur in all three ‘ecoXoristic regions’. Thus any biogeo-
graphic classiWcation of Australian rainforests is necessarily imperfect, and deW-
nitions of regions ultimately include an arbitrary component. In this book, I have
occasionally broken up the huge continuum of Australian rainforests into four
geographic zones: monsoon tropics, humid tropics, subtropics and temperate. I
acknowledge that this division ignores the complexity of altitudinal eVects on
climate and edaphic inXuences on rainforest vegetation. I have pursued this
classiWcation because it is a convenient method of relating studies that have been
conducted in the same geographic zone, and in some cases, the same landscape.
The transition between rainforest and the surrounding non-rainforest vegeta-
tion is typically abrupt for monsoon and tropical rainforests (Figure 1.17).
However, in some situations rainforest invades the surrounding Eucalyptus
14 Introduction

Figure 1.12Boundaries of ‘ecoXoristic provinces’ deWned by Webb et al. (1984).
15 Distribution of Australian rainforest

TABLE 1.1. Climatic variables for characteristic meteorological stations for eight major rainforest ‘ecofloristic provinces’ in
Australia
EcoXoristic
province Climate type
Latitude and
longitude Altitude
Mean annual
rainfall
(mm)
Mean annual
rain days
Mean rainfall in
driest 6
consecutive
months (mm)
Mean annual
air temperature
(°C)
Mean minimum
temperature of
coldest month
(°C)
A1 aseasonal
humid warm
subtropical
aseasonal
humid cool
subtropical
28° 19' S
153° 26' E
30° 19' S
153° 07' E
28° 36' S
153° 23' E
31° 23' S
152° 15' E
5
3
381
146
1722
1759
2388
1603
142
147
147
159
550
569
762
499
19.3
18.3
16.6
17.3
5.8
6.6
5.8
3.8
A2 aseasonal
humid
montane
subtropical
aseasonal
humid warm
temperate
33° 42' S
150° 22' E
30° 37' S
152° 11' E
37° 32' S
149° 09' E
883
1036
88
1374
1516
1004
149
130
146
406
444
448
12.3
13.1
14.1
1.5
2.8
2.0
A3 aseasonal
humid cool
temperate
41° 26' S
145° 31' E
41° 38' S
145° 57' E
624
915
2201
2774
252
237
820
1066
8.3
6.7
1.6
0.0
B1 seasonal
humid tropical
12° 26' S
130° 52' E
12° 31' S
138° 03' E
12° 47' S
143° 18' E
12° 27' S
142° 38' E
29
7
19
39
1594
1360
2049
1362
109
92
202
102
110
51
215
66
27.5
27.8
25.4
26.2
18.9
17.9
18.4
17.0
B2 aseasonal
humid tropical
17° 32' S
145° 58' E
18° 16' S
146° 02' E
17° 12' S
145° 34' E
40
5
715
3644
2127
1260
155
122
113
760
289
189
23.5
24.1
20.2
15.1
13.3
10.8
B3 seasonal
subhumid
tropical
13° 57' S
143° 12' E
15° 28' S
141° 25' E
14° 28' S
132° 16' E
193
13
107
1146
1222
952
86
71
62
44
36
46
25.4
26.9
27.2
16.7
14.8
12.9
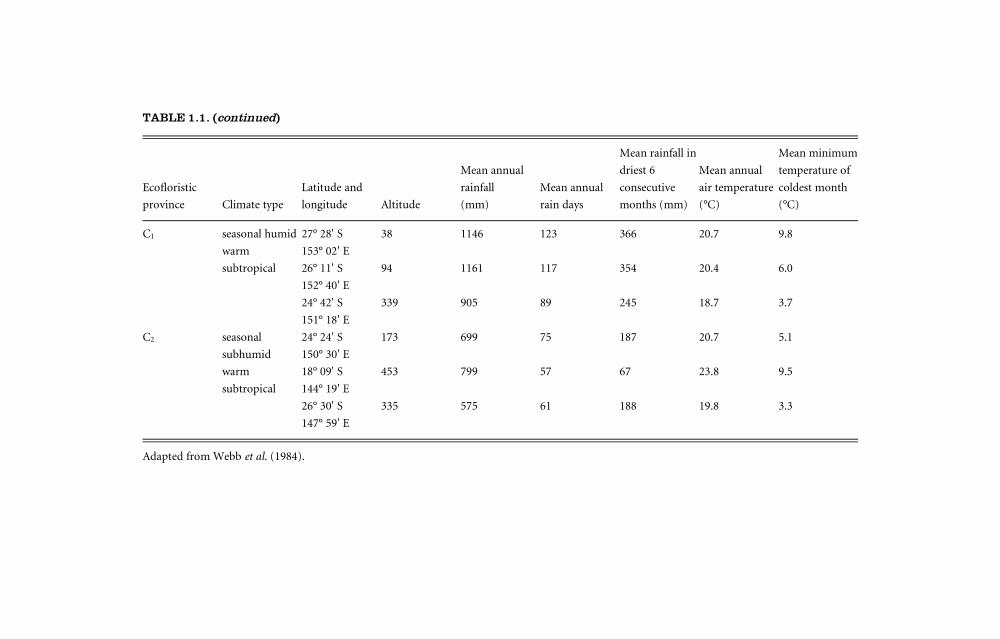
TABLE 1.1. (continued)
EcoXoristic
province Climate type
Latitude and
longitude Altitude
Mean annual
rainfall
(mm)
Mean annual
rain days
Mean rainfall in
driest 6
consecutive
months (mm)
Mean annual
air temperature
(°C)
Mean minimum
temperature of
coldest month
(°C)
C1 seasonal humid
warm
subtropical
27° 28' S
153° 02' E
26° 11' S
152° 40' E
24° 42' S
151° 18' E
38
94
339
1146
1161
905
123
117
89
366
354
245
20.7
20.4
18.7
9.8
6.0
3.7
C2 seasonal
subhumid
warm
subtropical
24° 24' S
150° 30' E
18° 09' S
144° 19' E
26° 30' S
147° 59' E
173
453
335
699
799
575
75
57
61
187
67
188
20.7
23.8
19.8
5.1
9.5
3.3
Adapted from Webb et al. (1984).

Figure 1.13Interior of a Nothofagus cunninghamii rainforest on fertile soil in northwestern Tasmania.This forest type is typical of the rainforests in the A3 ecoXoristic province (Webb et al. 1984).(Photograph: David Bowman.)
Figure 1.14Boundary of a monsoon vine-thicket rainforest on basalt soils in northeastern Queensland. Thisforest type is typical of rainforest in the B3 ecoXoristic province (Webb et al. 1984).(Photograph: David Bowman.)
19 Distribution of Australian rainforest

Figure 1.15ProWle of humid tropical rainforest near Cape Tribulation in northeastern Queensland. Thisforest type is typical of rainforest in the B1 ecoXoristic province (Webb et al. 1984). (© MurrayFagg, Australian National Botanical Gardens.)
Figure 1.16Percentage of rainforest species from a sample of 1316 tree species that occur in the three‘ecoXoristic regions’ that divide up the geographic range of Australian rainforest. Adapted fromWebb et al. (1984).
20 Introduction
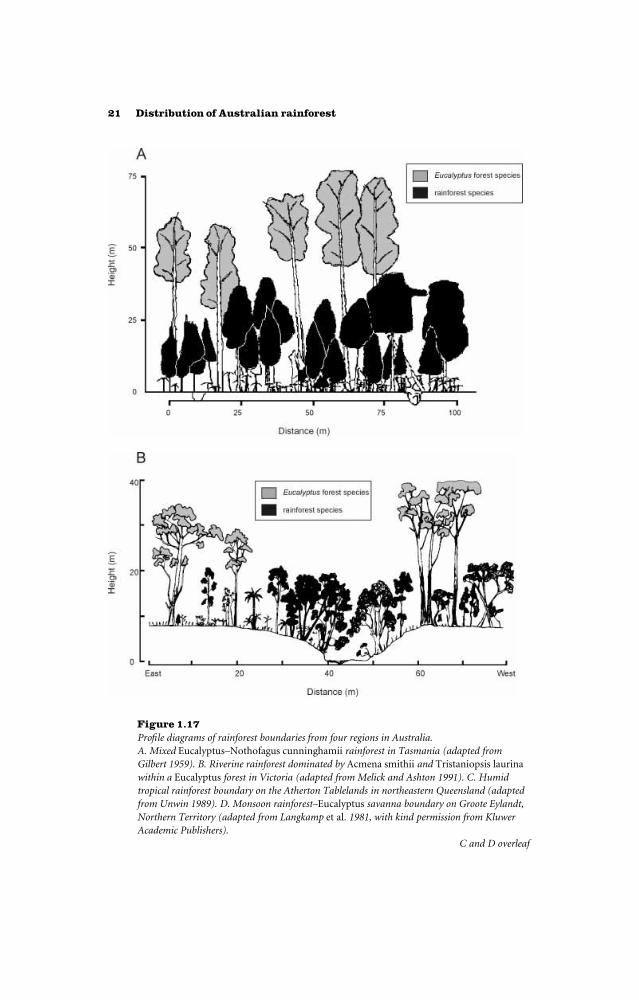
Figure 1.17ProWle diagrams of rainforest boundaries from four regions in Australia.A. Mixed Eucalyptus–Nothofagus cunninghamii rainforest in Tasmania (adapted fromGilbert 1959). B. Riverine rainforest dominated by Acmena smithii and Tristaniopsis laurinawithin a Eucalyptus forest in Victoria (adapted from Melick and Ashton 1991). C. Humidtropical rainforest boundary on the Atherton Tablelands in northeastern Queensland (adaptedfrom Unwin 1989). D. Monsoon rainforest–Eucalyptus savanna boundary on Groote Eylandt,Northern Territory (adapted from Langkamp et al. 1981, with kind permission from KluwerAcademic Publishers).
C and D overleaf
21 Distribution of Australian rainforest
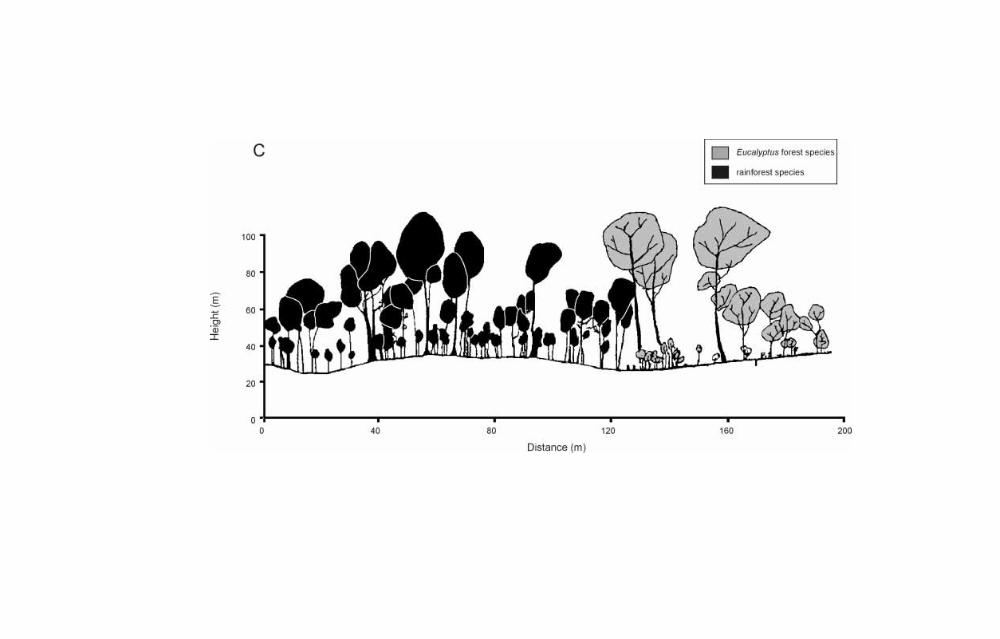
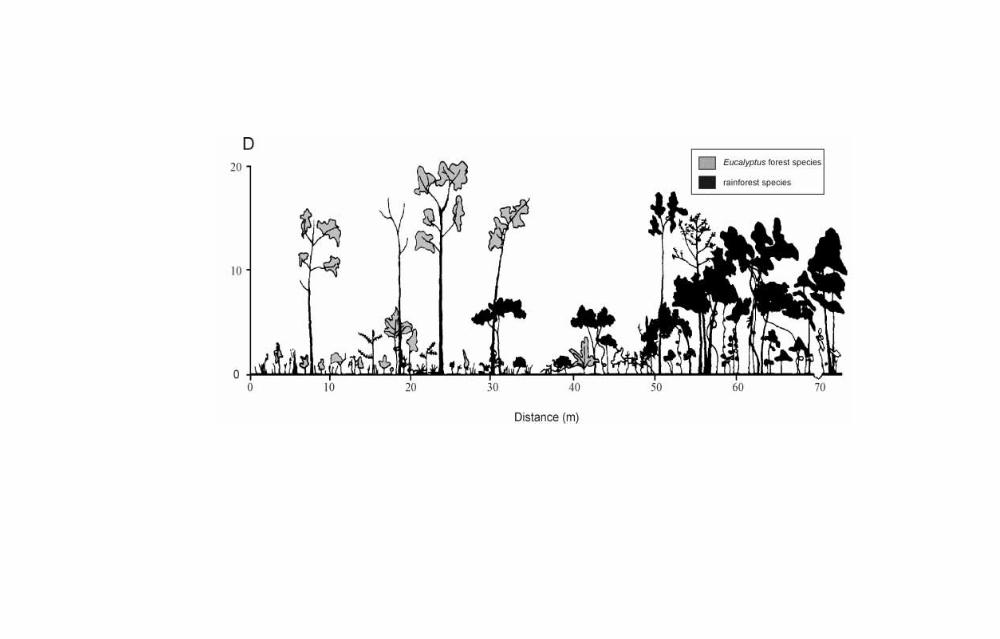

forests (Figure 1.17). The width of these rainforest ecotones is highly variable but
typically less than one km. The boundary of temperate rainforests can be either
abrupt or extremely gradual. Wide ecotones are often recognised as a distinct
community known as ‘mixed forests’ (Figure 1.17), and in Tasmania there are
large tracts of these mixed forests. The mixture of rainforest and Eucalyptus forest
has bedevilled neat deWnitions of ‘rainforest’ in Australia. The deWnition of
rainforest in Australia is the subject of the following two chapters. The remainder
of the book seeks to explain why Australian rainforests have a fragmentary
distribution.
Fire, air, earth and waterA number of theories have been advanced to explain the control of rainforest in
Australia. Some of these theories have been concealed, Trojan-horse-like, within
deWnitions of ‘rainforest’. Other theories are explicit and typically have cham-
pioned the primacy of single environmental contingencies such as Wre history,
environmental changes, soil fertility, or water stress. Some theories are so broad
in scope that they cover all bases by acknowledging the importance of many
factors and their complex interactions. Clearly, the various theories are compet-
ing for the same intellectual space. The aim of this book is to subject them to
critical analysis to determine if there is a general explanation for the continent-
wide fragmentary distribution of Australian rainforest.
24 Introduction