australian foundation investment company limited statutory ... · 8/29/2016 · (a) all dividends...
TRANSCRIPT
29 August 2016 The Manager ASX Market Announcements Australian Securities Exchange Exchange Centre Level 4 20 Bridge Street Sydney NSW 2000 Electronic Lodgement
Australian Foundation Investment Company Limited Statutory Annual Report, Annual Shareholder Review,
Notice of Meeting and Proxy Form Dear Sir / Madam Please find attached the 2016 Statutory Annual Report, Annual Shareholder Review, Notice of Meeting and Proxy Form being sent to shareholders. Yours faithfully
Matthew Rowe Company Secretary
For
per
sona
l use
onl
y
Annual Report 2016
EXPERIENCE INCOME GROWTH
For
per
sona
l use
onl
y
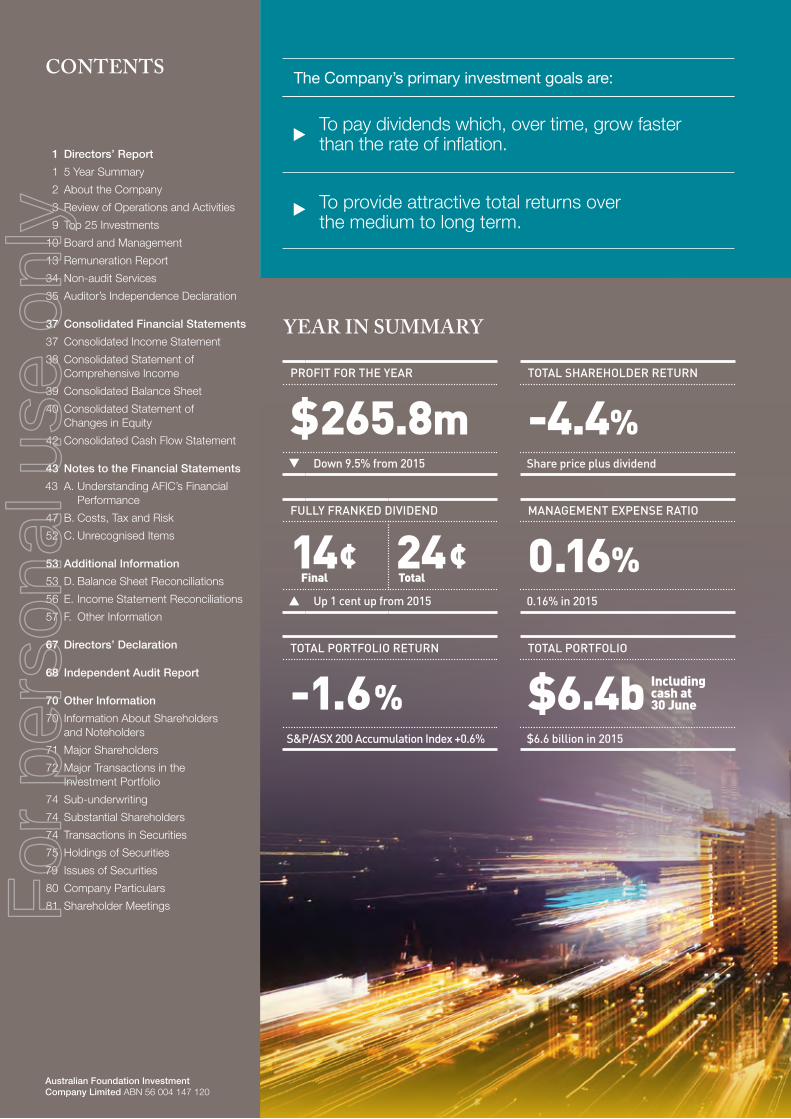
YEAR IN SUMMARY
The Company’s primary investment goals are:
To provide attractive total returns over the medium to long term.
To pay dividends which, over time, grow faster than the rate of inflation.
1 Directors’ Report
1 5 Year Summary
2 About the Company
3 Review of Operations and Activities
9 Top 25 Investments
10 Board and Management
13 Remuneration Report
34 Non-audit Services
35 Auditor’s Independence Declaration
37 Consolidated Financial Statements
37 Consolidated Income Statement
38 Consolidated Statement of Comprehensive Income
39 Consolidated Balance Sheet
40 Consolidated Statement of Changes in Equity
42 Consolidated Cash Flow Statement
43 Notes to the Financial Statements
43 A. Understanding AFIC’s Financial Performance
47 B. Costs, Tax and Risk
52 C. Unrecognised Items
53 Additional Information
53 D. Balance Sheet Reconciliations
56 E. Income Statement Reconciliations
57 F. Other Information
67 Directors’ Declaration
68 Independent Audit Report
70 Other Information
70 Information About Shareholders and Noteholders
71 Major Shareholders
72 Major Transactions in the Investment Portfolio
74 Sub-underwriting
74 Substantial Shareholders
74 Transactions in Securities
75 Holdings of Securities
79 Issues of Securities
80 Company Particulars
81 Shareholder Meetings
CONTENTS
PROFIT FOR THE YEAR
$265.8mDown 9.5% from 2015
FULLY FRANKED DIVIDEND
14¢ Final24¢ Total
Up 1 cent up from 2015
TOTAL PORTFOLIO RETURN
-1.6%
S&P/ASX 200 Accumulation Index +0.6%
TOTAL SHAREHOLDER RETURN
-4.4%
Share price plus dividend
MANAGEMENT EXPENSE RATIO
0.16%
0.16% in 2015
TOTAL PORTFOLIO
$6.4b $6.6 billion in 2015
Including cash at 30 June
Australian Foundation Investment Company Limited ABN 56 004 147 120
For
per
sona
l use
onl
y
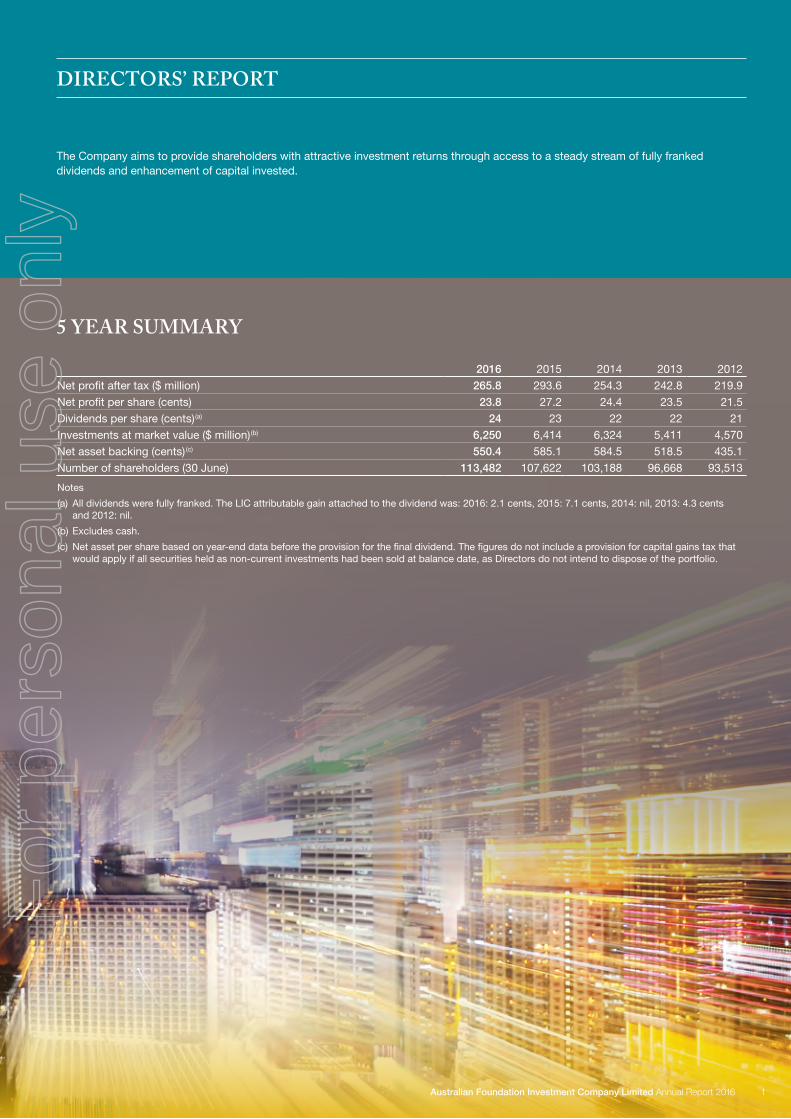
2016 2015 2014 2013 2012
Net profit after tax ($ million) 265.8 293.6 254.3 242.8 219.9
Net profit per share (cents) 23.8 27.2 24.4 23.5 21.5
Dividends per share (cents)(a) 24 23 22 22 21
Investments at market value ($ million)(b) 6,250 6,414 6,324 5,411 4,570
Net asset backing (cents) (c) 550.4 585.1 584.5 518.5 435.1
Number of shareholders (30 June) 113,482 107,622 103,188 96,668 93,513
Notes
(a) All dividends were fully franked. The LIC attributable gain attached to the dividend was: 2016: 2.1 cents, 2015: 7.1 cents, 2014: nil, 2013: 4.3 cents and 2012: nil.
(b) Excludes cash.
(c) Net asset per share based on year-end data before the provision for the final dividend. The figures do not include a provision for capital gains tax that would apply if all securities held as non-current investments had been sold at balance date, as Directors do not intend to dispose of the portfolio.
5 YEAR SUMMARY
DIRECTORS’ REPORT
The Company aims to provide shareholders with attractive investment returns through access to a steady stream of fully franked dividends and enhancement of capital invested.
1Australian Foundation Investment Company Limited Annual Report 2016
For
per
sona
l use
onl
y
Australian Foundation Investment Company Limited (AFIC) specialises in investing in Australian equities. We have been investing in Australian companies for over 80 years and is Australia’s largest listed investment company.
Investment AimsThe Company aims to provide shareholders with attractive investment returns through access to a growing stream of fully franked dividends and enhancement of capital invested.
The Company’s primary investment goals are to pay dividends, which, over time, grow faster than the rate of inflation and to provide attractive total returns over the medium to long term.
Approach to InvestingThe investment philosophy is built on taking a medium to longer term view of value, which means that the aim is to buy and hold individual stocks for the long term based on selection criteria, which, in summary, include:
• formulation and execution of business strategy of the Company and its underlying business value;
• key financial indicators, including cash flow, prospective price earnings relative to projected growth, sustainability of earnings and dividend yield; and
• corporate governance practices.
The Company has access to lines of credit of up to $150 million, which allows it to borrow money when appropriate investment returns are available. The Company also has on issue $190.5 million of convertible notes.
The Company also uses options written against a small proportion of its investments to generate additional income.
Our StructureThe Company has a ‘closed end’ structure, which means that the number of shares on issue is fixed and set by the Board. As a result, the Company does not issue new shares or cancel them as investors enter and leave. This allows management to concentrate on the performance of the funds invested over the longer term without having to deal with continuous inflows or outflows of monies.
FeesThe management expense ratio to 30 June 2016 was 0.16 per cent of assets. The Company does not charge entry or exit fees when shareholders acquire or dispose of their holdings although transaction costs will be borne by the shareholder when buying or selling through a stockbroker. There are no trailing commissions or portfolio performance fees.
Investing in the Company By investing in the Company, shareholders have immediate access to a diversified portfolio numbering around 100 companies, most of which are predominantly Australia’s major companies and to a Board and Investment Committee with extensive investment skills and practical business experience. The Company’s shares can be bought or sold through the Australian Securities Exchange and New Zealand Securities Exchange (ASX Code: AFI, NZX Code: AFI). The Company’s convertible notes can be bought or sold through the Australian Securities Exchange (ASX Code: AFIG).
TransparencyWe take an active approach to keeping shareholders informed about the Company’s activities and performance including yearly and half-yearly profit announcements, regular shareholder briefings and access to all Company announcements, including monthly net tangible asset announcements, through the Australian Securities Exchange, the New Zealand Securities Exchange and the Company’s website afi.com.au
ABOUT THE COMPANY
2 Australian Foundation Investment Company Limited Annual Report 2016
For
per
sona
l use
onl
y
ProfitProfit for the year to 30 June 2016 was $265.8 million, down from $293.6 million the prior year. Last year’s figure included a special non-cash dividend of $31.9 million received from the demerger of South32 from BHP Billiton. Excluding this item the profit was up 1.5 per cent.
Income from investments (excluding demerger dividends), which consists primarily of franked dividends, was up 0.1 per cent over the year. In volatile markets, there was an increased use of the trading portfolio which contributed $12.3 million compared to $8.4 million last year.
Earnings per share for the year were 23.8 cents per share compared with 27.2 cents per share last year.
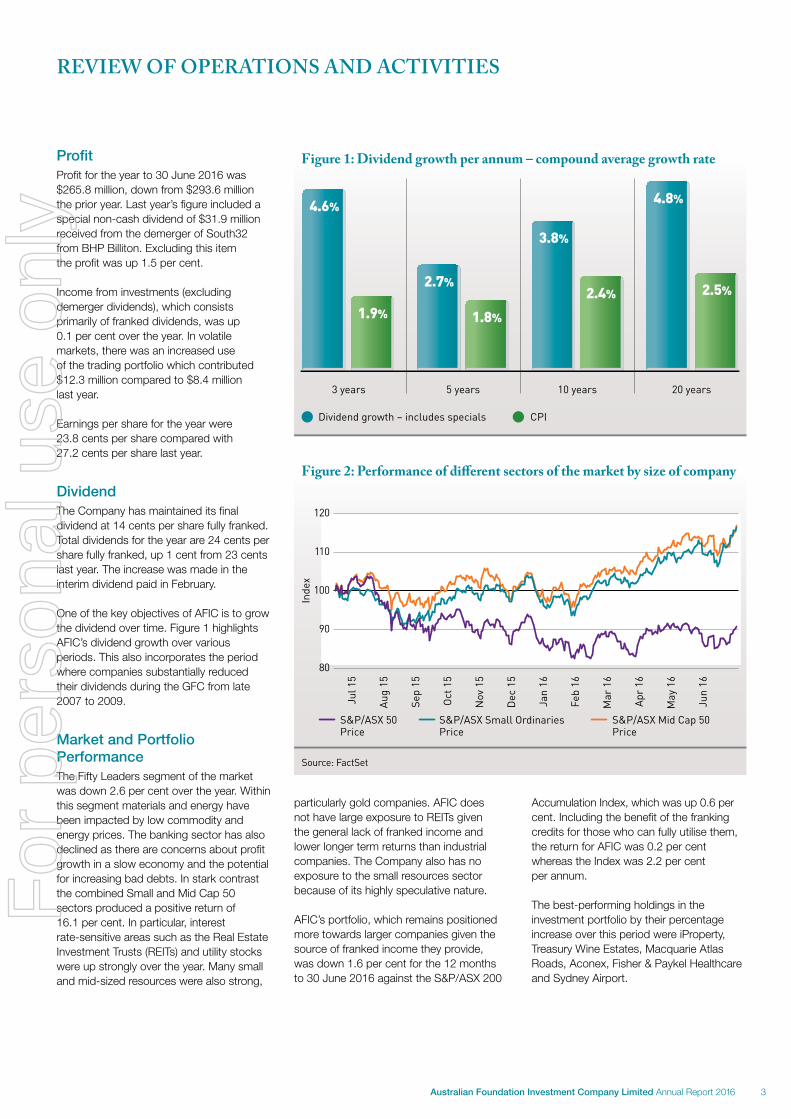
DividendThe Company has maintained its final dividend at 14 cents per share fully franked. Total dividends for the year are 24 cents per share fully franked, up 1 cent from 23 cents last year. The increase was made in the interim dividend paid in February.
One of the key objectives of AFIC is to grow the dividend over time. Figure 1 highlights AFIC’s dividend growth over various periods. This also incorporates the period where companies substantially reduced their dividends during the GFC from late 2007 to 2009.
Market and Portfolio PerformanceThe Fifty Leaders segment of the market was down 2.6 per cent over the year. Within this segment materials and energy have been impacted by low commodity and energy prices. The banking sector has also declined as there are concerns about profit growth in a slow economy and the potential for increasing bad debts. In stark contrast the combined Small and Mid Cap 50 sectors produced a positive return of 16.1 per cent. In particular, interest rate-sensitive areas such as the Real Estate Investment Trusts (REITs) and utility stocks were up strongly over the year. Many small and mid-sized resources were also strong,
particularly gold companies. AFIC does not have large exposure to REITs given the general lack of franked income and lower longer term returns than industrial companies. The Company also has no exposure to the small resources sector because of its highly speculative nature.
AFIC’s portfolio, which remains positioned more towards larger companies given the source of franked income they provide, was down 1.6 per cent for the 12 months to 30 June 2016 against the S&P/ASX 200
Accumulation Index, which was up 0.6 per cent. Including the benefit of the franking credits for those who can fully utilise them, the return for AFIC was 0.2 per cent whereas the Index was 2.2 per cent per annum.
The best-performing holdings in the investment portfolio by their percentage increase over this period were iProperty, Treasury Wine Estates, Macquarie Atlas Roads, Aconex, Fisher & Paykel Healthcare and Sydney Airport.
REVIEW OF OPERATIONS AND ACTIVITIES
4.6%
1.9%
2.7%
1.8%
3.8%
2.4%
X.X%4.8%
2.5%
Figure 1: Dividend growth per annum – compound average growth rate
20 years
Dividend growth – includes specials CPI
3 years 5 years 10 years
Figure 2: Performance of di�erent sectors of the market by size of company
S&P/ASX 50Price
S&P/ASX Small OrdinariesPrice
S&P/ASX Mid Cap 50Price
May
16
Apr
16
Mar
16
Feb
16
Jan
16
Dec
15
Jun
16
Nov
15
Oct
15
Sep
15
Aug
15
Jul 1
5
80
120
90
100
Inde
x
110
Source: FactSet
3Australian Foundation Investment Company Limited Annual Report 2016
For
per
sona
l use
onl
y
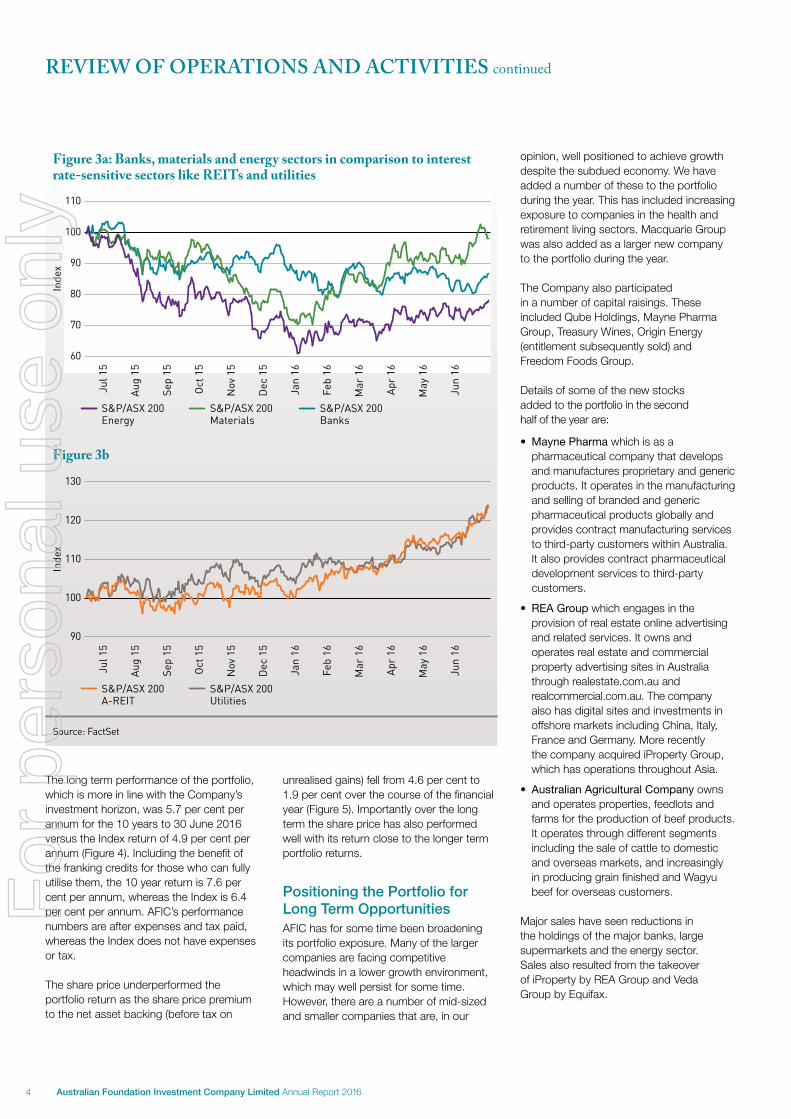
The long term performance of the portfolio, which is more in line with the Company’s investment horizon, was 5.7 per cent per annum for the 10 years to 30 June 2016 versus the Index return of 4.9 per cent per annum (Figure 4). Including the benefit of the franking credits for those who can fully utilise them, the 10 year return is 7.6 per cent per annum, whereas the Index is 6.4 per cent per annum. AFIC’s performance numbers are after expenses and tax paid, whereas the Index does not have expenses or tax.
The share price underperformed the portfolio return as the share price premium to the net asset backing (before tax on
unrealised gains) fell from 4.6 per cent to 1.9 per cent over the course of the financial year (Figure 5). Importantly over the long term the share price has also performed well with its return close to the longer term portfolio returns.
Positioning the Portfolio for Long Term OpportunitiesAFIC has for some time been broadening its portfolio exposure. Many of the larger companies are facing competitive headwinds in a lower growth environment, which may well persist for some time. However, there are a number of mid-sized and smaller companies that are, in our
opinion, well positioned to achieve growth despite the subdued economy. We have added a number of these to the portfolio during the year. This has included increasing exposure to companies in the health and retirement living sectors. Macquarie Group was also added as a larger new company to the portfolio during the year.
The Company also participated in a number of capital raisings. These included Qube Holdings, Mayne Pharma Group, Treasury Wines, Origin Energy (entitlement subsequently sold) and Freedom Foods Group.
Details of some of the new stocks added to the portfolio in the second half of the year are:
• Mayne Pharma which is as a pharmaceutical company that develops and manufactures proprietary and generic products. It operates in the manufacturing and selling of branded and generic pharmaceutical products globally and provides contract manufacturing services to third-party customers within Australia. It also provides contract pharmaceutical development services to third-party customers.
• REA Group which engages in the provision of real estate online advertising and related services. It owns and operates real estate and commercial property advertising sites in Australia through realestate.com.au and realcommercial.com.au. The company also has digital sites and investments in offshore markets including China, Italy, France and Germany. More recently the company acquired iProperty Group, which has operations throughout Asia.
• Australian Agricultural Company owns and operates properties, feedlots and farms for the production of beef products. It operates through different segments including the sale of cattle to domestic and overseas markets, and increasingly in producing grain finished and Wagyu beef for overseas customers.
Major sales have seen reductions in the holdings of the major banks, large supermarkets and the energy sector. Sales also resulted from the takeover of iProperty by REA Group and Veda Group by Equifax.
REVIEW OF OPERATIONS AND ACTIVITIES continued
Figure 3a: Banks, materials and energy sectors in comparison to interest rate-sensitive sectors like REITs and utilities
S&P/ASX 200Energy
S&P/ASX 200Materials
S&P/ASX 200Banks
May
16
Apr
16
Mar
16
Feb
16
Jan
16
Dec
15
Jun
16
Nov
15
Oct
15
Sep
15
Aug
15
Jul 1
5
60
110
70
80Inde
x 90
100
Figure 3b
S&P/ASX 200A-REIT
S&P/ASX 200Utilities
May
16
Apr
16
Mar
16
Feb
16
Jan
16
Dec
15
Jun
16
Nov
15
Oct
15
Sep
15
Aug
15
Jul 1
5
90
130
100
110
Inde
x
120
Source: FactSet
4 Australian Foundation Investment Company Limited Annual Report 2016
For
per
sona
l use
onl
y
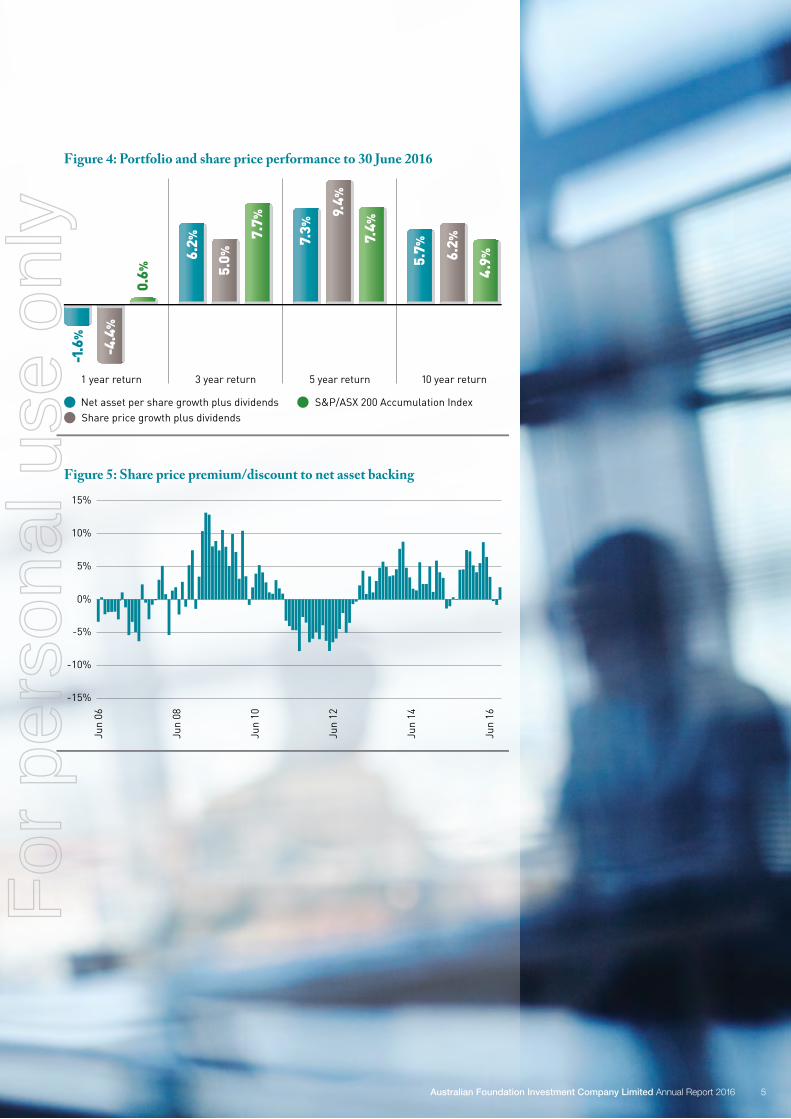
Figure 4: Portfolio and share price performance to 30 June 2016
10 year return
Net asset per share growth plus dividends S&P/ASX 200 Accumulation IndexShare price growth plus dividends
1 year return 3 year return 5 year return
7.7%
6.2%
5.0%
0.6%
-1.6%
5.7% 6.2%
4.9%
7.3%
9.4%
7.4%
-4.4%
Figure 5: Share price premium/discount to net asset backing
15%
-15%
-10%
-5%
0%
5%
10%
Jun
06
Jun
08
Jun
10
Jun
12
Jun
14
Jun
16
5Australian Foundation Investment Company Limited Annual Report 2016
For
per
sona
l use
onl
y
Overall purchases for the year totalled $819.0 million, with sales totalling $596.6 million.
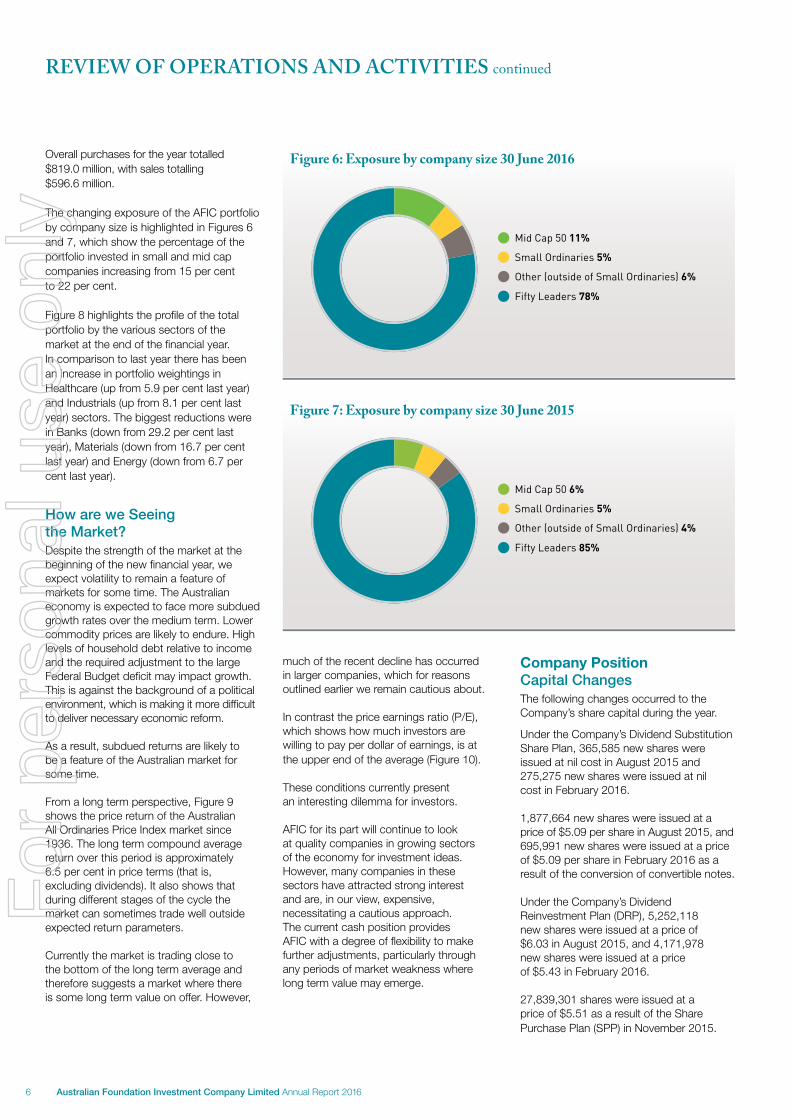
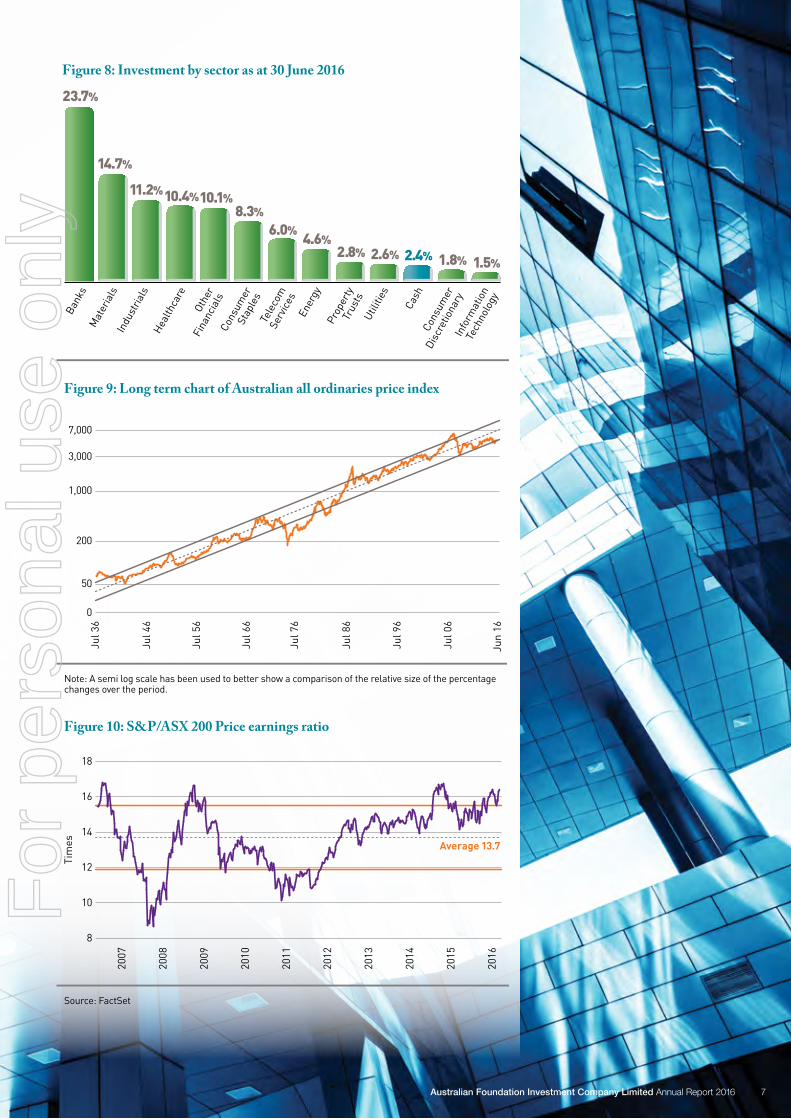
The changing exposure of the AFIC portfolio by company size is highlighted in Figures 6 and 7, which show the percentage of the portfolio invested in small and mid cap companies increasing from 15 per cent to 22 per cent.
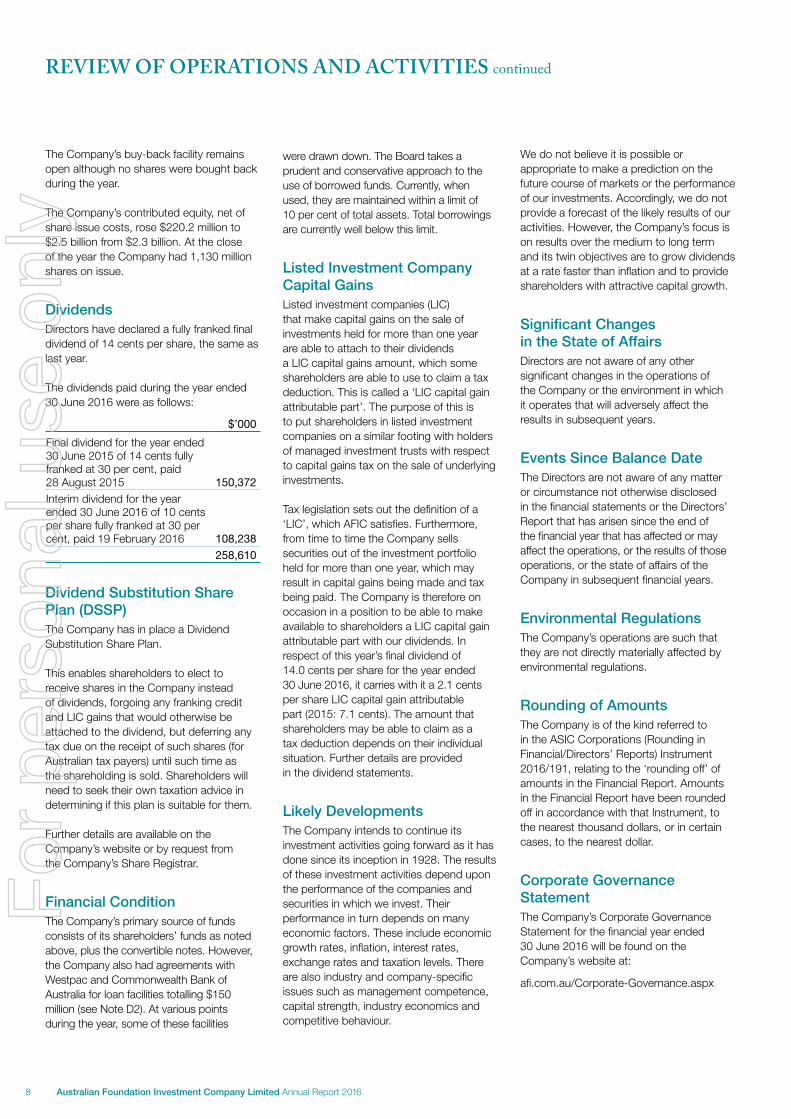
Figure 8 highlights the profile of the total portfolio by the various sectors of the market at the end of the financial year. In comparison to last year there has been an increase in portfolio weightings in Healthcare (up from 5.9 per cent last year) and Industrials (up from 8.1 per cent last year) sectors. The biggest reductions were in Banks (down from 29.2 per cent last year), Materials (down from 16.7 per cent last year) and Energy (down from 6.7 per cent last year).
How are we Seeing the Market? Despite the strength of the market at the beginning of the new financial year, we expect volatility to remain a feature of markets for some time. The Australian economy is expected to face more subdued growth rates over the medium term. Lower commodity prices are likely to endure. High levels of household debt relative to income and the required adjustment to the large Federal Budget deficit may impact growth. This is against the background of a political environment, which is making it more difficult to deliver necessary economic reform.
As a result, subdued returns are likely to be a feature of the Australian market for some time.
From a long term perspective, Figure 9 shows the price return of the Australian All Ordinaries Price Index market since 1936. The long term compound average return over this period is approximately 6.5 per cent in price terms (that is, excluding dividends). It also shows that during different stages of the cycle the market can sometimes trade well outside expected return parameters.
Currently the market is trading close to the bottom of the long term average and therefore suggests a market where there is some long term value on offer. However,
much of the recent decline has occurred in larger companies, which for reasons outlined earlier we remain cautious about.
In contrast the price earnings ratio (P/E), which shows how much investors are willing to pay per dollar of earnings, is at the upper end of the average (Figure 10).
These conditions currently present an interesting dilemma for investors.
AFIC for its part will continue to look at quality companies in growing sectors of the economy for investment ideas. However, many companies in these sectors have attracted strong interest and are, in our view, expensive, necessitating a cautious approach. The current cash position provides AFIC with a degree of flexibility to make further adjustments, particularly through any periods of market weakness where long term value may emerge.
Company PositionCapital ChangesThe following changes occurred to the Company’s share capital during the year.
Under the Company’s Dividend Substitution Share Plan, 365,585 new shares were issued at nil cost in August 2015 and 275,275 new shares were issued at nil cost in February 2016.
1,877,664 new shares were issued at a price of $5.09 per share in August 2015, and 695,991 new shares were issued at a price of $5.09 per share in February 2016 as a result of the conversion of convertible notes.
Under the Company’s Dividend Reinvestment Plan (DRP), 5,252,118 new shares were issued at a price of $6.03 in August 2015, and 4,171,978 new shares were issued at a price of $5.43 in February 2016.
27,839,301 shares were issued at a price of $5.51 as a result of the Share Purchase Plan (SPP) in November 2015.
REVIEW OF OPERATIONS AND ACTIVITIES continued
Mid Cap 50 11%
Small Ordinaries 5%
Other (outside of Small Ordinaries) 6%
Fifty Leaders 78%
Figure 6: Exposure by company size 30 June 2016
Mid Cap 50 6%
Small Ordinaries 5%
Other (outside of Small Ordinaries) 4%
Fifty Leaders 85%
Figure 7: Exposure by company size 30 June 2015
6 Australian Foundation Investment Company Limited Annual Report 2016
For
per
sona
l use
onl
y
1.5%
Info
rmat
ion
Tech
nolo
gy
Cons
umer
Disc
retio
nary
2.4%
Cash
2.6%
Utili
ties
4.6%
Ener
gy
2.8%
Prop
erty
Trus
ts
6.0%
Tele
com
Serv
ices
8.3%Co
nsum
erSt
aple
s
10.4%
Heal
thca
re
10.1%Ot
her
Fina
ncia
ls
11.2%
Indu
stria
ls
14.7%
Mat
eria
ls23.7%
Bank
sFigure 8: Investment by sector as at 30 June 2016
1.8%
Figure 9: Long term chart of Australian all ordinaries price index
Jun
16
Jul 3
6
Jul 4
6
Jul 5
6
Jul 6
6
Jul 7
6
Jul 8
6
Jul 9
6
Jul 0
6
0
50
7,000
200
1,000
3,000
Note: A semi log scale has been used to better show a comparison of the relative size of the percentage changes over the period.
Source: FactSet
Figure 10: S&P/ASX 200 Price earnings ratio
2015
2014
2013
2012
2016
2011
2010
2009
2008
2007
8
18
10
12
14
16
Tim
es Average 13.7
7Australian Foundation Investment Company Limited Annual Report 2016
For
per
sona
l use
onl
y
The Company’s buy-back facility remains open although no shares were bought back during the year.
The Company’s contributed equity, net of share issue costs, rose $220.2 million to $2.5 billion from $2.3 billion. At the close of the year the Company had 1,130 million shares on issue.
DividendsDirectors have declared a fully franked final dividend of 14 cents per share, the same as last year.
The dividends paid during the year ended 30 June 2016 were as follows:
$’000
Final dividend for the year ended 30 June 2015 of 14 cents fully franked at 30 per cent, paid 28 August 2015 150,372
Interim dividend for the year ended 30 June 2016 of 10 cents per share fully franked at 30 per cent, paid 19 February 2016 108,238
258,610
Dividend Substitution Share Plan (DSSP)The Company has in place a Dividend Substitution Share Plan.
This enables shareholders to elect to receive shares in the Company instead of dividends, forgoing any franking credit and LIC gains that would otherwise be attached to the dividend, but deferring any tax due on the receipt of such shares (for Australian tax payers) until such time as the shareholding is sold. Shareholders will need to seek their own taxation advice in determining if this plan is suitable for them.
Further details are available on the Company’s website or by request from the Company’s Share Registrar.
Financial ConditionThe Company’s primary source of funds consists of its shareholders’ funds as noted above, plus the convertible notes. However, the Company also had agreements with Westpac and Commonwealth Bank of Australia for loan facilities totalling $150 million (see Note D2). At various points during the year, some of these facilities
were drawn down. The Board takes a prudent and conservative approach to the use of borrowed funds. Currently, when used, they are maintained within a limit of 10 per cent of total assets. Total borrowings are currently well below this limit.
Listed Investment Company Capital GainsListed investment companies (LIC) that make capital gains on the sale of investments held for more than one year are able to attach to their dividends a LIC capital gains amount, which some shareholders are able to use to claim a tax deduction. This is called a ‘LIC capital gain attributable part’. The purpose of this is to put shareholders in listed investment companies on a similar footing with holders of managed investment trusts with respect to capital gains tax on the sale of underlying investments.
Tax legislation sets out the definition of a ‘LIC’, which AFIC satisfies. Furthermore, from time to time the Company sells securities out of the investment portfolio held for more than one year, which may result in capital gains being made and tax being paid. The Company is therefore on occasion in a position to be able to make available to shareholders a LIC capital gain attributable part with our dividends. In respect of this year’s final dividend of 14.0 cents per share for the year ended 30 June 2016, it carries with it a 2.1 cents per share LIC capital gain attributable part (2015: 7.1 cents). The amount that shareholders may be able to claim as a tax deduction depends on their individual situation. Further details are provided in the dividend statements.
Likely DevelopmentsThe Company intends to continue its investment activities going forward as it has done since its inception in 1928. The results of these investment activities depend upon the performance of the companies and securities in which we invest. Their performance in turn depends on many economic factors. These include economic growth rates, inflation, interest rates, exchange rates and taxation levels. There are also industry and company-specific issues such as management competence, capital strength, industry economics and competitive behaviour.
We do not believe it is possible or appropriate to make a prediction on the future course of markets or the performance of our investments. Accordingly, we do not provide a forecast of the likely results of our activities. However, the Company’s focus is on results over the medium to long term and its twin objectives are to grow dividends at a rate faster than inflation and to provide shareholders with attractive capital growth.
Significant Changes in the State of AffairsDirectors are not aware of any other significant changes in the operations of the Company or the environment in which it operates that will adversely affect the results in subsequent years.
Events Since Balance DateThe Directors are not aware of any matter or circumstance not otherwise disclosed in the financial statements or the Directors’ Report that has arisen since the end of the financial year that has affected or may affect the operations, or the results of those operations, or the state of affairs of the Company in subsequent financial years.
Environmental RegulationsThe Company’s operations are such that they are not directly materially affected by environmental regulations.
Rounding of AmountsThe Company is of the kind referred to in the ASIC Corporations (Rounding in Financial/Directors’ Reports) Instrument 2016/191, relating to the ‘rounding off’ of amounts in the Financial Report. Amounts in the Financial Report have been rounded off in accordance with that Instrument, to the nearest thousand dollars, or in certain cases, to the nearest dollar.
Corporate Governance StatementThe Company’s Corporate Governance Statement for the financial year ended 30 June 2016 will be found on the Company’s website at:
afi.com.au/Corporate-Governance.aspx
REVIEW OF OPERATIONS AND ACTIVITIES continued
8 Australian Foundation Investment Company Limited Annual Report 2016
For
per
sona
l use
onl
y
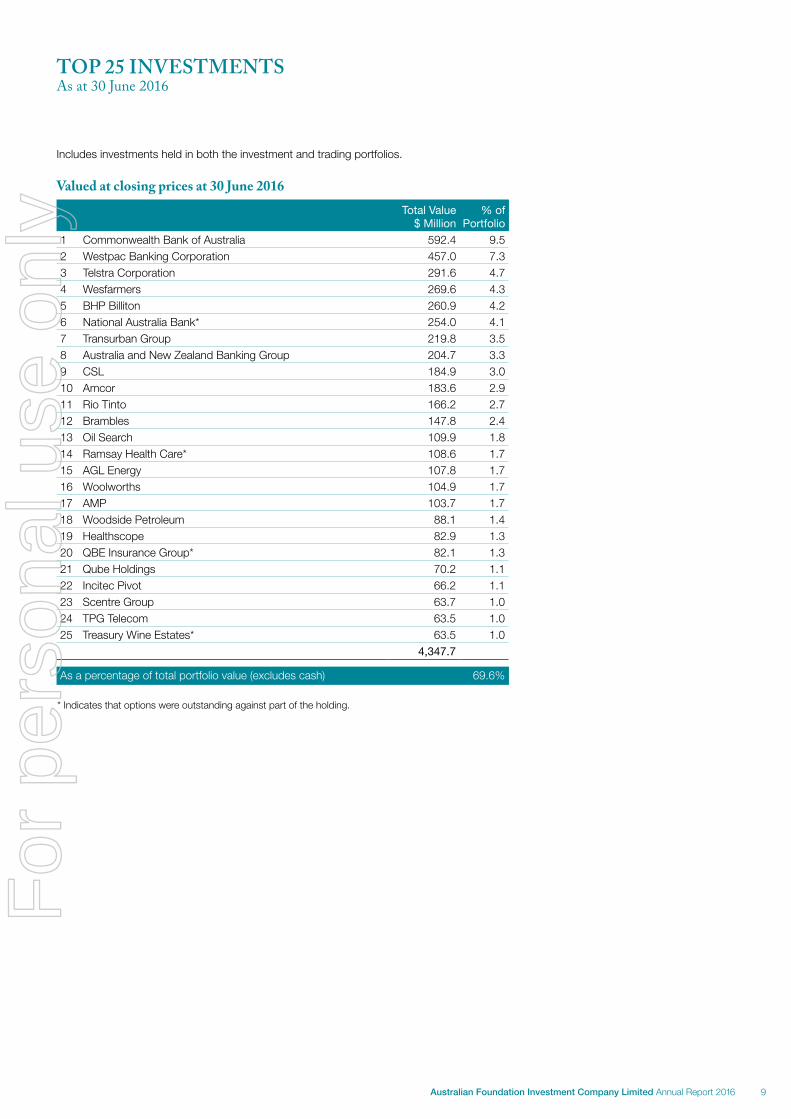
TOP 25 INVESTMENTSAs at 30 June 2016
Includes investments held in both the investment and trading portfolios.
Valued at closing prices at 30 June 2016Total Value
$ Million% of
Portfolio1 Commonwealth Bank of Australia 592.4 9.52 Westpac Banking Corporation 457.0 7.33 Telstra Corporation 291.6 4.74 Wesfarmers 269.6 4.35 BHP Billiton 260.9 4.26 National Australia Bank* 254.0 4.17 Transurban Group 219.8 3.58 Australia and New Zealand Banking Group 204.7 3.39 CSL 184.9 3.010 Amcor 183.6 2.911 Rio Tinto 166.2 2.712 Brambles 147.8 2.413 Oil Search 109.9 1.814 Ramsay Health Care* 108.6 1.715 AGL Energy 107.8 1.716 Woolworths 104.9 1.717 AMP 103.7 1.718 Woodside Petroleum 88.1 1.419 Healthscope 82.9 1.320 QBE Insurance Group* 82.1 1.321 Qube Holdings 70.2 1.122 Incitec Pivot 66.2 1.123 Scentre Group 63.7 1.024 TPG Telecom 63.5 1.025 Treasury Wine Estates* 63.5 1.0
4,347.7
As a percentage of total portfolio value (excludes cash) 69.6%
* Indicates that options were outstanding against part of the holding.
9Australian Foundation Investment Company Limited Annual Report 2016
For
per
sona
l use
onl
y
BOARD AND MANAGEMENT
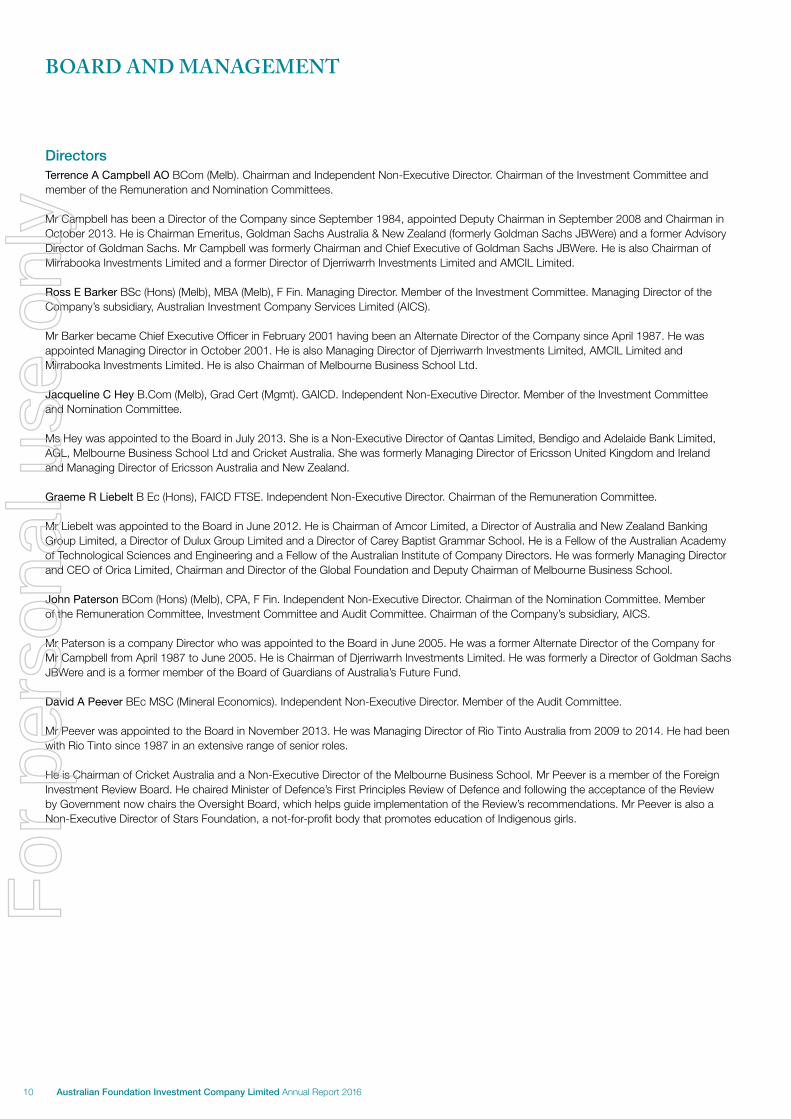
DirectorsTerrence A Campbell AO BCom (Melb). Chairman and Independent Non-Executive Director. Chairman of the Investment Committee and member of the Remuneration and Nomination Committees.
Mr Campbell has been a Director of the Company since September 1984, appointed Deputy Chairman in September 2008 and Chairman in October 2013. He is Chairman Emeritus, Goldman Sachs Australia & New Zealand (formerly Goldman Sachs JBWere) and a former Advisory Director of Goldman Sachs. Mr Campbell was formerly Chairman and Chief Executive of Goldman Sachs JBWere. He is also Chairman of Mirrabooka Investments Limited and a former Director of Djerriwarrh Investments Limited and AMCIL Limited.
Ross E Barker BSc (Hons) (Melb), MBA (Melb), F Fin. Managing Director. Member of the Investment Committee. Managing Director of the Company’s subsidiary, Australian Investment Company Services Limited (AICS).
Mr Barker became Chief Executive Officer in February 2001 having been an Alternate Director of the Company since April 1987. He was appointed Managing Director in October 2001. He is also Managing Director of Djerriwarrh Investments Limited, AMCIL Limited and Mirrabooka Investments Limited. He is also Chairman of Melbourne Business School Ltd.
Jacqueline C Hey B.Com (Melb), Grad Cert (Mgmt). GAICD. Independent Non-Executive Director. Member of the Investment Committee and Nomination Committee.
Ms Hey was appointed to the Board in July 2013. She is a Non-Executive Director of Qantas Limited, Bendigo and Adelaide Bank Limited, AGL, Melbourne Business School Ltd and Cricket Australia. She was formerly Managing Director of Ericsson United Kingdom and Ireland and Managing Director of Ericsson Australia and New Zealand.
Graeme R Liebelt B Ec (Hons), FAICD FTSE. Independent Non-Executive Director. Chairman of the Remuneration Committee.
Mr Liebelt was appointed to the Board in June 2012. He is Chairman of Amcor Limited, a Director of Australia and New Zealand Banking Group Limited, a Director of Dulux Group Limited and a Director of Carey Baptist Grammar School. He is a Fellow of the Australian Academy of Technological Sciences and Engineering and a Fellow of the Australian Institute of Company Directors. He was formerly Managing Director and CEO of Orica Limited, Chairman and Director of the Global Foundation and Deputy Chairman of Melbourne Business School.
John Paterson BCom (Hons) (Melb), CPA, F Fin. Independent Non-Executive Director. Chairman of the Nomination Committee. Member of the Remuneration Committee, Investment Committee and Audit Committee. Chairman of the Company’s subsidiary, AICS.
Mr Paterson is a company Director who was appointed to the Board in June 2005. He was a former Alternate Director of the Company for Mr Campbell from April 1987 to June 2005. He is Chairman of Djerriwarrh Investments Limited. He was formerly a Director of Goldman Sachs JBWere and is a former member of the Board of Guardians of Australia’s Future Fund.
David A Peever BEc MSC (Mineral Economics). Independent Non-Executive Director. Member of the Audit Committee.
Mr Peever was appointed to the Board in November 2013. He was Managing Director of Rio Tinto Australia from 2009 to 2014. He had been with Rio Tinto since 1987 in an extensive range of senior roles.
He is Chairman of Cricket Australia and a Non-Executive Director of the Melbourne Business School. Mr Peever is a member of the Foreign Investment Review Board. He chaired Minister of Defence’s First Principles Review of Defence and following the acceptance of the Review by Government now chairs the Oversight Board, which helps guide implementation of the Review’s recommendations. Mr Peever is also a Non-Executive Director of Stars Foundation, a not-for-profit body that promotes education of Indigenous girls.
10 Australian Foundation Investment Company Limited Annual Report 2016
For
per
sona
l use
onl
y
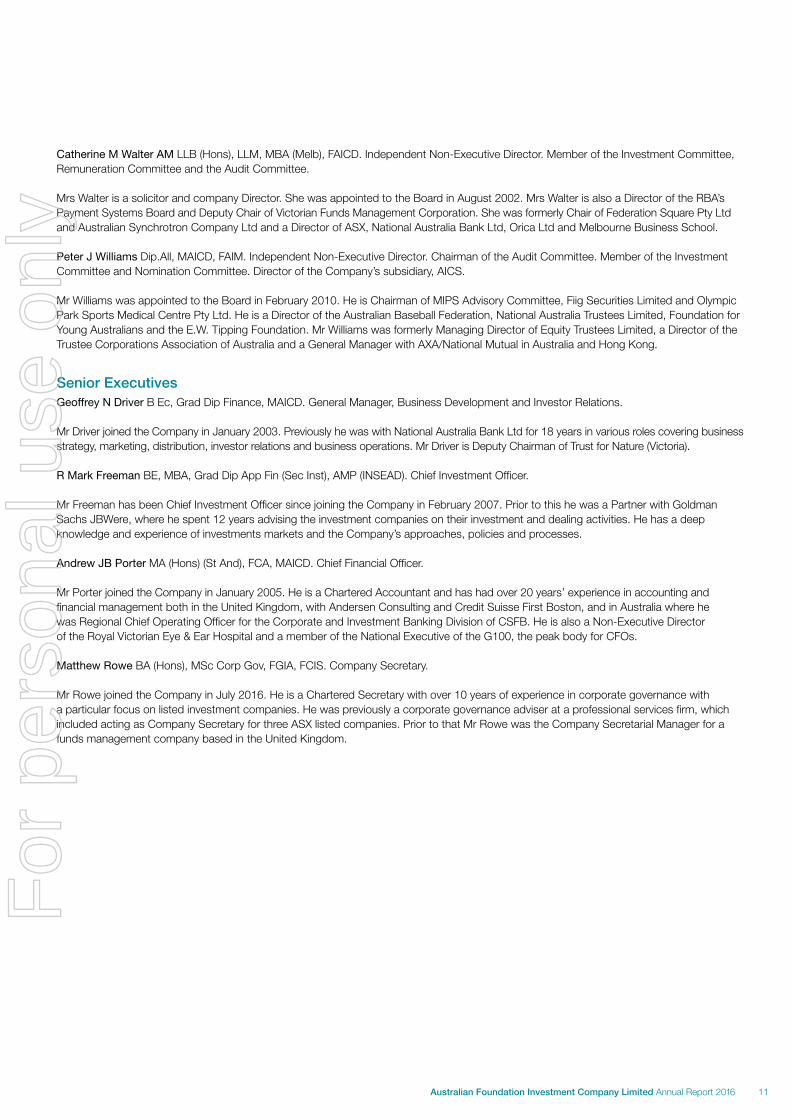
Catherine M Walter AM LLB (Hons), LLM, MBA (Melb), FAICD. Independent Non-Executive Director. Member of the Investment Committee, Remuneration Committee and the Audit Committee.
Mrs Walter is a solicitor and company Director. She was appointed to the Board in August 2002. Mrs Walter is also a Director of the RBA’s Payment Systems Board and Deputy Chair of Victorian Funds Management Corporation. She was formerly Chair of Federation Square Pty Ltd and Australian Synchrotron Company Ltd and a Director of ASX, National Australia Bank Ltd, Orica Ltd and Melbourne Business School.
Peter J Williams Dip.All, MAICD, FAIM. Independent Non-Executive Director. Chairman of the Audit Committee. Member of the Investment Committee and Nomination Committee. Director of the Company’s subsidiary, AICS.
Mr Williams was appointed to the Board in February 2010. He is Chairman of MIPS Advisory Committee, Fiig Securities Limited and Olympic Park Sports Medical Centre Pty Ltd. He is a Director of the Australian Baseball Federation, National Australia Trustees Limited, Foundation for Young Australians and the E.W. Tipping Foundation. Mr Williams was formerly Managing Director of Equity Trustees Limited, a Director of the Trustee Corporations Association of Australia and a General Manager with AXA/National Mutual in Australia and Hong Kong.
Senior ExecutivesGeoffrey N Driver B Ec, Grad Dip Finance, MAICD. General Manager, Business Development and Investor Relations.
Mr Driver joined the Company in January 2003. Previously he was with National Australia Bank Ltd for 18 years in various roles covering business strategy, marketing, distribution, investor relations and business operations. Mr Driver is Deputy Chairman of Trust for Nature (Victoria).
R Mark Freeman BE, MBA, Grad Dip App Fin (Sec Inst), AMP (INSEAD). Chief Investment Officer.
Mr Freeman has been Chief Investment Officer since joining the Company in February 2007. Prior to this he was a Partner with Goldman Sachs JBWere, where he spent 12 years advising the investment companies on their investment and dealing activities. He has a deep knowledge and experience of investments markets and the Company’s approaches, policies and processes.
Andrew JB Porter MA (Hons) (St And), FCA, MAICD. Chief Financial Officer.
Mr Porter joined the Company in January 2005. He is a Chartered Accountant and has had over 20 years’ experience in accounting and financial management both in the United Kingdom, with Andersen Consulting and Credit Suisse First Boston, and in Australia where he was Regional Chief Operating Officer for the Corporate and Investment Banking Division of CSFB. He is also a Non-Executive Director of the Royal Victorian Eye & Ear Hospital and a member of the National Executive of the G100, the peak body for CFOs.
Matthew Rowe BA (Hons), MSc Corp Gov, FGIA, FCIS. Company Secretary.
Mr Rowe joined the Company in July 2016. He is a Chartered Secretary with over 10 years of experience in corporate governance with a particular focus on listed investment companies. He was previously a corporate governance adviser at a professional services firm, which included acting as Company Secretary for three ASX listed companies. Prior to that Mr Rowe was the Company Secretarial Manager for a funds management company based in the United Kingdom.
11Australian Foundation Investment Company Limited Annual Report 2016
For
per
sona
l use
onl
y
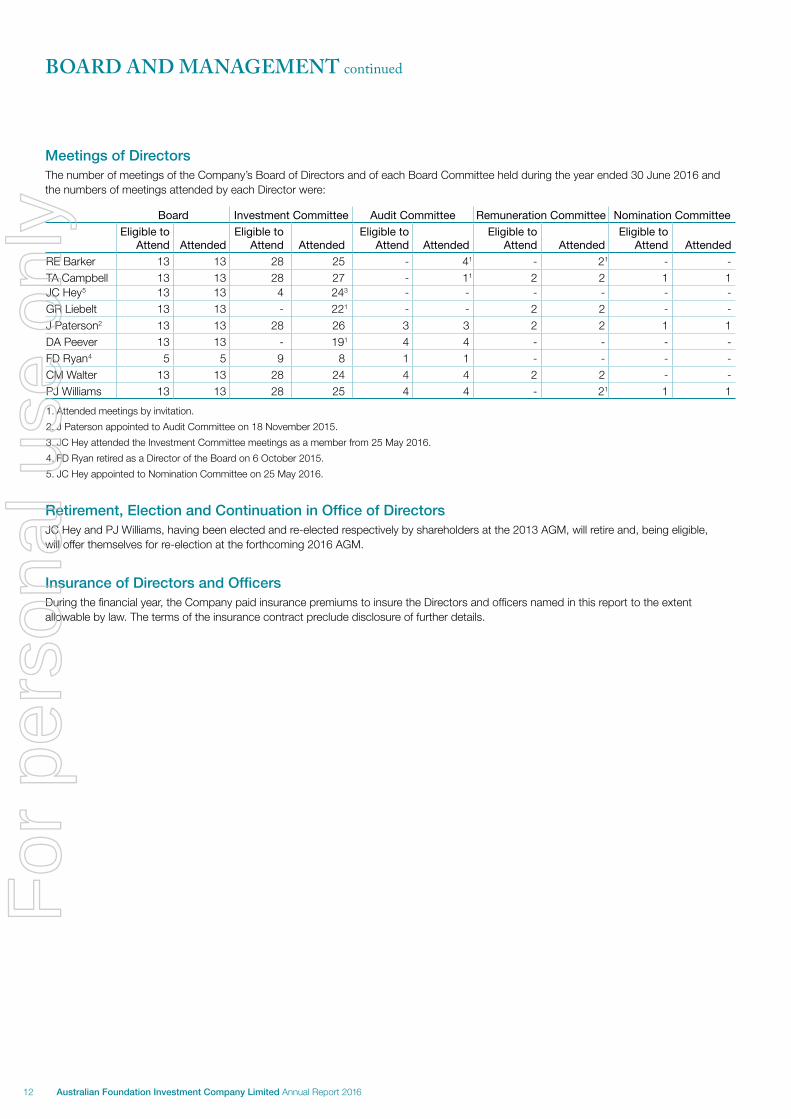
Meetings of DirectorsThe number of meetings of the Company’s Board of Directors and of each Board Committee held during the year ended 30 June 2016 and the numbers of meetings attended by each Director were:
Board Investment Committee Audit Committee Remuneration Committee Nomination Committee
Eligible to Attend Attended
Eligible to Attend Attended
Eligible to Attend Attended
Eligible to Attend Attended
Eligible to Attend Attended
RE Barker 13 13 28 25 - 41 - 21 - -TA Campbell 13 13 28 27 - 11 2 2 1 1JC Hey5 13 13 4 243 - - - - - -GR Liebelt 13 13 - 221 - - 2 2 - -J Paterson2 13 13 28 26 3 3 2 2 1 1DA Peever 13 13 - 191 4 4 - - - -FD Ryan4 5 5 9 8 1 1 - - - -CM Walter 13 13 28 24 4 4 2 2 - -PJ Williams 13 13 28 25 4 4 - 21 1 1
1. Attended meetings by invitation.
2. J Paterson appointed to Audit Committee on 18 November 2015.
3. JC Hey attended the Investment Committee meetings as a member from 25 May 2016.
4. FD Ryan retired as a Director of the Board on 6 October 2015.
5. JC Hey appointed to Nomination Committee on 25 May 2016.
Retirement, Election and Continuation in Office of DirectorsJC Hey and PJ Williams, having been elected and re-elected respectively by shareholders at the 2013 AGM, will retire and, being eligible, will offer themselves for re-election at the forthcoming 2016 AGM.
Insurance of Directors and OfficersDuring the financial year, the Company paid insurance premiums to insure the Directors and officers named in this report to the extent allowable by law. The terms of the insurance contract preclude disclosure of further details.
BOARD AND MANAGEMENT continued
12 Australian Foundation Investment Company Limited Annual Report 2016
For
per
sona
l use
onl
y
REMUNERATION REPORT
ContentsThe Directors present AFIC’s 2016 Remuneration Report, which outlines key aspects of our remuneration policy and remuneration awarded this year. Shareholders should be aware that AFIC does not bear the total cost of remuneration alone. Due to agreements that the Group’s subsidiary, Australian Investment Company Services Limited (AICS) also has with Djerriwarrh Investments Limited, Mirrabooka Investments Limited and AMCIL Limited, a substantial proportion of the total remuneration cost (usually 30 per cent to 40 per cent, depending on the individual) is borne by these other companies. AICS expenses the total amount and recovers the proportion borne by the investment companies through the fees that it charges. This report, therefore, shows the total expense that is borne by AICS and that an individual receives.
The report is structured as follows:
1. Remuneration Policy and Link to Performance
2. Structure of Remuneration
3. Executive Remuneration Expense
4. Contract Terms
5. Non-Executive Director Remuneration
AppendixA. Remuneration Governance
B. Annual Incentives: Details of Outcomes and Conditions
C. Long Term Incentives: Details of Outcomes and Conditions
D. Directors and Executives: Equity Holdings and Other Transactions
E. Detailed Performance Measures by Investment Company
1. Remuneration Policy and Link to Performance
1.1 What is Our Remuneration Policy?AFIC is an investor in securities listed primarily in Australia and New Zealand. Our primary objectives are to grow dividends at a faster rate than inflation and provide shareholders with capital growth over the medium to long term. To achieve this, we need to attract and retain professional, competent and highly motivated executives and staff through offering attractive remuneration arrangements which:
• reflect market conditions;
• recognise the skills, experience, roles and responsibilities of the individuals;
• align with shareholder interests; and
• align with the risk management strategies.
Generally, we seek to set total remuneration at the upper or second quartile of the sectors in which we operate.
Remuneration for the Group’s Executives has two main elements:
• fixed annual remuneration (FAR); and
• performance-related pay, being annual incentives and long term incentives (LTI).
FAR is determined with reference to levels necessary to recruit and retain staff with the relevant skills and experience in the industry in which the Group operates. We seek external input to ensure that the FAR meets these conditions. This includes industry data provided by the Financial Institutions Remuneration Group Inc. (FIRG) and McLagan for the financial services industry.
13Australian Foundation Investment Company Limited Annual Report 2016
For
per
sona
l use
onl
y
Through performance-related pay, the remuneration is adjusted to reflect the risks that the Company and its shareholders face and how the Company has responded to those risks. In particular:
• The key performance indicators chosen to determine performance-related pay are those that the Company considers most relevant to its objectives of improving shareholder wealth over the medium to long term.
• The focus is on performance over the medium to long term with only a minor proportion of both Annual Incentives and LTI being dependent on a single year’s performance.
• Executives other than the Chief Investment Officer (CIO) agree to invest 50 per cent of the annual cash incentive (after tax) in AFIC shares and shares of the other investment companies (including AMCIL Limited, Djerriwarrh Investments Limited and Mirrabooka Investments Limited) and to hold these shares for a minimum of two years. The CIO and other members of the investment team are not required under any of the remuneration schemes to purchase shares in the investment companies, but are encouraged to do so.
The Remuneration Committee may, at its discretion, cancel any performance rights that are yet to vest or to be tested in the event of any negative issues that may arise, including material mis-statement of the Company’s financial statements.
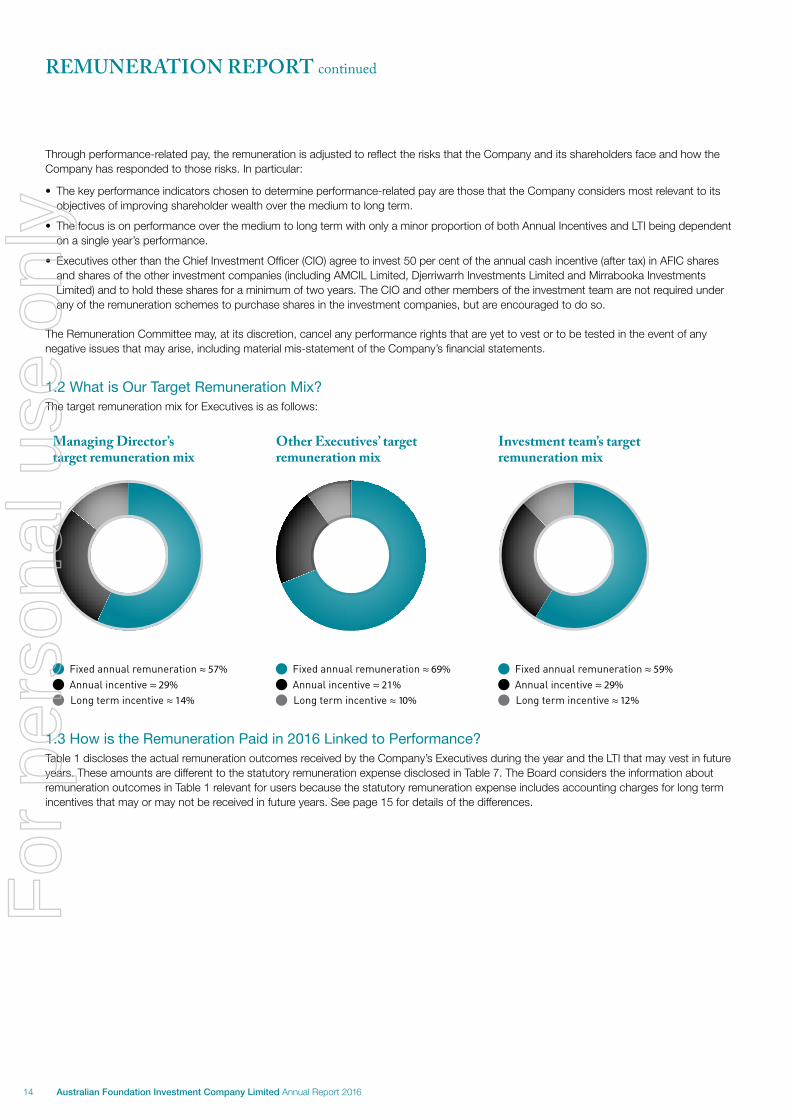
1.2 What is Our Target Remuneration Mix?The target remuneration mix for Executives is as follows:
1.3 How is the Remuneration Paid in 2016 Linked to Performance?Table 1 discloses the actual remuneration outcomes received by the Company’s Executives during the year and the LTI that may vest in future years. These amounts are different to the statutory remuneration expense disclosed in Table 7. The Board considers the information about remuneration outcomes in Table 1 relevant for users because the statutory remuneration expense includes accounting charges for long term incentives that may or may not be received in future years. See page 15 for details of the differences.
REMUNERATION REPORT continued
Managing Director’starget remuneration mix
Annual incentive ≈ 29%
Long term incentive ≈ 14%
Fixed annual remuneration ≈ 57%
Other Executives’ target remuneration mix
Annual incentive ≈ 21%
Long term incentive ≈ 10%
Fixed annual remuneration ≈ 69%
Investment team’s target remuneration mix
Annual incentive ≈ 29%
Long term incentive ≈ 12%
Fixed annual remuneration ≈ 59%
14 Australian Foundation Investment Company Limited Annual Report 2016
For
per
sona
l use
onl
y
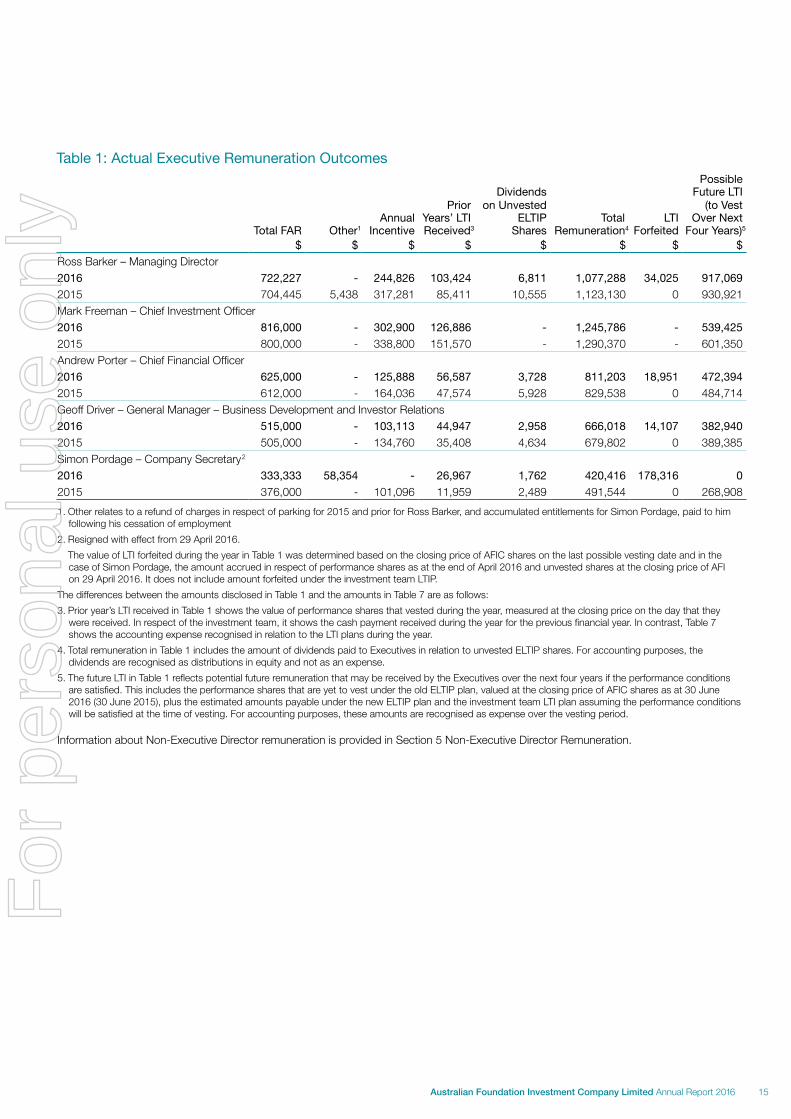
Table 1: Actual Executive Remuneration OutcomesPossible
PriorDividends
on UnvestedFuture LTI
(to VestAnnual Years’ LTI ELTIP Total LTI Over Next
Total FAR Other1 Incentive Received3 Shares Remuneration4 Forfeited Four Years)5
$ $ $ $ $ $ $ $
Ross Barker – Managing Director2016 722,227 - 244,826 103,424 6,811 1,077,288 34,025 917,069
2015 704,445 5,438 317,281 85,411 10,555 1,123,130 0 930,921Mark Freeman – Chief Investment Officer2016 816,000 - 302,900 126,886 - 1,245,786 - 539,425
2015 800,000 - 338,800 151,570 - 1,290,370 - 601,350Andrew Porter – Chief Financial Officer2016 625,000 - 125,888 56,587 3,728 811,203 18,951 472,394
2015 612,000 - 164,036 47,574 5,928 829,538 0 484,714Geoff Driver – General Manager – Business Development and Investor Relations 2016 515,000 - 103,113 44,947 2,958 666,018 14,107 382,940
2015 505,000 - 134,760 35,408 4,634 679,802 0 389,385Simon Pordage – Company Secretary2
2016 333,333 58,354 - 26,967 1,762 420,416 178,316 0
2015 376,000 - 101,096 11,959 2,489 491,544 0 268,908
1. Other relates to a refund of charges in respect of parking for 2015 and prior for Ross Barker, and accumulated entitlements for Simon Pordage, paid to him following his cessation of employment
2. Resigned with effect from 29 April 2016.
The value of LTI forfeited during the year in Table 1 was determined based on the closing price of AFIC shares on the last possible vesting date and in the case of Simon Pordage, the amount accrued in respect of performance shares as at the end of April 2016 and unvested shares at the closing price of AFI on 29 April 2016. It does not include amount forfeited under the investment team LTIP.
The differences between the amounts disclosed in Table 1 and the amounts in Table 7 are as follows:
3. Prior year’s LTI received in Table 1 shows the value of performance shares that vested during the year, measured at the closing price on the day that they were received. In respect of the investment team, it shows the cash payment received during the year for the previous financial year. In contrast, Table 7 shows the accounting expense recognised in relation to the LTI plans during the year.
4. Total remuneration in Table 1 includes the amount of dividends paid to Executives in relation to unvested ELTIP shares. For accounting purposes, the dividends are recognised as distributions in equity and not as an expense.
5. The future LTI in Table 1 reflects potential future remuneration that may be received by the Executives over the next four years if the performance conditions are satisfied. This includes the performance shares that are yet to vest under the old ELTIP plan, valued at the closing price of AFIC shares as at 30 June 2016 (30 June 2015), plus the estimated amounts payable under the new ELTIP plan and the investment team LTI plan assuming the performance conditions will be satisfied at the time of vesting. For accounting purposes, these amounts are recognised as expense over the vesting period.
Information about Non-Executive Director remuneration is provided in Section 5 Non-Executive Director Remuneration.
15Australian Foundation Investment Company Limited Annual Report 2016
For
per
sona
l use
onl
y
1.3.1 Fixed Remuneration
Most Executives received modest inflationary increases in their fixed annual remuneration this year. AFIC continues to operate in a highly competitive market and salary levels are reviewed periodically with the aim of remunerating its Executives to the extent required to attract and retain Executives who are leaders in their field.
1.3.2 Performance-related Pay
This section shows:
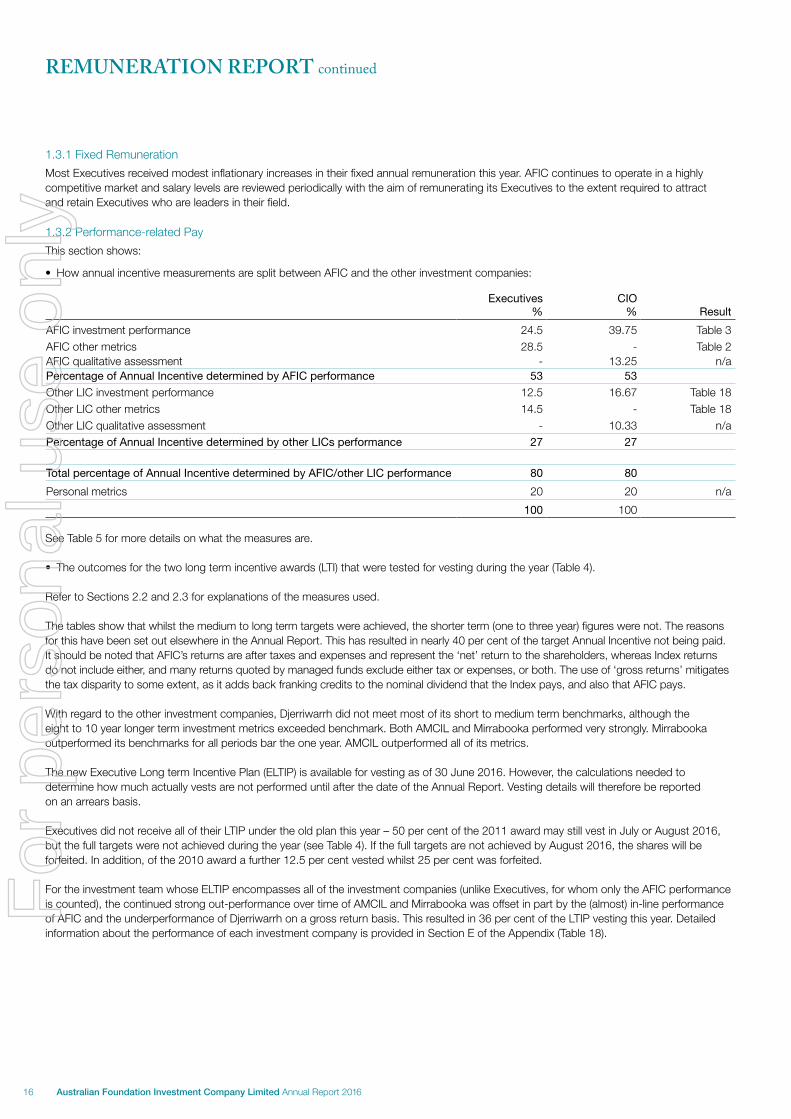
• How annual incentive measurements are split between AFIC and the other investment companies:
Executives %
CIO % Result
AFIC investment performance 24.5 39.75 Table 3AFIC other metrics 28.5 - Table 2AFIC qualitative assessment - 13.25 n/aPercentage of Annual Incentive determined by AFIC performance 53 53
Other LIC investment performance 12.5 16.67 Table 18Other LIC other metrics 14.5 - Table 18Other LIC qualitative assessment - 10.33 n/aPercentage of Annual Incentive determined by other LICs performance 27 27
Total percentage of Annual Incentive determined by AFIC/other LIC performance 80 80
Personal metrics 20 20 n/a
100 100
See Table 5 for more details on what the measures are.
• The outcomes for the two long term incentive awards (LTI) that were tested for vesting during the year (Table 4).
Refer to Sections 2.2 and 2.3 for explanations of the measures used.
The tables show that whilst the medium to long term targets were achieved, the shorter term (one to three year) figures were not. The reasons for this have been set out elsewhere in the Annual Report. This has resulted in nearly 40 per cent of the target Annual Incentive not being paid. It should be noted that AFIC’s returns are after taxes and expenses and represent the ‘net’ return to the shareholders, whereas Index returns do not include either, and many returns quoted by managed funds exclude either tax or expenses, or both. The use of ‘gross returns’ mitigates the tax disparity to some extent, as it adds back franking credits to the nominal dividend that the Index pays, and also that AFIC pays.
With regard to the other investment companies, Djerriwarrh did not meet most of its short to medium term benchmarks, although the eight to 10 year longer term investment metrics exceeded benchmark. Both AMCIL and Mirrabooka performed very strongly. Mirrabooka outperformed its benchmarks for all periods bar the one year. AMCIL outperformed all of its metrics.
The new Executive Long term Incentive Plan (ELTIP) is available for vesting as of 30 June 2016. However, the calculations needed to determine how much actually vests are not performed until after the date of the Annual Report. Vesting details will therefore be reported on an arrears basis.
Executives did not receive all of their LTIP under the old plan this year – 50 per cent of the 2011 award may still vest in July or August 2016, but the full targets were not achieved during the year (see Table 4). If the full targets are not achieved by August 2016, the shares will be forfeited. In addition, of the 2010 award a further 12.5 per cent vested whilst 25 per cent was forfeited.
For the investment team whose ELTIP encompasses all of the investment companies (unlike Executives, for whom only the AFIC performance is counted), the continued strong out-performance over time of AMCIL and Mirrabooka was offset in part by the (almost) in-line performance of AFIC and the underperformance of Djerriwarrh on a gross return basis. This resulted in 36 per cent of the LTIP vesting this year. Detailed information about the performance of each investment company is provided in Section E of the Appendix (Table 18).
REMUNERATION REPORT continued
16 Australian Foundation Investment Company Limited Annual Report 2016
For
per
sona
l use
onl
y
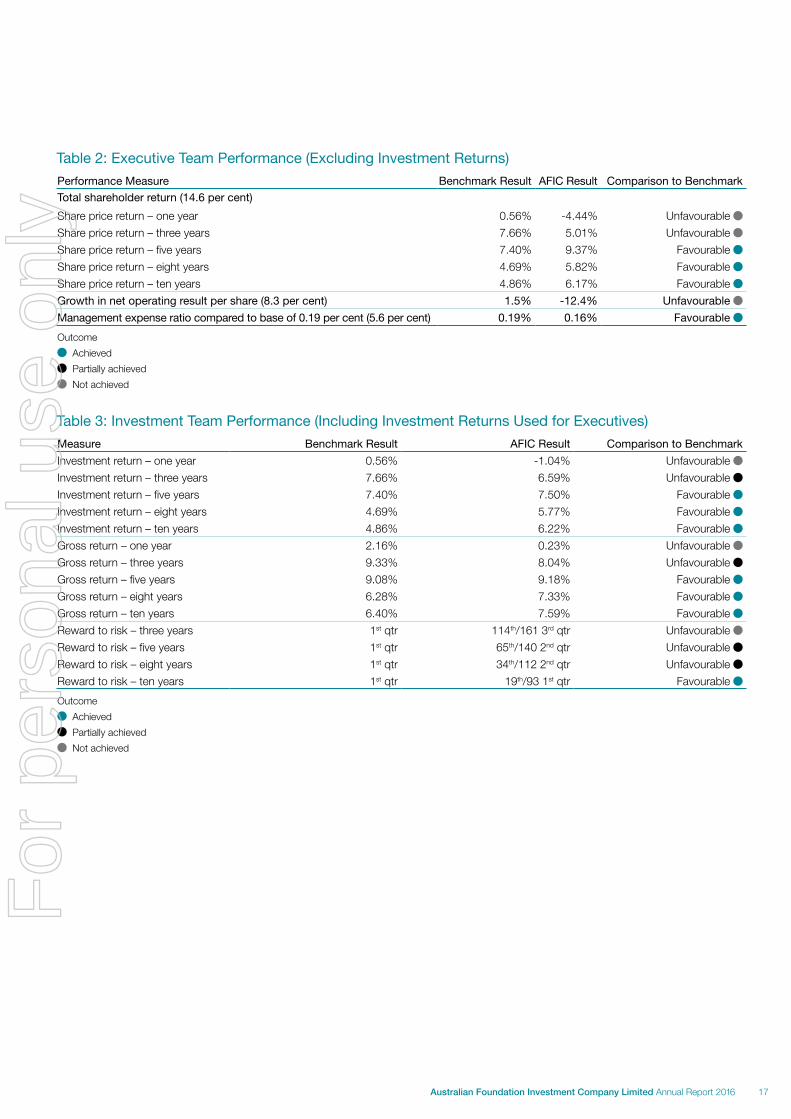
Table 2: Executive Team Performance (Excluding Investment Returns)Performance Measure Benchmark Result AFIC Result Comparison to Benchmark
Total shareholder return (14.6 per cent)
Share price return – one year 0.56% -4.44% Unfavourable
Share price return – three years 7.66% 5.01% Unfavourable
Share price return – five years 7.40% 9.37% Favourable
Share price return – eight years 4.69% 5.82% Favourable
Share price return – ten years 4.86% 6.17% Favourable
Growth in net operating result per share (8.3 per cent) 1.5% -12.4% Unfavourable
Management expense ratio compared to base of 0.19 per cent (5.6 per cent) 0.19% 0.16% Favourable
Outcome
Achieved
Partially achieved
Not achieved
Table 3: Investment Team Performance (Including Investment Returns Used for Executives)Measure Benchmark Result AFIC Result Comparison to Benchmark
Investment return – one year 0.56% -1.04% Unfavourable
Investment return – three years 7.66% 6.59% Unfavourable
Investment return – five years 7.40% 7.50% Favourable
Investment return – eight years 4.69% 5.77% Favourable
Investment return – ten years 4.86% 6.22% Favourable
Gross return – one year 2.16% 0.23% Unfavourable
Gross return – three years 9.33% 8.04% Unfavourable
Gross return – five years 9.08% 9.18% Favourable
Gross return – eight years 6.28% 7.33% Favourable
Gross return – ten years 6.40% 7.59% Favourable
Reward to risk – three years 1st qtr 114th/161 3rd qtr Unfavourable
Reward to risk – five years 1st qtr 65th/140 2nd qtr Unfavourable
Reward to risk – eight years 1st qtr 34th/112 2nd qtr Unfavourable
Reward to risk – ten years 1st qtr 19th/93 1st qtr Favourable
Outcome
Achieved
Partially achieved
Not achieved
17Australian Foundation Investment Company Limited Annual Report 2016
For
per
sona
l use
onl
y
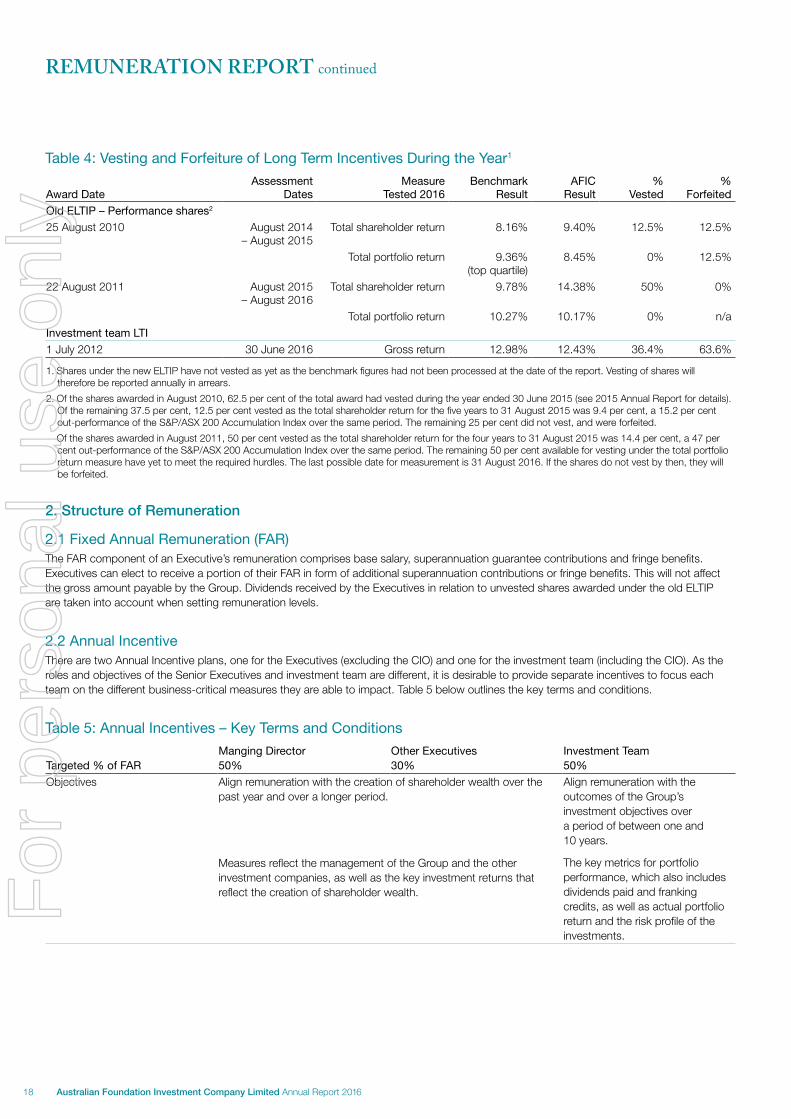
Table 4: Vesting and Forfeiture of Long Term Incentives During the Year1
Award DateAssessment
DatesMeasure
Tested 2016Benchmark
ResultAFIC
Result%
Vested %
Forfeited
Old ELTIP – Performance shares2
25 August 2010 August 2014 – August 2015
Total shareholder return 8.16% 9.40% 12.5% 12.5%
Total portfolio return 9.36% (top quartile)
8.45% 0% 12.5%
22 August 2011 August 2015 – August 2016
Total shareholder return 9.78% 14.38% 50% 0%
Total portfolio return 10.27% 10.17% 0% n/aInvestment team LTI
1 July 2012 30 June 2016 Gross return 12.98% 12.43% 36.4% 63.6%
1. Shares under the new ELTIP have not vested as yet as the benchmark figures had not been processed at the date of the report. Vesting of shares will therefore be reported annually in arrears.
2. Of the shares awarded in August 2010, 62.5 per cent of the total award had vested during the year ended 30 June 2015 (see 2015 Annual Report for details). Of the remaining 37.5 per cent, 12.5 per cent vested as the total shareholder return for the five years to 31 August 2015 was 9.4 per cent, a 15.2 per cent out-performance of the S&P/ASX 200 Accumulation Index over the same period. The remaining 25 per cent did not vest, and were forfeited.
Of the shares awarded in August 2011, 50 per cent vested as the total shareholder return for the four years to 31 August 2015 was 14.4 per cent, a 47 per cent out-performance of the S&P/ASX 200 Accumulation Index over the same period. The remaining 50 per cent available for vesting under the total portfolio return measure have yet to meet the required hurdles. The last possible date for measurement is 31 August 2016. If the shares do not vest by then, they will be forfeited.
2. Structure of Remuneration
2.1 Fixed Annual Remuneration (FAR)The FAR component of an Executive’s remuneration comprises base salary, superannuation guarantee contributions and fringe benefits. Executives can elect to receive a portion of their FAR in form of additional superannuation contributions or fringe benefits. This will not affect the gross amount payable by the Group. Dividends received by the Executives in relation to unvested shares awarded under the old ELTIP are taken into account when setting remuneration levels.
2.2 Annual IncentiveThere are two Annual Incentive plans, one for the Executives (excluding the CIO) and one for the investment team (including the CIO). As the roles and objectives of the Senior Executives and investment team are different, it is desirable to provide separate incentives to focus each team on the different business-critical measures they are able to impact. Table 5 below outlines the key terms and conditions.
Table 5: Annual Incentives – Key Terms and Conditions
Targeted % of FAR Manging Director 50%
Other Executives 30%
Investment Team 50%
Objectives Align remuneration with the creation of shareholder wealth over the past year and over a longer period.
Measures reflect the management of the Group and the other investment companies, as well as the key investment returns that reflect the creation of shareholder wealth.
Align remuneration with the outcomes of the Group’s investment objectives over a period of between one and 10 years.
The key metrics for portfolio performance, which also includes dividends paid and franking credits, as well as actual portfolio return and the risk profile of the investments.
REMUNERATION REPORT continued
18 Australian Foundation Investment Company Limited Annual Report 2016
For
per
sona
l use
onl
y
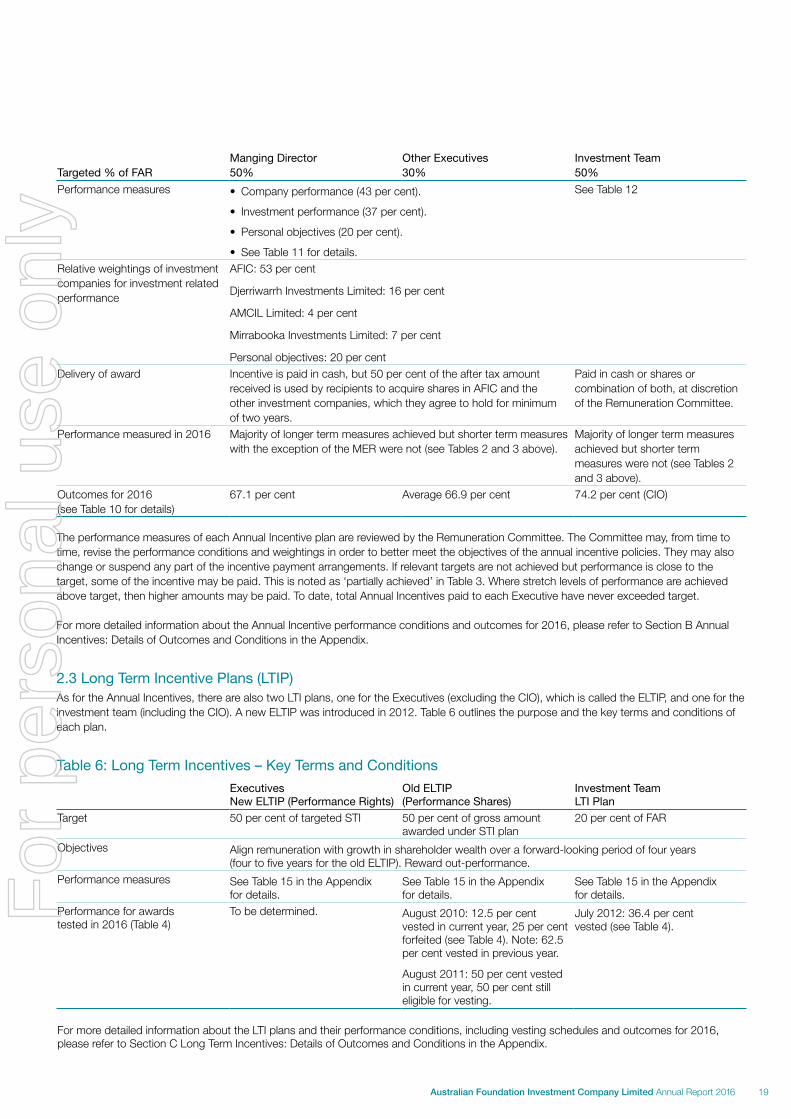
Targeted % of FAR Manging Director 50%
Other Executives 30%
Investment Team 50%
Performance measures • Company performance (43 per cent).
• Investment performance (37 per cent).
• Personal objectives (20 per cent).
• See Table 11 for details.
See Table 12
Relative weightings of investment companies for investment related performance
AFIC: 53 per cent
Djerriwarrh Investments Limited: 16 per cent
AMCIL Limited: 4 per cent
Mirrabooka Investments Limited: 7 per cent
Personal objectives: 20 per centDelivery of award Incentive is paid in cash, but 50 per cent of the after tax amount
received is used by recipients to acquire shares in AFIC and the other investment companies, which they agree to hold for minimum of two years.
Paid in cash or shares or combination of both, at discretion of the Remuneration Committee.
Performance measured in 2016 Majority of longer term measures achieved but shorter term measures with the exception of the MER were not (see Tables 2 and 3 above).
Majority of longer term measures achieved but shorter term measures were not (see Tables 2 and 3 above).
Outcomes for 2016 (see Table 10 for details)
67.1 per cent Average 66.9 per cent 74.2 per cent (CIO)
The performance measures of each Annual Incentive plan are reviewed by the Remuneration Committee. The Committee may, from time to time, revise the performance conditions and weightings in order to better meet the objectives of the annual incentive policies. They may also change or suspend any part of the incentive payment arrangements. If relevant targets are not achieved but performance is close to the target, some of the incentive may be paid. This is noted as ‘partially achieved’ in Table 3. Where stretch levels of performance are achieved above target, then higher amounts may be paid. To date, total Annual Incentives paid to each Executive have never exceeded target.
For more detailed information about the Annual Incentive performance conditions and outcomes for 2016, please refer to Section B Annual Incentives: Details of Outcomes and Conditions in the Appendix.
2.3 Long Term Incentive Plans (LTIP)As for the Annual Incentives, there are also two LTI plans, one for the Executives (excluding the CIO), which is called the ELTIP, and one for the investment team (including the CIO). A new ELTIP was introduced in 2012. Table 6 outlines the purpose and the key terms and conditions of each plan.
Table 6: Long Term Incentives – Key Terms and ConditionsExecutives New ELTIP (Performance Rights)
Old ELTIP (Performance Shares)
Investment Team LTI Plan
Target 50 per cent of targeted STI 50 per cent of gross amount awarded under STI plan
20 per cent of FAR
Objectives Align remuneration with growth in shareholder wealth over a forward-looking period of four years (four to five years for the old ELTIP). Reward out-performance.
Performance measures See Table 15 in the Appendix for details.
See Table 15 in the Appendix for details.
See Table 15 in the Appendix for details.
Performance for awards tested in 2016 (Table 4)
To be determined. August 2010: 12.5 per cent vested in current year, 25 per cent forfeited (see Table 4). Note: 62.5 per cent vested in previous year.
August 2011: 50 per cent vested in current year, 50 per cent still eligible for vesting.
July 2012: 36.4 per cent vested (see Table 4).
For more detailed information about the LTI plans and their performance conditions, including vesting schedules and outcomes for 2016, please refer to Section C Long Term Incentives: Details of Outcomes and Conditions in the Appendix.
19Australian Foundation Investment Company Limited Annual Report 2016
For
per
sona
l use
onl
y
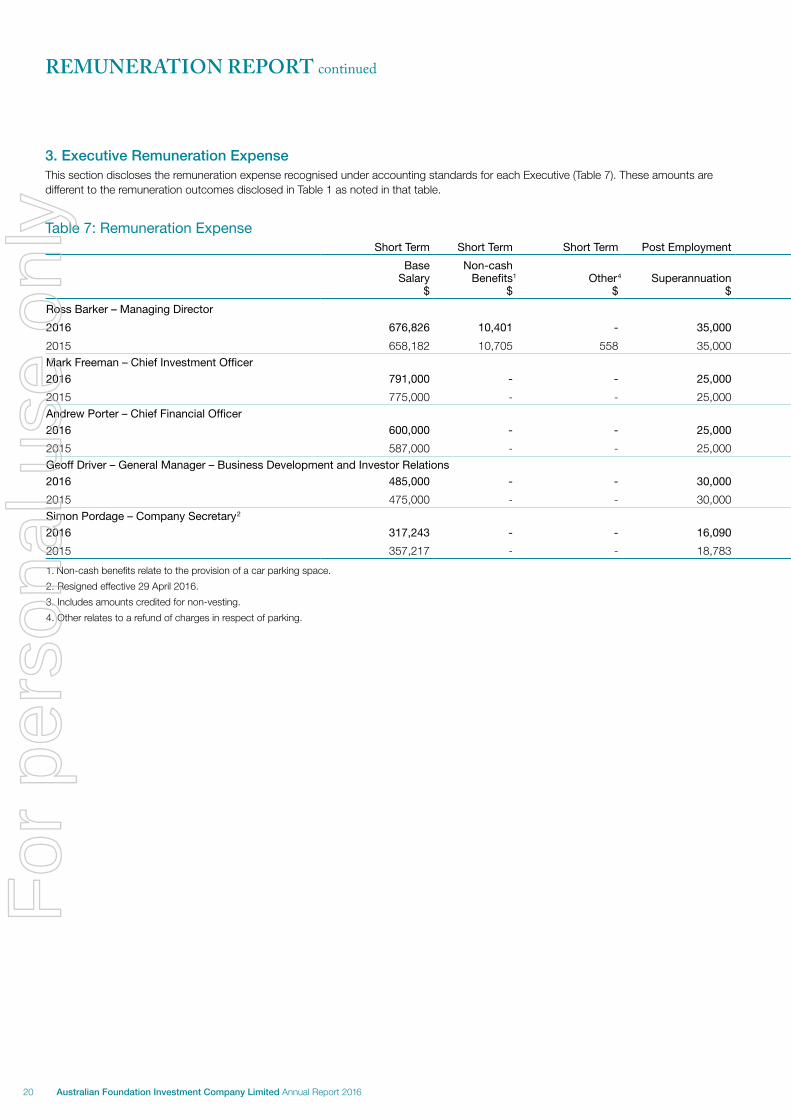
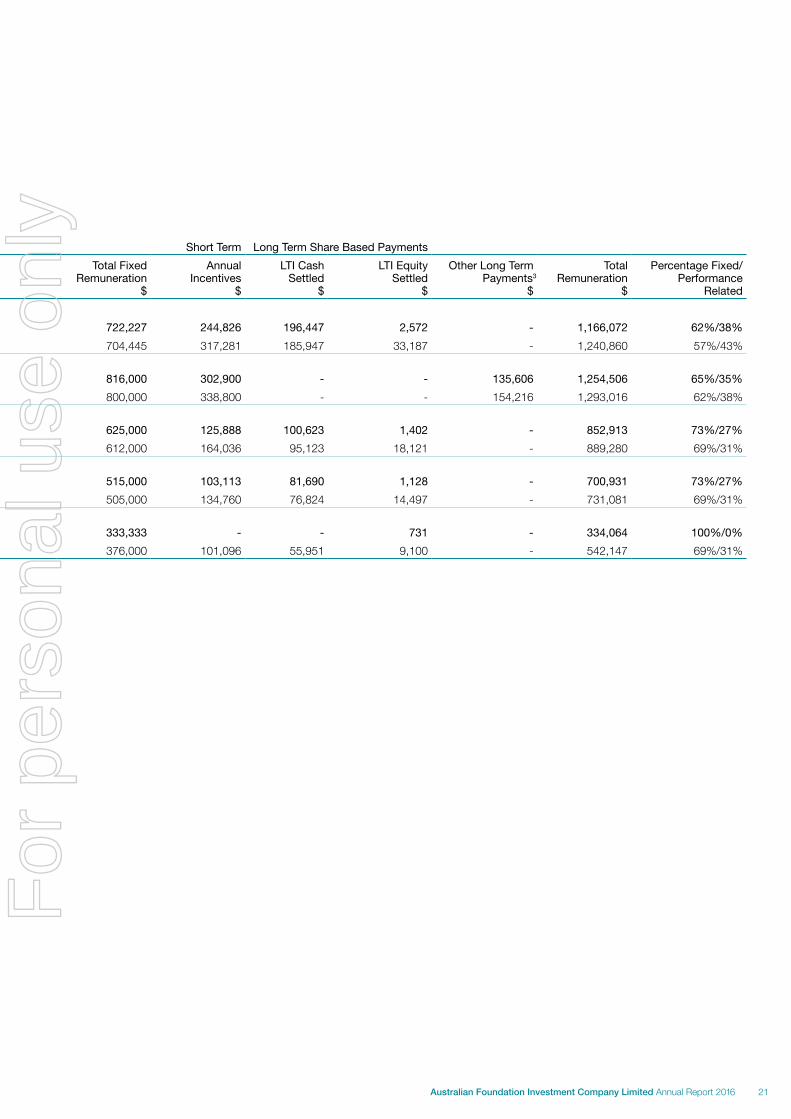
3. Executive Remuneration ExpenseThis section discloses the remuneration expense recognised under accounting standards for each Executive (Table 7). These amounts are different to the remuneration outcomes disclosed in Table 1 as noted in that table.
Table 7: Remuneration Expense Short Term Short Term Short Term Post Employment Short Term Long Term Share Based Payments
Base Non-cash Total Fixed Annual LTI Cash LTI Equity Other Long Term Total Percentage Fixed/Salary Benefits1 Other4 Superannuation Remuneration Incentives Settled Settled Payments3 Remuneration Performance
$ $ $ $ $ $ $ $ $ $ Related
Ross Barker – Managing Director
2016 676,826 10,401 - 35,000 722,227 244,826 196,447 2,572 - 1,166,072 62%/38%
2015 658,182 10,705 558 35,000 704,445 317,281 185,947 33,187 - 1,240,860 57%/43%Mark Freeman – Chief Investment Officer
2016 791,000 - - 25,000 816,000 302,900 - - 135,606 1,254,506 65%/35%
2015 775,000 - - 25,000 800,000 338,800 - - 154,216 1,293,016 62%/38%Andrew Porter – Chief Financial Officer
2016 600,000 - - 25,000 625,000 125,888 100,623 1,402 - 852,913 73%/27%
2015 587,000 - - 25,000 612,000 164,036 95,123 18,121 - 889,280 69%/31%Geoff Driver – General Manager – Business Development and Investor Relations
2016 485,000 - - 30,000 515,000 103,113 81,690 1,128 - 700,931 73%/27%
2015 475,000 - - 30,000 505,000 134,760 76,824 14,497 - 731,081 69%/31%Simon Pordage – Company Secretary2
2016 317,243 - - 16,090 333,333 - - 731 - 334,064 100%/0%
2015 357,217 - - 18,783 376,000 101,096 55,951 9,100 - 542,147 69%/31%
1. Non-cash benefits relate to the provision of a car parking space.
2. Resigned effective 29 April 2016.
3. Includes amounts credited for non-vesting.
4. Other relates to a refund of charges in respect of parking.
REMUNERATION REPORT continued
20 Australian Foundation Investment Company Limited Annual Report 2016
For
per
sona
l use
onl
y
3. Executive Remuneration ExpenseThis section discloses the remuneration expense recognised under accounting standards for each Executive (Table 7). These amounts are different to the remuneration outcomes disclosed in Table 1 as noted in that table.
Table 7: Remuneration Expense Short Term Short Term Short Term Post Employment Short Term Long Term Share Based Payments
Base Non-cash Total Fixed Annual LTI Cash LTI Equity Other Long Term Total Percentage Fixed/Salary Benefits1 Other4 Superannuation Remuneration Incentives Settled Settled Payments3 Remuneration Performance
$ $ $ $ $ $ $ $ $ $ Related
Ross Barker – Managing Director
2016 676,826 10,401 - 35,000 722,227 244,826 196,447 2,572 - 1,166,072 62%/38%
2015 658,182 10,705 558 35,000 704,445 317,281 185,947 33,187 - 1,240,860 57%/43%Mark Freeman – Chief Investment Officer
2016 791,000 - - 25,000 816,000 302,900 - - 135,606 1,254,506 65%/35%
2015 775,000 - - 25,000 800,000 338,800 - - 154,216 1,293,016 62%/38%Andrew Porter – Chief Financial Officer
2016 600,000 - - 25,000 625,000 125,888 100,623 1,402 - 852,913 73%/27%
2015 587,000 - - 25,000 612,000 164,036 95,123 18,121 - 889,280 69%/31%Geoff Driver – General Manager – Business Development and Investor Relations
2016 485,000 - - 30,000 515,000 103,113 81,690 1,128 - 700,931 73%/27%
2015 475,000 - - 30,000 505,000 134,760 76,824 14,497 - 731,081 69%/31%Simon Pordage – Company Secretary2
2016 317,243 - - 16,090 333,333 - - 731 - 334,064 100%/0%
2015 357,217 - - 18,783 376,000 101,096 55,951 9,100 - 542,147 69%/31%
1. Non-cash benefits relate to the provision of a car parking space.
2. Resigned effective 29 April 2016.
3. Includes amounts credited for non-vesting.
4. Other relates to a refund of charges in respect of parking.
21Australian Foundation Investment Company Limited Annual Report 2016
For
per
sona
l use
onl
y
4. Contract TermsEach Executive is employed under an open-ended contract, the terms of which can be varied by mutual agreement. There is no provision for cessation of employment. Either the Company or the Executive can give notice in accordance with statutory requirements (typically four weeks’ notice; this can be altered at the Board’s discretion but in no case to be more than 12 months). There are no specific payments to be made as a consequence of termination beyond those required by statute. Should there be any payments, these will be at the Board’s discretion.
Material breaches of the terms of employment will normally result in the termination of an Executive’s employment.
5. Non-Executive Director RemunerationShareholders approve the maximum aggregate amount of remuneration per year to be allocated between Non-Executive Directors (NEDs) as they see fit. In proposing the amount for consideration by shareholders, the Remuneration Committee takes into account the time demands made on Directors together with such factors as the general level of fees paid to Australian corporate directors.
For NEDs charged with the responsibility of oversight of the Company’s activities, a fixed annual fee is paid with no element of performance-related pay.
The amount approved at the AGM in October 2007 was $1,000,000 per annum, which is the maximum amount that may be paid in total to all NEDs. Retirement allowances for Directors were frozen at 30 June 2004.
NEDs do not receive any performance-based remuneration. On appointment, the Company enters into a deed of access and indemnity with each NED. There are no termination payments due at the cessation of office, and any Director may retire or resign from the Board, or be removed by a resolution of shareholders.
The amounts paid to each NED, and the figures for the corresponding period, are set out in Table 8.
REMUNERATION REPORT continued
22 Australian Foundation Investment Company Limited Annual Report 2016
For
per
sona
l use
onl
y
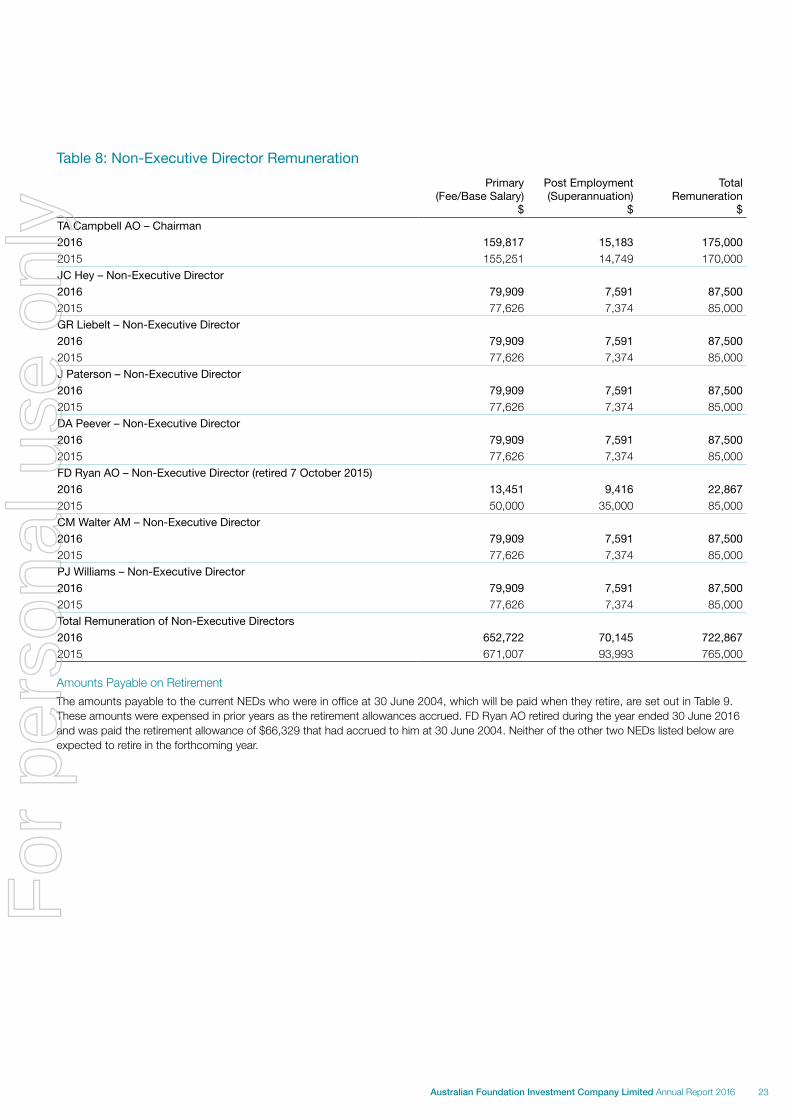
Table 8: Non-Executive Director RemunerationPrimary
(Fee/Base Salary) $
Post Employment (Superannuation)
$
Total Remuneration
$
TA Campbell AO – Chairman
2016 159,817 15,183 175,000
2015 155,251 14,749 170,000JC Hey – Non-Executive Director
2016 79,909 7,591 87,500
2015 77,626 7,374 85,000GR Liebelt – Non-Executive Director
2016 79,909 7,591 87,500
2015 77,626 7,374 85,000J Paterson – Non-Executive Director
2016 79,909 7,591 87,500
2015 77,626 7,374 85,000DA Peever – Non-Executive Director
2016 79,909 7,591 87,500
2015 77,626 7,374 85,000FD Ryan AO – Non-Executive Director (retired 7 October 2015)
2016 13,451 9,416 22,867
2015 50,000 35,000 85,000CM Walter AM – Non-Executive Director
2016 79,909 7,591 87,500
2015 77,626 7,374 85,000PJ Williams – Non-Executive Director
2016 79,909 7,591 87,500
2015 77,626 7,374 85,000Total Remuneration of Non-Executive Directors
2016 652,722 70,145 722,867
2015 671,007 93,993 765,000
Amounts Payable on Retirement
The amounts payable to the current NEDs who were in office at 30 June 2004, which will be paid when they retire, are set out in Table 9. These amounts were expensed in prior years as the retirement allowances accrued. FD Ryan AO retired during the year ended 30 June 2016 and was paid the retirement allowance of $66,329 that had accrued to him at 30 June 2004. Neither of the other two NEDs listed below are expected to retire in the forthcoming year.
23Australian Foundation Investment Company Limited Annual Report 2016
For
per
sona
l use
onl
y
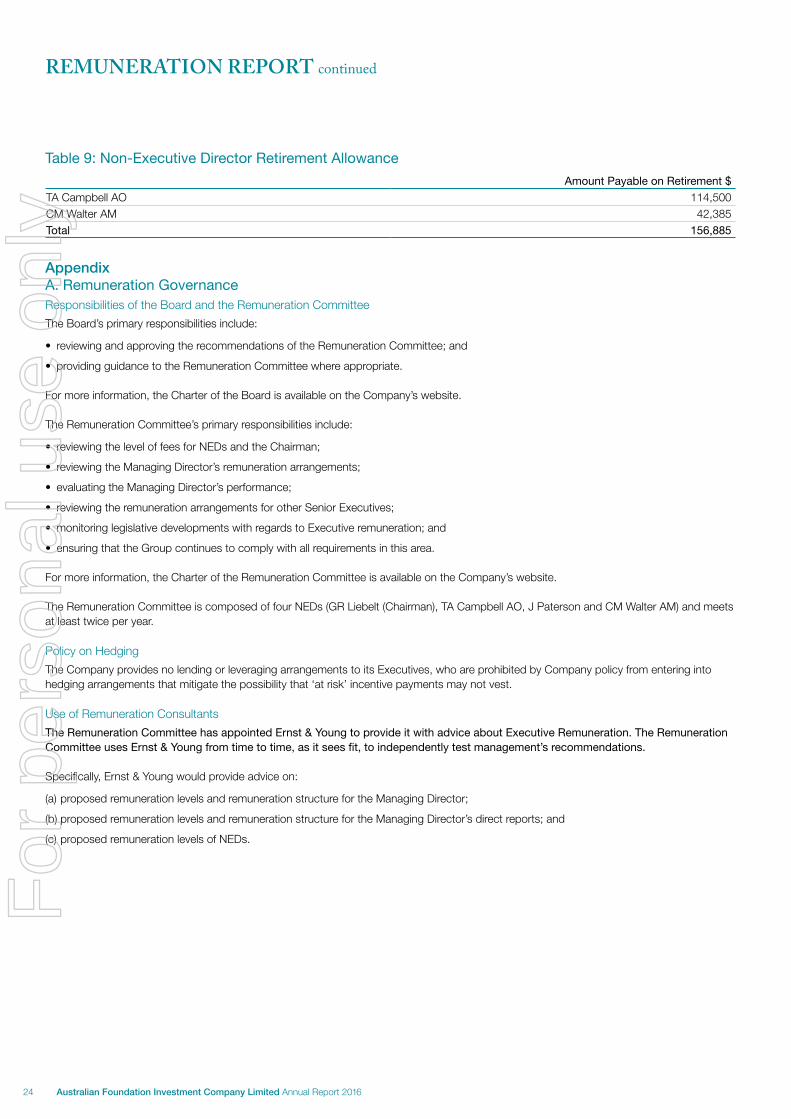
Table 9: Non-Executive Director Retirement AllowanceAmount Payable on Retirement $
TA Campbell AO 114,500CM Walter AM 42,385Total 156,885
AppendixA. Remuneration GovernanceResponsibilities of the Board and the Remuneration Committee
The Board’s primary responsibilities include:
• reviewing and approving the recommendations of the Remuneration Committee; and
• providing guidance to the Remuneration Committee where appropriate.
For more information, the Charter of the Board is available on the Company’s website.
The Remuneration Committee’s primary responsibilities include:
• reviewing the level of fees for NEDs and the Chairman;
• reviewing the Managing Director’s remuneration arrangements;
• evaluating the Managing Director’s performance;
• reviewing the remuneration arrangements for other Senior Executives;
• monitoring legislative developments with regards to Executive remuneration; and
• ensuring that the Group continues to comply with all requirements in this area.
For more information, the Charter of the Remuneration Committee is available on the Company’s website.
The Remuneration Committee is composed of four NEDs (GR Liebelt (Chairman), TA Campbell AO, J Paterson and CM Walter AM) and meets at least twice per year.
Policy on Hedging
The Company provides no lending or leveraging arrangements to its Executives, who are prohibited by Company policy from entering into hedging arrangements that mitigate the possibility that ‘at risk’ incentive payments may not vest.
Use of Remuneration Consultants
The Remuneration Committee has appointed Ernst & Young to provide it with advice about Executive Remuneration. The Remuneration Committee uses Ernst & Young from time to time, as it sees fit, to independently test management’s recommendations.
Specifically, Ernst & Young would provide advice on:
(a) proposed remuneration levels and remuneration structure for the Managing Director;
(b) proposed remuneration levels and remuneration structure for the Managing Director’s direct reports; and
(c) proposed remuneration levels of NEDs.
REMUNERATION REPORT continued
24 Australian Foundation Investment Company Limited Annual Report 2016
For
per
sona
l use
onl
y
The Remuneration Committee has not thought it necessary to engage Ernst & Young to provide advice in these areas this year.
The Board is satisfied that these arrangements ensure that any remuneration recommendations made by remuneration consultants are free from influence by management.
The use of the remuneration advisers by management is limited to specific areas to ensure that the independent advice that the Remuneration Committee receives is not perceived as having been compromised by management.
Ernst & Young is separately engaged by management to report on the following:
(a) trends in remuneration for the sectors in which the Group operates (provision of market practice data);
(b) the relative positioning of the remuneration of the Group’s employees (including Executives) within those sectors;
(c) proposed remuneration levels for employees other than designated Senior Executives; and
(d) advice on the operation of the incentive plans (e.g. tax and accounting advice).
The Managing Director then makes recommendations to the Remuneration Committee with regards to the remuneration levels and structure of the KMP.
Ernst & Young also reviews the calculations used in determining the vesting of awards and certifies them as being correct and in accordance with the terms and conditions of the LTI plan.
Ernst & Young was paid $21,017 during the year ended 30 June 2016 for general remuneration advice including confirmation of vesting calculations (2015: $6,628), and during the year the Group also paid $117,150 for other professional advice received that included acting as the internal auditor for AICS and general taxation and accountancy advice (2015: $127,827) (all including GST).
Ernst & Young was remunerated on an invoiced basis, based on work performed.
The Company also participates in the annual McLagan and FIRG surveys of fund managers to understand current remuneration levels and practices.
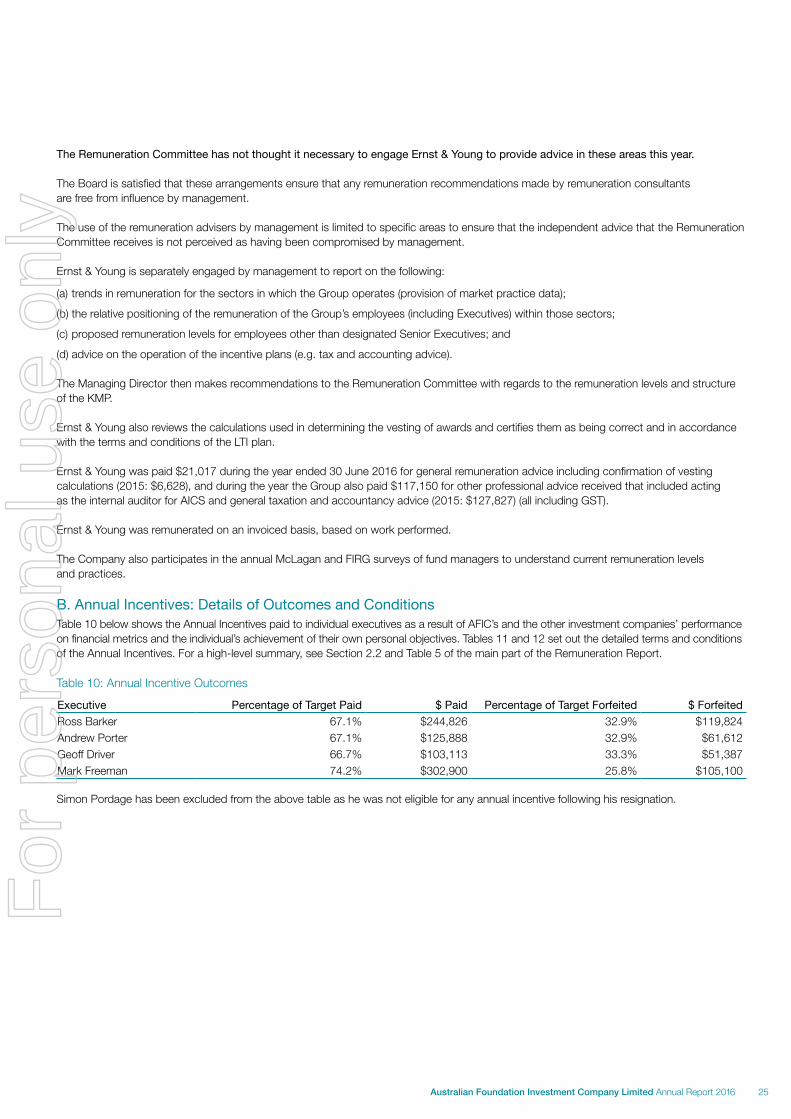
B. Annual Incentives: Details of Outcomes and ConditionsTable 10 below shows the Annual Incentives paid to individual executives as a result of AFIC’s and the other investment companies’ performance on financial metrics and the individual’s achievement of their own personal objectives. Tables 11 and 12 set out the detailed terms and conditions of the Annual Incentives. For a high-level summary, see Section 2.2 and Table 5 of the main part of the Remuneration Report.
Table 10: Annual Incentive Outcomes
Executive Percentage of Target Paid $ Paid Percentage of Target Forfeited $ Forfeited
Ross Barker 67.1% $244,826 32.9% $119,824Andrew Porter 67.1% $125,888 32.9% $61,612Geoff Driver 66.7% $103,113 33.3% $51,387Mark Freeman 74.2% $302,900 25.8% $105,100
Simon Pordage has been excluded from the above table as he was not eligible for any annual incentive following his resignation.
25Australian Foundation Investment Company Limited Annual Report 2016
For
per
sona
l use
onl
y
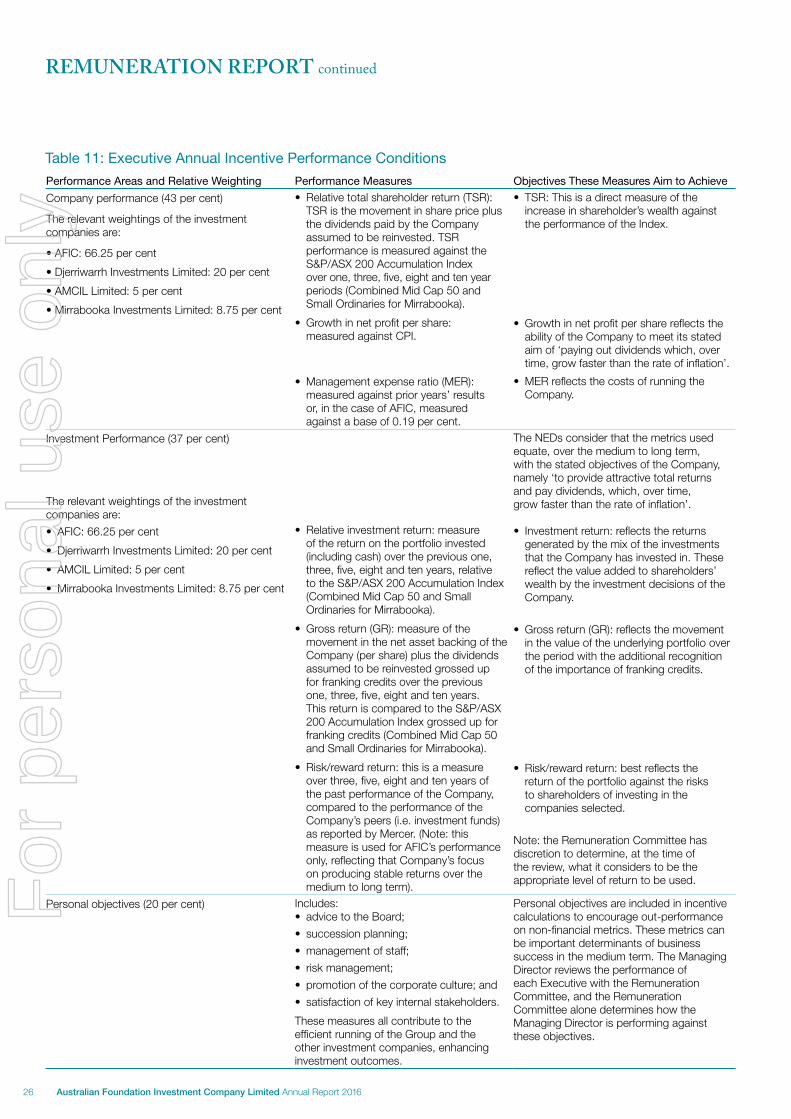
Table 11: Executive Annual Incentive Performance ConditionsPerformance Areas and Relative Weighting Performance Measures Objectives These Measures Aim to Achieve
Company performance (43 per cent)
The relevant weightings of the investment companies are:
• AFIC: 66.25 per cent
• Djerriwarrh Investments Limited: 20 per cent
• AMCIL Limited: 5 per cent
• Mirrabooka Investments Limited: 8.75 per cent
• Relative total shareholder return (TSR): TSR is the movement in share price plus the dividends paid by the Company assumed to be reinvested. TSR performance is measured against the S&P/ASX 200 Accumulation Index over one, three, five, eight and ten year periods (Combined Mid Cap 50 and Small Ordinaries for Mirrabooka).
• Growth in net profit per share: measured against CPI.
• Management expense ratio (MER): measured against prior years’ results or, in the case of AFIC, measured against a base of 0.19 per cent.
• TSR: This is a direct measure of the increase in shareholder’s wealth against the performance of the Index.
• Growth in net profit per share reflects the ability of the Company to meet its stated aim of ‘paying out dividends which, over time, grow faster than the rate of inflation’.
• MER reflects the costs of running the Company.
Investment Performance (37 per cent)
The relevant weightings of the investment companies are:
• AFIC: 66.25 per cent
• Djerriwarrh Investments Limited: 20 per cent
• AMCIL Limited: 5 per cent
• Mirrabooka Investments Limited: 8.75 per cent
• Relative investment return: measure of the return on the portfolio invested (including cash) over the previous one, three, five, eight and ten years, relative to the S&P/ASX 200 Accumulation Index (Combined Mid Cap 50 and Small Ordinaries for Mirrabooka).
• Gross return (GR): measure of the movement in the net asset backing of the Company (per share) plus the dividends assumed to be reinvested grossed up for franking credits over the previous one, three, five, eight and ten years. This return is compared to the S&P/ASX 200 Accumulation Index grossed up for franking credits (Combined Mid Cap 50 and Small Ordinaries for Mirrabooka).
• Risk/reward return: this is a measure over three, five, eight and ten years of the past performance of the Company, compared to the performance of the Company’s peers (i.e. investment funds) as reported by Mercer. (Note: this measure is used for AFIC’s performance only, reflecting that Company’s focus on producing stable returns over the medium to long term).
The NEDs consider that the metrics used equate, over the medium to long term, with the stated objectives of the Company, namely ‘to provide attractive total returns and pay dividends, which, over time, grow faster than the rate of inflation’.
• Investment return: reflects the returns generated by the mix of the investments that the Company has invested in. These reflect the value added to shareholders’ wealth by the investment decisions of the Company.
• Gross return (GR): reflects the movement in the value of the underlying portfolio over the period with the additional recognition of the importance of franking credits.
• Risk/reward return: best reflects the return of the portfolio against the risks to shareholders of investing in the companies selected.
Note: the Remuneration Committee has discretion to determine, at the time of the review, what it considers to be the appropriate level of return to be used.
Personal objectives (20 per cent) Includes:• advice to the Board;
• succession planning;
• management of staff;
• risk management;
• promotion of the corporate culture; and
• satisfaction of key internal stakeholders.
These measures all contribute to the efficient running of the Group and the other investment companies, enhancing investment outcomes.
Personal objectives are included in incentive calculations to encourage out-performance on non-financial metrics. These metrics can be important determinants of business success in the medium term. The Managing Director reviews the performance of each Executive with the Remuneration Committee, and the Remuneration Committee alone determines how the Managing Director is performing against these objectives.
REMUNERATION REPORT continued
26 Australian Foundation Investment Company Limited Annual Report 2016
For
per
sona
l use
onl
y
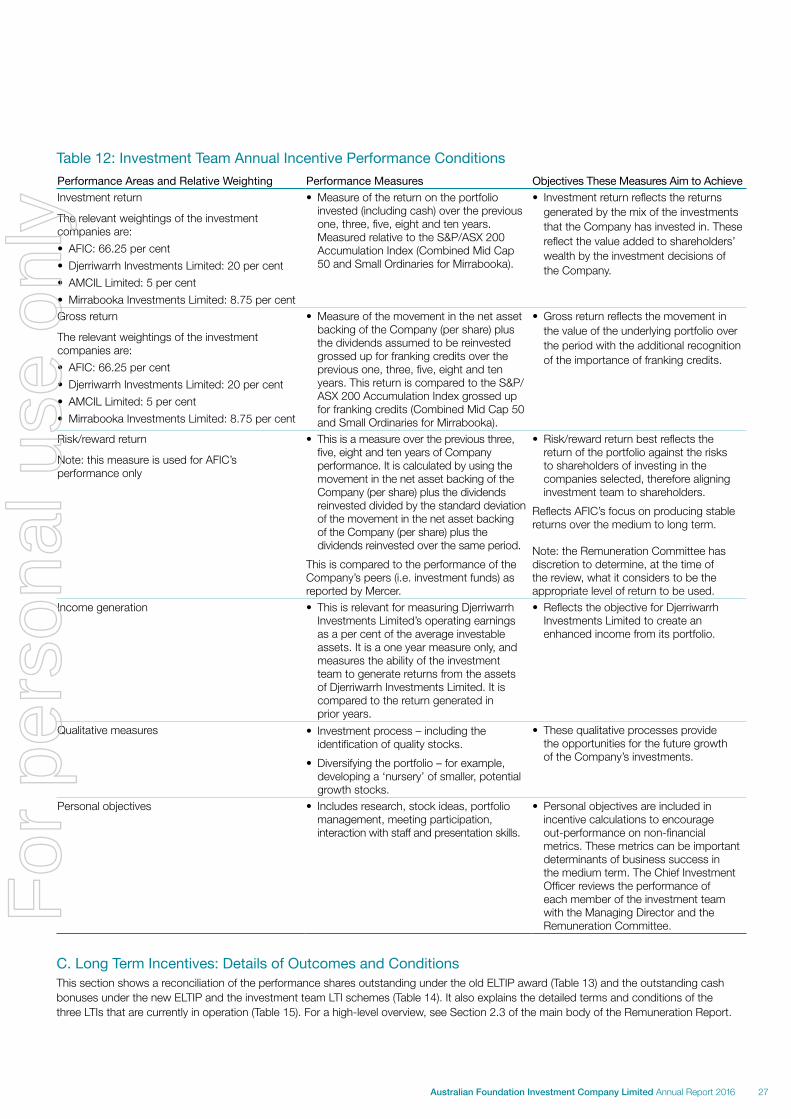
Table 12: Investment Team Annual Incentive Performance ConditionsPerformance Areas and Relative Weighting Performance Measures Objectives These Measures Aim to Achieve
Investment return
The relevant weightings of the investment companies are:
• AFIC: 66.25 per cent
• Djerriwarrh Investments Limited: 20 per cent
• AMCIL Limited: 5 per cent
• Mirrabooka Investments Limited: 8.75 per cent
• Measure of the return on the portfolio invested (including cash) over the previous one, three, five, eight and ten years. Measured relative to the S&P/ASX 200 Accumulation Index (Combined Mid Cap 50 and Small Ordinaries for Mirrabooka).
• Investment return reflects the returns generated by the mix of the investments that the Company has invested in. These reflect the value added to shareholders’ wealth by the investment decisions of the Company.
Gross return
The relevant weightings of the investment companies are:
• AFIC: 66.25 per cent
• Djerriwarrh Investments Limited: 20 per cent
• AMCIL Limited: 5 per cent
• Mirrabooka Investments Limited: 8.75 per cent
• Measure of the movement in the net asset backing of the Company (per share) plus the dividends assumed to be reinvested grossed up for franking credits over the previous one, three, five, eight and ten years. This return is compared to the S&P/ASX 200 Accumulation Index grossed up for franking credits (Combined Mid Cap 50 and Small Ordinaries for Mirrabooka).
• Gross return reflects the movement in the value of the underlying portfolio over the period with the additional recognition of the importance of franking credits.
Risk/reward return
Note: this measure is used for AFIC’s performance only
• This is a measure over the previous three, five, eight and ten years of Company performance. It is calculated by using the movement in the net asset backing of the Company (per share) plus the dividends reinvested divided by the standard deviation of the movement in the net asset backing of the Company (per share) plus the dividends reinvested over the same period.
This is compared to the performance of the Company’s peers (i.e. investment funds) as reported by Mercer.
• Risk/reward return best reflects the return of the portfolio against the risks to shareholders of investing in the companies selected, therefore aligning investment team to shareholders.
Reflects AFIC’s focus on producing stable returns over the medium to long term.
Note: the Remuneration Committee has discretion to determine, at the time of the review, what it considers to be the appropriate level of return to be used.
Income generation • This is relevant for measuring Djerriwarrh Investments Limited’s operating earnings as a per cent of the average investable assets. It is a one year measure only, and measures the ability of the investment team to generate returns from the assets of Djerriwarrh Investments Limited. It is compared to the return generated in prior years.
• Reflects the objective for Djerriwarrh Investments Limited to create an enhanced income from its portfolio.
Qualitative measures • Investment process – including the identification of quality stocks.
• Diversifying the portfolio – for example, developing a ‘nursery’ of smaller, potential growth stocks.
• These qualitative processes provide the opportunities for the future growth of the Company’s investments.
Personal objectives • Includes research, stock ideas, portfolio management, meeting participation, interaction with staff and presentation skills.
• Personal objectives are included in incentive calculations to encourage out-performance on non-financial metrics. These metrics can be important determinants of business success in the medium term. The Chief Investment Officer reviews the performance of each member of the investment team with the Managing Director and the Remuneration Committee.
C. Long Term Incentives: Details of Outcomes and ConditionsThis section shows a reconciliation of the performance shares outstanding under the old ELTIP award (Table 13) and the outstanding cash bonuses under the new ELTIP and the investment team LTI schemes (Table 14). It also explains the detailed terms and conditions of the three LTIs that are currently in operation (Table 15). For a high-level overview, see Section 2.3 of the main body of the Remuneration Report.
27Australian Foundation Investment Company Limited Annual Report 2016
For
per
sona
l use
onl
y
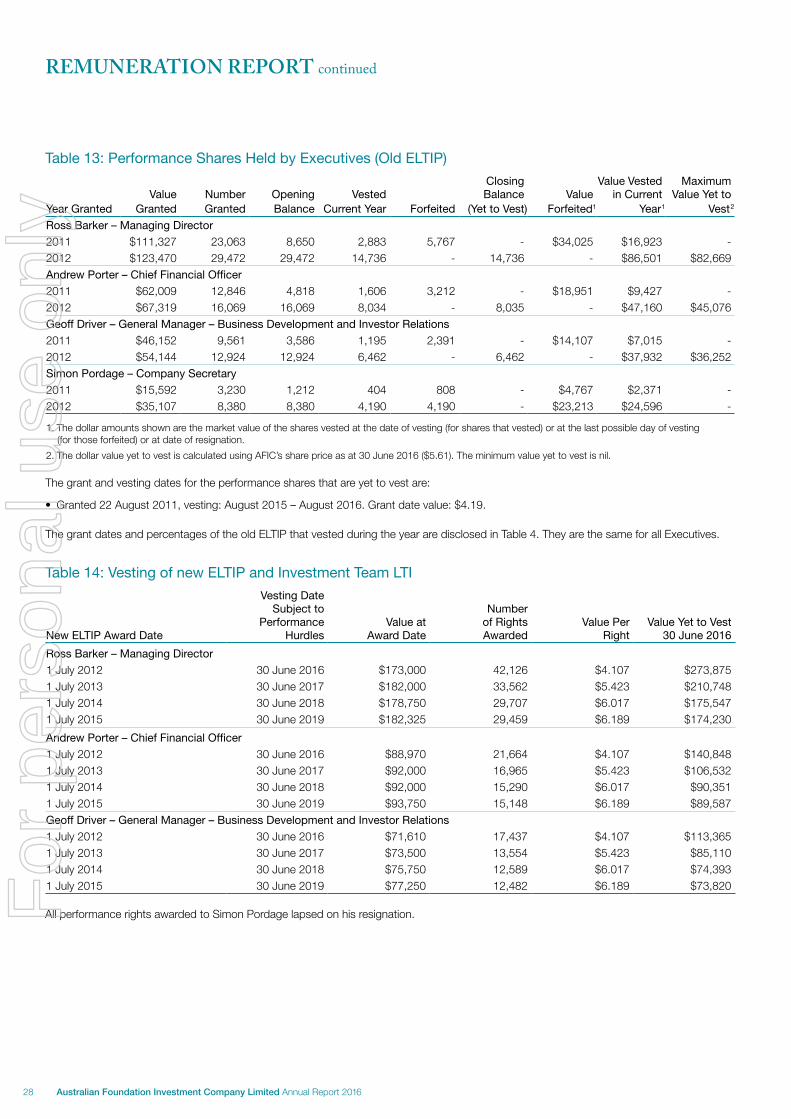
Table 13: Performance Shares Held by Executives (Old ELTIP)
Value Number Opening VestedClosing Balance Value
Value Vested in Current
Maximum Value Yet to
Year Granted Granted Granted Balance Current Year Forfeited (Yet to Vest) Forfeited1 Year1 Vest2
Ross Barker – Managing Director
2011 $111,327 23,063 8,650 2,883 5,767 - $34,025 $16,923 -2012 $123,470 29,472 29,472 14,736 - 14,736 - $86,501 $82,669Andrew Porter – Chief Financial Officer
2011 $62,009 12,846 4,818 1,606 3,212 - $18,951 $9,427 -2012 $67,319 16,069 16,069 8,034 - 8,035 - $47,160 $45,076Geoff Driver – General Manager – Business Development and Investor Relations
2011 $46,152 9,561 3,586 1,195 2,391 - $14,107 $7,015 -2012 $54,144 12,924 12,924 6,462 - 6,462 - $37,932 $36,252Simon Pordage – Company Secretary
2011 $15,592 3,230 1,212 404 808 - $4,767 $2,371 -2012 $35,107 8,380 8,380 4,190 4,190 - $23,213 $24,596 -
1. The dollar amounts shown are the market value of the shares vested at the date of vesting (for shares that vested) or at the last possible day of vesting (for those forfeited) or at date of resignation.
2. The dollar value yet to vest is calculated using AFIC’s share price as at 30 June 2016 ($5.61). The minimum value yet to vest is nil.
The grant and vesting dates for the performance shares that are yet to vest are:
• Granted 22 August 2011, vesting: August 2015 – August 2016. Grant date value: $4.19.
The grant dates and percentages of the old ELTIP that vested during the year are disclosed in Table 4. They are the same for all Executives.
Table 14: Vesting of new ELTIP and Investment Team LTI
New ELTIP Award Date
Vesting Date Subject to
Performance Hurdles
Value at Award Date
Number of Rights Awarded
Value Per Right
Value Yet to Vest 30 June 2016
Ross Barker – Managing Director
1 July 2012 30 June 2016 $173,000 42,126 $4.107 $273,8751 July 2013 30 June 2017 $182,000 33,562 $5.423 $210,7481 July 2014 30 June 2018 $178,750 29,707 $6.017 $175,5471 July 2015 30 June 2019 $182,325 29,459 $6.189 $174,230
Andrew Porter – Chief Financial Officer
1 July 2012 30 June 2016 $88,970 21,664 $4.107 $140,8481 July 2013 30 June 2017 $92,000 16,965 $5.423 $106,5321 July 2014 30 June 2018 $92,000 15,290 $6.017 $90,3511 July 2015 30 June 2019 $93,750 15,148 $6.189 $89,587Geoff Driver – General Manager – Business Development and Investor Relations
1 July 2012 30 June 2016 $71,610 17,437 $4.107 $113,3651 July 2013 30 June 2017 $73,500 13,554 $5.423 $85,1101 July 2014 30 June 2018 $75,750 12,589 $6.017 $74,3931 July 2015 30 June 2019 $77,250 12,482 $6.189 $73,820
All performance rights awarded to Simon Pordage lapsed on his resignation.
REMUNERATION REPORT continued
28 Australian Foundation Investment Company Limited Annual Report 2016
For
per
sona
l use
onl
y
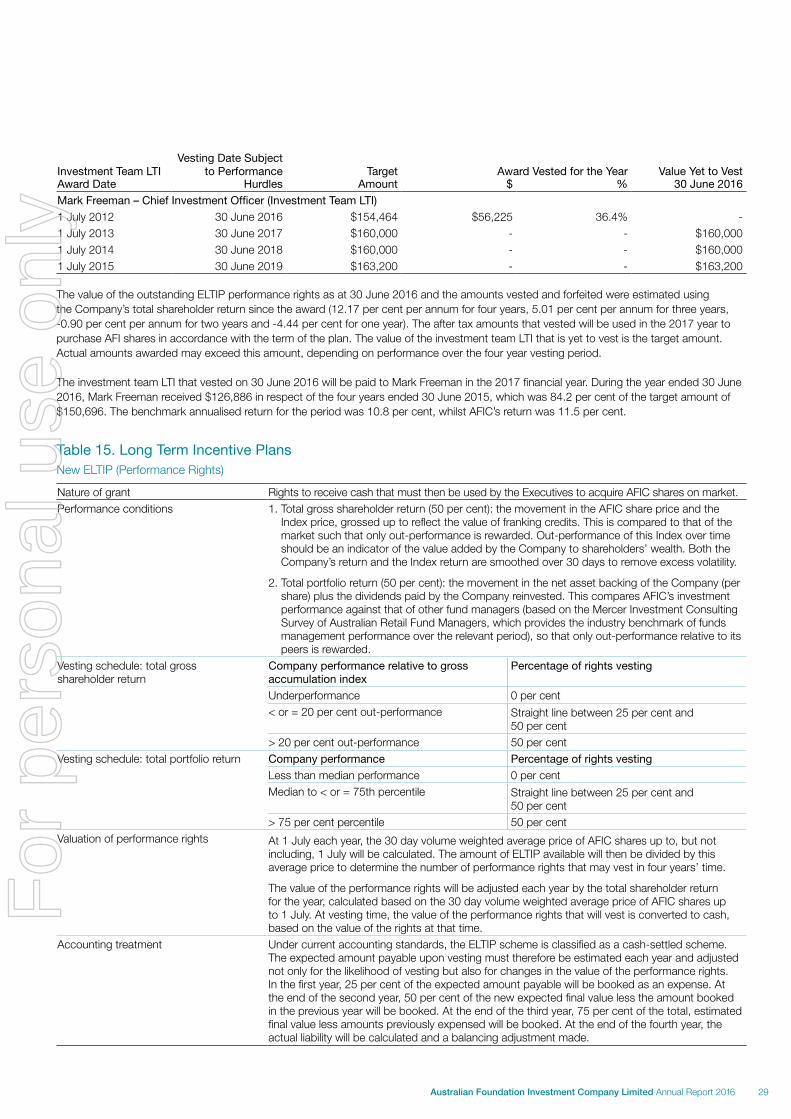
Investment Team LTIVesting Date Subject
to Performance Target Award Vested for the Year Value Yet to VestAward Date Hurdles Amount $ % 30 June 2016
Mark Freeman – Chief Investment Officer (Investment Team LTI)
1 July 2012 30 June 2016 $154,464 $56,225 36.4% -1 July 2013 30 June 2017 $160,000 - - $160,0001 July 2014 30 June 2018 $160,000 - - $160,0001 July 2015 30 June 2019 $163,200 - - $163,200
The value of the outstanding ELTIP performance rights as at 30 June 2016 and the amounts vested and forfeited were estimated using the Company’s total shareholder return since the award (12.17 per cent per annum for four years, 5.01 per cent per annum for three years, -0.90 per cent per annum for two years and -4.44 per cent for one year). The after tax amounts that vested will be used in the 2017 year to purchase AFI shares in accordance with the term of the plan. The value of the investment team LTI that is yet to vest is the target amount. Actual amounts awarded may exceed this amount, depending on performance over the four year vesting period.
The investment team LTI that vested on 30 June 2016 will be paid to Mark Freeman in the 2017 financial year. During the year ended 30 June 2016, Mark Freeman received $126,886 in respect of the four years ended 30 June 2015, which was 84.2 per cent of the target amount of $150,696. The benchmark annualised return for the period was 10.8 per cent, whilst AFIC’s return was 11.5 per cent.
Table 15. Long Term Incentive PlansNew ELTIP (Performance Rights)
Nature of grant Rights to receive cash that must then be used by the Executives to acquire AFIC shares on market. Performance conditions 1. Total gross shareholder return (50 per cent): the movement in the AFIC share price and the
Index price, grossed up to reflect the value of franking credits. This is compared to that of the market such that only out-performance is rewarded. Out-performance of this Index over time should be an indicator of the value added by the Company to shareholders’ wealth. Both the Company’s return and the Index return are smoothed over 30 days to remove excess volatility.
2. Total portfolio return (50 per cent): the movement in the net asset backing of the Company (per share) plus the dividends paid by the Company reinvested. This compares AFIC’s investment performance against that of other fund managers (based on the Mercer Investment Consulting Survey of Australian Retail Fund Managers, which provides the industry benchmark of funds management performance over the relevant period), so that only out-performance relative to its peers is rewarded.
Vesting schedule: total gross shareholder return
Company performance relative to gross accumulation index
Percentage of rights vesting
Underperformance 0 per cent< or = 20 per cent out-performance Straight line between 25 per cent and
50 per cent> 20 per cent out-performance 50 per cent
Vesting schedule: total portfolio return Company performance Percentage of rights vesting
Less than median performance 0 per centMedian to < or = 75th percentile Straight line between 25 per cent and
50 per cent> 75 per cent percentile 50 per cent
Valuation of performance rights At 1 July each year, the 30 day volume weighted average price of AFIC shares up to, but not including, 1 July will be calculated. The amount of ELTIP available will then be divided by this average price to determine the number of performance rights that may vest in four years’ time.
The value of the performance rights will be adjusted each year by the total shareholder return for the year, calculated based on the 30 day volume weighted average price of AFIC shares up to 1 July. At vesting time, the value of the performance rights that will vest is converted to cash, based on the value of the rights at that time.
Accounting treatment Under current accounting standards, the ELTIP scheme is classified as a cash-settled scheme. The expected amount payable upon vesting must therefore be estimated each year and adjusted not only for the likelihood of vesting but also for changes in the value of the performance rights. In the first year, 25 per cent of the expected amount payable will be booked as an expense. At the end of the second year, 50 per cent of the new expected final value less the amount booked in the previous year will be booked. At the end of the third year, 75 per cent of the total, estimated final value less amounts previously expensed will be booked. At the end of the fourth year, the actual liability will be calculated and a balancing adjustment made.
29Australian Foundation Investment Company Limited Annual Report 2016
For
per
sona
l use
onl
y
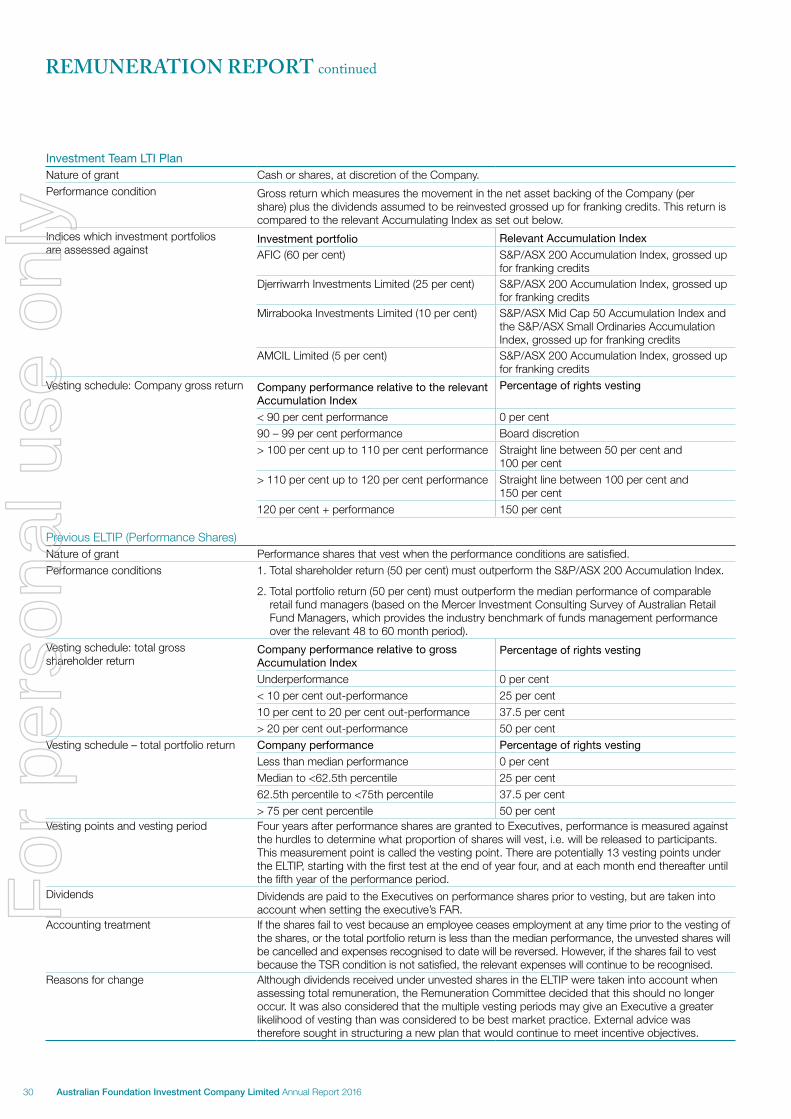
Investment Team LTI PlanNature of grant Cash or shares, at discretion of the Company.Performance condition Gross return which measures the movement in the net asset backing of the Company (per
share) plus the dividends assumed to be reinvested grossed up for franking credits. This return is compared to the relevant Accumulating Index as set out below.
Indices which investment portfolios are assessed against
Investment portfolio Relevant Accumulation Index
AFIC (60 per cent) S&P/ASX 200 Accumulation Index, grossed up for franking credits
Djerriwarrh Investments Limited (25 per cent) S&P/ASX 200 Accumulation Index, grossed up for franking credits
Mirrabooka Investments Limited (10 per cent) S&P/ASX Mid Cap 50 Accumulation Index and the S&P/ASX Small Ordinaries Accumulation Index, grossed up for franking credits
AMCIL Limited (5 per cent) S&P/ASX 200 Accumulation Index, grossed up for franking credits
Vesting schedule: Company gross return Company performance relative to the relevant Accumulation Index
Percentage of rights vesting
< 90 per cent performance 0 per cent90 – 99 per cent performance Board discretion> 100 per cent up to 110 per cent performance Straight line between 50 per cent and
100 per cent> 110 per cent up to 120 per cent performance Straight line between 100 per cent and
150 per cent 120 per cent + performance 150 per cent
Previous ELTIP (Performance Shares)Nature of grant Performance shares that vest when the performance conditions are satisfied.Performance conditions 1. Total shareholder return (50 per cent) must outperform the S&P/ASX 200 Accumulation Index.
2. Total portfolio return (50 per cent) must outperform the median performance of comparable retail fund managers (based on the Mercer Investment Consulting Survey of Australian Retail Fund Managers, which provides the industry benchmark of funds management performance over the relevant 48 to 60 month period).
Vesting schedule: total gross shareholder return
Company performance relative to gross Accumulation Index
Percentage of rights vesting
Underperformance 0 per cent< 10 per cent out-performance 25 per cent10 per cent to 20 per cent out-performance 37.5 per cent> 20 per cent out-performance 50 per cent
Vesting schedule – total portfolio return Company performance Percentage of rights vesting
Less than median performance 0 per centMedian to <62.5th percentile 25 per cent62.5th percentile to <75th percentile 37.5 per cent> 75 per cent percentile 50 per cent
Vesting points and vesting period Four years after performance shares are granted to Executives, performance is measured against the hurdles to determine what proportion of shares will vest, i.e. will be released to participants. This measurement point is called the vesting point. There are potentially 13 vesting points under the ELTIP, starting with the first test at the end of year four, and at each month end thereafter until the fifth year of the performance period.
Dividends Dividends are paid to the Executives on performance shares prior to vesting, but are taken into account when setting the executive’s FAR.
Accounting treatment If the shares fail to vest because an employee ceases employment at any time prior to the vesting of the shares, or the total portfolio return is less than the median performance, the unvested shares will be cancelled and expenses recognised to date will be reversed. However, if the shares fail to vest because the TSR condition is not satisfied, the relevant expenses will continue to be recognised.
Reasons for change Although dividends received under unvested shares in the ELTIP were taken into account when assessing total remuneration, the Remuneration Committee decided that this should no longer occur. It was also considered that the multiple vesting periods may give an Executive a greater likelihood of vesting than was considered to be best market practice. External advice was therefore sought in structuring a new plan that would continue to meet incentive objectives.
REMUNERATION REPORT continued
30 Australian Foundation Investment Company Limited Annual Report 2016
For
per
sona
l use
onl
y
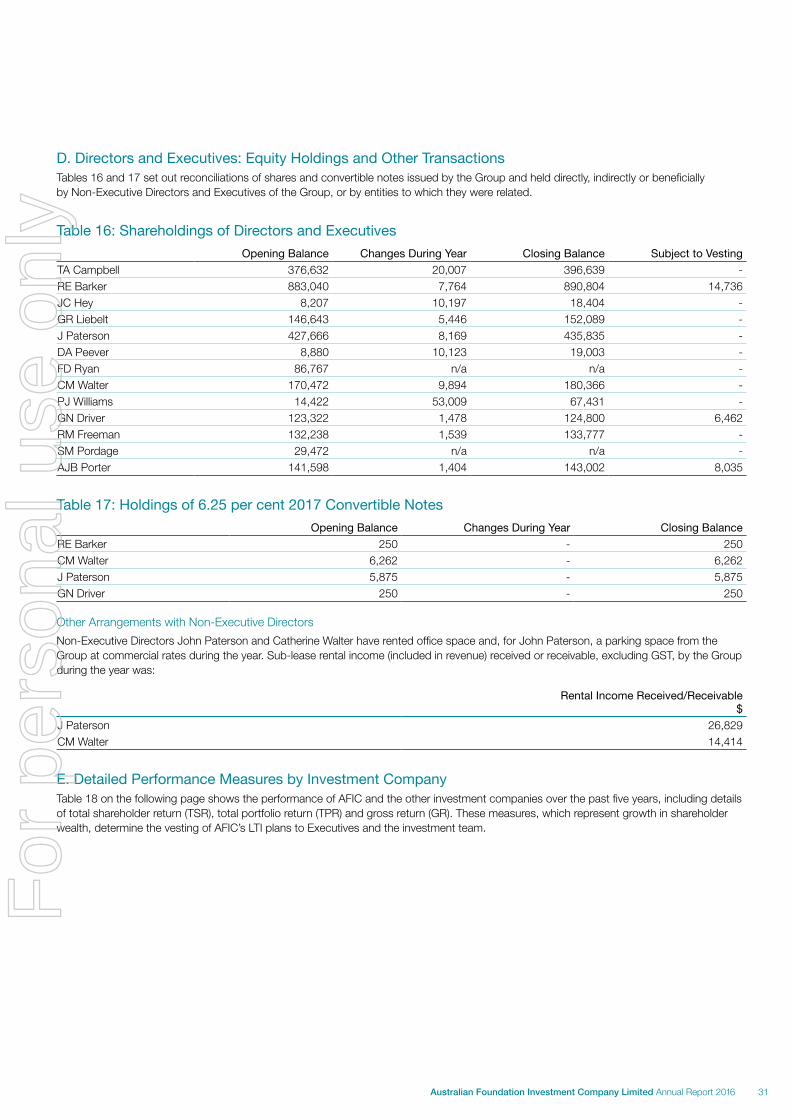
D. Directors and Executives: Equity Holdings and Other TransactionsTables 16 and 17 set out reconciliations of shares and convertible notes issued by the Group and held directly, indirectly or beneficially by Non-Executive Directors and Executives of the Group, or by entities to which they were related.
Table 16: Shareholdings of Directors and ExecutivesOpening Balance Changes During Year Closing Balance Subject to Vesting
TA Campbell 376,632 20,007 396,639 -RE Barker 883,040 7,764 890,804 14,736JC Hey 8,207 10,197 18,404 -GR Liebelt 146,643 5,446 152,089 -J Paterson 427,666 8,169 435,835 -DA Peever 8,880 10,123 19,003 -FD Ryan 86,767 n/a n/a -CM Walter 170,472 9,894 180,366 -PJ Williams 14,422 53,009 67,431 -GN Driver 123,322 1,478 124,800 6,462RM Freeman 132,238 1,539 133,777 -SM Pordage 29,472 n/a n/a -AJB Porter 141,598 1,404 143,002 8,035
Table 17: Holdings of 6.25 per cent 2017 Convertible NotesOpening Balance Changes During Year Closing Balance
RE Barker 250 - 250CM Walter 6,262 - 6,262J Paterson 5,875 - 5,875GN Driver 250 - 250
Other Arrangements with Non-Executive Directors
Non-Executive Directors John Paterson and Catherine Walter have rented office space and, for John Paterson, a parking space from the Group at commercial rates during the year. Sub-lease rental income (included in revenue) received or receivable, excluding GST, by the Group during the year was:
Rental Income Received/Receivable $
J Paterson 26,829CM Walter 14,414
E. Detailed Performance Measures by Investment CompanyTable 18 on the following page shows the performance of AFIC and the other investment companies over the past five years, including details of total shareholder return (TSR), total portfolio return (TPR) and gross return (GR). These measures, which represent growth in shareholder wealth, determine the vesting of AFIC’s LTI plans to Executives and the investment team.
31Australian Foundation Investment Company Limited Annual Report 2016
For
per
sona
l use
onl
y
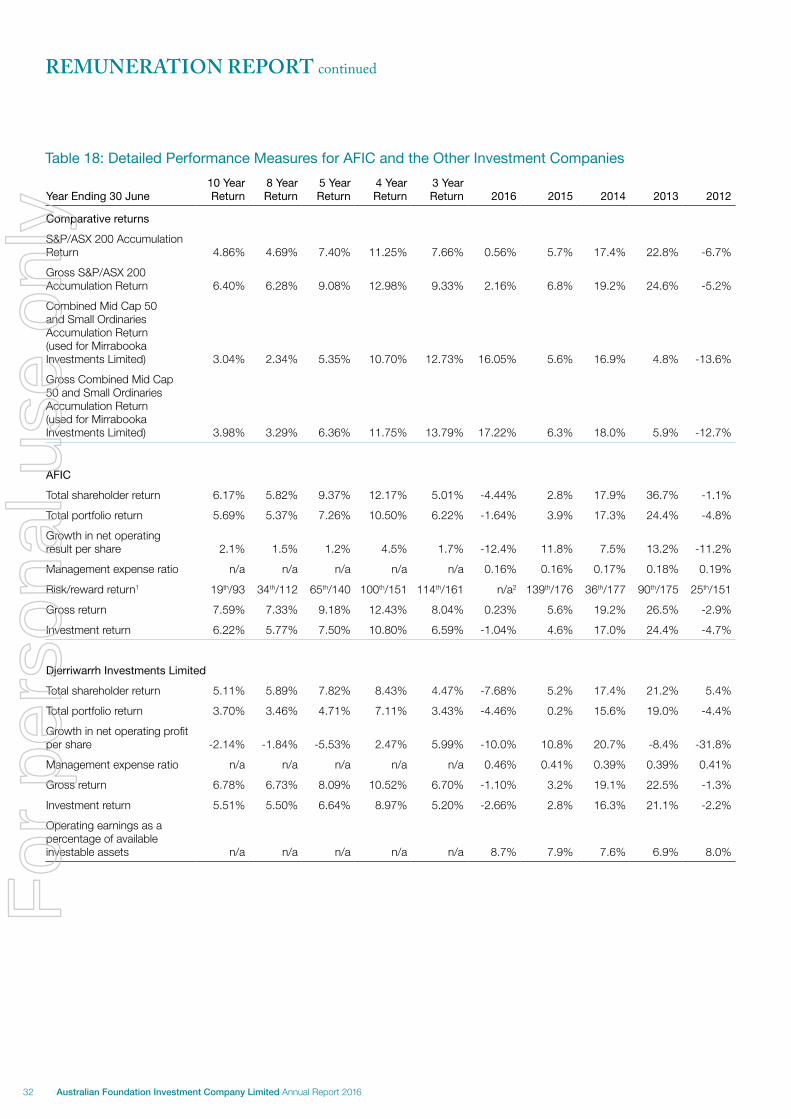
Table 18: Detailed Performance Measures for AFIC and the Other Investment Companies
Year Ending 30 June10 Year Return
8 Year Return
5 Year Return
4 Year Return
3 Year Return 2016 2015 2014 2013 2012
Comparative returns
S&P/ASX 200 Accumulation Return 4.86% 4.69% 7.40% 11.25% 7.66% 0.56% 5.7% 17.4% 22.8% -6.7%
Gross S&P/ASX 200 Accumulation Return 6.40% 6.28% 9.08% 12.98% 9.33% 2.16% 6.8% 19.2% 24.6% -5.2%
Combined Mid Cap 50 and Small Ordinaries Accumulation Return (used for Mirrabooka Investments Limited) 3.04% 2.34% 5.35% 10.70% 12.73% 16.05% 5.6% 16.9% 4.8% -13.6%
Gross Combined Mid Cap 50 and Small Ordinaries Accumulation Return (used for Mirrabooka Investments Limited) 3.98% 3.29% 6.36% 11.75% 13.79% 17.22% 6.3% 18.0% 5.9% -12.7%
AFIC
Total shareholder return 6.17% 5.82% 9.37% 12.17% 5.01% -4.44% 2.8% 17.9% 36.7% -1.1%
Total portfolio return 5.69% 5.37% 7.26% 10.50% 6.22% -1.64% 3.9% 17.3% 24.4% -4.8%
Growth in net operating result per share 2.1% 1.5% 1.2% 4.5% 1.7% -12.4% 11.8% 7.5% 13.2% -11.2%
Management expense ratio n/a n/a n/a n/a n/a 0.16% 0.16% 0.17% 0.18% 0.19%
Risk/reward return1 19th/93 34th/112 65th/140 100th/151 114th/161 n/a2 139th/176 36th/177 90th/175 25th/151
Gross return 7.59% 7.33% 9.18% 12.43% 8.04% 0.23% 5.6% 19.2% 26.5% -2.9%
Investment return 6.22% 5.77% 7.50% 10.80% 6.59% -1.04% 4.6% 17.0% 24.4% -4.7%
Djerriwarrh Investments Limited
Total shareholder return 5.11% 5.89% 7.82% 8.43% 4.47% -7.68% 5.2% 17.4% 21.2% 5.4%
Total portfolio return 3.70% 3.46% 4.71% 7.11% 3.43% -4.46% 0.2% 15.6% 19.0% -4.4%
Growth in net operating profit per share -2.14% -1.84% -5.53% 2.47% 5.99% -10.0% 10.8% 20.7% -8.4% -31.8%
Management expense ratio n/a n/a n/a n/a n/a 0.46% 0.41% 0.39% 0.39% 0.41%
Gross return 6.78% 6.73% 8.09% 10.52% 6.70% -1.10% 3.2% 19.1% 22.5% -1.3%
Investment return 5.51% 5.50% 6.64% 8.97% 5.20% -2.66% 2.8% 16.3% 21.1% -2.2%
Operating earnings as a percentage of available investable assets n/a n/a n/a n/a n/a 8.7% 7.9% 7.6% 6.9% 8.0%
REMUNERATION REPORT continued
32 Australian Foundation Investment Company Limited Annual Report 2016
For
per
sona
l use
onl
y
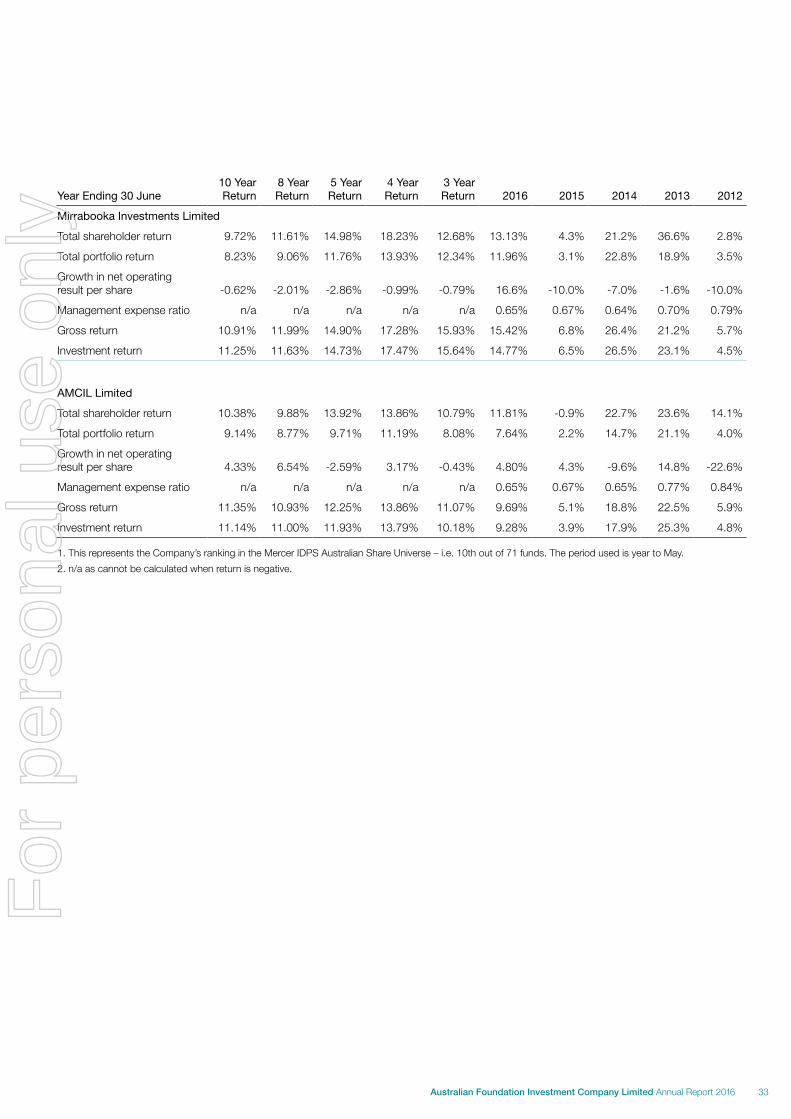
Year Ending 30 June10 Year Return
8 Year Return
5 Year Return
4 Year Return
3 Year Return 2016 2015 2014 2013 2012
Mirrabooka Investments Limited
Total shareholder return 9.72% 11.61% 14.98% 18.23% 12.68% 13.13% 4.3% 21.2% 36.6% 2.8%
Total portfolio return 8.23% 9.06% 11.76% 13.93% 12.34% 11.96% 3.1% 22.8% 18.9% 3.5%
Growth in net operating result per share -0.62% -2.01% -2.86% -0.99% -0.79% 16.6% -10.0% -7.0% -1.6% -10.0%
Management expense ratio n/a n/a n/a n/a n/a 0.65% 0.67% 0.64% 0.70% 0.79%
Gross return 10.91% 11.99% 14.90% 17.28% 15.93% 15.42% 6.8% 26.4% 21.2% 5.7%
Investment return 11.25% 11.63% 14.73% 17.47% 15.64% 14.77% 6.5% 26.5% 23.1% 4.5%
AMCIL Limited
Total shareholder return 10.38% 9.88% 13.92% 13.86% 10.79% 11.81% -0.9% 22.7% 23.6% 14.1%
Total portfolio return 9.14% 8.77% 9.71% 11.19% 8.08% 7.64% 2.2% 14.7% 21.1% 4.0%
Growth in net operating result per share 4.33% 6.54% -2.59% 3.17% -0.43% 4.80% 4.3% -9.6% 14.8% -22.6%
Management expense ratio n/a n/a n/a n/a n/a 0.65% 0.67% 0.65% 0.77% 0.84%
Gross return 11.35% 10.93% 12.25% 13.86% 11.07% 9.69% 5.1% 18.8% 22.5% 5.9%
Investment return 11.14% 11.00% 11.93% 13.79% 10.18% 9.28% 3.9% 17.9% 25.3% 4.8%
1. This represents the Company’s ranking in the Mercer IDPS Australian Share Universe – i.e. 10th out of 71 funds. The period used is year to May.
2. n/a as cannot be calculated when return is negative.
33Australian Foundation Investment Company Limited Annual Report 2016
For
per
sona
l use
onl
y
NON-AUDIT SERVICES
Details of non-audit services performed by the auditors may be found in Note F2 of the Financial Report.
The Board of Directors has considered the position and, in accordance with the advice received from the Audit Committee, is satisfied that the provision of the non-audit services is compatible with the general standard of independence for auditors imposed by the Corporations Act 2001. The Directors are satisfied that the provision of non-audit services by the auditor, as set out below, did not compromise the auditor independence requirements of the Corporations Act 2001 for the following reasons:
• all non-audit services have been reviewed by the Audit Committee to ensure they do not impact the impartiality and objectivity of the auditor; and
• none of the services undermine the general principles relating to auditor independence as set out in the Corporations Act 2001 including reviewing or auditing the auditor’s own work, acting in a management or a decision-making capacity for the Company, acting as advocate for the Company, or jointly sharing economic risk and rewards.
A copy of the Auditor’s Independence Declaration is set out on page 35.
This report is made in accordance with a resolution of the Directors.
Terrence Campbell AOChairman
Melbourne25 July 2016
34 Australian Foundation Investment Company Limited Annual Report 2016
For
per
sona
l use
onl
y
AUDITOR’S INDEPENDENCE DECLARATION
35Australian Foundation Investment Company Limited Annual Report 2016
For
per
sona
l use
onl
y
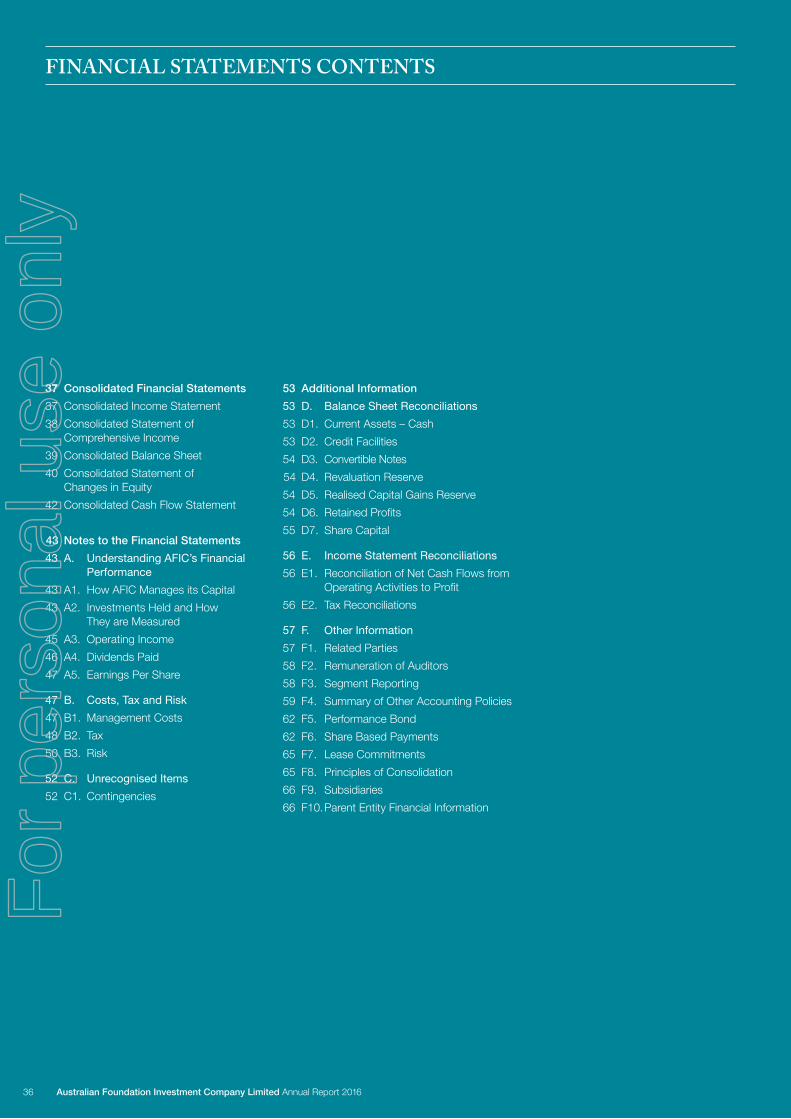
FINANCIAL STATEMENTS CONTENTS
37 Consolidated Financial Statements
37 Consolidated Income Statement
38 Consolidated Statement of Comprehensive Income
39 Consolidated Balance Sheet
40 Consolidated Statement of Changes in Equity
42 Consolidated Cash Flow Statement
43 Notes to the Financial Statements
43 A. Understanding AFIC’s Financial Performance
43 A1. How AFIC Manages its Capital
43 A2. Investments Held and How They are Measured
45 A3. Operating Income
46 A4. Dividends Paid
47 A5. Earnings Per Share
47 B. Costs, Tax and Risk
47 B1. Management Costs
48 B2. Tax
50 B3. Risk
52 C. Unrecognised Items
52 C1. Contingencies
53 Additional Information
53 D. Balance Sheet Reconciliations
53 D1. Current Assets – Cash
53 D2. Credit Facilities
54 D3. Convertible Notes
54 D4. Revaluation Reserve
54 D5. Realised Capital Gains Reserve
54 D6. Retained Profits
55 D7. Share Capital
56 E. Income Statement Reconciliations
56 E1. Reconciliation of Net Cash Flows from Operating Activities to Profit
56 E2. Tax Reconciliations
57 F. Other Information
57 F1. Related Parties
58 F2. Remuneration of Auditors
58 F3. Segment Reporting
59 F4. Summary of Other Accounting Policies
62 F5. Performance Bond
62 F6. Share Based Payments
65 F7. Lease Commitments
65 F8. Principles of Consolidation
66 F9. Subsidiaries
66 F10. Parent Entity Financial Information
36 Australian Foundation Investment Company Limited Annual Report 2016
For
per
sona
l use
onl
y
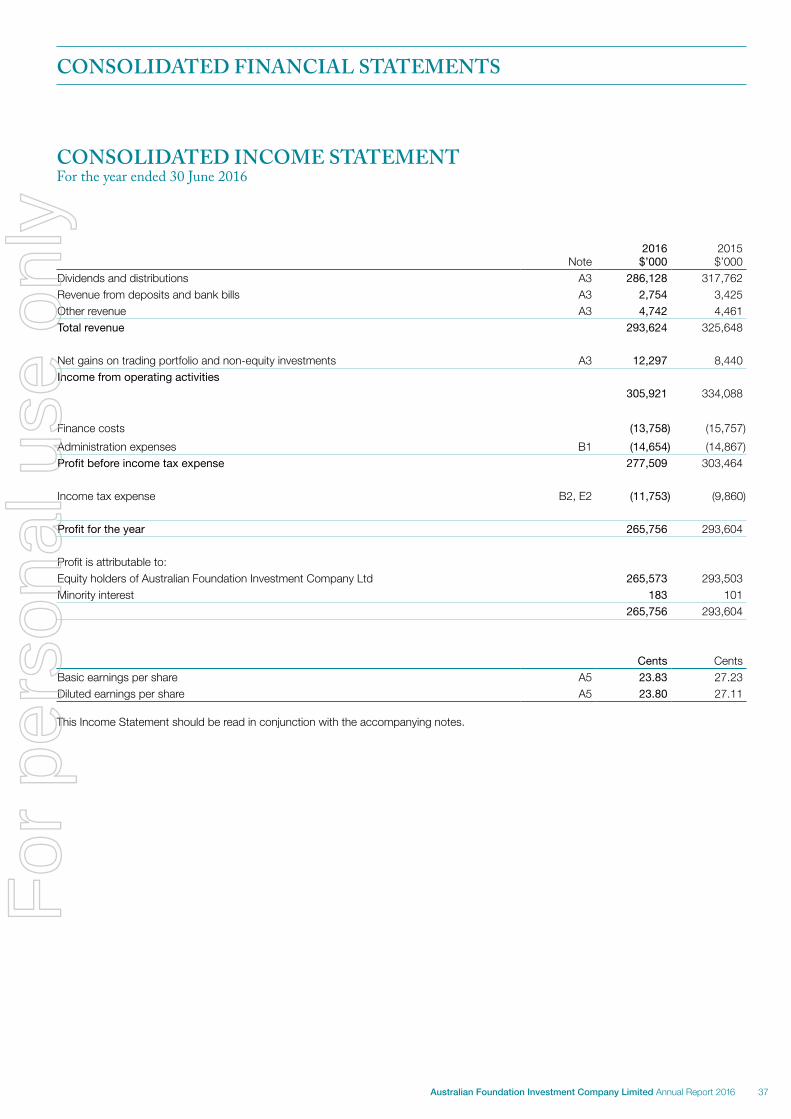
CONSOLIDATED FINANCIAL STATEMENTS
Note2016
$’0002015 $’000
Dividends and distributions A3 286,128 317,762Revenue from deposits and bank bills A3 2,754 3,425Other revenue A3 4,742 4,461Total revenue 293,624 325,648
Net gains on trading portfolio and non-equity investments A3 12,297 8,440Income from operating activities
305,921 334,088
Finance costs (13,758) (15,757)
Administration expenses B1 (14,654) (14,867)Profit before income tax expense 277,509 303,464
Income tax expense B2, E2 (11,753) (9,860)
Profit for the year 265,756 293,604
Profit is attributable to:Equity holders of Australian Foundation Investment Company Ltd 265,573 293,503Minority interest 183 101
265,756 293,604
Cents CentsBasic earnings per share A5 23.83 27.23Diluted earnings per share A5 23.80 27.11
This Income Statement should be read in conjunction with the accompanying notes.
CONSOLIDATED INCOME STATEMENTFor the year ended 30 June 2016
37Australian Foundation Investment Company Limited Annual Report 2016
For
per
sona
l use
onl
y
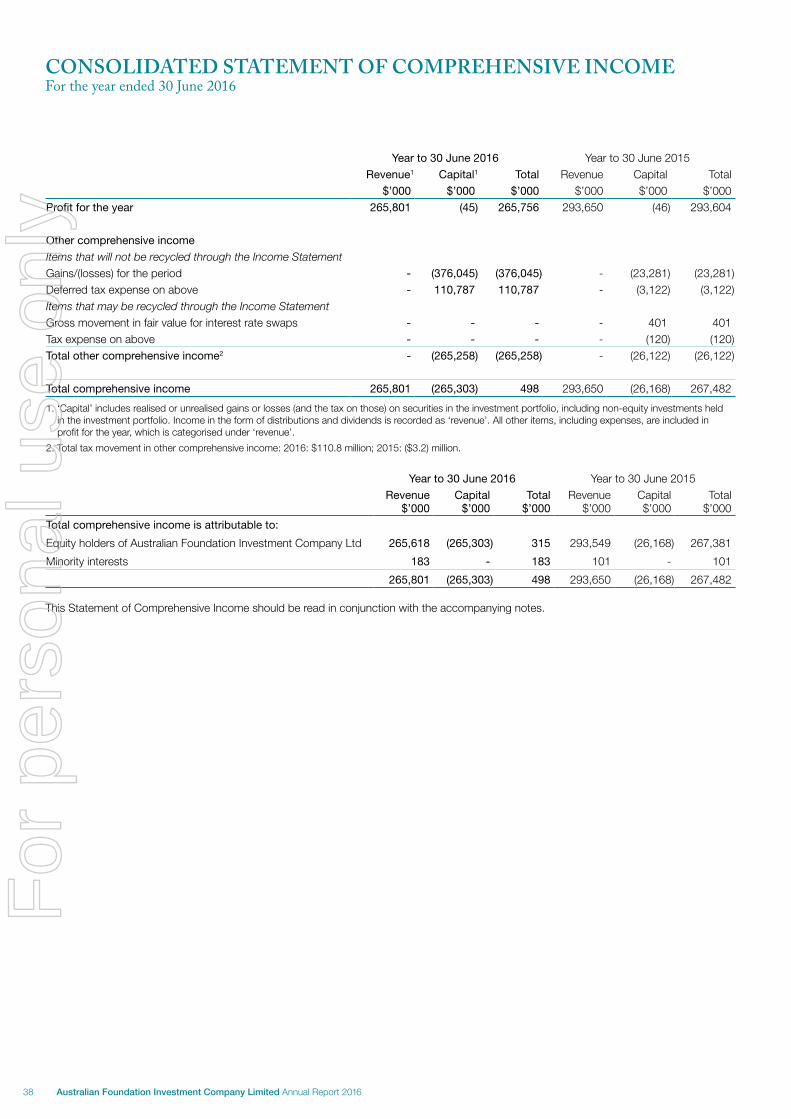
CONSOLIDATED STATEMENT OF COMPREHENSIVE INCOMEFor the year ended 30 June 2016
Year to 30 June 2016 Year to 30 June 2015Revenue1 Capital1 Total Revenue Capital Total
$’000 $’000 $’000 $’000 $’000 $’000Profit for the year 265,801 (45) 265,756 293,650 (46) 293,604
Other comprehensive income
Items that will not be recycled through the Income Statement
Gains/(losses) for the period - (376,045) (376,045) - (23,281) (23,281)Deferred tax expense on above - 110,787 110,787 - (3,122) (3,122)Items that may be recycled through the Income Statement
Gross movement in fair value for interest rate swaps - - - - 401 401Tax expense on above - - - - (120) (120)Total other comprehensive income2 - (265,258) (265,258) - (26,122) (26,122)
Total comprehensive income 265,801 (265,303) 498 293,650 (26,168) 267,482
1. ‘Capital’ includes realised or unrealised gains or losses (and the tax on those) on securities in the investment portfolio, including non-equity investments held in the investment portfolio. Income in the form of distributions and dividends is recorded as ‘revenue’. All other items, including expenses, are included in profit for the year, which is categorised under ‘revenue’.
2. Total tax movement in other comprehensive income: 2016: $110.8 million; 2015: ($3.2) million.
Year to 30 June 2016 Year to 30 June 2015Revenue
$’000Capital
$’000Total
$’000Revenue
$’000Capital$’000
Total$’000
Total comprehensive income is attributable to:
Equity holders of Australian Foundation Investment Company Ltd 265,618 (265,303) 315 293,549 (26,168) 267,381
Minority interests 183 - 183 101 - 101
265,801 (265,303) 498 293,650 (26,168) 267,482
This Statement of Comprehensive Income should be read in conjunction with the accompanying notes.
38 Australian Foundation Investment Company Limited Annual Report 2016
For
per
sona
l use
onl
y
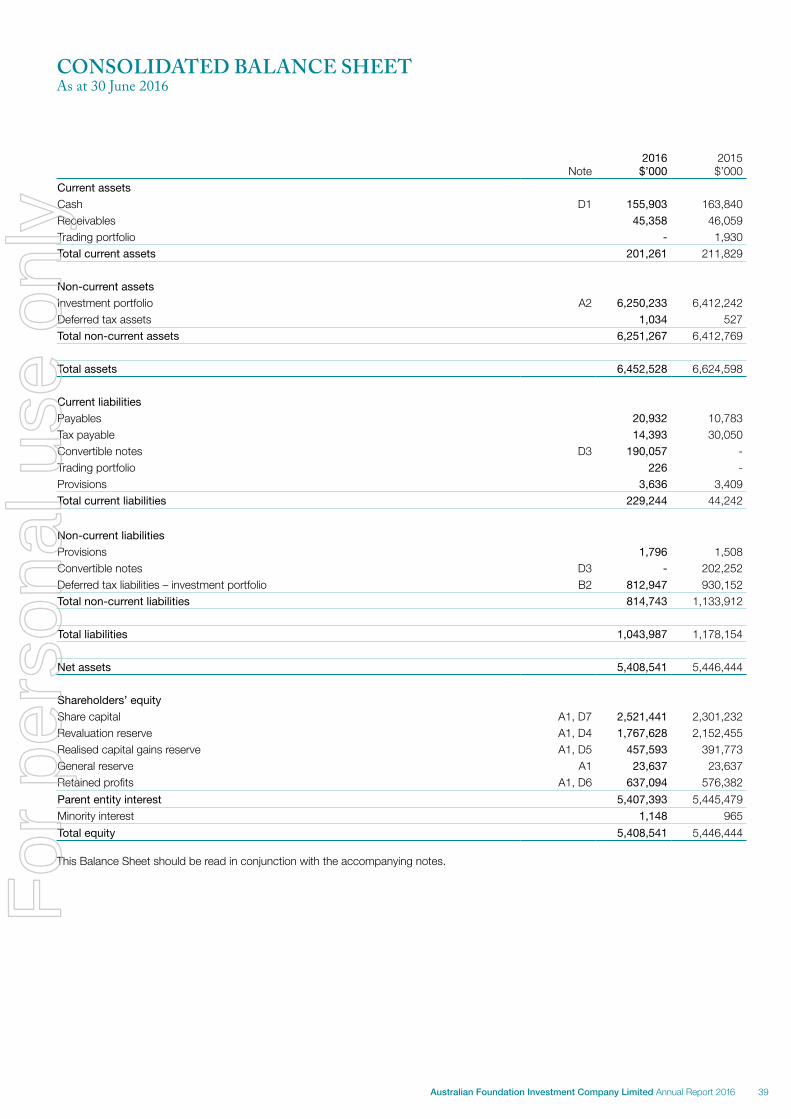
CONSOLIDATED BALANCE SHEETAs at 30 June 2016
Note2016
$’0002015$’000
Current assets
Cash D1 155,903 163,840Receivables 45,358 46,059Trading portfolio - 1,930Total current assets 201,261 211,829
Non-current assets
Investment portfolio A2 6,250,233 6,412,242Deferred tax assets 1,034 527Total non-current assets 6,251,267 6,412,769
Total assets 6,452,528 6,624,598
Current liabilities
Payables 20,932 10,783Tax payable 14,393 30,050Convertible notes D3 190,057 -Trading portfolio 226 -Provisions 3,636 3,409Total current liabilities 229,244 44,242
Non-current liabilities
Provisions 1,796 1,508Convertible notes D3 - 202,252Deferred tax liabilities – investment portfolio B2 812,947 930,152Total non-current liabilities 814,743 1,133,912
Total liabilities 1,043,987 1,178,154
Net assets 5,408,541 5,446,444
Shareholders’ equity
Share capital A1, D7 2,521,441 2,301,232Revaluation reserve A1, D4 1,767,628 2,152,455Realised capital gains reserve A1, D5 457,593 391,773General reserve A1 23,637 23,637Retained profits A1, D6 637,094 576,382
Parent entity interest 5,407,393 5,445,479Minority interest 1,148 965
Total equity 5,408,541 5,446,444
This Balance Sheet should be read in conjunction with the accompanying notes.
39Australian Foundation Investment Company Limited Annual Report 2016
For
per
sona
l use
onl
y
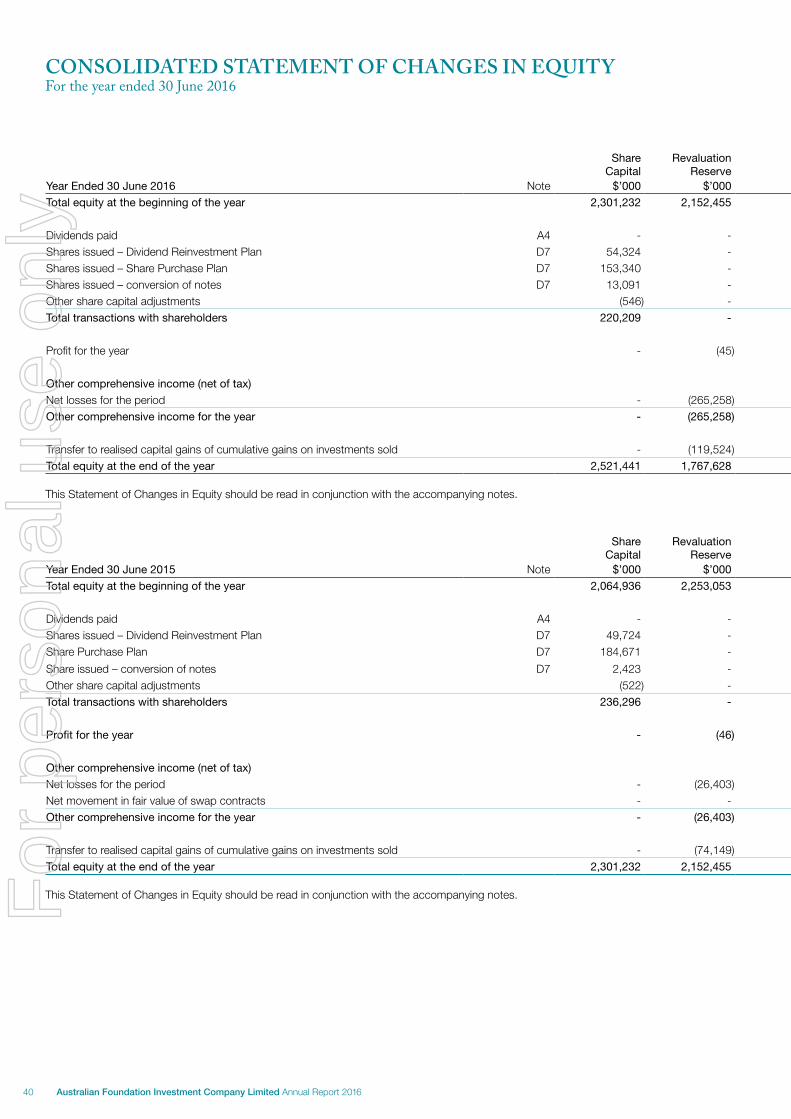
CONSOLIDATED STATEMENT OF CHANGES IN EQUITYFor the year ended 30 June 2016
Share Capital
Revaluation Reserve
Realised Capital Gains
General Reserve
Retained Profits
Total Parent Entity
Minority Interest Total
Year Ended 30 June 2016 Note $’000 $’000 $’000 $’000 $’000 $’000 $’000 $’000
Total equity at the beginning of the year 2,301,232 2,152,455 391,773 23,637 576,382 5,445,479 965 5,446,444
Dividends paid A4 - - (53,704) - (204,906) (258,610) - (258,610)Shares issued – Dividend Reinvestment Plan D7 54,324 - - - - 54,324 - 54,324Shares issued – Share Purchase Plan D7 153,340 - - - - 153,340 - 153,340Shares issued – conversion of notes D7 13,091 - - - - 13,091 - 13,091Other share capital adjustments (546) - - - - (546) - (546)Total transactions with shareholders 220,209 - (53,704) - (204,906) (38,401) - (38,401)
Profit for the year - (45) - - 265,618 265,573 183 265,756
Other comprehensive income (net of tax)
Net losses for the period - (265,258) - - - (265,258) - (265,258)Other comprehensive income for the year - (265,258) - - - (265,258) - (265,258)
Transfer to realised capital gains of cumulative gains on investments sold - (119,524) 119,524 - - - - -Total equity at the end of the year 2,521,441 1,767,628 457,593 23,637 637,094 5,407,393 1,148 5,408,541
This Statement of Changes in Equity should be read in conjunction with the accompanying notes.
Share Capital
Revaluation Reserve
Realised Capital Gains
General Reserve
Interest Rate Hedging
Retained Profits
Total Parent Entity
Minority Interest Total
Year Ended 30 June 2015 Note $’000 $’000 $’000 $’000 $’000 $’000 $’000 $’000 $’000
Total equity at the beginning of the year 2,064,936 2,253,053 317,624 23,637 (281) 524,319 5,183,288 864 5,184,152
Dividends paid A4 - - - - - (241,486) (241,486) - (241,486)Shares issued – Dividend Reinvestment Plan D7 49,724 - - - - - 49,724 - 49,724Share Purchase Plan D7 184,671 - - - - - 184,671 - 184,671
Share issued – conversion of notes D7 2,423 - - - - - 2,423 - 2,423Other share capital adjustments (522) - - - - - (522) - (522)Total transactions with shareholders 236,296 - - - - (241,486) (5,190) - (5,190)
Profit for the year - (46) - - - 293,549 293,503 101 293,604
Other comprehensive income (net of tax)
Net losses for the period - (26,403) - - - - (26,403) - (26,403)Net movement in fair value of swap contracts - - - - 281 - 281 - 281Other comprehensive income for the year - (26,403) - - 281 - (26,122) - (26,122)
Transfer to realised capital gains of cumulative gains on investments sold - (74,149) 74,149 - - - - - -Total equity at the end of the year 2,301,232 2,152,455 391,773 23,637 - 576,382 5,445,479 965 5,446,444
This Statement of Changes in Equity should be read in conjunction with the accompanying notes.
40 Australian Foundation Investment Company Limited Annual Report 2016
For
per
sona
l use
onl
y
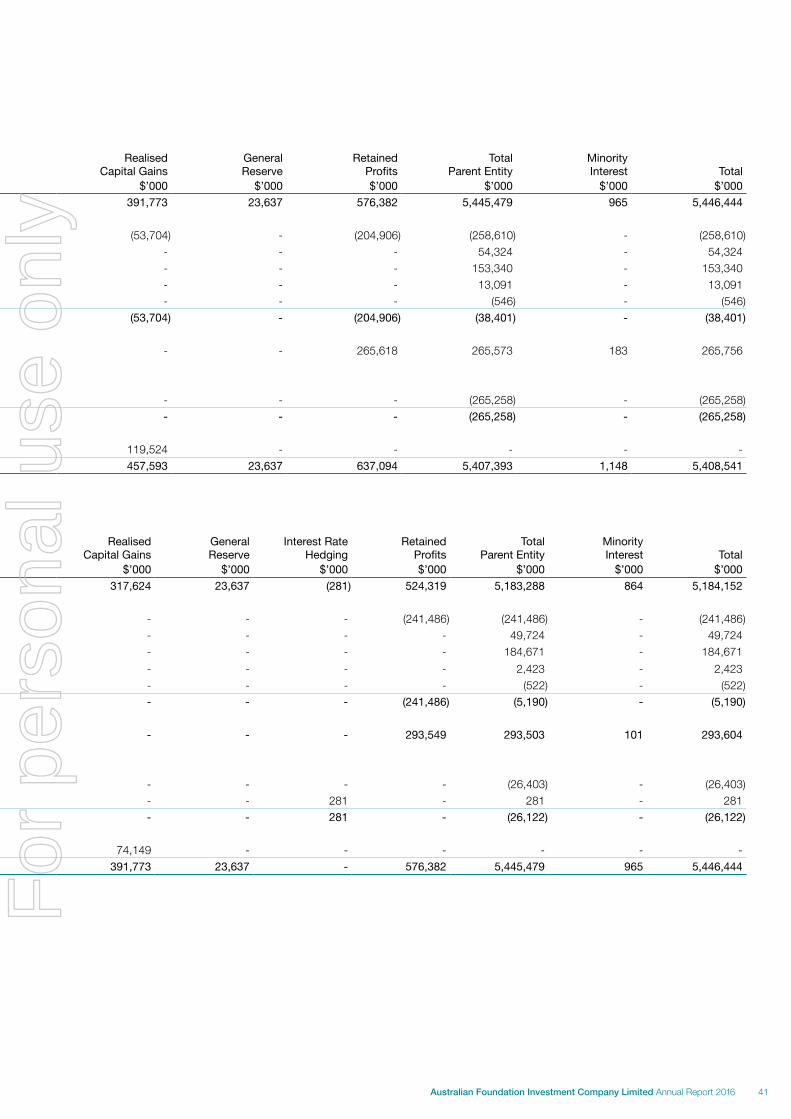
Share Capital
Revaluation Reserve
Realised Capital Gains
General Reserve
Retained Profits
Total Parent Entity
Minority Interest Total
Year Ended 30 June 2016 Note $’000 $’000 $’000 $’000 $’000 $’000 $’000 $’000
Total equity at the beginning of the year 2,301,232 2,152,455 391,773 23,637 576,382 5,445,479 965 5,446,444
Dividends paid A4 - - (53,704) - (204,906) (258,610) - (258,610)Shares issued – Dividend Reinvestment Plan D7 54,324 - - - - 54,324 - 54,324Shares issued – Share Purchase Plan D7 153,340 - - - - 153,340 - 153,340Shares issued – conversion of notes D7 13,091 - - - - 13,091 - 13,091Other share capital adjustments (546) - - - - (546) - (546)Total transactions with shareholders 220,209 - (53,704) - (204,906) (38,401) - (38,401)
Profit for the year - (45) - - 265,618 265,573 183 265,756
Other comprehensive income (net of tax)
Net losses for the period - (265,258) - - - (265,258) - (265,258)Other comprehensive income for the year - (265,258) - - - (265,258) - (265,258)
Transfer to realised capital gains of cumulative gains on investments sold - (119,524) 119,524 - - - - -Total equity at the end of the year 2,521,441 1,767,628 457,593 23,637 637,094 5,407,393 1,148 5,408,541
This Statement of Changes in Equity should be read in conjunction with the accompanying notes.
Share Capital
Revaluation Reserve
Realised Capital Gains
General Reserve
Interest Rate Hedging
Retained Profits
Total Parent Entity
Minority Interest Total
Year Ended 30 June 2015 Note $’000 $’000 $’000 $’000 $’000 $’000 $’000 $’000 $’000
Total equity at the beginning of the year 2,064,936 2,253,053 317,624 23,637 (281) 524,319 5,183,288 864 5,184,152
Dividends paid A4 - - - - - (241,486) (241,486) - (241,486)Shares issued – Dividend Reinvestment Plan D7 49,724 - - - - - 49,724 - 49,724Share Purchase Plan D7 184,671 - - - - - 184,671 - 184,671
Share issued – conversion of notes D7 2,423 - - - - - 2,423 - 2,423Other share capital adjustments (522) - - - - - (522) - (522)Total transactions with shareholders 236,296 - - - - (241,486) (5,190) - (5,190)
Profit for the year - (46) - - - 293,549 293,503 101 293,604
Other comprehensive income (net of tax)
Net losses for the period - (26,403) - - - - (26,403) - (26,403)Net movement in fair value of swap contracts - - - - 281 - 281 - 281Other comprehensive income for the year - (26,403) - - 281 - (26,122) - (26,122)
Transfer to realised capital gains of cumulative gains on investments sold - (74,149) 74,149 - - - - - -Total equity at the end of the year 2,301,232 2,152,455 391,773 23,637 - 576,382 5,445,479 965 5,446,444
This Statement of Changes in Equity should be read in conjunction with the accompanying notes.
41Australian Foundation Investment Company Limited Annual Report 2016
For
per
sona
l use
onl
y
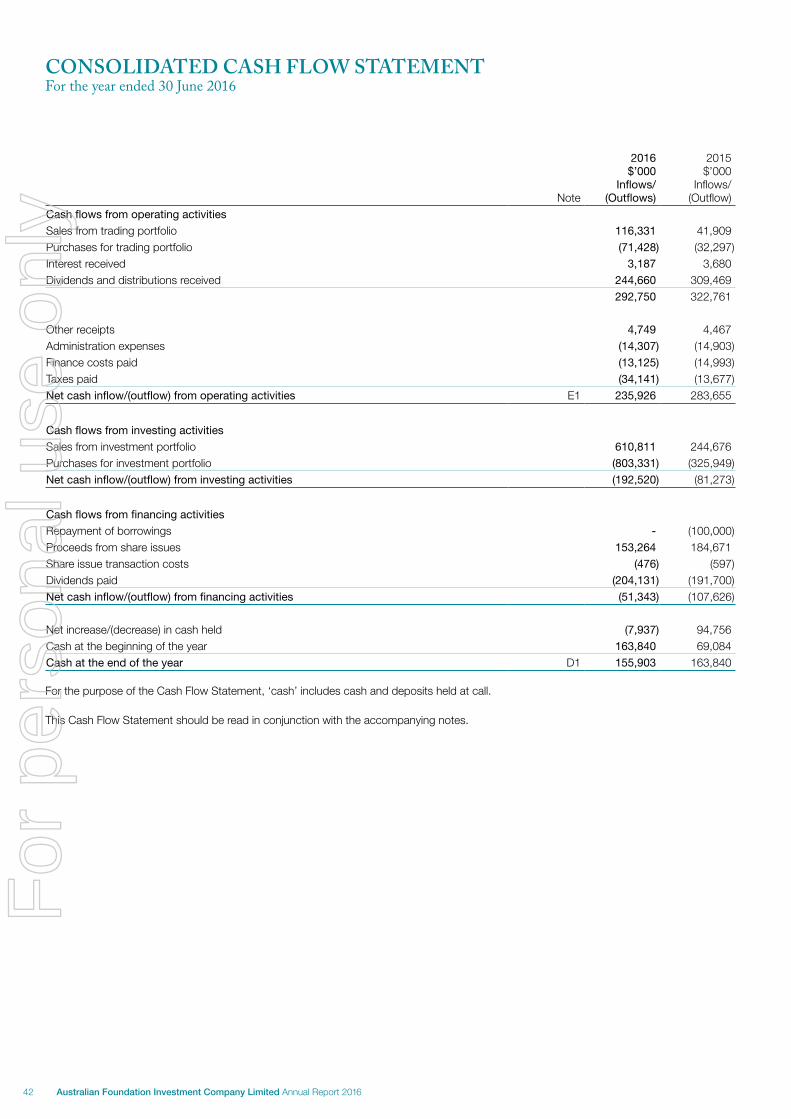
CONSOLIDATED CASH FLOW STATEMENTFor the year ended 30 June 2016
Note
2016$’000
Inflows/(Outflows)
2015$’000
Inflows/(Outflow)
Cash flows from operating activities
Sales from trading portfolio 116,331 41,909Purchases for trading portfolio (71,428) (32,297)Interest received 3,187 3,680Dividends and distributions received 244,660 309,469
292,750 322,761
Other receipts 4,749 4,467Administration expenses (14,307) (14,903)Finance costs paid (13,125) (14,993)Taxes paid (34,141) (13,677)Net cash inflow/(outflow) from operating activities E1 235,926 283,655
Cash flows from investing activities
Sales from investment portfolio 610,811 244,676Purchases for investment portfolio (803,331) (325,949)Net cash inflow/(outflow) from investing activities (192,520) (81,273)
Cash flows from financing activities
Repayment of borrowings - (100,000)Proceeds from share issues 153,264 184,671Share issue transaction costs (476) (597)Dividends paid (204,131) (191,700)Net cash inflow/(outflow) from financing activities (51,343) (107,626)
Net increase/(decrease) in cash held (7,937) 94,756Cash at the beginning of the year 163,840 69,084Cash at the end of the year D1 155,903 163,840
For the purpose of the Cash Flow Statement, ‘cash’ includes cash and deposits held at call.
This Cash Flow Statement should be read in conjunction with the accompanying notes.
42 Australian Foundation Investment Company Limited Annual Report 2016
For
per
sona
l use
onl
y
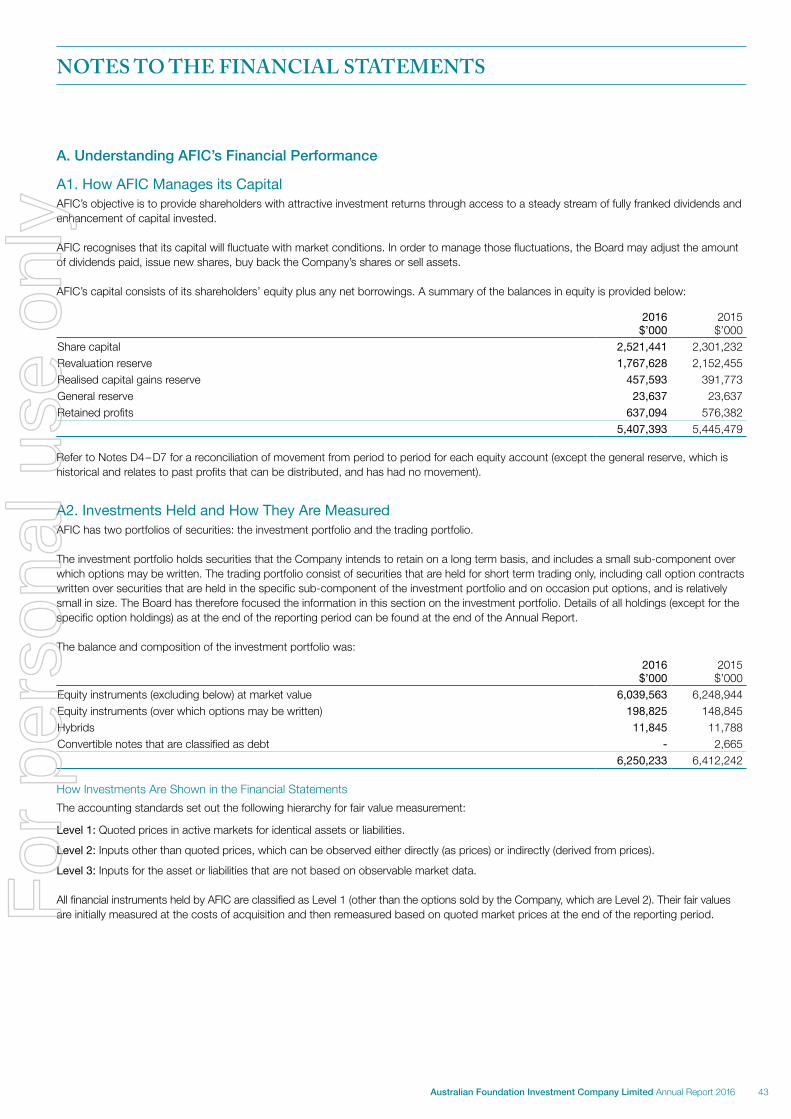
NOTES TO THE FINANCIAL STATEMENTS
A. Understanding AFIC’s Financial Performance
A1. How AFIC Manages its CapitalAFIC’s objective is to provide shareholders with attractive investment returns through access to a steady stream of fully franked dividends and enhancement of capital invested.
AFIC recognises that its capital will fluctuate with market conditions. In order to manage those fluctuations, the Board may adjust the amount of dividends paid, issue new shares, buy back the Company’s shares or sell assets.
AFIC’s capital consists of its shareholders’ equity plus any net borrowings. A summary of the balances in equity is provided below:
2016 $’000
2015 $’000
Share capital 2,521,441 2,301,232Revaluation reserve 1,767,628 2,152,455Realised capital gains reserve 457,593 391,773General reserve 23,637 23,637Retained profits 637,094 576,382
5,407,393 5,445,479
Refer to Notes D4–D7 for a reconciliation of movement from period to period for each equity account (except the general reserve, which is historical and relates to past profits that can be distributed, and has had no movement).
A2. Investments Held and How They Are MeasuredAFIC has two portfolios of securities: the investment portfolio and the trading portfolio.
The investment portfolio holds securities that the Company intends to retain on a long term basis, and includes a small sub-component over which options may be written. The trading portfolio consist of securities that are held for short term trading only, including call option contracts written over securities that are held in the specific sub-component of the investment portfolio and on occasion put options, and is relatively small in size. The Board has therefore focused the information in this section on the investment portfolio. Details of all holdings (except for the specific option holdings) as at the end of the reporting period can be found at the end of the Annual Report.
The balance and composition of the investment portfolio was:
2016 $’000
2015 $’000
Equity instruments (excluding below) at market value 6,039,563 6,248,944Equity instruments (over which options may be written) 198,825 148,845Hybrids 11,845 11,788Convertible notes that are classified as debt - 2,665
6,250,233 6,412,242
How Investments Are Shown in the Financial Statements
The accounting standards set out the following hierarchy for fair value measurement:
Level 1: Quoted prices in active markets for identical assets or liabilities.
Level 2: Inputs other than quoted prices, which can be observed either directly (as prices) or indirectly (derived from prices).
Level 3: Inputs for the asset or liabilities that are not based on observable market data.
All financial instruments held by AFIC are classified as Level 1 (other than the options sold by the Company, which are Level 2). Their fair values are initially measured at the costs of acquisition and then remeasured based on quoted market prices at the end of the reporting period.
43Australian Foundation Investment Company Limited Annual Report 2016
For
per
sona
l use
onl
y
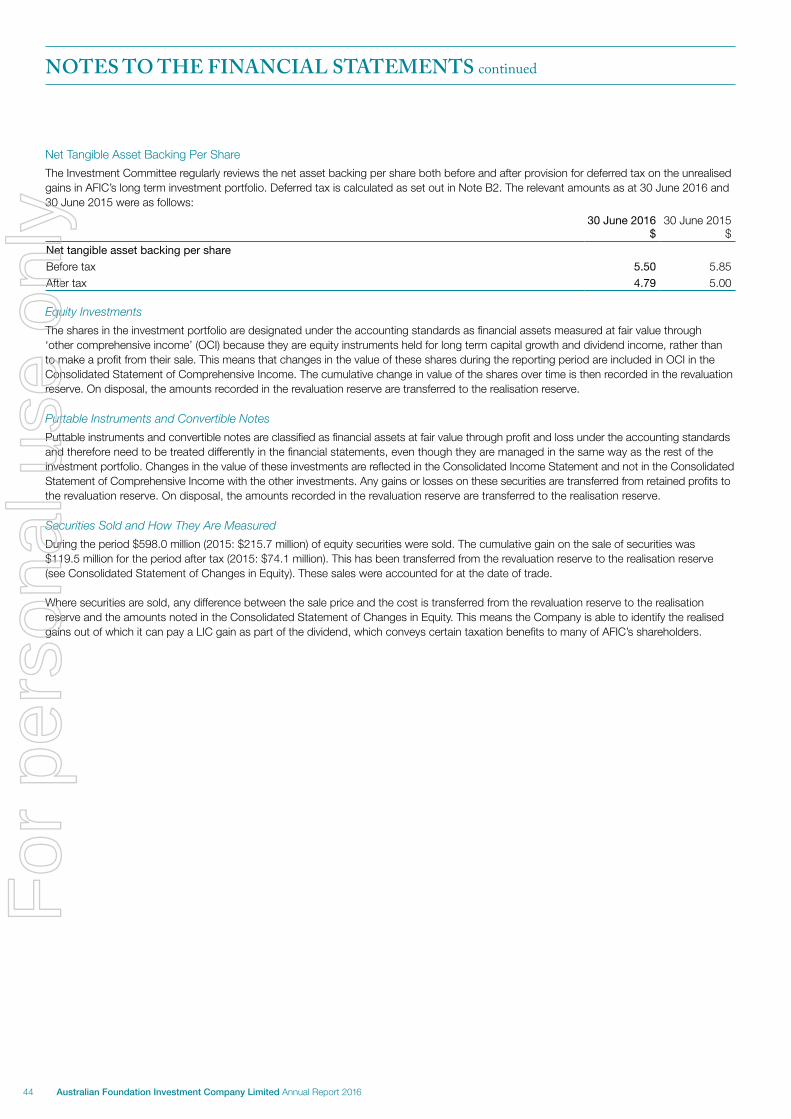
Net Tangible Asset Backing Per Share
The Investment Committee regularly reviews the net asset backing per share both before and after provision for deferred tax on the unrealised gains in AFIC’s long term investment portfolio. Deferred tax is calculated as set out in Note B2. The relevant amounts as at 30 June 2016 and 30 June 2015 were as follows:
30 June 2016 $
30 June 2015 $
Net tangible asset backing per share
Before tax 5.50 5.85After tax 4.79 5.00
Equity Investments
The shares in the investment portfolio are designated under the accounting standards as financial assets measured at fair value through ‘other comprehensive income’ (OCI) because they are equity instruments held for long term capital growth and dividend income, rather than to make a profit from their sale. This means that changes in the value of these shares during the reporting period are included in OCI in the Consolidated Statement of Comprehensive Income. The cumulative change in value of the shares over time is then recorded in the revaluation reserve. On disposal, the amounts recorded in the revaluation reserve are transferred to the realisation reserve.
Puttable Instruments and Convertible Notes
Puttable instruments and convertible notes are classified as financial assets at fair value through profit and loss under the accounting standards and therefore need to be treated differently in the financial statements, even though they are managed in the same way as the rest of the investment portfolio. Changes in the value of these investments are reflected in the Consolidated Income Statement and not in the Consolidated Statement of Comprehensive Income with the other investments. Any gains or losses on these securities are transferred from retained profits to the revaluation reserve. On disposal, the amounts recorded in the revaluation reserve are transferred to the realisation reserve.
Securities Sold and How They Are Measured
During the period $598.0 million (2015: $215.7 million) of equity securities were sold. The cumulative gain on the sale of securities was $119.5 million for the period after tax (2015: $74.1 million). This has been transferred from the revaluation reserve to the realisation reserve (see Consolidated Statement of Changes in Equity). These sales were accounted for at the date of trade.
Where securities are sold, any difference between the sale price and the cost is transferred from the revaluation reserve to the realisation reserve and the amounts noted in the Consolidated Statement of Changes in Equity. This means the Company is able to identify the realised gains out of which it can pay a LIC gain as part of the dividend, which conveys certain taxation benefits to many of AFIC’s shareholders.
NOTES TO THE FINANCIAL STATEMENTS continued
44 Australian Foundation Investment Company Limited Annual Report 2016
For
per
sona
l use
onl
y
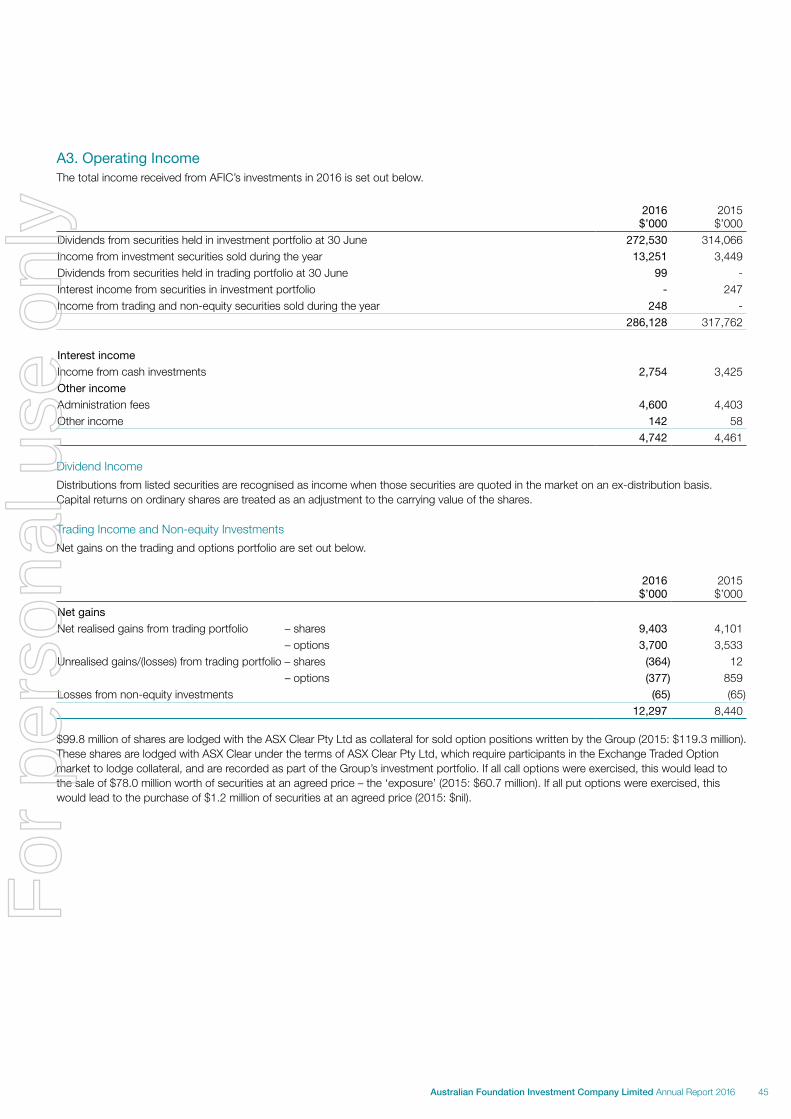
A3. Operating IncomeThe total income received from AFIC’s investments in 2016 is set out below.
2016 $’000
2015 $’000
Dividends from securities held in investment portfolio at 30 June 272,530 314,066Income from investment securities sold during the year 13,251 3,449Dividends from securities held in trading portfolio at 30 June 99 -Interest income from securities in investment portfolio - 247Income from trading and non-equity securities sold during the year 248 -
286,128 317,762
Interest income
Income from cash investments 2,754 3,425Other income
Administration fees 4,600 4,403Other income 142 58
4,742 4,461
Dividend Income
Distributions from listed securities are recognised as income when those securities are quoted in the market on an ex-distribution basis. Capital returns on ordinary shares are treated as an adjustment to the carrying value of the shares.
Trading Income and Non-equity Investments
Net gains on the trading and options portfolio are set out below.
2016 $’000
2015 $’000
Net gains
Net realised gains from trading portfolio – shares 9,403 4,101 – options 3,700 3,533Unrealised gains/(losses) from trading portfolio – shares (364) 12 – options (377) 859Losses from non-equity investments (65) (65)
12,297 8,440
$99.8 million of shares are lodged with the ASX Clear Pty Ltd as collateral for sold option positions written by the Group (2015: $119.3 million). These shares are lodged with ASX Clear under the terms of ASX Clear Pty Ltd, which require participants in the Exchange Traded Option market to lodge collateral, and are recorded as part of the Group’s investment portfolio. If all call options were exercised, this would lead to the sale of $78.0 million worth of securities at an agreed price – the ‘exposure’ (2015: $60.7 million). If all put options were exercised, this would lead to the purchase of $1.2 million of securities at an agreed price (2015: $nil).
45Australian Foundation Investment Company Limited Annual Report 2016
For
per
sona
l use
onl
y
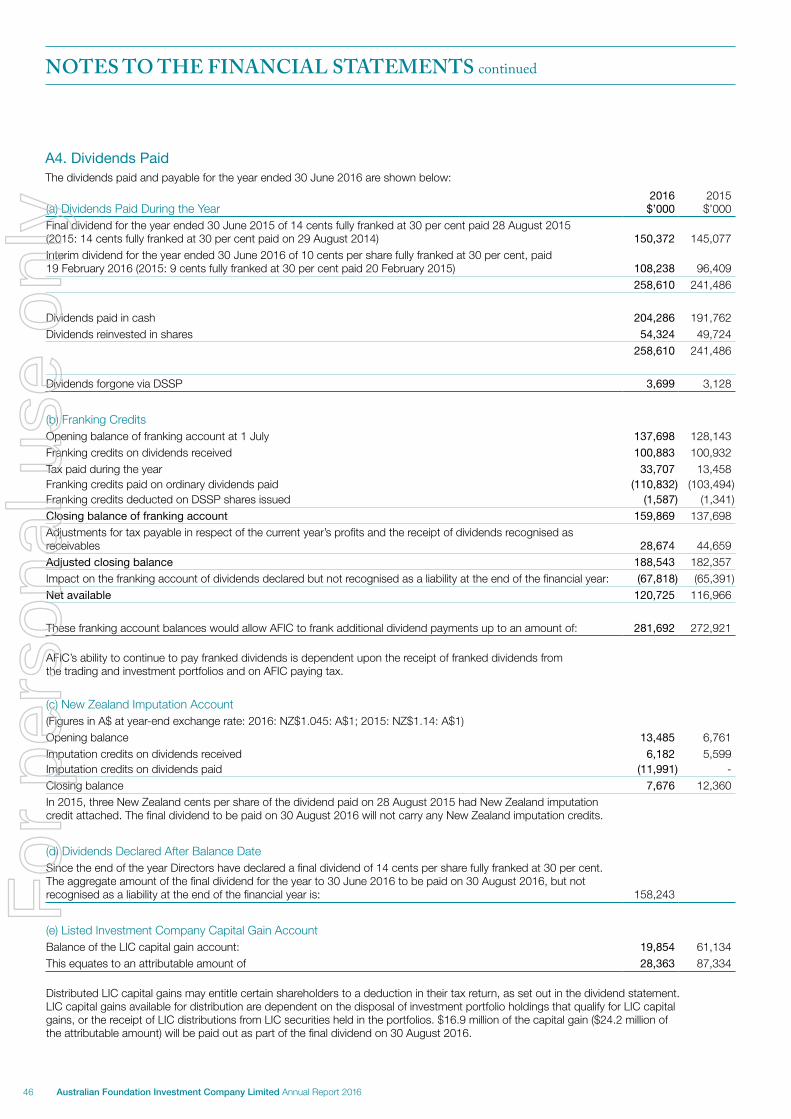
A4. Dividends PaidThe dividends paid and payable for the year ended 30 June 2016 are shown below:
(a) Dividends Paid During the Year2016
$’0002015 $’000
Final dividend for the year ended 30 June 2015 of 14 cents fully franked at 30 per cent paid 28 August 2015 (2015: 14 cents fully franked at 30 per cent paid on 29 August 2014) 150,372 145,077Interim dividend for the year ended 30 June 2016 of 10 cents per share fully franked at 30 per cent, paid 19 February 2016 (2015: 9 cents fully franked at 30 per cent paid 20 February 2015) 108,238 96,409
258,610 241,486
Dividends paid in cash 204,286 191,762Dividends reinvested in shares 54,324 49,724
258,610 241,486
Dividends forgone via DSSP 3,699 3,128
(b) Franking CreditsOpening balance of franking account at 1 July 137,698 128,143Franking credits on dividends received 100,883 100,932Tax paid during the year 33,707 13,458Franking credits paid on ordinary dividends paid (110,832) (103,494)Franking credits deducted on DSSP shares issued (1,587) (1,341)Closing balance of franking account 159,869 137,698Adjustments for tax payable in respect of the current year’s profits and the receipt of dividends recognised as receivables 28,674 44,659Adjusted closing balance 188,543 182,357Impact on the franking account of dividends declared but not recognised as a liability at the end of the financial year: (67,818) (65,391)Net available 120,725 116,966
These franking account balances would allow AFIC to frank additional dividend payments up to an amount of: 281,692 272,921
AFIC’s ability to continue to pay franked dividends is dependent upon the receipt of franked dividends from the trading and investment portfolios and on AFIC paying tax.
(c) New Zealand Imputation Account(Figures in A$ at year-end exchange rate: 2016: NZ$1.045: A$1; 2015: NZ$1.14: A$1)Opening balance 13,485 6,761Imputation credits on dividends received 6,182 5,599Imputation credits on dividends paid (11,991) -Closing balance 7,676 12,360In 2015, three New Zealand cents per share of the dividend paid on 28 August 2015 had New Zealand imputation credit attached. The final dividend to be paid on 30 August 2016 will not carry any New Zealand imputation credits.
(d) Dividends Declared After Balance DateSince the end of the year Directors have declared a final dividend of 14 cents per share fully franked at 30 per cent. The aggregate amount of the final dividend for the year to 30 June 2016 to be paid on 30 August 2016, but not recognised as a liability at the end of the financial year is: 158,243
(e) Listed Investment Company Capital Gain AccountBalance of the LIC capital gain account: 19,854 61,134This equates to an attributable amount of 28,363 87,334
Distributed LIC capital gains may entitle certain shareholders to a deduction in their tax return, as set out in the dividend statement. LIC capital gains available for distribution are dependent on the disposal of investment portfolio holdings that qualify for LIC capital gains, or the receipt of LIC distributions from LIC securities held in the portfolios. $16.9 million of the capital gain ($24.2 million of the attributable amount) will be paid out as part of the final dividend on 30 August 2016.
NOTES TO THE FINANCIAL STATEMENTS continued
46 Australian Foundation Investment Company Limited Annual Report 2016
For
per
sona
l use
onl
y
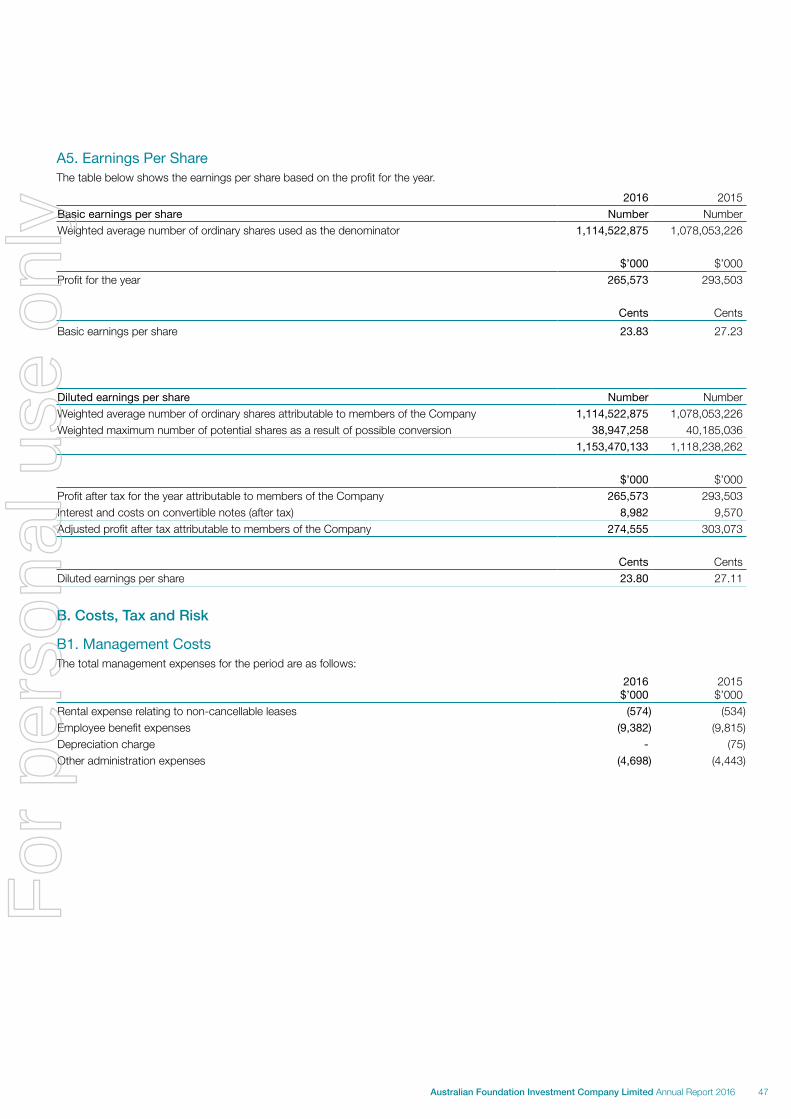
A5. Earnings Per ShareThe table below shows the earnings per share based on the profit for the year.
2016 2015Basic earnings per share Number NumberWeighted average number of ordinary shares used as the denominator 1,114,522,875 1,078,053,226
$’000 $’000Profit for the year 265,573 293,503
Cents Cents
Basic earnings per share 23.83 27.23
Diluted earnings per share Number NumberWeighted average number of ordinary shares attributable to members of the Company 1,114,522,875 1,078,053,226Weighted maximum number of potential shares as a result of possible conversion 38,947,258 40,185,036
1,153,470,133 1,118,238,262
$’000 $’000Profit after tax for the year attributable to members of the Company 265,573 293,503Interest and costs on convertible notes (after tax) 8,982 9,570Adjusted profit after tax attributable to members of the Company 274,555 303,073
Cents CentsDiluted earnings per share 23.80 27.11
B. Costs, Tax and Risk
B1. Management CostsThe total management expenses for the period are as follows:
2016 $’000
2015 $’000
Rental expense relating to non-cancellable leases (574) (534)Employee benefit expenses (9,382) (9,815)Depreciation charge - (75)Other administration expenses (4,698) (4,443)
47Australian Foundation Investment Company Limited Annual Report 2016
For
per
sona
l use
onl
y
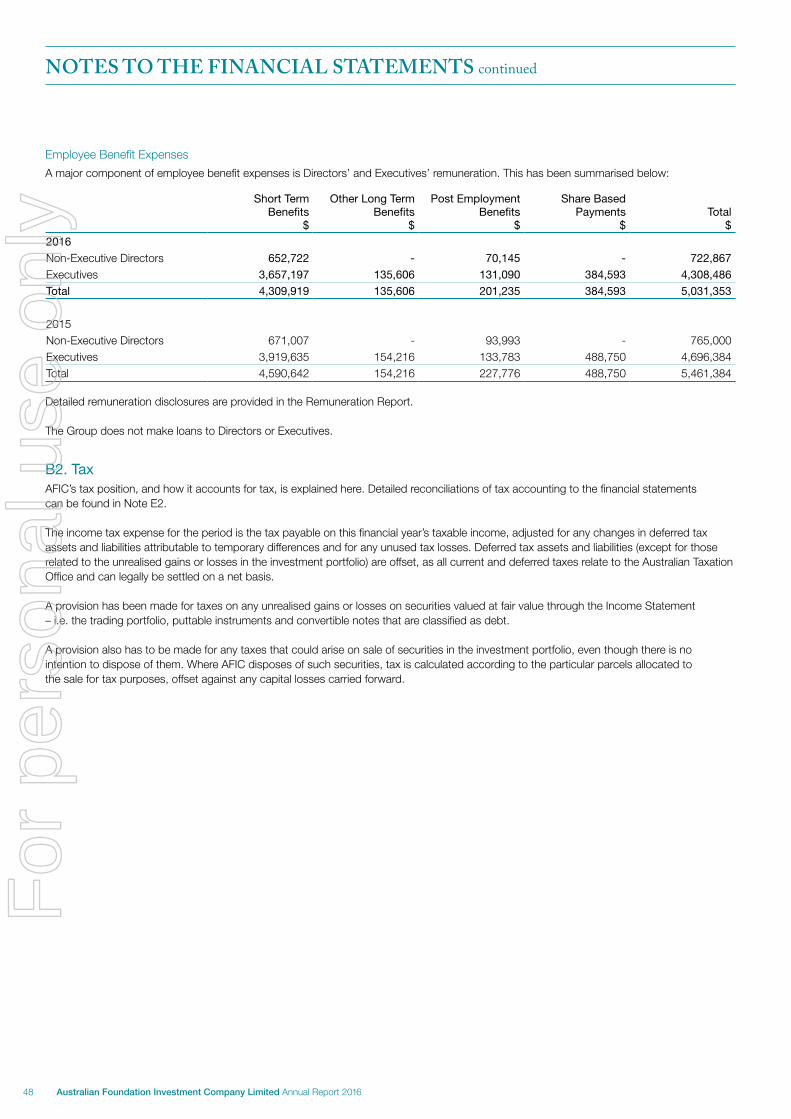
Employee Benefit Expenses
A major component of employee benefit expenses is Directors’ and Executives’ remuneration. This has been summarised below:
Short Term Benefits
$
Other Long Term Benefits
$
Post Employment Benefits
$
Share Based Payments
$Total
$
2016
Non-Executive Directors 652,722 - 70,145 - 722,867
Executives 3,657,197 135,606 131,090 384,593 4,308,486
Total 4,309,919 135,606 201,235 384,593 5,031,353
2015Non-Executive Directors 671,007 - 93,993 - 765,000Executives 3,919,635 154,216 133,783 488,750 4,696,384Total 4,590,642 154,216 227,776 488,750 5,461,384
Detailed remuneration disclosures are provided in the Remuneration Report.
The Group does not make loans to Directors or Executives.
B2. TaxAFIC’s tax position, and how it accounts for tax, is explained here. Detailed reconciliations of tax accounting to the financial statements can be found in Note E2.
The income tax expense for the period is the tax payable on this financial year’s taxable income, adjusted for any changes in deferred tax assets and liabilities attributable to temporary differences and for any unused tax losses. Deferred tax assets and liabilities (except for those related to the unrealised gains or losses in the investment portfolio) are offset, as all current and deferred taxes relate to the Australian Taxation Office and can legally be settled on a net basis.
A provision has been made for taxes on any unrealised gains or losses on securities valued at fair value through the Income Statement – i.e. the trading portfolio, puttable instruments and convertible notes that are classified as debt.
A provision also has to be made for any taxes that could arise on sale of securities in the investment portfolio, even though there is no intention to dispose of them. Where AFIC disposes of such securities, tax is calculated according to the particular parcels allocated to the sale for tax purposes, offset against any capital losses carried forward.
NOTES TO THE FINANCIAL STATEMENTS continued
48 Australian Foundation Investment Company Limited Annual Report 2016
For
per
sona
l use
onl
y
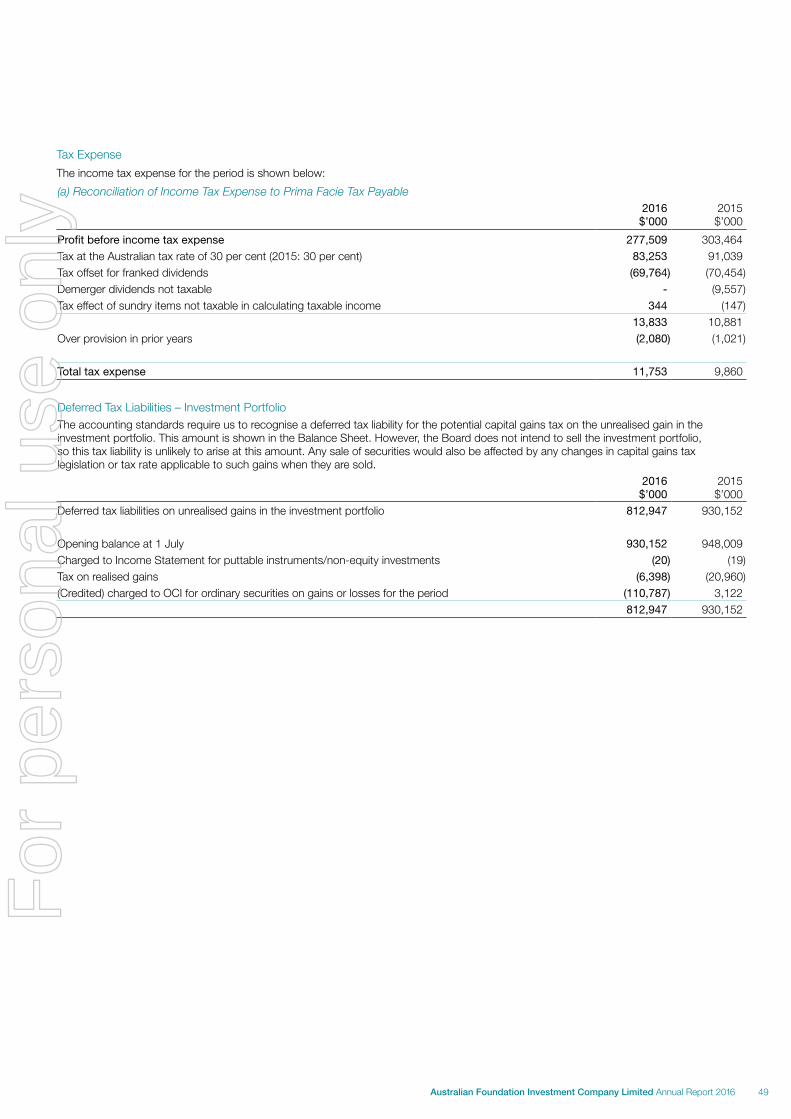
Tax Expense
The income tax expense for the period is shown below:
(a) Reconciliation of Income Tax Expense to Prima Facie Tax Payable2016
$’0002015 $’000
Profit before income tax expense 277,509 303,464Tax at the Australian tax rate of 30 per cent (2015: 30 per cent) 83,253 91,039Tax offset for franked dividends (69,764) (70,454)Demerger dividends not taxable - (9,557)Tax effect of sundry items not taxable in calculating taxable income 344 (147)
13,833 10,881Over provision in prior years (2,080) (1,021)
Total tax expense 11,753 9,860
Deferred Tax Liabilities – Investment PortfolioThe accounting standards require us to recognise a deferred tax liability for the potential capital gains tax on the unrealised gain in the investment portfolio. This amount is shown in the Balance Sheet. However, the Board does not intend to sell the investment portfolio, so this tax liability is unlikely to arise at this amount. Any sale of securities would also be affected by any changes in capital gains tax legislation or tax rate applicable to such gains when they are sold.
2016 $’000
2015 $’000
Deferred tax liabilities on unrealised gains in the investment portfolio 812,947 930,152
Opening balance at 1 July 930,152 948,009Charged to Income Statement for puttable instruments/non-equity investments (20) (19)Tax on realised gains (6,398) (20,960)(Credited) charged to OCI for ordinary securities on gains or losses for the period (110,787) 3,122
812,947 930,152
49Australian Foundation Investment Company Limited Annual Report 2016
For
per
sona
l use
onl
y
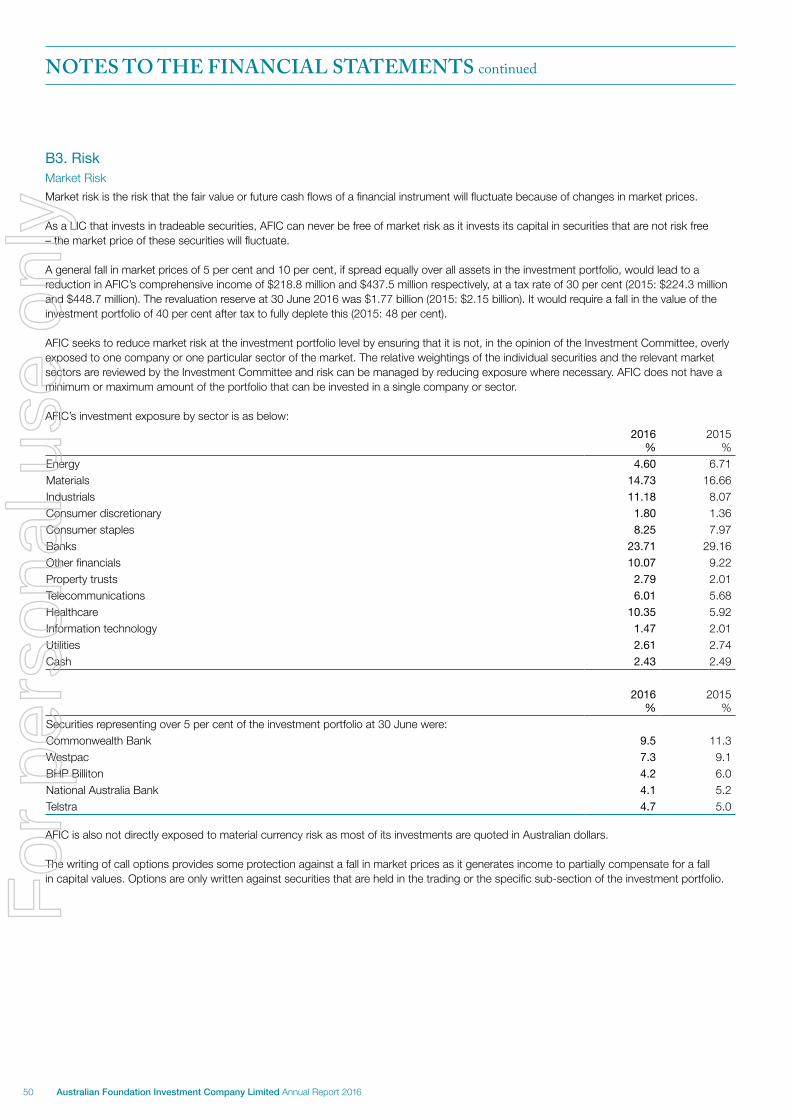
B3. RiskMarket Risk
Market risk is the risk that the fair value or future cash flows of a financial instrument will fluctuate because of changes in market prices.
As a LIC that invests in tradeable securities, AFIC can never be free of market risk as it invests its capital in securities that are not risk free – the market price of these securities will fluctuate.
A general fall in market prices of 5 per cent and 10 per cent, if spread equally over all assets in the investment portfolio, would lead to a reduction in AFIC’s comprehensive income of $218.8 million and $437.5 million respectively, at a tax rate of 30 per cent (2015: $224.3 million and $448.7 million). The revaluation reserve at 30 June 2016 was $1.77 billion (2015: $2.15 billion). It would require a fall in the value of the investment portfolio of 40 per cent after tax to fully deplete this (2015: 48 per cent).
AFIC seeks to reduce market risk at the investment portfolio level by ensuring that it is not, in the opinion of the Investment Committee, overly exposed to one company or one particular sector of the market. The relative weightings of the individual securities and the relevant market sectors are reviewed by the Investment Committee and risk can be managed by reducing exposure where necessary. AFIC does not have a minimum or maximum amount of the portfolio that can be invested in a single company or sector.
AFIC’s investment exposure by sector is as below:
2016%
2015%
Energy 4.60 6.71Materials 14.73 16.66Industrials 11.18 8.07Consumer discretionary 1.80 1.36Consumer staples 8.25 7.97Banks 23.71 29.16Other financials 10.07 9.22Property trusts 2.79 2.01Telecommunications 6.01 5.68Healthcare 10.35 5.92Information technology 1.47 2.01Utilities 2.61 2.74Cash 2.43 2.49
2016%
2015%
Securities representing over 5 per cent of the investment portfolio at 30 June were:Commonwealth Bank 9.5 11.3Westpac 7.3 9.1BHP Billiton 4.2 6.0National Australia Bank 4.1 5.2Telstra 4.7 5.0
AFIC is also not directly exposed to material currency risk as most of its investments are quoted in Australian dollars.
The writing of call options provides some protection against a fall in market prices as it generates income to partially compensate for a fall in capital values. Options are only written against securities that are held in the trading or the specific sub-section of the investment portfolio.
NOTES TO THE FINANCIAL STATEMENTS continued
50 Australian Foundation Investment Company Limited Annual Report 2016
For
per
sona
l use
onl
y
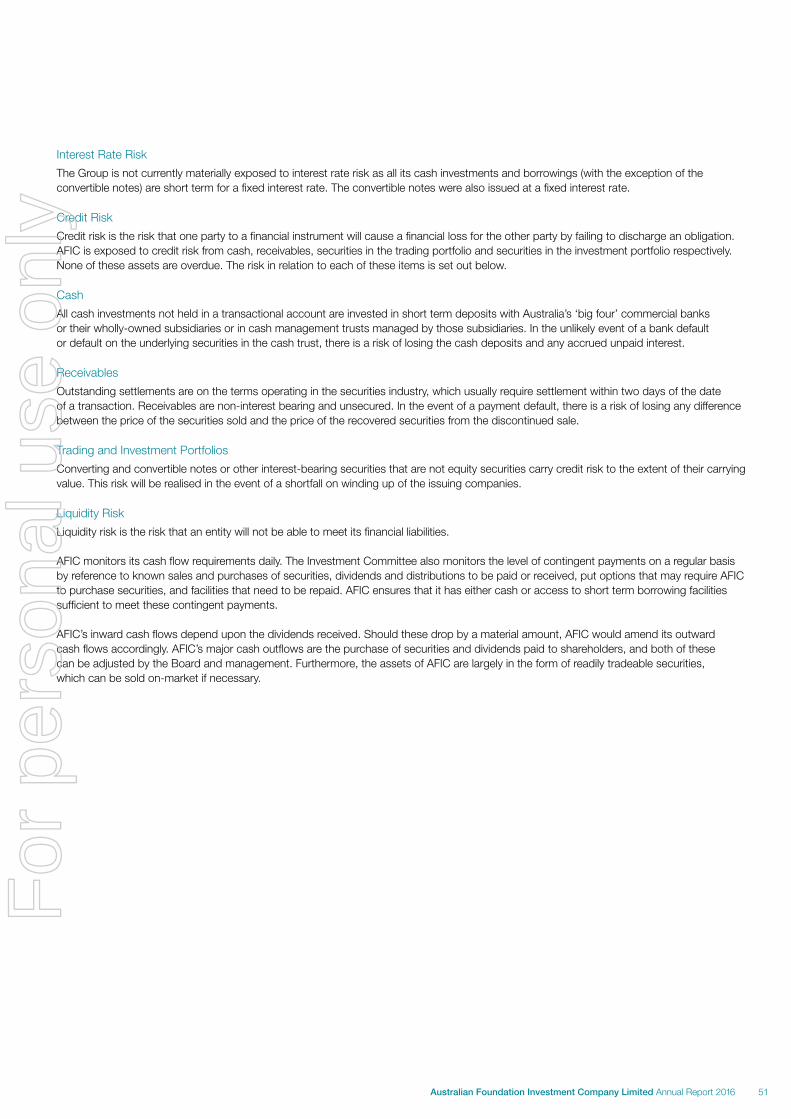
Interest Rate Risk
The Group is not currently materially exposed to interest rate risk as all its cash investments and borrowings (with the exception of the convertible notes) are short term for a fixed interest rate. The convertible notes were also issued at a fixed interest rate.
Credit Risk
Credit risk is the risk that one party to a financial instrument will cause a financial loss for the other party by failing to discharge an obligation. AFIC is exposed to credit risk from cash, receivables, securities in the trading portfolio and securities in the investment portfolio respectively. None of these assets are overdue. The risk in relation to each of these items is set out below.
Cash
All cash investments not held in a transactional account are invested in short term deposits with Australia’s ‘big four’ commercial banks or their wholly-owned subsidiaries or in cash management trusts managed by those subsidiaries. In the unlikely event of a bank default or default on the underlying securities in the cash trust, there is a risk of losing the cash deposits and any accrued unpaid interest.
Receivables
Outstanding settlements are on the terms operating in the securities industry, which usually require settlement within two days of the date of a transaction. Receivables are non-interest bearing and unsecured. In the event of a payment default, there is a risk of losing any difference between the price of the securities sold and the price of the recovered securities from the discontinued sale.
Trading and Investment Portfolios
Converting and convertible notes or other interest-bearing securities that are not equity securities carry credit risk to the extent of their carrying value. This risk will be realised in the event of a shortfall on winding up of the issuing companies.
Liquidity Risk
Liquidity risk is the risk that an entity will not be able to meet its financial liabilities.
AFIC monitors its cash flow requirements daily. The Investment Committee also monitors the level of contingent payments on a regular basis by reference to known sales and purchases of securities, dividends and distributions to be paid or received, put options that may require AFIC to purchase securities, and facilities that need to be repaid. AFIC ensures that it has either cash or access to short term borrowing facilities sufficient to meet these contingent payments.
AFIC’s inward cash flows depend upon the dividends received. Should these drop by a material amount, AFIC would amend its outward cash flows accordingly. AFIC’s major cash outflows are the purchase of securities and dividends paid to shareholders, and both of these can be adjusted by the Board and management. Furthermore, the assets of AFIC are largely in the form of readily tradeable securities, which can be sold on-market if necessary.
51Australian Foundation Investment Company Limited Annual Report 2016
For
per
sona
l use
onl
y
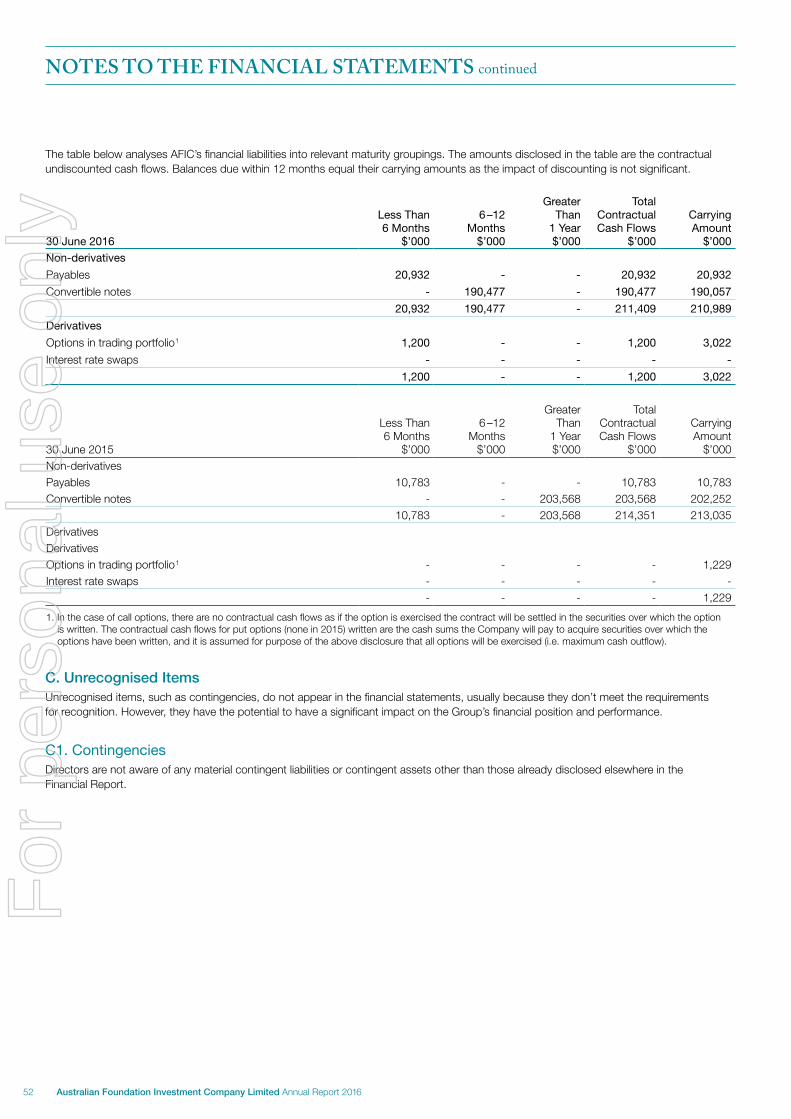
The table below analyses AFIC’s financial liabilities into relevant maturity groupings. The amounts disclosed in the table are the contractual undiscounted cash flows. Balances due within 12 months equal their carrying amounts as the impact of discounting is not significant.
30 June 2016
Less Than 6 Months
$’000
6 –12 Months
$’000
Greater Than
1 Year $’000
Total Contractual Cash Flows
$’000
Carrying Amount
$’000
Non-derivatives
Payables 20,932 - - 20,932 20,932
Convertible notes - 190,477 - 190,477 190,057
20,932 190,477 - 211,409 210,989
Derivatives
Options in trading portfolio1 1,200 - - 1,200 3,022
Interest rate swaps - - - - -
1,200 - - 1,200 3,022
30 June 2015
Less Than 6 Months
$’000
6 –12 Months
$’000
Greater Than
1 Year $’000
Total Contractual Cash Flows
$’000
Carrying Amount
$’000Non-derivativesPayables 10,783 - - 10,783 10,783Convertible notes - - 203,568 203,568 202,252
10,783 - 203,568 214,351 213,035DerivativesDerivativesOptions in trading portfolio1 - - - - 1,229Interest rate swaps - - - - -
- - - - 1,229
1. In the case of call options, there are no contractual cash flows as if the option is exercised the contract will be settled in the securities over which the option is written. The contractual cash flows for put options (none in 2015) written are the cash sums the Company will pay to acquire securities over which the options have been written, and it is assumed for purpose of the above disclosure that all options will be exercised (i.e. maximum cash outflow).
C. Unrecognised ItemsUnrecognised items, such as contingencies, do not appear in the financial statements, usually because they don’t meet the requirements for recognition. However, they have the potential to have a significant impact on the Group’s financial position and performance.
C1. ContingenciesDirectors are not aware of any material contingent liabilities or contingent assets other than those already disclosed elsewhere in the Financial Report.
NOTES TO THE FINANCIAL STATEMENTS continued
52 Australian Foundation Investment Company Limited Annual Report 2016
For
per
sona
l use
onl
y
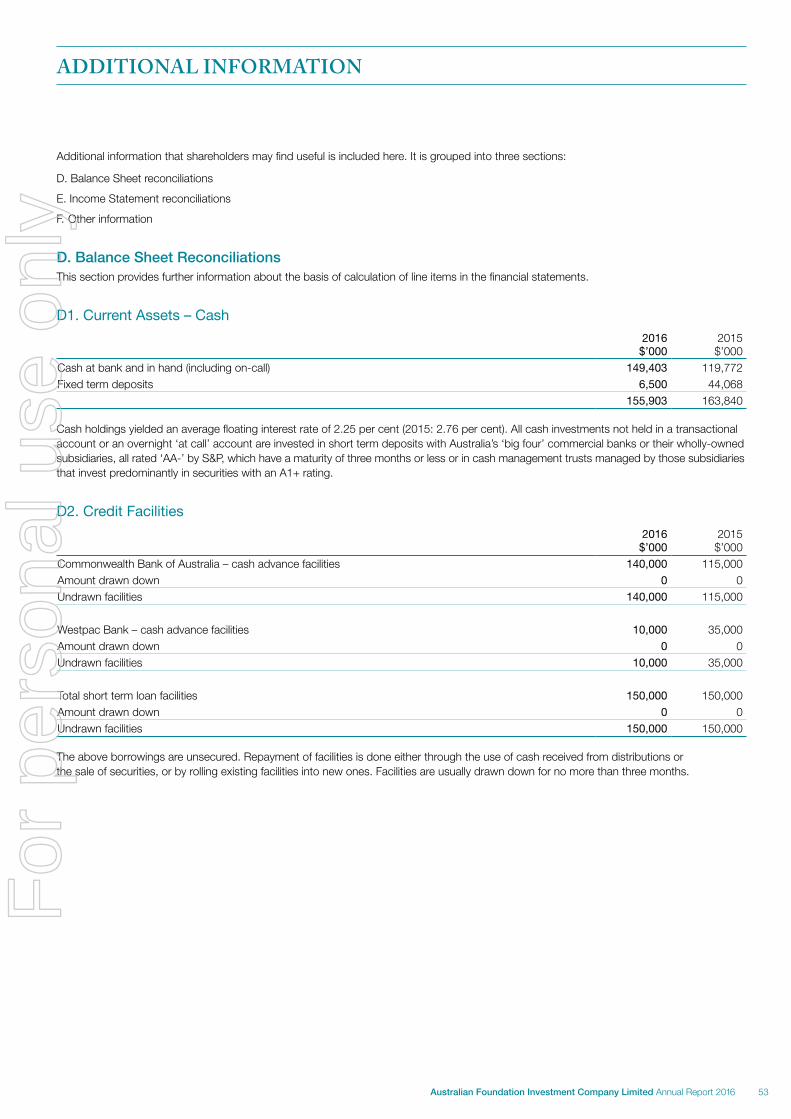
Additional information that shareholders may find useful is included here. It is grouped into three sections:
D. Balance Sheet reconciliations
E. Income Statement reconciliations
F. Other information
D. Balance Sheet ReconciliationsThis section provides further information about the basis of calculation of line items in the financial statements.
D1. Current Assets – Cash2016
$’0002015 $’000
Cash at bank and in hand (including on-call) 149,403 119,772Fixed term deposits 6,500 44,068
155,903 163,840
Cash holdings yielded an average floating interest rate of 2.25 per cent (2015: 2.76 per cent). All cash investments not held in a transactional account or an overnight ‘at call’ account are invested in short term deposits with Australia’s ‘big four’ commercial banks or their wholly-owned subsidiaries, all rated ‘AA-’ by S&P, which have a maturity of three months or less or in cash management trusts managed by those subsidiaries that invest predominantly in securities with an A1+ rating.
D2. Credit Facilities2016
$’0002015 $’000
Commonwealth Bank of Australia – cash advance facilities 140,000 115,000Amount drawn down 0 0Undrawn facilities 140,000 115,000
Westpac Bank – cash advance facilities 10,000 35,000Amount drawn down 0 0Undrawn facilities 10,000 35,000
Total short term loan facilities 150,000 150,000Amount drawn down 0 0Undrawn facilities 150,000 150,000
The above borrowings are unsecured. Repayment of facilities is done either through the use of cash received from distributions or the sale of securities, or by rolling existing facilities into new ones. Facilities are usually drawn down for no more than three months.
ADDITIONAL INFORMATION
53Australian Foundation Investment Company Limited Annual Report 2016
For
per
sona
l use
onl
y
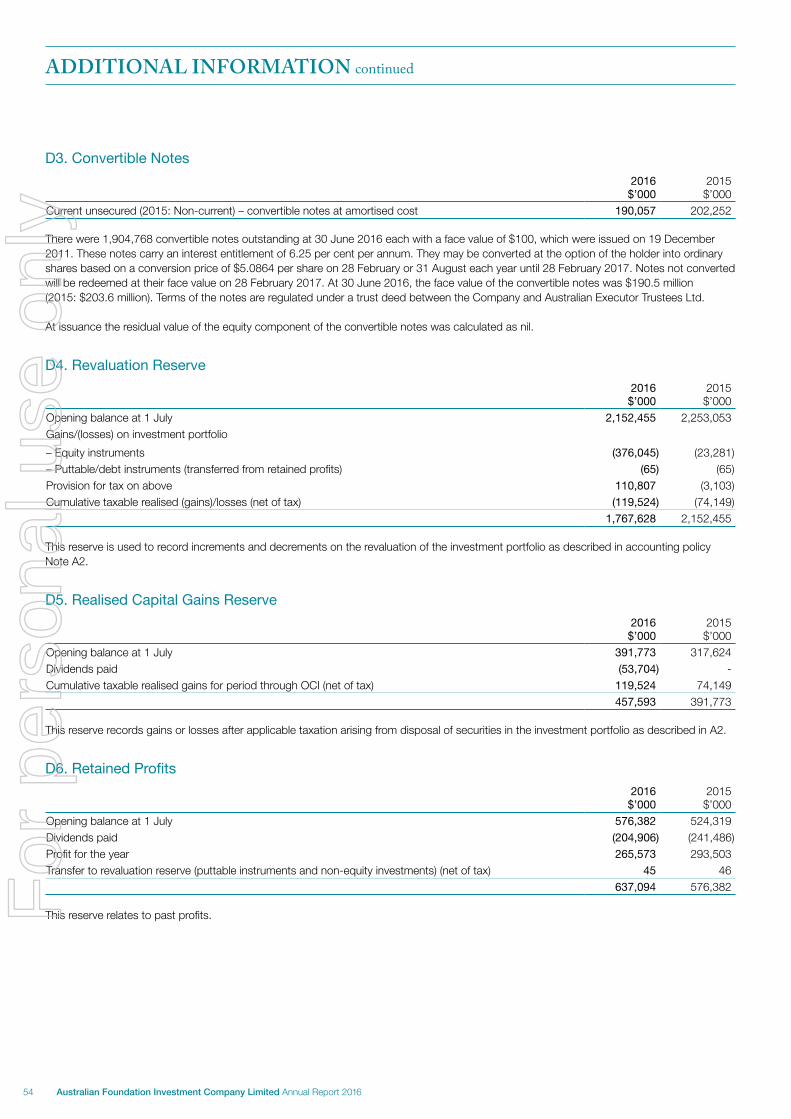
D3. Convertible Notes2016
$’0002015 $’000
Current unsecured (2015: Non-current) – convertible notes at amortised cost 190,057 202,252
There were 1,904,768 convertible notes outstanding at 30 June 2016 each with a face value of $100, which were issued on 19 December 2011. These notes carry an interest entitlement of 6.25 per cent per annum. They may be converted at the option of the holder into ordinary shares based on a conversion price of $5.0864 per share on 28 February or 31 August each year until 28 February 2017. Notes not converted will be redeemed at their face value on 28 February 2017. At 30 June 2016, the face value of the convertible notes was $190.5 million (2015: $203.6 million). Terms of the notes are regulated under a trust deed between the Company and Australian Executor Trustees Ltd.
At issuance the residual value of the equity component of the convertible notes was calculated as nil.
D4. Revaluation Reserve2016
$’0002015 $’000
Opening balance at 1 July 2,152,455 2,253,053Gains/(losses) on investment portfolio
– Equity instruments (376,045) (23,281)– Puttable/debt instruments (transferred from retained profits) (65) (65)Provision for tax on above 110,807 (3,103)Cumulative taxable realised (gains)/losses (net of tax) (119,524) (74,149)
1,767,628 2,152,455
This reserve is used to record increments and decrements on the revaluation of the investment portfolio as described in accounting policy Note A2.
D5. Realised Capital Gains Reserve2016
$’0002015 $’000
Opening balance at 1 July 391,773 317,624Dividends paid (53,704) -Cumulative taxable realised gains for period through OCI (net of tax) 119,524 74,149
457,593 391,773
This reserve records gains or losses after applicable taxation arising from disposal of securities in the investment portfolio as described in A2.
D6. Retained Profits2016
$’0002015 $’000
Opening balance at 1 July 576,382 524,319Dividends paid (204,906) (241,486)Profit for the year 265,573 293,503Transfer to revaluation reserve (puttable instruments and non-equity investments) (net of tax) 45 46
637,094 576,382
This reserve relates to past profits.
ADDITIONAL INFORMATION continued
54 Australian Foundation Investment Company Limited Annual Report 2016
For
per
sona
l use
onl
y
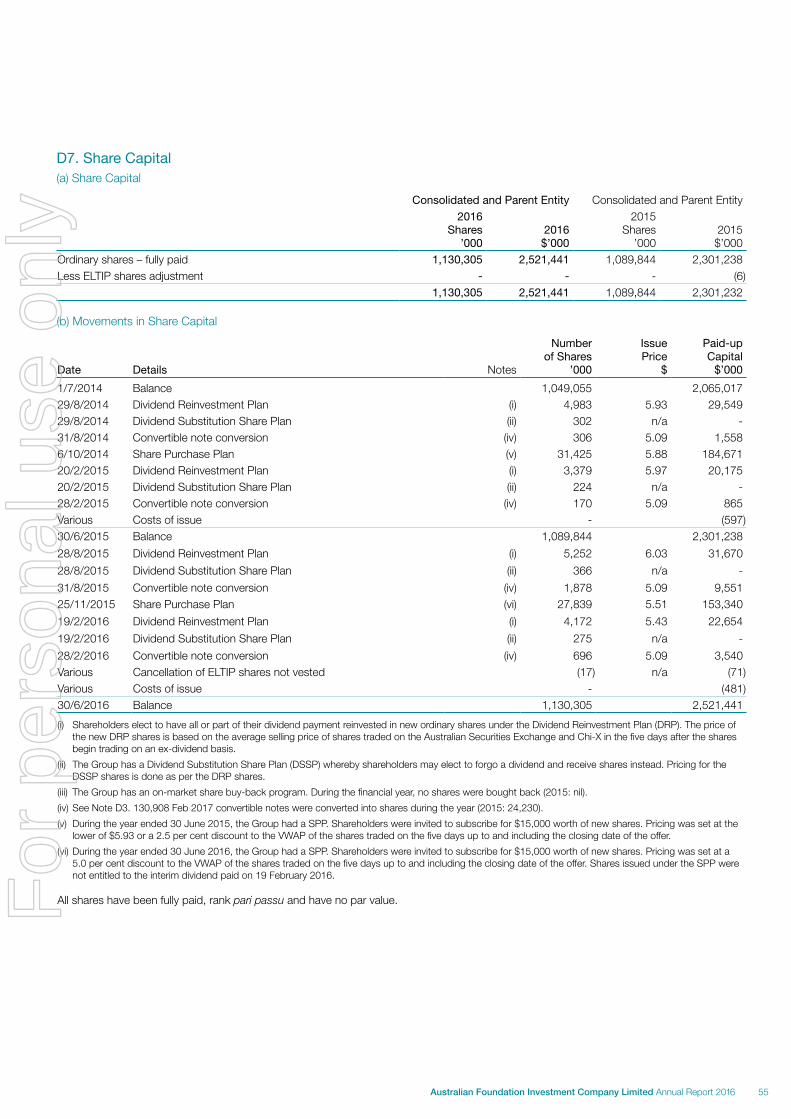
D7. Share Capital(a) Share Capital
Consolidated and Parent Entity Consolidated and Parent Entity2016
Shares ’000
2016 $’000
2015 Shares
’0002015 $’000
Ordinary shares – fully paid 1,130,305 2,521,441 1,089,844 2,301,238Less ELTIP shares adjustment - - - (6)
1,130,305 2,521,441 1,089,844 2,301,232
(b) Movements in Share Capital
Date Details Notes
Number of Shares
’000
Issue Price
$
Paid-up Capital
$’000
1/7/2014 Balance 1,049,055 2,065,01729/8/2014 Dividend Reinvestment Plan (i) 4,983 5.93 29,54929/8/2014 Dividend Substitution Share Plan (ii) 302 n/a -31/8/2014 Convertible note conversion (iv) 306 5.09 1,5586/10/2014 Share Purchase Plan (v) 31,425 5.88 184,67120/2/2015 Dividend Reinvestment Plan (i) 3,379 5.97 20,17520/2/2015 Dividend Substitution Share Plan (ii) 224 n/a -28/2/2015 Convertible note conversion (iv) 170 5.09 865Various Costs of issue - (597)30/6/2015 Balance 1,089,844 2,301,238
28/8/2015 Dividend Reinvestment Plan (i) 5,252 6.03 31,670
28/8/2015 Dividend Substitution Share Plan (ii) 366 n/a -
31/8/2015 Convertible note conversion (iv) 1,878 5.09 9,55125/11/2015 Share Purchase Plan (vi) 27,839 5.51 153,340
19/2/2016 Dividend Reinvestment Plan (i) 4,172 5.43 22,654
19/2/2016 Dividend Substitution Share Plan (ii) 275 n/a -
28/2/2016 Convertible note conversion (iv) 696 5.09 3,540Various Cancellation of ELTIP shares not vested (17) n/a (71)Various Costs of issue - (481)30/6/2016 Balance 1,130,305 2,521,441
(i) Shareholders elect to have all or part of their dividend payment reinvested in new ordinary shares under the Dividend Reinvestment Plan (DRP). The price of the new DRP shares is based on the average selling price of shares traded on the Australian Securities Exchange and Chi-X in the five days after the shares begin trading on an ex-dividend basis.
(ii) The Group has a Dividend Substitution Share Plan (DSSP) whereby shareholders may elect to forgo a dividend and receive shares instead. Pricing for the DSSP shares is done as per the DRP shares.
(iii) The Group has an on-market share buy-back program. During the financial year, no shares were bought back (2015: nil).
(iv) See Note D3. 130,908 Feb 2017 convertible notes were converted into shares during the year (2015: 24,230).
(v) During the year ended 30 June 2015, the Group had a SPP. Shareholders were invited to subscribe for $15,000 worth of new shares. Pricing was set at the lower of $5.93 or a 2.5 per cent discount to the VWAP of the shares traded on the five days up to and including the closing date of the offer.
(vi) During the year ended 30 June 2016, the Group had a SPP. Shareholders were invited to subscribe for $15,000 worth of new shares. Pricing was set at a 5.0 per cent discount to the VWAP of the shares traded on the five days up to and including the closing date of the offer. Shares issued under the SPP were not entitled to the interim dividend paid on 19 February 2016.
All shares have been fully paid, rank pari passu and have no par value.
55Australian Foundation Investment Company Limited Annual Report 2016
For
per
sona
l use
onl
y
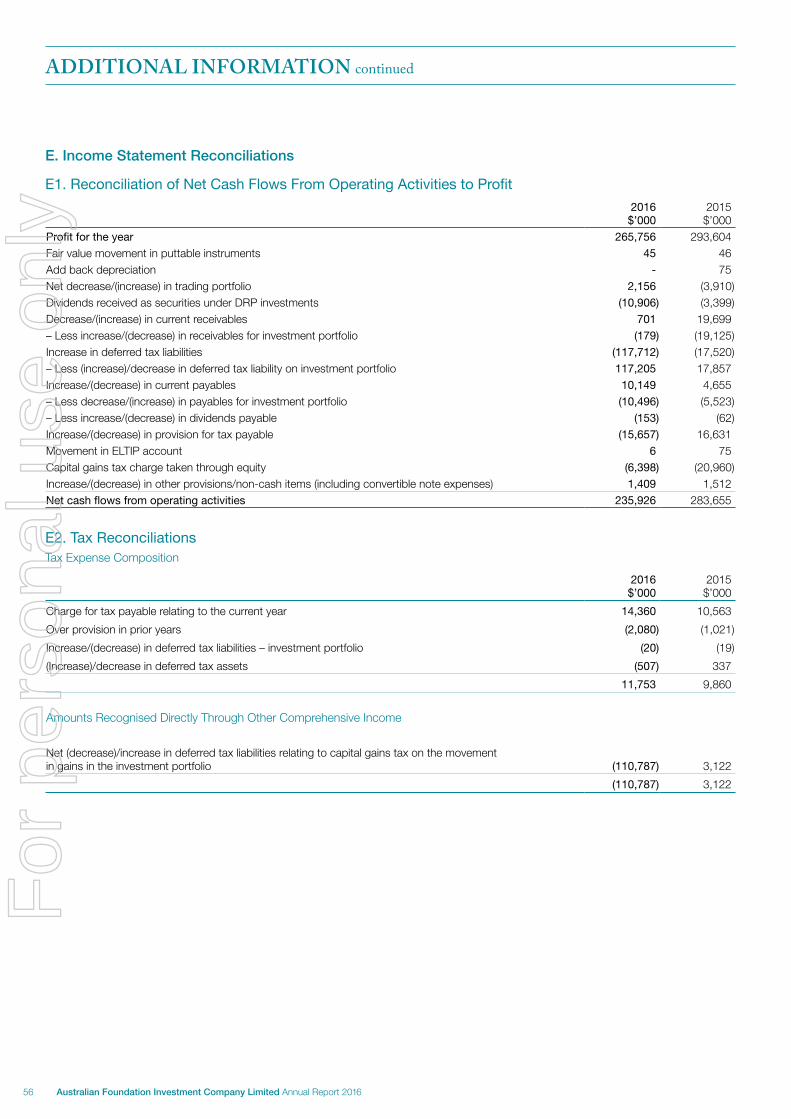
E. Income Statement Reconciliations
E1. Reconciliation of Net Cash Flows From Operating Activities to Profit2016
$’0002015 $’000
Profit for the year 265,756 293,604Fair value movement in puttable instruments 45 46Add back depreciation - 75Net decrease/(increase) in trading portfolio 2,156 (3,910)Dividends received as securities under DRP investments (10,906) (3,399)Decrease/(increase) in current receivables 701 19,699– Less increase/(decrease) in receivables for investment portfolio (179) (19,125)Increase in deferred tax liabilities (117,712) (17,520)– Less (increase)/decrease in deferred tax liability on investment portfolio 117,205 17,857Increase/(decrease) in current payables 10,149 4,655– Less decrease/(increase) in payables for investment portfolio (10,496) (5,523)– Less increase/(decrease) in dividends payable (153) (62)Increase/(decrease) in provision for tax payable (15,657) 16,631Movement in ELTIP account 6 75Capital gains tax charge taken through equity (6,398) (20,960)Increase/(decrease) in other provisions/non-cash items (including convertible note expenses) 1,409 1,512Net cash flows from operating activities 235,926 283,655
E2. Tax ReconciliationsTax Expense Composition
2016 $’000
2015 $’000
Charge for tax payable relating to the current year 14,360 10,563
Over provision in prior years (2,080) (1,021)
Increase/(decrease) in deferred tax liabilities – investment portfolio (20) (19)
(Increase)/decrease in deferred tax assets (507) 337
11,753 9,860
Amounts Recognised Directly Through Other Comprehensive Income
Net (decrease)/increase in deferred tax liabilities relating to capital gains tax on the movement in gains in the investment portfolio (110,787) 3,122
(110,787) 3,122
ADDITIONAL INFORMATION continued
56 Australian Foundation Investment Company Limited Annual Report 2016
For
per
sona
l use
onl
y
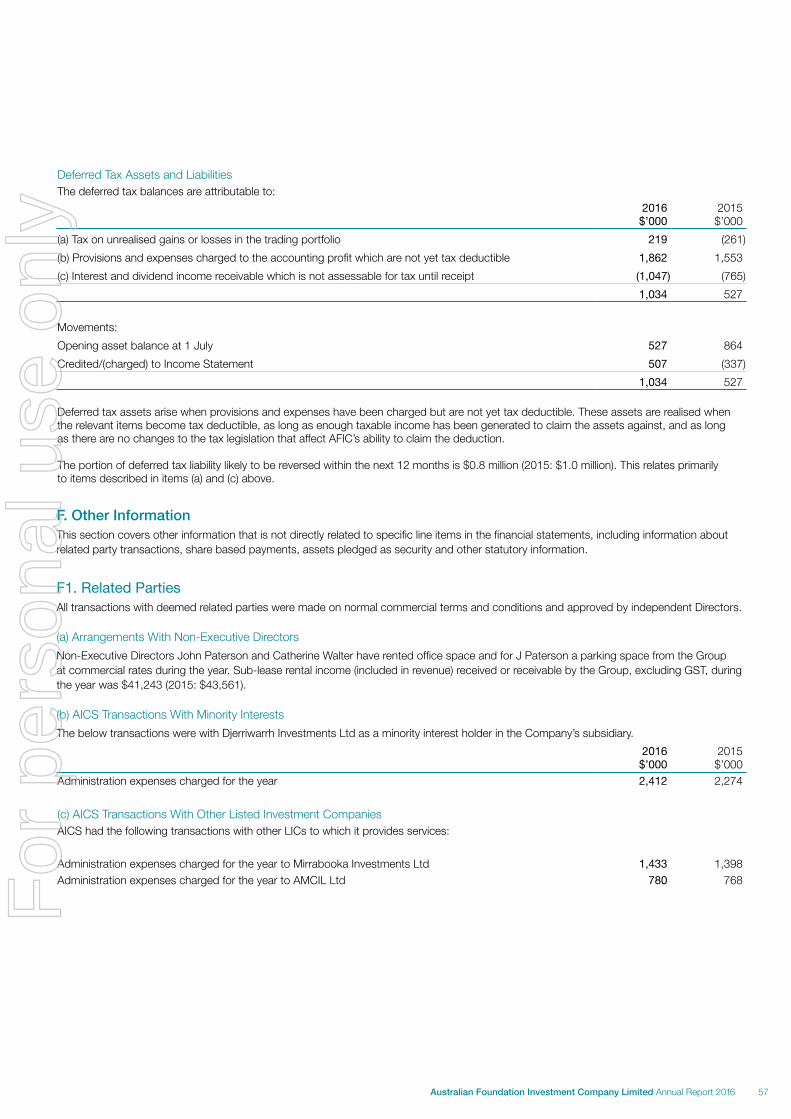
Deferred Tax Assets and Liabilities The deferred tax balances are attributable to:
2016 $’000
2015 $’000
(a) Tax on unrealised gains or losses in the trading portfolio 219 (261)
(b) Provisions and expenses charged to the accounting profit which are not yet tax deductible 1,862 1,553
(c) Interest and dividend income receivable which is not assessable for tax until receipt (1,047) (765)
1,034 527
Movements:
Opening asset balance at 1 July 527 864
Credited/(charged) to Income Statement 507 (337)
1,034 527
Deferred tax assets arise when provisions and expenses have been charged but are not yet tax deductible. These assets are realised when the relevant items become tax deductible, as long as enough taxable income has been generated to claim the assets against, and as long as there are no changes to the tax legislation that affect AFIC’s ability to claim the deduction.
The portion of deferred tax liability likely to be reversed within the next 12 months is $0.8 million (2015: $1.0 million). This relates primarily to items described in items (a) and (c) above.
F. Other InformationThis section covers other information that is not directly related to specific line items in the financial statements, including information about related party transactions, share based payments, assets pledged as security and other statutory information.
F1. Related PartiesAll transactions with deemed related parties were made on normal commercial terms and conditions and approved by independent Directors.
(a) Arrangements With Non-Executive Directors
Non-Executive Directors John Paterson and Catherine Walter have rented office space and for J Paterson a parking space from the Group at commercial rates during the year. Sub-lease rental income (included in revenue) received or receivable by the Group, excluding GST, during the year was $41,243 (2015: $43,561).
(b) AICS Transactions With Minority Interests
The below transactions were with Djerriwarrh Investments Ltd as a minority interest holder in the Company’s subsidiary.
2016 $’000
2015 $’000
Administration expenses charged for the year 2,412 2,274
(c) AICS Transactions With Other Listed Investment CompaniesAICS had the following transactions with other LICs to which it provides services:
Administration expenses charged for the year to Mirrabooka Investments Ltd 1,433 1,398Administration expenses charged for the year to AMCIL Ltd 780 768
57Australian Foundation Investment Company Limited Annual Report 2016
For
per
sona
l use
onl
y
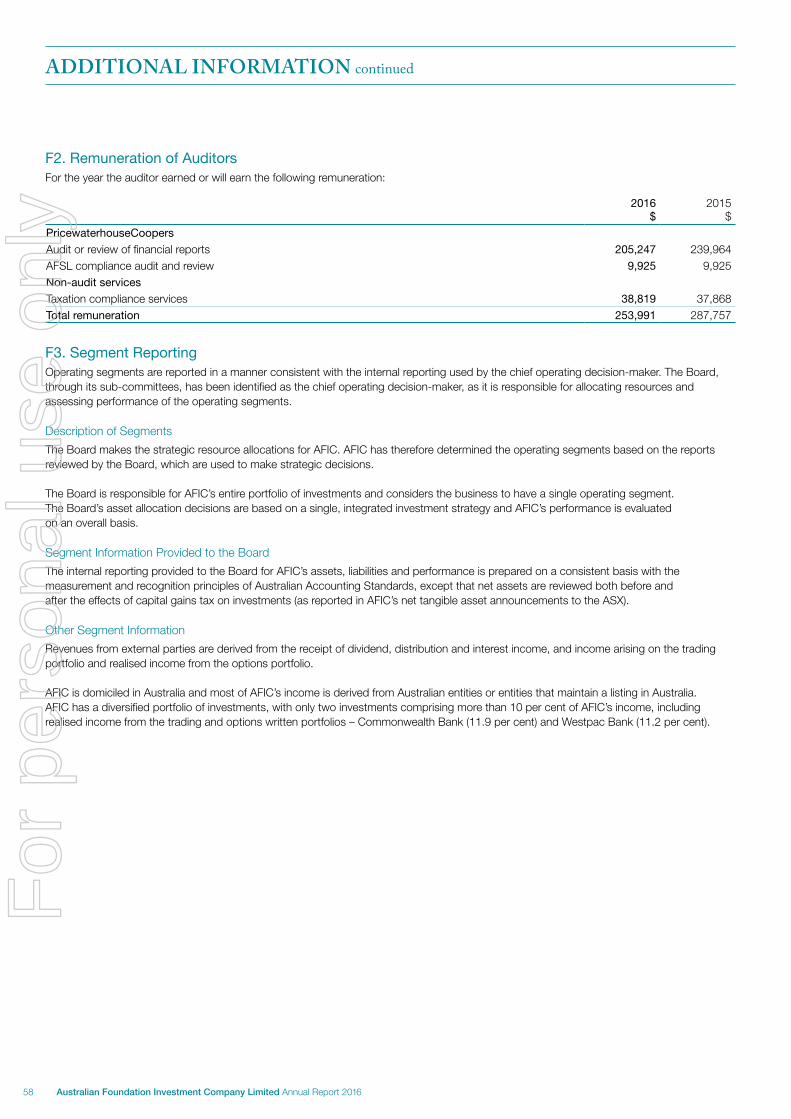
F2. Remuneration of AuditorsFor the year the auditor earned or will earn the following remuneration:
2016 $
2015 $
PricewaterhouseCoopers
Audit or review of financial reports 205,247 239,964AFSL compliance audit and review 9,925 9,925Non-audit services
Taxation compliance services 38,819 37,868Total remuneration 253,991 287,757
F3. Segment ReportingOperating segments are reported in a manner consistent with the internal reporting used by the chief operating decision-maker. The Board, through its sub-committees, has been identified as the chief operating decision-maker, as it is responsible for allocating resources and assessing performance of the operating segments.
Description of Segments
The Board makes the strategic resource allocations for AFIC. AFIC has therefore determined the operating segments based on the reports reviewed by the Board, which are used to make strategic decisions.
The Board is responsible for AFIC’s entire portfolio of investments and considers the business to have a single operating segment. The Board’s asset allocation decisions are based on a single, integrated investment strategy and AFIC’s performance is evaluated on an overall basis.
Segment Information Provided to the Board
The internal reporting provided to the Board for AFIC’s assets, liabilities and performance is prepared on a consistent basis with the measurement and recognition principles of Australian Accounting Standards, except that net assets are reviewed both before and after the effects of capital gains tax on investments (as reported in AFIC’s net tangible asset announcements to the ASX).
Other Segment Information
Revenues from external parties are derived from the receipt of dividend, distribution and interest income, and income arising on the trading portfolio and realised income from the options portfolio.
AFIC is domiciled in Australia and most of AFIC’s income is derived from Australian entities or entities that maintain a listing in Australia. AFIC has a diversified portfolio of investments, with only two investments comprising more than 10 per cent of AFIC’s income, including realised income from the trading and options written portfolios – Commonwealth Bank (11.9 per cent) and Westpac Bank (11.2 per cent).
ADDITIONAL INFORMATION continued
58 Australian Foundation Investment Company Limited Annual Report 2016
For
per
sona
l use
onl
y
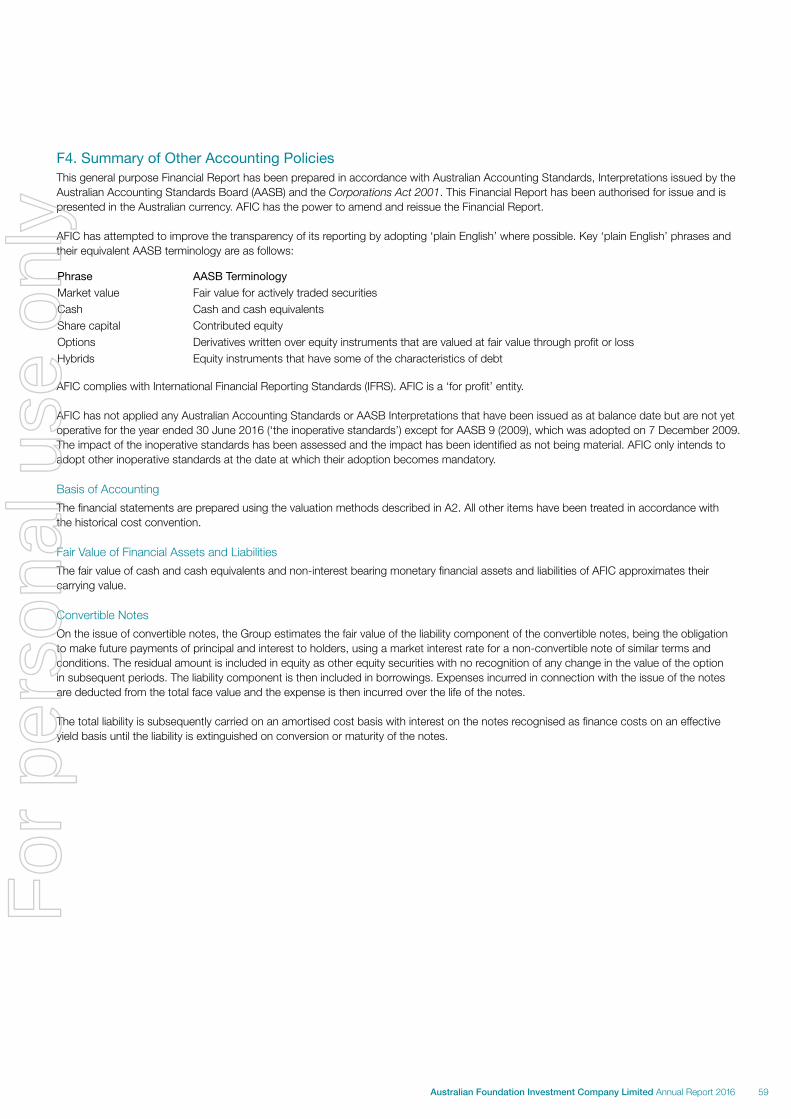
F4. Summary of Other Accounting PoliciesThis general purpose Financial Report has been prepared in accordance with Australian Accounting Standards, Interpretations issued by the Australian Accounting Standards Board (AASB) and the Corporations Act 2001. This Financial Report has been authorised for issue and is presented in the Australian currency. AFIC has the power to amend and reissue the Financial Report.
AFIC has attempted to improve the transparency of its reporting by adopting ‘plain English’ where possible. Key ‘plain English’ phrases and their equivalent AASB terminology are as follows:
Phrase AASB Terminology
Market value Fair value for actively traded securitiesCash Cash and cash equivalentsShare capital Contributed equityOptions Derivatives written over equity instruments that are valued at fair value through profit or lossHybrids Equity instruments that have some of the characteristics of debt
AFIC complies with International Financial Reporting Standards (IFRS). AFIC is a ‘for profit’ entity.
AFIC has not applied any Australian Accounting Standards or AASB Interpretations that have been issued as at balance date but are not yet operative for the year ended 30 June 2016 (‘the inoperative standards’) except for AASB 9 (2009), which was adopted on 7 December 2009. The impact of the inoperative standards has been assessed and the impact has been identified as not being material. AFIC only intends to adopt other inoperative standards at the date at which their adoption becomes mandatory.
Basis of Accounting
The financial statements are prepared using the valuation methods described in A2. All other items have been treated in accordance with the historical cost convention.
Fair Value of Financial Assets and Liabilities
The fair value of cash and cash equivalents and non-interest bearing monetary financial assets and liabilities of AFIC approximates their carrying value.
Convertible Notes
On the issue of convertible notes, the Group estimates the fair value of the liability component of the convertible notes, being the obligation to make future payments of principal and interest to holders, using a market interest rate for a non-convertible note of similar terms and conditions. The residual amount is included in equity as other equity securities with no recognition of any change in the value of the option in subsequent periods. The liability component is then included in borrowings. Expenses incurred in connection with the issue of the notes are deducted from the total face value and the expense is then incurred over the life of the notes.
The total liability is subsequently carried on an amortised cost basis with interest on the notes recognised as finance costs on an effective yield basis until the liability is extinguished on conversion or maturity of the notes.
59Australian Foundation Investment Company Limited Annual Report 2016
For
per
sona
l use
onl
y
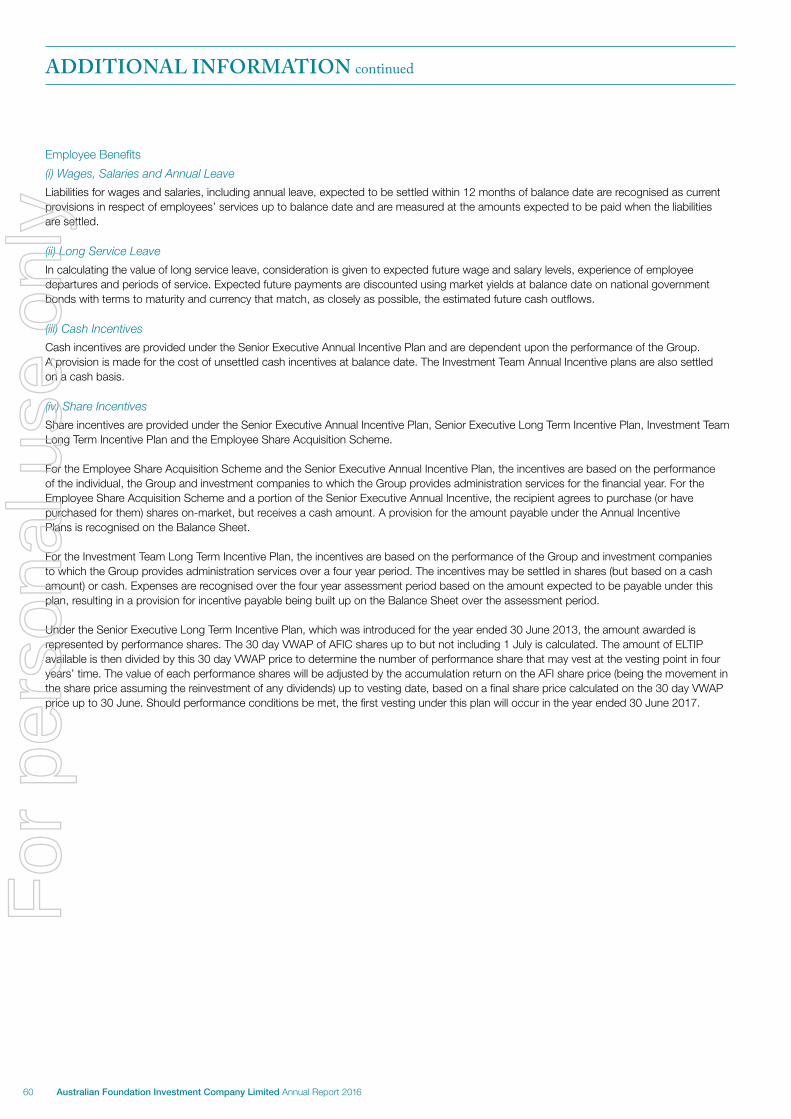
Employee Benefits
(i) Wages, Salaries and Annual Leave
Liabilities for wages and salaries, including annual leave, expected to be settled within 12 months of balance date are recognised as current provisions in respect of employees’ services up to balance date and are measured at the amounts expected to be paid when the liabilities are settled.
(ii) Long Service Leave
In calculating the value of long service leave, consideration is given to expected future wage and salary levels, experience of employee departures and periods of service. Expected future payments are discounted using market yields at balance date on national government bonds with terms to maturity and currency that match, as closely as possible, the estimated future cash outflows.
(iii) Cash Incentives
Cash incentives are provided under the Senior Executive Annual Incentive Plan and are dependent upon the performance of the Group. A provision is made for the cost of unsettled cash incentives at balance date. The Investment Team Annual Incentive plans are also settled on a cash basis.
(iv) Share Incentives
Share incentives are provided under the Senior Executive Annual Incentive Plan, Senior Executive Long Term Incentive Plan, Investment Team Long Term Incentive Plan and the Employee Share Acquisition Scheme.
For the Employee Share Acquisition Scheme and the Senior Executive Annual Incentive Plan, the incentives are based on the performance of the individual, the Group and investment companies to which the Group provides administration services for the financial year. For the Employee Share Acquisition Scheme and a portion of the Senior Executive Annual Incentive, the recipient agrees to purchase (or have purchased for them) shares on-market, but receives a cash amount. A provision for the amount payable under the Annual Incentive Plans is recognised on the Balance Sheet.
For the Investment Team Long Term Incentive Plan, the incentives are based on the performance of the Group and investment companies to which the Group provides administration services over a four year period. The incentives may be settled in shares (but based on a cash amount) or cash. Expenses are recognised over the four year assessment period based on the amount expected to be payable under this plan, resulting in a provision for incentive payable being built up on the Balance Sheet over the assessment period.
Under the Senior Executive Long Term Incentive Plan, which was introduced for the year ended 30 June 2013, the amount awarded is represented by performance shares. The 30 day VWAP of AFIC shares up to but not including 1 July is calculated. The amount of ELTIP available is then divided by this 30 day VWAP price to determine the number of performance share that may vest at the vesting point in four years’ time. The value of each performance shares will be adjusted by the accumulation return on the AFI share price (being the movement in the share price assuming the reinvestment of any dividends) up to vesting date, based on a final share price calculated on the 30 day VWAP price up to 30 June. Should performance conditions be met, the first vesting under this plan will occur in the year ended 30 June 2017.
ADDITIONAL INFORMATION continued
60 Australian Foundation Investment Company Limited Annual Report 2016
For
per
sona
l use
onl
y
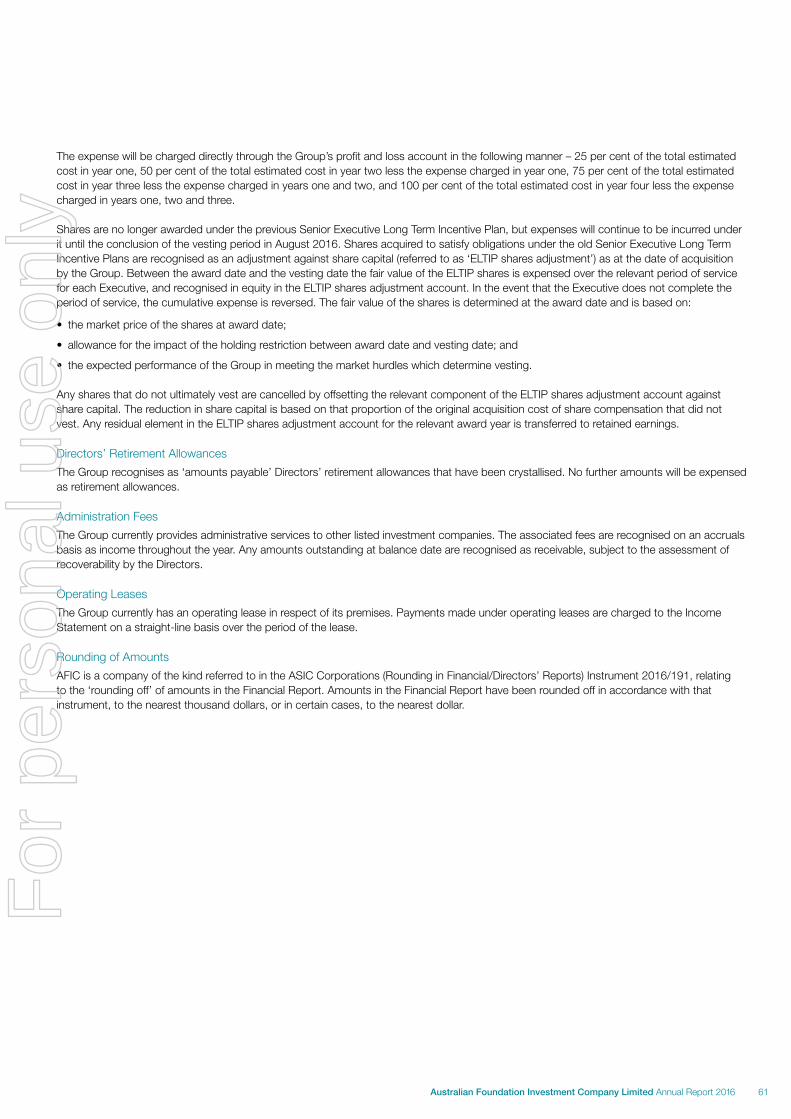
The expense will be charged directly through the Group’s profit and loss account in the following manner – 25 per cent of the total estimated cost in year one, 50 per cent of the total estimated cost in year two less the expense charged in year one, 75 per cent of the total estimated cost in year three less the expense charged in years one and two, and 100 per cent of the total estimated cost in year four less the expense charged in years one, two and three.
Shares are no longer awarded under the previous Senior Executive Long Term Incentive Plan, but expenses will continue to be incurred under it until the conclusion of the vesting period in August 2016. Shares acquired to satisfy obligations under the old Senior Executive Long Term Incentive Plans are recognised as an adjustment against share capital (referred to as ‘ELTIP shares adjustment’) as at the date of acquisition by the Group. Between the award date and the vesting date the fair value of the ELTIP shares is expensed over the relevant period of service for each Executive, and recognised in equity in the ELTIP shares adjustment account. In the event that the Executive does not complete the period of service, the cumulative expense is reversed. The fair value of the shares is determined at the award date and is based on:
• the market price of the shares at award date;
• allowance for the impact of the holding restriction between award date and vesting date; and
• the expected performance of the Group in meeting the market hurdles which determine vesting.
Any shares that do not ultimately vest are cancelled by offsetting the relevant component of the ELTIP shares adjustment account against share capital. The reduction in share capital is based on that proportion of the original acquisition cost of share compensation that did not vest. Any residual element in the ELTIP shares adjustment account for the relevant award year is transferred to retained earnings.
Directors’ Retirement Allowances
The Group recognises as ‘amounts payable’ Directors’ retirement allowances that have been crystallised. No further amounts will be expensed as retirement allowances.
Administration Fees
The Group currently provides administrative services to other listed investment companies. The associated fees are recognised on an accruals basis as income throughout the year. Any amounts outstanding at balance date are recognised as receivable, subject to the assessment of recoverability by the Directors.
Operating Leases
The Group currently has an operating lease in respect of its premises. Payments made under operating leases are charged to the Income Statement on a straight-line basis over the period of the lease.
Rounding of Amounts
AFIC is a company of the kind referred to in the ASIC Corporations (Rounding in Financial/Directors’ Reports) Instrument 2016/191, relating to the ‘rounding off’ of amounts in the Financial Report. Amounts in the Financial Report have been rounded off in accordance with that instrument, to the nearest thousand dollars, or in certain cases, to the nearest dollar.
61Australian Foundation Investment Company Limited Annual Report 2016
For
per
sona
l use
onl
y
F5. Performance BondThe Group’s subsidiary, AICS, has under the terms of its Australian Financial Services Licence in place a performance bond to the sum of $20,000 underwritten by the Commonwealth Bank of Australia in favour of the Australian Securities and Investments Commission (ASIC), payable on demand to ASIC.
F6. Share Based PaymentsShare Based Payments
The Group has a number of share incentive arrangements. These are accounted for in accordance with Note F4. Where shares are issued to employees of AICS, AICS compensates AFIC for the fair value of the shares.
(a) Executive Incentive Plans
The Executives’ remuneration arrangements incorporate an ‘at risk’ component as set out in the Remuneration Report. Part of this ‘at risk’ component is paid in shares in the Group.
(i) Senior Executive Annual Incentive Plan
Each financial year, the Remuneration Committee sets the target (cash) amount of remuneration that could be paid should all performance targets and measures be achieved. If all are achieved, 100 per cent of the remuneration will be awarded. If stretch levels of performance are achieved above target, then higher amounts may be paid. On the other hand, there is no set minimum that will be paid regardless of performance.
The performance measures are a combination of the performance of the Group, the investment companies to which the Group provides administration services and personal objectives.
All of the incentive remuneration awarded is paid in cash, with 50 per cent of the after tax amount being used by the Executive to purchase shares. All remuneration under the plan is paid in the financial year following the year of assessment.
The Executive agrees to the shares being subject to being held for two years (holding term), during which they cannot be sold. Dividends are paid to Executives on these shares prior to the expiry of the holding term. Should an Executive leave the Group before the holding term expires, the restriction will be lifted.
19,648 shares (2015: 22,452 shares) were purchased by Executives in the year (in relation to the prior year) with a fair value (being the acquisition price) of $121,411 (2015: $135,685).
ADDITIONAL INFORMATION continued
62 Australian Foundation Investment Company Limited Annual Report 2016
For
per
sona
l use
onl
y
(ii) Senior Executive Long Term Incentive Plan
Senior Executives were awarded a number of shares equivalent to 50 per cent of the gross amount awarded under the old Annual Incentive Plan. These shares (‘performance shares’) were acquired on-market. The award of shares to participants was made for no consideration. The shares are subject to a holding lock for a minimum of four years (the vesting period) during which time the Executive will be entitled to receive dividends and hold voting rights.
The performance shares vest between four and five years after grant date, entirely dependent on the achievement of set quantitative measures, the TSR and the TPR, which reflect the movement in the share price of the Company (TSR) and in the portfolio of investments in which the Company has invested shareholders’ funds (TPR). The number of shares that vest is based on the highest cumulative performance level achieved under each category. Shares that do not vest are transferred back to the Group for no consideration and are cancelled.
Should an Executive cease employment prior to the shares vesting, then all unvested shares may be cancelled.
Details of the number of shares awarded, vested and cancelled in the year are set out in the Remuneration Report.
Under the new Senior Executive Long Term Incentive Plan, the amount awarded will be represented by Performance Rights. The 30 day VWAP of AFIC shares up to but not including 1 July will be calculated. The amount of ELTIP available will then be divided by this 30 day VWAP price to determine the number of performance rights that may vest at the vesting point in four years’ time. The value of each performance right will be adjusted by the accumulation return on the AFI share price (being the movement in the share price assuming the reinvestment of any dividends) up to vesting date, based on a final share price calculated on the 30 day VWAP price up to 30 June.
The estimated fair value of the award will be calculated in accordance with AASB 2 – Share Based Payments at the end of each year until the final year of vesting. The liability shown after the final year of vesting will represent the actual amount being paid to eligible employees as a cash-settled share based payment.
66,784 rights were awarded under the plan during the year ended 30 June 2016 (2015: 67,009). An expense of $267,351 (2015: $413,846) was incurred. 41,496 rights were forfeited due to the departure during the year.
63Australian Foundation Investment Company Limited Annual Report 2016
For
per
sona
l use
onl
y
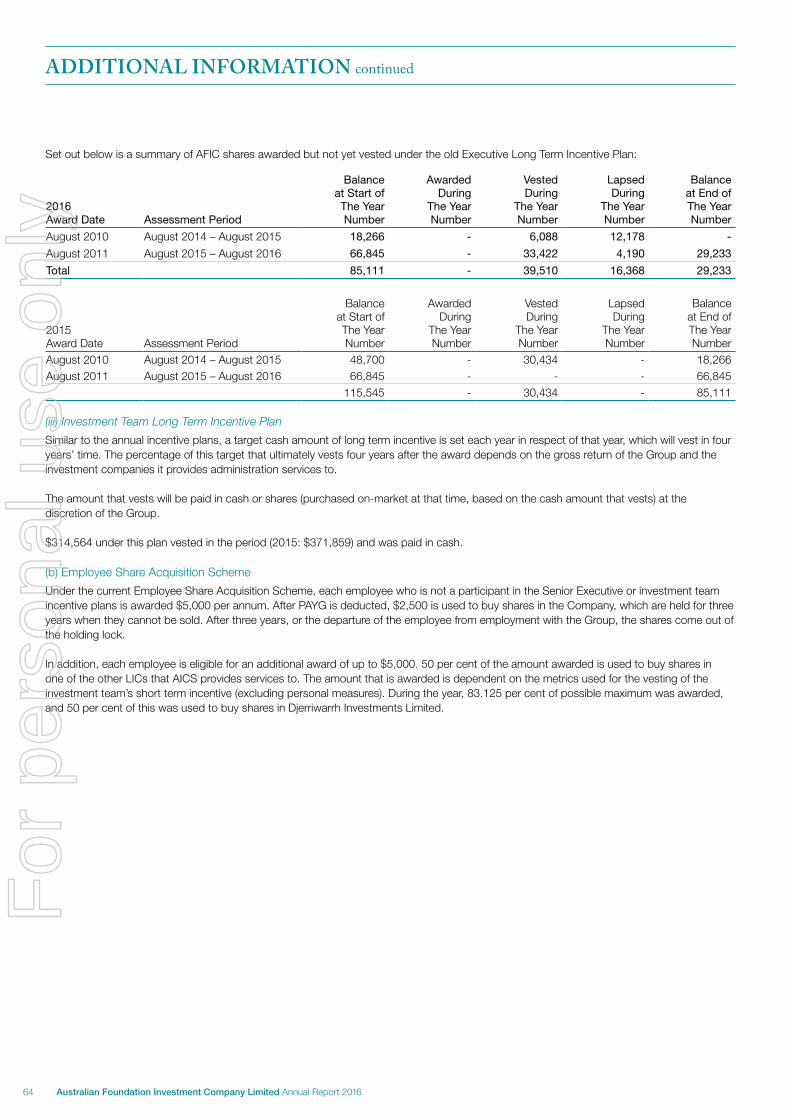
Set out below is a summary of AFIC shares awarded but not yet vested under the old Executive Long Term Incentive Plan:
2016 Award Date Assessment Period
Balance at Start of The Year Number
Awarded During
The Year Number
Vested During
The Year Number
Lapsed During
The Year Number
Balance at End of The Year Number
August 2010 August 2014 – August 2015 18,266 - 6,088 12,178 -
August 2011 August 2015 – August 2016 66,845 - 33,422 4,190 29,233
Total 85,111 - 39,510 16,368 29,233
2015 Award Date Assessment Period
Balance at Start of The Year Number
Awarded During
The Year Number
Vested During
The Year Number
Lapsed During
The Year Number
Balance at End of The Year Number
August 2010 August 2014 – August 2015 48,700 - 30,434 - 18,266August 2011 August 2015 – August 2016 66,845 - - - 66,845
115,545 - 30,434 - 85,111
(iii) Investment Team Long Term Incentive Plan
Similar to the annual incentive plans, a target cash amount of long term incentive is set each year in respect of that year, which will vest in four years’ time. The percentage of this target that ultimately vests four years after the award depends on the gross return of the Group and the investment companies it provides administration services to.
The amount that vests will be paid in cash or shares (purchased on-market at that time, based on the cash amount that vests) at the discretion of the Group.
$314,564 under this plan vested in the period (2015: $371,859) and was paid in cash.
(b) Employee Share Acquisition Scheme
Under the current Employee Share Acquisition Scheme, each employee who is not a participant in the Senior Executive or investment team incentive plans is awarded $5,000 per annum. After PAYG is deducted, $2,500 is used to buy shares in the Company, which are held for three years when they cannot be sold. After three years, or the departure of the employee from employment with the Group, the shares come out of the holding lock.
In addition, each employee is eligible for an additional award of up to $5,000. 50 per cent of the amount awarded is used to buy shares in one of the other LICs that AICS provides services to. The amount that is awarded is dependent on the metrics used for the vesting of the investment team’s short term incentive (excluding personal measures). During the year, 83.125 per cent of possible maximum was awarded, and 50 per cent of this was used to buy shares in Djerriwarrh Investments Limited.
ADDITIONAL INFORMATION continued
64 Australian Foundation Investment Company Limited Annual Report 2016
For
per
sona
l use
onl
y
(c) Expenses Arising From Share Based Payment Transactions
Total expenses arising from share based payment transactions recognised during the period as part of the employee benefit expense (including the expense for the ELTIP but excluding the Investment Team Long Term Incentive Plan) were as follows:
2016 $’000
2015 $’000
Share based payment expense 306 529
(d) Liability
The total liability arising from share based payment transactions is included in the current and non-current liabilities for ‘provisions’.
F7. Lease CommitmentsThe Group has entered into a non-cancellable operating lease for the use of its premises for seven years. Current commitment relating to leases at balance date for the current lease (including GST) is:
2016 $’000
2015 $’000
Due within one year 667 563Later than one year but less than five 2,669 -Greater than five years 667 -
4,003 563
F8. Principles of ConsolidationAFIC’s consolidated financial statements consist of the financial statements of AFIC, the parent and its subsidiary AICS. 25 per cent of AICS is owned by Djerriwarrh Investments Ltd, another investment company for which AICS performs operational and investment administration services, and for which it is paid monthly.
No subsidiaries were acquired or disposed of during the year. Intercompany transactions and balances between AFIC and AICS are eliminated on consolidation.
The financial information for the parent entity, disclosed in F10 below, has been prepared on the same basis as the consolidated financial statements. All notes are for the consolidated group unless specifically noted otherwise.
65Australian Foundation Investment Company Limited Annual Report 2016
For
per
sona
l use
onl
y
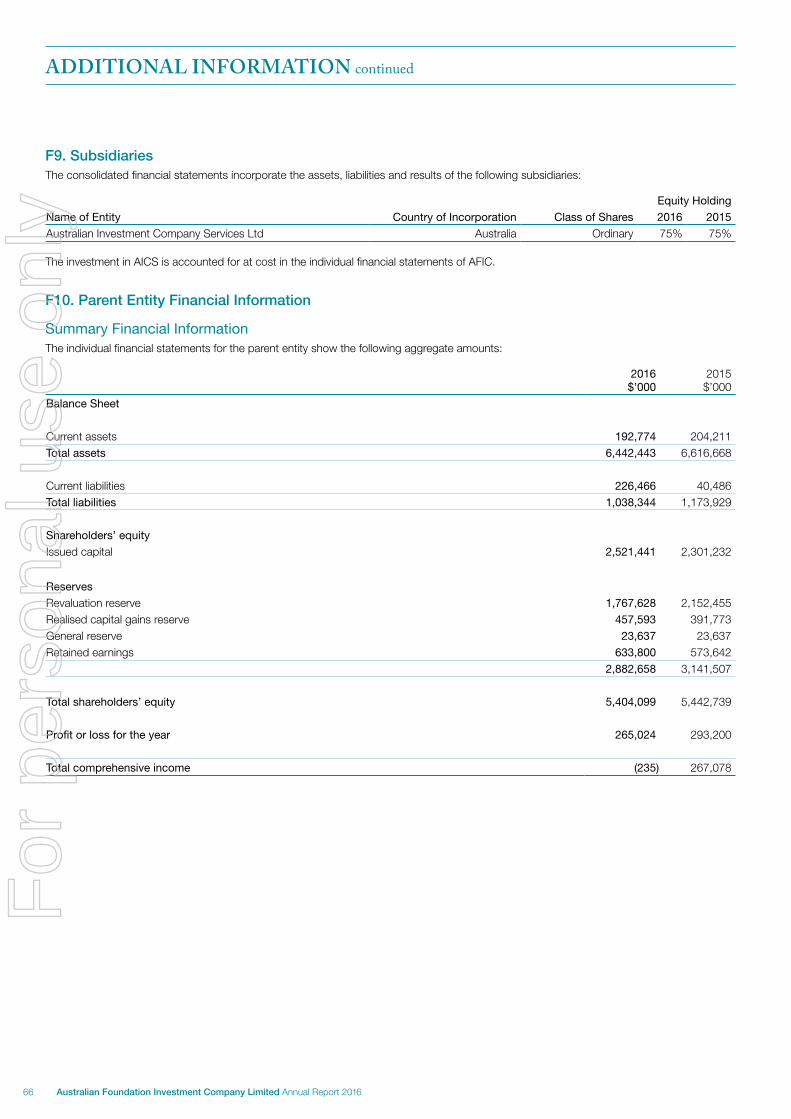
F9. SubsidiariesThe consolidated financial statements incorporate the assets, liabilities and results of the following subsidiaries:
Equity Holding
Name of Entity Country of Incorporation Class of Shares 2016 2015
Australian Investment Company Services Ltd Australia Ordinary 75% 75%
The investment in AICS is accounted for at cost in the individual financial statements of AFIC.
F10. Parent Entity Financial Information
Summary Financial InformationThe individual financial statements for the parent entity show the following aggregate amounts:
2016$’000
2015$’000
Balance Sheet
Current assets 192,774 204,211Total assets 6,442,443 6,616,668
Current liabilities 226,466 40,486Total liabilities 1,038,344 1,173,929
Shareholders’ equity
Issued capital 2,521,441 2,301,232
Reserves
Revaluation reserve 1,767,628 2,152,455Realised capital gains reserve 457,593 391,773General reserve 23,637 23,637Retained earnings 633,800 573,642
2,882,658 3,141,507
Total shareholders’ equity 5,404,099 5,442,739
Profit or loss for the year 265,024 293,200
Total comprehensive income (235) 267,078
ADDITIONAL INFORMATION continued
66 Australian Foundation Investment Company Limited Annual Report 2016
For
per
sona
l use
onl
y
In the Directors’ opinion:
(1) the financial statements and notes set out on pages 37 to 66 are in accordance with the Corporations Act 2001 including:
(a) complying with the Accounting Standards, the Corporations Regulations 2001 and other mandatory professional reporting requirements; and
(b) giving a true and fair view of the entity’s financial position as at 30 June 2016 and of its performance for the financial year ended on that date; and
(2) there are reasonable grounds to believe that the Company will be able to pay its debts as and when they become due and payable.
Note F4 to the financial statements confirms that the financial statements also comply with International Financial Reporting Standards as issued by the International Accounting Standards Board.
This declaration is made in accordance with a resolution of the Directors.
This declaration has been made after receiving the declarations required to be made to the Directors by the Managing Director and the Chief Financial Officer regarding the financial statements in accordance with Section 295A of the Corporations Act 2001 for the financial year ended 30 June 2016. The declarations received were that, in the opinion of the Managing Director and the Chief Financial Officer to the best of their knowledge, the financial records of the Company have been properly maintained, that the financial statements comply with Accounting Standards and that they give a true and fair view.
Terrence Campbell AOChairman
Melbourne25 July 2016
DIRECTORS’ DECLARATION
67Australian Foundation Investment Company Limited Annual Report 2016
For
per
sona
l use
onl
y
INDEPENDENT AUDIT REPORT
68 Australian Foundation Investment Company Limited Annual Report 2016
For
per
sona
l use
onl
y
69Australian Foundation Investment Company Limited Annual Report 2016
For
per
sona
l use
onl
y
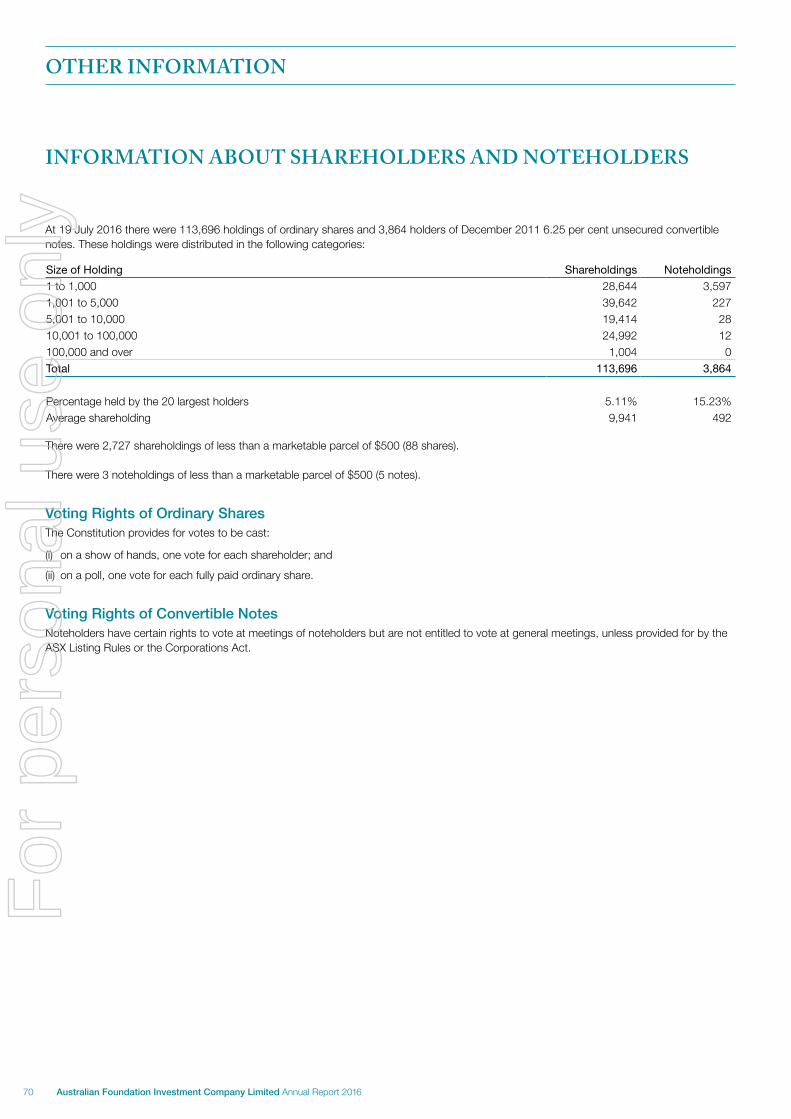
At 19 July 2016 there were 113,696 holdings of ordinary shares and 3,864 holders of December 2011 6.25 per cent unsecured convertible notes. These holdings were distributed in the following categories:
Size of Holding Shareholdings Noteholdings
1 to 1,000 28,644 3,5971,001 to 5,000 39,642 2275,001 to 10,000 19,414 2810,001 to 100,000 24,992 12100,000 and over 1,004 0Total 113,696 3,864
Percentage held by the 20 largest holders 5.11% 15.23%Average shareholding 9,941 492
There were 2,727 shareholdings of less than a marketable parcel of $500 (88 shares).
There were 3 noteholdings of less than a marketable parcel of $500 (5 notes).
Voting Rights of Ordinary SharesThe Constitution provides for votes to be cast:
(i) on a show of hands, one vote for each shareholder; and
(ii) on a poll, one vote for each fully paid ordinary share.
Voting Rights of Convertible NotesNoteholders have certain rights to vote at meetings of noteholders but are not entitled to vote at general meetings, unless provided for by the ASX Listing Rules or the Corporations Act.
OTHER INFORMATION
INFORMATION ABOUT SHAREHOLDERS AND NOTEHOLDERS
70 Australian Foundation Investment Company Limited Annual Report 2016
For
per
sona
l use
onl
y
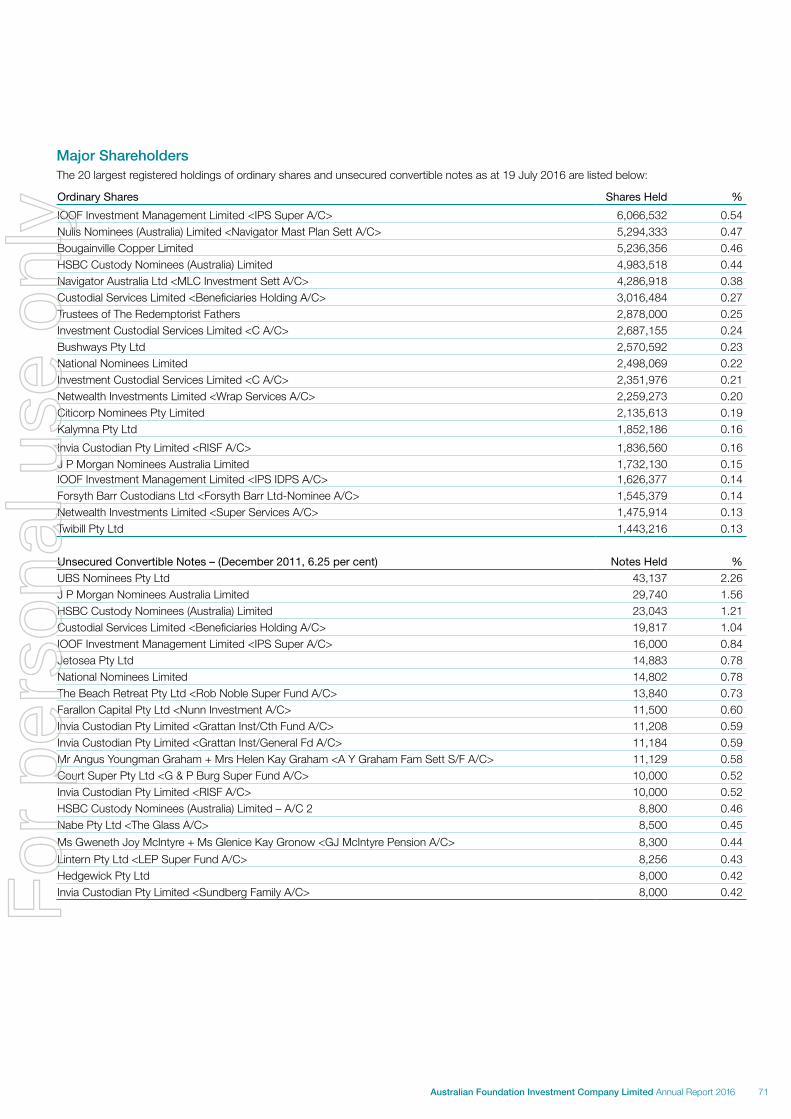
Major ShareholdersThe 20 largest registered holdings of ordinary shares and unsecured convertible notes as at 19 July 2016 are listed below:
Ordinary Shares Shares Held %
IOOF Investment Management Limited <IPS Super A/C> 6,066,532 0.54Nulis Nominees (Australia) Limited <Navigator Mast Plan Sett A/C> 5,294,333 0.47Bougainville Copper Limited 5,236,356 0.46HSBC Custody Nominees (Australia) Limited 4,983,518 0.44Navigator Australia Ltd <MLC Investment Sett A/C> 4,286,918 0.38Custodial Services Limited <Beneficiaries Holding A/C> 3,016,484 0.27Trustees of The Redemptorist Fathers 2,878,000 0.25Investment Custodial Services Limited <C A/C> 2,687,155 0.24Bushways Pty Ltd 2,570,592 0.23National Nominees Limited 2,498,069 0.22Investment Custodial Services Limited <C A/C> 2,351,976 0.21Netwealth Investments Limited <Wrap Services A/C> 2,259,273 0.20Citicorp Nominees Pty Limited 2,135,613 0.19Kalymna Pty Ltd 1,852,186 0.16
Invia Custodian Pty Limited <RISF A/C> 1,836,560 0.16J P Morgan Nominees Australia Limited 1,732,130 0.15IOOF Investment Management Limited <IPS IDPS A/C> 1,626,377 0.14Forsyth Barr Custodians Ltd <Forsyth Barr Ltd-Nominee A/C> 1,545,379 0.14Netwealth Investments Limited <Super Services A/C> 1,475,914 0.13Twibill Pty Ltd 1,443,216 0.13
Unsecured Convertible Notes – (December 2011, 6.25 per cent) Notes Held %
UBS Nominees Pty Ltd 43,137 2.26J P Morgan Nominees Australia Limited 29,740 1.56HSBC Custody Nominees (Australia) Limited 23,043 1.21Custodial Services Limited <Beneficiaries Holding A/C> 19,817 1.04IOOF Investment Management Limited <IPS Super A/C> 16,000 0.84Jetosea Pty Ltd 14,883 0.78National Nominees Limited 14,802 0.78The Beach Retreat Pty Ltd <Rob Noble Super Fund A/C> 13,840 0.73Farallon Capital Pty Ltd <Nunn Investment A/C> 11,500 0.60Invia Custodian Pty Limited <Grattan Inst/Cth Fund A/C> 11,208 0.59Invia Custodian Pty Limited <Grattan Inst/General Fd A/C> 11,184 0.59Mr Angus Youngman Graham + Mrs Helen Kay Graham <A Y Graham Fam Sett S/F A/C> 11,129 0.58Court Super Pty Ltd <G & P Burg Super Fund A/C> 10,000 0.52Invia Custodian Pty Limited <RISF A/C> 10,000 0.52HSBC Custody Nominees (Australia) Limited – A/C 2 8,800 0.46Nabe Pty Ltd <The Glass A/C> 8,500 0.45
Ms Gweneth Joy McIntyre + Ms Glenice Kay Gronow <GJ McIntyre Pension A/C> 8,300 0.44
Lintern Pty Ltd <LEP Super Fund A/C> 8,256 0.43Hedgewick Pty Ltd 8,000 0.42Invia Custodian Pty Limited <Sundberg Family A/C> 8,000 0.42
71Australian Foundation Investment Company Limited Annual Report 2016
For
per
sona
l use
onl
y
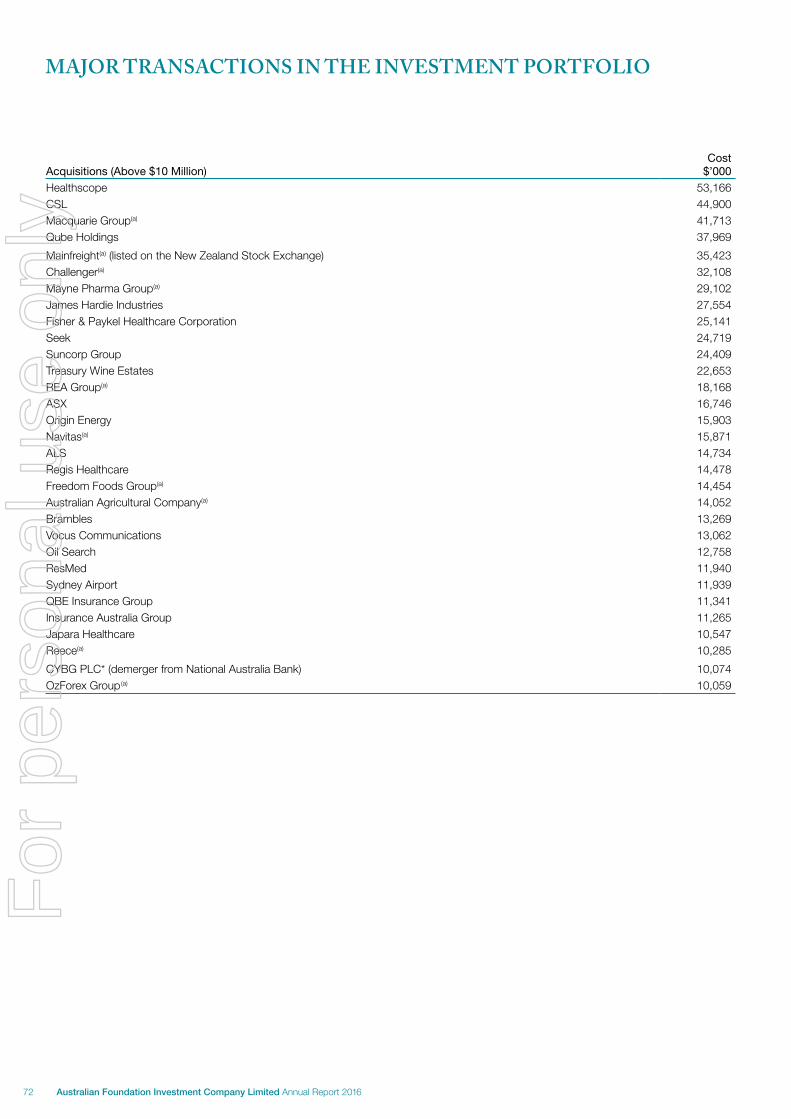
MAJOR TRANSACTIONS IN THE INVESTMENT PORTFOLIO
Acquisitions (Above $10 Million)Cost
$’000
Healthscope 53,166CSL 44,900Macquarie Group(a) 41,713Qube Holdings 37,969
Mainfreight(a) (listed on the New Zealand Stock Exchange) 35,423Challenger(a) 32,108Mayne Pharma Group(a) 29,102James Hardie Industries 27,554Fisher & Paykel Healthcare Corporation 25,141Seek 24,719Suncorp Group 24,409Treasury Wine Estates 22,653REA Group(a) 18,168ASX 16,746Origin Energy 15,903Navitas(a) 15,871ALS 14,734Regis Healthcare 14,478Freedom Foods Group(a) 14,454Australian Agricultural Company(a) 14,052Brambles 13,269Vocus Communications 13,062Oil Search 12,758ResMed 11,940Sydney Airport 11,939QBE Insurance Group 11,341Insurance Australia Group 11,265Japara Healthcare 10,547Reece(a) 10,285
CYBG PLC* (demerger from National Australia Bank) 10,074OzForex Group(a) 10,059
72 Australian Foundation Investment Company Limited Annual Report 2016
For
per
sona
l use
onl
y
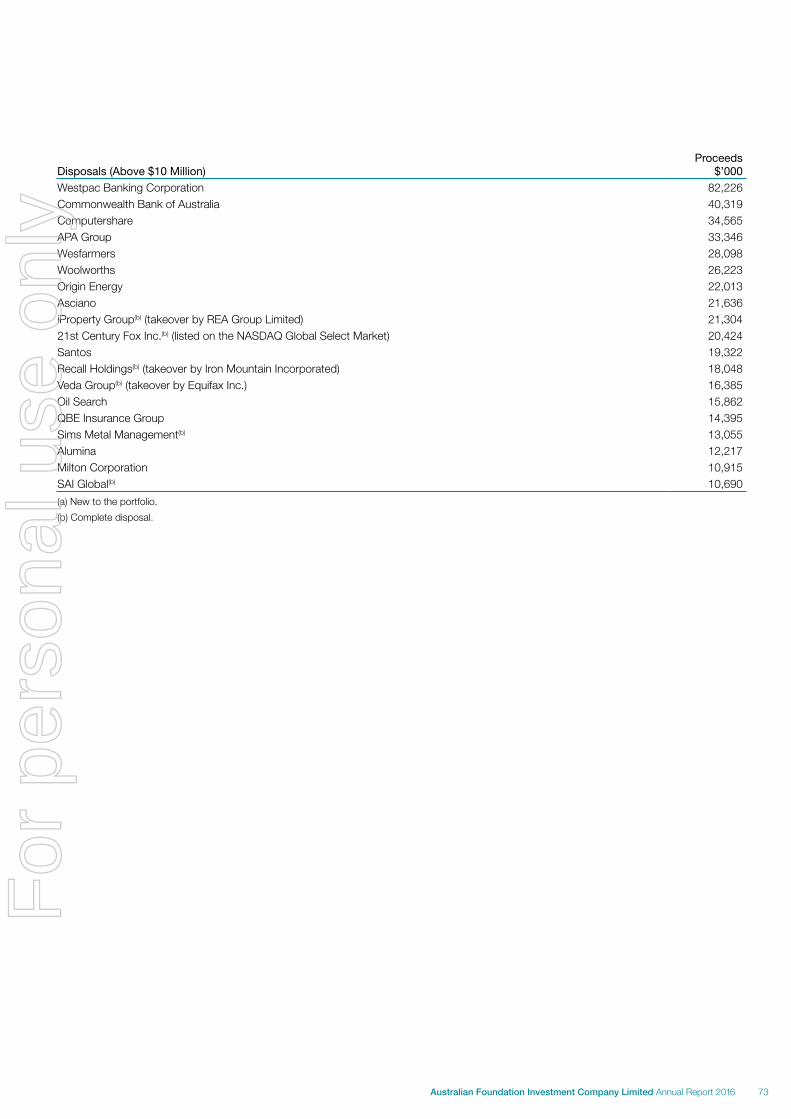
Disposals (Above $10 Million)Proceeds
$’000
Westpac Banking Corporation 82,226Commonwealth Bank of Australia 40,319Computershare 34,565APA Group 33,346Wesfarmers 28,098Woolworths 26,223Origin Energy 22,013Asciano 21,636iProperty Group(b) (takeover by REA Group Limited) 21,30421st Century Fox Inc.(b) (listed on the NASDAQ Global Select Market) 20,424Santos 19,322Recall Holdings(b) (takeover by Iron Mountain Incorporated) 18,048Veda Group(b) (takeover by Equifax Inc.) 16,385Oil Search 15,862QBE Insurance Group 14,395Sims Metal Management(b) 13,055Alumina 12,217Milton Corporation 10,915SAI Global(b) 10,690
(a) New to the portfolio.
(b) Complete disposal.
73Australian Foundation Investment Company Limited Annual Report 2016
For
per
sona
l use
onl
y
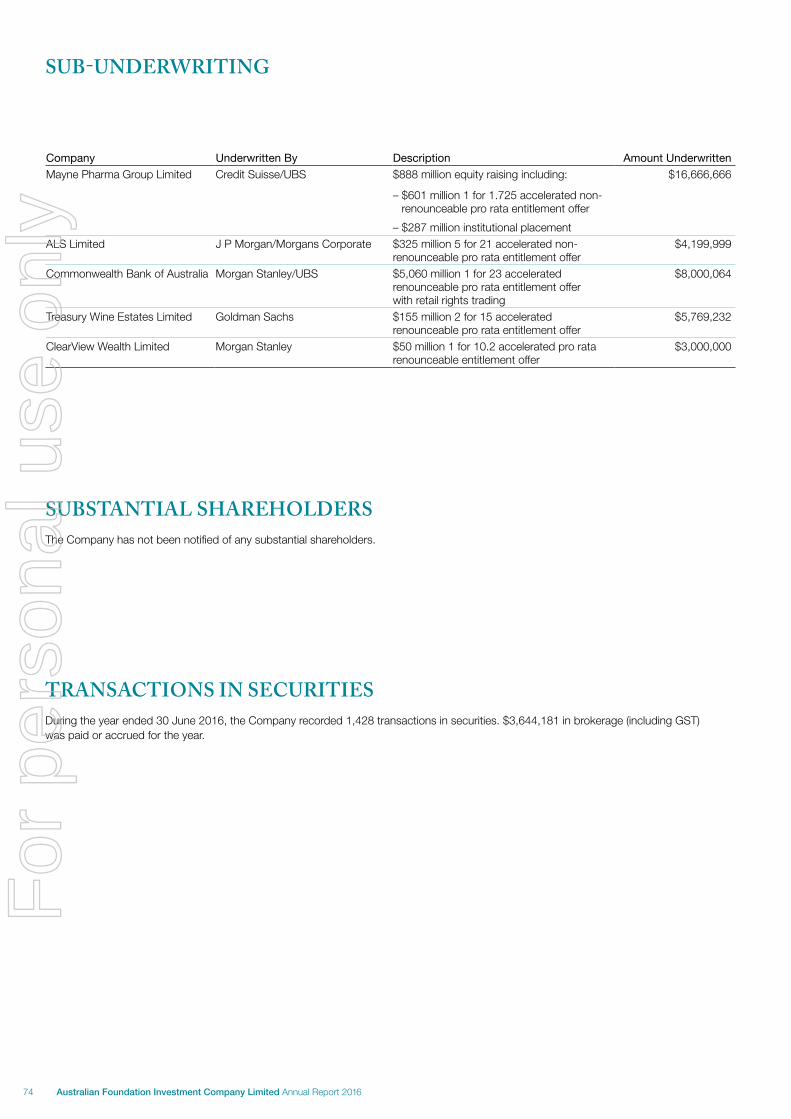
SUB-UNDERWRITING
Company Underwritten By Description Amount Underwritten
Mayne Pharma Group Limited Credit Suisse/UBS $888 million equity raising including:
– $601 million 1 for 1.725 accelerated non-renounceable pro rata entitlement offer
– $287 million institutional placement
$16,666,666
ALS Limited J P Morgan/Morgans Corporate $325 million 5 for 21 accelerated non-renounceable pro rata entitlement offer
$4,199,999
Commonwealth Bank of Australia Morgan Stanley/UBS $5,060 million 1 for 23 accelerated renounceable pro rata entitlement offer with retail rights trading
$8,000,064
Treasury Wine Estates Limited Goldman Sachs $155 million 2 for 15 accelerated renounceable pro rata entitlement offer
$5,769,232
ClearView Wealth Limited Morgan Stanley $50 million 1 for 10.2 accelerated pro rata renounceable entitlement offer
$3,000,000
SUBSTANTIAL SHAREHOLDERSThe Company has not been notified of any substantial shareholders.
TRANSACTIONS IN SECURITIES During the year ended 30 June 2016, the Company recorded 1,428 transactions in securities. $3,644,181 in brokerage (including GST) was paid or accrued for the year.
74 Australian Foundation Investment Company Limited Annual Report 2016
For
per
sona
l use
onl
y
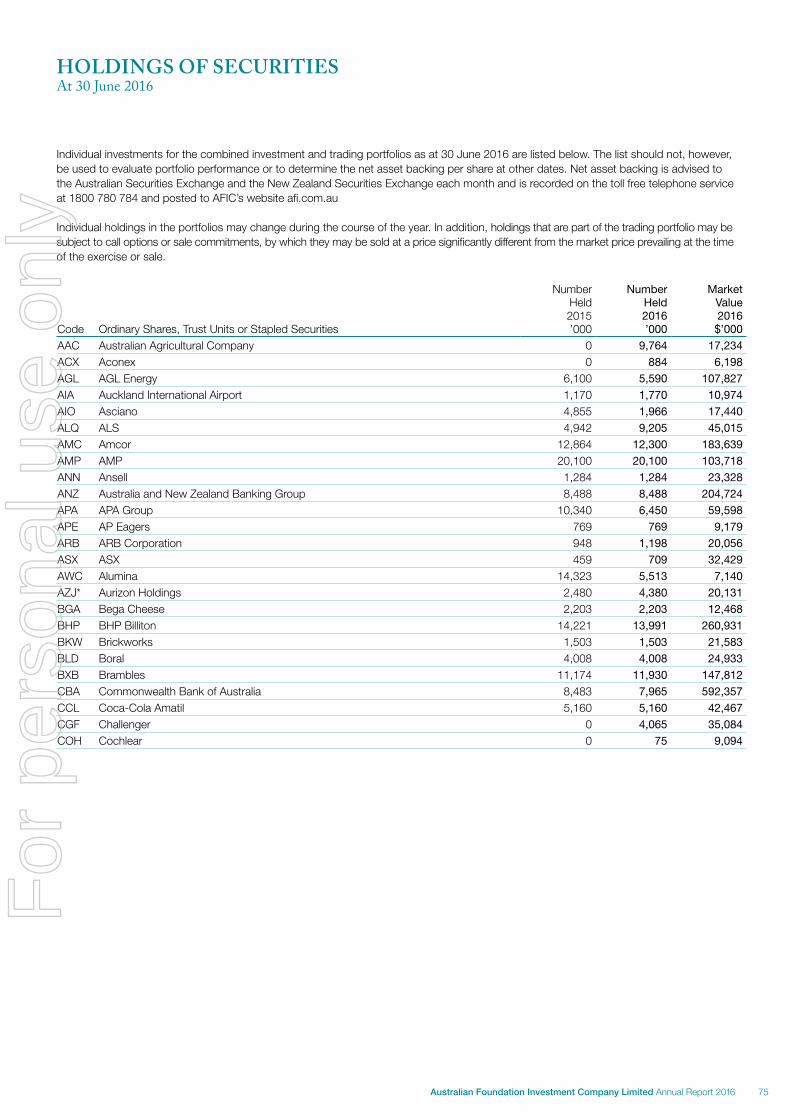
HOLDINGS OF SECURITIESAt 30 June 2016
Individual investments for the combined investment and trading portfolios as at 30 June 2016 are listed below. The list should not, however, be used to evaluate portfolio performance or to determine the net asset backing per share at other dates. Net asset backing is advised to the Australian Securities Exchange and the New Zealand Securities Exchange each month and is recorded on the toll free telephone service at 1800 780 784 and posted to AFIC’s website afi.com.au
Individual holdings in the portfolios may change during the course of the year. In addition, holdings that are part of the trading portfolio may be subject to call options or sale commitments, by which they may be sold at a price significantly different from the market price prevailing at the time of the exercise or sale.
Code Ordinary Shares, Trust Units or Stapled Securities
Number Held 2015 ’000
Number Held 2016 ’000
Market Value 2016 $’000
AAC Australian Agricultural Company 0 9,764 17,234
ACX Aconex 0 884 6,198
AGL AGL Energy 6,100 5,590 107,827
AIA Auckland International Airport 1,170 1,770 10,974
AIO Asciano 4,855 1,966 17,440
ALQ ALS 4,942 9,205 45,015
AMC Amcor 12,864 12,300 183,639
AMP AMP 20,100 20,100 103,718
ANN Ansell 1,284 1,284 23,328
ANZ Australia and New Zealand Banking Group 8,488 8,488 204,724
APA APA Group 10,340 6,450 59,598
APE AP Eagers 769 769 9,179
ARB ARB Corporation 948 1,198 20,056
ASX ASX 459 709 32,429
AWC Alumina 14,323 5,513 7,140
AZJ* Aurizon Holdings 2,480 4,380 20,131
BGA Bega Cheese 2,203 2,203 12,468
BHP BHP Billiton 14,221 13,991 260,931
BKW Brickworks 1,503 1,503 21,583
BLD Boral 4,008 4,008 24,933
BXB Brambles 11,174 11,930 147,812
CBA Commonwealth Bank of Australia 8,483 7,965 592,357
CCL Coca-Cola Amatil 5,160 5,160 42,467
CGF Challenger 0 4,065 35,084
COH Cochlear 0 75 9,094
75Australian Foundation Investment Company Limited Annual Report 2016
For
per
sona
l use
onl
y
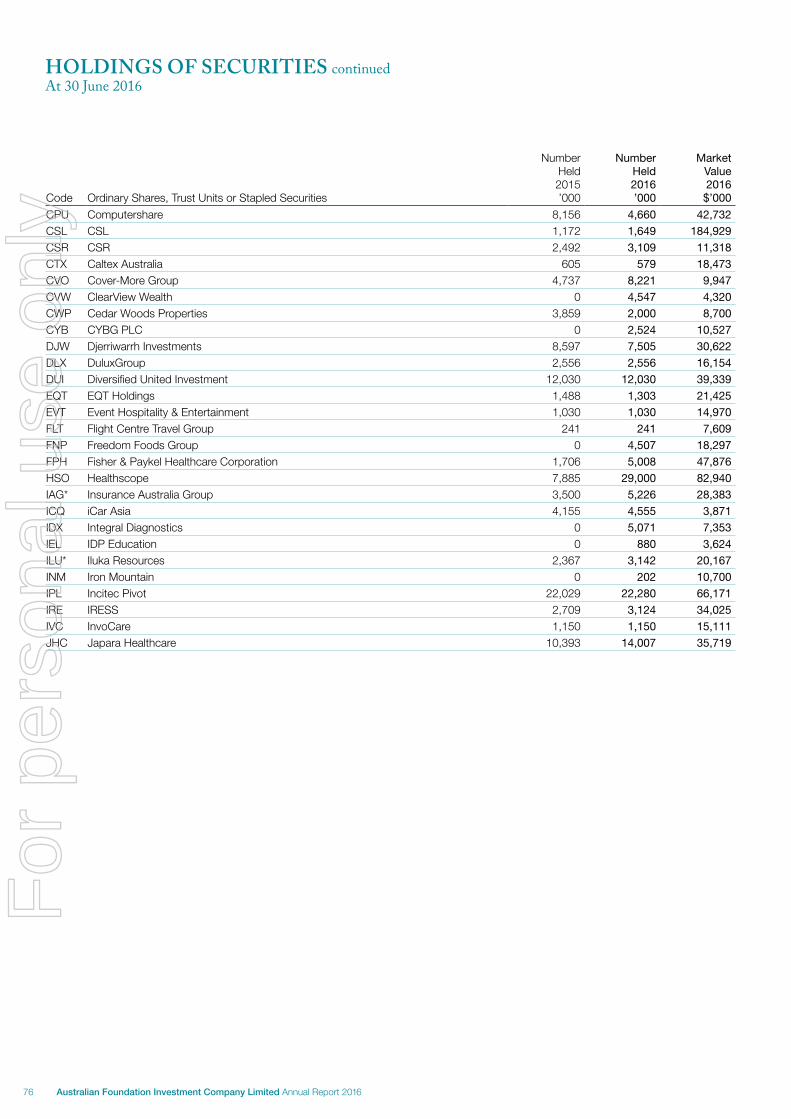
Code Ordinary Shares, Trust Units or Stapled Securities
Number Held 2015 ’000
Number Held 2016 ’000
Market Value 2016 $’000
CPU Computershare 8,156 4,660 42,732
CSL CSL 1,172 1,649 184,929
CSR CSR 2,492 3,109 11,318
CTX Caltex Australia 605 579 18,473
CVO Cover-More Group 4,737 8,221 9,947
CVW ClearView Wealth 0 4,547 4,320
CWP Cedar Woods Properties 3,859 2,000 8,700
CYB CYBG PLC 0 2,524 10,527
DJW Djerriwarrh Investments 8,597 7,505 30,622
DLX DuluxGroup 2,556 2,556 16,154
DUI Diversified United Investment 12,030 12,030 39,339
EQT EQT Holdings 1,488 1,303 21,425
EVT Event Hospitality & Entertainment 1,030 1,030 14,970
FLT Flight Centre Travel Group 241 241 7,609
FNP Freedom Foods Group 0 4,507 18,297
FPH Fisher & Paykel Healthcare Corporation 1,706 5,008 47,876
HSO Healthscope 7,885 29,000 82,940
IAG* Insurance Australia Group 3,500 5,226 28,383
ICQ iCar Asia 4,155 4,555 3,871
IDX Integral Diagnostics 0 5,071 7,353
IEL IDP Education 0 880 3,624
ILU* Iluka Resources 2,367 3,142 20,167
INM Iron Mountain 0 202 10,700
IPL Incitec Pivot 22,029 22,280 66,171
IRE IRESS 2,709 3,124 34,025
IVC InvoCare 1,150 1,150 15,111
JHC Japara Healthcare 10,393 14,007 35,719
HOLDINGS OF SECURITIES continuedAt 30 June 2016
76 Australian Foundation Investment Company Limited Annual Report 2016
For
per
sona
l use
onl
y
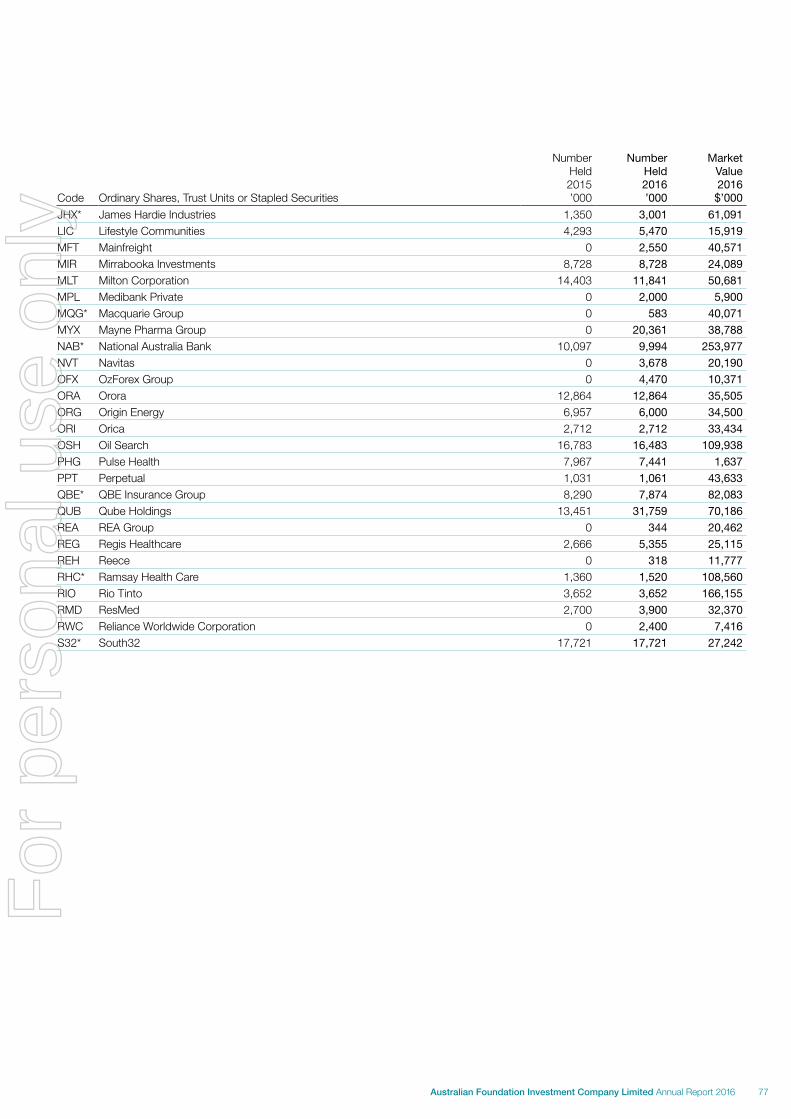
Code Ordinary Shares, Trust Units or Stapled Securities
Number Held 2015 ’000
Number Held 2016 ’000
Market Value 2016 $’000
JHX* James Hardie Industries 1,350 3,001 61,091
LIC Lifestyle Communities 4,293 5,470 15,919
MFT Mainfreight 0 2,550 40,571
MIR Mirrabooka Investments 8,728 8,728 24,089
MLT Milton Corporation 14,403 11,841 50,681
MPL Medibank Private 0 2,000 5,900
MQG* Macquarie Group 0 583 40,071
MYX Mayne Pharma Group 0 20,361 38,788
NAB* National Australia Bank 10,097 9,994 253,977
NVT Navitas 0 3,678 20,190
OFX OzForex Group 0 4,470 10,371
ORA Orora 12,864 12,864 35,505
ORG Origin Energy 6,957 6,000 34,500
ORI Orica 2,712 2,712 33,434
OSH Oil Search 16,783 16,483 109,938
PHG Pulse Health 7,967 7,441 1,637
PPT Perpetual 1,031 1,061 43,633
QBE* QBE Insurance Group 8,290 7,874 82,083
QUB Qube Holdings 13,451 31,759 70,186
REA REA Group 0 344 20,462
REG Regis Healthcare 2,666 5,355 25,115
REH Reece 0 318 11,777
RHC* Ramsay Health Care 1,360 1,520 108,560
RIO Rio Tinto 3,652 3,652 166,155
RMD ResMed 2,700 3,900 32,370
RWC Reliance Worldwide Corporation 0 2,400 7,416
S32* South32 17,721 17,721 27,242
77Australian Foundation Investment Company Limited Annual Report 2016
For
per
sona
l use
onl
y
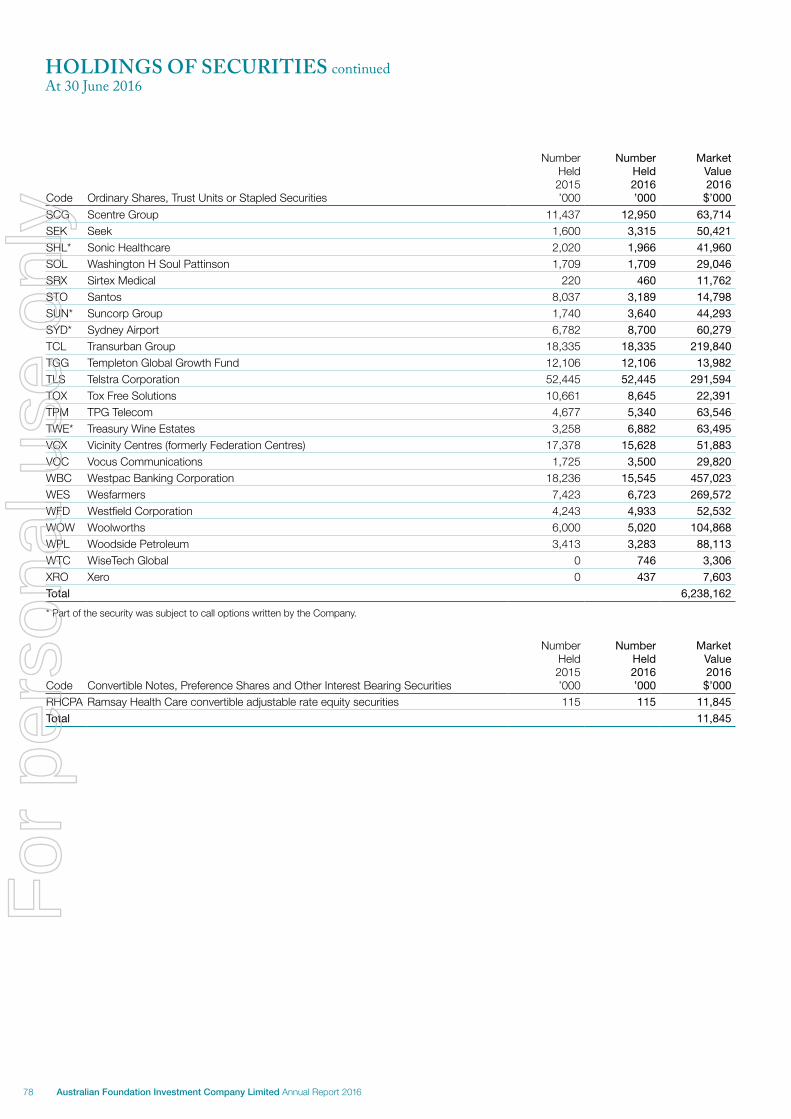
Code Ordinary Shares, Trust Units or Stapled Securities
Number Held 2015 ’000
Number Held 2016 ’000
Market Value 2016 $’000
SCG Scentre Group 11,437 12,950 63,714
SEK Seek 1,600 3,315 50,421
SHL* Sonic Healthcare 2,020 1,966 41,960
SOL Washington H Soul Pattinson 1,709 1,709 29,046
SRX Sirtex Medical 220 460 11,762
STO Santos 8,037 3,189 14,798
SUN* Suncorp Group 1,740 3,640 44,293
SYD* Sydney Airport 6,782 8,700 60,279
TCL Transurban Group 18,335 18,335 219,840
TGG Templeton Global Growth Fund 12,106 12,106 13,982
TLS Telstra Corporation 52,445 52,445 291,594
TOX Tox Free Solutions 10,661 8,645 22,391
TPM TPG Telecom 4,677 5,340 63,546
TWE* Treasury Wine Estates 3,258 6,882 63,495
VCX Vicinity Centres (formerly Federation Centres) 17,378 15,628 51,883
VOC Vocus Communications 1,725 3,500 29,820
WBC Westpac Banking Corporation 18,236 15,545 457,023
WES Wesfarmers 7,423 6,723 269,572
WFD Westfield Corporation 4,243 4,933 52,532
WOW Woolworths 6,000 5,020 104,868
WPL Woodside Petroleum 3,413 3,283 88,113
WTC WiseTech Global 0 746 3,306
XRO Xero 0 437 7,603
Total 6,238,162
* Part of the security was subject to call options written by the Company.
Code Convertible Notes, Preference Shares and Other Interest Bearing Securities
Number Held 2015 ’000
Number Held 2016 ’000
Market Value 2016 $’000
RHCPA Ramsay Health Care convertible adjustable rate equity securities 115 115 11,845
Total 11,845
HOLDINGS OF SECURITIES continuedAt 30 June 2016
78 Australian Foundation Investment Company Limited Annual Report 2016
For
per
sona
l use
onl
y
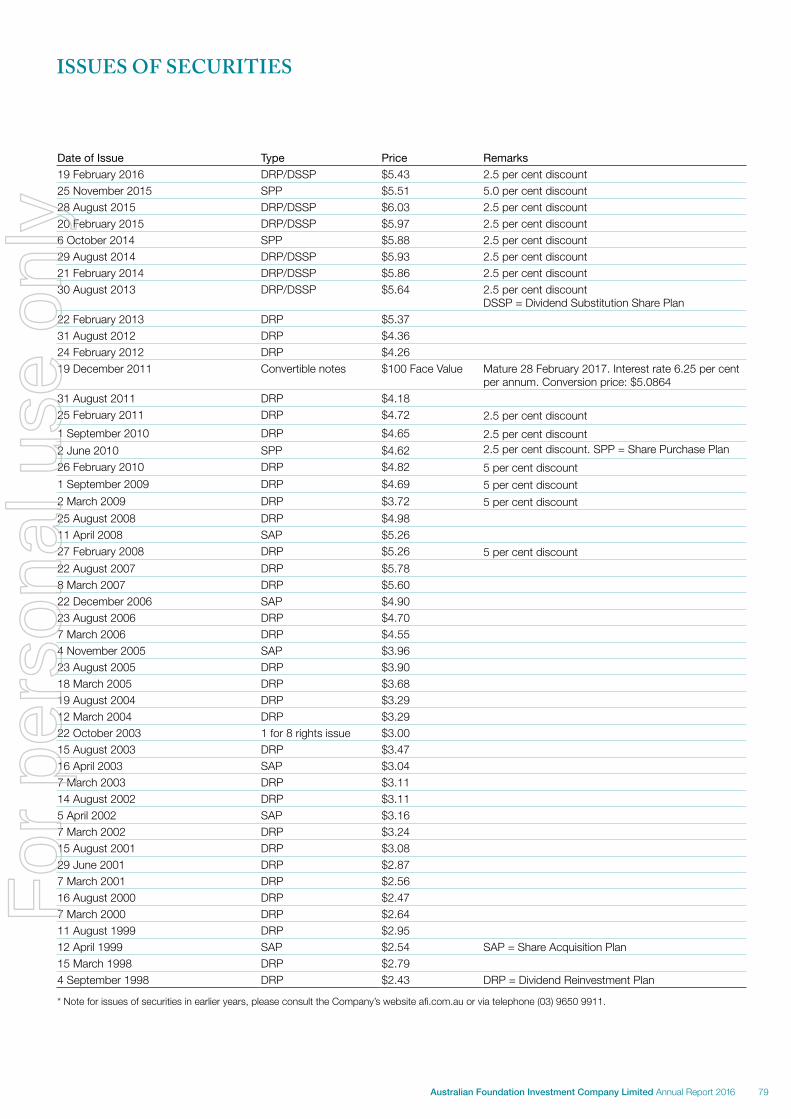
ISSUES OF SECURITIES
Date of Issue Type Price Remarks
19 February 2016 DRP/DSSP $5.43 2.5 per cent discount25 November 2015 SPP $5.51 5.0 per cent discount28 August 2015 DRP/DSSP $6.03 2.5 per cent discount20 February 2015 DRP/DSSP $5.97 2.5 per cent discount6 October 2014 SPP $5.88 2.5 per cent discount29 August 2014 DRP/DSSP $5.93 2.5 per cent discount21 February 2014 DRP/DSSP $5.86 2.5 per cent discount30 August 2013 DRP/DSSP $5.64 2.5 per cent discount
DSSP = Dividend Substitution Share Plan22 February 2013 DRP $5.3731 August 2012 DRP $4.3624 February 2012 DRP $4.2619 December 2011 Convertible notes $100 Face Value Mature 28 February 2017. Interest rate 6.25 per cent
per annum. Conversion price: $5.086431 August 2011 DRP $4.1825 February 2011 DRP $4.72 2.5 per cent discount
1 September 2010 DRP $4.65 2.5 per cent discount2 June 2010 SPP $4.62 2.5 per cent discount. SPP = Share Purchase Plan
26 February 2010 DRP $4.82 5 per cent discount1 September 2009 DRP $4.69 5 per cent discount2 March 2009 DRP $3.72 5 per cent discount25 August 2008 DRP $4.9811 April 2008 SAP $5.2627 February 2008 DRP $5.26 5 per cent discount 22 August 2007 DRP $5.788 March 2007 DRP $5.6022 December 2006 SAP $4.9023 August 2006 DRP $4.707 March 2006 DRP $4.554 November 2005 SAP $3.9623 August 2005 DRP $3.9018 March 2005 DRP $3.6819 August 2004 DRP $3.29 12 March 2004 DRP $3.29 22 October 2003 1 for 8 rights issue $3.00 15 August 2003 DRP $3.47 16 April 2003 SAP $3.04 7 March 2003 DRP $3.11 14 August 2002 DRP $3.11 5 April 2002 SAP $3.167 March 2002 DRP $3.24 15 August 2001 DRP $3.08 29 June 2001 DRP $2.87 7 March 2001 DRP $2.56 16 August 2000 DRP $2.47 7 March 2000 DRP $2.64 11 August 1999 DRP $2.95 12 April 1999 SAP $2.54 SAP = Share Acquisition Plan15 March 1998 DRP $2.79 4 September 1998 DRP $2.43 DRP = Dividend Reinvestment Plan
* Note for issues of securities in earlier years, please consult the Company’s website afi.com.au or via telephone (03) 9650 9911.
79Australian Foundation Investment Company Limited Annual Report 2016
For
per
sona
l use
onl
y
COMPANY PARTICULARS
Australian Foundation Investment Company Limited (AFIC)ABN 56 004 147 120
DirectorsTerrence A Campbell AO, ChairmanRoss E Barker, Managing DirectorJacqueline C HeyGraeme R LiebeltJohn PatersonDavid A PeeverCatherine M Walter AMPeter J Williams
Company SecretariesMatthew J RoweAndrew JB Porter
AuditorPricewaterhouseCoopersChartered Accountants
Country of IncorporationAustralia
Registered Office and Mailing AddressLevel 21, 101 Collins Street Melbourne Victoria 3000
Contact DetailsTelephone (03) 9650 9911Facsimile (03) 9650 9100Email [email protected] afi.com.au
For enquiries regarding net asset backing (as advised each month to the Australian Securities Exchange and the New Zealand Securities Exchange):
Telephone 1800 780 784 (toll free)
Share Registrar AustraliaComputershare Investor Services Pty LtdYarra Falls, 452 Johnston StreetAbbotsford Victoria 3067
New ZealandComputershare Investor Services Pty Ltd159 Hurstmere Road Takapuna Auckland 0622
ShareholderEnquiry Lines 1300 662 270 (Australia) 0800 333 501 (from New Zealand) +61 3 9415 4373 (from overseas)Facsimile (03) 9473 2500Website investorcentre.com.au/contact
For all enquiries relating to shareholdings, noteholdings, dividends and related matters, please contact the Share Registrar as above.
Australian and New Zealand Securities Exchange CodesAFI Ordinary shares (ASX and NZX)AFIG Unsecured convertible notes (ASX)
80 Australian Foundation Investment Company Limited Annual Report 2016
For
per
sona
l use
onl
y
SHAREHOLDER MEETINGS
Annual General Meeting Time 10.00amDate Wednesday 12 October 2016Venue RACV City ClubLocation 501 Bourke Street Melbourne
Sydney MeetingTime 10.00amDate Friday 14 October 2016Venue Four Seasons HotelLocation 199 George Street Sydney
Adelaide MeetingTime 10.00am Date Monday 17 October 2016Venue Adelaide Convention CentreLocation North Terrace Adelaide
Brisbane MeetingTime 10.00amDate Monday 24 October 2016Venue Hilton HotelLocation 190 Elizabeth Street Brisbane
Auckland MeetingTime 10.00amDate Monday 5 December 2016Venue Hilton HotelLocation 147 Quay Street Auckland
Australian Foundation Investment Company Limited Annual Report 2016 81
For
per
sona
l use
onl
y

Design: MDM Investor Connect. Printed on environmentally friendly paper.
For
per
sona
l use
onl
y
Annual Review 2016
EXPERIENCE INCOME GROWTH
For
per
sona
l use
onl
y
CONTENTS The Company’s primary investment goals are:
To provide attractive total returns over the medium to long term.
To pay dividends which, over time, grow faster than the rate of inflation.
1 Year in Summary
2 Review of Operations and Activities
14 Top 25 Investments
15 Income Statement
16 Balance Sheet
17 Summarised Statement of Changes in Equity
18 Holdings of Securities
25 Major Transactions in the Investment Portfolio
27 5 Year Summary
28 Company Particulars
29 Shareholder Meetings
The Company aims to provide shareholders with attractive investment returns through access to a growing stream of fully franked dividends and enhancement of capital invested.
Australian Foundation Investment Company Limited ABN 56 004 147 120
For
per
sona
l use
onl
y
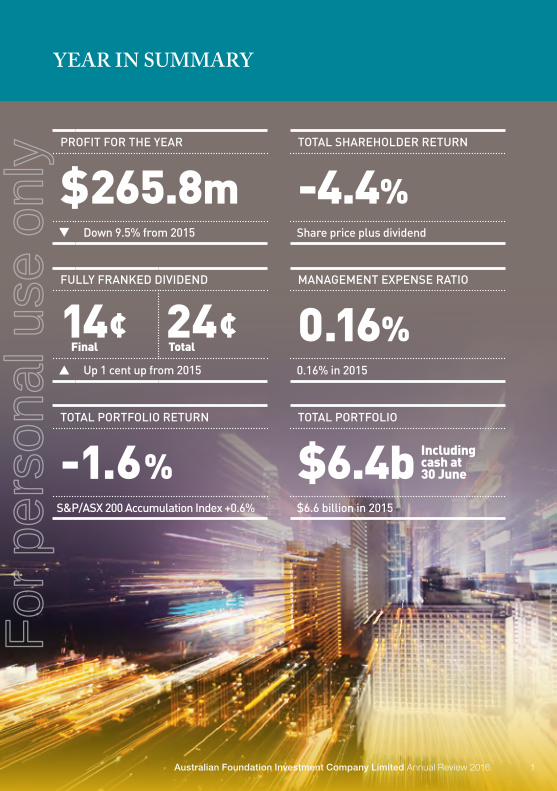
YEAR IN SUMMARY
PROFIT FOR THE YEAR
$265.8mDown 9.5% from 2015
FULLY FRANKED DIVIDEND
14¢ Final24¢ Total
Up 1 cent up from 2015
TOTAL PORTFOLIO RETURN
-1.6%
S&P/ASX 200 Accumulation Index +0.6%
TOTAL SHAREHOLDER RETURN
-4.4%
Share price plus dividend
MANAGEMENT EXPENSE RATIO
0.16%
0.16% in 2015
TOTAL PORTFOLIO
$6.4b $6.6 billion in 2015
Including cash at 30 June
1Australian Foundation Investment Company Limited Annual Review 2016
For
per
sona
l use
onl
y
ProfitProfit for the year to 30 June 2016 was $265.8 million, down from $293.6 million the prior year. Last year’s figure included a special non-cash dividend of $31.9 million received from the demerger of South32 from BHP Billiton. Excluding this item the profit was up 1.5 per cent.
Income from investments (excluding demerger dividends), which consists primarily of franked dividends, was up 0.1 per cent over the year. In volatile markets, there was an increased use of the trading portfolio which contributed $12.3 million compared to $8.4 million last year.
Earnings per share for the year were 23.8 cents per share compared with 27.2 cents per share last year.
DividendThe Company has maintained its final dividend at 14 cents per share fully franked. Total dividends for the year are 24 cents per share fully franked, up 1 cent from 23 cents last year. The increase was made in the interim dividend paid in February.
One of the key objectives of AFIC is to grow the dividend over time. Figure 1 highlights AFIC’s dividend growth over various periods. This also incorporates the period where companies substantially reduced their dividends during the GFC from late 2007 to 2009.
Market and Portfolio PerformanceThe Fifty Leaders segment of the market was down 2.6 per cent over the year. Within this segment materials and energy have been impacted by low commodity and energy prices. The banking sector has also declined as there are concerns about profit growth in a slow economy and the potential for increasing bad debts. In stark contrast the combined Small and Mid Cap 50 sectors produced a positive return of 16.1 per cent. In particular, interest rate sensitive areas such as the Real Estate Investment Trusts (REITs) and utility stocks were up strongly over the year. Many small and mid-sized resources were also strong, particularly gold companies. AFIC does not have large exposure to REITs given the general lack of franked income and lower longer term returns than industrial companies. The Company also has no exposure to the small resources sector because of its highly speculative nature.
REVIEW OF OPERATIONS AND ACTIVITIES
2
For
per
sona
l use
onl
y
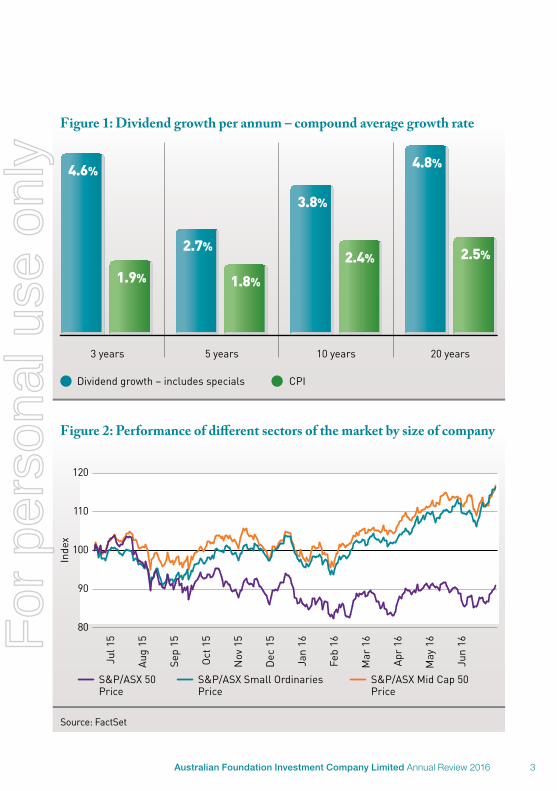
4.6%
1.9%
2.7%
1.8%
3.8%
2.4%
X.X%4.8%
2.5%
Figure 1: Dividend growth per annum – compound average growth rate
20 years
Dividend growth – includes specials CPI
3 years 5 years 10 years
Figure 2: Performance of di�erent sectors of the market by size of company
S&P/ASX 50Price
S&P/ASX Small OrdinariesPrice
S&P/ASX Mid Cap 50Price
May
16
Apr
16
Mar
16
Feb
16
Jan
16
Dec
15
Jun
16
Nov
15
Oct
15
Sep
15
Aug
15
Jul 1
5
80
120
90
100
Inde
x
110
Source: FactSet
3Australian Foundation Investment Company Limited Annual Review 2016
For
per
sona
l use
onl
y
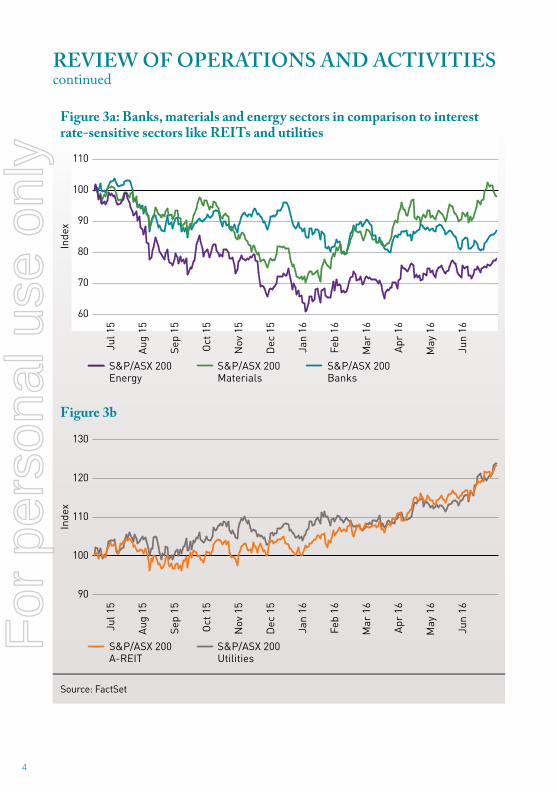
REVIEW OF OPERATIONS AND ACTIVITIEScontinued
Figure 3a: Banks, materials and energy sectors in comparison to interest rate-sensitive sectors like REITs and utilities
S&P/ASX 200Energy
S&P/ASX 200Materials
S&P/ASX 200Banks
May
16
Apr
16
Mar
16
Feb
16
Jan
16
Dec
15
Jun
16
Nov
15
Oct
15
Sep
15
Aug
15
Jul 1
5
60
110
70
80Inde
x 90
100
Figure 3b
S&P/ASX 200A-REIT
S&P/ASX 200Utilities
May
16
Apr
16
Mar
16
Feb
16
Jan
16
Dec
15
Jun
16
Nov
15
Oct
15
Sep
15
Aug
15
Jul 1
5
90
130
100
110
Inde
x
120
Source: FactSet
4
For
per
sona
l use
onl
y
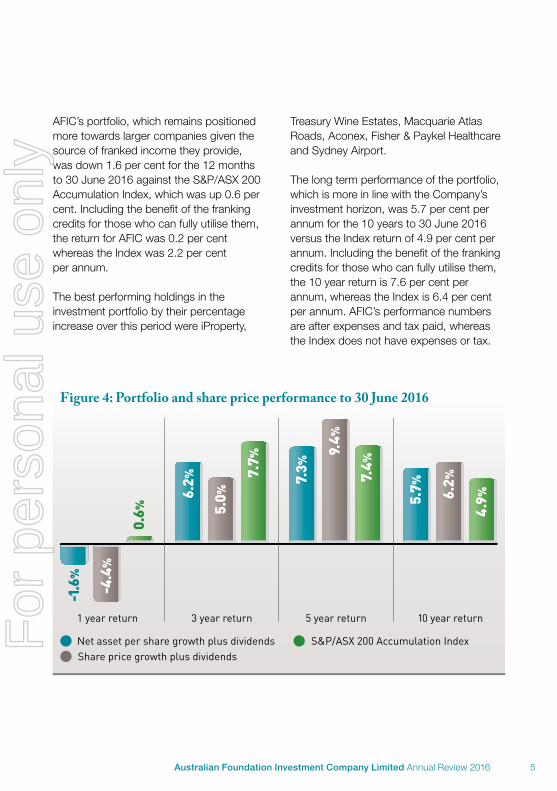
AFIC’s portfolio, which remains positioned more towards larger companies given the source of franked income they provide, was down 1.6 per cent for the 12 months to 30 June 2016 against the S&P/ASX 200 Accumulation Index, which was up 0.6 per cent. Including the benefit of the franking credits for those who can fully utilise them, the return for AFIC was 0.2 per cent whereas the Index was 2.2 per cent per annum.
The best performing holdings in the investment portfolio by their percentage increase over this period were iProperty,
Treasury Wine Estates, Macquarie Atlas Roads, Aconex, Fisher & Paykel Healthcare and Sydney Airport.
The long term performance of the portfolio, which is more in line with the Company’s investment horizon, was 5.7 per cent per annum for the 10 years to 30 June 2016 versus the Index return of 4.9 per cent per annum. Including the benefit of the franking credits for those who can fully utilise them, the 10 year return is 7.6 per cent per annum, whereas the Index is 6.4 per cent per annum. AFIC’s performance numbers are after expenses and tax paid, whereas the Index does not have expenses or tax.
Figure 4: Portfolio and share price performance to 30 June 2016
10 year return
Net asset per share growth plus dividends S&P/ASX 200 Accumulation IndexShare price growth plus dividends
1 year return 3 year return 5 year return
7.7%
6.2%
5.0%
0.6%
-1.6%
5.7% 6.2%
4.9%
7.3%
9.4%
7.4%
-4.4%
5Australian Foundation Investment Company Limited Annual Review 2016
For
per
sona
l use
onl
y

6
For
per
sona
l use
onl
y
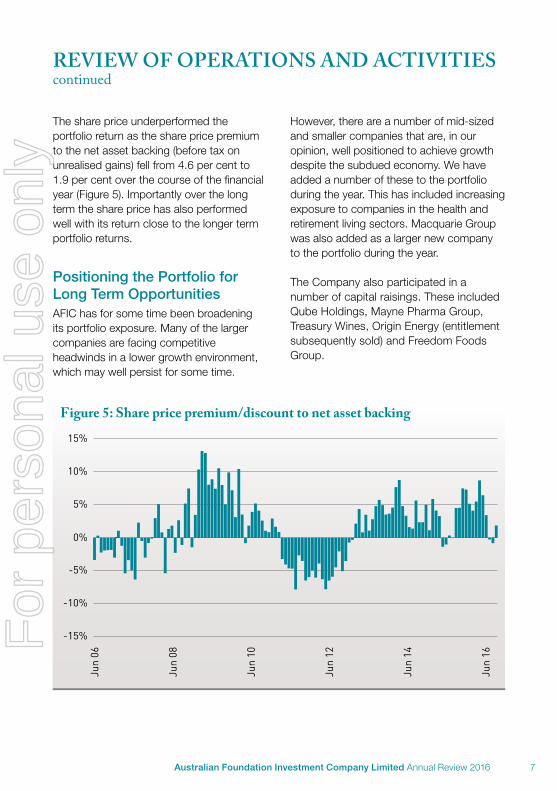
The share price underperformed the portfolio return as the share price premium to the net asset backing (before tax on unrealised gains) fell from 4.6 per cent to 1.9 per cent over the course of the financial year (Figure 5). Importantly over the long term the share price has also performed well with its return close to the longer term portfolio returns.
Positioning the Portfolio for Long Term OpportunitiesAFIC has for some time been broadening its portfolio exposure. Many of the larger companies are facing competitive headwinds in a lower growth environment, which may well persist for some time.
However, there are a number of mid-sized and smaller companies that are, in our opinion, well positioned to achieve growth despite the subdued economy. We have added a number of these to the portfolio during the year. This has included increasing exposure to companies in the health and retirement living sectors. Macquarie Group was also added as a larger new company to the portfolio during the year.
The Company also participated in a number of capital raisings. These included Qube Holdings, Mayne Pharma Group, Treasury Wines, Origin Energy (entitlement subsequently sold) and Freedom Foods Group.
REVIEW OF OPERATIONS AND ACTIVITIEScontinued
Figure 5: Share price premium/discount to net asset backing
15%
-15%
-10%
-5%
0%
5%
10%
Jun
06
Jun
08
Jun
10
Jun
12
Jun
14
Jun
16
7Australian Foundation Investment Company Limited Annual Review 2016
For
per
sona
l use
onl
y
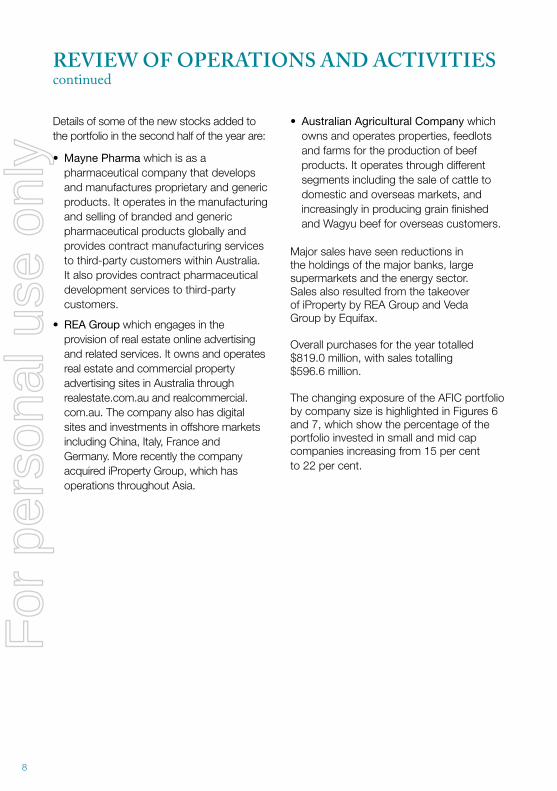
Details of some of the new stocks added to the portfolio in the second half of the year are:
• Mayne Pharma which is as a pharmaceutical company that develops and manufactures proprietary and generic products. It operates in the manufacturing and selling of branded and generic pharmaceutical products globally and provides contract manufacturing services to third-party customers within Australia. It also provides contract pharmaceutical development services to third-party customers.
• REA Group which engages in the provision of real estate online advertising and related services. It owns and operates real estate and commercial property advertising sites in Australia through realestate.com.au and realcommercial.com.au. The company also has digital sites and investments in offshore markets including China, Italy, France and Germany. More recently the company acquired iProperty Group, which has operations throughout Asia.
• Australian Agricultural Company which owns and operates properties, feedlots and farms for the production of beef products. It operates through different segments including the sale of cattle to domestic and overseas markets, and increasingly in producing grain finished and Wagyu beef for overseas customers.
Major sales have seen reductions in the holdings of the major banks, large supermarkets and the energy sector. Sales also resulted from the takeover of iProperty by REA Group and Veda Group by Equifax.
Overall purchases for the year totalled $819.0 million, with sales totalling $596.6 million.
The changing exposure of the AFIC portfolio by company size is highlighted in Figures 6 and 7, which show the percentage of the portfolio invested in small and mid cap companies increasing from 15 per cent to 22 per cent.
REVIEW OF OPERATIONS AND ACTIVITIEScontinued
8
For
per
sona
l use
onl
y
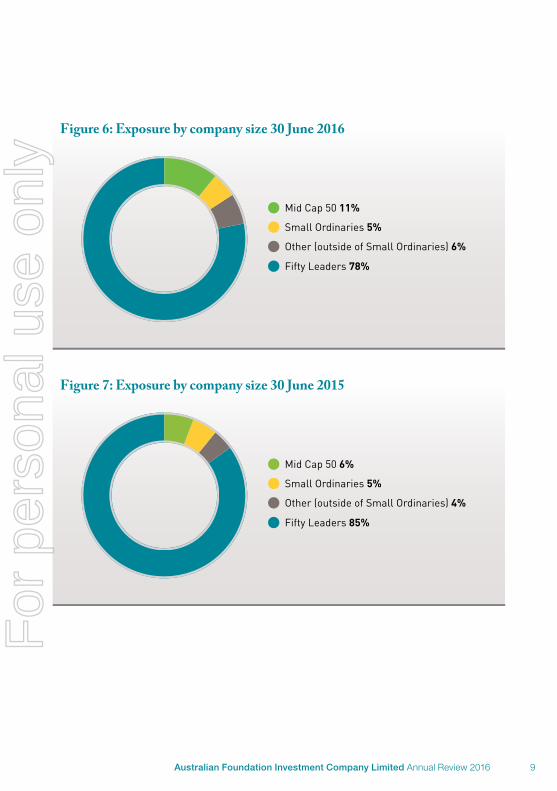
Mid Cap 50 11%
Small Ordinaries 5%
Other (outside of Small Ordinaries) 6%
Fifty Leaders 78%
Figure 6: Exposure by company size 30 June 2016
Mid Cap 50 6%
Small Ordinaries 5%
Other (outside of Small Ordinaries) 4%
Fifty Leaders 85%
Figure 7: Exposure by company size 30 June 2015
9Australian Foundation Investment Company Limited Annual Review 2016
For
per
sona
l use
onl
y
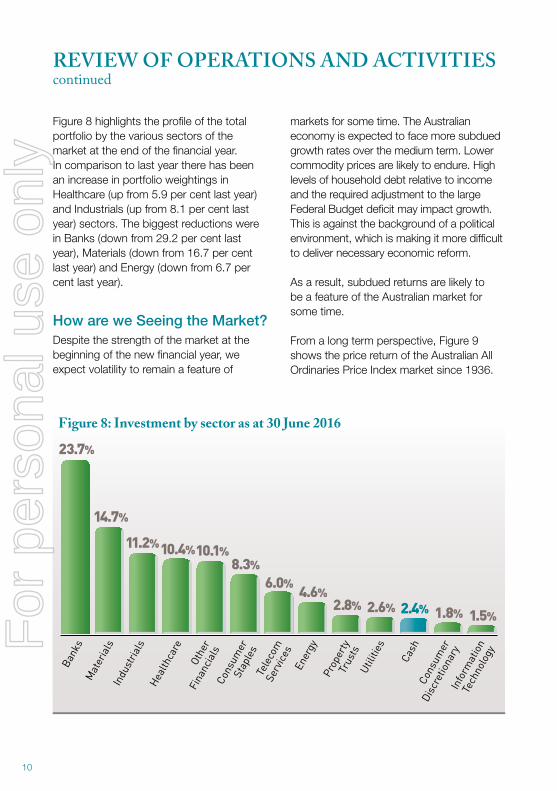
Figure 8 highlights the profile of the total portfolio by the various sectors of the market at the end of the financial year. In comparison to last year there has been an increase in portfolio weightings in Healthcare (up from 5.9 per cent last year) and Industrials (up from 8.1 per cent last year) sectors. The biggest reductions were in Banks (down from 29.2 per cent last year), Materials (down from 16.7 per cent last year) and Energy (down from 6.7 per cent last year).
How are we Seeing the Market? Despite the strength of the market at the beginning of the new financial year, we expect volatility to remain a feature of
markets for some time. The Australian economy is expected to face more subdued growth rates over the medium term. Lower commodity prices are likely to endure. High levels of household debt relative to income and the required adjustment to the large Federal Budget deficit may impact growth. This is against the background of a political environment, which is making it more difficult to deliver necessary economic reform.
As a result, subdued returns are likely to be a feature of the Australian market for some time.
From a long term perspective, Figure 9 shows the price return of the Australian All Ordinaries Price Index market since 1936.
REVIEW OF OPERATIONS AND ACTIVITIEScontinued
1.5%
Info
rmat
ion
Tech
nolo
gy
Cons
umer
Disc
retio
nary
2.4%
Cash
2.6%
Utili
ties
4.6%
Ener
gy
2.8%
Prop
erty
Trus
ts
6.0%
Tele
com
Serv
ices
8.3%
Cons
umer
Stap
les
10.4%
Heal
thca
re
10.1%
Othe
rFi
nanc
ials
11.2%
Indu
stria
ls
14.7%
Mat
eria
ls
23.7%
Bank
s
Figure 8: Investment by sector as at 30 June 2016
1.8%
10
For
per
sona
l use
onl
y
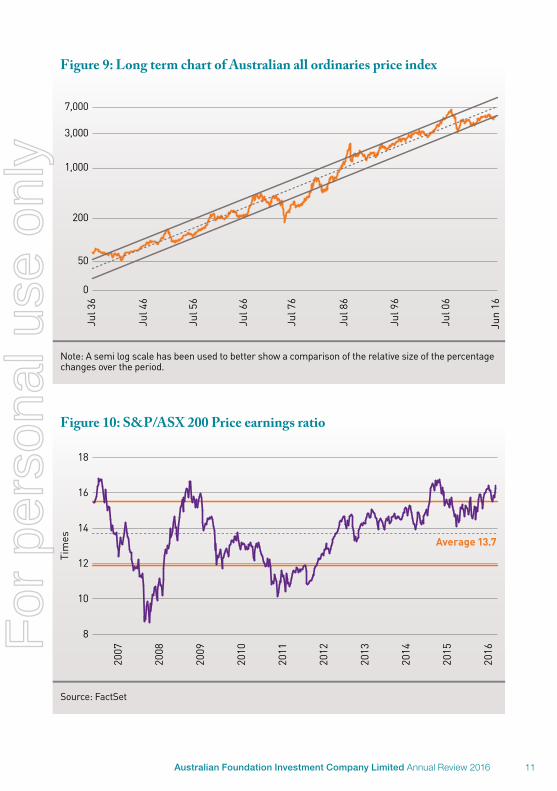
Figure 9: Long term chart of Australian all ordinaries price index
Jun
16
Jul 3
6
Jul 4
6
Jul 5
6
Jul 6
6
Jul 7
6
Jul 8
6
Jul 9
6
Jul 0
6
0
50
7,000
200
1,000
3,000
Note: A semi log scale has been used to better show a comparison of the relative size of the percentage changes over the period.
Source: FactSet
Figure 10: S&P/ASX 200 Price earnings ratio20
15
2014
2013
2012
2016
2011
2010
2009
2008
2007
8
18
10
12
14
16
Tim
es Average 13.7
11Australian Foundation Investment Company Limited Annual Review 2016
For
per
sona
l use
onl
y
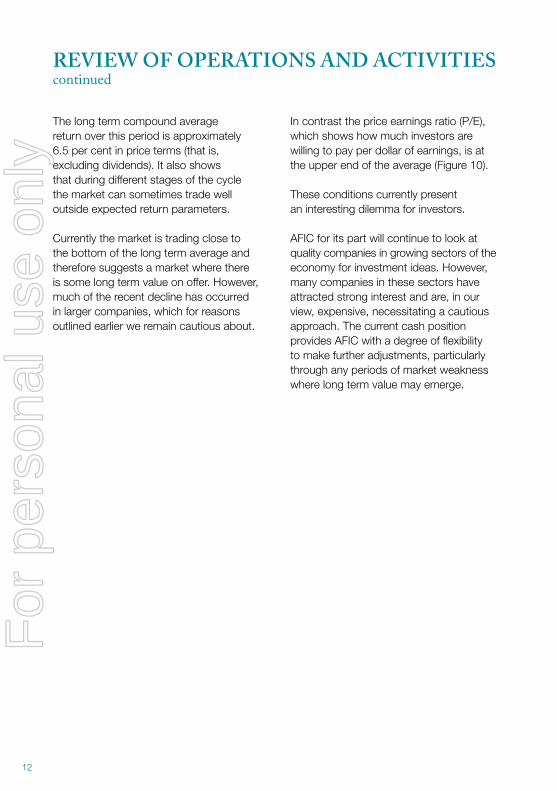
The long term compound average return over this period is approximately 6.5 per cent in price terms (that is, excluding dividends). It also shows that during different stages of the cycle the market can sometimes trade well outside expected return parameters.
Currently the market is trading close to the bottom of the long term average and therefore suggests a market where there is some long term value on offer. However, much of the recent decline has occurred in larger companies, which for reasons outlined earlier we remain cautious about.
In contrast the price earnings ratio (P/E), which shows how much investors are willing to pay per dollar of earnings, is at the upper end of the average (Figure 10).
These conditions currently present an interesting dilemma for investors.
AFIC for its part will continue to look at quality companies in growing sectors of the economy for investment ideas. However, many companies in these sectors have attracted strong interest and are, in our view, expensive, necessitating a cautious approach. The current cash position provides AFIC with a degree of flexibility to make further adjustments, particularly through any periods of market weakness where long term value may emerge.
REVIEW OF OPERATIONS AND ACTIVITIEScontinued
12
For
per
sona
l use
onl
y

13Australian Foundation Investment Company Limited Annual Review 2016
For
per
sona
l use
onl
y
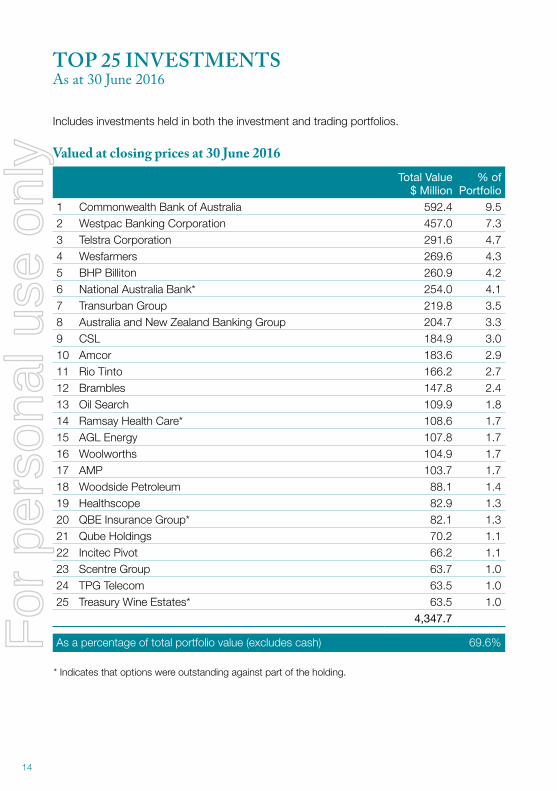
TOP 25 INVESTMENTSAs at 30 June 2016
Includes investments held in both the investment and trading portfolios.
Valued at closing prices at 30 June 2016Total Value
$ Million% of
Portfolio1 Commonwealth Bank of Australia 592.4 9.52 Westpac Banking Corporation 457.0 7.33 Telstra Corporation 291.6 4.74 Wesfarmers 269.6 4.35 BHP Billiton 260.9 4.26 National Australia Bank* 254.0 4.17 Transurban Group 219.8 3.58 Australia and New Zealand Banking Group 204.7 3.39 CSL 184.9 3.010 Amcor 183.6 2.911 Rio Tinto 166.2 2.712 Brambles 147.8 2.413 Oil Search 109.9 1.814 Ramsay Health Care* 108.6 1.715 AGL Energy 107.8 1.716 Woolworths 104.9 1.717 AMP 103.7 1.718 Woodside Petroleum 88.1 1.419 Healthscope 82.9 1.320 QBE Insurance Group* 82.1 1.321 Qube Holdings 70.2 1.122 Incitec Pivot 66.2 1.123 Scentre Group 63.7 1.024 TPG Telecom 63.5 1.025 Treasury Wine Estates* 63.5 1.0
4,347.7
As a percentage of total portfolio value (excludes cash) 69.6%
* Indicates that options were outstanding against part of the holding.
14
For
per
sona
l use
onl
y
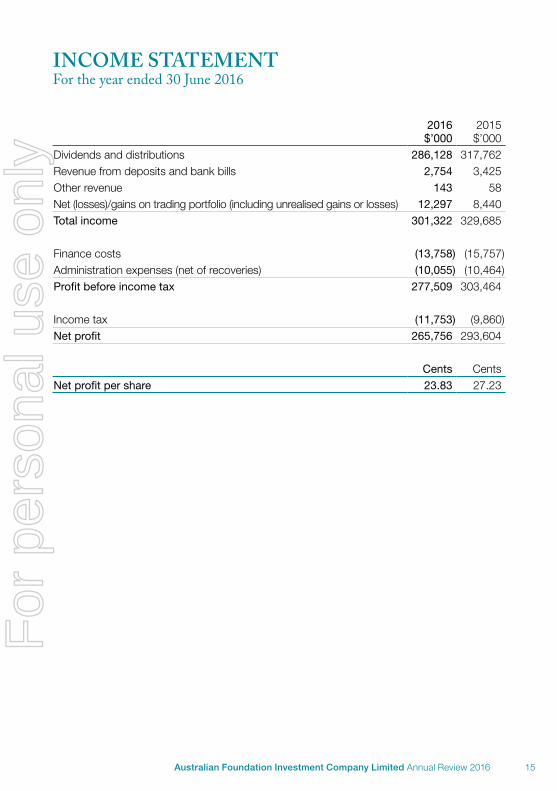
2016 $’000
2015 $’000
Dividends and distributions 286,128 317,762Revenue from deposits and bank bills 2,754 3,425Other revenue 143 58Net (losses)/gains on trading portfolio (including unrealised gains or losses) 12,297 8,440Total income 301,322 329,685
Finance costs (13,758) (15,757)Administration expenses (net of recoveries) (10,055) (10,464)Profit before income tax 277,509 303,464
Income tax (11,753) (9,860)Net profit 265,756 293,604
Cents CentsNet profit per share 23.83 27.23
INCOME STATEMENTFor the year ended 30 June 2016
15Australian Foundation Investment Company Limited Annual Review 2016
For
per
sona
l use
onl
y
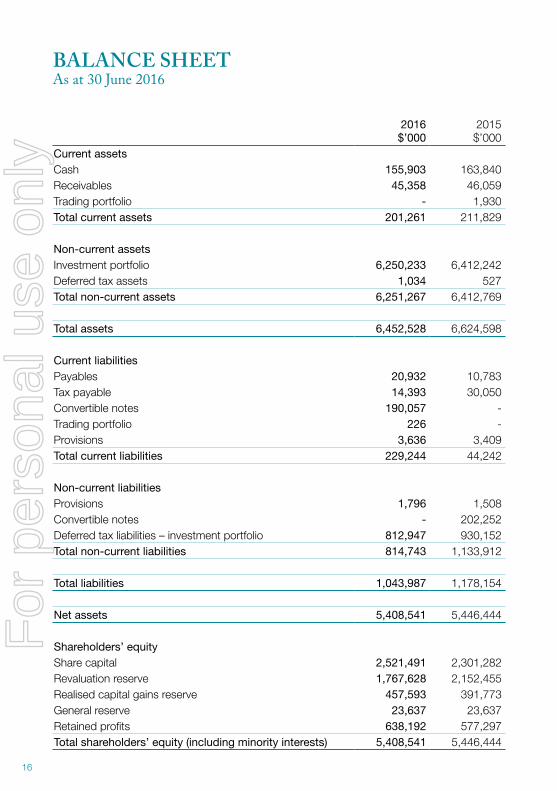
BALANCE SHEETAs at 30 June 2016
2016$’000
2015$’000
Current assetsCash 155,903 163,840Receivables 45,358 46,059Trading portfolio - 1,930Total current assets 201,261 211,829
Non-current assetsInvestment portfolio 6,250,233 6,412,242Deferred tax assets 1,034 527Total non-current assets 6,251,267 6,412,769
Total assets 6,452,528 6,624,598
Current liabilitiesPayables 20,932 10,783Tax payable 14,393 30,050Convertible notes 190,057 -Trading portfolio 226 -Provisions 3,636 3,409Total current liabilities 229,244 44,242
Non-current liabilitiesProvisions 1,796 1,508Convertible notes - 202,252Deferred tax liabilities – investment portfolio 812,947 930,152Total non-current liabilities 814,743 1,133,912
Total liabilities 1,043,987 1,178,154
Net assets 5,408,541 5,446,444
Shareholders’ equityShare capital 2,521,491 2,301,282Revaluation reserve 1,767,628 2,152,455Realised capital gains reserve 457,593 391,773General reserve 23,637 23,637Retained profits 638,192 577,297Total shareholders’ equity (including minority interests) 5,408,541 5,446,444
16
For
per
sona
l use
onl
y
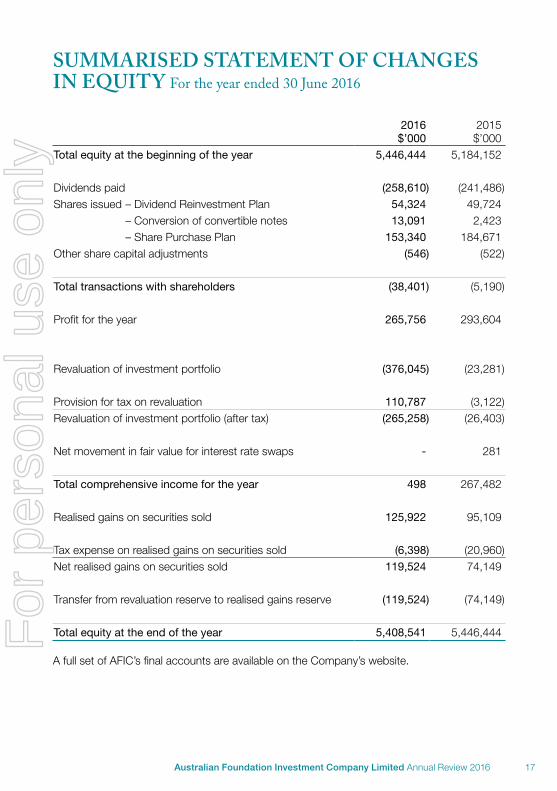
SUMMARISED STATEMENT OF CHANGES IN EQUITY For the year ended 30 June 2016
2016 $’000
2015 $’000
Total equity at the beginning of the year 5,446,444 5,184,152
Dividends paid (258,610) (241,486)Shares issued – Dividend Reinvestment Plan 54,324 49,724 – Conversion of convertible notes 13,091 2,423 – Share Purchase Plan 153,340 184,671Other share capital adjustments (546) (522)
Total transactions with shareholders (38,401) (5,190)
Profit for the year 265,756 293,604
Revaluation of investment portfolio (376,045) (23,281)
Provision for tax on revaluation 110,787 (3,122)Revaluation of investment portfolio (after tax) (265,258) (26,403)
Net movement in fair value for interest rate swaps - 281
Total comprehensive income for the year 498 267,482
Realised gains on securities sold 125,922 95,109
Tax expense on realised gains on securities sold (6,398) (20,960)Net realised gains on securities sold 119,524 74,149
Transfer from revaluation reserve to realised gains reserve (119,524) (74,149)
Total equity at the end of the year 5,408,541 5,446,444
A full set of AFIC’s final accounts are available on the Company’s website.
17Australian Foundation Investment Company Limited Annual Review 2016
For
per
sona
l use
onl
y
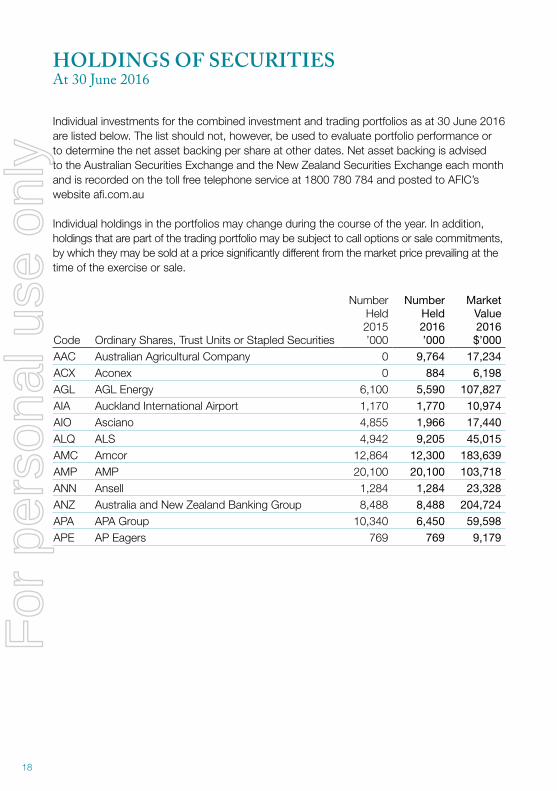
HOLDINGS OF SECURITIESAt 30 June 2016
Individual investments for the combined investment and trading portfolios as at 30 June 2016 are listed below. The list should not, however, be used to evaluate portfolio performance or to determine the net asset backing per share at other dates. Net asset backing is advised to the Australian Securities Exchange and the New Zealand Securities Exchange each month and is recorded on the toll free telephone service at 1800 780 784 and posted to AFIC’s website afi.com.au
Individual holdings in the portfolios may change during the course of the year. In addition, holdings that are part of the trading portfolio may be subject to call options or sale commitments, by which they may be sold at a price significantly different from the market price prevailing at the time of the exercise or sale.
Code Ordinary Shares, Trust Units or Stapled Securities
Number Held 2015 ’000
Number Held 2016 ’000
Market Value 2016
$’000
AAC Australian Agricultural Company 0 9,764 17,234
ACX Aconex 0 884 6,198
AGL AGL Energy 6,100 5,590 107,827
AIA Auckland International Airport 1,170 1,770 10,974
AIO Asciano 4,855 1,966 17,440
ALQ ALS 4,942 9,205 45,015
AMC Amcor 12,864 12,300 183,639
AMP AMP 20,100 20,100 103,718
ANN Ansell 1,284 1,284 23,328
ANZ Australia and New Zealand Banking Group 8,488 8,488 204,724
APA APA Group 10,340 6,450 59,598
APE AP Eagers 769 769 9,179
18
For
per
sona
l use
onl
y
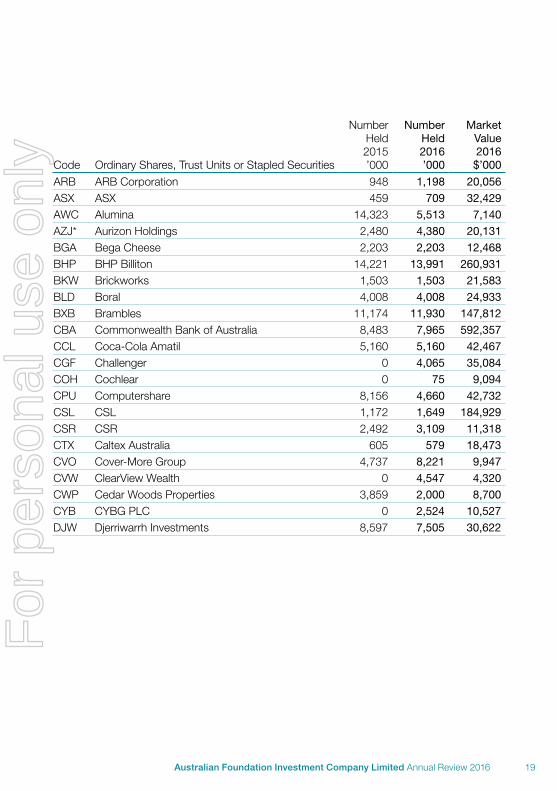
Code Ordinary Shares, Trust Units or Stapled Securities
Number Held 2015 ’000
Number Held 2016 ’000
Market Value 2016
$’000
ARB ARB Corporation 948 1,198 20,056
ASX ASX 459 709 32,429
AWC Alumina 14,323 5,513 7,140
AZJ* Aurizon Holdings 2,480 4,380 20,131
BGA Bega Cheese 2,203 2,203 12,468
BHP BHP Billiton 14,221 13,991 260,931
BKW Brickworks 1,503 1,503 21,583
BLD Boral 4,008 4,008 24,933
BXB Brambles 11,174 11,930 147,812
CBA Commonwealth Bank of Australia 8,483 7,965 592,357
CCL Coca-Cola Amatil 5,160 5,160 42,467
CGF Challenger 0 4,065 35,084
COH Cochlear 0 75 9,094
CPU Computershare 8,156 4,660 42,732
CSL CSL 1,172 1,649 184,929
CSR CSR 2,492 3,109 11,318
CTX Caltex Australia 605 579 18,473
CVO Cover-More Group 4,737 8,221 9,947
CVW ClearView Wealth 0 4,547 4,320
CWP Cedar Woods Properties 3,859 2,000 8,700
CYB CYBG PLC 0 2,524 10,527
DJW Djerriwarrh Investments 8,597 7,505 30,622
19Australian Foundation Investment Company Limited Annual Review 2016
For
per
sona
l use
onl
y
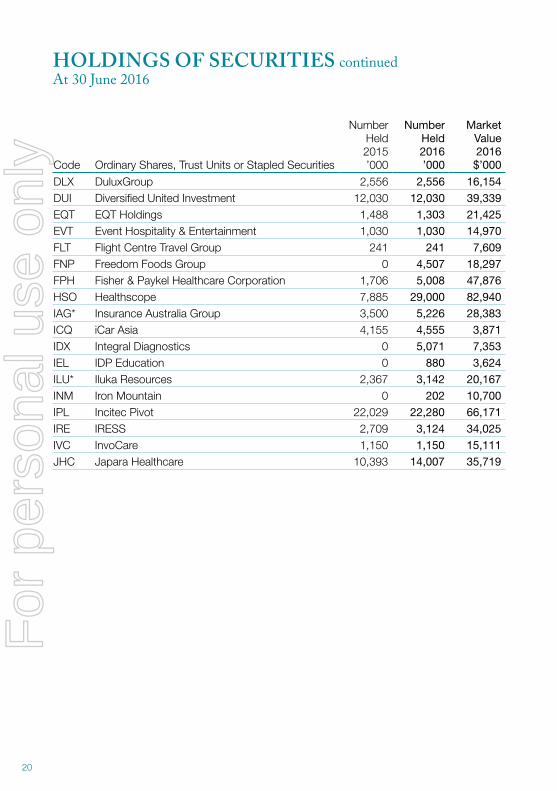
Code Ordinary Shares, Trust Units or Stapled Securities
Number Held 2015 ’000
Number Held 2016 ’000
Market Value 2016
$’000
DLX DuluxGroup 2,556 2,556 16,154
DUI Diversified United Investment 12,030 12,030 39,339
EQT EQT Holdings 1,488 1,303 21,425
EVT Event Hospitality & Entertainment 1,030 1,030 14,970
FLT Flight Centre Travel Group 241 241 7,609
FNP Freedom Foods Group 0 4,507 18,297
FPH Fisher & Paykel Healthcare Corporation 1,706 5,008 47,876
HSO Healthscope 7,885 29,000 82,940
IAG* Insurance Australia Group 3,500 5,226 28,383
ICQ iCar Asia 4,155 4,555 3,871
IDX Integral Diagnostics 0 5,071 7,353
IEL IDP Education 0 880 3,624
ILU* Iluka Resources 2,367 3,142 20,167
INM Iron Mountain 0 202 10,700
IPL Incitec Pivot 22,029 22,280 66,171
IRE IRESS 2,709 3,124 34,025
IVC InvoCare 1,150 1,150 15,111
JHC Japara Healthcare 10,393 14,007 35,719
HOLDINGS OF SECURITIES continuedAt 30 June 2016
20
For
per
sona
l use
onl
y
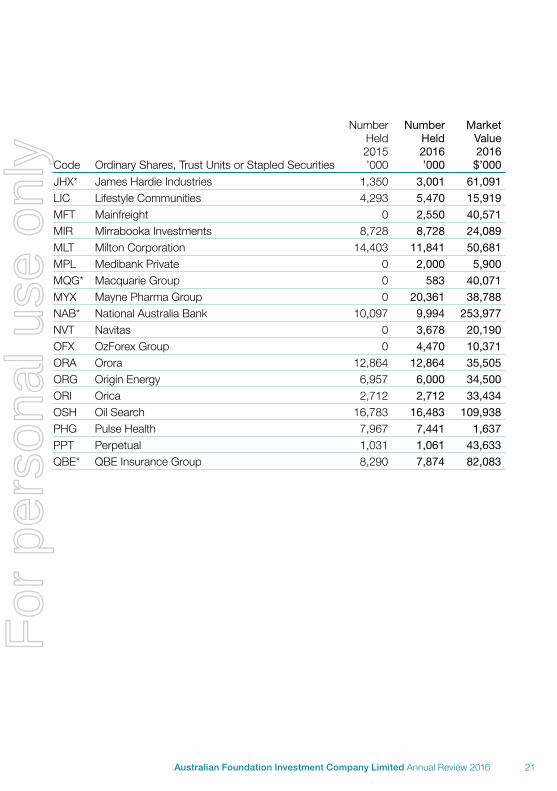
Code Ordinary Shares, Trust Units or Stapled Securities
Number Held 2015 ’000
Number Held 2016 ’000
Market Value 2016
$’000
JHX* James Hardie Industries 1,350 3,001 61,091
LIC Lifestyle Communities 4,293 5,470 15,919
MFT Mainfreight 0 2,550 40,571
MIR Mirrabooka Investments 8,728 8,728 24,089
MLT Milton Corporation 14,403 11,841 50,681
MPL Medibank Private 0 2,000 5,900
MQG* Macquarie Group 0 583 40,071
MYX Mayne Pharma Group 0 20,361 38,788
NAB* National Australia Bank 10,097 9,994 253,977
NVT Navitas 0 3,678 20,190
OFX OzForex Group 0 4,470 10,371
ORA Orora 12,864 12,864 35,505
ORG Origin Energy 6,957 6,000 34,500
ORI Orica 2,712 2,712 33,434
OSH Oil Search 16,783 16,483 109,938
PHG Pulse Health 7,967 7,441 1,637
PPT Perpetual 1,031 1,061 43,633
QBE* QBE Insurance Group 8,290 7,874 82,083
21Australian Foundation Investment Company Limited Annual Review 2016
For
per
sona
l use
onl
y
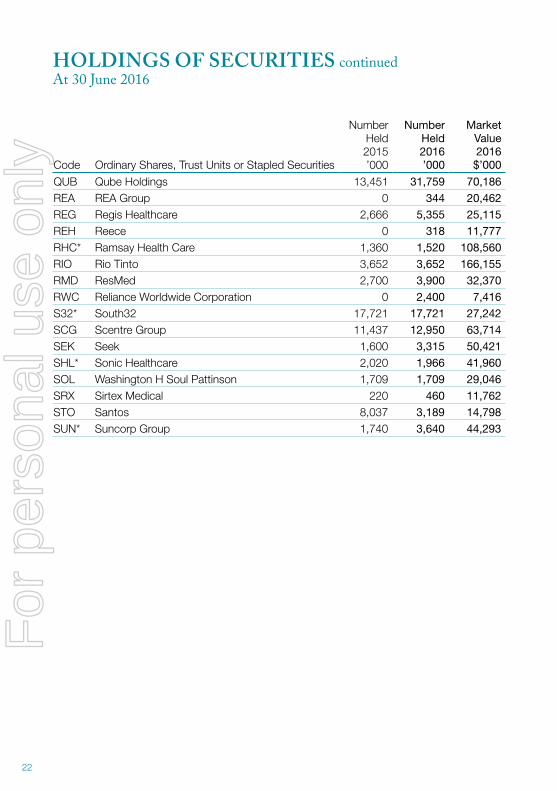
Code Ordinary Shares, Trust Units or Stapled Securities
Number Held 2015 ’000
Number Held 2016 ’000
Market Value 2016
$’000
QUB Qube Holdings 13,451 31,759 70,186
REA REA Group 0 344 20,462
REG Regis Healthcare 2,666 5,355 25,115
REH Reece 0 318 11,777
RHC* Ramsay Health Care 1,360 1,520 108,560
RIO Rio Tinto 3,652 3,652 166,155
RMD ResMed 2,700 3,900 32,370
RWC Reliance Worldwide Corporation 0 2,400 7,416
S32* South32 17,721 17,721 27,242
SCG Scentre Group 11,437 12,950 63,714
SEK Seek 1,600 3,315 50,421
SHL* Sonic Healthcare 2,020 1,966 41,960
SOL Washington H Soul Pattinson 1,709 1,709 29,046
SRX Sirtex Medical 220 460 11,762
STO Santos 8,037 3,189 14,798
SUN* Suncorp Group 1,740 3,640 44,293
HOLDINGS OF SECURITIES continuedAt 30 June 2016
22
For
per
sona
l use
onl
y
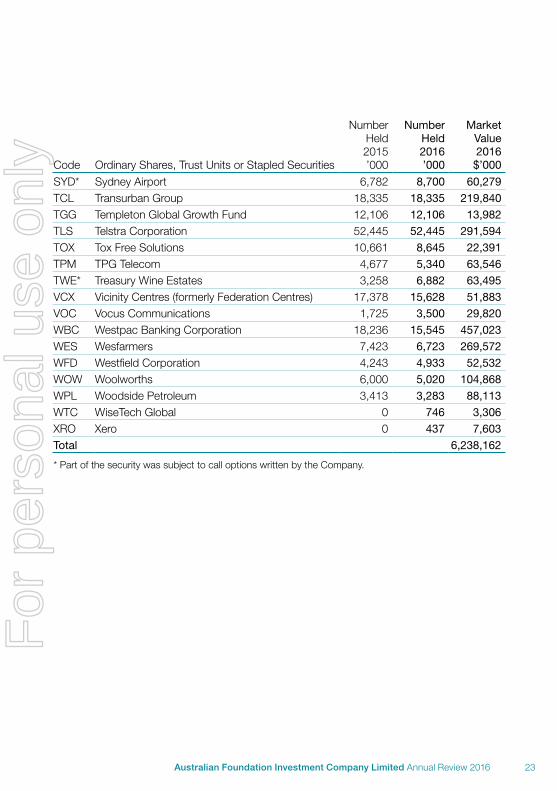
Code Ordinary Shares, Trust Units or Stapled Securities
Number Held 2015 ’000
Number Held 2016 ’000
Market Value 2016
$’000
SYD* Sydney Airport 6,782 8,700 60,279
TCL Transurban Group 18,335 18,335 219,840
TGG Templeton Global Growth Fund 12,106 12,106 13,982
TLS Telstra Corporation 52,445 52,445 291,594
TOX Tox Free Solutions 10,661 8,645 22,391
TPM TPG Telecom 4,677 5,340 63,546
TWE* Treasury Wine Estates 3,258 6,882 63,495
VCX Vicinity Centres (formerly Federation Centres) 17,378 15,628 51,883
VOC Vocus Communications 1,725 3,500 29,820
WBC Westpac Banking Corporation 18,236 15,545 457,023
WES Wesfarmers 7,423 6,723 269,572
WFD Westfield Corporation 4,243 4,933 52,532
WOW Woolworths 6,000 5,020 104,868
WPL Woodside Petroleum 3,413 3,283 88,113
WTC WiseTech Global 0 746 3,306
XRO Xero 0 437 7,603
Total 6,238,162
* Part of the security was subject to call options written by the Company.
23Australian Foundation Investment Company Limited Annual Review 2016
For
per
sona
l use
onl
y
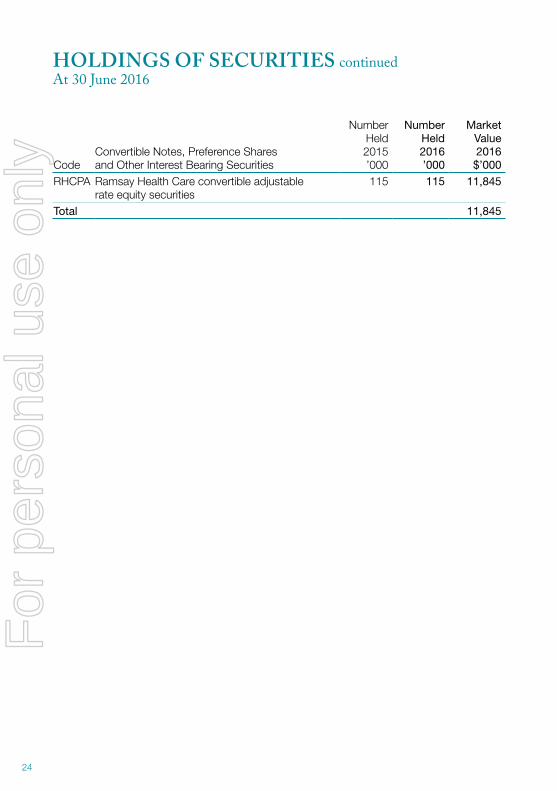
HOLDINGS OF SECURITIES continuedAt 30 June 2016
CodeConvertible Notes, Preference Shares and Other Interest Bearing Securities
Number Held 2015 ’000
Number Held 2016 ’000
Market Value 2016
$’000
RHCPA Ramsay Health Care convertible adjustable rate equity securities
115 115 11,845
Total 11,845
24
For
per
sona
l use
onl
y
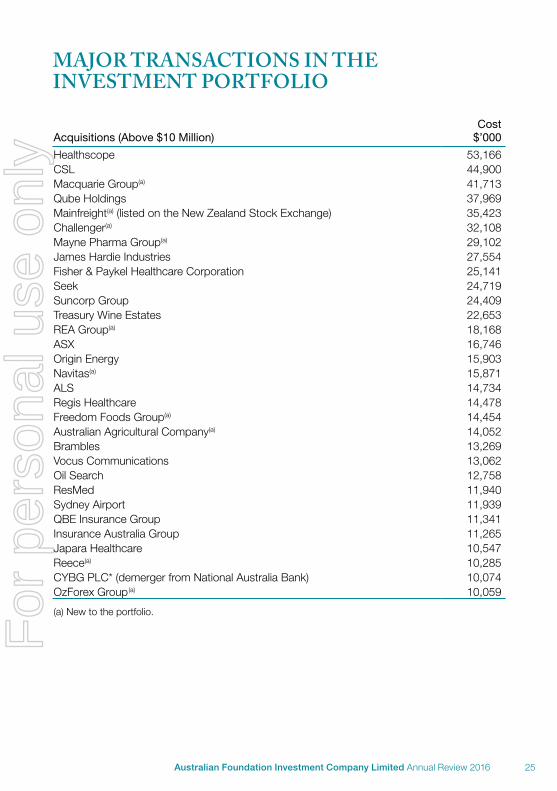
Acquisitions (Above $10 Million)Cost
$’000
Healthscope 53,166CSL 44,900Macquarie Group(a) 41,713Qube Holdings 37,969Mainfreight(a) (listed on the New Zealand Stock Exchange) 35,423Challenger(a) 32,108Mayne Pharma Group(a) 29,102James Hardie Industries 27,554Fisher & Paykel Healthcare Corporation 25,141Seek 24,719Suncorp Group 24,409Treasury Wine Estates 22,653REA Group(a) 18,168ASX 16,746Origin Energy 15,903Navitas(a) 15,871ALS 14,734Regis Healthcare 14,478Freedom Foods Group(a) 14,454Australian Agricultural Company(a) 14,052Brambles 13,269Vocus Communications 13,062Oil Search 12,758ResMed 11,940Sydney Airport 11,939QBE Insurance Group 11,341Insurance Australia Group 11,265Japara Healthcare 10,547Reece(a) 10,285CYBG PLC* (demerger from National Australia Bank) 10,074OzForex Group(a) 10,059
(a) New to the portfolio.
MAJOR TRANSACTIONS IN THE INVESTMENT PORTFOLIO
25Australian Foundation Investment Company Limited Annual Review 2016
For
per
sona
l use
onl
y
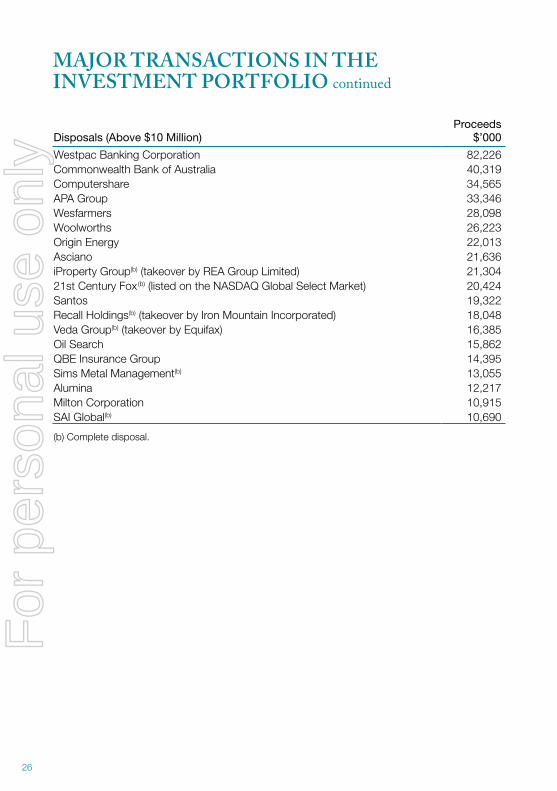
MAJOR TRANSACTIONS IN THE INVESTMENT PORTFOLIO continued
Disposals (Above $10 Million)Proceeds
$’000
Westpac Banking Corporation 82,226Commonwealth Bank of Australia 40,319Computershare 34,565APA Group 33,346Wesfarmers 28,098Woolworths 26,223Origin Energy 22,013Asciano 21,636iProperty Group(b) (takeover by REA Group Limited) 21,30421st Century Fox(b) (listed on the NASDAQ Global Select Market) 20,424Santos 19,322Recall Holdings(b) (takeover by Iron Mountain Incorporated) 18,048Veda Group(b) (takeover by Equifax) 16,385Oil Search 15,862QBE Insurance Group 14,395Sims Metal Management(b) 13,055Alumina 12,217Milton Corporation 10,915SAI Global(b) 10,690
(b) Complete disposal.
26
For
per
sona
l use
onl
y
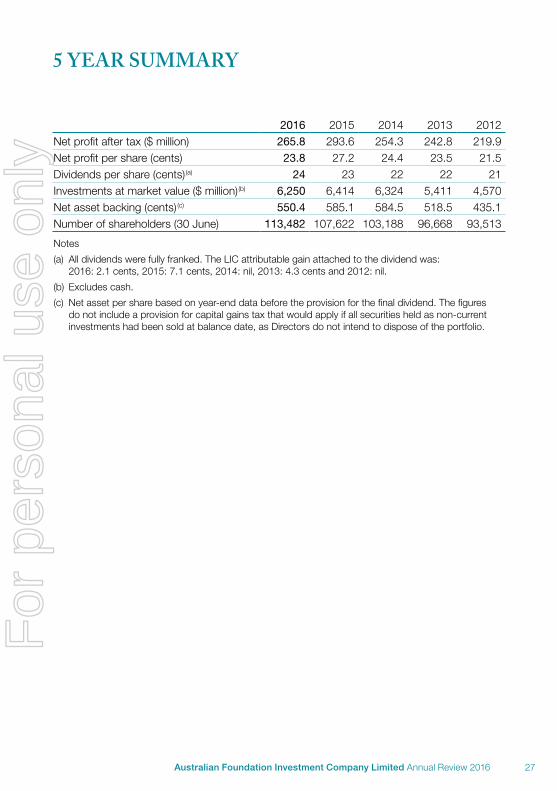
5 YEAR SUMMARY
2016 2015 2014 2013 2012Net profit after tax ($ million) 265.8 293.6 254.3 242.8 219.9Net profit per share (cents) 23.8 27.2 24.4 23.5 21.5Dividends per share (cents)(a) 24 23 22 22 21Investments at market value ($ million)(b) 6,250 6,414 6,324 5,411 4,570Net asset backing (cents) (c) 550.4 585.1 584.5 518.5 435.1Number of shareholders (30 June) 113,482 107,622 103,188 96,668 93,513
Notes
(a) All dividends were fully franked. The LIC attributable gain attached to the dividend was: 2016: 2.1 cents, 2015: 7.1 cents, 2014: nil, 2013: 4.3 cents and 2012: nil.
(b) Excludes cash.
(c) Net asset per share based on year-end data before the provision for the final dividend. The figures do not include a provision for capital gains tax that would apply if all securities held as non-current investments had been sold at balance date, as Directors do not intend to dispose of the portfolio.
27Australian Foundation Investment Company Limited Annual Review 2016
For
per
sona
l use
onl
y
COMPANY PARTICULARS
Contact DetailsTelephone (03) 9650 9911Facsimile (03) 9650 9100Email [email protected] afi.com.au
For enquiries regarding net asset backing (as advised each month to the Australian Securities Exchange and the New Zealand Securities Exchange):
Telephone 1800 780 784 (toll free)
Share RegistrarComputershare Investor Services Pty LtdYarra Falls, 452 Johnston StreetAbbotsford Victoria 3067
ShareholderEnquiry Lines 1300 662 270 (Australia) 0800 333 501 (from New Zealand) +61 3 9415 4373 (from overseas)Facsimile (03) 9473 2500Website investorcentre.com.au/contact
For all enquiries relating to shareholdings, dividends and related matters, please contact the Share Registrar in your country.
Australian and New Zealand Securities Exchange CodesAFI Ordinary shares (ASX and NZX)AFIG Unsecured convertible notes (ASX)
Australian Foundation Investment Company Limited (AFIC)ABN 56 004 147 120
AFIC is a listed investment company. As such it is an investor in equities and similar securities on the stock market primarily in Australia.
DirectorsTerrence A Campbell AO, ChairmanRoss E Barker, Managing DirectorJacqueline C HeyGraeme R LiebeltJohn PatersonDavid A PeeverCatherine M Walter AMPeter J Williams
Company SecretariesMatthew J RoweAndrew JB Porter
AuditorPricewaterhouseCoopers Chartered Accountants
Country of IncorporationAustralia
Registered Office and Mailing AddressLevel 21, 101 Collins Street Melbourne Victoria 3000
28
For
per
sona
l use
onl
y
SHAREHOLDER MEETINGS
Annual General Meeting Time 10.00amDate Wednesday 12 October 2016Venue RACV City ClubLocation 501 Bourke Street Melbourne
Sydney MeetingTime 10.00amDate Friday 14 October 2016Venue Four Seasons HotelLocation 199 George Street Sydney
Adelaide MeetingTime 10.00am Date Monday 17 October 2016Venue Adelaide Convention CentreLocation North Terrace Adelaide
Brisbane MeetingTime 10.00amDate Monday 24 October 2016Venue Hilton HotelLocation 190 Elizabeth Street Brisbane
Auckland MeetingTime 10.00amDate Monday 5 December 2016Venue Hilton HotelLocation 147 Quay Street Auckland
The Annual Report for 2016 is available on AFIC’s website afi.com.au or by contacting the Company on (03) 9650 9911.
29Australian Foundation Investment Company Limited Annual Review 2016
For
per
sona
l use
onl
y
Design: MDM Investor Connect. Printed on environmentally friendly paper.
For
per
sona
l use
onl
y
NOTICE OF ANNUAL GENERAL MEETING 2016
The Annual General Meeting of Australian Foundation Investment Company Limited (ABN: 56 004 147 120 “the Company”) will be held at: RACV CITY CLUB, 501 BOURKE STREET, MELBOURNE, VICTORIA 3000 at 10.00am (AEDT) on Wednesday 12 October 2016. The Company has determined that, for the purpose of voting at the meeting, shares will be taken to be held by those persons recorded on the Company’s register at 7.00pm (AEDT) on Monday 10 October 2016.
BUSINESS OF THE MEETING
1. FINANCIAL STATEMENTS AND REPORTSTo consider the Directors’ Report, Financial Statements and Independent Audit Report for the financial year ended 30 June 2016.
(Please note that no resolution will be required to be passed on this matter)
2. ADOPTION OF REMUNERATION REPORTTo consider and, if thought fit, to pass the following resolution (as an ordinary resolution):
“That the Remuneration Report for the financial year ended 30 June 2016 be adopted.”
(Please note that the vote on this item is advisory only)
3. & 4. RE-ELECTION OF DIRECTORSTo consider and, if thought fit, to pass the following resolutions (as ordinary resolutions):
“That Jacqueline Hey, a Director retiring from office in accordance with Rule 46 of the Constitution, being eligible is re-elected as a Director of the Company.”
“That Peter Williams, a Director retiring from office in accordance with Rule 46 of the Constitution, being eligible is re-elected as a Director of the Company.”
By Order of the Board
Matthew RoweCompany Secretary29 August 2016
1
For
per
sona
l use
onl
y
2
Australian Foundation Investment Company LimitedNotice of Annual General Meeting 2016
EXPLANATORY NOTES
The Explanatory Notes below provide additional information regarding the items of business proposed for the Annual General Meeting.
IMPORTANT: Shareholders are urged to direct their proxy how to vote by clearly marking the relevant box for each item on the proxy form.
Please ensure that your properly completed proxy form reaches the share registry by the deadline of 10.00am (AEDT) on Monday 10 October 2016.
1. FINANCIAL STATEMENTS AND REPORTS
During this item there will be a reasonable opportunity for shareholders to ask questions and comment on the Directors’ Report, Financial Statements and Independent Audit Report for the financial year ended 30 June 2016. No resolution will be required to be passed on this matter.
Shareholders who have not elected to receive a hard copy of the Company’s 2016 Annual Report can view or download it from the Company’s website at:
www.afi.com.au/Reports-by-year.aspx
2. ADOPTION OF REMUNERATION REPORT
Board recommendation and undirected proxies: The Board recommends that shareholders vote in FAVOUR of item 2. The Chairman of the meeting intends to vote undirected proxies in FAVOUR of item 2.
During this item there will be a reasonable opportunity for shareholders at the meeting to comment on and ask questions about the Remuneration Report which can be found in the Company’s 2016 Annual Report. As prescribed by the Corporations Act, the vote on the proposed resolution is an advisory one.
Voting exclusions on item 2Pursuant to section 250R(4) of the Corporations Act 2001, the Company is required to disregard any votes cast on item 2 (in any capacity) by or on behalf of either a member of the key management personnel, details of whose remuneration are included in the remuneration report; or a closely related party of such a member (together “prohibited persons”).
However, the Company will not disregard a vote if:
• the prohibited person does so as a proxy appointed by writing that specifies how the proxy is to vote on the proposed resolution; and
• the vote is not cast on behalf of a prohibited person.
If the Chairman of the meeting is appointed, or taken to be appointed, as a proxy, the shareholder can direct the Chairman of the meeting to vote for or against, or to abstain from voting on, the resolution on item 2 (Adoption of Remuneration Report) by marking the appropriate box opposite item 2 on the proxy form.
Pursuant to section 250R(5) of the Corporations Act 2001, if the Chairman of the meeting is a proxy and the relevant shareholder does not mark any of the boxes opposite item 2, the relevant shareholder will be expressly authorising the Chairman to exercise the proxy in relation to item 2. F
or p
erso
nal u
se o
nly
3
Australian Foundation Investment Company LimitedNotice of Annual General Meeting 2016
ITEMS 3 & 4. RE-ELECTION OF DIRECTORS
Board recommendation and undirected proxies: The Board recommends that shareholders vote in FAVOUR of items 3 & 4. The Chairman of the meeting intends to vote undirected proxies in FAVOUR of items 3 & 4.
Jacqueline Hey and Peter Williams were elected and re-elected respectively as Directors by shareholders at the 2013 AGM. As such they are required to seek re-election by shareholders at this AGM. Their biographical details are set out below:
Jacqueline C HeyB.Com (Melb), Grad Cert (Mgmt), GAICD. Independent Non-Executive Director. Member of the Investment Committee and Nomination Committee.
Ms Hey was appointed to the Board in July 2013. She is a Non-Executive Director of Qantas Limited, Bendigo and Adelaide Bank Limited, AGL, Melbourne Business School Ltd and Cricket Australia. She was formerly Managing Director of Ericsson UK and Ireland and Managing Director of Ericsson Australia and New Zealand.
Peter J WilliamsDip.All, MAICD, FAIM. Independent Non-Executive Director. Chairman of the Audit Committee. Member of the Investment Committee and Nomination Committee. Director of the Company’s subsidiary, AICS.
Mr Williams was appointed to the Board in February 2010. He is Chairman of MIPS Advisory Committee, Fiig Securities Limited and Olympic Park Sports Medical Centre Pty Ltd. Mr Williams is a Director of the Australian Baseball Federation, National Australia Trustees Limited, Foundation for Young Australians and the E.W. Tipping Foundation, and an Advisory Board Member to TLC Aged Care Pty Ltd. Mr Williams was formerly Managing Director of Equity Trustees Limited, a Director of the Trustee Corporations Association of Australia and a General Manager with AXA/National Mutual in Australia and Hong Kong.
Further information regarding the Company’s Corporate Governance arrangements and the Board’s role can be found on the Company’s website at:
www.afi.com.au/Corporate-Governance.aspx
SHAREHOLDER INFORMATION
Proxies1. A shareholder entitled to attend and vote at this meeting is entitled to appoint not more than two proxies
(who need not be members of the Company) to attend, vote and speak in the shareholder’s place and to join in any demand for a poll.
2. Where a shareholder appoints more than one representative, proxy or attorney, those appointees are entitled to vote on a poll but not on a show of hands.
3. A shareholder who appoints two proxies may specify a proportion or number of the shareholder’s votes each proxy is appointed to exercise. Where no such specification is made, each proxy may exercise half of the votes (any fractions of votes resulting from this are disregarded).
4. Proxy forms may be lodged online by visiting www.investorvote.com.au or by scanning the QR Code on the proxy form with a mobile device.
5. Relevant custodians may lodge their proxy forms online by visiting www.intermediaryonline.com
6. Proxy forms and any authorities (or certified copies of those authorities) under which they are signed may be delivered in person, by mail or by fax to the Company‘s Share Registry (see details below) no later than 48 hours before the meeting, being 10.00am (AEDT) on Monday 10 October 2016. Further details are on the proxy form.
For
per
sona
l use
onl
y
4
Australian Foundation Investment Company LimitedNotice of Annual General Meeting 2016
7. A proxy need not vote in that capacity on a show of hands on any resolution nor (unless the proxy is the Chairman of the meeting) on a poll. However, if the proxy’s appointment specifies the way to vote on a resolution, and the proxy decides to vote in that capacity on that resolution, the proxy must vote the way specified (subject to the other provisions of this Notice, including the voting exclusions noted above).
8. In certain circumstances the Chairman of the meeting will be taken to have been appointed as the proxy of the relevant shareholder in respect of the meeting or the poll on that resolution even if the shareholder has not expressly appointed the Chairman of the meeting as their proxy. This will occur where:
• an appointment of a proxy specifies the way the proxy is to vote on a particular resolution; and• the appointed proxy is not the Chairman of the meeting; and• at the meeting, a poll is called on the resolution; and• either of the following apply:
if a record of attendance is made for the AGM - the proxy is not recorded as attending the proxy does not vote on the resolution.
Corporate representativesA body corporate which is a shareholder, or which has been appointed as a proxy, may appoint an individual to act as its representative at the meeting. Unless it has previously been given to the Company, the representative should bring evidence of their appointment to the meeting, together with any authority under which it is signed. The appointment must comply with section 250D of the Corporations Act 2001.
AttorneysA shareholder may appoint an attorney to vote on their behalf. To be effective for the meeting, the instrument effecting the appointment (or a certified copy of it) must be received by the deadline for the receipt of proxy forms (see above), being no later than 48 hours before the meeting.
Share RegistryThe Company’s Share Registry details are as follows:
Computershare Investor Services Pty Limited
Street address: Postal address:Yarra Falls GPO Box 242452 Johnston Street Melbourne VIC 3001Abbotsford VIC 3067
Telephone: 1300 662 270 (within Australia) 0800 333 501 (within New Zealand) +61 3 9415 4373 (outside Australia)Facsimile: 1800 783 447 (within Australia) +61 3 9473 2555 (outside Australia)Internet: www.investorcentre.com/contact
For
per
sona
l use
onl
y
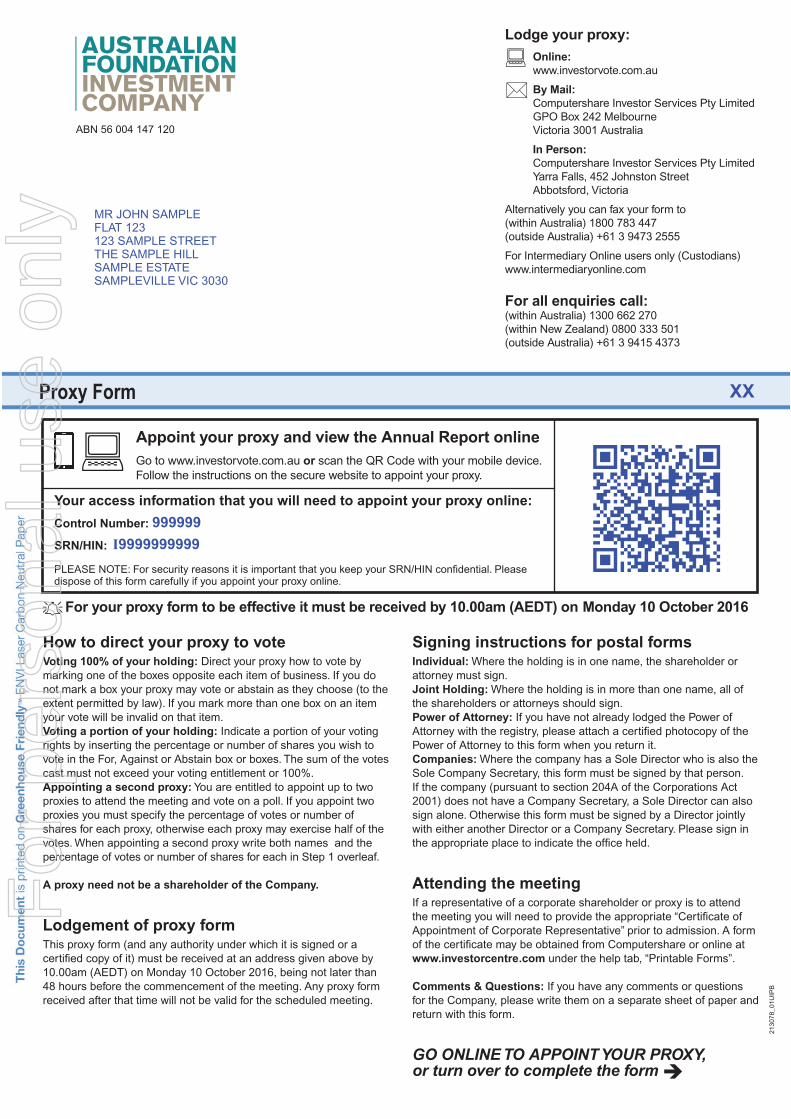
2130
78_0
1UIP
B
Lodge your proxy:
Online:
www.investorvote.com.au
By Mail:
Computershare Investor Services Pty Limited GPO Box 242 Melbourne Victoria 3001 Australia
In Person:
Computershare Investor Services Pty Limited Yarra Falls, 452 Johnston Street Abbotsford, Victoria
Alternatively you can fax your form to (within Australia) 1800 783 447(outside Australia) +61 3 9473 2555
For Intermediary Online users only (Custodians)www.intermediaryonline.com
For all enquiries call:(within Australia) 1300 662 270(within New Zealand) 0800 333 501(outside Australia) +61 3 9415 4373
Proxy Form
How to direct your proxy to voteVoting 100% of your holding: Direct your proxy how to vote by marking one of the boxes opposite each item of business. If you do not mark a box your proxy may vote or abstain as they choose (to the extent permitted by law). If you mark more than one box on an item your vote will be invalid on that item.Voting a portion of your holding: Indicate a portion of your voting rights by inserting the percentage or number of shares you wish to vote in the For, Against or Abstain box or boxes. The sum of the votes cast must not exceed your voting entitlement or 100%.Appointing a second proxy: You are entitled to appoint up to two proxies to attend the meeting and vote on a poll. If you appoint two proxies you must specify the percentage of votes or number of shares for each proxy, otherwise each proxy may exercise half of the votes. When appointing a second proxy write both names and the percentage of votes or number of shares for each in Step 1 overleaf.
A proxy need not be a shareholder of the Company.
Lodgement of proxy formThis proxy form (and any authority under which it is signed or a certifi ed copy of it) must be received at an address given above by 10.00am (AEDT) on Monday 10 October 2016, being not later than 48 hours before the commencement of the meeting. Any proxy form received after that time will not be valid for the scheduled meeting.
Signing instructions for postal formsIndividual: Where the holding is in one name, the shareholder or attorney must sign.Joint Holding: Where the holding is in more than one name, all of the shareholders or attorneys should sign.Power of Attorney: If you have not already lodged the Power of Attorney with the registry, please attach a certifi ed photocopy of the Power of Attorney to this form when you return it.Companies: Where the company has a Sole Director who is also the Sole Company Secretary, this form must be signed by that person. If the company (pursuant to section 204A of the Corporations Act 2001) does not have a Company Secretary, a Sole Director can also sign alone. Otherwise this form must be signed by a Director jointly with either another Director or a Company Secretary. Please sign in the appropriate place to indicate the offi ce held.
Attending the meetingIf a representative of a corporate shareholder or proxy is to attend the meeting you will need to provide the appropriate “Certifi cate of Appointment of Corporate Representative” prior to admission. A form of the certifi cate may be obtained from Computershare or online at www.investorcentre.com under the help tab, “Printable Forms”.
Comments & Questions: If you have any comments or questions for the Company, please write them on a separate sheet of paper and return with this form.
GO ONLINE TO APPOINT YOUR PROXY, or turn over to complete the form
For your proxy form to be effective it must be received by 10.00am (AEDT) on Monday 10 October 2016
ABN 56 004 147 120
Appoint your proxy and view the Annual Report online
Go to www.investorvote.com.au or scan the QR Code with your mobile device.Follow the instructions on the secure website to appoint your proxy.
Your access information that you will need to appoint your proxy online:
Control Number:
SRN/HIN:
PLEASE NOTE: For security reasons it is important that you keep your SRN/HIN confi dential. Please dispose of this form carefully if you appoint your proxy online.
MR JOHN SAMPLEFLAT 123123 SAMPLE STREETTHE SAMPLE HILLSAMPLE ESTATESAMPLEVILLE VIC 3030
I9999999999
999999
XX
For
per
sona
l use
onl
y
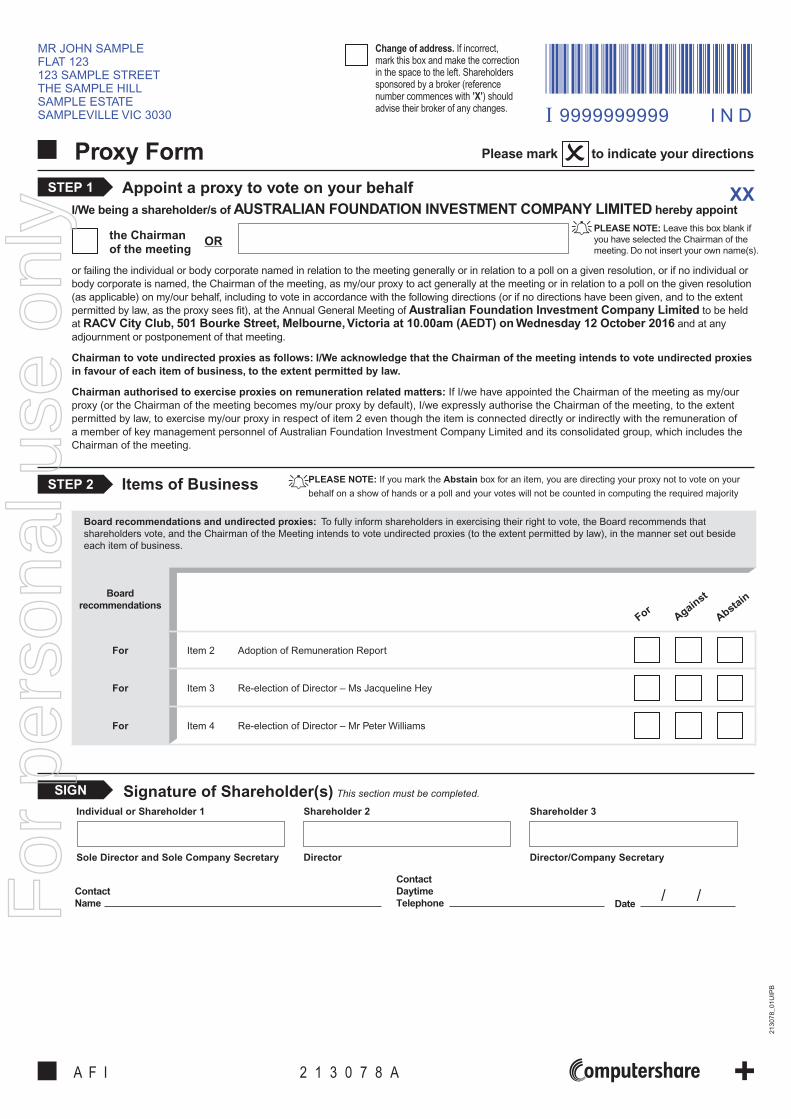
2130
78_0
1UIP
B
I/We being a shareholder/s of AUSTRALIAN FOUNDATION INVESTMENT COMPANY LIMITED hereby appoint
the Chairman
of the meeting OR
or failing the individual or body corporate named in relation to the meeting generally or in relation to a poll on a given resolution, or if no individual or body corporate is named, the Chairman of the meeting, as my/our proxy to act generally at the meeting or in relation to a poll on the given resolution (as applicable) on my/our behalf, including to vote in accordance with the following directions (or if no directions have been given, and to the extent permitted by law, as the proxy sees fi t), at the Annual General Meeting of Australian Foundation Investment Company Limited to be held at RACV City Club, 501 Bourke Street, Melbourne, Victoria at 10.00am (AEDT) on Wednesday 12 October 2016 and at any adjournment or postponement of that meeting.
Chairman to vote undirected proxies as follows: I/We acknowledge that the Chairman of the meeting intends to vote undirected proxies
in favour of each item of business, to the extent permitted by law.
Chairman authorised to exercise proxies on remuneration related matters: If I/we have appointed the Chairman of the meeting as my/our proxy (or the Chairman of the meeting becomes my/our proxy by default), I/we expressly authorise the Chairman of the meeting, to the extent permitted by law, to exercise my/our proxy in respect of item 2 even though the item is connected directly or indirectly with the remuneration of a member of key management personnel of Australian Foundation Investment Company Limited and its consolidated group, which includes the Chairman of the meeting.
Items of BusinessSTEP 2PLEASE NOTE: If you mark the Abstain box for an item, you are directing your proxy not to vote on your
behalf on a show of hands or a poll and your votes will not be counted in computing the required majority
Appoint a proxy to vote on your behalf
Signature of Shareholder(s) This section must be completed.SIGN
STEP 1
PLEASE NOTE: Leave this box blank if you have selected the Chairman of the meeting. Do not insert your own name(s).
Individual or Shareholder 1
Sole Director and Sole Company Secretary
Shareholder 2
Director
Shareholder 3
Director/Company Secretary
Contact
Name
Contact
Daytime
Telephone Date/ /
Please mark to indicate your directionsProxy Form
Change of address. If incorrect, mark this box and make the correction in the space to the left. Shareholders sponsored by a broker (reference number commences with ’X’) should advise their broker of any changes.
A F I 2 1 3 0 7 8 A
Board recommendations and undirected proxies: To fully inform shareholders in exercising their right to vote, the Board recommends that shareholders vote, and the Chairman of the Meeting intends to vote undirected proxies (to the extent permitted by law), in the manner set out beside each item of business.
Board
recommendations
For Item 2 Adoption of Remuneration Report
For Item 3 Re-election of Director – Ms Jacqueline Hey
For Item 4 Re-election of Director – Mr Peter Williams
ForA
gainst
Absta
in
I 9999999999 I N D
XX
MR JOHN SAMPLEFLAT 123123 SAMPLE STREETTHE SAMPLE HILLSAMPLE ESTATESAMPLEVILLE VIC 3030
*I1234567890*F
or p
erso
nal u
se o
nly