annual results presentation period ended 30 june 2004 · final ordinary 18¢ 13¢ +39% special 10¢...
TRANSCRIPT

Annual Results Presentation Period Ended 30 June 2004Kirby Adams, Managing Director and Chief Executive OfficerBrian Kruger, Chief Financial Officer19 August, 2004
ASX Code: BSL

Page 2
Important Notice
THIS PRESENTATION IS NOT AND DOES NOT FORM PART OF ANY OFFER, INVITATION OR RECOMMENDATION IN RESPECT OF SECURITIES. ANY DECISION TO BUY OR SELL BLUESCOPE STEEL LIMITED SECURITIES OR OTHER PRODUCTS SHOULD BE MADE ONLY AFTER SEEKING APPROPRIATE FINANCIAL ADVICE. RELIANCE SHOULD NOT BE PLACED ON INFORMATION OR OPINIONS CONTAINED IN THIS PRESENTATION AND, SUBJECT ONLY TO ANY LEGAL OBLIGATION TO DO SO, BSL DOES NOT ACCEPT ANY OBLIGATION TO CORRECT OR UPDATE THEM. THIS PRESENTATION DOES NOT TAKE INTO CONSIDERATION THE INVESTMENT OBJECTIVES, FINANCIAL SITUATION OR PARTICULAR NEEDS OF ANY PARTICULAR INVESTOR.
TO THE FULLEST EXTENT PERMITTED BY LAW, BSL AND ITS AFFILIATES AND THEIR RESPECTIVE OFFICERS, DIRECTORS, EMPLOYEES AND AGENTS, ACCEPT NO RESPONSIBILITY FOR ANY INFORMATION PROVIDED IN THIS PRESENTATION, INCLUDING ANY FORWARD LOOKING INFORMATION, AND DISCLAIM ANY LIABILITY WHATSOEVER (INCLUDING FOR NEGLIGENCE) FOR ANY LOSS HOWSOEVER ARISING FROM ANY USE OF THIS PRESENTATION OR RELIANCE ON ANYTHING CONTAINED IN OR OMITTED FROM IT OR OTHERWISE ARISING IN CONNECTION WITH THIS.

Page 3
Rewarding Shareholders Rewarding Shareholders As We GrowAs We Grow

Page 4
Safety –– Our goal remains zero harm
Lost Time Injury Frequency Rate Medically Treated Injury Frequency Rate
35
29
1614
8
4.8 3.7 4 3.4 2.8 1.8 1.3
0
5
10
15
20
25
30
35
40
1993 1994 1995 1996 1997 1998 1999 2000 2001 2002 2003 2004
80
68
60
52.247.1
29.122.4 21.9
16.912.2 9.3 6.7
0
10
20
30
40
50
60
70
80
90
1993 1994 1995 1996 1997 1998 1999 2000 2001 2002 2003 2004* Includes contractors from 1996
Injur
ies re
sultin
g in l
ost ti
me pe
r milli
on m
an-h
ours
worke
d
IISI Member Companies (2002) – 8.4Me
dicall
y tre
ated i
njurie
s per
milli
on m
an-h
ours
worke
d
* Includes contractors from 2003
But, we experienced a fatality on 29 June 2004

Page 5
Group headlines FY2004
Continued to seize market opportunities and drive business improvements
• Revenue $5.77 billion Record even with A$ strength
• Despatches 6.94 million metric tonnes Record
• NPAT $584 million Up 29% to record
• EBITDA $1,105 million First time over $1.0 billion
• EBIT $818 million Up 34%
• EPS 77.8¢ Up 36%
• Return on Invested Capital 18.5% Improvement continues
• Net Cash Flow $315 million Even after Butler & growth expenditure
• Debt Increased Up $425 million Reflects Butler acquisition and share buyback
• Gearing (net debt) 12.9% But for buyback and acquisition –would be zero
Page 6
Rewarding shareholders as we grow
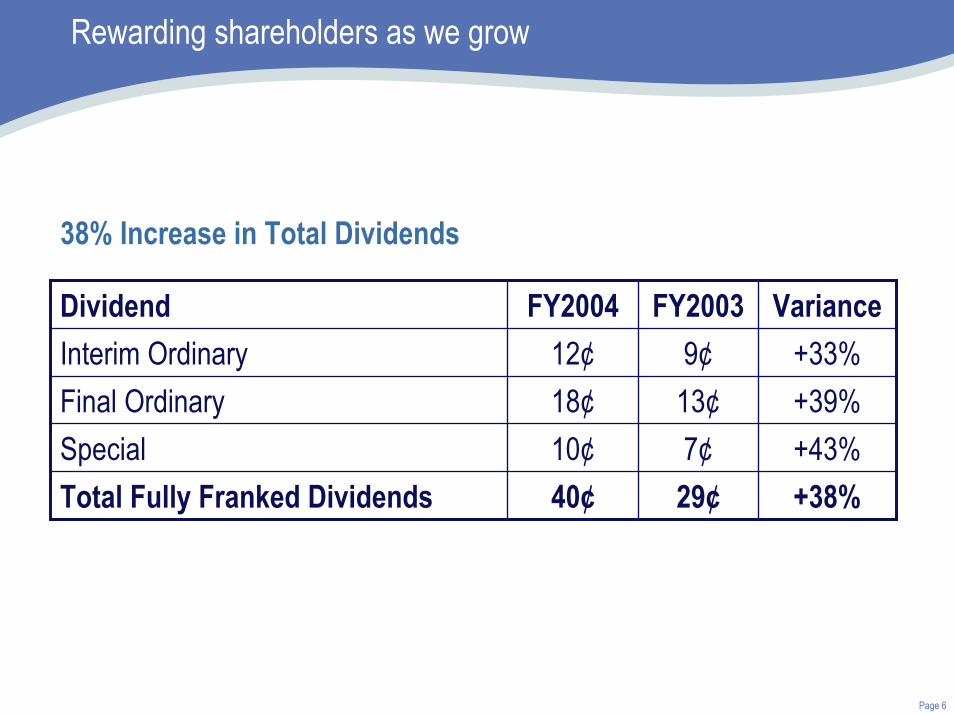
+39%13¢18¢Final Ordinary+43%7¢10¢Special
+33%9¢12¢Interim Ordinary
+38%29¢40¢Total Fully Franked Dividends
VarianceFY2003FY2004Dividend
38% Increase in Total Dividends

Page 7
•
Growing for the future benefit of shareholders
Growth initiatives underwayVietnam – new metal coating and paint line facilityThailand – second metal coating facilityChina – new metal coating and paint line facility
– BlueScope / Butler integration North America – Butler acquisition, integration and business transformation
• More recent growth initiativesHot Strip Mill upgrade – Port Kembla SteelworksProgressing West Sydney - Colorbond® steel centre

Page 8
Strong and improved financial performance across all segments
471
44
11984
565
59
197
100
-9
-100
0
100
200
300
400
500
600
Hot RolledProducts
New Zealand Steel Coated & BuildingProducts Australia
Coated & BuildingProducts Asia
Coated & BuildingProducts North
America
FY03 FY04
EBIT
A$ M
illion
s 69
71 North Star BlueScope Steel
• New business segment as at 1 May 2004
• 2 months results, including integration costs
Group EBIT $818m

Page 9
471
565
179
386
0
100
200
300
400
500
600
FY03 FY04 FY04-1H FY04-2H
Hot Rolled Products – hard work is paying off
Performance- Annual production records at PKSW and
North Star BlueScope Steel - Offset by:
stronger AUD/USDiron ore and scrap costsrepair and maintenance spendinghigher employment costs
- Enterprise Bargaining Agreement renewed
Markets- Strong global demand- Tight markets for raw materials
and product - Record prices in second half- Core long term customer relationships
• FY2004 return on net assets (pre-tax) 30.7%
• Revenue = A$2,732m
EBIT
A$ M
illion
s
69
71
2
69

Page 10
New Zealand Steel – its best ever performance
Markets- Strong NZ construction demand- Record domestic sales mix- Higher prices - particularly export- Core long term customer relationships
• FY 2004 return on net assets (pre-tax) 14.1%
• Revenue = A$560m
44
59
20
39
0
10
20
30
40
50
60
70
FY03 FY04 FY04-1H FY04-2H
EBIT
A$ M
illion
s
Performance- Record EBIT- Annual paint line production record- Metal coating expansion completed with
full benefit to be achieved in 2005- Best ever safety outcomes

Page 11
Coated & Building Products Australia – “Oh What A Feeling!”
• FY2004 return on net assets (pre-tax) 16.0%
• Revenue = A$2,884m
Performance- Annual production records- Feed costs higher in second half = margin squeeze- Low cost capacity improvements continue- Western Port
maintenance alliance operationalbest ever delivery performance
- Springhillproduction and efficiency improvements
- Customer survey affirms improved serviceToyota President’s Award
- Packaging business margin pressure
Markets- Demand never been stronger
construction, automotive, manufacturing- Signs of dwelling market slowing- Industrial/commercial remains buoyant- Price increases implemented- Strengthened channels to market
119
197
102 95
0
50
100
150
200
FY03 FY04 FY04-1H FY04-2H
EBIT
A$ M
illion
s

Page 12
Coated and Building Products Asia – the growth continues
Performance- All plants operating near full capacity- Strong volume growth of 35%- Achieved A$100m EBIT- Leading safety performance- Major capital projects developed, approved and
underway- Excellent EBIT performance in local currencies
Markets- World’s fastest growing steel market - BlueScope Steel uniquely positioned- Prices higher in local currencies- Pre-engineered building demand growing in
Asia – immediate scale achieved in China through Butler acquisition
- BlueScope Steel’s branded products increasing presence and growing reputation
84
100
4555
0
20
40
60
80
100
120
FY03 FY04 FY04-1H FY04-2H
EBIT
A$ M
illion
s
• FY2004 return on net assets (pre-tax) 21.5%
• Revenue = A$689m

Page 13
Index of EBIT performance of Asian businesses in local currencies
0
100
200
300
400
2001 2002 2003 2004
Thailand Malaysia Indonesia China

Page 14
Coated and Building Products North America – foundations in place
• Butler Manufacturing Co. acquisition completed 27 April 2004- No negative surprises- Integration team making good progress- New management structure in place- Galesburg facility to close mid-CY2005- Timber business (Lester) sold in July 2004
• Continued improvement in non-residential buildings construction in U.S.- Butler Buildings order backlog up- Vistawall despatches stronger
• Challenges - Rapid steel price increases, higher aluminium costs- Limited steel availability
………………………………………………………………………………………………..
• On target to achieve consolidated financial goals stated at acquisition- FY05 EPS neutral- FY06 EPS positive
Page 15
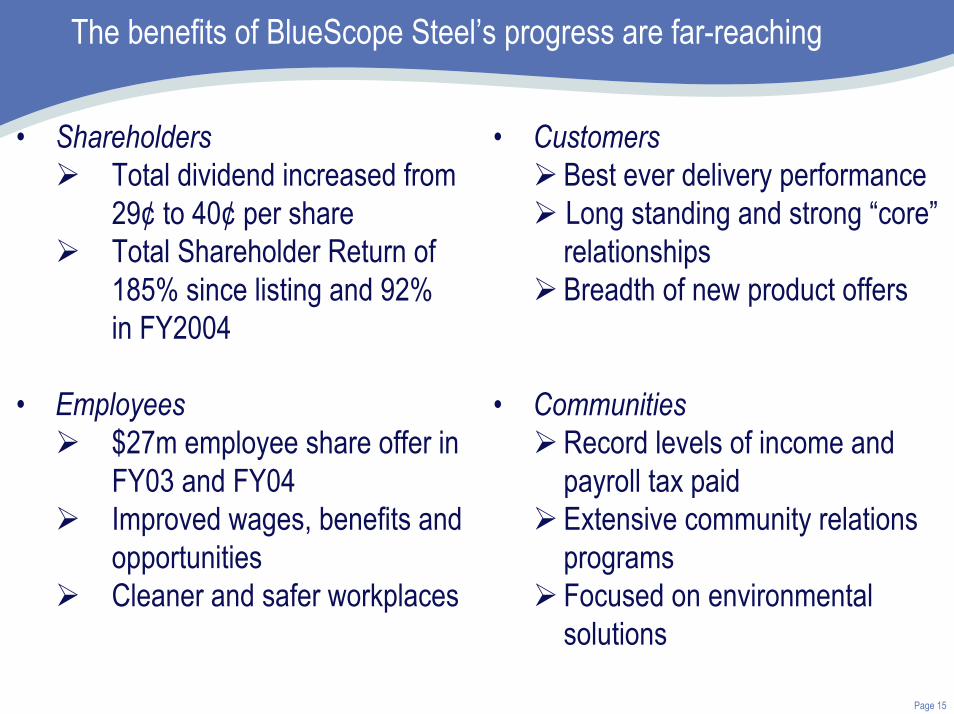
The benefits of BlueScope Steel’s progress are far-reaching
• ShareholdersTotal dividend increased from 29¢ to 40¢ per shareTotal Shareholder Return of 185% since listing and 92% in FY2004
• Employees$27m employee share offer in FY03 and FY04 Improved wages, benefits and opportunities Cleaner and safer workplaces
• CustomersBest ever delivery performanceLong standing and strong “core”relationshipsBreadth of new product offers
• CommunitiesRecord levels of income and payroll tax paidExtensive community relations programsFocused on environmental solutions

Page 16
FinancialsFinancials

Page 17
Continued strong earnings performance
A$ Millions 2000(1) 2001(1) 2002(1) 2003 2004(3) 2004-1H 2004-2H(3)
Revenue 4,898 4,941 4,593 5,302 5,770 2,619 3,151
EBITDA(2) 711 568 412 881 1,105 440 665
EBIT(2) 445 305 160 611 818 302 516
Net Profit 452 584 227 357
EPS (¢)(4) 57.1 77.8 (1) 2000 to and including 2002 normalised.(2) Includes profit/loss for North Star BlueScope Steel.(3) Includes two months of BlueScope Butler financial results.(4) Weighted average shares on issue 791.5m FY03 and 750.5m FY04.

Page 18
EBIT variance – FY2004 vs. FY2003
100
300
500
700
900
1100
June 03YTD Actual
ExportPrices
DomesticPrices
Volume /Mix
NSBSL ExchangeRates
Conversion& OtherCosts
RawMaterialCosts
Other June 04YTD Actual
EBIT A$m
$611m
$300m
$818m
($130m)
$79m
$70m($85m)
($111m)
$2m
$82m
Higher R&M (42)Employment costs (42)Freight (18)Cost improvements 68
FY03 Superannuation Contribution 32FY03 Name ChangeProvision 20Lower Restructuring Costs 31

Page 19
EBIT variance – June 04 half year vs. December 03 half year
0
100
200
300
400
500
600
700
800
Dec 03 Half Export Prices DomesticPrices
Volume / Mix NSBSL ExchangeRates
Conversion &Other Costs
Raw MaterialCosts
Other June 04 Half
EBIT A$m
$302m
$223m $516m
($55m)
$10m$21m
($74m)
($10m)
$68m
$31m

Page 20
Balance Sheet – strength and flexibility
A s A t E x c lu d in g F Y 0 4 a c q u is it io n s
A $ M ill io n s 3 0 J u n e 2 0 0 3 3 0 J u n e 2 0 0 4 3 0 J u n e
2 0 0 4 A s s e ts C a s h 9 1 1 1 9 9 1 R e c e iv a b le s 6 5 0 9 9 6 7 8 5 In v e n to ry 6 9 8 9 6 2 7 6 2 O th e r A s s e ts 2 2 8 4 1 6 3 2 5 N e t F ix e d A s s e ts 3 ,0 8 6 3 ,2 8 9 3 ,0 9 0
T o ta l A s s e ts 4 ,7 5 3 5 ,7 8 2 5 ,0 5 3
L ia b il it ie s C re d ito rs 4 9 3 7 2 8 5 6 8 In te re s t B e a r in g L ia b il i t ie s 1 6 8 5 9 3 1 9 7 P ro v is io n s 1 ,0 0 1 1 ,2 6 7 1 ,0 9 4 T o ta l L ia b il it ie s 1 ,6 6 2 2 ,5 8 8 1 ,8 5 9
N e t A s s e ts 3 ,0 9 1 3 ,1 9 4 3 ,1 9 4
• Net Debt / (Net Debt + Equity) 2.4% 12.9%(excluding off balance sheet items)

Page 21
Major growth initiatives – capital spending profile
114
-
53
45
1
15
FY2006
13
-
13
-
-
-
FY2007
405365897Total(3)
-277277Butler acquisition
34-100Port Kembla HSM expansion(1)
21124280China(1)
601980Thailand(1)
10045160Vietnam(1)
FY2005FY2004 Actual
Total Est. Capex/Cost
All in A$m
(1) Estimated capital costs based on forecast exchange rate assumptions.
(2) Butler acquisition cost less cash acquired and not including the benefit of Louisiana Pacific Corporation settlement proceeds received of US$21m.
(3) Addition of smaller capital spending programmes bringing total approved CAPEX to over A$1 billion.

Page 22
Capital management - continued focus on returns to shareholders
• Share Buyback- Purchased/cancelled 60.7m shares- Further program – 16.0m shares
• Dividends - All Fully Franked
913 12
18
7
10
0
5
10
15
20
25
30
FY2003-1H FY2003-2H FY2004-1H FY2004-2H
SpecialOrdinary
¢
¢¢
Cent
s Per
Sha
re
Total return to shareholders since public listing:
• Initial buyback $286m• Dividends Paid $313m• Final/Special
(to be paid) $208m$807m
¢
29¢
40¢
¢
¢

Page 23
Consistently strong cash flows
A$ millions 2000(1) 2001(1) 2002(1) 2003 2004 2004-1H 2004-2H Net operating cash flow before borrowing costs and income tax
715 631 381 763 893 357 536
Net investing cash flows - Capital expenditure - Other
(90) 10
(105)
(6)
(162)
8
(183)
18
(290) (288)
(99) (3)
(191) (285)
Net cash flow before financing & tax
635 520 227 598 315 255 60
Net financing cash flow (493) 75 (8) 83 Payment of income tax (29) (119) (84) (35) Net dividends (75) (244) (155) (89) Net increase in cash held 1 27 8 19
(1) 2000 to and including 2002 normalised.

Page 24
Results remain sensitive to BlueScope Steel’s realised hot rolled coil prices
(1) The change in export HRC price assumes proportional effect on export slab, and flow on to domestic pipe and tube market and to other export products.
(2) The movement in the Australian dollar/US dollar exchange rate includes the restatement of US dollar denominated receivables and payables.
Estimated impact on forecast
EBIT (A$mil) for year ending 30/06/05
Assumption +/– US$25 / tonne movement in BSL’s average realised HRC price(1) 75 +/– 1¢ movement in Australian dollar / US dollar exchange rate(2) 13 +/– US$10 / tonne movement in NSBHP scrap to HRC price spread 12 +/– 2% movement in slab production in Australia and New Zealand 24 +/– US$1 / tonne movement in coking coal costs 5 +/– US$1 / tonne movement in iron ore costs 10

Page 25
Looking forward to 2005
• Global steel industry
• Higher costs
• BlueScope Steel strategy
• Outlook for BlueScope Steel

Page 26
North AmericaNorth America• Record HRC prices• Scrap surcharges and
volatility• Steel availability• Consolidation continues• Economic recovery
Global steel industry - dynamic
IndiaIndia• Increasing steel capacity• Growing GDP demand
South AmericaSouth America• Plans for new capacity• Raw material rich• Low cost
EuropeEurope• Weak demand continues• Consolidation benefits
CISCIS• Restricted scrap exports• Stronger economies
JapanJapan• Production at capacity• Significant exports
ChinaChina• World’s largest steel consumer
and producer• Less than 5% of BlueScope
Steel sales• Indirect impact significant• Net importer of flat steel• Slowdown welcome• Raw material / shipping effect
Australia / New ZealandAustralia / New Zealand• Strong economic growth• Interest rates?
KoreaKorea• Shipyards full• BlueScope Steel customer
SE AsiaSE Asia• Improved economic growth• Volatile tariff structures

Page 27
Steel making raw material costs are increasing
0
1,000
2,000
3,000
4,000
5,000
6,000
Nov-9
9
May-0
0
Nov-0
0
May-0
1
Nov-0
1
May-0
2
Nov-0
2
May-0
3
Nov-0
3
May-0
4
BDI Index
ShippingIron Ore Coal
“…unprecedented demand and extremely tight supply position…”
“…China reducing exports…” “…2-3 Year backlog for shipbuilders…”
BDI – Baltic Dry IndexIron Ore and Coal – Aus-Japan Reference PricesSource: IISI, Baltic Dry Index, SSY
SOURCE: ANZ Bank ‘Resources Market Outlook’, Mar 04

Page 28
Other metallic coating material costs also increasing
1,000
1,200
1,400
1,600
1,800
2,000
Jun-98
Apr-99
Feb-00
Dec-00
Oct-01Aug-
02Jun
-03Apr-0
4
US $
/TON
NE
500
700
900
1,100
1,300
1,500
Jun-98
Apr-99
Feb-00
Dec-00
Oct-01
Aug-02
Jun-03
Apr-04
US $
/TON
NE
3,000
5,000
7,000
9,000
Jun-98
Apr-99
Feb-00
Dec-00
Oct-01
Aug-02
Jun-03
Apr-04
US $
/TON
NE
`
TinAluminium Zinc
“Chinese and world demand outpacing supply. Concentrate inventories depleted.”
“Chinese demand is still growing. Potential for further price rises.”
“Chinese demand has driven 25-30% price rise since 2001. Recent Chinese Government actions caused minor price fall . . . which may be only temporary.”
Source: London Metal Exchange (LME)

Page 29
Marine freight – well managed to minimise costs
• Global marine freight market continues to be tight
• BlueScope Steel’s approach- stagger renewals- long term relationships- limited “spot” contracts
• BlueScope Steel largely insulated in FY2004
• In FY2005:- Approximately half of our marine freight cost is exposed
to higher costs . . . totalling a net A$70m or approximately 10% of our total transportation spend

Page 30
Our strategy is unchanged
• Asia and Regional Growth
• Value-added branded products
• Asset productivity
• Disciplined capital management
• World-class low-cost operations
• Manufacturing excellence
• Supply chain velocity
• Cost reductions
• Vigorously defend existing value
Cold Rolled
Painted
Roll-forming
Metallic Coated
Vietnam
Australia & NZ Brownfields
Australia & NZ Brownfields
China
Vietnam
Thailand China
Water
ButlerPEB/Solutions
Hot Rolled Coil, Plate
Slab
HSM Expansion

Page 31
2004 was another good year . . . and the momentum continues
• Anticipate another good year in 2005
• Challenges ahead- much higher slab / HRC prices in first half leading to further
margin pressure downstream- adjusting to higher raw material and freight cost environment - achieving productivity to offset higher wage / employment costs
• Opportunities ahead- Butler turnaround and PEB growth- safe and successful project construction- new products and markets - choosing amongst myriad of growth opportunities- further execution of our strategy
• Seize benefits of our diversified product and geographic portfolio
• Continue to reward our shareholders as we grow

Annual Results Presentation Period Ended 30 June 2004Kirby Adams, Managing Director and Chief Executive OfficerBrian Kruger, Chief Financial Officer19 August, 2004
ASX Code: BSL

Page 33
Creating shareholder value as we grow
Challenging Global Steel
Market
Challenging Global Steel
Market
Profitable Through the
Cycle
Profitable Through the
Cycle
Geographic and Product
Diversity
Geographic and Product
Diversity
Strong and Flexible Capital
Structure
Strong and Flexible Capital
Structure
Consistently Strong Cash
Flows
Consistently Strong Cash
Flows
Strong Board & Management
Team
Strong Board & Management
Team
Value Added Branded Products
Value Added Branded Products
Growth Opportunities in
Asia
Growth Opportunities in
Asia
Low Cost Producer
Low Cost Producer
Strong Operating
Track Record
Strong Operating
Track Record
A VERY DIFFERENT KIND OF STEEL
COMPANY