australian capital territory - the university of adelaide · australians conducted in the six...
TRANSCRIPT
DENTAL STATISTICS AND RESEARCH SERIES Number 39
Australian Institute of Health and Welfare Canberra
Cat. no DEN 175
The National Survey of Adult Oral Health 2004–06
Australian Capital Territory
2008
© Australian Institute of Health and Welfare 2008 This work is copyright. Apart from any use as permitted under the Copyright Act 1968, no part may be reproduced without prior written permission from the Australian Institute of Health and Welfare. Requests and enquiries concerning reproduction and rights should be directed to the Head, Media and Communications Unit, Australian Institute of Health and Welfare, GPO Box 570, Canberra ACT 2601. This publication is part of the Australian Institute of Health and Welfare’s Dental and Statistics Research series. A complete list of the Institute’s publications is available from the Institute’s website <www.aihw.gov.au>. ISSN 1321-0254 ISBN 978 1 74024 781 8
Suggested citation
AIHW Dental Statistics and Research Unit 2008. The National Survey of Adult Oral Health 2004–06: Australian Capital Territory. Cat. no. DEN 175. Dental Statistics and Research Series no. 39. Canberra: Australian Institute of Health and Welfare.
Australian Institute of Health and Welfare
Board Chair Hon. Peter Collins, AM, QC Director Penny Allbon Published by the Australian Institute of Health and Welfare Printed by
Contents
Abbreviations....................................................................................................................................... v Symbols................................................................................................................................................ vi Acknowledgments.............................................................................................................................. vi Overview of results ..............................................................................................................................1
Oral health status ...........................................................................................................................1 Oral health care...............................................................................................................................1 Oral health perceptions .................................................................................................................1
1 Introduction....................................................................................................................................2 Purpose and organisation of this report .....................................................................................3 Background to the survey .............................................................................................................3 Aspects of oral health and dental care relevant to the National Oral Health Plan...............5
2 Methods ..........................................................................................................................................6 Study population and sampling...................................................................................................6 Sampled postcodes.........................................................................................................................6 Computer-assisted telephone interview .....................................................................................6 Oral epidemiological examination...............................................................................................7 Period of data collection..............................................................................................................11 Ethical conduct of research .........................................................................................................11 Target sample size........................................................................................................................11 Participation in the survey..........................................................................................................12 Data analysis .................................................................................................................................12 Distribution of sociodemographic and dental access characteristics....................................15
3 Oral health status ........................................................................................................................16 Complete tooth loss .....................................................................................................................16 Inadequate natural dentition among dentate people..............................................................18 Denture wearing by dentate people ..........................................................................................20 Average number of teeth per person missing due to pathology...........................................22 Prevalence of untreated coronal decay .....................................................................................24 Percentage of people with untreated root decay .....................................................................26 Percentage of people with one or more filled teeth.................................................................28 Average number of decayed, missing and filled teeth per person .......................................30 Prevalence of moderate or severe periodontitis ......................................................................32 Prevalence of deep pocket depth ...............................................................................................34 Prevalence of 4+ mm clinical attachment loss..........................................................................36 Prevalence of gingival inflammation.........................................................................................38
The National Survey of Adult Oral Health 2004–06: Australian Capital Territory iii
4 Oral health care............................................................................................................................40 People’s most recent dental visit................................................................................................40 Attendance at private dental practice .......................................................................................42 Payments by patients for dental care ........................................................................................44 Government-subsidised dental care in private sector ............................................................46 People’s usual pattern of dental visits.......................................................................................48 Usual attendance at the same dentist ........................................................................................50 Usual dental attendance for a check-up....................................................................................52 Dental care avoided or delayed due to cost .............................................................................54 Recommended dental treatment foregone due to cost ...........................................................56 Difficulty paying a $100 dental bill............................................................................................58 Percentage of people avoiding foods due to dental problems ..............................................60
5 Oral health perceptions..............................................................................................................62 Percentage of people rating their oral health as fair or poor .................................................62 Percentage of people experiencing toothache..........................................................................64 Percentage of people experiencing orofacial pain ...................................................................66 Perceived need for dentures .......................................................................................................68 Perceived need for dental extraction or filling.........................................................................70 Perceived need for a dental check-up .......................................................................................72 Perceived urgency of dental treatment needs..........................................................................74 Age-standardised comparison between government health cardholders and non-health cardholders ...............................................................................................................76 Age-standardised comparison between the dentally insured and the uninsured..............78
Appendix..............................................................................................................................................80 Sample counts...............................................................................................................................80
Glossary................................................................................................................................................82 References............................................................................................................................................85 List of tables ........................................................................................................................................88
iv The National Survey of Adult Oral Health 2004–06: Australian Capital Territory
Abbreviations
AAP American Academy of Periodontology AHMAC Australian Health Ministers’ Advisory Council AIHW Australian Institute of Health and Welfare ARCPOH Australian Research Centre for Population Oral Health CAL clinical attachment loss CATI computer-assisted telephone interview CDC US Centers for Disease Control and Prevention CEJ cemento-enamel junction DHS Department of Human Services, Melbourne DMFT number of decayed, missing and filled permanent teeth DSRU Dental Statistics and Research Unit IRSAD Index of Relative Socioeconomic Advantage/Disadvantage MT missing teeth NHANES US National Health and Nutrition Examination Survey NHMRC National Health and Medical Research Council NOHSA National Oral Health Survey of Australia NSAOH National Survey of Adult Oral Health SEIFA Socioeconomic Indices for Areas
Place abbreviations ACT Australian Capital Territory NSW New South Wales NT Northern Territory Qld Queensland SA South Australia Tas Tasmania UK United Kingdom US United States Vic Victoria WA Western Australia
The National Survey of Adult Oral Health 2004–06: Australian Capital Territory v
Symbols
$ Australian dollars
% per cent
. . not applicable
— nil
> greater than
< less than
≥ greater than or equal to
≤ less than or equal to
<0 estimate is less than zero
Acknowledgments
This publication was prepared by the following authors at the Australian Research Centre for Population Oral Health (ARCPOH):
Authors Loc Do
Anne Ellershaw
Jane Harford
Liana Luzzi
Kaye Roberts-Thomson
Gary Slade
John Spencer
Editorial team Alison McLean and Lorna Lucas (ARCPOH) contributed to the editing of this publication and proofreading was by Jo Mason. All three worked to improve the consistency, layout and readability of the text.
vi The National Survey of Adult Oral Health 2004–06: Australian Capital Territory
ACT Survey personnel Survey manager Dr Stuart Long
Appointment coordinator Ms Virginia Mazzarol
Dentist examiners Dr Hugh Gibbon, Dr Julie Sandeep Sandu
Dental recorders Ms Julie Evans, Ms Julie Kleeson
Scientific Advisory Committee members Dr Peter Barnard, Australian Dental Association
Professor Mike Morgan, The University of Melbourne
Mr Gary Niedorfer, Australian Bureau of Statistics
Professor Brian Oldenburg, Monash University
Professor Eric Reynolds, The University of Melbourne
Dr Ken Tallis, Australian Institute of Health and Welfare
Community and Professional Advisory Committee members Dr Louise Brown, Australian and New Zealand Academy of Periodontists
Ms Samantha Edmonds, Council of Social Service of NSW (NCOSS)
Mr Errol Evans, Oral Health Unit, Queensland Health (alternate Dr Paul Wood)
Ms Chris Morris, South Australian Dental Service
Dr David Neesham, Dental Health Services, Western Australia (alternate Dr Martin Glick)
Dr Bill O’Reilly, Australian Dental Association Federal Executive
Ms Lindsay Simmons, Council of the Ageing
Ms Tracey Slater, Department of Human Services, Victoria
Funding sources for the 2004–06 National Survey of Adult Oral Health National Health and Medical Research Council, Project Grant #299060
National Health and Medical Research Council, Project Grant #349514
National Health and Medical Research Council, Capacity Building Grant #349537
Australian Government Department of Health and Ageing, Population Health Division
Australian Institute of Health and Welfare
Colgate Oral Care
Australian Dental Association
US Centers for Disease Control and Prevention, Research Participation Program
The National Survey of Adult Oral Health 2004–06: Australian Capital Territory vii
viii The National Survey of Adult Oral Health 2004–06: Australian Capital Territory
ARCPOH interviewers CATI supervisors Scott Crowley, Meredith Morgan
CATI interviewers Jan Anderson, Olivia Baker, Jenny Cates, Debra Flack, Susie Garner, Alex Holland, Jessica Holder, Dora Jankumas, Claire Leske, Peter Monaghan, Patricia Moyle, Grant Noble, Alison Packer, Mary Porter, Jenny Proeve, Verity Proeve, Edmund Redgrove, Joanne Rogers, Joy Simmons, Kaye Sparrow, Lachlan Spencer, Michelle Storan, Sue Tanner, Zoe Taylor, Theodora Trovas, Jenny Venn, Tammy White
Overview of results
This report describes levels of oral health in the adult population of the Australian Capital Territory (ACT) at the beginning of the twenty-first century. The findings are from the 2004–06 National Survey of Adult Oral Health (NSAOH). In ACT, 1,025 people were interviewed and 400 people were dentally examined for the survey. This report presents percentages and means for 30 oral health indicators in tables that compare three age groups and classify people according to five sociodemographic characteristics: sex, residential locality, socioeconomic status of residential postcode, government health card status and dental insurance.
Oral health status • 2.8% of people had no natural teeth and among dentate people, an average of 3.1 teeth
per person were missing. These and two other indicators of tooth loss were more frequent among government health cardholders compared with non-cardholders.
• 18.7% of people had untreated dental decay and an average of 11.0 teeth per person were decayed, missing or filled. There was relatively little variation among sociodemographic groups in indicators of dental decay experience.
• 18.6% of people had inflamed gums and 12.8% had moderate or severe gum disease. Two indicators of gum disease occurred more frequently among uninsured compared with insured people.
Oral health care • 66.4% of people had visited a dentist within the preceding 12 months, and 60.4% said
they usually did so. These and two other measures of dental attendance varied according to government health card status and dental insurance status.
• 83.5% of people had a dentist that they usually attended, although 28.7% said that they avoided or delayed dental care due to its cost. Barriers to dental care were most strongly associated with having a government health card and a lack of dental insurance.
Oral health perceptions • 16.1% of people said they had avoided some foods due to dental problems and
15.9% had experienced toothache in the preceding 12 months. Perceptions of poor oral health were associated with having a government health card and a lack of dental insurance.
• 29.9% of people felt they needed an extraction or filling, although only 5.5% said they needed dentures. Need for dental treatment was perceived more frequently by uninsured than insured people.
Age-standardised analysis revealed that government health cardholders had poorer outcomes for 17 of the 29 outcomes, while the uninsured had poorer outcomes for 17 of the 30 indicators reported.
The National Survey of Adult Oral Health 2004–06: Australian Capital Territory 1
1 Introduction
This report presents findings from the ACT component of the 2004–06 National Survey of Adult Oral Health (NSAOH). Information was collected using interviews and standardised dental examinations that were conducted among a random sample of ACT residents aged 15 years or more. Three major themes are reported in chapters describing oral health status, oral health care and perceptions of oral health. Statistics summarising those themes are tabulated for the ACT adult population and for three age groups that are further classified according to: sex, residential locality, socioeconomic status of the area in which they live, government health cardholder status and dental insurance.
The 2004–06 NSAOH took place 17 years after the first oral examination survey of Australians conducted in the six states and the Australian Capital Territory (Barnard 1993). State/territory reports from that 1987–88 National Oral Health Survey of Australia (NOHSA) highlighted variations among age groups, between the sexes and between people living in or outside capital cities. The major findings reported from the survey were: • children’s dental decay rates were low by historical standards and when compared
internationally • nearly one-half (48%) of adults had made a dental visit within the preceding year, the
majority of them to a private dental practice (88%) • however, 44% of adults were found to need one or more dental fillings • the percentage of Australians with complete tooth loss had reduced compared with
earlier interview surveys although 50% of people aged 65 years or more had no natural teeth and
• one of the four national oral health targets had been achieved and it was expected that the remaining three targets would be achieved by 2000.
However, the first survey did not collect information about government health cardholder status or socioeconomic status, and results were not contrasted between insured and uninsured.
In the 17-year period since the NOHSA, there has been substantial growth in public sector dental care and dental insurance. Increasingly, national and state/territory health goals call for reductions in socioeconomic inequalities in health, including oral health. For those reasons, this report includes a focus on the relationship between oral health and indicators of socioeconomic status and access to dental care, as well as the traditional demographic markers of age, sex and residential location.
2 The National Survey of Adult Oral Health 2004–06: Australian Capital Territory
Purpose and organisation of this report The purpose of this report is to provide a descriptive ‘snapshot’ of oral health in the adult population of ACT. The findings are intended to provide up-to-date evidence that can contribute to the development of oral health policies and programs in ACT.
This introductory chapter outlines the motives for undertaking the survey. Chapter 2 reviews the survey’s methods and describes the population distribution of sociodemographic and dental access characteristics presented in later tables. Statistical findings regarding oral health status are tabulated and described in Chapter 3, followed by statistical findings regarding oral health care (Chapter 4) and perceptions of oral health (Chapter 5). The Appendix contains additional tables of oral health statistics for conventional 10-year age groups. These are narrower than the age ranges reported in the chapters, and are presented to permit comparisons with surveys conducted at other places and other times.
The national report of the survey’s findings (Slade et al. 2007) provides additional details about the survey, including participation rates and analysis of potential biases due to non-participation. The national report also presents qualitative findings from ‘oral histories’ conducted with a small number of survey participants to document historical influences on the nation’s oral health. Further appendix material is available at:
<http://www.arcpoh.adelaide.edu.au/project/distribution/NSAOH.html>.
Background to the survey Up-to-date information about population oral health is important because oral diseases have broad implications for the health of the public. Dental problems are ranked among the most frequently reported illness episodes by Australians (AIHW 2000), and provision of dental care accounts for 6.6% of recurrent health expenditure in 2005–06 (AIHW 2007). In the United States the Surgeon General characterised oral disease as a ‘silent epidemic’ (Surgeon General 2000).
In the 17 years following the 1987–88 NOHSA, no state-wide oral examination surveys of adults have been conducted. Instead, published oral examination surveys were restricted to special groups of the adult population and often they were conducted within selected locations in states. They included studies of oral health in: • military recruits (Dawson & Smales 1994; Hopcraft & Morgan 2003a,b, 2005, 2006;
Morgan et al. 1992) • adults in Melbourne (Wright et al. 1994) • community-dwelling elderly people (Bergman et al. 1991; Chalmers, Carter & Spencer
2002; Slade et al. 1993; Slade & Spencer 1995, 1997; Thomson et al. 1995) • elderly people living in nursing homes or hostels (Chalmers, Carter, Fuss et al. 2002;
Chalmers, Hodge et al. 2002; Chalmers et al. 2005; Saub & Evans 2001) • Aboriginals and Torres Strait Islanders (Endean et al. 2004; Smith et al. 2007) • immigrants (Marino et al. 2001, 2007) or refugees (Kingsford Smith & Szuster 2000) • prisoners (Osborn et al. 2003) • patients receiving dental care in public dental services (Brennan et al. 2000, 2001, 2007;
Brennan & Spencer 2004) and • patients with selected medical conditions (Coates et al. 1996, 2000).
The National Survey of Adult Oral Health 2004–06: Australian Capital Territory 3
By the late 1990s, several collaborative efforts among federal and state/territory stakeholders attempted to secure support for a second national oral health survey, although none were funded. Renewed impetus for a national survey began with the work of the National Advisory Committee on Oral Health (AHMAC 2001). The committee formulated a National Oral Health Plan for the period 2004–13 comprising seven action areas: • promotion of oral health across the population • children and adolescents • older people • people with low income and social disadvantage • people with special needs • Aboriginal and Torres Strait Islander people and • workforce development.
One of four short-term goals listed for the plan’s first action area was the conduct of a national survey of adult oral health. Fulfilment of that goal became possible in 2003 when researchers at the Australian Research Centre for Population Oral Health (ARCPOH) in The University of Adelaide sought project grant funding from the National Health and Medical Research Council (NHMRC). The proposal was for funding to support a collaborative project that pooled resources already committed or promised from the following sources: funding from the Australian Government Department of Health and Ageing to the Dental Statistics and Research Unit (DSRU) within ARCPOH to undertake a telephone interview survey; commitment of staff from oral health sections within state and territory health departments to conduct oral epidemiological examinations; and core funding from the Australian Institute of Health and Welfare (AIHW) to DSRU. Following peer review, the NHMRC awarded a project grant to ARCPOH in November 2003.
4 The National Survey of Adult Oral Health 2004–06: Australian Capital Territory
Aspects of oral health and dental care relevant to the National Oral Health Plan The National Oral Health Plan outlined nine population indicators that were informative in developing the plan and that are cited as key performance indicators to evaluate the outcomes of the plan. This survey reports findings that relate to six of those key performance indicators: • The percentage of the dentate population reporting a social impact (for example
toothache, difficulty chewing, concerned about appearance) because of problems with teeth, mouth or gums in the last 12 months, by age group, living circumstance, government health cardholder status, Indigenous identity and special needs.
• The percentage of the population with untreated decay, by age group, living circumstance, government health cardholder status and Indigenous identity.
• The proportion of the dentate population with a maximum periodontal pocketing of 3.5 mm and 5.5 mm, by age group.
• The mean number of missing teeth and proportion of existing teeth with untreated decay, by age group, living circumstance, government health cardholder status and card status, and Indigenous identity.
• The percentage of the dentate population who visited a dental practitioner in the last 2 years, by age group, living circumstance, government health cardholder status and Indigenous identity.
• The percentage of the dentate population whose reason for visiting a dental practitioner in the last 12 months was for a check-up, by age group, living circumstance, government health cardholder status and Indigenous identity.
The National Survey of Adult Oral Health 2004–06: Australian Capital Territory 5
2 Methods
Full details of the survey’s methods have been described in Chapter 2 of the national report (Slade et al. 2007). The following summary highlights the main methodological features of the survey.
Study population and sampling A three-stage, stratified clustered sampling design was used to select people from the target population of Australian residents aged 15 years or more: • Postcodes were sampled at random from capital city and non-capital city strata in six
states and the Northern Territory, and from a single stratum in the Australian Capital Territory. Postcodes represented the geographic clustering in the design and were selected with probability proportional to size, where size was defined as the number of households listed in the ‘electronic white pages’ in each postcode.
• A systematic sample of households listed in the ‘electronic white pages’ was selected for each sampled postcode. Thirty households per metropolitan stratum and 40 households per ex-metropolitan stratum were selected.
• One person aged 15 years or more was randomly selected per household. In households with only one person aged 15 years or more, that person was selected. In other households telephone interviewers asked for the name of the person aged ≥15 years who most recently had had a birthday and the name of the person aged ≥15 years who would next have a birthday. A computer algorithm then selected one of those two people at random.
Sampled postcodes In ACT the following postcodes were sampled: 2600, 2601, 2602, 2603, 2604, 2605, 2606, 2607, 2609, 2611, 2612, 2614, 2615, 2617, 2618, 2620, 2900, 2902, 2903, 2904, 2905, 2906, 2912, 2913, 2914.
Computer-assisted telephone interview Self-reported information about oral health and characteristics associated with it was obtained though telephone interviews. Interviewers read questions from a computer screen and recorded answers directly onto the computer. They were conducted from a dedicated computer-assisted telephone interview (CATI) suite at University of Adelaide research offices. The methods were based on those advocated by Dillman (2000), including the mailing of a letter to households prior to telephoning, a protocol for contacting each household and standardised procedures for asking questions and recording answers. Interviews were conducted by 29 interviewers, each of whom was trained in the survey methods. Every effort was made to interview the target person although, in certain circumstances, the questions were answered by another adult in the form of a proxy interview.
6 The National Survey of Adult Oral Health 2004–06: Australian Capital Territory
The interview consisted of 79 questions, several with multiple response categories. A copy of the questions used is included in an Appendix available online:
<http://www.arcpoh.adelaide.edu.au/project/distribution/NSAOH.html>.
Oral epidemiological examination Information about clinical oral status was collected during standardised dental examinations conducted by dentists who undertook training in the survey procedures. Examinations were limited to people who reported having some or all of their own natural teeth at the time of the interview. Examining dentists followed a standardised protocol to record levels of tooth loss, dental decay experience, tooth wear and—for subjects with no medical contraindications to periodontal probing—signs of gum disease. During data collection, replicate examinations were conducted for approximately five study participants per examiner to evaluate the consistency of their findings when judged against the principal survey examiner.
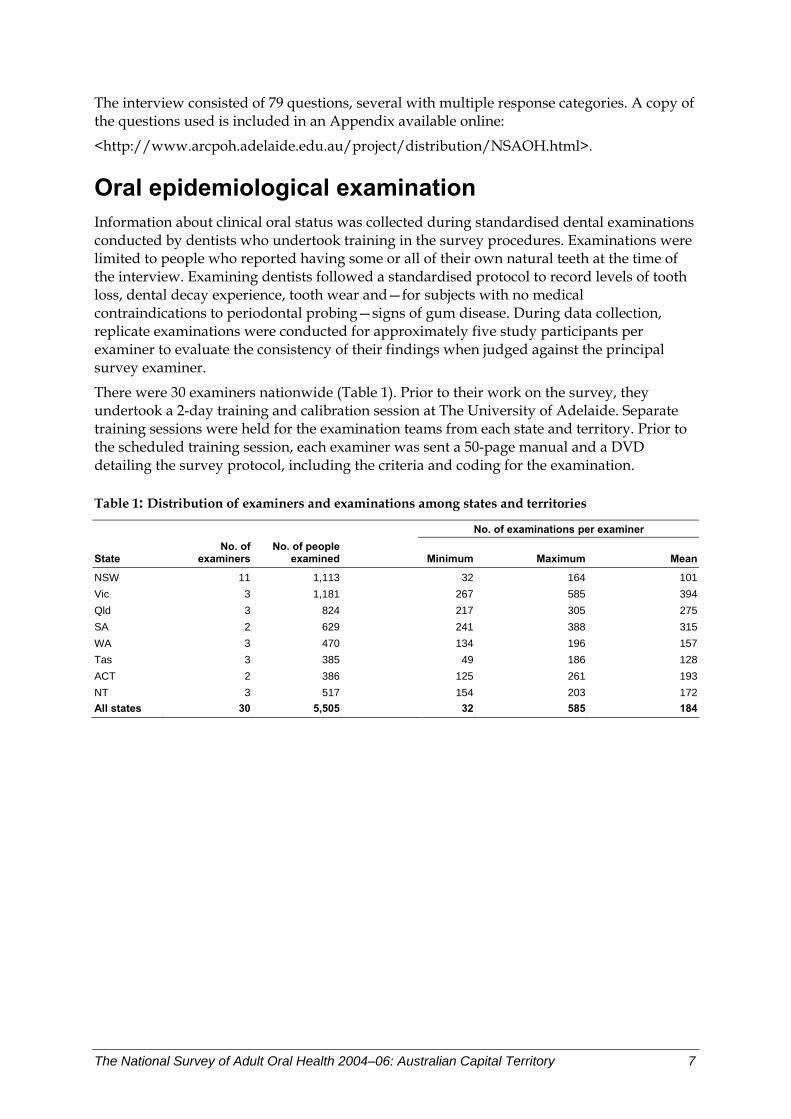
There were 30 examiners nationwide (Table 1). Prior to their work on the survey, they undertook a 2-day training and calibration session at The University of Adelaide. Separate training sessions were held for the examination teams from each state and territory. Prior to the scheduled training session, each examiner was sent a 50-page manual and a DVD detailing the survey protocol, including the criteria and coding for the examination.
Table 1: Distribution of examiners and examinations among states and territories
No. of examinations per examiner
State No. of
examiners No. of people
examined Minimum Maximum Mean
NSW 11 1,113 32 164 101Vic 3 1,181 267 585 394Qld 3 824 217 305 275SA 2 629 241 388 315WA 3 470 134 196 157Tas 3 385 49 186 128ACT 2 386 125 261 193NT 3 517 154 203 172All states 30 5,505 32 585 184
The National Survey of Adult Oral Health 2004–06: Australian Capital Territory 7
Scope of examination Survey participants were examined in a supine position in standard dental chairs with illumination provided by the chair’s overhead dental light. Examiners used an intra-oral mirror that additionally had its own battery-powered light source. A periodontal probe with 2-mm markings was used to record distances, for example when assessing periodontal destruction (described further below); however, sharp explorers were not used and no radiographs were taken. Full details of the examination protocol are provided online:
<http://www.arcpoh.adelaide.edu.au/project/distribution/NSAOH.html>.
The following overview summarises criteria used to assess the main oral health variables reported in this volume.
Tooth loss For people aged less than 45 years, examiners distinguished between missing teeth that had been extracted due to decay or periodontal disease and teeth that were absent for any other reason (that is, congenitally missing; unerupted; or extracted for orthodontics, trauma or impaction). For people aged 45 years or more, no such distinction was made, so that an extracted or otherwise absent tooth was recorded as missing. Dental implants, root fragments and deciduous teeth were coded separately and not counted as missing or absent teeth.
Replacement teeth All lost teeth were further classified as replaced or not replaced by a fixed bridge or a removable denture that was worn to the examination.
Decay experience of coronal tooth surfaces All teeth present were subdivided into five tooth surfaces: mesial, buccal, distal, lingual, and either occlusal (for premolars or molars) or incisal (for incisors and canines). Each coronal surface was assessed and categorised using visual criteria (no explorer was used) and one of the following codes was assigned: • decay: cavitation of enamel or dentinal involvement or both are present • recurrent caries: visible caries that is contiguous with a restoration • filled unsatisfactorily: a filling placed for any reason in a surface that requires
replacement but that has none of the above conditions • filling to treat decay: a filling placed to treat decay in a surface that had none of the
above conditions • filling placed for reasons other than decay: in a surface that has none of the above
conditions (incisors and canines only) • fissure sealant: where none of the above conditions were found • sound: when none of the above conditions was found.
8 The National Survey of Adult Oral Health 2004–06: Australian Capital Territory
Decay experience of tooth root surfaces All teeth present were subdivided into four root surfaces: medial, buccal, distal and lingual. Each root surface was assessed visually and, if necessary, using a ball-ended periodontal probe. One of the following codes was assigned: • decay: a discrete, well-defined or discoloured lesion on the root surface that is soft to
exploration using the periodontal probe • recurrent caries: detectable caries that is contiguous with a restoration • filled unsatisfactorily: a filling placed for any reason in a surface that has unacceptable
defects but meeting none of the above conditions • filled root surface: one or more permanent restorations placed for any reason but none of
the above conditions • wear of 2 mm or more: recorded only on buccal surfaces with none of the above
conditions • sound root surface: when none of the above conditions was found • no visible root surface.
Periodontal tissue destruction The assessment of periodontal tissue destruction was based on methods used in the US National Health and Nutrition Examination Survey (NHANES 2005). Assessments were made of probing pocket depth and gingival recession, both recorded in millimetres using a periodontal probe that had 2-mm markings. Measurements were made at the mesio-buccal, mid-buccal and disto-buccal aspects of all teeth present, except for third molars. All fractional millimetre measurements were rounded down to the lowest whole millimetre before calling the number. For recession, the cemento-enamel junction (CEJ) was identified or its position was estimated (for example, if a filling obscured its position), and the distance from the CEJ to the free gingival margin was recorded in millimetres. When the CEJ was subgingival, the number called was negative; otherwise it was positive. For probing pocket depth, the distance from the free gingival margin to the bottom of the periodontal crevice/pocket was called.
Examiners did not make a direct measurement of clinical attachment loss; instead, it was computed during data analysis.
The National Survey of Adult Oral Health 2004–06: Australian Capital Territory 9
Gingival inflammation around six index teeth The Loe and Silness (1963) gingival index was used to assess inflammation of the marginal gingival tissues around six index teeth (if present)—the most anterior molar in each dental quadrant (up to four teeth), the right maxillary central incisor and the left mandibular central incisor. Pressure was applied to the free gingival margin on the buccal aspect of the tooth by swiping with the side of a periodontal probe that was held at approximately 90 degrees to the long axis of the tooth. One of the following codes was assigned: • severe inflammation: marked redness and oedema, ulceration or tendency to
spontaneous bleeding • moderate inflammation: redness, oedema, glazing or bleeding after applying pressure
with the probe • mild inflammation: slight change in colour or slight oedema but no bleeding after
applying pressure with the probe • none of the above.
Data recording for examinations Each code called by an examiner was recorded directly onto a laptop computer by state/territory staff who had experience in clinical dental procedures. They were trained in use of the software during the 2-day training session for examination teams held at The University of Adelaide.
Assessment of inter-examiner reliability In order to measure inter-examiner reliability, the principal survey examiner attended examination sessions for all but one examiner to conduct masked replicate examinations of survey participants. The remaining examiner withdrew from the survey after completing 32 examinations. Replicate examination entailed assessments of tooth presence, periodontal assessment of teeth in one jaw, and assessment of caries experience in both crowns and roots of teeth. The observed levels of agreement for most oral health indicators were equivalent to benchmarks reported for national oral health surveys conducted in the United Kingdom and the United States.
10 The National Survey of Adult Oral Health 2004–06: Australian Capital Territory
Period of data collection Data collection began in July 2004 and was completed in September 2006 (Table 2). Interviews were timed to begin approximately 1 month prior to the planned start of examinations in each jurisdiction.
Table 2: Periods of data collection in states and territories
Dates of interviews Dates of examinations
State/territory Beginning End Beginning End
ACT July 2004 October 2004 July 2004 October 2004
SA September 2004 December 2004 September 2004 May 2005
WA October 2004 March 2005 November 2004 May 2005
Vic January 2005 September 2005 February 2005 September 2005
NSW May 2005 November 2005 June 2005 July 2006
NT August 2005 October 2005 September 2005 March 2006
Tas January 2006 May 2006 March 2006 September 2006
Qld March 2006 September 2006 June 2006 September 2006
Australia July 2004 September 2006 July 2004 September 2006
Ethical conduct of research This project was reviewed and approved by The University of Adelaide’s Human Research Ethics Committee. Interviewed subjects provided verbal consent prior to answering questions. All examined subjects provided signed, informed consent prior to the examination.
Target sample size Sample size requirements were calculated for a range of key outcome variables to be reported nationally. One outcome, the capacity to detect a 25% or greater reduction in national age-specific estimates of mean number of decayed teeth since 1987–88, was nominated as the critical threshold that should be detectable with standard statistical power of 80%. Another outcome was a capacity to detect a 10% or greater reduction in national age-specific mean DMFT. This identified a need for 7,500 examinations and 13,560 interviews, assuming a 65% participation rate in the examination. The sample size within each state and territory was planned to be approximately proportional to the population of the jurisdiction.
The National Survey of Adult Oral Health 2004–06: Australian Capital Territory 11
Participation in the survey National participation rates were lower than intended, both in the interview, where 49.0% of sampled people participated, and the examination, where 43.7% of those eligible took part. Interview participation rates varied from 43.9% in NSW to 61.8% in SA. Examination rates varied from 33.2% in NSW to 57.5% in SA (Table 3).
Table 3: Number and percentage of people sampled, interviewed and examined(a)
No. of people
sampled
No. of people
interviewed
Per cent of sampled
people interviewed
No. of people eligible
for exam
No. of people
examined
Per cent of eligible
people examined
Australia 28,812 14,123 49.0 12,606 5,505 43.7 State/territory NSW 8,270 3,630 43.9 3,310 1,099 33.2 Vic 6,013 2,667 44.4 2,360 1,181 50.0 Qld 4,219 2,052 48.6 1,841 824 44.8 SA 2,159 1,335 61.8 1,093 629 57.5 WA 2,365 1,290 54.5 1,109 470 42.4 Tas 1,745 1,042 59.7 873 385 44.1 ACT 1,892 1,025 54.2 981 400 40.8 NT 2,149 1,082 50.3 1,039 517 49.8
(a) Unweighted data.
Data analysis The aim of the data analysis was to generate summary statistics describing oral health for the ACT population. With the exception of data regarding participation rates, results in this report have been weighted to compensate for individuals’ different probabilities of selection and survey participation rates. For the telephone interview survey, weights were adjusted to ensure survey estimates were consistent with the 2005 Australian Bureau of Statistics Estimated Residential Population data. For the oral examination survey, which was restricted to dentate people aged 15 years or more, estimates of the dentate population were derived from the telephone interview survey and used to derive examination weights. This means that results can be generalised to the ACT population.
Tables 35 and 36 contain age-standardised estimates for each indicator presented in preceding tables. Age standardisation is a statistical procedure that aims to remove any effects of age that might account for differences in each oral health indicator between the two comparison groups: health cardholders versus non-health cardholders (Table 35) and insured versus non-insured people (Table 36). For these tables, percentages and means were standardised using the direct method. The reference population was the 2005 Australian Estimated Residential Population classified into 14 five-year age categories within the range 15–84 years and a fifteenth category aged 85 years of more.
12 The National Survey of Adult Oral Health 2004–06: Australian Capital Territory
Presentation of results Oral health measures are tabulated for each of three age groups representing the survey participant’s age reported in the telephone interview, plus an ‘all ages’ summary. The three age groups are: 15–34 years, 35–54 years and ≥55 years. The tables report estimates for mutually exclusive subgroups of people created for each of six characteristics based on responses to the telephone interview questions. The subgroups and unweighted number of respondents are listed in the Appendix to this volume and the six characteristics are described below:
Sex was classified as ‘Male’ or ‘Female’ recorded during the interview.
Residential location was classified as ‘Capital city’ or ‘Other places’ based on the sampling postcode used in selection of households.
Postcode socioeconomic status was used to classify individuals according to the Index of Relative Socioeconomic Advantage/Disadvantage (IRSAD) of the postcode in which they lived. The IRSAD is an aggregate measure of a postcode’s socioeconomic status based on characteristics of its residents recorded in the 2001 Population Census. A postcode that has a relatively high proportion of people with high incomes or a skilled labour force is assigned a relatively higher value on this index. Conversely, a low score on the index indicates that an area has a higher proportion of individuals with low incomes and more people who work in unskilled occupations. Postcodes were classified into three groups of ascending socioeconomic status, each group comprising approximately one-third of the ACT population. This type of analysis is said to be ‘ecological’ because it is not based on individuals’ own socioeconomic status, but on the socioeconomic status of the area in which they live. Hence, care should be taken in the interpretation of results—because Socioeconomic Indices for Areas (SEIFA) scores refer to areas, not individuals, results are not interpretable at the level of the individual.
Government health card status identified whether or not people were covered either by a pensioner concession card or health care card. Both cards are issued according to a means test administered by Centrelink, an agency of the Australian Government’s Family Assistance Office. People with either card and their dependents are eligible for public-sector dental care in most states and territories.
Place of last dental visit further disaggregated health cardholders according to the location of their last dental visit. The latter was established during the interview by asking people ‘Where did you make your last dental visit?’. Health cardholders who responded ‘Government dental clinic’ or ‘School dental service’ were classified as ‘Cardholder/Public’. Otherwise, eligible people were classified as ‘Cardholder/Non-public’ if they reported any of the other locations: Private dental practice (including specialist); Dental technician; Clinic operated by health insurance fund; Armed Services/Defence Force clinic; Other site. People who were not health cardholders were classified as ‘Non-cardholder/Non-public’ regardless of their reported visit location.
Dental insurance coverage was based on responses to the question ‘Do you have private insurance cover for dental expenses?’. People were classified as insured if they responded ‘yes’ and uninsured if they responded ‘no’.
The National Survey of Adult Oral Health 2004–06: Australian Capital Territory 13
14 The National Survey of Adult Oral Health 2004–06: Australian Capital Territory
Criteria for determining statistical significance As with any survey where data are collected from only some of the people in the population, proportions and means in this report are estimates of the true population values. The estimates have some degree of uncertainty, which is expressed in this report using 95% confidence intervals (95% CIs). The 95% CI signifies the likely lower and upper limits of the range of values within which the true population percentage would fall. In this context ‘likely’ means that there is a 95% probability that the true population value lies between those two values.
In this report 95% CIs are used additionally as a guideline to identify differences between population subgroups that are statistically significant. Specifically, when there is no overlap between 95% CIs for two groups, the difference between the groups is deemed to be statistically significant. This criterion for judging statistical significance is more conservative than the alternative method of calculating P-values. In fact, when 95% CIs do not overlap, it means that a test of statistical significance for the difference between the groups would have a P-value of less than 0.05 (the conventional threshold used in many reports), and it could be as small as less than 0.005. The ‘conservative’ nature of the criterion used in this report comes about because 95% CIs that overlap to a small degree could, nevertheless, be found to differ to a statistically significant degree (at P<0.05 ) using a hypothesis test.
Data files were managed and summary variables computed using SAS software version 9.1.1 Means and their associated 95% CIs were generated using SUDAAN software release 9.0.0.2 The SUDAAN procedures used sampling weights to generate population estimates and calculated 95% CIs that allowed for the complex sampling design used in this survey. To do so, ‘with replacement’ sampling was specified with two levels of stratification (state and section of state). The subject’s sampling postcode was specified as the primary sampling unit, which was used by SUDAAN as the clustering variable.
1 SAS Institute Inc. 100 SAS Campus Drive, Cary, NC 27513–2414, USA. 2 Research Triangle Institute. PO Box 12194, Research Triangle Park, NC 27709–2194, USA.
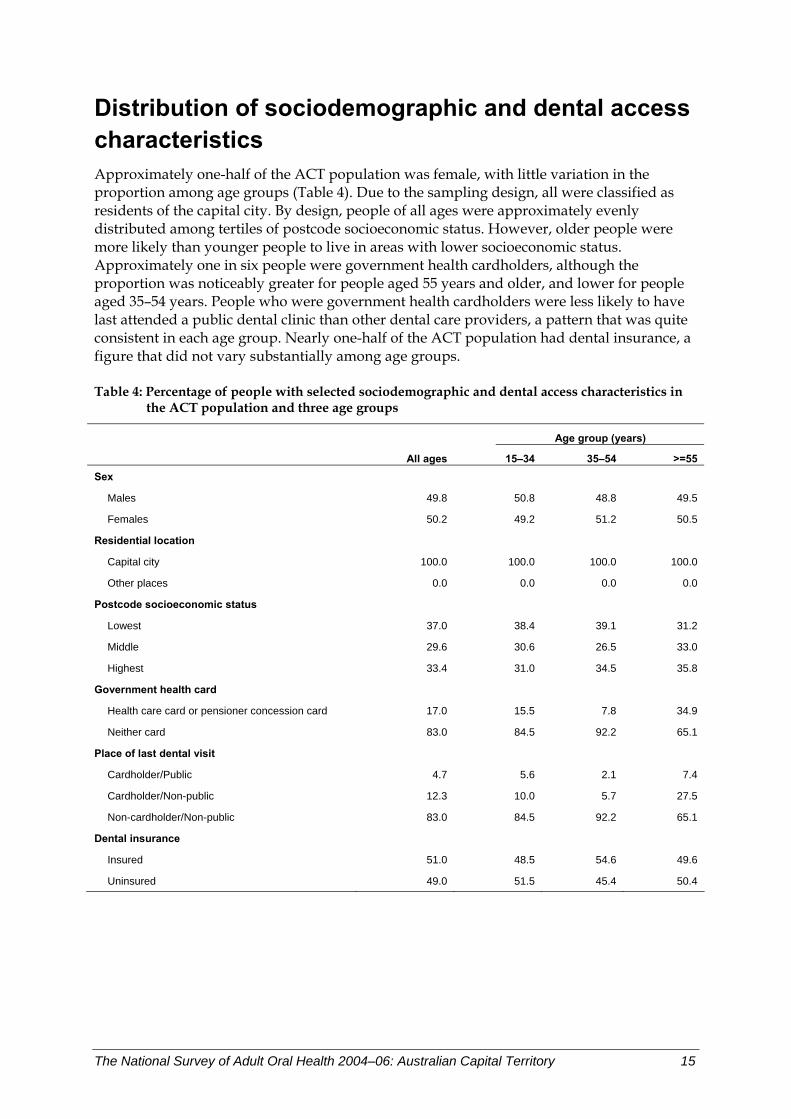
Distribution of sociodemographic and dental access characteristics Approximately one-half of the ACT population was female, with little variation in the proportion among age groups (Table 4). Due to the sampling design, all were classified as residents of the capital city. By design, people of all ages were approximately evenly distributed among tertiles of postcode socioeconomic status. However, older people were more likely than younger people to live in areas with lower socioeconomic status. Approximately one in six people were government health cardholders, although the proportion was noticeably greater for people aged 55 years and older, and lower for people aged 35–54 years. People who were government health cardholders were less likely to have last attended a public dental clinic than other dental care providers, a pattern that was quite consistent in each age group. Nearly one-half of the ACT population had dental insurance, a figure that did not vary substantially among age groups.
Table 4: Percentage of people with selected sociodemographic and dental access characteristics in the ACT population and three age groups
Age group (years) All ages 15–34 35–54 >=55 Sex
Males 49.8 50.8 48.8 49.5
Females 50.2 49.2 51.2 50.5
Residential location
Capital city 100.0 100.0 100.0 100.0
Other places 0.0 0.0 0.0 0.0
Postcode socioeconomic status
Lowest 37.0 38.4 39.1 31.2
Middle 29.6 30.6 26.5 33.0
Highest 33.4 31.0 34.5 35.8
Government health card
Health care card or pensioner concession card 17.0 15.5 7.8 34.9
Neither card 83.0 84.5 92.2 65.1
Place of last dental visit
Cardholder/Public 4.7 5.6 2.1 7.4
Cardholder/Non-public 12.3 10.0 5.7 27.5
Non-cardholder/Non-public 83.0 84.5 92.2 65.1
Dental insurance
Insured 51.0 48.5 54.6 49.6
Uninsured 49.0 51.5 45.4 50.4
The National Survey of Adult Oral Health 2004–06: Australian Capital Territory 15
3 Oral health status
Complete tooth loss In NSAOH, complete tooth loss was assessed in the interview by asking people ‘Do you have any of your own natural teeth?’. People who answered ‘no’ were classified as edentulous. In ACT, edentulous people represented 2.8% of the population aged 15 years or more (Table 5), which was significantly less than the national estimate of 6.4% (Slade et al. 2007).
Key findings • The prevalence of edentulism was strongly associated with age, being negligible among
people below the age of 55 years but affecting 11.1% of ACT adults aged 55 years or more.
• Among people aged 55 years or more, there was a tendency for prevalence of complete tooth loss to be greater among females than males, although the difference was not statistically significant.
• Similarly, among people aged 55 years or more, prevalence of complete tooth loss tended to be greater in postcodes with low socioeconomic status than in postcodes with high socioeconomic status, although the difference was not statistically significant.
• Among all ages, government health cardholders were six times more likely to be edentulous (9.9%) compared with non-government health cardholders (1.5%). Within age groups, government health cardholder status was statistically significantly associated with edentulism among people aged 55 years or more.
• Within the population of government health cardholders, there was a tendency for prevalence of edentulism to be higher for people whose last dental visit was to the public sector than to other sources of care. While this pattern was observed among people aged 35–54-years and 55 years or more, the differences were not statistically significant.
• The prevalence of complete tooth loss was not associated with dental insurance.
Discussion As emphasised in the national report, variation among age groups in prevalence of edentulism can be attributed primarily to the differing historical experiences of generations born in different time periods during the 20th century rather than to the effects of ageing. Because edentulism prevalence was so strongly dependent upon age group, comparisons between sociodemographic groups were observed most clearly for the oldest age group. Among 15–34-year-olds, prevalence estimates were all zero, and therefore did not reveal any differences between population groups.
In summary, complete tooth loss in ACT was a condition observed rarely below the age of 55 years, while among people aged 55 years or more, it was associated with government health cardholder status.
16 The National Survey of Adult Oral Health 2004–06: Australian Capital Territory
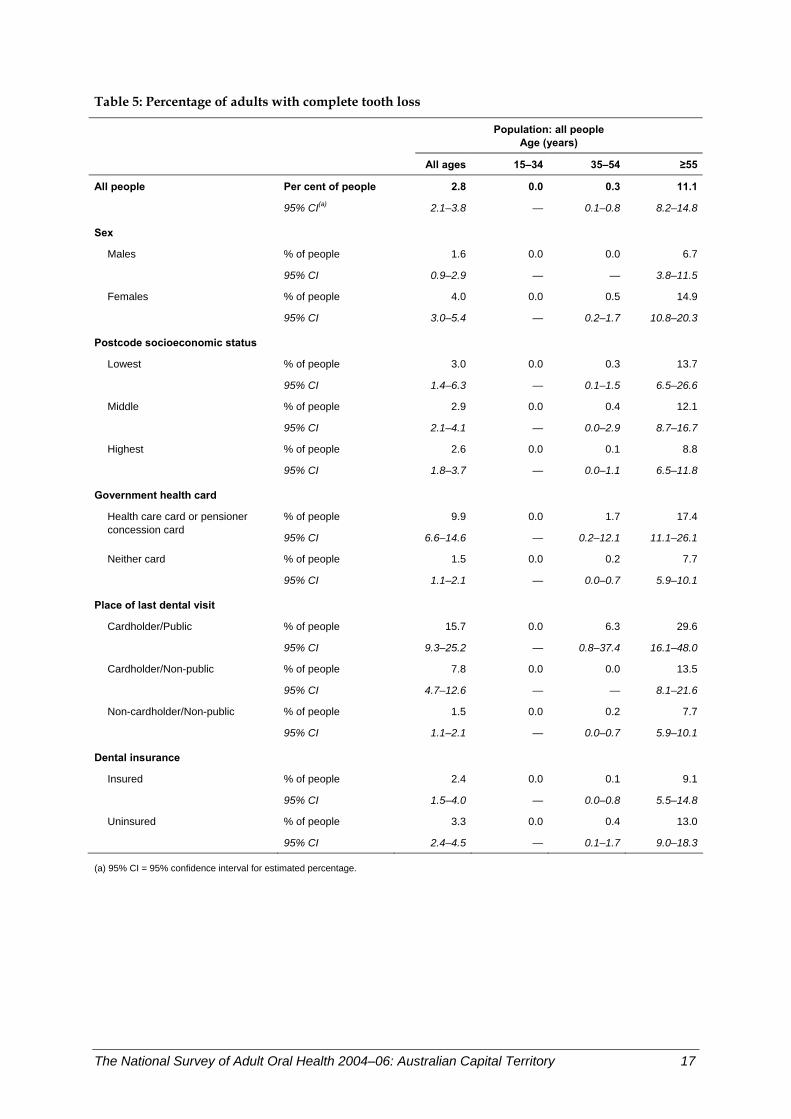
Table 5: Percentage of adults with complete tooth loss
Population: all people
Age (years)
All ages 15–34 35–54 ≥55
All people Per cent of people 2.8 0.0 0.3 11.1
95% CI(a) 2.1–3.8 — 0.1–0.8 8.2–14.8
Sex
Males % of people 1.6 0.0 0.0 6.7
95% CI 0.9–2.9 — — 3.8–11.5
Females % of people 4.0 0.0 0.5 14.9
95% CI 3.0–5.4 — 0.2–1.7 10.8–20.3
Postcode socioeconomic status
Lowest % of people 3.0 0.0 0.3 13.7
95% CI 1.4–6.3 — 0.1–1.5 6.5–26.6
Middle % of people 2.9 0.0 0.4 12.1
95% CI 2.1–4.1 — 0.0–2.9 8.7–16.7
Highest % of people 2.6 0.0 0.1 8.8
95% CI 1.8–3.7 — 0.0–1.1 6.5–11.8
Government health card
% of people 9.9 0.0 1.7 17.4Health care card or pensioner concession card
95% CI 6.6–14.6 — 0.2–12.1 11.1–26.1
Neither card % of people 1.5 0.0 0.2 7.7
95% CI 1.1–2.1 — 0.0–0.7 5.9–10.1
Place of last dental visit Cardholder/Public % of people 15.7 0.0 6.3 29.6
95% CI 9.3–25.2 — 0.8–37.4 16.1–48.0
Cardholder/Non-public % of people 7.8 0.0 0.0 13.5
95% CI 4.7–12.6 — — 8.1–21.6
Non-cardholder/Non-public % of people 1.5 0.0 0.2 7.7
95% CI 1.1–2.1 — 0.0–0.7 5.9–10.1
Dental insurance Insured % of people 2.4 0.0 0.1 9.1
95% CI 1.5–4.0 — 0.0–0.8 5.5–14.8
Uninsured % of people 3.3 0.0 0.4 13.0
95% CI 2.4–4.5 — 0.1–1.7 9.0–18.3
(a) 95% CI = 95% confidence interval for estimated percentage.
The National Survey of Adult Oral Health 2004–06: Australian Capital Territory 17
Inadequate natural dentition among dentate people Adults who have approximately 20 teeth or more usually have satisfactory chewing function (Elias & Sheiham 1998), diet and nutritional status (Sheiham et al. 2002), whereas people with fewer teeth are more likely to suffer impaired quality of oral health (McGrath & Bedi 2002). In NSAOH, people were asked during the interview to report either the number of remaining teeth or the number of missing teeth in their upper jaw and lower jaw. Responses were used to classify people as having an inadequate natural dentition if they reported having fewer than 21 natural teeth, the same threshold that has been reported for the UK population. In ACT, 7.2% of dentate adults had fewer than 21 teeth (Table 6), which was significantly lower than the national figure of 11.4% (Slade et al. 2007).
Key findings • The prevalence of an inadequate natural dentition was strongly associated with age,
being negligible for people aged 15–34 years but affecting approximately one-quarter of dentate people aged 55 years or more.
• Differences in prevalence between males and females were small and statistically non-significant, both for the population as a whole and within the three age groups.
• Within the 35–54-years and 55 years or more age groups, prevalence of an inadequate natural dentition tended to be lower among people living in postcodes with high socioeconomic status compared with those living in postcodes of low or middle socioeconomic status. However, the differences were not statistically significant.
• Government health cardholder status was associated with elevated prevalence of an inadequate natural dentition, and the difference was statistically significant for all ages combined and within the oldest age group of 55 years or more.
• Within the population of government health cardholders, there was a tendency for age-group-specific prevalence to be higher for those whose last dental visit was to the public sector than for those who attended a private dentist. However, the difference was not statistically significant.
• Large differences in prevalence were observed between people with dental insurance and the insured, and the differences were statistically significant for all ages combined and for people aged 55 years or more.
Discussion A threshold of fewer than 21 teeth is used here as an indicator of likely impairments in oral function, nutrition and quality of life, rather than a cardinal sign of those problems. As observed for complete tooth loss, there was a pronounced age gradient in prevalence of an inadequate natural dentition. Because of this age association, valid comparisons between other sociodemographic groups should only be made within age groups. Those comparisons reveal that prevalence was associated with both government health cardholder status and dental insurance. Unlike the pattern observed for complete tooth loss, prevalence of an inadequate natural dentition was also significantly higher for dentally uninsured people than for those with dental insurance.
18 The National Survey of Adult Oral Health 2004–06: Australian Capital Territory
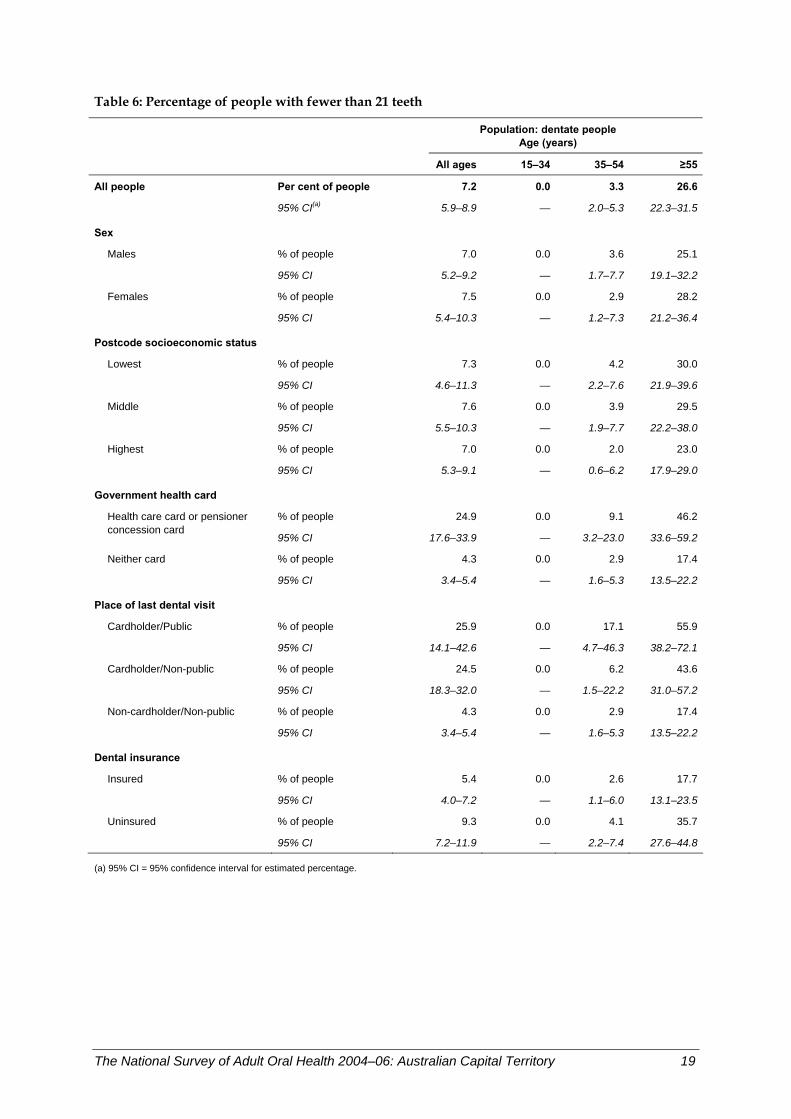
Table 6: Percentage of people with fewer than 21 teeth
Population: dentate people
Age (years)
All ages 15–34 35–54 ≥55
All people Per cent of people 7.2 0.0 3.3 26.6
95% CI(a) 5.9–8.9 — 2.0–5.3 22.3–31.5
Sex
Males % of people 7.0 0.0 3.6 25.1
95% CI 5.2–9.2 — 1.7–7.7 19.1–32.2
Females % of people 7.5 0.0 2.9 28.2
95% CI 5.4–10.3 — 1.2–7.3 21.2–36.4
Postcode socioeconomic status
Lowest % of people 7.3 0.0 4.2 30.0
95% CI 4.6–11.3 — 2.2–7.6 21.9–39.6
Middle % of people 7.6 0.0 3.9 29.5
95% CI 5.5–10.3 — 1.9–7.7 22.2–38.0
Highest % of people 7.0 0.0 2.0 23.0
95% CI 5.3–9.1 — 0.6–6.2 17.9–29.0
Government health card
% of people 24.9 0.0 9.1 46.2Health care card or pensioner concession card
95% CI 17.6–33.9 — 3.2–23.0 33.6–59.2
Neither card % of people 4.3 0.0 2.9 17.4
95% CI 3.4–5.4 — 1.6–5.3 13.5–22.2
Place of last dental visit Cardholder/Public % of people 25.9 0.0 17.1 55.9
95% CI 14.1–42.6 — 4.7–46.3 38.2–72.1
Cardholder/Non-public % of people 24.5 0.0 6.2 43.6
95% CI 18.3–32.0 — 1.5–22.2 31.0–57.2
Non-cardholder/Non-public % of people 4.3 0.0 2.9 17.4
95% CI 3.4–5.4 — 1.6–5.3 13.5–22.2
Dental insurance Insured % of people 5.4 0.0 2.6 17.7
95% CI 4.0–7.2 — 1.1–6.0 13.1–23.5
Uninsured % of people 9.3 0.0 4.1 35.7
95% CI 7.2–11.9 — 2.2–7.4 27.6–44.8
(a) 95% CI = 95% confidence interval for estimated percentage.
The National Survey of Adult Oral Health 2004–06: Australian Capital Territory 19
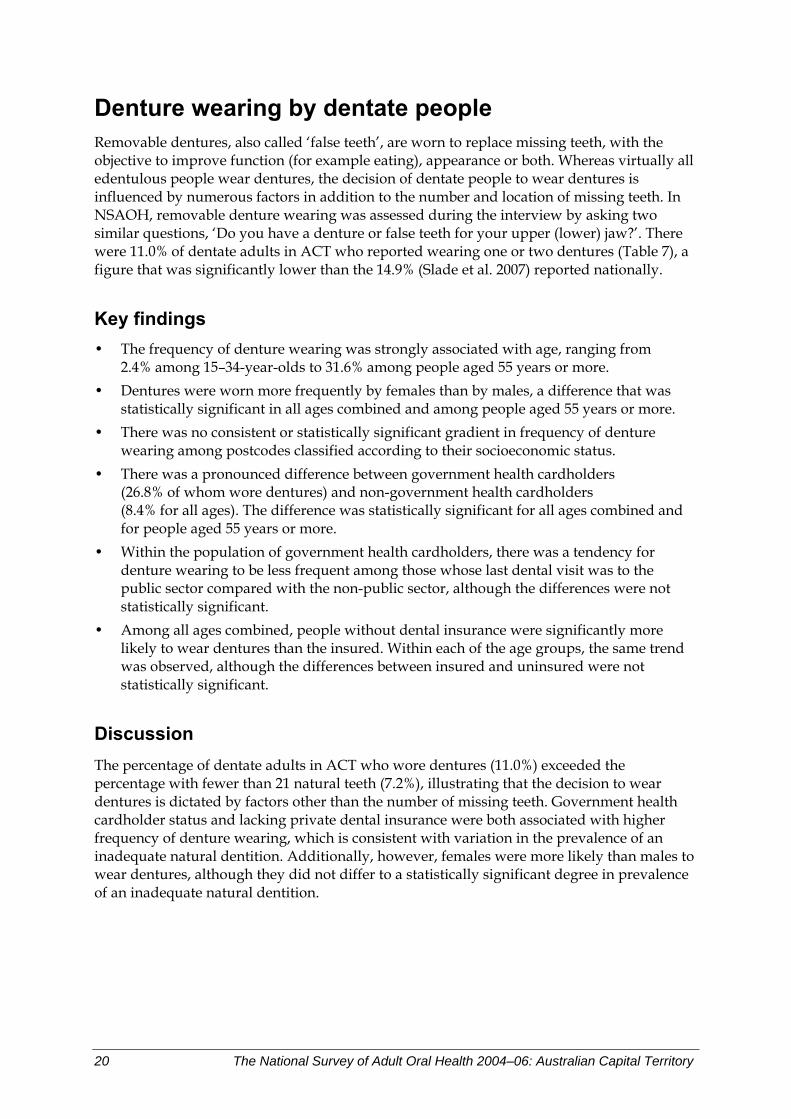
Denture wearing by dentate people Removable dentures, also called ‘false teeth’, are worn to replace missing teeth, with the objective to improve function (for example eating), appearance or both. Whereas virtually all edentulous people wear dentures, the decision of dentate people to wear dentures is influenced by numerous factors in addition to the number and location of missing teeth. In NSAOH, removable denture wearing was assessed during the interview by asking two similar questions, ‘Do you have a denture or false teeth for your upper (lower) jaw?’. There were 11.0% of dentate adults in ACT who reported wearing one or two dentures (Table 7), a figure that was significantly lower than the 14.9% (Slade et al. 2007) reported nationally.
Key findings • The frequency of denture wearing was strongly associated with age, ranging from
2.4% among 15–34-year-olds to 31.6% among people aged 55 years or more. • Dentures were worn more frequently by females than by males, a difference that was
statistically significant in all ages combined and among people aged 55 years or more. • There was no consistent or statistically significant gradient in frequency of denture
wearing among postcodes classified according to their socioeconomic status. • There was a pronounced difference between government health cardholders
(26.8% of whom wore dentures) and non-government health cardholders (8.4% for all ages). The difference was statistically significant for all ages combined and for people aged 55 years or more.
• Within the population of government health cardholders, there was a tendency for denture wearing to be less frequent among those whose last dental visit was to the public sector compared with the non-public sector, although the differences were not statistically significant.
• Among all ages combined, people without dental insurance were significantly more likely to wear dentures than the insured. Within each of the age groups, the same trend was observed, although the differences between insured and uninsured were not statistically significant.
Discussion The percentage of dentate adults in ACT who wore dentures (11.0%) exceeded the percentage with fewer than 21 natural teeth (7.2%), illustrating that the decision to wear dentures is dictated by factors other than the number of missing teeth. Government health cardholder status and lacking private dental insurance were both associated with higher frequency of denture wearing, which is consistent with variation in the prevalence of an inadequate natural dentition. Additionally, however, females were more likely than males to wear dentures, although they did not differ to a statistically significant degree in prevalence of an inadequate natural dentition.
20 The National Survey of Adult Oral Health 2004–06: Australian Capital Territory
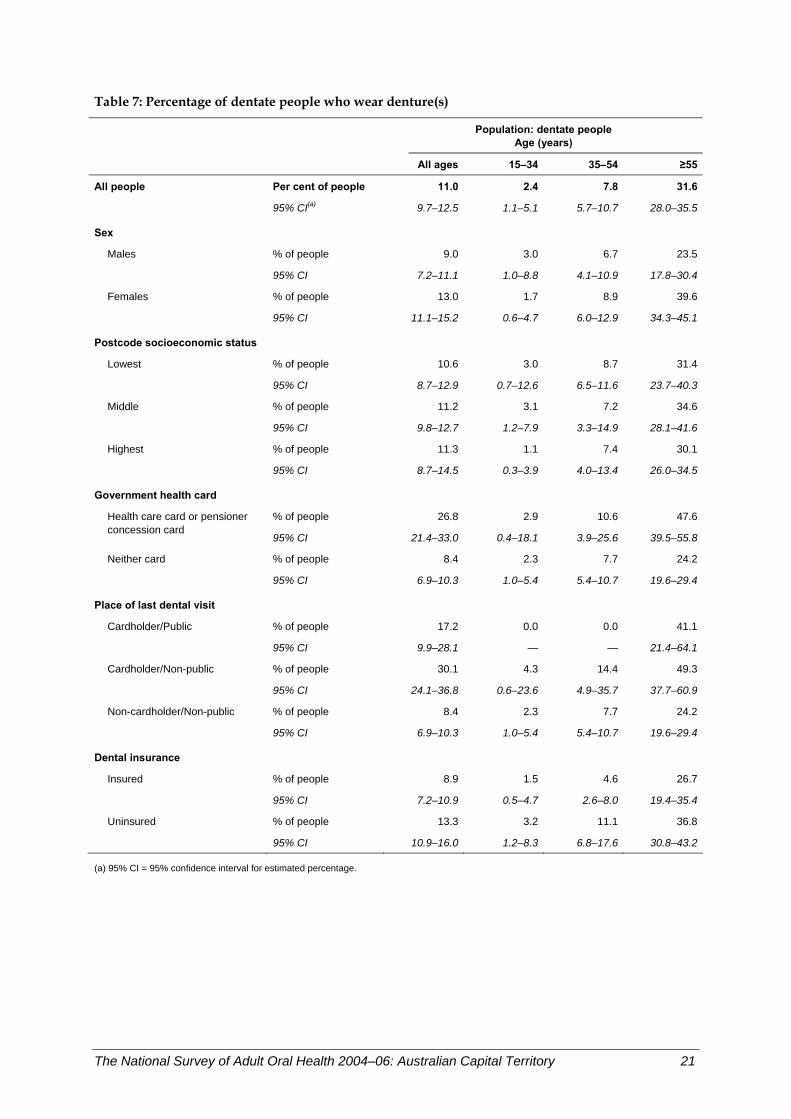
Table 7: Percentage of dentate people who wear denture(s)
Population: dentate people
Age (years)
All ages 15–34 35–54 ≥55
All people Per cent of people 11.0 2.4 7.8 31.6
95% CI(a) 9.7–12.5 1.1–5.1 5.7–10.7 28.0–35.5
Sex
Males % of people 9.0 3.0 6.7 23.5
95% CI 7.2–11.1 1.0–8.8 4.1–10.9 17.8–30.4
Females % of people 13.0 1.7 8.9 39.6
95% CI 11.1–15.2 0.6–4.7 6.0–12.9 34.3–45.1
Postcode socioeconomic status
Lowest % of people 10.6 3.0 8.7 31.4
95% CI 8.7–12.9 0.7–12.6 6.5–11.6 23.7–40.3
Middle % of people 11.2 3.1 7.2 34.6
95% CI 9.8–12.7 1.2–7.9 3.3–14.9 28.1–41.6
Highest % of people 11.3 1.1 7.4 30.1
95% CI 8.7–14.5 0.3–3.9 4.0–13.4 26.0–34.5
Government health card
% of people 26.8 2.9 10.6 47.6Health care card or pensioner concession card
95% CI 21.4–33.0 0.4–18.1 3.9–25.6 39.5–55.8
Neither card % of people 8.4 2.3 7.7 24.2
95% CI 6.9–10.3 1.0–5.4 5.4–10.7 19.6–29.4
Place of last dental visit Cardholder/Public % of people 17.2 0.0 0.0 41.1
95% CI 9.9–28.1 — — 21.4–64.1
Cardholder/Non-public % of people 30.1 4.3 14.4 49.3
95% CI 24.1–36.8 0.6–23.6 4.9–35.7 37.7–60.9
Non-cardholder/Non-public % of people 8.4 2.3 7.7 24.2
95% CI 6.9–10.3 1.0–5.4 5.4–10.7 19.6–29.4
Dental insurance Insured % of people 8.9 1.5 4.6 26.7
95% CI 7.2–10.9 0.5–4.7 2.6–8.0 19.4–35.4
Uninsured % of people 13.3 3.2 11.1 36.8
95% CI 10.9–16.0 1.2–8.3 6.8–17.6 30.8–43.2
(a) 95% CI = 95% confidence interval for estimated percentage.
The National Survey of Adult Oral Health 2004–06: Australian Capital Territory 21
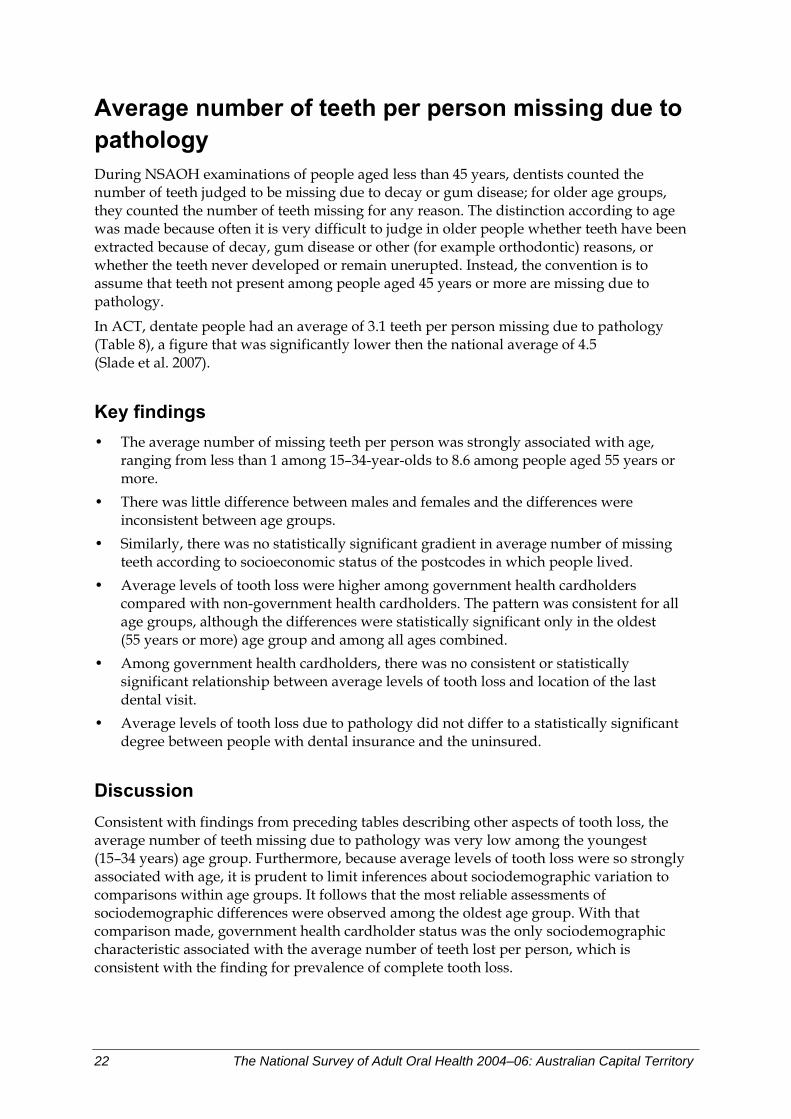
Average number of teeth per person missing due to pathology During NSAOH examinations of people aged less than 45 years, dentists counted the number of teeth judged to be missing due to decay or gum disease; for older age groups, they counted the number of teeth missing for any reason. The distinction according to age was made because often it is very difficult to judge in older people whether teeth have been extracted because of decay, gum disease or other (for example orthodontic) reasons, or whether the teeth never developed or remain unerupted. Instead, the convention is to assume that teeth not present among people aged 45 years or more are missing due to pathology.
In ACT, dentate people had an average of 3.1 teeth per person missing due to pathology (Table 8), a figure that was significantly lower then the national average of 4.5 (Slade et al. 2007).
Key findings • The average number of missing teeth per person was strongly associated with age,
ranging from less than 1 among 15–34-year-olds to 8.6 among people aged 55 years or more.
• There was little difference between males and females and the differences were inconsistent between age groups.
• Similarly, there was no statistically significant gradient in average number of missing teeth according to socioeconomic status of the postcodes in which people lived.
• Average levels of tooth loss were higher among government health cardholders compared with non-government health cardholders. The pattern was consistent for all age groups, although the differences were statistically significant only in the oldest (55 years or more) age group and among all ages combined.
• Among government health cardholders, there was no consistent or statistically significant relationship between average levels of tooth loss and location of the last dental visit.
• Average levels of tooth loss due to pathology did not differ to a statistically significant degree between people with dental insurance and the uninsured.
Discussion Consistent with findings from preceding tables describing other aspects of tooth loss, the average number of teeth missing due to pathology was very low among the youngest (15–34 years) age group. Furthermore, because average levels of tooth loss were so strongly associated with age, it is prudent to limit inferences about sociodemographic variation to comparisons within age groups. It follows that the most reliable assessments of sociodemographic differences were observed among the oldest age group. With that comparison made, government health cardholder status was the only sociodemographic characteristic associated with the average number of teeth lost per person, which is consistent with the finding for prevalence of complete tooth loss.
22 The National Survey of Adult Oral Health 2004–06: Australian Capital Territory

Table 8: Average number of teeth per person missing due to pathology
Population: dentate people
Age (years)
All ages 15–34 35–54 ≥55
All people mean 3.1 0.2 2.8 8.6
95% CI(a) 2.5–3.6 <0–0.4 2.4–3.3 7.5–9.8
Sex
Males mean 2.8 0.1 2.1 8.6
95% CI 2.2–3.3 <0–0.4 1.2–3.0 7.0–10.1
Females mean 3.4 0.2 3.5 8.6
95% CI 2.5–4.3 0.0–0.4 2.7–4.4 7.4–9.9
Postcode socioeconomic status
Lowest mean 3.1 0.4 2.9 9.4
95% CI 2.0–4.2 0.0–0.8 2.5–3.4 7.1–11.7
Middle mean 3.1 0.0 2.9 8.4
95% CI 2.3–3.9 0.0–0.0 2.2–3.7 7.1–9.7
Highest mean 3.0 0.1 2.7 8.1
95% CI 2.2–3.8 <0–0.1 1.8–3.6 6.2–9.9
Government health card
mean 6.3 0.5 4.7 11.6Health care card or pensioner concession card
95% CI 4.6–8.0 <0–1.1 1.6–7.9 10.1–13.0
Neither card mean 2.4 0.1 2.7 7.0
95% CI 2.0–2.8 <0–0.3 2.3–3.1 5.7–8.3
Place of last dental visit Cardholder/Public mean 5.6 0.0 5.6 13.2
95% CI 3.4–7.8 0.0–0.0 <0–11.8 8.9–17.6
Cardholder/Non-public mean 6.6 0.8 4.4 11.1
95% CI 4.4–8.7 <0–1.7 0.9–8.0 9.2–13.0
Non-cardholder/Non-public mean 2.4 0.1 2.7 7.0
95% CI 2.0–2.8 <0–0.3 2.3–3.1 5.7–8.3
Dental insurance Insured mean 2.8 0.1 2.8 7.4
95% CI 2.1–3.5 <0–0.3 2.3–3.2 6.2–8.7
Uninsured mean 3.4 0.2 2.9 9.7
95% CI 2.4–4.4 <0–0.6 2.0–3.8 8.2–11.3
(a) 95% CI = 95% confidence interval for estimated mean.
The National Survey of Adult Oral Health 2004–06: Australian Capital Territory 23
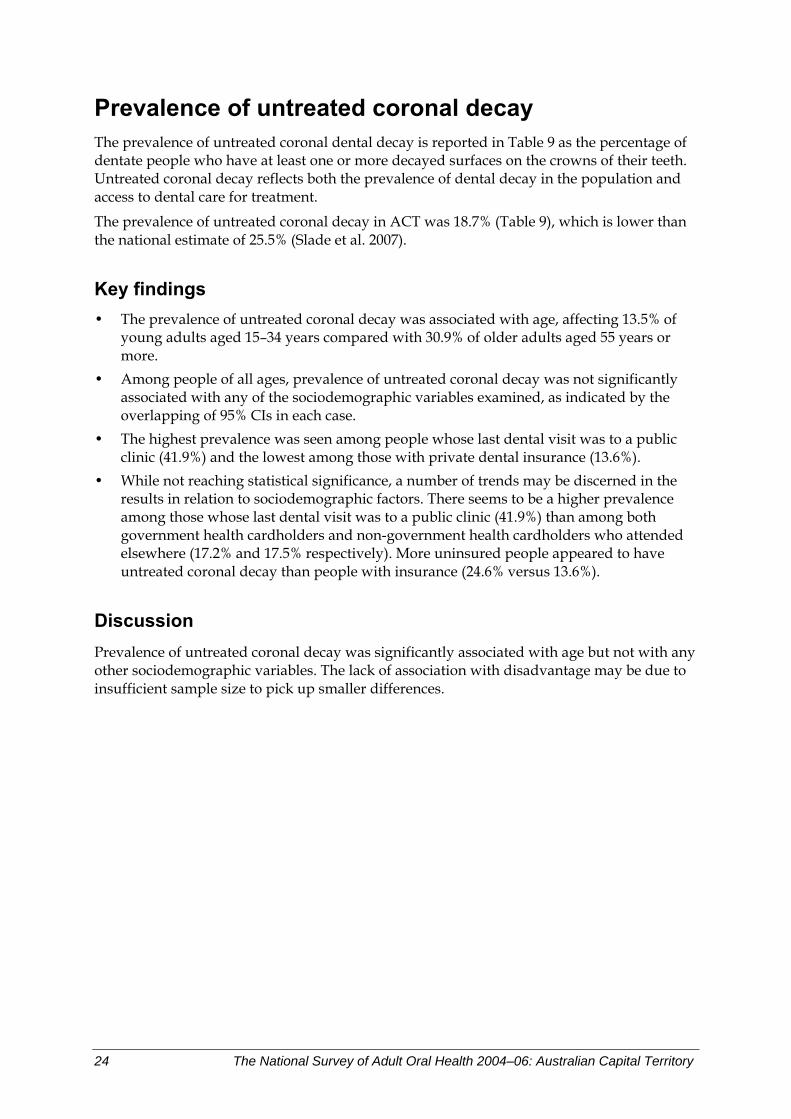
Prevalence of untreated coronal decay The prevalence of untreated coronal dental decay is reported in Table 9 as the percentage of dentate people who have at least one or more decayed surfaces on the crowns of their teeth. Untreated coronal decay reflects both the prevalence of dental decay in the population and access to dental care for treatment.
The prevalence of untreated coronal decay in ACT was 18.7% (Table 9), which is lower than the national estimate of 25.5% (Slade et al. 2007).
Key findings • The prevalence of untreated coronal decay was associated with age, affecting 13.5% of
young adults aged 15–34 years compared with 30.9% of older adults aged 55 years or more.
• Among people of all ages, prevalence of untreated coronal decay was not significantly associated with any of the sociodemographic variables examined, as indicated by the overlapping of 95% CIs in each case.
• The highest prevalence was seen among people whose last dental visit was to a public clinic (41.9%) and the lowest among those with private dental insurance (13.6%).
• While not reaching statistical significance, a number of trends may be discerned in the results in relation to sociodemographic factors. There seems to be a higher prevalence among those whose last dental visit was to a public clinic (41.9%) than among both government health cardholders and non-government health cardholders who attended elsewhere (17.2% and 17.5% respectively). More uninsured people appeared to have untreated coronal decay than people with insurance (24.6% versus 13.6%).
Discussion Prevalence of untreated coronal decay was significantly associated with age but not with any other sociodemographic variables. The lack of association with disadvantage may be due to insufficient sample size to pick up smaller differences.
24 The National Survey of Adult Oral Health 2004–06: Australian Capital Territory
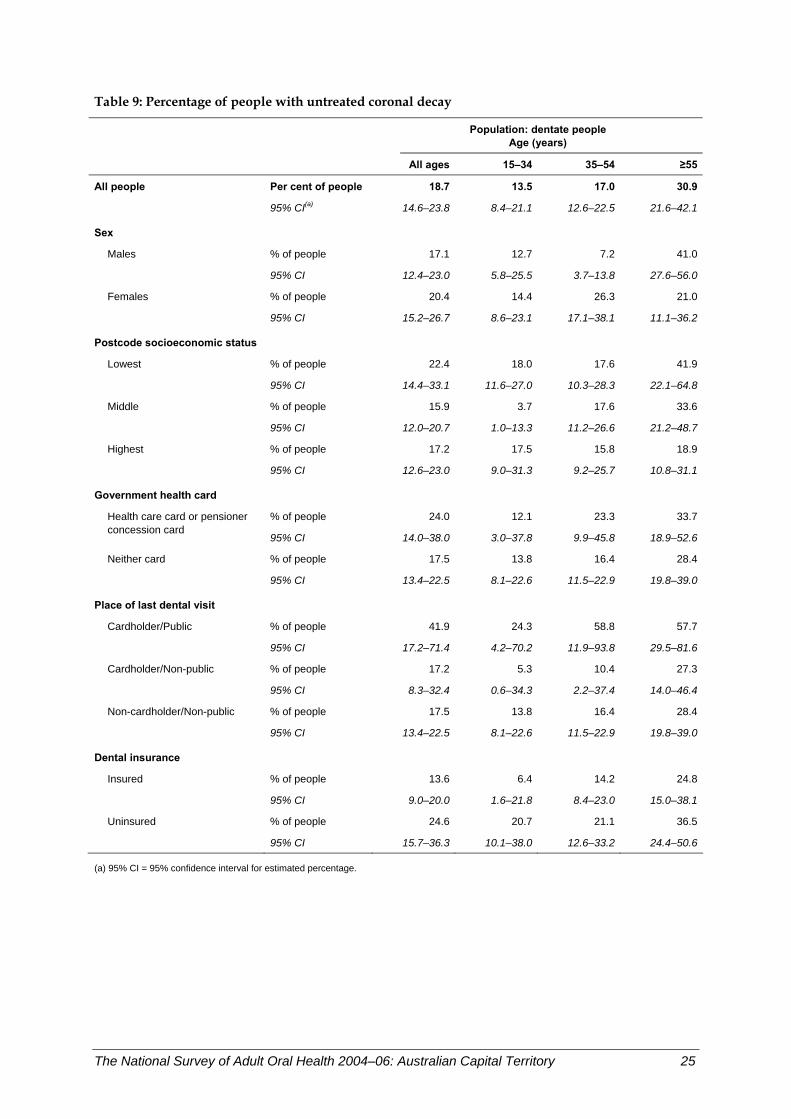
Table 9: Percentage of people with untreated coronal decay
Population: dentate people
Age (years)
All ages 15–34 35–54 ≥55
All people Per cent of people 18.7 13.5 17.0 30.9
95% CI(a) 14.6–23.8 8.4–21.1 12.6–22.5 21.6–42.1
Sex
Males % of people 17.1 12.7 7.2 41.0
95% CI 12.4–23.0 5.8–25.5 3.7–13.8 27.6–56.0
Females % of people 20.4 14.4 26.3 21.0
95% CI 15.2–26.7 8.6–23.1 17.1–38.1 11.1–36.2
Postcode socioeconomic status
Lowest % of people 22.4 18.0 17.6 41.9
95% CI 14.4–33.1 11.6–27.0 10.3–28.3 22.1–64.8
Middle % of people 15.9 3.7 17.6 33.6
95% CI 12.0–20.7 1.0–13.3 11.2–26.6 21.2–48.7
Highest % of people 17.2 17.5 15.8 18.9
95% CI 12.6–23.0 9.0–31.3 9.2–25.7 10.8–31.1
Government health card
% of people 24.0 12.1 23.3 33.7Health care card or pensioner concession card
95% CI 14.0–38.0 3.0–37.8 9.9–45.8 18.9–52.6
Neither card % of people 17.5 13.8 16.4 28.4
95% CI 13.4–22.5 8.1–22.6 11.5–22.9 19.8–39.0
Place of last dental visit Cardholder/Public % of people 41.9 24.3 58.8 57.7
95% CI 17.2–71.4 4.2–70.2 11.9–93.8 29.5–81.6
Cardholder/Non-public % of people 17.2 5.3 10.4 27.3
95% CI 8.3–32.4 0.6–34.3 2.2–37.4 14.0–46.4
Non-cardholder/Non-public % of people 17.5 13.8 16.4 28.4
95% CI 13.4–22.5 8.1–22.6 11.5–22.9 19.8–39.0
Dental insurance Insured % of people 13.6 6.4 14.2 24.8
95% CI 9.0–20.0 1.6–21.8 8.4–23.0 15.0–38.1
Uninsured % of people 24.6 20.7 21.1 36.5
95% CI 15.7–36.3 10.1–38.0 12.6–33.2 24.4–50.6
(a) 95% CI = 95% confidence interval for estimated percentage.
The National Survey of Adult Oral Health 2004–06: Australian Capital Territory 25
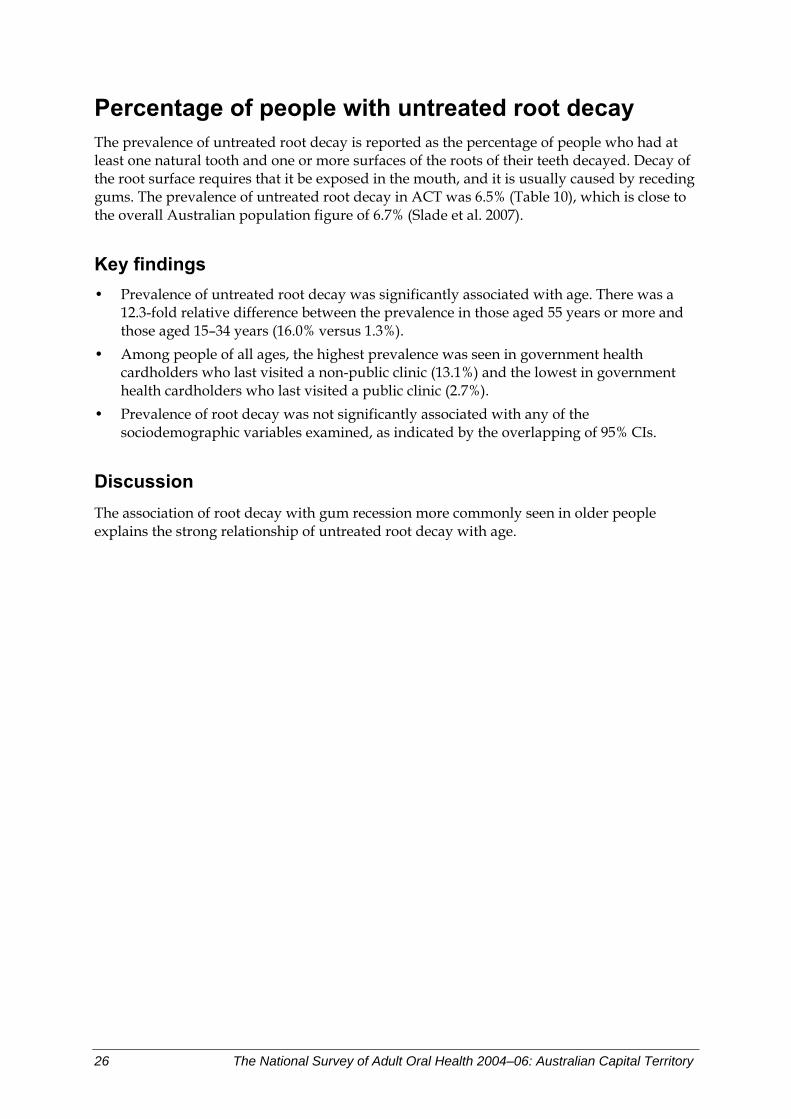
Percentage of people with untreated root decay The prevalence of untreated root decay is reported as the percentage of people who had at least one natural tooth and one or more surfaces of the roots of their teeth decayed. Decay of the root surface requires that it be exposed in the mouth, and it is usually caused by receding gums. The prevalence of untreated root decay in ACT was 6.5% (Table 10), which is close to the overall Australian population figure of 6.7% (Slade et al. 2007).
Key findings • Prevalence of untreated root decay was significantly associated with age. There was a
12.3-fold relative difference between the prevalence in those aged 55 years or more and those aged 15–34 years (16.0% versus 1.3%).
• Among people of all ages, the highest prevalence was seen in government health cardholders who last visited a non-public clinic (13.1%) and the lowest in government health cardholders who last visited a public clinic (2.7%).
• Prevalence of root decay was not significantly associated with any of the sociodemographic variables examined, as indicated by the overlapping of 95% CIs.
Discussion The association of root decay with gum recession more commonly seen in older people explains the strong relationship of untreated root decay with age.
26 The National Survey of Adult Oral Health 2004–06: Australian Capital Territory
Table 10: Percentage of people with untreated root decay
Population: dentate people
Age (years)
All ages 15–34 35–54 ≥55
All people Per cent of people 6.5 1.3 6.5 16.0
95% CI(a) 4.4–9.6 0.4–4.6 2.7–14.8 11.9–21.2
Sex
Males % of people 7.8 0.0 8.5 20.8
95% CI 3.9–14.9 — 2.0–29.5 12.6–32.4
Females % of people 5.3 2.6 4.6 11.3
95% CI 2.6–10.8 0.6–10.5 1.4–14.2 5.3–22.7
Postcode socioeconomic status
Lowest % of people 6.2 1.4 5.6 17.8
95% CI 3.0–12.3 0.3–6.6 2.3–13.0 10.4–28.9
Middle % of people 9.7 0.0 14.1 19.8
95% CI 5.3–16.9 — 3.4–43.6 14.3–26.7
Highest % of people 4.2 2.5 1.6 11.0
95% CI 2.5–6.8 0.5–11.9 0.3–8.8 6.4–18.2
Government health card
% of people 10.2 3.4 0.0 19.4Health care card or pensioner concession card
95% CI 5.0–19.9 0.4–23.0 — 11.8–30.2
Neither card % of people 5.6 0.9 7.0 13.0
95% CI 3.3–9.3 0.1–5.9 2.9–15.8 8.7–18.9
Place of last dental visit Cardholder/Public % of people 2.7 0.0 0.0 7.5
95% CI 0.9–7.9 — — 2.0–24.0
Cardholder/Non-public % of people 13.1 5.3 0.0 22.6
95% CI 6.0–26.1 0.6–34.3 — 12.5–37.5
Non-cardholder/Non-public % of people 5.6 0.9 7.0 13.0
95% CI 3.3–9.3 0.1–5.9 2.9–15.8 8.7–18.9
Dental insurance Insured % of people 7.0 0.0 8.8 15.8
95% CI 3.3–14.4 — 2.6–26.0 9.5–25.3
Uninsured % of people 6.1 2.6 4.0 15.6
95% CI 3.2–11.2 0.7–9.2 1.2–12.4 9.4–24.9
(a) 95% CI = 95% confidence interval for estimated percentage.
The National Survey of Adult Oral Health 2004–06: Australian Capital Territory 27
Percentage of people with one or more filled teeth Fillings for treatment of tooth decay leave permanent marks on the teeth and are one measure of a person’s lifetime experience of decay. Filled teeth also indicate patterns of dental treatment and access to dental care. The prevalence of filled teeth in ACT was 78.8% (Table 11), which is slightly lower than the overall Australian population figure (83.9%) (Slade et al. 2007).
Key findings • Prevalence of filled teeth was significantly associated with age; among those aged
55 years or more and those aged 35–54 years, it was over 1.7 times that of those in the 15–34 years age group (98.1% and 93.3% versus 54.6% respectively).
• Among people of all ages, the highest prevalence was seen in those living in middle socioeconomic status areas (89.3%) and the lowest among government health cardholders who last attended a public clinic (71.6%).
• Prevalence of filled teeth was significantly associated with socioeconomic status of postcodes, with those living in middle status postcodes having a 1.2-fold higher prevalence than those in areas of lowest status (89.3% versus 75.4%).
Discussion The percentage of people with filled teeth relates to lifetime experience of dental decay and its treatment, and hence is associated with age. Prevalence also reflects access to timely dental care, and with type of care used to treat caries being a restoration rather than an extraction. Those in the middle socioeconomic status areas possibly had higher disease experience than those in the highest group but better access to dental care than those in the lowest group; hence, they had the highest prevalence of filled teeth.
In summary, the percentage of people with filled teeth was much lower in the youngest age group but was also related to socioeconomic status of residential area.
28 The National Survey of Adult Oral Health 2004–06: Australian Capital Territory
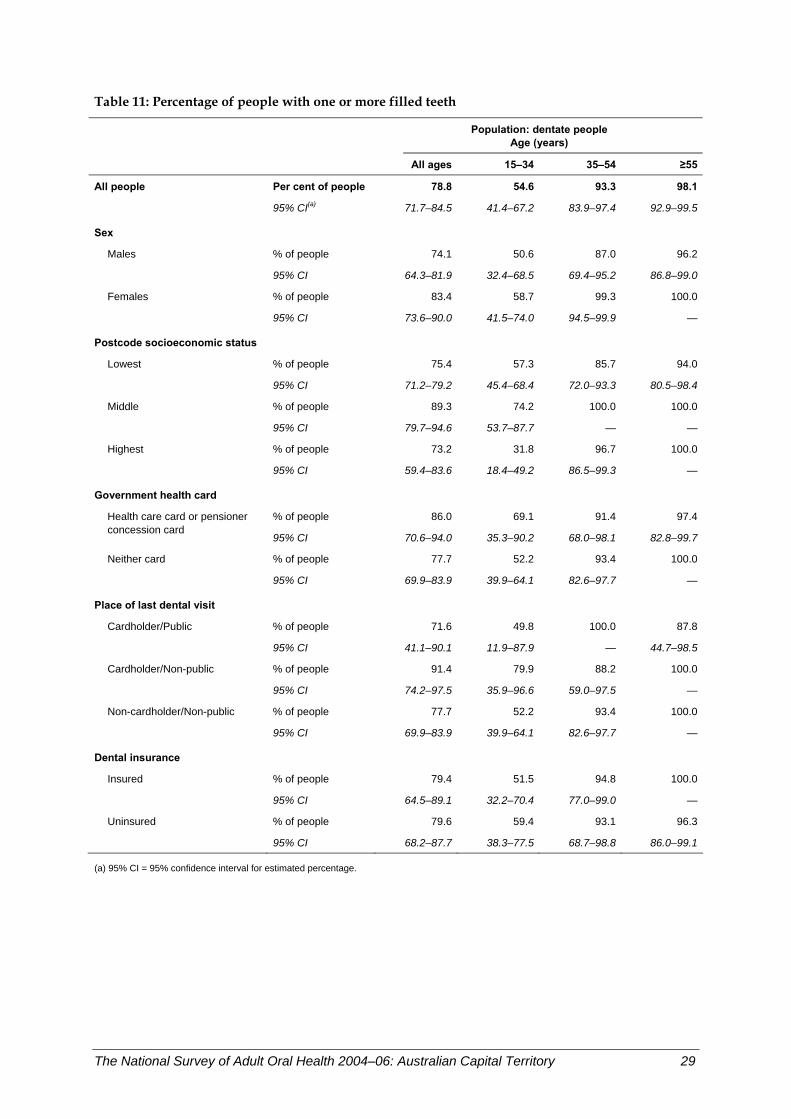
Table 11: Percentage of people with one or more filled teeth
Population: dentate people
Age (years)
All ages 15–34 35–54 ≥55
All people Per cent of people 78.8 54.6 93.3 98.1
95% CI(a) 71.7–84.5 41.4–67.2 83.9–97.4 92.9–99.5
Sex
Males % of people 74.1 50.6 87.0 96.2
95% CI 64.3–81.9 32.4–68.5 69.4–95.2 86.8–99.0
Females % of people 83.4 58.7 99.3 100.0
95% CI 73.6–90.0 41.5–74.0 94.5–99.9 —
Postcode socioeconomic status
Lowest % of people 75.4 57.3 85.7 94.0
95% CI 71.2–79.2 45.4–68.4 72.0–93.3 80.5–98.4
Middle % of people 89.3 74.2 100.0 100.0
95% CI 79.7–94.6 53.7–87.7 — —
Highest % of people 73.2 31.8 96.7 100.0
95% CI 59.4–83.6 18.4–49.2 86.5–99.3 —
Government health card
% of people 86.0 69.1 91.4 97.4Health care card or pensioner concession card
95% CI 70.6–94.0 35.3–90.2 68.0–98.1 82.8–99.7
Neither card % of people 77.7 52.2 93.4 100.0
95% CI 69.9–83.9 39.9–64.1 82.6–97.7 —
Place of last dental visit Cardholder/Public % of people 71.6 49.8 100.0 87.8
95% CI 41.1–90.1 11.9–87.9 — 44.7–98.5
Cardholder/Non-public % of people 91.4 79.9 88.2 100.0
95% CI 74.2–97.5 35.9–96.6 59.0–97.5 —
Non-cardholder/Non-public % of people 77.7 52.2 93.4 100.0
95% CI 69.9–83.9 39.9–64.1 82.6–97.7 —
Dental insurance Insured % of people 79.4 51.5 94.8 100.0
95% CI 64.5–89.1 32.2–70.4 77.0–99.0 —
Uninsured % of people 79.6 59.4 93.1 96.3
95% CI 68.2–87.7 38.3–77.5 68.7–98.8 86.0–99.1
(a) 95% CI = 95% confidence interval for estimated percentage.
The National Survey of Adult Oral Health 2004–06: Australian Capital Territory 29
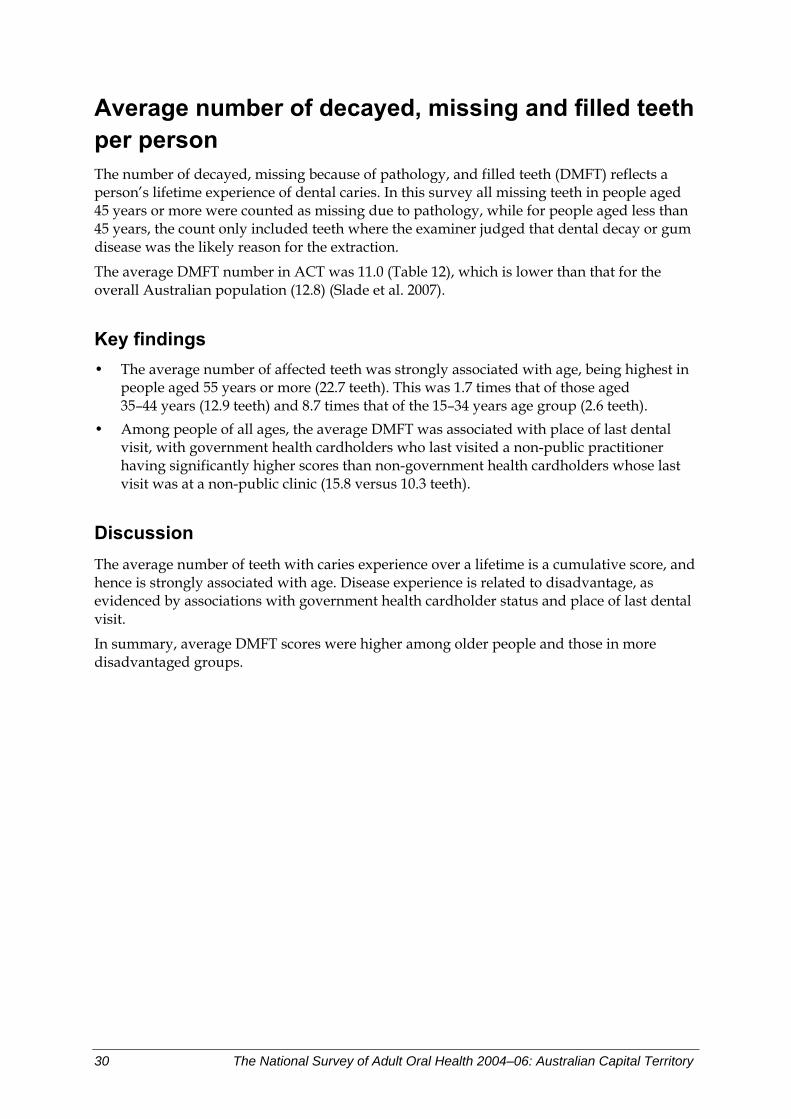
Average number of decayed, missing and filled teeth per person The number of decayed, missing because of pathology, and filled teeth (DMFT) reflects a person’s lifetime experience of dental caries. In this survey all missing teeth in people aged 45 years or more were counted as missing due to pathology, while for people aged less than 45 years, the count only included teeth where the examiner judged that dental decay or gum disease was the likely reason for the extraction.
The average DMFT number in ACT was 11.0 (Table 12), which is lower than that for the overall Australian population (12.8) (Slade et al. 2007).
Key findings • The average number of affected teeth was strongly associated with age, being highest in
people aged 55 years or more (22.7 teeth). This was 1.7 times that of those aged 35–44 years (12.9 teeth) and 8.7 times that of the 15–34 years age group (2.6 teeth).
• Among people of all ages, the average DMFT was associated with place of last dental visit, with government health cardholders who last visited a non-public practitioner having significantly higher scores than non-government health cardholders whose last visit was at a non-public clinic (15.8 versus 10.3 teeth).
Discussion The average number of teeth with caries experience over a lifetime is a cumulative score, and hence is strongly associated with age. Disease experience is related to disadvantage, as evidenced by associations with government health cardholder status and place of last dental visit.
In summary, average DMFT scores were higher among older people and those in more disadvantaged groups.
30 The National Survey of Adult Oral Health 2004–06: Australian Capital Territory
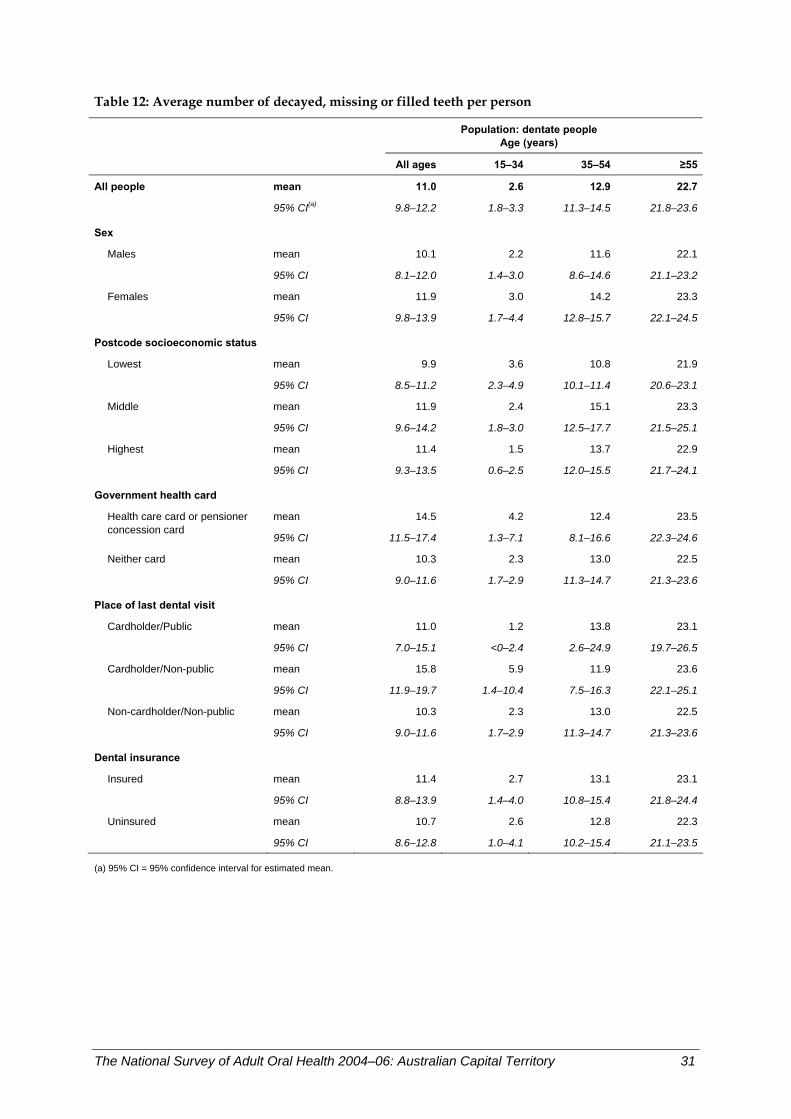
Table 12: Average number of decayed, missing or filled teeth per person
Population: dentate people
Age (years)
All ages 15–34 35–54 ≥55
All people mean 11.0 2.6 12.9 22.7
95% CI(a) 9.8–12.2 1.8–3.3 11.3–14.5 21.8–23.6
Sex
Males mean 10.1 2.2 11.6 22.1
95% CI 8.1–12.0 1.4–3.0 8.6–14.6 21.1–23.2
Females mean 11.9 3.0 14.2 23.3
95% CI 9.8–13.9 1.7–4.4 12.8–15.7 22.1–24.5
Postcode socioeconomic status
Lowest mean 9.9 3.6 10.8 21.9
95% CI 8.5–11.2 2.3–4.9 10.1–11.4 20.6–23.1
Middle mean 11.9 2.4 15.1 23.3
95% CI 9.6–14.2 1.8–3.0 12.5–17.7 21.5–25.1
Highest mean 11.4 1.5 13.7 22.9
95% CI 9.3–13.5 0.6–2.5 12.0–15.5 21.7–24.1
Government health card
mean 14.5 4.2 12.4 23.5Health care card or pensioner concession card
95% CI 11.5–17.4 1.3–7.1 8.1–16.6 22.3–24.6
Neither card mean 10.3 2.3 13.0 22.5
95% CI 9.0–11.6 1.7–2.9 11.3–14.7 21.3–23.6
Place of last dental visit Cardholder/Public mean 11.0 1.2 13.8 23.1
95% CI 7.0–15.1 <0–2.4 2.6–24.9 19.7–26.5
Cardholder/Non-public mean 15.8 5.9 11.9 23.6
95% CI 11.9–19.7 1.4–10.4 7.5–16.3 22.1–25.1
Non-cardholder/Non-public mean 10.3 2.3 13.0 22.5
95% CI 9.0–11.6 1.7–2.9 11.3–14.7 21.3–23.6
Dental insurance Insured mean 11.4 2.7 13.1 23.1
95% CI 8.8–13.9 1.4–4.0 10.8–15.4 21.8–24.4
Uninsured mean 10.7 2.6 12.8 22.3
95% CI 8.6–12.8 1.0–4.1 10.2–15.4 21.1–23.5
(a) 95% CI = 95% confidence interval for estimated mean.
The National Survey of Adult Oral Health 2004–06: Australian Capital Territory 31
Prevalence of moderate or severe periodontitis A case definition of periodontitis has been developed jointly by the US Centers for Disease Control and Prevention (CDC) and the American Academy of Periodontology (AAP) to describe prevalence of moderate and severe periodontitis. The CDC–AAP defines moderate periodontitis as the presence of either two sites between adjacent teeth where the gum has lost its attachment to the tooth for 4 mm or more, or at least two such sites that have pockets of 5 mm or more. Severe periodontitis has been defined as having at least two sites between adjacent teeth where the gum has lost its attachment to the tooth for 6 mm or more, and there is at least one pocket of 5 mm or greater depth. Table 13 reports estimates of combined moderate and severe periodontitis.
In ACT, a total of 21.8% of the dentate population had moderate or severe periodontitis (Table 13), which was lower, but not significantly, than the national estimate of 22.9% (Slade et al. 2007).
Key findings • The prevalence of moderate or severe periodontitis was strongly associated with age in
ACT, being 10.3% in 15–34-year-old adults but affecting 50.0% of those aged 55 years or more. The difference between those two age groups was statistically significant.
• The prevalence in government health cardholders was more than twice as high as that in non-government health cardholders.
• Likewise, people who did not have private dental insurance had a significantly higher prevalence of periodontitis compared with those who had private insurance. This trend remained significant in the youngest and middle-aged groups.
Discussion Components of periodontal disease measurement reflect both concurrent disease state and historical accumulation of the disease. Therefore, a strong association with age was fully expected. Because periodontitis was more prevalent in the middle-aged and older segments of the population, comparisons between population groups were observed most clearly in those age groups.
In summary, moderate or severe periodontitis affected one-fifth of the ACT adult population, with the highest proportion of those affected being in the oldest age group. The disease was more likely to be observed in people in a lower socioeconomic position.
32 The National Survey of Adult Oral Health 2004–06: Australian Capital Territory
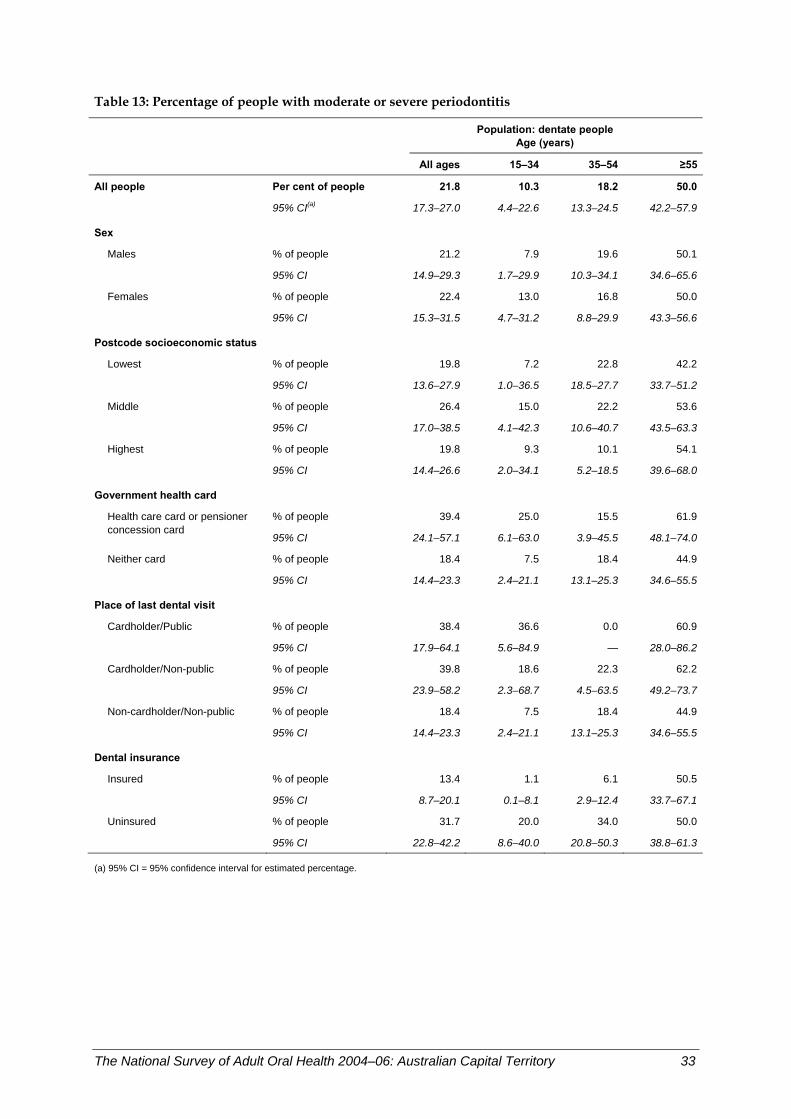
Table 13: Percentage of people with moderate or severe periodontitis
Population: dentate people
Age (years)
All ages 15–34 35–54 ≥55
All people Per cent of people 21.8 10.3 18.2 50.0
95% CI(a) 17.3–27.0 4.4–22.6 13.3–24.5 42.2–57.9
Sex
Males % of people 21.2 7.9 19.6 50.1
95% CI 14.9–29.3 1.7–29.9 10.3–34.1 34.6–65.6
Females % of people 22.4 13.0 16.8 50.0
95% CI 15.3–31.5 4.7–31.2 8.8–29.9 43.3–56.6
Postcode socioeconomic status
Lowest % of people 19.8 7.2 22.8 42.2
95% CI 13.6–27.9 1.0–36.5 18.5–27.7 33.7–51.2
Middle % of people 26.4 15.0 22.2 53.6
95% CI 17.0–38.5 4.1–42.3 10.6–40.7 43.5–63.3
Highest % of people 19.8 9.3 10.1 54.1
95% CI 14.4–26.6 2.0–34.1 5.2–18.5 39.6–68.0
Government health card
% of people 39.4 25.0 15.5 61.9Health care card or pensioner concession card
95% CI 24.1–57.1 6.1–63.0 3.9–45.5 48.1–74.0
Neither card % of people 18.4 7.5 18.4 44.9
95% CI 14.4–23.3 2.4–21.1 13.1–25.3 34.6–55.5
Place of last dental visit Cardholder/Public % of people 38.4 36.6 0.0 60.9
95% CI 17.9–64.1 5.6–84.9 — 28.0–86.2
Cardholder/Non-public % of people 39.8 18.6 22.3 62.2
95% CI 23.9–58.2 2.3–68.7 4.5–63.5 49.2–73.7
Non-cardholder/Non-public % of people 18.4 7.5 18.4 44.9
95% CI 14.4–23.3 2.4–21.1 13.1–25.3 34.6–55.5
Dental insurance Insured % of people 13.4 1.1 6.1 50.5
95% CI 8.7–20.1 0.1–8.1 2.9–12.4 33.7–67.1
Uninsured % of people 31.7 20.0 34.0 50.0
95% CI 22.8–42.2 8.6–40.0 20.8–50.3 38.8–61.3
(a) 95% CI = 95% confidence interval for estimated percentage.
The National Survey of Adult Oral Health 2004–06: Australian Capital Territory 33
Prevalence of deep pocket depth Deep periodontal pockets have been defined as 4 mm or more. The depth of the pocket, measured in millimetres using a periodontal probe, is an indication of the severity of the destructive process.
In ACT, a total of 36.4% of the dentate adult population had at least one site with periodontal pocket depth of 4 mm or more (Table 14), which was significantly higher than the national estimate of 19.8% (Slade et al. 2007).
Key findings • There was a tendency that the prevalence of deep periodontal pockets increased with
age. The oldest age group had the highest prevalence of the condition. The difference between the youngest and the oldest age groups was statistically significant.
• The prevalence of deep periodontal pockets was significantly higher among people who did not have private dental insurance, a trend that remained significant for the youngest and middle-aged groups. Young adults who did not have private insurance had five times the prevalence compared with those of the same age group who had private insurance.
Discussion The depth of periodontal pockets reflects a more current activity of periodontal inflammation.
In summary, there was a tendency of higher prevalence of deep periodontal pockets among older people and those who were in a lower socioeconomic position.
34 The National Survey of Adult Oral Health 2004–06: Australian Capital Territory
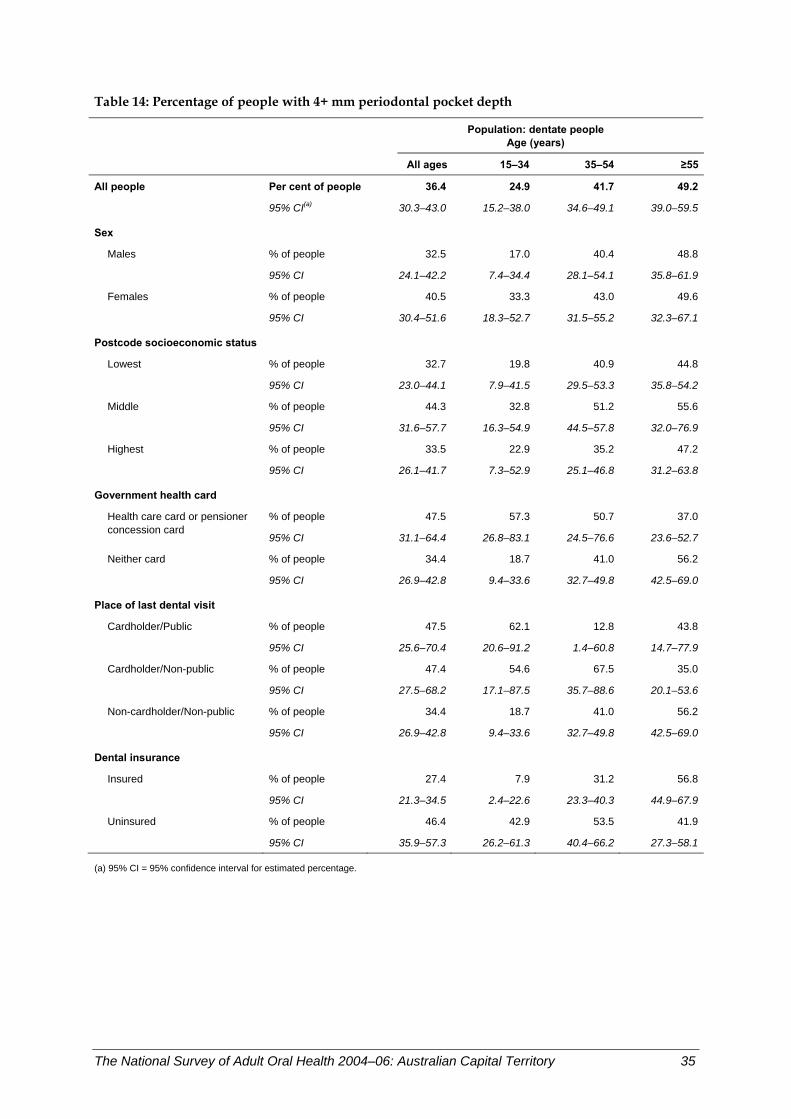
Table 14: Percentage of people with 4+ mm periodontal pocket depth
Population: dentate people
Age (years)
All ages 15–34 35–54 ≥55
All people Per cent of people 36.4 24.9 41.7 49.2
95% CI(a) 30.3–43.0 15.2–38.0 34.6–49.1 39.0–59.5
Sex
Males % of people 32.5 17.0 40.4 48.8
95% CI 24.1–42.2 7.4–34.4 28.1–54.1 35.8–61.9
Females % of people 40.5 33.3 43.0 49.6
95% CI 30.4–51.6 18.3–52.7 31.5–55.2 32.3–67.1
Postcode socioeconomic status
Lowest % of people 32.7 19.8 40.9 44.8
95% CI 23.0–44.1 7.9–41.5 29.5–53.3 35.8–54.2
Middle % of people 44.3 32.8 51.2 55.6
95% CI 31.6–57.7 16.3–54.9 44.5–57.8 32.0–76.9
Highest % of people 33.5 22.9 35.2 47.2
95% CI 26.1–41.7 7.3–52.9 25.1–46.8 31.2–63.8
Government health card
% of people 47.5 57.3 50.7 37.0Health care card or pensioner concession card
95% CI 31.1–64.4 26.8–83.1 24.5–76.6 23.6–52.7
Neither card % of people 34.4 18.7 41.0 56.2
95% CI 26.9–42.8 9.4–33.6 32.7–49.8 42.5–69.0
Place of last dental visit Cardholder/Public % of people 47.5 62.1 12.8 43.8
95% CI 25.6–70.4 20.6–91.2 1.4–60.8 14.7–77.9
Cardholder/Non-public % of people 47.4 54.6 67.5 35.0
95% CI 27.5–68.2 17.1–87.5 35.7–88.6 20.1–53.6
Non-cardholder/Non-public % of people 34.4 18.7 41.0 56.2
95% CI 26.9–42.8 9.4–33.6 32.7–49.8 42.5–69.0
Dental insurance Insured % of people 27.4 7.9 31.2 56.8
95% CI 21.3–34.5 2.4–22.6 23.3–40.3 44.9–67.9
Uninsured % of people 46.4 42.9 53.5 41.9
95% CI 35.9–57.3 26.2–61.3 40.4–66.2 27.3–58.1
(a) 95% CI = 95% confidence interval for estimated percentage.
The National Survey of Adult Oral Health 2004–06: Australian Capital Territory 35
Prevalence of 4+ mm clinical attachment loss Clinical attachment loss (CAL) is the loss of supporting periodontal structure around the tooth. Attachment may be lost through gum recession or the development of periodontal pockets from the inflammatory disease periodontitis. In NSAOH, CAL was measured using a combination of gum recession and periodontal probing depth on three sites per tooth.
In ACT, a total of 40.2% of dentate adults had at least one site with 4 mm or more CAL (Table 15), which was lower, but not significantly, than the national estimate of 42.5% (Slade et al. 2007).
Key findings • The prevalence of 4+ mm CAL was strongly associated with age in ACT, being 19.5% in
15–34-year-old adults but affecting 40.5% of middle-aged adults and 79.2% of adults aged 55 years or more. The differences between the three age groups were statistically significant.
• There was a tendency that government health cardholders had higher prevalence compared with non-government health cardholders. However, the difference was not statistically significant.
• There was a tendency that people who did not have a private insurance were more likely to have the condition. However, the difference was not statistically significant.
Discussion Clinical attachment loss reflects an accumulation of activity of periodontal inflammation as well as a physiological process in the gums. Therefore, a strong age effect was observed. This condition was highly prevalent in certain groups of the oldest population.
In summary, clinical attachment loss was highly prevalent in this population. It was more likely to occur in the older population and in people with lower socioeconomic status.
36 The National Survey of Adult Oral Health 2004–06: Australian Capital Territory
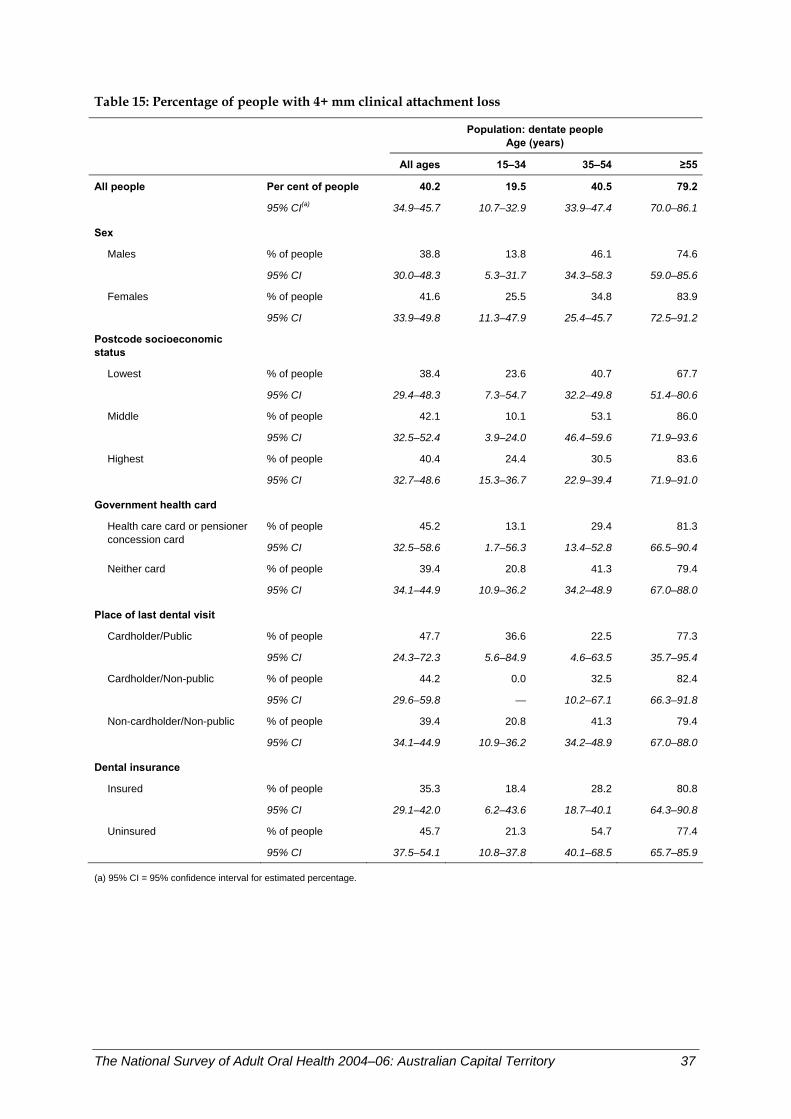
Table 15: Percentage of people with 4+ mm clinical attachment loss
Population: dentate people
Age (years)
All ages 15–34 35–54 ≥55
All people Per cent of people 40.2 19.5 40.5 79.2
95% CI(a) 34.9–45.7 10.7–32.9 33.9–47.4 70.0–86.1
Sex
Males % of people 38.8 13.8 46.1 74.6
95% CI 30.0–48.3 5.3–31.7 34.3–58.3 59.0–85.6
Females % of people 41.6 25.5 34.8 83.9
95% CI 33.9–49.8 11.3–47.9 25.4–45.7 72.5–91.2
Postcode socioeconomic status
Lowest % of people 38.4 23.6 40.7 67.7
95% CI 29.4–48.3 7.3–54.7 32.2–49.8 51.4–80.6
Middle % of people 42.1 10.1 53.1 86.0
95% CI 32.5–52.4 3.9–24.0 46.4–59.6 71.9–93.6
Highest % of people 40.4 24.4 30.5 83.6
95% CI 32.7–48.6 15.3–36.7 22.9–39.4 71.9–91.0
Government health card
% of people 45.2 13.1 29.4 81.3Health care card or pensioner concession card
95% CI 32.5–58.6 1.7–56.3 13.4–52.8 66.5–90.4
Neither card % of people 39.4 20.8 41.3 79.4
95% CI 34.1–44.9 10.9–36.2 34.2–48.9 67.0–88.0
Place of last dental visit Cardholder/Public % of people 47.7 36.6 22.5 77.3
95% CI 24.3–72.3 5.6–84.9 4.6–63.5 35.7–95.4
Cardholder/Non-public % of people 44.2 0.0 32.5 82.4
95% CI 29.6–59.8 — 10.2–67.1 66.3–91.8
Non-cardholder/Non-public % of people 39.4 20.8 41.3 79.4
95% CI 34.1–44.9 10.9–36.2 34.2–48.9 67.0–88.0
Dental insurance Insured % of people 35.3 18.4 28.2 80.8
95% CI 29.1–42.0 6.2–43.6 18.7–40.1 64.3–90.8
Uninsured % of people 45.7 21.3 54.7 77.4
95% CI 37.5–54.1 10.8–37.8 40.1–68.5 65.7–85.9
(a) 95% CI = 95% confidence interval for estimated percentage.
The National Survey of Adult Oral Health 2004–06: Australian Capital Territory 37
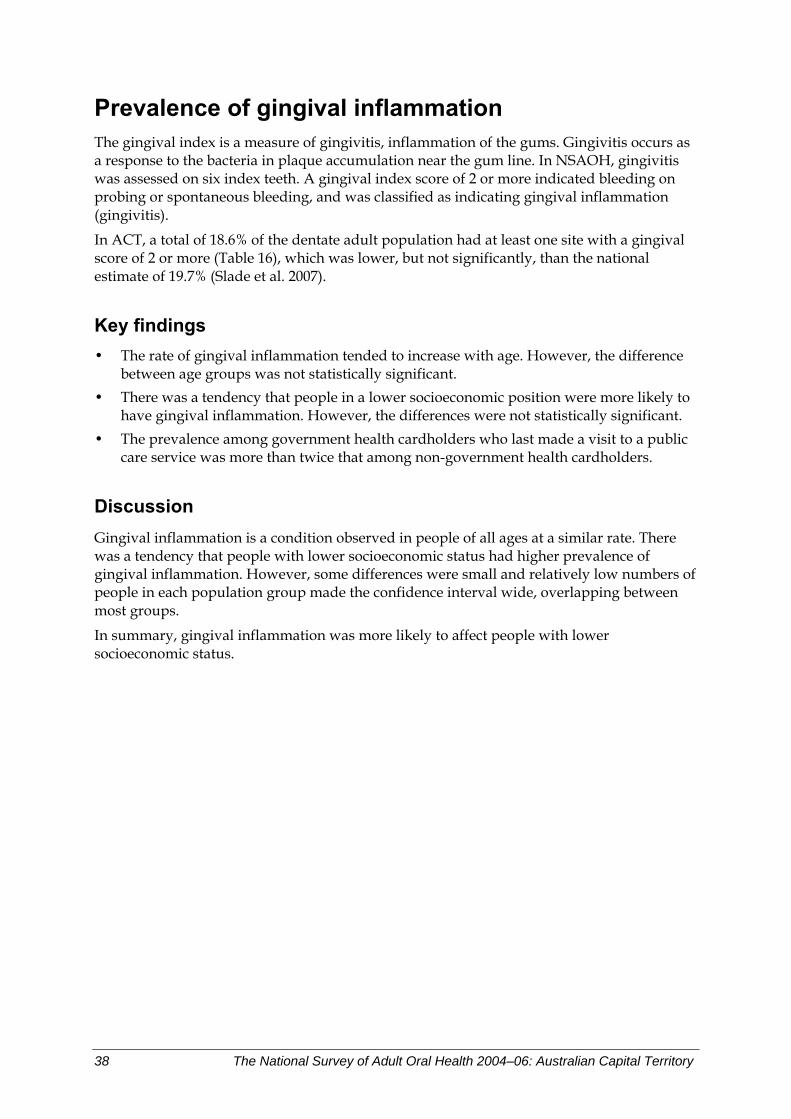
Prevalence of gingival inflammation The gingival index is a measure of gingivitis, inflammation of the gums. Gingivitis occurs as a response to the bacteria in plaque accumulation near the gum line. In NSAOH, gingivitis was assessed on six index teeth. A gingival index score of 2 or more indicated bleeding on probing or spontaneous bleeding, and was classified as indicating gingival inflammation (gingivitis).
In ACT, a total of 18.6% of the dentate adult population had at least one site with a gingival score of 2 or more (Table 16), which was lower, but not significantly, than the national estimate of 19.7% (Slade et al. 2007).
Key findings • The rate of gingival inflammation tended to increase with age. However, the difference
between age groups was not statistically significant. • There was a tendency that people in a lower socioeconomic position were more likely to
have gingival inflammation. However, the differences were not statistically significant. • The prevalence among government health cardholders who last made a visit to a public
care service was more than twice that among non-government health cardholders.
Discussion Gingival inflammation is a condition observed in people of all ages at a similar rate. There was a tendency that people with lower socioeconomic status had higher prevalence of gingival inflammation. However, some differences were small and relatively low numbers of people in each population group made the confidence interval wide, overlapping between most groups.
In summary, gingival inflammation was more likely to affect people with lower socioeconomic status.
38 The National Survey of Adult Oral Health 2004–06: Australian Capital Territory
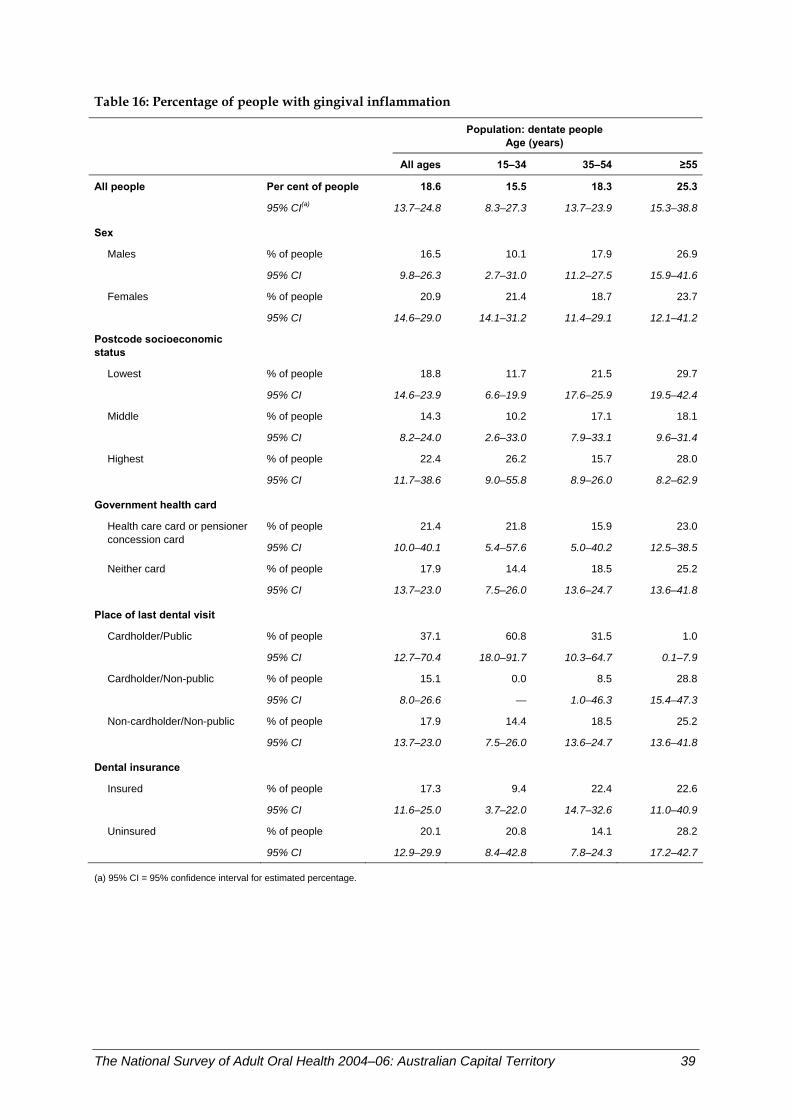
Table 16: Percentage of people with gingival inflammation
Population: dentate people
Age (years)
All ages 15–34 35–54 ≥55
All people Per cent of people 18.6 15.5 18.3 25.3
95% CI(a) 13.7–24.8 8.3–27.3 13.7–23.9 15.3–38.8
Sex
Males % of people 16.5 10.1 17.9 26.9
95% CI 9.8–26.3 2.7–31.0 11.2–27.5 15.9–41.6
Females % of people 20.9 21.4 18.7 23.7
95% CI 14.6–29.0 14.1–31.2 11.4–29.1 12.1–41.2
Postcode socioeconomic status
Lowest % of people 18.8 11.7 21.5 29.7
95% CI 14.6–23.9 6.6–19.9 17.6–25.9 19.5–42.4
Middle % of people 14.3 10.2 17.1 18.1
95% CI 8.2–24.0 2.6–33.0 7.9–33.1 9.6–31.4
Highest % of people 22.4 26.2 15.7 28.0
95% CI 11.7–38.6 9.0–55.8 8.9–26.0 8.2–62.9
Government health card
% of people 21.4 21.8 15.9 23.0Health care card or pensioner concession card
95% CI 10.0–40.1 5.4–57.6 5.0–40.2 12.5–38.5
Neither card % of people 17.9 14.4 18.5 25.2
95% CI 13.7–23.0 7.5–26.0 13.6–24.7 13.6–41.8
Place of last dental visit Cardholder/Public % of people 37.1 60.8 31.5 1.0
95% CI 12.7–70.4 18.0–91.7 10.3–64.7 0.1–7.9
Cardholder/Non-public % of people 15.1 0.0 8.5 28.8
95% CI 8.0–26.6 — 1.0–46.3 15.4–47.3
Non-cardholder/Non-public % of people 17.9 14.4 18.5 25.2
95% CI 13.7–23.0 7.5–26.0 13.6–24.7 13.6–41.8
Dental insurance Insured % of people 17.3 9.4 22.4 22.6
95% CI 11.6–25.0 3.7–22.0 14.7–32.6 11.0–40.9
Uninsured % of people 20.1 20.8 14.1 28.2
95% CI 12.9–29.9 8.4–42.8 7.8–24.3 17.2–42.7
(a) 95% CI = 95% confidence interval for estimated percentage.
The National Survey of Adult Oral Health 2004–06: Australian Capital Territory 39
4 Oral health care
People’s most recent dental visit Time since last visiting a dentist is a key indicator of access to dental care. In NSAOH, the time since last dental visit was assessed in the interview by asking ‘How long ago did you last see a dental professional about your teeth, dentures or gums?’. Five responses were possible including ‘Less than 12 months.’ In ACT, 66.4% of people aged 15 years or more had visited a dentist within the last 12 months (Table 17), significantly higher than the national estimate of 59.4% (Slade et al. 2007).
Key findings • There was little variation across age groups in the percentage of ACT residents reporting
they had visited a dentist within the last 12 months. • Percentages were slightly higher among females than males (69.0% versus 63.7%).
Similar differences between females and males were evident in the two younger age groups although they were not significant.
• Adults living in high socioeconomic postcodes reported a slightly higher prevalence than those who lived in postcodes of low socioeconomic status (70.6% versus 63.6%). Within age groups, differences between high and low socioeconomic areas were larger, with significant differences observed for those aged 35–54 years (81.1% versus 62.3%) and 55 years or more (77.7% versus 58.2%).
• Government health cardholders were less likely to have visited a dentist in the last 12 months than non-government health cardholders (55.6% versus 68.3%). This difference was mainly attributable to adults aged 15–34 years (39.5% versus 64.5%).
• Lowest percentages were reported among government health cardholders who attended a public practice at their last dental visit than those who attended a private practice (48.2% versus 58.3%), although this difference was not significant. Within age groups, the largest difference was observed for 35–54-year-olds, with only 37.9% of public attendees visiting within the last 12 months compared with 83.0% of private attendees. However, this difference was not statistically significant due to large confidence intervals associated with these estimates.
• Insurance status was strongly associated with dental visiting. Insured adults were far more likely to have visited a dentist within the last 12 months than those without dental insurance (77.1% versus 57.2%). Large differences by insurance status were also observed within each age group, particularly for those aged 15–34 years and 35–54 years.
Discussion Of ACT residents aged 15 years or more, 2 out of 3 visited a dentist within the preceding 12 months. Having dental insurance and not holding a government health card were associated with recent visiting. For adults aged 35 years or more, living in areas of high socioeconomic status was also associated with visiting within the last 12 months. People aged 35–54 years who were government health cardholders and who last visited a public practice reported the lowest percentage.
40 The National Survey of Adult Oral Health 2004–06: Australian Capital Territory
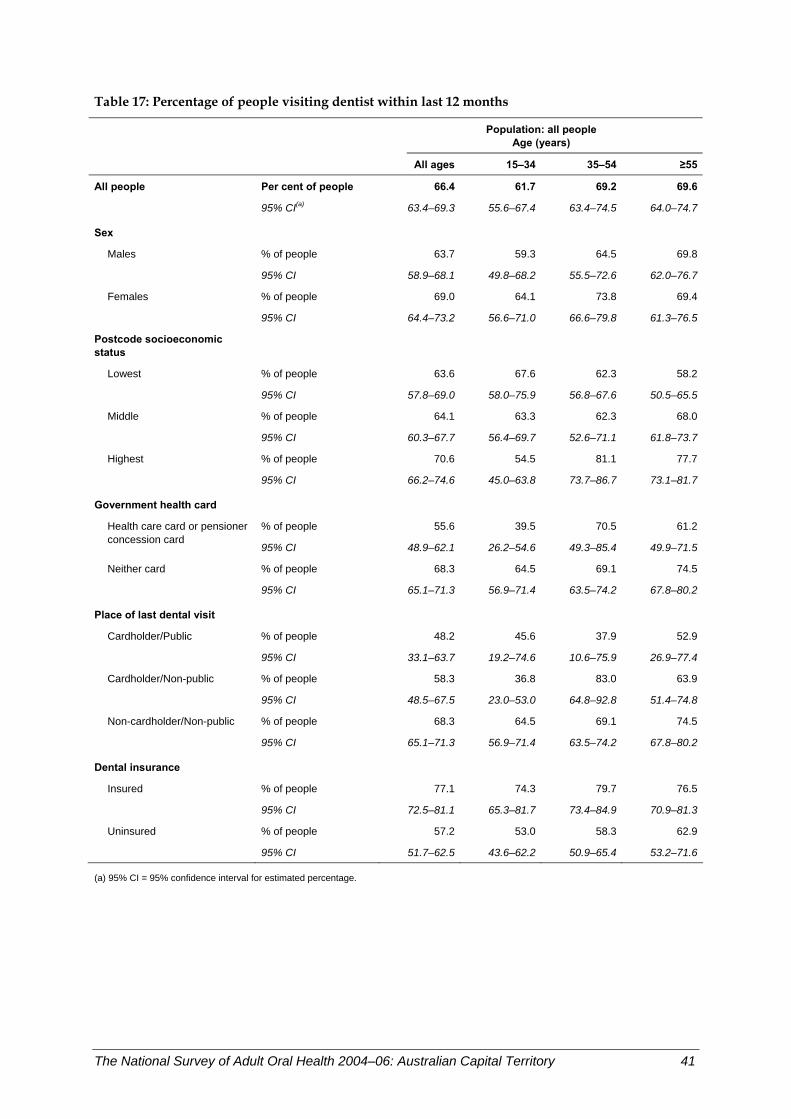
Table 17: Percentage of people visiting dentist within last 12 months
Population: all people
Age (years)
All ages 15–34 35–54 ≥55
All people Per cent of people 66.4 61.7 69.2 69.6
95% CI(a) 63.4–69.3 55.6–67.4 63.4–74.5 64.0–74.7
Sex
Males % of people 63.7 59.3 64.5 69.8
95% CI 58.9–68.1 49.8–68.2 55.5–72.6 62.0–76.7
Females % of people 69.0 64.1 73.8 69.4
95% CI 64.4–73.2 56.6–71.0 66.6–79.8 61.3–76.5
Postcode socioeconomic status
Lowest % of people 63.6 67.6 62.3 58.2
95% CI 57.8–69.0 58.0–75.9 56.8–67.6 50.5–65.5
Middle % of people 64.1 63.3 62.3 68.0
95% CI 60.3–67.7 56.4–69.7 52.6–71.1 61.8–73.7
Highest % of people 70.6 54.5 81.1 77.7
95% CI 66.2–74.6 45.0–63.8 73.7–86.7 73.1–81.7
Government health card
% of people 55.6 39.5 70.5 61.2Health care card or pensioner concession card
95% CI 48.9–62.1 26.2–54.6 49.3–85.4 49.9–71.5
Neither card % of people 68.3 64.5 69.1 74.5
95% CI 65.1–71.3 56.9–71.4 63.5–74.2 67.8–80.2
Place of last dental visit Cardholder/Public % of people 48.2 45.6 37.9 52.9
95% CI 33.1–63.7 19.2–74.6 10.6–75.9 26.9–77.4
Cardholder/Non-public % of people 58.3 36.8 83.0 63.9
95% CI 48.5–67.5 23.0–53.0 64.8–92.8 51.4–74.8
Non-cardholder/Non-public % of people 68.3 64.5 69.1 74.5
95% CI 65.1–71.3 56.9–71.4 63.5–74.2 67.8–80.2
Dental insurance Insured % of people 77.1 74.3 79.7 76.5
95% CI 72.5–81.1 65.3–81.7 73.4–84.9 70.9–81.3
Uninsured % of people 57.2 53.0 58.3 62.9
95% CI 51.7–62.5 43.6–62.2 50.9–65.4 53.2–71.6
(a) 95% CI = 95% confidence interval for estimated percentage.
The National Survey of Adult Oral Health 2004–06: Australian Capital Territory 41
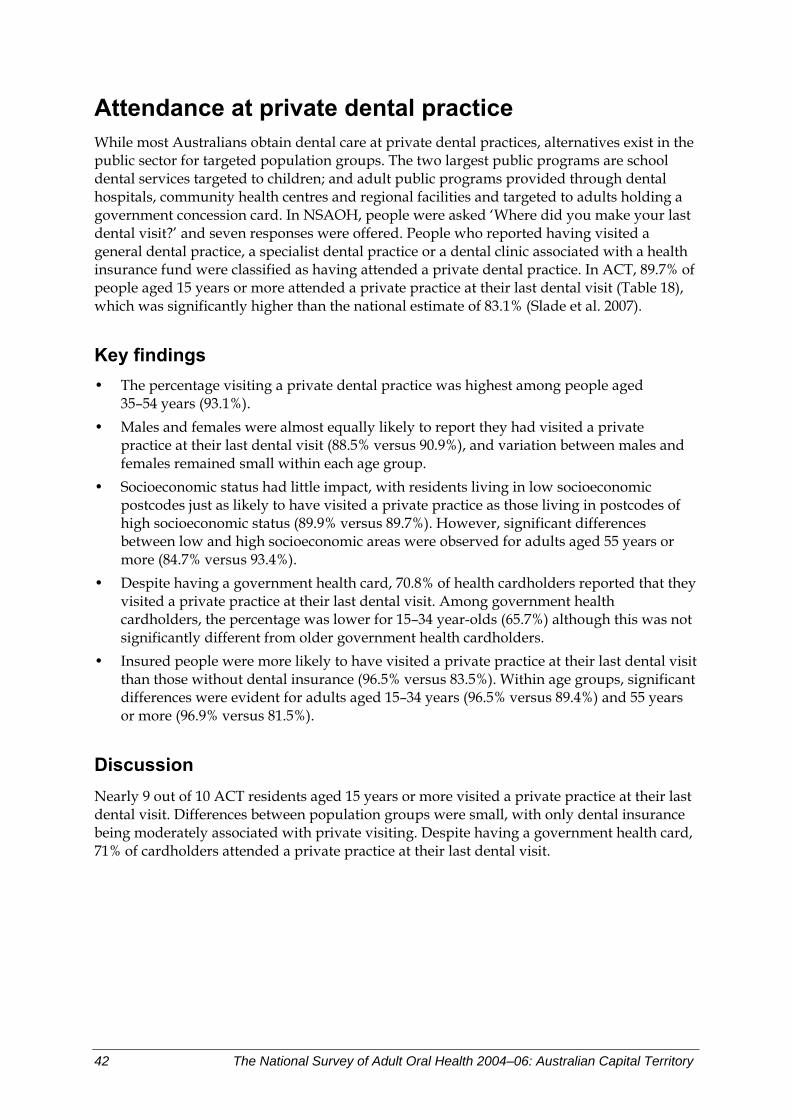
Attendance at private dental practice While most Australians obtain dental care at private dental practices, alternatives exist in the public sector for targeted population groups. The two largest public programs are school dental services targeted to children; and adult public programs provided through dental hospitals, community health centres and regional facilities and targeted to adults holding a government concession card. In NSAOH, people were asked ‘Where did you make your last dental visit?’ and seven responses were offered. People who reported having visited a general dental practice, a specialist dental practice or a dental clinic associated with a health insurance fund were classified as having attended a private dental practice. In ACT, 89.7% of people aged 15 years or more attended a private practice at their last dental visit (Table 18), which was significantly higher than the national estimate of 83.1% (Slade et al. 2007).
Key findings • The percentage visiting a private dental practice was highest among people aged
35–54 years (93.1%). • Males and females were almost equally likely to report they had visited a private
practice at their last dental visit (88.5% versus 90.9%), and variation between males and females remained small within each age group.
• Socioeconomic status had little impact, with residents living in low socioeconomic postcodes just as likely to have visited a private practice as those living in postcodes of high socioeconomic status (89.9% versus 89.7%). However, significant differences between low and high socioeconomic areas were observed for adults aged 55 years or more (84.7% versus 93.4%).
• Despite having a government health card, 70.8% of health cardholders reported that they visited a private practice at their last dental visit. Among government health cardholders, the percentage was lower for 15–34 year-olds (65.7%) although this was not significantly different from older government health cardholders.
• Insured people were more likely to have visited a private practice at their last dental visit than those without dental insurance (96.5% versus 83.5%). Within age groups, significant differences were evident for adults aged 15–34 years (96.5% versus 89.4%) and 55 years or more (96.9% versus 81.5%).
Discussion Nearly 9 out of 10 ACT residents aged 15 years or more visited a private practice at their last dental visit. Differences between population groups were small, with only dental insurance being moderately associated with private visiting. Despite having a government health card, 71% of cardholders attended a private practice at their last dental visit.
42 The National Survey of Adult Oral Health 2004–06: Australian Capital Territory
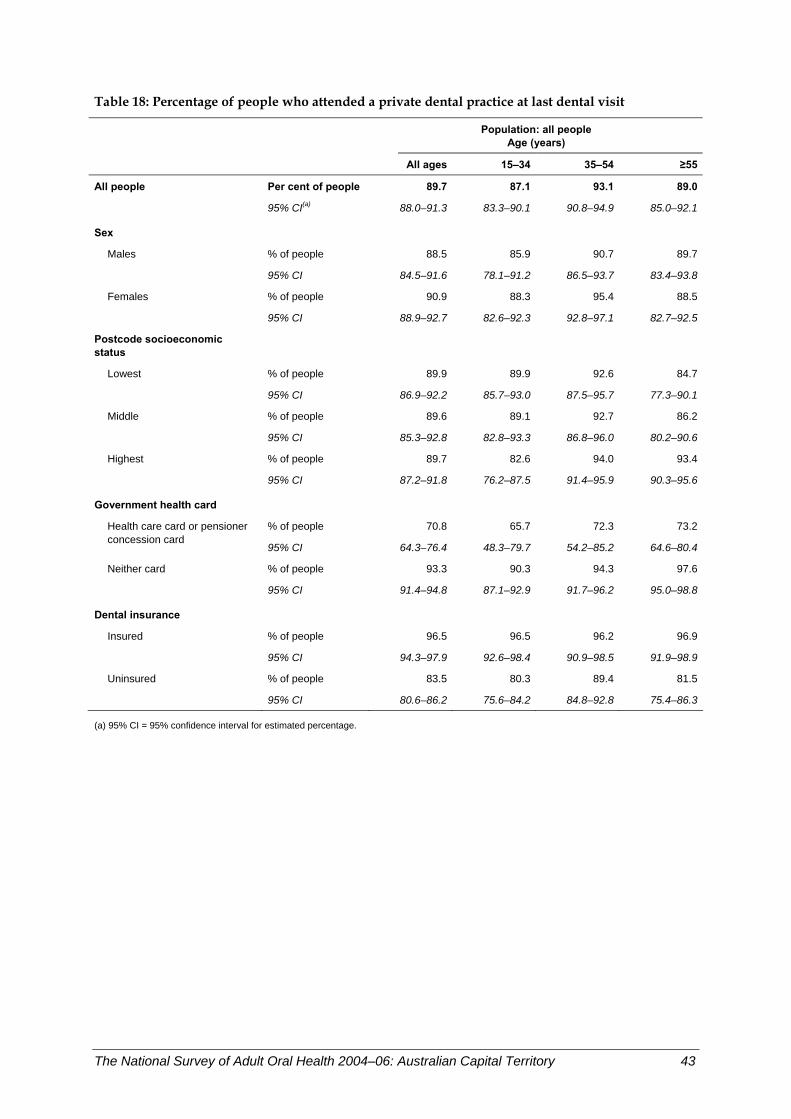
Table 18: Percentage of people who attended a private dental practice at last dental visit
Population: all people
Age (years)
All ages 15–34 35–54 ≥55
All people Per cent of people 89.7 87.1 93.1 89.0
95% CI(a) 88.0–91.3 83.3–90.1 90.8–94.9 85.0–92.1
Sex
Males % of people 88.5 85.9 90.7 89.7
95% CI 84.5–91.6 78.1–91.2 86.5–93.7 83.4–93.8
Females % of people 90.9 88.3 95.4 88.5
95% CI 88.9–92.7 82.6–92.3 92.8–97.1 82.7–92.5
Postcode socioeconomic status
Lowest % of people 89.9 89.9 92.6 84.7
95% CI 86.9–92.2 85.7–93.0 87.5–95.7 77.3–90.1
Middle % of people 89.6 89.1 92.7 86.2
95% CI 85.3–92.8 82.8–93.3 86.8–96.0 80.2–90.6
Highest % of people 89.7 82.6 94.0 93.4
95% CI 87.2–91.8 76.2–87.5 91.4–95.9 90.3–95.6
Government health card
% of people 70.8 65.7 72.3 73.2Health care card or pensioner concession card
95% CI 64.3–76.4 48.3–79.7 54.2–85.2 64.6–80.4
Neither card % of people 93.3 90.3 94.3 97.6
95% CI 91.4–94.8 87.1–92.9 91.7–96.2 95.0–98.8
Dental insurance Insured % of people 96.5 96.5 96.2 96.9
95% CI 94.3–97.9 92.6–98.4 90.9–98.5 91.9–98.9
Uninsured % of people 83.5 80.3 89.4 81.5
95% CI 80.6–86.2 75.6–84.2 84.8–92.8 75.4–86.3
(a) 95% CI = 95% confidence interval for estimated percentage.
The National Survey of Adult Oral Health 2004–06: Australian Capital Territory 43
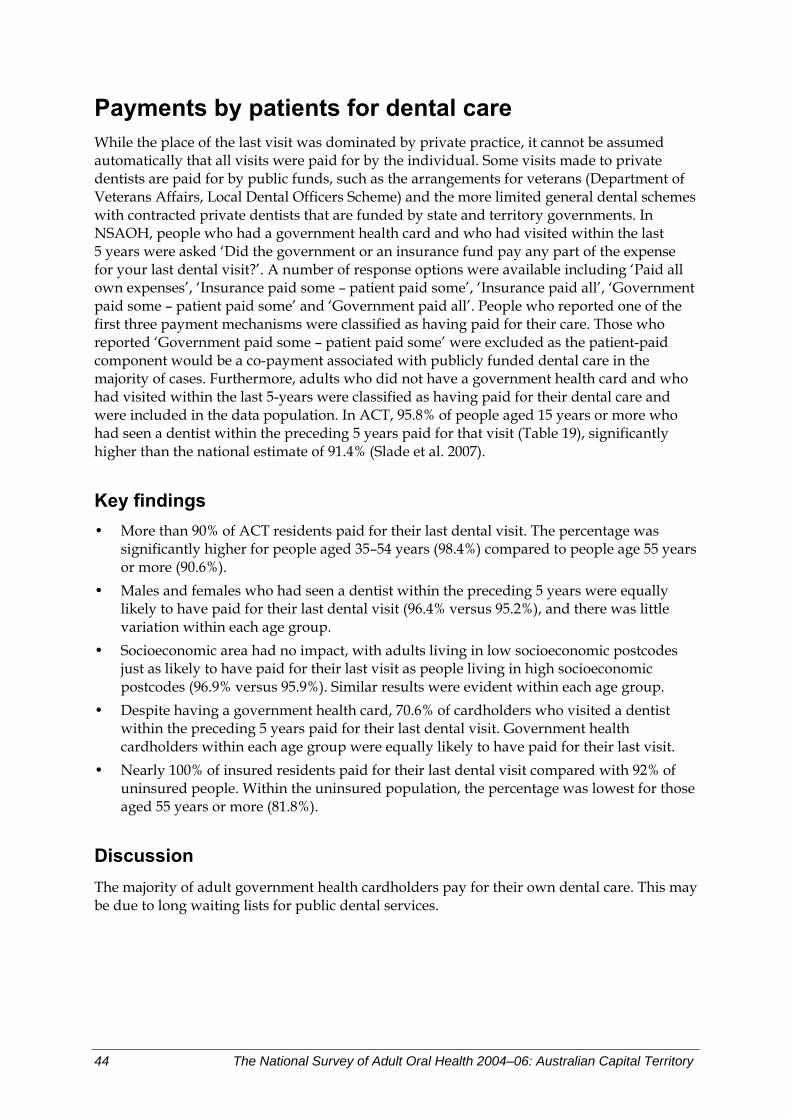
Payments by patients for dental care While the place of the last visit was dominated by private practice, it cannot be assumed automatically that all visits were paid for by the individual. Some visits made to private dentists are paid for by public funds, such as the arrangements for veterans (Department of Veterans Affairs, Local Dental Officers Scheme) and the more limited general dental schemes with contracted private dentists that are funded by state and territory governments. In NSAOH, people who had a government health card and who had visited within the last 5 years were asked ‘Did the government or an insurance fund pay any part of the expense for your last dental visit?’. A number of response options were available including ‘Paid all own expenses’, ‘Insurance paid some – patient paid some’, ‘Insurance paid all’, ‘Government paid some – patient paid some’ and ‘Government paid all’. People who reported one of the first three payment mechanisms were classified as having paid for their care. Those who reported ‘Government paid some – patient paid some’ were excluded as the patient-paid component would be a co-payment associated with publicly funded dental care in the majority of cases. Furthermore, adults who did not have a government health card and who had visited within the last 5-years were classified as having paid for their dental care and were included in the data population. In ACT, 95.8% of people aged 15 years or more who had seen a dentist within the preceding 5 years paid for that visit (Table 19), significantly higher than the national estimate of 91.4% (Slade et al. 2007).
Key findings • More than 90% of ACT residents paid for their last dental visit. The percentage was
significantly higher for people aged 35–54 years (98.4%) compared to people age 55 years or more (90.6%).
• Males and females who had seen a dentist within the preceding 5 years were equally likely to have paid for their last dental visit (96.4% versus 95.2%), and there was little variation within each age group.
• Socioeconomic area had no impact, with adults living in low socioeconomic postcodes just as likely to have paid for their last visit as people living in high socioeconomic postcodes (96.9% versus 95.9%). Similar results were evident within each age group.
• Despite having a government health card, 70.6% of cardholders who visited a dentist within the preceding 5 years paid for their last dental visit. Government health cardholders within each age group were equally likely to have paid for their last visit.
• Nearly 100% of insured residents paid for their last dental visit compared with 92% of uninsured people. Within the uninsured population, the percentage was lowest for those aged 55 years or more (81.8%).
Discussion The majority of adult government health cardholders pay for their own dental care. This may be due to long waiting lists for public dental services.
44 The National Survey of Adult Oral Health 2004–06: Australian Capital Territory
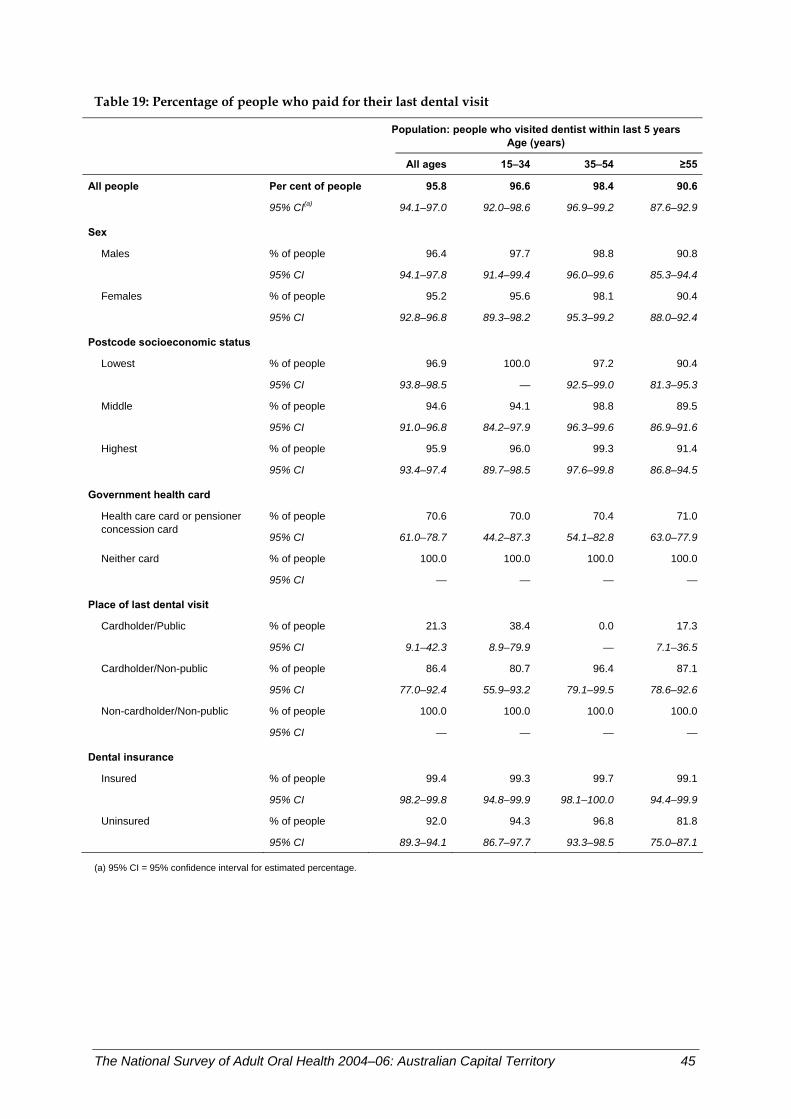
Table 19: Percentage of people who paid for their last dental visit
Population: people who visited dentist within last 5 years
Age (years)
All ages 15–34 35–54 ≥55
All people Per cent of people 95.8 96.6 98.4 90.6
95% CI(a) 94.1–97.0 92.0–98.6 96.9–99.2 87.6–92.9
Sex
Males % of people 96.4 97.7 98.8 90.8
95% CI 94.1–97.8 91.4–99.4 96.0–99.6 85.3–94.4
Females % of people 95.2 95.6 98.1 90.4
95% CI 92.8–96.8 89.3–98.2 95.3–99.2 88.0–92.4
Postcode socioeconomic status
Lowest % of people 96.9 100.0 97.2 90.4
95% CI 93.8–98.5 — 92.5–99.0 81.3–95.3
Middle % of people 94.6 94.1 98.8 89.5
95% CI 91.0–96.8 84.2–97.9 96.3–99.6 86.9–91.6
Highest % of people 95.9 96.0 99.3 91.4
95% CI 93.4–97.4 89.7–98.5 97.6–99.8 86.8–94.5
Government health card
% of people 70.6 70.0 70.4 71.0Health care card or pensioner concession card
95% CI 61.0–78.7 44.2–87.3 54.1–82.8 63.0–77.9
Neither card % of people 100.0 100.0 100.0 100.0
95% CI — — — —
Place of last dental visit Cardholder/Public % of people 21.3 38.4 0.0 17.3
95% CI 9.1–42.3 8.9–79.9 — 7.1–36.5
Cardholder/Non-public % of people 86.4 80.7 96.4 87.1
95% CI 77.0–92.4 55.9–93.2 79.1–99.5 78.6–92.6
Non-cardholder/Non-public % of people 100.0 100.0 100.0 100.0
95% CI — — — —
Dental insurance Insured % of people 99.4 99.3 99.7 99.1
95% CI 98.2–99.8 94.8–99.9 98.1–100.0 94.4–99.9
Uninsured % of people 92.0 94.3 96.8 81.8
95% CI 89.3–94.1 86.7–97.7 93.3–98.5 75.0–87.1
(a) 95% CI = 95% confidence interval for estimated percentage.
The National Survey of Adult Oral Health 2004–06: Australian Capital Territory 45
Government-subsidised dental care in private sector In some states and territories, public-sector dental programs provide care to people eligible for their services by referring them to private practitioner dentists. The cost of such care is then subsidised by the state or territory dental program. In ACT, 1.2% of the adult population received territory-subsidised dental care in the private sector (Table 20). This statistic was not reported nationally. • People aged 55 years or more were more likely than younger people to receive
territory-subsidised dental care in private practice, although the difference was statistically significant only in comparison with 35–54-year-olds.
• Among people with a government health card, 8.4% received territory-subsidised dental care in private practice.
• People living in postcodes that had the lowest socioeconomic status did not receive state-subsidised dental care in private practice.
Discussion Due to the small percentage of people who received territory-subsidised dental care in the private sector and the small numbers of people sampled in the ACT, it is unwise to draw any firm conclusions from these findings.
46 The National Survey of Adult Oral Health 2004–06: Australian Capital Territory
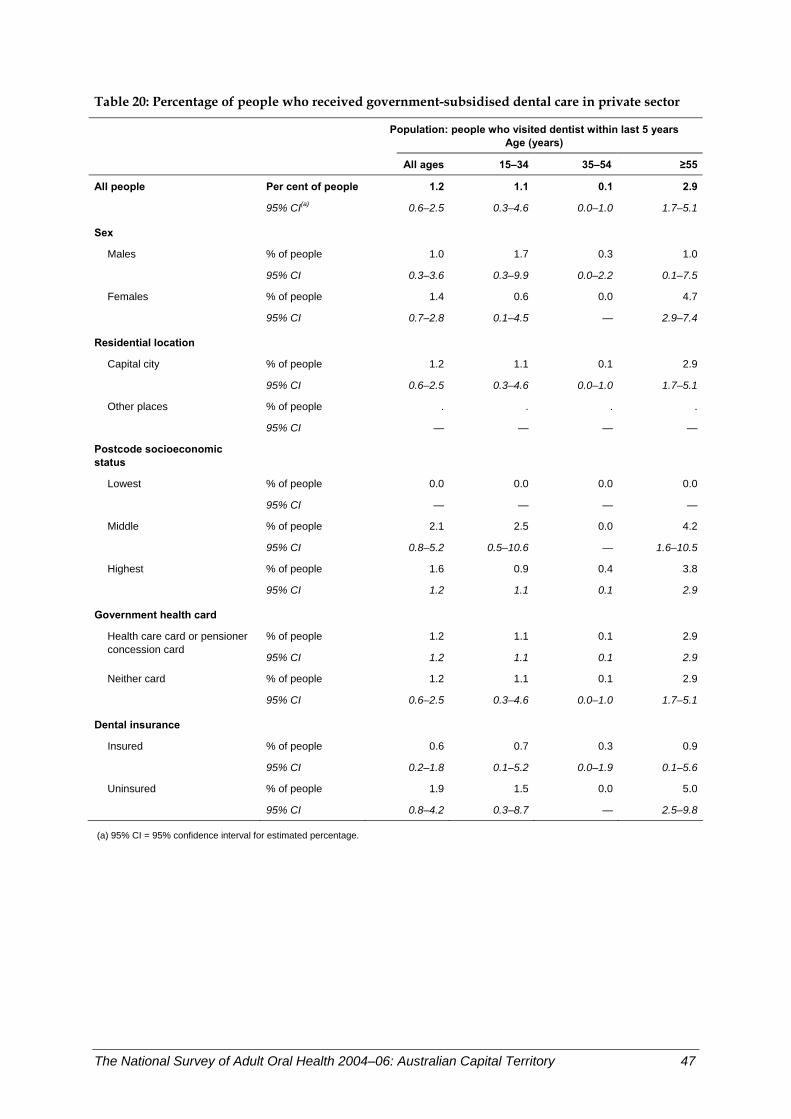
Table 20: Percentage of people who received government-subsidised dental care in private sector
Population: people who visited dentist within last 5 years
Age (years)
All ages 15–34 35–54 ≥55
All people Per cent of people 1.2 1.1 0.1 2.9
95% CI(a) 0.6–2.5 0.3–4.6 0.0–1.0 1.7–5.1
Sex
Males % of people 1.0 1.7 0.3 1.0
95% CI 0.3–3.6 0.3–9.9 0.0–2.2 0.1–7.5
Females % of people 1.4 0.6 0.0 4.7
95% CI 0.7–2.8 0.1–4.5 — 2.9–7.4
Residential location
Capital city % of people 1.2 1.1 0.1 2.9
95% CI 0.6–2.5 0.3–4.6 0.0–1.0 1.7–5.1
Other places % of people . . . .
95% CI — — — —
Postcode socioeconomic status
Lowest % of people 0.0 0.0 0.0 0.0
95% CI — — — —
Middle % of people 2.1 2.5 0.0 4.2
95% CI 0.8–5.2 0.5–10.6 — 1.6–10.5
Highest % of people 1.6 0.9 0.4 3.8
95% CI 1.2 1.1 0.1 2.9
Government health card % of people 1.2 1.1 0.1 2.9Health care card or pensioner
concession card 95% CI 1.2 1.1 0.1 2.9
Neither card % of people 1.2 1.1 0.1 2.9
95% CI 0.6–2.5 0.3–4.6 0.0–1.0 1.7–5.1
Dental insurance Insured % of people 0.6 0.7 0.3 0.9
95% CI 0.2–1.8 0.1–5.2 0.0–1.9 0.1–5.6
Uninsured % of people 1.9 1.5 0.0 5.0
95% CI 0.8–4.2 0.3–8.7 — 2.5–9.8
(a) 95% CI = 95% confidence interval for estimated percentage.
The National Survey of Adult Oral Health 2004–06: Australian Capital Territory 47
People’s usual pattern of dental visits While time since last visiting a dentist provides a snapshot of dental visiting behaviour, people’s usual dental attendance patterns reflect longer term behaviours and intentions. In NSAOH, people who were dentate were asked ‘How often on average do you seek care from a dental professional?’ and four categories of response were offered. In ACT, 60.4% of people aged 15 years or more said that they usually visit a dentist at least once a year (Table 21), which was significantly higher than the national estimate of 53.1% (Slade et al. 2007).
Key findings • Adults aged 15–34 years were least likely to visit a dentist one or more times a year
(53.3%), significantly lower than that reported for adults aged 55 years or more (70.5%). • Females were more likely than males to report they usually visited a dentist at least once
a year (65.9% versus 54.8%). Similar differences were observed within each age group. • Socioeconomic status had some impact, with the percentage being higher for people
living in high socioeconomic postcodes than people living in low socioeconomic postcodes (66.5% versus 54.2%). Within age groups, large differences between high and low socioeconomic areas were observed for adults aged 35–54 years (72.7% versus 54.3%) and 55 years or more (82.7% versus 56.2%). However, this pattern was not evident in young adults.
• Percentages were similar for government health cardholders and non-health cardholders (56.5% versus 61.1%). Within age groups, the largest difference by cardholder status occurred for those aged 55 years or more (62.5% versus 74.3%) although this difference was not significant.
• Among government health cardholders, the percentage was lower for people who visited a public practice at their last dental visit than people who visited a private practice (48.5% versus 59.3%), although this difference was not significant. Within age groups, the largest difference by place of last visit was observed for adults aged 55 years or more (39.8% versus 68.5%). In contrast to older adults, those aged less than 35 years who last visited a public practice were more likely to have made annual dental visits than private attendees (59.0% versus 44.8%).
• Dental insurance was strongly associated with annual dental visiting. Insured people were far more likely to usually visit a dentist one or more times a year than uninsured people (74.2% versus 48.2%). Significant differences between insurance groups were also observed for adults aged 15–34 years (71.7% versus 40.0%) and 35–54 years (75.1% versus 48.3%).
Discussion Six out of 10 ACT residents usually visit the dentist at least once a year. Dental insurance was strongly associated with regular dental visiting, particularly for the two younger age groups. For adults aged 55 years or more, those living in high socioeconomic areas were much more likely to make regular dental visits than those in areas of low socioeconomic status. Government health cardholders aged 55 years or more who last visited a public practice were the least likely to make annual dental visits (39.8%).
48 The National Survey of Adult Oral Health 2004–06: Australian Capital Territory
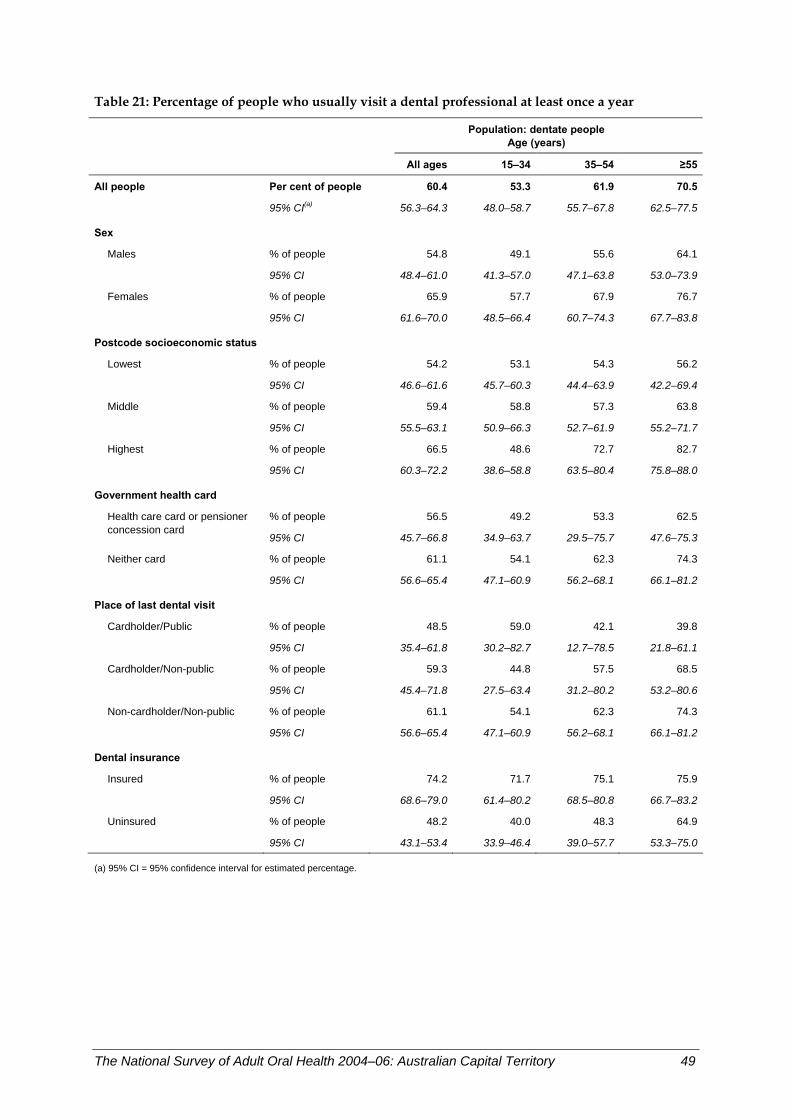
Table 21: Percentage of people who usually visit a dental professional at least once a year
Population: dentate people
Age (years)
All ages 15–34 35–54 ≥55
All people Per cent of people 60.4 53.3 61.9 70.5
95% CI(a) 56.3–64.3 48.0–58.7 55.7–67.8 62.5–77.5
Sex
Males % of people 54.8 49.1 55.6 64.1
95% CI 48.4–61.0 41.3–57.0 47.1–63.8 53.0–73.9
Females % of people 65.9 57.7 67.9 76.7
95% CI 61.6–70.0 48.5–66.4 60.7–74.3 67.7–83.8
Postcode socioeconomic status
Lowest % of people 54.2 53.1 54.3 56.2
95% CI 46.6–61.6 45.7–60.3 44.4–63.9 42.2–69.4
Middle % of people 59.4 58.8 57.3 63.8
95% CI 55.5–63.1 50.9–66.3 52.7–61.9 55.2–71.7
Highest % of people 66.5 48.6 72.7 82.7
95% CI 60.3–72.2 38.6–58.8 63.5–80.4 75.8–88.0
Government health card
% of people 56.5 49.2 53.3 62.5Health care card or pensioner concession card
95% CI 45.7–66.8 34.9–63.7 29.5–75.7 47.6–75.3
Neither card % of people 61.1 54.1 62.3 74.3
95% CI 56.6–65.4 47.1–60.9 56.2–68.1 66.1–81.2
Place of last dental visit Cardholder/Public % of people 48.5 59.0 42.1 39.8
95% CI 35.4–61.8 30.2–82.7 12.7–78.5 21.8–61.1
Cardholder/Non-public % of people 59.3 44.8 57.5 68.5
95% CI 45.4–71.8 27.5–63.4 31.2–80.2 53.2–80.6
Non-cardholder/Non-public % of people 61.1 54.1 62.3 74.3
95% CI 56.6–65.4 47.1–60.9 56.2–68.1 66.1–81.2
Dental insurance Insured % of people 74.2 71.7 75.1 75.9
95% CI 68.6–79.0 61.4–80.2 68.5–80.8 66.7–83.2
Uninsured % of people 48.2 40.0 48.3 64.9
95% CI 43.1–53.4 33.9–46.4 39.0–57.7 53.3–75.0
(a) 95% CI = 95% confidence interval for estimated percentage.
The National Survey of Adult Oral Health 2004–06: Australian Capital Territory 49
Usual attendance at the same dentist In NSAOH, usual source of care was assessed in the interview by asking people ‘Is there a dentist you usually go to for dental care?’. People who answered ‘yes, have a usual source of care’ were classified as having a dentist they usually attend. In ACT, 83.5% of the dentate population aged 15 years or more who visited a dentist within the last 5 years reported having a dentist they usually attend (Table 22), which was significantly higher than the national estimate of 78.6% (Slade et al. 2007).
Key findings • Across age groups the percentage who replied ‘yes’ to having a dentist they usually
attend was lower for those adults aged 15–34 years (80.1%) compared with those aged 35–54 years (83.3%) and 55 years or more (89.3%). However, differences between age groups were not statistically significant.
• For all ages combined and across age groups, there was little variation among groups classified by sex. A lower percentage of females than males reported having a dentist they usually attend, with the exception of those aged 35–54 years. However, observed differences were not statistically significant.
• For all ages combined, people living in postcodes with low socioeconomic status were significantly less likely to report a usual source of care compared with those in postcodes with high socioeconomic status (83.9% versus 86.2%). However, for each age group, there was little variation in the percentage of adults among groups classified by postcode socioeconomic status. Large 95% CIs in some groups resulted in observed differences not being statistically significant.
• For all ages combined and across age groups, there was little variation among groups classified by government health cardholder status. Percentages were lower for people who held cards than for those who did not.
• Within the population of government health cardholders, older people whose last dental visit was to the public sector were significantly less likely to report having a dentist they usually attend than those who attended elsewhere. The largest differences occurred in the 35–54 years (15.9% versus 88.5%) and 55 years or more (51.3% versus 87.2%) age groups. Note that 95% CIs were large in the youngest age group so the observed difference was not statistically significant.
• The percentage was significantly higher among adults with dental insurance than for those without dental insurance (91.1% versus 76.1%). This difference was mainly attributable to those aged 55 years or more (97.6% compared with 80.6%).
Discussion In summary, 83.5% of ACT adults reported that they usually visit the same dentist. This type of visiting was more frequent among the older age groups, those who were not government health cardholders and those who are insured.
Choice of an individual dentist is not possible within most public dental clinics.
50 The National Survey of Adult Oral Health 2004–06: Australian Capital Territory
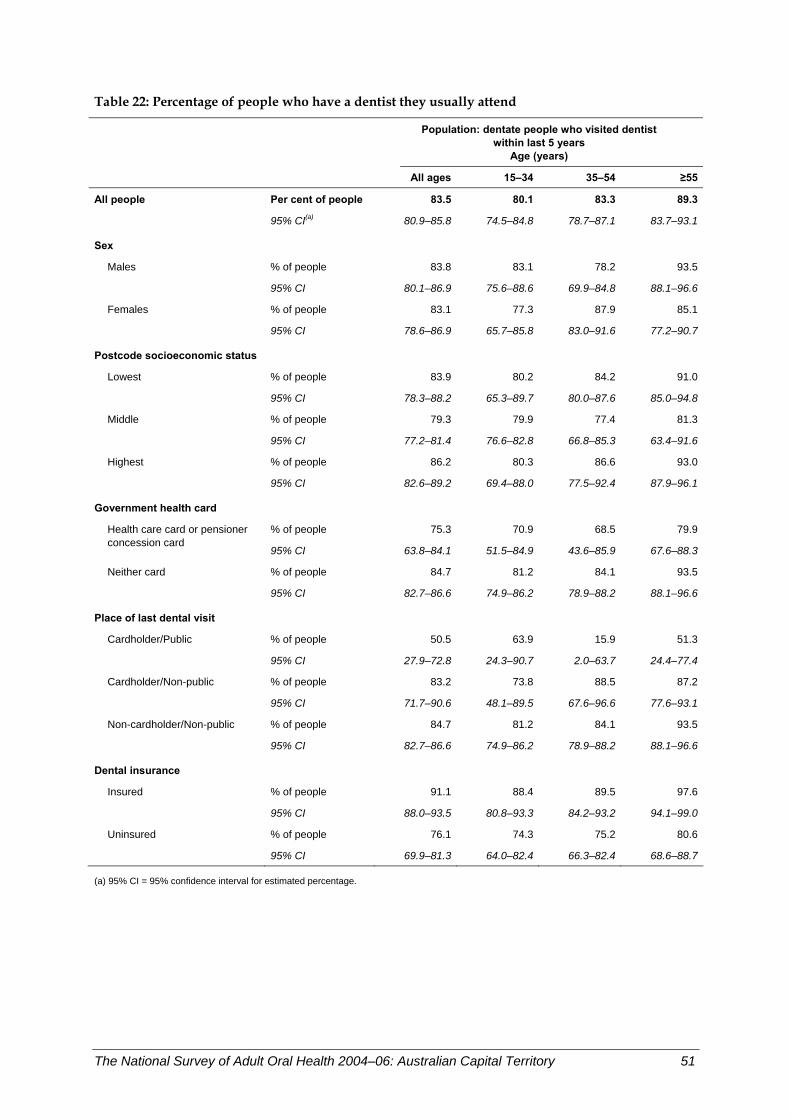
Table 22: Percentage of people who have a dentist they usually attend
Population: dentate people who visited dentist within last 5 years
Age (years)
All ages 15–34 35–54 ≥55
All people Per cent of people 83.5 80.1 83.3 89.3
95% CI(a) 80.9–85.8 74.5–84.8 78.7–87.1 83.7–93.1
Sex
Males % of people 83.8 83.1 78.2 93.5
95% CI 80.1–86.9 75.6–88.6 69.9–84.8 88.1–96.6
Females % of people 83.1 77.3 87.9 85.1
95% CI 78.6–86.9 65.7–85.8 83.0–91.6 77.2–90.7
Postcode socioeconomic status
Lowest % of people 83.9 80.2 84.2 91.0
95% CI 78.3–88.2 65.3–89.7 80.0–87.6 85.0–94.8
Middle % of people 79.3 79.9 77.4 81.3
95% CI 77.2–81.4 76.6–82.8 66.8–85.3 63.4–91.6
Highest % of people 86.2 80.3 86.6 93.0
95% CI 82.6–89.2 69.4–88.0 77.5–92.4 87.9–96.1
Government health card
% of people 75.3 70.9 68.5 79.9Health care card or pensioner concession card
95% CI 63.8–84.1 51.5–84.9 43.6–85.9 67.6–88.3
Neither card % of people 84.7 81.2 84.1 93.5
95% CI 82.7–86.6 74.9–86.2 78.9–88.2 88.1–96.6
Place of last dental visit Cardholder/Public % of people 50.5 63.9 15.9 51.3
95% CI 27.9–72.8 24.3–90.7 2.0–63.7 24.4–77.4
Cardholder/Non-public % of people 83.2 73.8 88.5 87.2
95% CI 71.7–90.6 48.1–89.5 67.6–96.6 77.6–93.1
Non-cardholder/Non-public % of people 84.7 81.2 84.1 93.5
95% CI 82.7–86.6 74.9–86.2 78.9–88.2 88.1–96.6
Dental insurance Insured % of people 91.1 88.4 89.5 97.6
95% CI 88.0–93.5 80.8–93.3 84.2–93.2 94.1–99.0
Uninsured % of people 76.1 74.3 75.2 80.6
95% CI 69.9–81.3 64.0–82.4 66.3–82.4 68.6–88.7
(a) 95% CI = 95% confidence interval for estimated percentage.
The National Survey of Adult Oral Health 2004–06: Australian Capital Territory 51
Usual dental attendance for a check-up In NSAOH, dentate people were asked ‘Is your usual reason for visiting a dental professional for check-ups or when you have a dental problem?’. In ACT, 63.6% of the adult dentate population reported usually visiting a dentist for a check-up (Table 23), which was significantly higher than the national estimate of 56.2% (Slade et al. 2007).
Key findings
• Across age groups there was little variation in the percentage of adults usually visiting a dentist for a check-up, as indicated by a slightly higher percentage in the youngest (15–34 years) age group (65.5%) compared with those aged 35–54 years (63.2%) and 55 years or more (60.8%). However, differences between age groups were not statistically significant.
• For all ages combined and across age groups, there was little variation among groups classified by sex. A higher percentage of females than males reported having a dentist they usually attend, with the exception of those aged 15–34 years. However, observed differences were not statistically significant.
• People living in postcodes with low and middle socioeconomic status tended to be less likely to report usually visiting for a check-up than those in postcodes with high socioeconomic status, although the majority of the observed differences within age groups were not statistically significant. For people aged 55 years or more, those living in postcodes with middle socioeconomic status were significantly less likely to report usually visiting for a check-up than those with high socioeconomic status (55.4% versus 70.5%).
• The percentage was significantly lower for adults who had a government health card than for those who did not (48.1% versus 66.2%). This pattern was consistent across all age groups.
• Within the population of government health cardholders, people aged 55 years or more whose last dental visit was to the public sector were less likely to report usually visiting a dentist for a check-up than those who attended elsewhere (22.7% versus 63.2%). Note that 95% CIs were large in the younger age groups so the differences observed were not statistically significant.
• The percentage was significantly higher among adults with dental insurance than for those without dental insurance (74.8% versus 53.0%). This pattern was consistent across all age groups.
Discussion In summary, almost two-thirds of the adult population usually visit the dentist for a check-up, with this percentage being slightly higher for adults aged 15–34 years. Usually visiting for a check-up was significantly associated with not having a government health card and having dental insurance.
52 The National Survey of Adult Oral Health 2004–06: Australian Capital Territory

Table 23: Percentage of people who usually visit a dentist for a check-up
Population: dentate people
Age (years)
All ages 15–34 35–54 ≥55
All people Per cent of people 63.6 65.5 63.2 60.8
95% CI(a) 59.5–67.5 58.9–71.6 58.0–68.1 53.0–68.0
Sex
Males % of people 62.1 67.1 59.8 56.6
95% CI 56.7–67.3 56.7–76.1 50.7–68.3 47.7–65.2
Females % of people 65.0 63.8 66.5 64.7
95% CI 60.2–69.5 56.0–71.1 58.5–73.6 51.6–76.0
Postcode socioeconomic status
Lowest % of people 58.5 63.4 57.6 49.4
95% CI 52.6–64.1 55.0–71.1 50.3–64.7 35.5–63.4
Middle % of people 63.9 66.7 65.4 55.4
95% CI 57.7–69.6 51.6–79.1 58.3–71.9 51.0–59.7
Highest % of people 67.7 66.4 67.0 70.5
95% CI 61.2–73.6 55.8–75.6 57.3–75.5 60.2–79.0
Government health card
% of people 48.1 42.4 36.9 54.8Health care card or pensioner concession card
95% CI 40.1–56.3 26.0–60.6 18.8–59.5 44.8–64.5
Neither card % of people 66.2 68.7 64.7 63.6
95% CI 61.4–70.6 61.4–75.2 59.8–69.3 54.0–72.3
Place of last dental visit Cardholder/Public % of people 32.3 49.1 18.9 22.7
95% CI 20.4–47.1 19.2–79.7 3.5–60.0 9.9–44.1
Cardholder/Non-public % of people 53.1 39.7 43.3 63.2
95% CI 41.9–64.0 20.6–62.6 21.1–68.7 51.3–73.7
Non-cardholder/Non-public % of people 66.2 68.7 64.7 63.6
95% CI 61.4–70.6 61.4–75.2 59.8–69.3 54.0–72.3
Dental insurance Insured % of people 74.8 76.2 75.7 71.1
95% CI 69.9–79.1 64.9–84.8 68.6–81.6 62.5–78.4
Uninsured % of people 53.0 57.1 48.9 50.8
95% CI 46.8–59.0 48.0–65.8 40.7–57.2 41.6–59.9
(a) 95% CI = 95% confidence interval for estimated percentage.
The National Survey of Adult Oral Health 2004–06: Australian Capital Territory 53
Dental care avoided or delayed due to cost In NSAOH, cost as a barrier to receipt of dental care was assessed with the question ‘During the last 12 months, have you avoided or delayed visiting a dental professional because of the cost?’. People who answered ‘yes’ were classified as having delayed or avoided dental care due to cost. In ACT, they represented 28.7% of the population aged 15 years or more (Table 24), but this estimate was not significantly different from the national estimate of 30.0% (Slade et al. 2007).
Key findings • There was some variation in the percentage reporting cost as a barrier to receipt of dental
care, with statistically significant differences observed between the youngest and oldest age groups, as indicated by 34.9% of adults aged 15–34 years compared with 19.2% of those aged 55 years or more.
• For all ages combined, a significantly greater percentage of females reported that they had avoided or delayed care due to cost compared with males (34.7% versus 22.3%). This difference was mainly attributable to those aged 15–34 years (44.1% compared with 26.0%).
• For all ages combined, people living in postcodes with low socioeconomic status were significantly more likely to report having avoided or delayed care due to cost than those in postcodes with middle (34.8% versus 25.1%) and high (34.8% versus 26.1%) socioeconomic status. Among people aged 55 years or more, those with high socioeconomic status were significantly less likely to do so than those with low (12.0% versus 27.4%) and middle (12.0% versus 22.9%) socioeconomic status.
• The percentage was significantly higher for adults who had a government health card than for those who did not (39.6% versus 26.7%). This pattern was consistent across all age groups, with statistically significant differences between cardholders and non-cardholders observed in the 35–54 years age group (51.8% versus 26.8%).
• For all ages combined and across all age groups, within the population who had a government health card, no statistically significant differences were observed among groups classified by place of last visit. Note that 95% CIs were large in some groups so the differences observed were not statistically significant.
• The percentage was significantly higher among uninsured adults than insured adults (38.7% versus 18.0%). Statistically significant differences were observed in the 15–34 years (45.0% versus 22.2%) and 35–54 years (38.4% versus 19.5%) age groups.
Discussion Adults aged 55 years or more were less likely to report that they had avoided or delayed dental care due to cost compared with their younger counterparts. Dental insurance was strongly associated, and sex and government health cardholder status moderately associated, with having avoided or delayed receipt of dental care due to cost.
54 The National Survey of Adult Oral Health 2004–06: Australian Capital Territory
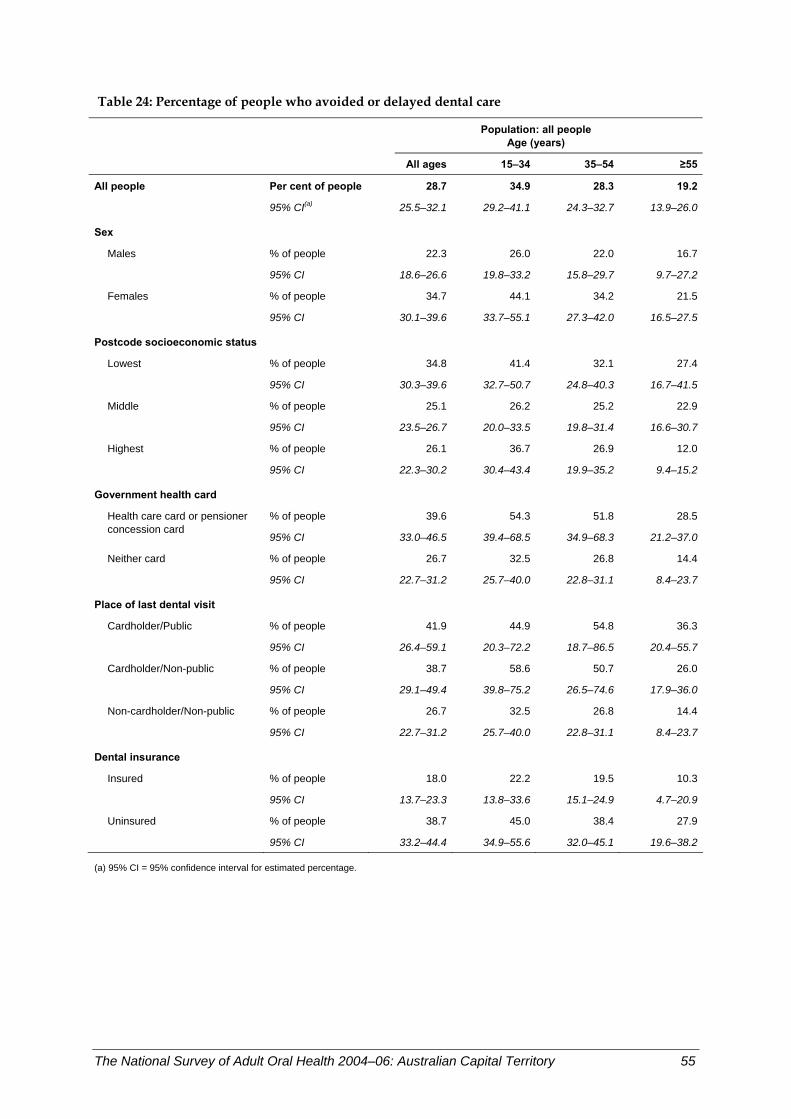
Table 24: Percentage of people who avoided or delayed dental care
Population: all people
Age (years)
All ages 15–34 35–54 ≥55
All people Per cent of people 28.7 34.9 28.3 19.2
95% CI(a) 25.5–32.1 29.2–41.1 24.3–32.7 13.9–26.0
Sex
Males % of people 22.3 26.0 22.0 16.7
95% CI 18.6–26.6 19.8–33.2 15.8–29.7 9.7–27.2
Females % of people 34.7 44.1 34.2 21.5
95% CI 30.1–39.6 33.7–55.1 27.3–42.0 16.5–27.5
Postcode socioeconomic status
Lowest % of people 34.8 41.4 32.1 27.4
95% CI 30.3–39.6 32.7–50.7 24.8–40.3 16.7–41.5
Middle % of people 25.1 26.2 25.2 22.9
95% CI 23.5–26.7 20.0–33.5 19.8–31.4 16.6–30.7
Highest % of people 26.1 36.7 26.9 12.0
95% CI 22.3–30.2 30.4–43.4 19.9–35.2 9.4–15.2
Government health card
% of people 39.6 54.3 51.8 28.5Health care card or pensioner concession card
95% CI 33.0–46.5 39.4–68.5 34.9–68.3 21.2–37.0
Neither card % of people 26.7 32.5 26.8 14.4
95% CI 22.7–31.2 25.7–40.0 22.8–31.1 8.4–23.7
Place of last dental visit Cardholder/Public % of people 41.9 44.9 54.8 36.3
95% CI 26.4–59.1 20.3–72.2 18.7–86.5 20.4–55.7
Cardholder/Non-public % of people 38.7 58.6 50.7 26.0
95% CI 29.1–49.4 39.8–75.2 26.5–74.6 17.9–36.0
Non-cardholder/Non-public % of people 26.7 32.5 26.8 14.4
95% CI 22.7–31.2 25.7–40.0 22.8–31.1 8.4–23.7
Dental insurance Insured % of people 18.0 22.2 19.5 10.3
95% CI 13.7–23.3 13.8–33.6 15.1–24.9 4.7–20.9
Uninsured % of people 38.7 45.0 38.4 27.9
95% CI 33.2–44.4 34.9–55.6 32.0–45.1 19.6–38.2
(a) 95% CI = 95% confidence interval for estimated percentage.
The National Survey of Adult Oral Health 2004–06: Australian Capital Territory 55
Recommended dental treatment foregone due to cost In NSAOH, treatment foregone due to cost was assessed with the question ‘Has the cost prevented you from having any dental treatment that was recommended during the last 2 years?’. People who answered ‘yes’ were classified as having foregone dental treatment due to cost. In ACT, they represented 22.7% of the population aged 15 years or more (Table 25), which was higher, but not significantly, than the national estimate of 20.6% (Slade et al. 2007).
Key findings • Across age groups there was little variation in the percentage of adults reporting that
they had forgone recommended treatment due to cost, as indicated by a lower percentage of adults aged 55 years or more (16.8%) compared with those aged 15–34 years (23.6%) and 35–54 years (25.7%). However, differences between age groups were not statistically significant.
• For all ages combined and across all age groups, there was little variation in the percentage among groups classified by sex.
• For all ages combined, people living in postcodes with low socioeconomic status were significantly more likely to report forgoing recommended dental treatment due to cost than those with middle socioeconomic status (29.3% versus 19.3%). Among people aged 55 years or more, those with low socioeconomic status were significantly more likely to do so than those with high socioeconomic status (25.5% versus 9.9%).
• For all ages combined and across all age groups, there was little variation in the percentage among groups classified by government health cardholder status. Those who held cards were more likely to report forgoing recommended dental treatment than those who did not. However, since the 95% CIs were large in these groups, the differences were not statistically significant.
• For all ages combined, people with no dental insurance were significantly more likely than the insured to report that they had foregone recommended dental treatment due to cost. However, there were no statistically significant age-specific differences observed.
Discussion In summary, having foregone recommended dental treatment due to cost was somewhat associated with postcode socioeconomic status and dental insurance. Note that 95% CIs were large in some strata, with the consequence that observed differences were statistically significant.
56 The National Survey of Adult Oral Health 2004–06: Australian Capital Territory
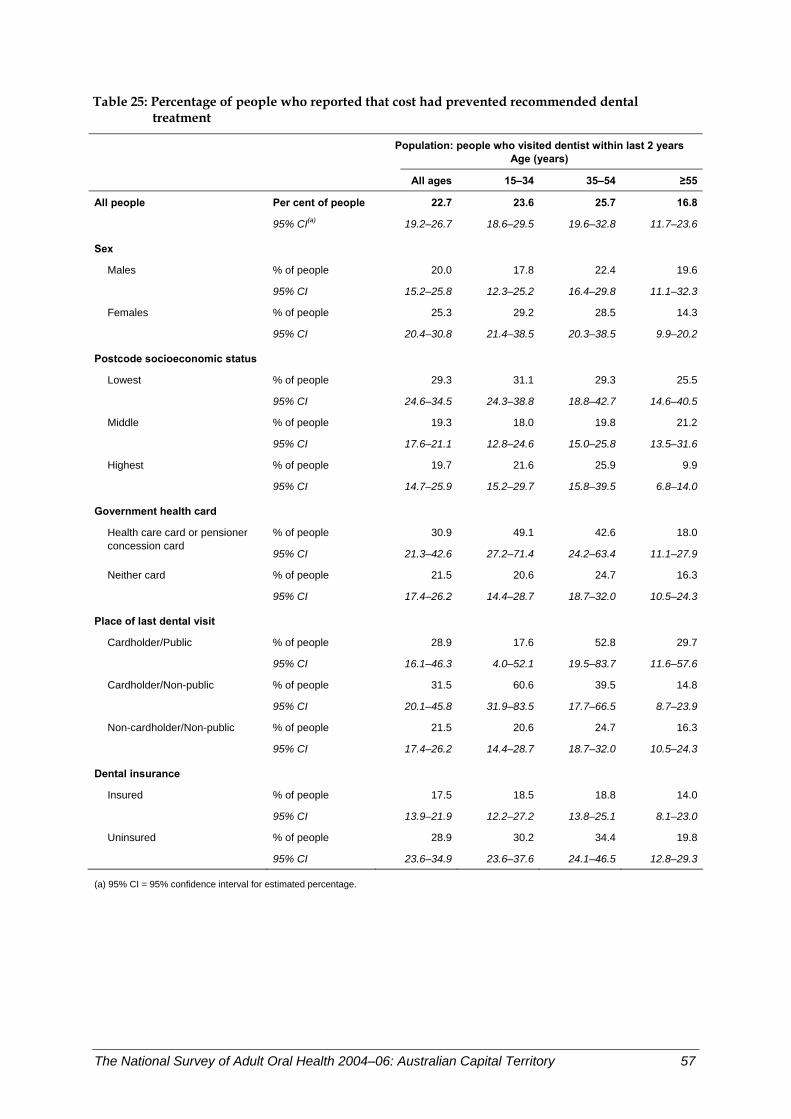
Table 25: Percentage of people who reported that cost had prevented recommended dental treatment
Population: people who visited dentist within last 2 years
Age (years)
All ages 15–34 35–54 ≥55
All people Per cent of people 22.7 23.6 25.7 16.8
95% CI(a) 19.2–26.7 18.6–29.5 19.6–32.8 11.7–23.6
Sex
Males % of people 20.0 17.8 22.4 19.6
95% CI 15.2–25.8 12.3–25.2 16.4–29.8 11.1–32.3
Females % of people 25.3 29.2 28.5 14.3
95% CI 20.4–30.8 21.4–38.5 20.3–38.5 9.9–20.2
Postcode socioeconomic status
Lowest % of people 29.3 31.1 29.3 25.5
95% CI 24.6–34.5 24.3–38.8 18.8–42.7 14.6–40.5
Middle % of people 19.3 18.0 19.8 21.2
95% CI 17.6–21.1 12.8–24.6 15.0–25.8 13.5–31.6
Highest % of people 19.7 21.6 25.9 9.9
95% CI 14.7–25.9 15.2–29.7 15.8–39.5 6.8–14.0
Government health card
% of people 30.9 49.1 42.6 18.0Health care card or pensioner concession card
95% CI 21.3–42.6 27.2–71.4 24.2–63.4 11.1–27.9
Neither card % of people 21.5 20.6 24.7 16.3
95% CI 17.4–26.2 14.4–28.7 18.7–32.0 10.5–24.3
Place of last dental visit Cardholder/Public % of people 28.9 17.6 52.8 29.7
95% CI 16.1–46.3 4.0–52.1 19.5–83.7 11.6–57.6
Cardholder/Non-public % of people 31.5 60.6 39.5 14.8
95% CI 20.1–45.8 31.9–83.5 17.7–66.5 8.7–23.9
Non-cardholder/Non-public % of people 21.5 20.6 24.7 16.3
95% CI 17.4–26.2 14.4–28.7 18.7–32.0 10.5–24.3
Dental insurance Insured % of people 17.5 18.5 18.8 14.0
95% CI 13.9–21.9 12.2–27.2 13.8–25.1 8.1–23.0
Uninsured % of people 28.9 30.2 34.4 19.8
95% CI 23.6–34.9 23.6–37.6 24.1–46.5 12.8–29.3
(a) 95% CI = 95% confidence interval for estimated percentage.
The National Survey of Adult Oral Health 2004–06: Australian Capital Territory 57
Difficulty paying a $100 dental bill In NSAOH, difficulty paying for dental care was assessed with the question ‘At most times of the year, how much difficulty would you have paying a $100 dental bill? Would you say none, hardly any, a little, a lot of difficulty, don’t know?’. People who answered ‘a lot’ were classified as having difficulty paying a $100 dental bill. They represented 14.8% of the population in ACT aged 15 years or more (Table 26), which was lower, but not significantly, than the national estimate of 18.2% (Slade et al. 2007).
Key findings • Across age groups there was little variation in the percentage of adults reporting that
they would have difficulty paying a $100 dental bill, as indicated by a slightly higher percentage of adults aged 15–34 years (16.9%) compared with those aged 35–54 years (12.5%) and 55 years or more (14.6%). However, differences between age groups were not statistically significant.
• For all ages combined and across all age groups, there was little variation among groups classified by sex. Females were more likely than males to report difficulty paying a $100 dental bill.
• People living in postcodes with low socioeconomic status were significantly more likely to have difficulty than those with middle socioeconomic status (17.9% versus 9.5%). Statistically significant differences were observed in the 35–54 years (16.5% versus 4.7%) and 55 years or more (23.9% versus 9.9%) age groups.
• Among people aged 55 years or more, those with low socioeconomic status were significantly more likely to report that they would have difficulty paying a $100 dental bill than those with high socioeconomic status (23.9% versus 11.6%).
• There was almost a three-fold difference between people who held a government health card (32.1%) and those who did not (11.5%). The relative difference was greatest in those aged 55 years or more (29.2% versus 6.6%) and smallest in the 15–34 years age group (34.8% versus 14.2%).
• Within the population of government health cardholders, the percentage was higher among people whose last dental visit was to the public sector than those who attended elsewhere. However, due to large 95% CIs in these groups, there were no statistically significant differences observed.
• For all ages combined, adults with no dental insurance were 2.4 times more likely to report that they would have difficulty paying a $100 dental bill than those with dental insurance (20.3% versus 8.5%). Among people aged 55 years or more, those with no dental insurance were 4.1 times more likely to do so than the insured.
Discussion In summary, government health cardholder status was strongly associated with having a lot of difficulty paying a $100 dental bill. There was a moderate association with postcode socioeconomic status and dental insurance.
58 The National Survey of Adult Oral Health 2004–06: Australian Capital Territory
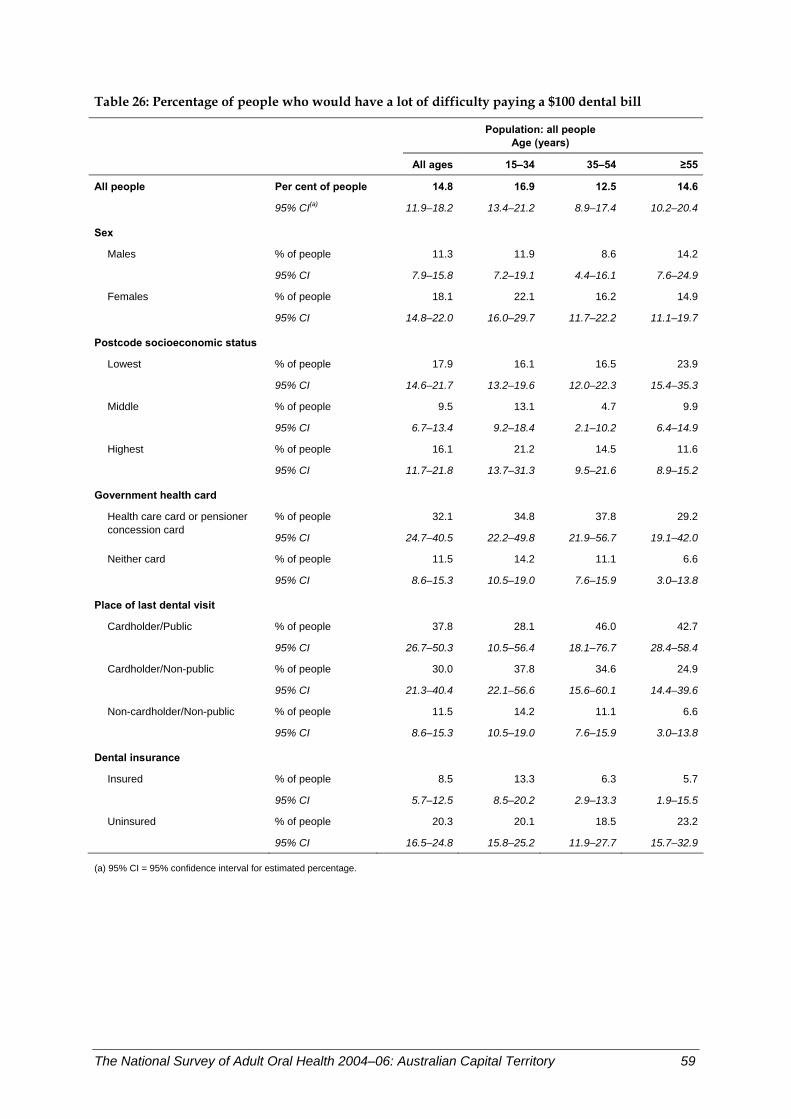
Table 26: Percentage of people who would have a lot of difficulty paying a $100 dental bill
Population: all people
Age (years)
All ages 15–34 35–54 ≥55
All people Per cent of people 14.8 16.9 12.5 14.6
95% CI(a) 11.9–18.2 13.4–21.2 8.9–17.4 10.2–20.4
Sex
Males % of people 11.3 11.9 8.6 14.2
95% CI 7.9–15.8 7.2–19.1 4.4–16.1 7.6–24.9
Females % of people 18.1 22.1 16.2 14.9
95% CI 14.8–22.0 16.0–29.7 11.7–22.2 11.1–19.7
Postcode socioeconomic status
Lowest % of people 17.9 16.1 16.5 23.9
95% CI 14.6–21.7 13.2–19.6 12.0–22.3 15.4–35.3
Middle % of people 9.5 13.1 4.7 9.9
95% CI 6.7–13.4 9.2–18.4 2.1–10.2 6.4–14.9
Highest % of people 16.1 21.2 14.5 11.6
95% CI 11.7–21.8 13.7–31.3 9.5–21.6 8.9–15.2
Government health card
% of people 32.1 34.8 37.8 29.2Health care card or pensioner concession card
95% CI 24.7–40.5 22.2–49.8 21.9–56.7 19.1–42.0
Neither card % of people 11.5 14.2 11.1 6.6
95% CI 8.6–15.3 10.5–19.0 7.6–15.9 3.0–13.8
Place of last dental visit Cardholder/Public % of people 37.8 28.1 46.0 42.7
95% CI 26.7–50.3 10.5–56.4 18.1–76.7 28.4–58.4
Cardholder/Non-public % of people 30.0 37.8 34.6 24.9
95% CI 21.3–40.4 22.1–56.6 15.6–60.1 14.4–39.6
Non-cardholder/Non-public % of people 11.5 14.2 11.1 6.6
95% CI 8.6–15.3 10.5–19.0 7.6–15.9 3.0–13.8
Dental insurance Insured % of people 8.5 13.3 6.3 5.7
95% CI 5.7–12.5 8.5–20.2 2.9–13.3 1.9–15.5
Uninsured % of people 20.3 20.1 18.5 23.2
95% CI 16.5–24.8 15.8–25.2 11.9–27.7 15.7–32.9
(a) 95% CI = 95% confidence interval for estimated percentage.
The National Survey of Adult Oral Health 2004–06: Australian Capital Territory 59
Percentage of people avoiding foods due to dental problems Avoiding food due to dental problems is a sign of poor oral health and may reflect an inability to eat properly. This reduces enjoyment of food and could affect the ability to maintain a healthy nutritional status.
In NSAOH, avoiding food was assessed in the interview by asking people ‘How often have you had to avoid eating some foods because of problems with your teeth, mouth or dentures during the last 12 months? Was it: very often, often, sometimes, hardly ever, never during the last 12 months, don’t know?’. People who answered ‘very often’, ‘often’ or ‘sometimes’ were classified as having avoided certain foods. They represented 16.1% of the ACT population aged 15 years or more (Table 27), which was slightly lower than the national estimate of 17.4% (Slade et al. 2007).
Key findings • The percentage of people avoiding food due to dental problems was over twice as high
for those who had a government health card (29.8%) than in those who did not (13.5%). • Those who were government health cardholders and who last visited a public dental
clinic were three times as likely (45.2%) than non-government health cardholders (13.5%) to avoid foods.
• People with no dental insurance were more likely (20.3%) than those with insurance (11.5%) to avoid foods because of problems with their teeth, mouth or gums.
Discussion Residents of ACT are less likely than the rest of the Australian population to avoid some foods because of problems with their teeth, mouth or gums. Avoiding some foods because of dental problems was associated with having a government health card, having last visited a public clinic and not having dental insurance. While there were large differences in the point estimates for some other comparisons, small numbers in the sample have resulted in wide confidence intervals and no conclusions about differences can be drawn.
60 The National Survey of Adult Oral Health 2004–06: Australian Capital Territory
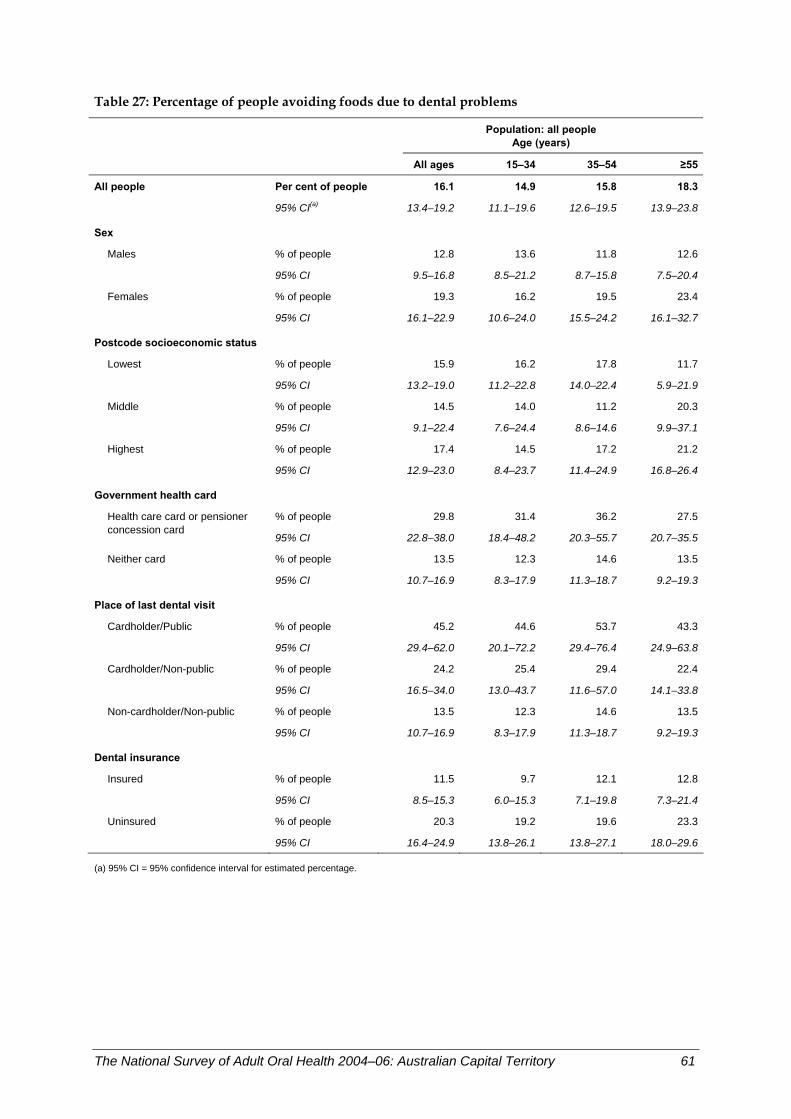
Table 27: Percentage of people avoiding foods due to dental problems
Population: all people
Age (years)
All ages 15–34 35–54 ≥55
All people Per cent of people 16.1 14.9 15.8 18.3
95% CI(a) 13.4–19.2 11.1–19.6 12.6–19.5 13.9–23.8
Sex
Males % of people 12.8 13.6 11.8 12.6
95% CI 9.5–16.8 8.5–21.2 8.7–15.8 7.5–20.4
Females % of people 19.3 16.2 19.5 23.4
95% CI 16.1–22.9 10.6–24.0 15.5–24.2 16.1–32.7
Postcode socioeconomic status
Lowest % of people 15.9 16.2 17.8 11.7
95% CI 13.2–19.0 11.2–22.8 14.0–22.4 5.9–21.9
Middle % of people 14.5 14.0 11.2 20.3
95% CI 9.1–22.4 7.6–24.4 8.6–14.6 9.9–37.1
Highest % of people 17.4 14.5 17.2 21.2
95% CI 12.9–23.0 8.4–23.7 11.4–24.9 16.8–26.4
Government health card
% of people 29.8 31.4 36.2 27.5Health care card or pensioner concession card
95% CI 22.8–38.0 18.4–48.2 20.3–55.7 20.7–35.5
Neither card % of people 13.5 12.3 14.6 13.5
95% CI 10.7–16.9 8.3–17.9 11.3–18.7 9.2–19.3
Place of last dental visit Cardholder/Public % of people 45.2 44.6 53.7 43.3
95% CI 29.4–62.0 20.1–72.2 29.4–76.4 24.9–63.8
Cardholder/Non-public % of people 24.2 25.4 29.4 22.4
95% CI 16.5–34.0 13.0–43.7 11.6–57.0 14.1–33.8
Non-cardholder/Non-public % of people 13.5 12.3 14.6 13.5
95% CI 10.7–16.9 8.3–17.9 11.3–18.7 9.2–19.3
Dental insurance Insured % of people 11.5 9.7 12.1 12.8
95% CI 8.5–15.3 6.0–15.3 7.1–19.8 7.3–21.4
Uninsured % of people 20.3 19.2 19.6 23.3
95% CI 16.4–24.9 13.8–26.1 13.8–27.1 18.0–29.6
(a) 95% CI = 95% confidence interval for estimated percentage.
The National Survey of Adult Oral Health 2004–06: Australian Capital Territory 61
5 Oral health perceptions
Percentage of people rating their oral health as fair or poor Self-reported global measures of oral health reflect an individual’s own experience of their oral health. Single-item, self-rated oral health measures are associated with functional impairment and discomfort as well as clinical measures of dental health. They are used widely in research and provide a summary measure of oral symptoms and functioning (Benyamini et al. 2004).
In NSAOH, self-rated oral health was assessed in the interview by asking people ‘And how would you rate your own DENTAL health. Would you say that it is: excellent, very good, good, fair, poor, don’t know?’. People who answered ‘fair’ or ‘poor’ were classified as having fair or poor self-rated oral health. They represented 17.1% of the ACT population aged 15 years or more (Table 28), which is slightly higher than the national estimate of 16.4% (Slade et al. 2007).
Key finding • Within the population of government health cardholders, those who last visited a public
dental clinic were more than twice as likely (41.1%) to report fair or poor oral health compared with those who visited a private dentist (17.9%).
Discussion Dentate residents of ACT were equally as likely as other Australians to report that their oral health was ‘fair’ or ‘poor’. Reporting fair or poor oral health was associated with having last visited a public dental service. While there were large differences in the point estimates for some other comparisons, small numbers in the sample have resulted in wide confidence intervals and no conclusions about differences can be drawn.
62 The National Survey of Adult Oral Health 2004–06: Australian Capital Territory
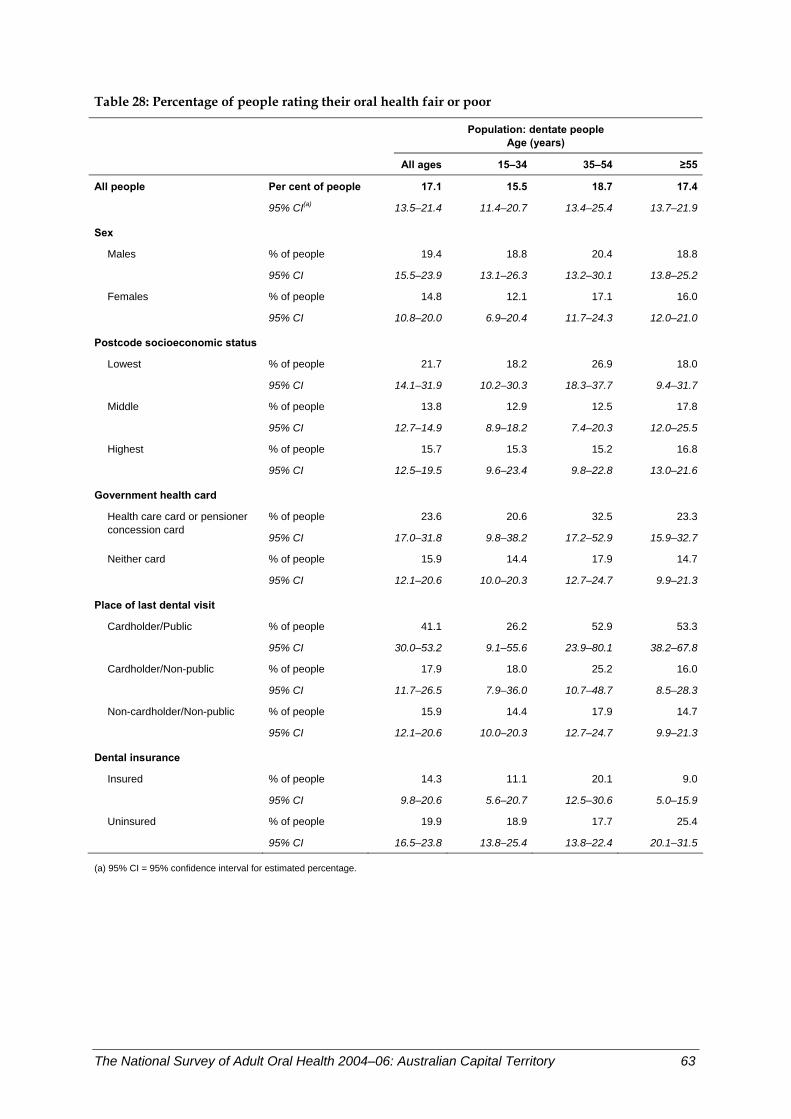
Table 28: Percentage of people rating their oral health fair or poor
Population: dentate people
Age (years)
All ages 15–34 35–54 ≥55
All people Per cent of people 17.1 15.5 18.7 17.4
95% CI(a) 13.5–21.4 11.4–20.7 13.4–25.4 13.7–21.9
Sex
Males % of people 19.4 18.8 20.4 18.8
95% CI 15.5–23.9 13.1–26.3 13.2–30.1 13.8–25.2
Females % of people 14.8 12.1 17.1 16.0
95% CI 10.8–20.0 6.9–20.4 11.7–24.3 12.0–21.0
Postcode socioeconomic status
Lowest % of people 21.7 18.2 26.9 18.0
95% CI 14.1–31.9 10.2–30.3 18.3–37.7 9.4–31.7
Middle % of people 13.8 12.9 12.5 17.8
95% CI 12.7–14.9 8.9–18.2 7.4–20.3 12.0–25.5
Highest % of people 15.7 15.3 15.2 16.8
95% CI 12.5–19.5 9.6–23.4 9.8–22.8 13.0–21.6
Government health card
% of people 23.6 20.6 32.5 23.3Health care card or pensioner concession card
95% CI 17.0–31.8 9.8–38.2 17.2–52.9 15.9–32.7
Neither card % of people 15.9 14.4 17.9 14.7
95% CI 12.1–20.6 10.0–20.3 12.7–24.7 9.9–21.3
Place of last dental visit Cardholder/Public % of people 41.1 26.2 52.9 53.3
95% CI 30.0–53.2 9.1–55.6 23.9–80.1 38.2–67.8
Cardholder/Non-public % of people 17.9 18.0 25.2 16.0
95% CI 11.7–26.5 7.9–36.0 10.7–48.7 8.5–28.3
Non-cardholder/Non-public % of people 15.9 14.4 17.9 14.7
95% CI 12.1–20.6 10.0–20.3 12.7–24.7 9.9–21.3
Dental insurance Insured % of people 14.3 11.1 20.1 9.0
95% CI 9.8–20.6 5.6–20.7 12.5–30.6 5.0–15.9
Uninsured % of people 19.9 18.9 17.7 25.4
95% CI 16.5–23.8 13.8–25.4 13.8–22.4 20.1–31.5
(a) 95% CI = 95% confidence interval for estimated percentage.
The National Survey of Adult Oral Health 2004–06: Australian Capital Territory 63
Percentage of people experiencing toothache Toothache is caused when the nerve root of a tooth is irritated. It is most commonly caused by infection, decay, injury or loss of a tooth. However, pain sometimes originates from other areas, most commonly the jaw joint and the ear, and radiates to the jaw, thus appearing to be tooth pain.
In NSAOH, experience of toothache was assessed in the interview by asking dentate people ‘During the last 12 months, how often have you had toothache? Was it: very often, often, sometimes, hardly ever, never during the last 12 months, don’t know?’. People who answered ‘very often’, ‘often’ or ‘sometimes’ were classified as having experienced toothache. They represented 15.9% of the dentate ACT population aged 15 years or more (Table 29), which was slightly higher than the national estimate of 15.1% (Slade et al. 2007).
Key findings • The experience of toothache decreased with age, from 21.7% in 15–34 year olds to
10.3% in those aged 55 years or more. • Experience of toothache was higher in government health cardholders (24.1%) than
non-government health cardholders (14.2%). • Within the population of government health cardholders, those who last visited a public
dental clinic were three times as likely (53.5%) than those who visited a private dentist (14.2%) to report experience of toothache. The latter group had the same experience as non-government health cardholders.
• People without private dental insurance (19.3%) were more likely than those without insurance (12.0%) to experience toothache.
Discussion Residents of ACT were slightly more likely than the rest of the Australian population to experience toothache. Experience of toothache was associated with being young, having a government health card, having last visited a public dental clinic and not having dental insurance. While there were large differences in the point estimates for some other comparisons, small numbers in the sample have resulted in wide confidence intervals and no conclusions about differences can be drawn.
64 The National Survey of Adult Oral Health 2004–06: Australian Capital Territory
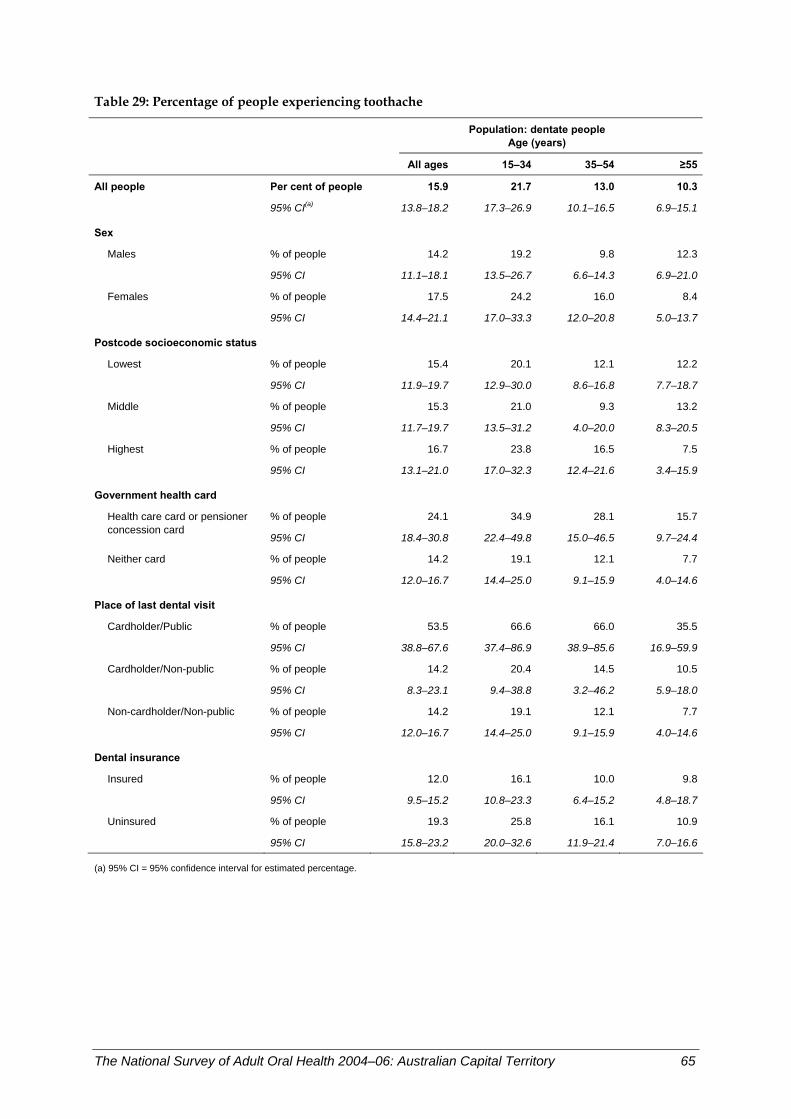
Table 29: Percentage of people experiencing toothache
Population: dentate people
Age (years)
All ages 15–34 35–54 ≥55
All people Per cent of people 15.9 21.7 13.0 10.3
95% CI(a) 13.8–18.2 17.3–26.9 10.1–16.5 6.9–15.1
Sex
Males % of people 14.2 19.2 9.8 12.3
95% CI 11.1–18.1 13.5–26.7 6.6–14.3 6.9–21.0
Females % of people 17.5 24.2 16.0 8.4
95% CI 14.4–21.1 17.0–33.3 12.0–20.8 5.0–13.7
Postcode socioeconomic status
Lowest % of people 15.4 20.1 12.1 12.2
95% CI 11.9–19.7 12.9–30.0 8.6–16.8 7.7–18.7
Middle % of people 15.3 21.0 9.3 13.2
95% CI 11.7–19.7 13.5–31.2 4.0–20.0 8.3–20.5
Highest % of people 16.7 23.8 16.5 7.5
95% CI 13.1–21.0 17.0–32.3 12.4–21.6 3.4–15.9
Government health card
% of people 24.1 34.9 28.1 15.7Health care card or pensioner concession card
95% CI 18.4–30.8 22.4–49.8 15.0–46.5 9.7–24.4
Neither card % of people 14.2 19.1 12.1 7.7
95% CI 12.0–16.7 14.4–25.0 9.1–15.9 4.0–14.6
Place of last dental visit Cardholder/Public % of people 53.5 66.6 66.0 35.5
95% CI 38.8–67.6 37.4–86.9 38.9–85.6 16.9–59.9
Cardholder/Non-public % of people 14.2 20.4 14.5 10.5
95% CI 8.3–23.1 9.4–38.8 3.2–46.2 5.9–18.0
Non-cardholder/Non-public % of people 14.2 19.1 12.1 7.7
95% CI 12.0–16.7 14.4–25.0 9.1–15.9 4.0–14.6
Dental insurance Insured % of people 12.0 16.1 10.0 9.8
95% CI 9.5–15.2 10.8–23.3 6.4–15.2 4.8–18.7
Uninsured % of people 19.3 25.8 16.1 10.9
95% CI 15.8–23.2 20.0–32.6 11.9–21.4 7.0–16.6
(a) 95% CI = 95% confidence interval for estimated percentage.
The National Survey of Adult Oral Health 2004–06: Australian Capital Territory 65
Percentage of people experiencing orofacial pain Orofacial pain can be debilitating and indicates temporomandibular joint dysfunction.
In NSAOH, orofacial pain was assessed in the interview by asking people ‘During the last month, have you had pain in the face, jaw, temple, in front of the ear or in the ear?’. People who answered ‘yes’ were classified as having orofacial pain. They represented 23.8% of the ACT population aged 15 years or more (Table 30), which was slightly higher than the national estimate of 22.6% (Slade et al. 2007).
Key findings • The experience of orofacial pain decreased with age, from 27.0% in 15–34-year-olds to
15.8% in those aged 55 years or more. • Females were more likely to report that they had orofacial pain (28.5%) than males
(18.9%). • Among people aged 55 years or more, those who reside in middle socioeconomic
postcodes (18.4%) were more than twice as likely to report orofacial pain as those in the lowest socioeconomic postcodes (8.9%).
• Among those aged 35–54 years, government health cardholders (46.5%) were almost twice as likely as non-government health cardholders to experience orofacial pain (24.6%).
Discussion Residents of ACT were more likely to experience orofacial pain than the rest of the Australian population. Experience of orofacial pain was associated with being young and being female. It was also associated with residing in a middle socioeconomic status postcode in those aged 55 years or more, and having a government health card in the 35–54 years age group. While there were large differences in the point estimates for some other comparisons, small numbers in the sample have resulted in wide confidence intervals and no conclusions about differences can be drawn.
66 The National Survey of Adult Oral Health 2004–06: Australian Capital Territory
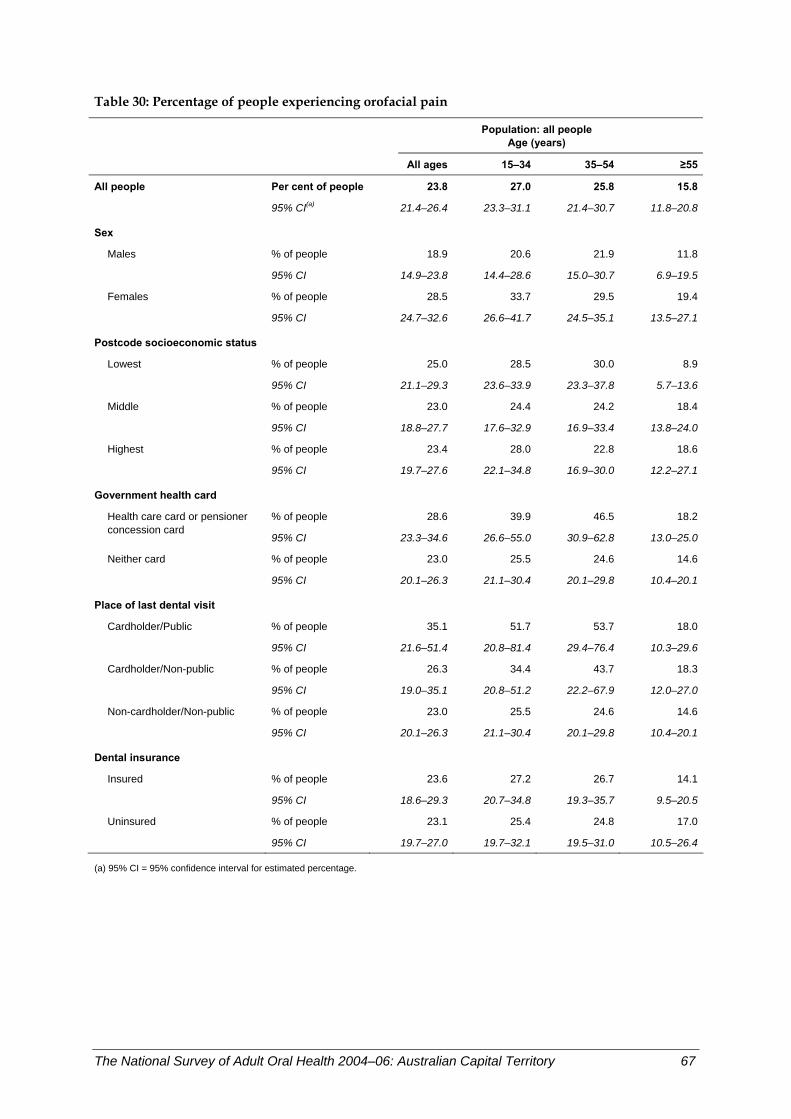
Table 30: Percentage of people experiencing orofacial pain
Population: all people
Age (years)
All ages 15–34 35–54 ≥55
All people Per cent of people 23.8 27.0 25.8 15.8
95% CI(a) 21.4–26.4 23.3–31.1 21.4–30.7 11.8–20.8
Sex
Males % of people 18.9 20.6 21.9 11.8
95% CI 14.9–23.8 14.4–28.6 15.0–30.7 6.9–19.5
Females % of people 28.5 33.7 29.5 19.4
95% CI 24.7–32.6 26.6–41.7 24.5–35.1 13.5–27.1
Postcode socioeconomic status
Lowest % of people 25.0 28.5 30.0 8.9
95% CI 21.1–29.3 23.6–33.9 23.3–37.8 5.7–13.6
Middle % of people 23.0 24.4 24.2 18.4
95% CI 18.8–27.7 17.6–32.9 16.9–33.4 13.8–24.0
Highest % of people 23.4 28.0 22.8 18.6
95% CI 19.7–27.6 22.1–34.8 16.9–30.0 12.2–27.1
Government health card
% of people 28.6 39.9 46.5 18.2Health care card or pensioner concession card
95% CI 23.3–34.6 26.6–55.0 30.9–62.8 13.0–25.0
Neither card % of people 23.0 25.5 24.6 14.6
95% CI 20.1–26.3 21.1–30.4 20.1–29.8 10.4–20.1
Place of last dental visit Cardholder/Public % of people 35.1 51.7 53.7 18.0
95% CI 21.6–51.4 20.8–81.4 29.4–76.4 10.3–29.6
Cardholder/Non-public % of people 26.3 34.4 43.7 18.3
95% CI 19.0–35.1 20.8–51.2 22.2–67.9 12.0–27.0
Non-cardholder/Non-public % of people 23.0 25.5 24.6 14.6
95% CI 20.1–26.3 21.1–30.4 20.1–29.8 10.4–20.1
Dental insurance Insured % of people 23.6 27.2 26.7 14.1
95% CI 18.6–29.3 20.7–34.8 19.3–35.7 9.5–20.5
Uninsured % of people 23.1 25.4 24.8 17.0
95% CI 19.7–27.0 19.7–32.1 19.5–31.0 10.5–26.4
(a) 95% CI = 95% confidence interval for estimated percentage.
The National Survey of Adult Oral Health 2004–06: Australian Capital Territory 67
Perceived need for dentures In NSAOH, people were asked at the time of the interview ‘Currently, which of the following dental treatments do you think you need to have?’. The possible responses varied for dentate and edentulous people. All people were asked if they felt they needed dentures.
In ACT, 5.5% of people thought they needed dentures (Table 31), which was significantly lower than the national estimate of 7.2% (Slade et al. 2007).
Key findings • The percentage of adults who thought they needed dentures was strongly age-related,
increasing from 1.7% in the 15–34 years age group to 4.6% among 35–54-year-olds and 13.0% in the 55 years or more age group.
• There were no significant differences in the perceived need for dentures by sex, residential location in capital city or other places, or postcode socioeconomic status.
• The need for a denture was more than five times higher among government health cardholders (17.1%) compared with non-government health cardholders (3.4%).
• Those who had a government health card and who last visited a public clinic were most likely to report need for a denture (22.9%). The percentage was not significantly lower among government health cardholders who last visited a private dentist (14.9%) but was significantly lower among non-government health cardholders who last visited a private dentist (3.4%).
• The percentage who reported needing a denture was significantly higher among people without dental insurance (8.4%) compared with those with dental insurance (2.6%).
• The age-relatedness of the need for dentures was evident within subgroups of adults formed by socioeconomic characteristics. For instance, among government health cardholders, the percentage was significantly higher in the 55 years or more age group (27.2%) than the two younger age groups (3.6% and 5.5% respectively).
• Some significant differences were seen across subgroups defined by socioeconomic characteristics within an individual age group. For instance, among people aged 55 years or more, the percentage was higher among government health cardholders (27.2%) than non-government health cardholders (5.4%).
Discussion The percentage of people who felt they needed new dentures was low. It was related to the observed pattern for complete tooth loss and numbers of missing teeth. However, the level of need for dentures was considerably lower than the percentage of people with either complete tooth loss or reasonable numbers of missing teeth. The relationship between perceived need and professional judgement of the need for dentures is complex, but people generally express a lower need than is assessed by dentists.
68 The National Survey of Adult Oral Health 2004–06: Australian Capital Territory
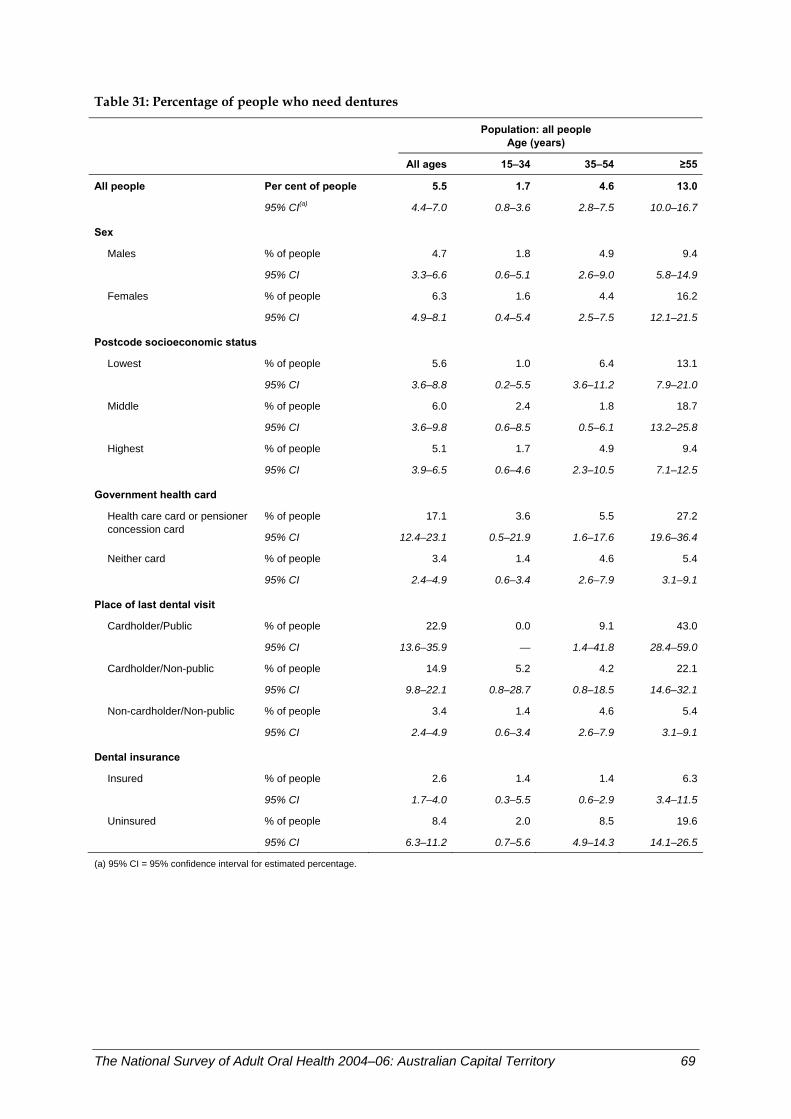
Table 31: Percentage of people who need dentures
Population: all people
Age (years)
All ages 15–34 35–54 ≥55
All people Per cent of people 5.5 1.7 4.6 13.0
95% CI(a) 4.4–7.0 0.8–3.6 2.8–7.5 10.0–16.7
Sex
Males % of people 4.7 1.8 4.9 9.4
95% CI 3.3–6.6 0.6–5.1 2.6–9.0 5.8–14.9
Females % of people 6.3 1.6 4.4 16.2
95% CI 4.9–8.1 0.4–5.4 2.5–7.5 12.1–21.5
Postcode socioeconomic status
Lowest % of people 5.6 1.0 6.4 13.1
95% CI 3.6–8.8 0.2–5.5 3.6–11.2 7.9–21.0
Middle % of people 6.0 2.4 1.8 18.7
95% CI 3.6–9.8 0.6–8.5 0.5–6.1 13.2–25.8
Highest % of people 5.1 1.7 4.9 9.4
95% CI 3.9–6.5 0.6–4.6 2.3–10.5 7.1–12.5
Government health card
% of people 17.1 3.6 5.5 27.2Health care card or pensioner concession card
95% CI 12.4–23.1 0.5–21.9 1.6–17.6 19.6–36.4
Neither card % of people 3.4 1.4 4.6 5.4
95% CI 2.4–4.9 0.6–3.4 2.6–7.9 3.1–9.1
Place of last dental visit Cardholder/Public % of people 22.9 0.0 9.1 43.0
95% CI 13.6–35.9 — 1.4–41.8 28.4–59.0
Cardholder/Non-public % of people 14.9 5.2 4.2 22.1
95% CI 9.8–22.1 0.8–28.7 0.8–18.5 14.6–32.1
Non-cardholder/Non-public % of people 3.4 1.4 4.6 5.4
95% CI 2.4–4.9 0.6–3.4 2.6–7.9 3.1–9.1
Dental insurance Insured % of people 2.6 1.4 1.4 6.3
95% CI 1.7–4.0 0.3–5.5 0.6–2.9 3.4–11.5
Uninsured % of people 8.4 2.0 8.5 19.6
95% CI 6.3–11.2 0.7–5.6 4.9–14.3 14.1–26.5
(a) 95% CI = 95% confidence interval for estimated percentage.
The National Survey of Adult Oral Health 2004–06: Australian Capital Territory 69
Perceived need for dental extraction or filling Dentate adults were asked about other dental services, including extractions or fillings that they might need. The responses to the options ‘Any extractions’ or ‘Any fillings’ have been combined so that the response indicates a perceived dental problem for which one or other of these two aspects of routine dental care is thought to be required, most likely as a sequelae for dental caries. Which of these two dental services would be provided would be determined by a process of negotiation between patient and provider, influenced by both provider and patient circumstances.
In ACT, 29.9% of dentate adults perceived a need for an extraction or filling (Table 32), which was a little lower, but not significantly, than the national estimate of 32.9% (Slade et al. 2007).
Key findings • The percentage of dentate adults who thought they needed extractions or fillings was
highest among the 15–34 years age group (33.5%) and lowest among the 55 years or more age group (25.3%). However, these differences were not statistically significant.
• There were no significant differences by sex, postcode socioeconomic status or government health cardholder status.
• People who were government health cardholders and who last visited a public dental clinic had the highest perceived need for an extraction or filling (62.5%), while the prevalence was significantly lower among both government health cardholders (31.3%) and non-government health cardholders who last visited a private dentist (28.3%).
• A higher percentage of adults who were uninsured said they needed dental extraction or fillings (36.3%) than those who were insured (23.0%).
• The lack of an age-related pattern of need for an extraction or filling was seen within all subgroups of adults formed by socioeconomic characteristics, with the exception of dentate adults living in the highest socioeconomic status postcodes. Those in the oldest age group had significantly lower perceived need (16.8%) compared with the youngest age group (42.4%).
Discussion Less than one-third of dentate adults perceived a need for an extraction or filling. The percentage was not significantly different across the three age groups but showed some socioeconomic characteristic variations. The percentage was higher among people who last visited a public dental clinic compared with non-government health cardholders who last visited a private dentist, and among people who were uninsured compared with those who were insured.
70 The National Survey of Adult Oral Health 2004–06: Australian Capital Territory
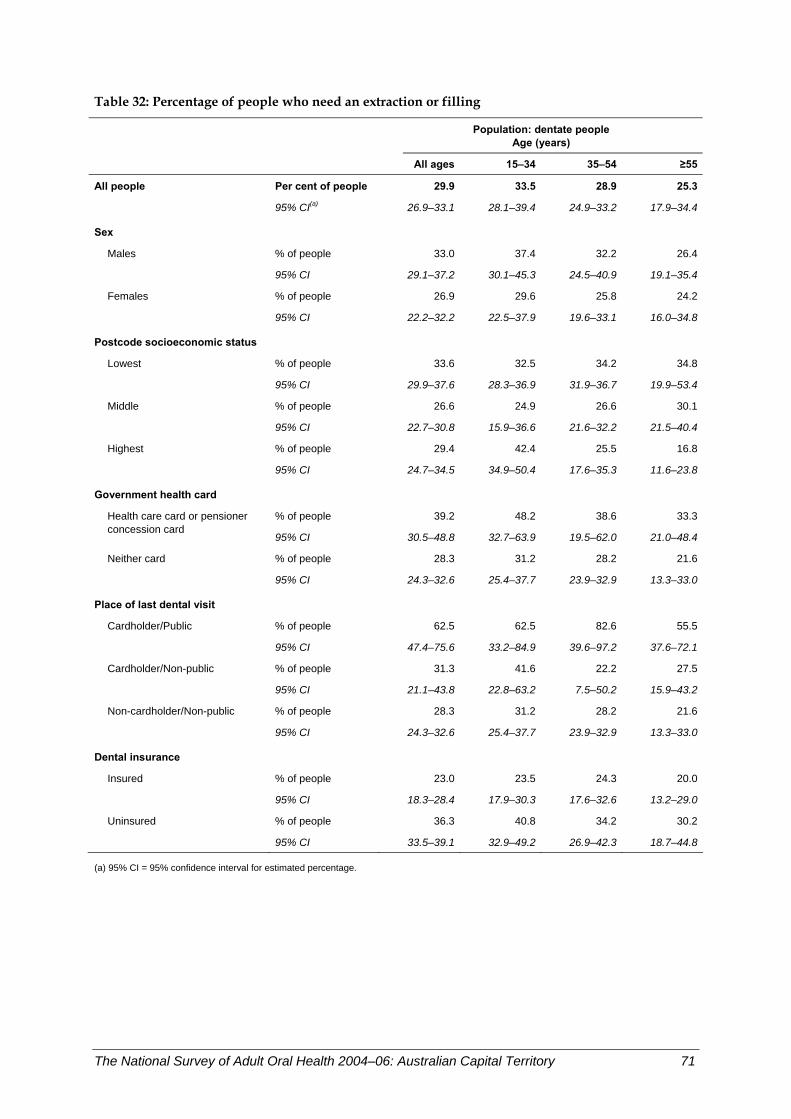
Table 32: Percentage of people who need an extraction or filling
Population: dentate people
Age (years)
All ages 15–34 35–54 ≥55
All people Per cent of people 29.9 33.5 28.9 25.3
95% CI(a) 26.9–33.1 28.1–39.4 24.9–33.2 17.9–34.4
Sex
Males % of people 33.0 37.4 32.2 26.4
95% CI 29.1–37.2 30.1–45.3 24.5–40.9 19.1–35.4
Females % of people 26.9 29.6 25.8 24.2
95% CI 22.2–32.2 22.5–37.9 19.6–33.1 16.0–34.8
Postcode socioeconomic status
Lowest % of people 33.6 32.5 34.2 34.8
95% CI 29.9–37.6 28.3–36.9 31.9–36.7 19.9–53.4
Middle % of people 26.6 24.9 26.6 30.1
95% CI 22.7–30.8 15.9–36.6 21.6–32.2 21.5–40.4
Highest % of people 29.4 42.4 25.5 16.8
95% CI 24.7–34.5 34.9–50.4 17.6–35.3 11.6–23.8
Government health card
% of people 39.2 48.2 38.6 33.3Health care card or pensioner concession card
95% CI 30.5–48.8 32.7–63.9 19.5–62.0 21.0–48.4
Neither card % of people 28.3 31.2 28.2 21.6
95% CI 24.3–32.6 25.4–37.7 23.9–32.9 13.3–33.0
Place of last dental visit Cardholder/Public % of people 62.5 62.5 82.6 55.5
95% CI 47.4–75.6 33.2–84.9 39.6–97.2 37.6–72.1
Cardholder/Non-public % of people 31.3 41.6 22.2 27.5
95% CI 21.1–43.8 22.8–63.2 7.5–50.2 15.9–43.2
Non-cardholder/Non-public % of people 28.3 31.2 28.2 21.6
95% CI 24.3–32.6 25.4–37.7 23.9–32.9 13.3–33.0
Dental insurance Insured % of people 23.0 23.5 24.3 20.0
95% CI 18.3–28.4 17.9–30.3 17.6–32.6 13.2–29.0
Uninsured % of people 36.3 40.8 34.2 30.2
95% CI 33.5–39.1 32.9–49.2 26.9–42.3 18.7–44.8
(a) 95% CI = 95% confidence interval for estimated percentage.
The National Survey of Adult Oral Health 2004–06: Australian Capital Territory 71
Perceived need for a dental check-up Dentate adults were asked about their perceived need for a check-up. This is regarded as an indicator of compliance with the recommendation of dentists to visit regularly when asymptomatic so as to detect disease earlier and receive prompt treatment for any dental problems. A check-up also provides an opportunity for preventive services to be received.
In ACT, 59.4% of dentate adults perceived a need for a check-up (Table 33), which was very similar to the national estimate of 59.6% (Slade et al. 2007).
Key findings • The percentage of dentate adults who thought they needed a check-up was significantly
different across the three age groups. The percentage was higher in the youngest age group (70.5%) than both the 35–54 years (56.8%) and 55 years or more (43.7%) age groups. While the percentage decreased between these two age groups, the difference was not significant.
• There were no significant differences among dentate adults by sex, residential location, postcode socioeconomic status, government health cardholder status or place of last dental visit.
• The percentage was significantly higher among those who were uninsured (64.5%) than those with dental insurance (54.0%).
• The age-related pattern of perceived need for a check-up was repeated within subgroups of adults formed by all of the socioeconomic characteristics. For instance, among the uninsured, the percentage decreased significantly from the 15–34 years age group (76.7%) to the 35–54-year-olds (59.2%) and further to the 55 years or more age group (48.2%).
Discussion Just less than 6 out of 10 dentate adults perceived a need for a check-up. The percentage decreased significantly from the 15–34 years to the 55 years or more age groups. There was little variation by socioeconomic characteristics, which might reflect a confounding of perceived need for a check-up by time since last dental visit. Those with a higher likelihood of compliance with the recommendation of dentists for a regular check-up visit may have last visited more recently and hence not perceive a need for a further check-up at the time of the interview.
72 The National Survey of Adult Oral Health 2004–06: Australian Capital Territory
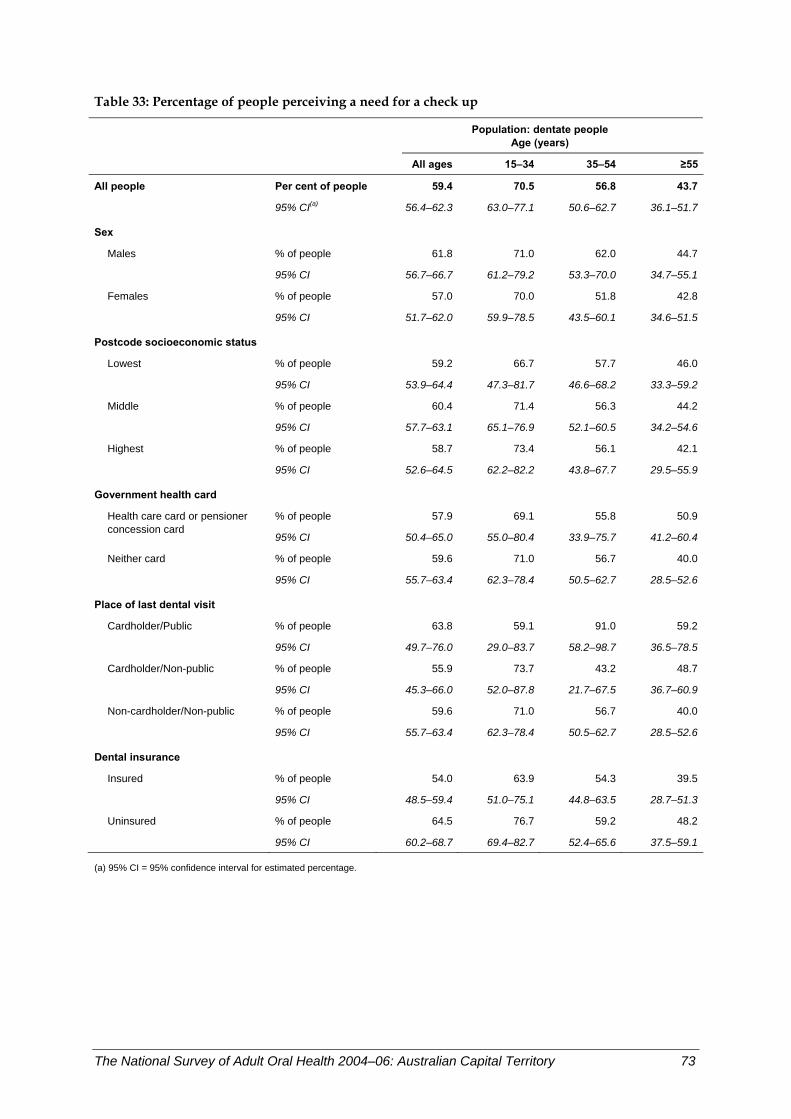
Table 33: Percentage of people perceiving a need for a check up
Population: dentate people
Age (years)
All ages 15–34 35–54 ≥55
All people Per cent of people 59.4 70.5 56.8 43.7
95% CI(a) 56.4–62.3 63.0–77.1 50.6–62.7 36.1–51.7
Sex
Males % of people 61.8 71.0 62.0 44.7
95% CI 56.7–66.7 61.2–79.2 53.3–70.0 34.7–55.1
Females % of people 57.0 70.0 51.8 42.8
95% CI 51.7–62.0 59.9–78.5 43.5–60.1 34.6–51.5
Postcode socioeconomic status
Lowest % of people 59.2 66.7 57.7 46.0
95% CI 53.9–64.4 47.3–81.7 46.6–68.2 33.3–59.2
Middle % of people 60.4 71.4 56.3 44.2
95% CI 57.7–63.1 65.1–76.9 52.1–60.5 34.2–54.6
Highest % of people 58.7 73.4 56.1 42.1
95% CI 52.6–64.5 62.2–82.2 43.8–67.7 29.5–55.9
Government health card
% of people 57.9 69.1 55.8 50.9Health care card or pensioner concession card
95% CI 50.4–65.0 55.0–80.4 33.9–75.7 41.2–60.4
Neither card % of people 59.6 71.0 56.7 40.0
95% CI 55.7–63.4 62.3–78.4 50.5–62.7 28.5–52.6
Place of last dental visit Cardholder/Public % of people 63.8 59.1 91.0 59.2
95% CI 49.7–76.0 29.0–83.7 58.2–98.7 36.5–78.5
Cardholder/Non-public % of people 55.9 73.7 43.2 48.7
95% CI 45.3–66.0 52.0–87.8 21.7–67.5 36.7–60.9
Non-cardholder/Non-public % of people 59.6 71.0 56.7 40.0
95% CI 55.7–63.4 62.3–78.4 50.5–62.7 28.5–52.6
Dental insurance Insured % of people 54.0 63.9 54.3 39.5
95% CI 48.5–59.4 51.0–75.1 44.8–63.5 28.7–51.3
Uninsured % of people 64.5 76.7 59.2 48.2
95% CI 60.2–68.7 69.4–82.7 52.4–65.6 37.5–59.1
(a) 95% CI = 95% confidence interval for estimated percentage.
The National Survey of Adult Oral Health 2004–06: Australian Capital Territory 73
Perceived urgency of dental treatment needs Dentate adults who perceived a need for an extraction or filling were asked about the urgency of needed dental treatment. Dental problems vary from truly urgent problems like dental trauma, swelling in or around the jaws, or bleeding (usually as a complication of dental treatment); through situations where treatment is highly desirable in a short period of time (usually associated with pain); to problems that can reasonably wait to be treated. In NSAOH, dentate adults who perceived a need for an extraction or filling were asked ‘How soon do you think you need this dental treatment?’ at the time of the interview. The possible responses included a wide range of time periods. These have been collapsed to perceiving a need for treatment within 3 months or longer than 3 months.
In ACT, 70.5% of dentate adults needing an extraction or filling perceived a need for dental treatment within 3 months (Table 34), which was a little higher, but not significantly, than the national estimate of 69.3% (Slade et al. 2007).
Key findings • The percentage of dentate adults needing an extraction or filling who thought they
needed treatment within 3 months showed no significant difference by age group, the percentage varying from 67.4% to 74.1% across the three age groups.
• There were no significant differences among subgroups formed by any social characteristic, except postcode socioeconomic status. The percentage varied from 77.5% among those dentate adults living in postcodes of the highest socioeconomic status to 60.8% among those of middle socioeconomic status. Those with the lowest socioeconomic status had an intermediate percentage who needed treatment within 3 months (70.2%).
Discussion Over 7 out of 10 dentate adults who needed an extraction or filling perceived a need for dental treatment within 3 months. The percentage of people who perceived a need for more urgent treatment was not significantly different across the three age groups. It also showed little significant variation by socioeconomic characteristics, which might reflect a confounding of perceived need for dental treatment within 3 months by time since last dental visit.
74 The National Survey of Adult Oral Health 2004–06: Australian Capital Territory

Table 34: Percentage of people perceiving a need for treatment within 3 months
Population: dentate people who need an extraction or filling
Age (years)
All ages 15–34 35–54 ≥55
All people Per cent of people 70.5 74.1 67.4 67.9
95% CI(a) 64.7–75.7 65.6–81.1 56.8–76.5 56.8–77.2
Sex
Males % of people 71.6 73.1 68.0 74.5
95% CI 63.0–78.8 58.2–84.1 52.3–80.5 57.0–86.5
Females % of people 69.3 75.4 66.7 60.4
95% CI 62.2–75.5 62.9–84.7 54.7–76.8 40.8–77.2
Postcode socioeconomic status
Lowest % of people 70.2 69.1 72.6 67.1
95% CI 61.3–77.8 53.5–81.3 57.5–83.8 51.9–79.5
Middle % of people 60.8 64.7 53.8 63.9
95% CI 53.2–67.8 49.7–77.3 34.3–72.2 41.2–81.7
Highest % of people 77.5 82.6 71.0 72.7
95% CI 68.8–84.2 71.2–90.2 55.4–82.8 54.5–85.6
Government health card
% of people 65.9 62.6 74.1 66.5Health care card or pensioner concession card
95% CI 53.6–76.3 38.6–81.7 39.5–92.6 43.7–83.5
Neither card % of people 71.3 76.1 66.6 68.8
95% CI 65.7–76.2 67.9–82.8 55.4–76.2 54.9–80.0
Place of last dental visit Cardholder/Public % of people 68.3 43.9 89.2 90.0
95% CI 42.6–86.3 10.9–83.4 54.5–98.3 77.0–96.0
Cardholder/Non-public % of people 64.3 75.9 53.4 56.4
95% CI 44.9–79.9 40.1–93.7 8.9–93.1 31.0–78.8
Non-cardholder/Non-public % of people 71.3 76.1 66.6 68.8
95% CI 65.7–76.2 67.9–82.8 55.4–76.2 54.9–80.0
Dental insurance Insured % of people 81.6 94.1 73.7 77.0
95% CI 71.1–88.8 71.0–99.1 57.5–85.3 57.6–89.2
Uninsured % of people 65.7 68.0 63.7 62.6
95% CI 57.3–73.2 55.0–78.7 47.2–77.5 45.7–76.9
(a) 95% CI = 95% confidence interval for estimated percentage.
The National Survey of Adult Oral Health 2004–06: Australian Capital Territory 75
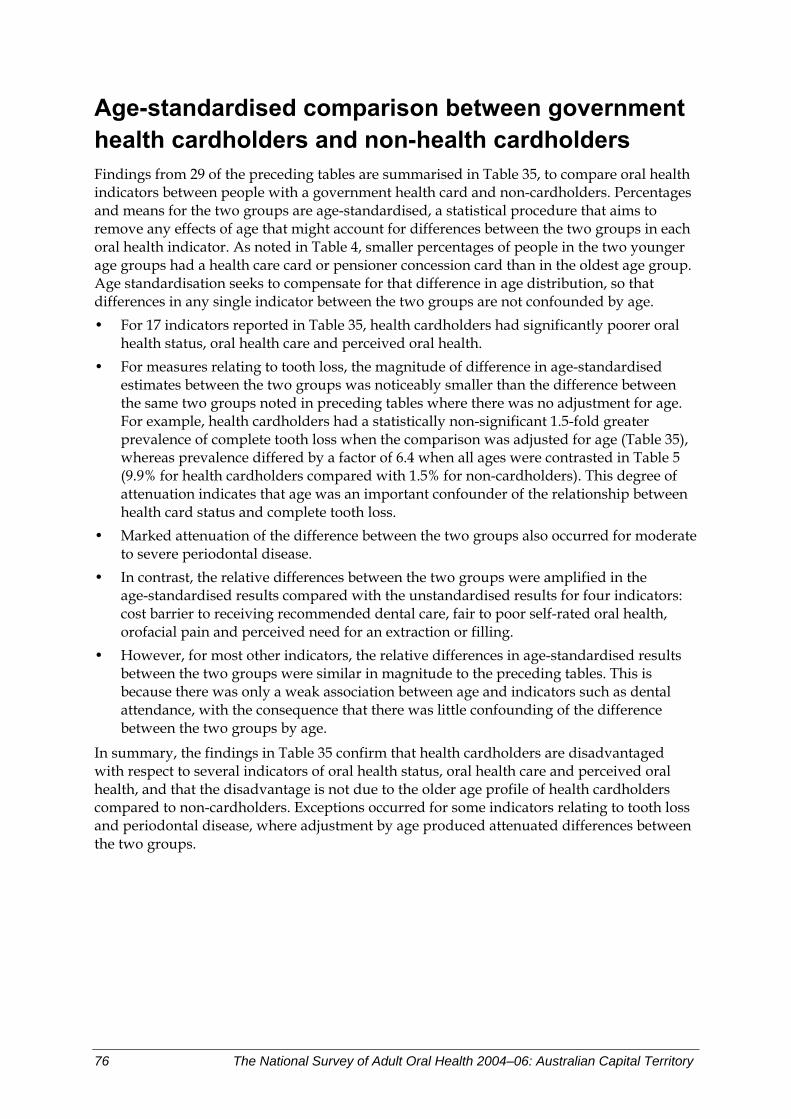
Age-standardised comparison between government health cardholders and non-health cardholders Findings from 29 of the preceding tables are summarised in Table 35, to compare oral health indicators between people with a government health card and non-cardholders. Percentages and means for the two groups are age-standardised, a statistical procedure that aims to remove any effects of age that might account for differences between the two groups in each oral health indicator. As noted in Table 4, smaller percentages of people in the two younger age groups had a health care card or pensioner concession card than in the oldest age group. Age standardisation seeks to compensate for that difference in age distribution, so that differences in any single indicator between the two groups are not confounded by age. • For 17 indicators reported in Table 35, health cardholders had significantly poorer oral
health status, oral health care and perceived oral health. • For measures relating to tooth loss, the magnitude of difference in age-standardised
estimates between the two groups was noticeably smaller than the difference between the same two groups noted in preceding tables where there was no adjustment for age. For example, health cardholders had a statistically non-significant 1.5-fold greater prevalence of complete tooth loss when the comparison was adjusted for age (Table 35), whereas prevalence differed by a factor of 6.4 when all ages were contrasted in Table 5 (9.9% for health cardholders compared with 1.5% for non-cardholders). This degree of attenuation indicates that age was an important confounder of the relationship between health card status and complete tooth loss.
• Marked attenuation of the difference between the two groups also occurred for moderate to severe periodontal disease.
• In contrast, the relative differences between the two groups were amplified in the age-standardised results compared with the unstandardised results for four indicators: cost barrier to receiving recommended dental care, fair to poor self-rated oral health, orofacial pain and perceived need for an extraction or filling.
• However, for most other indicators, the relative differences in age-standardised results between the two groups were similar in magnitude to the preceding tables. This is because there was only a weak association between age and indicators such as dental attendance, with the consequence that there was little confounding of the difference between the two groups by age.
In summary, the findings in Table 35 confirm that health cardholders are disadvantaged with respect to several indicators of oral health status, oral health care and perceived oral health, and that the disadvantage is not due to the older age profile of health cardholders compared to non-cardholders. Exceptions occurred for some indicators relating to tooth loss and periodontal disease, where adjustment by age produced attenuated differences between the two groups.
76 The National Survey of Adult Oral Health 2004–06: Australian Capital Territory
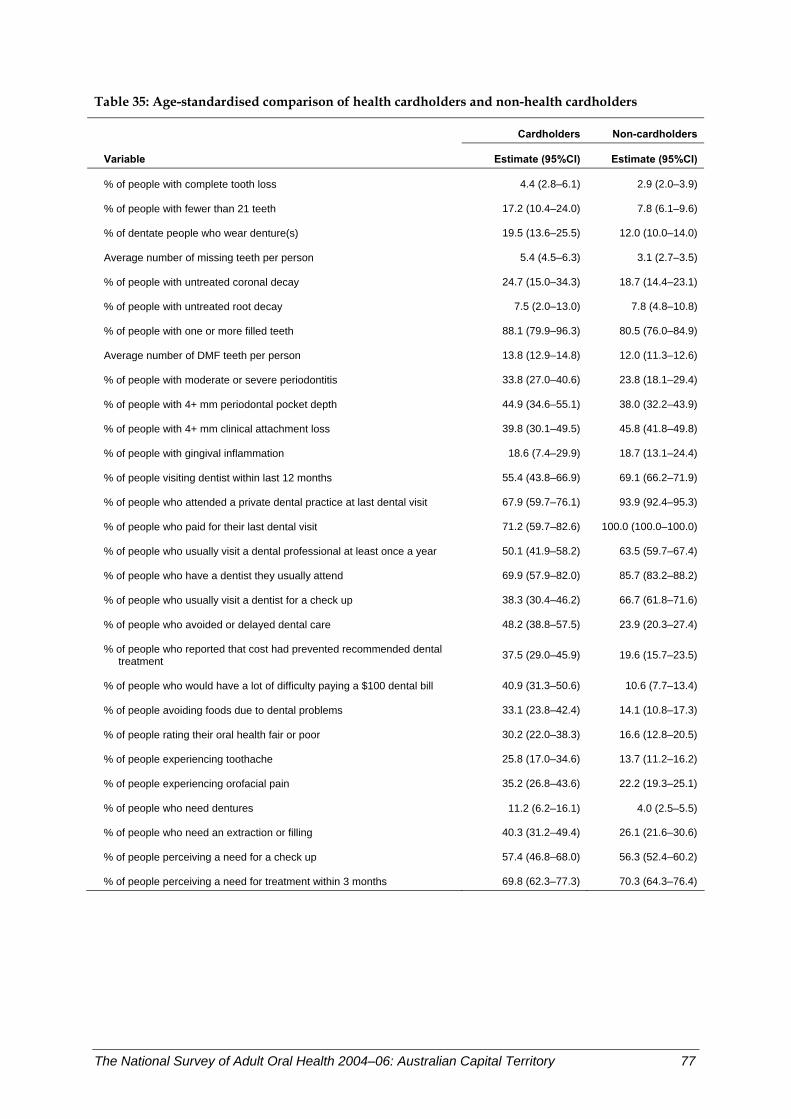
Table 35: Age-standardised comparison of health cardholders and non-health cardholders
Cardholders Non-cardholders
Variable Estimate (95%CI) Estimate (95%CI)
% of people with complete tooth loss 4.4 (2.8–6.1) 2.9 (2.0–3.9)
% of people with fewer than 21 teeth 17.2 (10.4–24.0) 7.8 (6.1–9.6)
% of dentate people who wear denture(s) 19.5 (13.6–25.5) 12.0 (10.0–14.0)
Average number of missing teeth per person 5.4 (4.5–6.3) 3.1 (2.7–3.5)
% of people with untreated coronal decay 24.7 (15.0–34.3) 18.7 (14.4–23.1)
% of people with untreated root decay 7.5 (2.0–13.0) 7.8 (4.8–10.8)
% of people with one or more filled teeth 88.1 (79.9–96.3) 80.5 (76.0–84.9)
Average number of DMF teeth per person 13.8 (12.9–14.8) 12.0 (11.3–12.6)
% of people with moderate or severe periodontitis 33.8 (27.0–40.6) 23.8 (18.1–29.4)
% of people with 4+ mm periodontal pocket depth 44.9 (34.6–55.1) 38.0 (32.2–43.9)
% of people with 4+ mm clinical attachment loss 39.8 (30.1–49.5) 45.8 (41.8–49.8)
% of people with gingival inflammation 18.6 (7.4–29.9) 18.7 (13.1–24.4)
% of people visiting dentist within last 12 months 55.4 (43.8–66.9) 69.1 (66.2–71.9)
% of people who attended a private dental practice at last dental visit 67.9 (59.7–76.1) 93.9 (92.4–95.3)
% of people who paid for their last dental visit 71.2 (59.7–82.6) 100.0 (100.0–100.0)
% of people who usually visit a dental professional at least once a year 50.1 (41.9–58.2) 63.5 (59.7–67.4)
% of people who have a dentist they usually attend 69.9 (57.9–82.0) 85.7 (83.2–88.2)
% of people who usually visit a dentist for a check up 38.3 (30.4–46.2) 66.7 (61.8–71.6)
% of people who avoided or delayed dental care 48.2 (38.8–57.5) 23.9 (20.3–27.4)
% of people who reported that cost had prevented recommended dental treatment 37.5 (29.0–45.9) 19.6 (15.7–23.5)
% of people who would have a lot of difficulty paying a $100 dental bill 40.9 (31.3–50.6) 10.6 (7.7–13.4)
% of people avoiding foods due to dental problems 33.1 (23.8–42.4) 14.1 (10.8–17.3)
% of people rating their oral health fair or poor 30.2 (22.0–38.3) 16.6 (12.8–20.5)
% of people experiencing toothache 25.8 (17.0–34.6) 13.7 (11.2–16.2)
% of people experiencing orofacial pain 35.2 (26.8–43.6) 22.2 (19.3–25.1)
% of people who need dentures 11.2 (6.2–16.1) 4.0 (2.5–5.5)
% of people who need an extraction or filling 40.3 (31.2–49.4) 26.1 (21.6–30.6)
% of people perceiving a need for a check up 57.4 (46.8–68.0) 56.3 (52.4–60.2)
% of people perceiving a need for treatment within 3 months 69.8 (62.3–77.3) 70.3 (64.3–76.4)
The National Survey of Adult Oral Health 2004–06: Australian Capital Territory 77
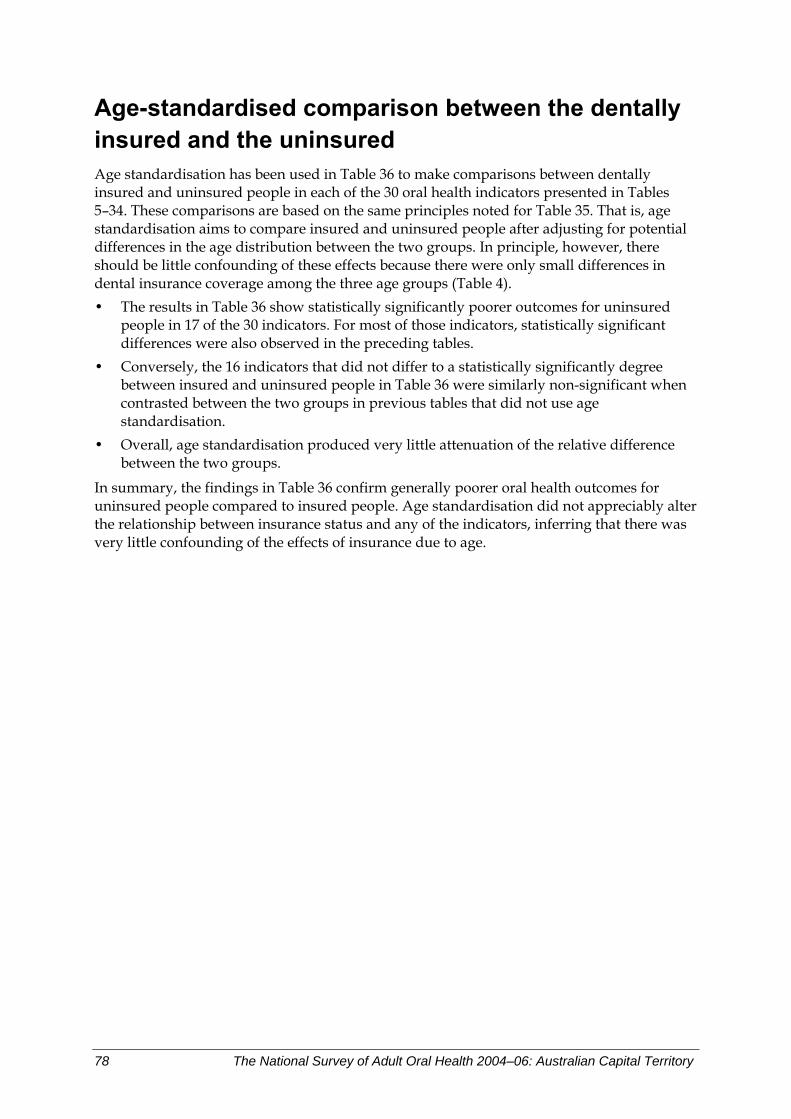
Age-standardised comparison between the dentally insured and the uninsured Age standardisation has been used in Table 36 to make comparisons between dentally insured and uninsured people in each of the 30 oral health indicators presented in Tables 5–34. These comparisons are based on the same principles noted for Table 35. That is, age standardisation aims to compare insured and uninsured people after adjusting for potential differences in the age distribution between the two groups. In principle, however, there should be little confounding of these effects because there were only small differences in dental insurance coverage among the three age groups (Table 4). • The results in Table 36 show statistically significantly poorer outcomes for uninsured
people in 17 of the 30 indicators. For most of those indicators, statistically significant differences were also observed in the preceding tables.
• Conversely, the 16 indicators that did not differ to a statistically significantly degree between insured and uninsured people in Table 36 were similarly non-significant when contrasted between the two groups in previous tables that did not use age standardisation.
• Overall, age standardisation produced very little attenuation of the relative difference between the two groups.
In summary, the findings in Table 36 confirm generally poorer oral health outcomes for uninsured people compared to insured people. Age standardisation did not appreciably alter the relationship between insurance status and any of the indicators, inferring that there was very little confounding of the effects of insurance due to age.
78 The National Survey of Adult Oral Health 2004–06: Australian Capital Territory
Table 36: Age-standardised comparison of the dentally insured and the uninsured
Insured Uninsured
Variable Estimate (95%CI) Estimate (95%CI)
% of people with complete tooth loss 3.0 (1.1–4.9) 3.9 (2.8–5.0)
% of people with fewer than 21 teeth 7.4 (5.6–9.2) 13.1 (10.4–15.8)
% of dentate people who wear denture(s) 11.1 (9.0–13.2) 16.9 (14.1–19.7)
Average number of missing teeth per person 3.3 (3.0–3.6) 4.1 (3.5–4.7)
% of people with untreated coronal decay 13.7 (8.7–18.7) 25.9 (17.0–34.8)
% of people with untreated root decay 8.2 (3.5–13.0) 8.0 (4.6–11.4)
% of people with one or more filled teeth 83.2 (75.7–90.7) 80.6 (74.0–87.2)
Average number of DMF teeth per person 12.6 (11.7–13.5) 11.9 (11.1–12.7)
% of people with moderate or severe periodontitis 17.9 (12.9–23.0) 34.3 (27.4–41.1)
% of people with 4+ mm periodontal pocket depth 29.7 (25.1–34.4) 46.0 (38.2–53.8)
% of people with 4+ mm clinical attachment loss 40.5 (34.6–46.4) 49.4 (44.1–54.7)
% of people with gingival inflammation 17.8 (11.2–24.5) 21.0 (12.3–29.7)
% of people visiting dentist within last 12 months 77.1 (73.2–81.1) 58.3 (52.8–63.8)
% of people who attended a private dental practice at last dental visit 96.7 (95.3–98.1) 83.5 (81.1–86.0)
% of people who paid for their last dental visit 99.4 (98.7–100.1) 91.3 (88.9–93.6)
% of people who received government-subsidised dental care in private sector
0.6 (<0–1.3) 1.9 (0.7–3.1)
% of people who usually visit a dental professional at least once a year 74.2 (69.5–78.9) 50.9 (45.3–56.5)
% of people who have a dentist they usually attend 91.5 (88.7–94.2) 76.4 (70.9–81.9)
% of people who usually visit a dentist for a check up 75.5 (71.5–79.4) 52.7 (46.8–58.6)
% of people who avoided or delayed dental care 18.1 (13.8–22.4) 36.9 (31.8–42.0)
% of people who reported that cost had prevented recommended dental treatment
17.8 (14.5–21.2) 28.3 (23.2–33.5)
% of people who would have a lot of difficulty paying a $100 dental bill 8.4 (5.2–11.6) 21.4 (17.2–25.6)
% of people avoiding foods due to dental problems 11.5 (8.2–14.9) 20.8 (16.7–24.8)
% of people rating their oral health fair or poor 14.8 (10.1–19.4) 20.6 (17.0–24.1)
% of people experiencing toothache 12.2 (9.4–14.9) 18.1 (14.8–21.5)
% of people experiencing orofacial pain 24.0 (19.4–28.6) 22.8 (18.9–26.7)
% of people who need dentures 3.7 (2.2–5.2) 9.5 (7.2–11.7)
% of people who need an extraction or filling 23.0 (17.9–28.2) 34.4 (31.2–37.7)
% of people perceiving a need for a check up 53.1 (47.6–58.6) 61.5 (57.3–65.7)
% of people perceiving a need for treatment within 3 months 82.6 (73.9–91.2) 61.0 (52.6–69.4)
The National Survey of Adult Oral Health 2004–06: Australian Capital Territory 79
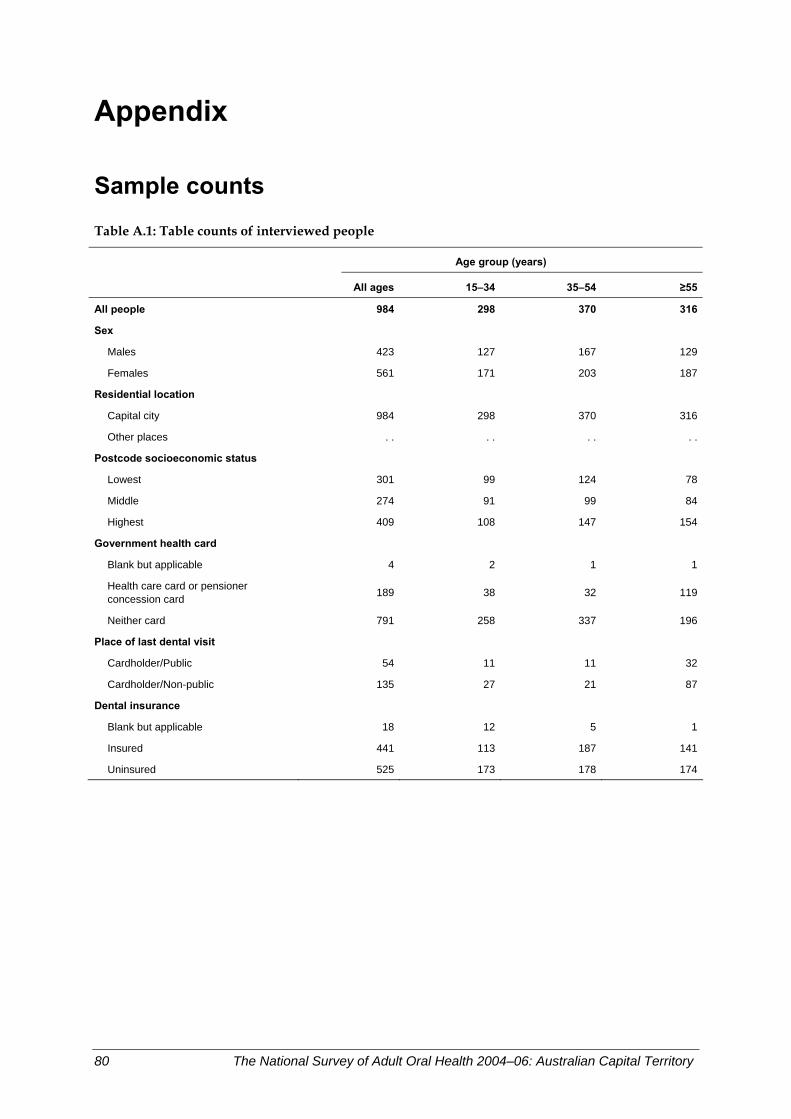
Appendix
Sample counts
Table A.1: Table counts of interviewed people
Age group (years)
All ages 15–34 35–54 ≥55
All people 984 298 370 316
Sex
Males 423 127 167 129
Females 561 171 203 187
Residential location
Capital city 984 298 370 316
Other places . . . . . . . .
Postcode socioeconomic status
Lowest 301 99 124 78
Middle 274 91 99 84
Highest 409 108 147 154
Government health card
Blank but applicable 4 2 1 1
Health care card or pensioner concession card 189 38 32 119
Neither card 791 258 337 196
Place of last dental visit
Cardholder/Public 54 11 11 32
Cardholder/Non-public 135 27 21 87
Dental insurance
Blank but applicable 18 12 5 1
Insured 441 113 187 141
Uninsured 525 173 178 174
80 The National Survey of Adult Oral Health 2004–06: Australian Capital Territory
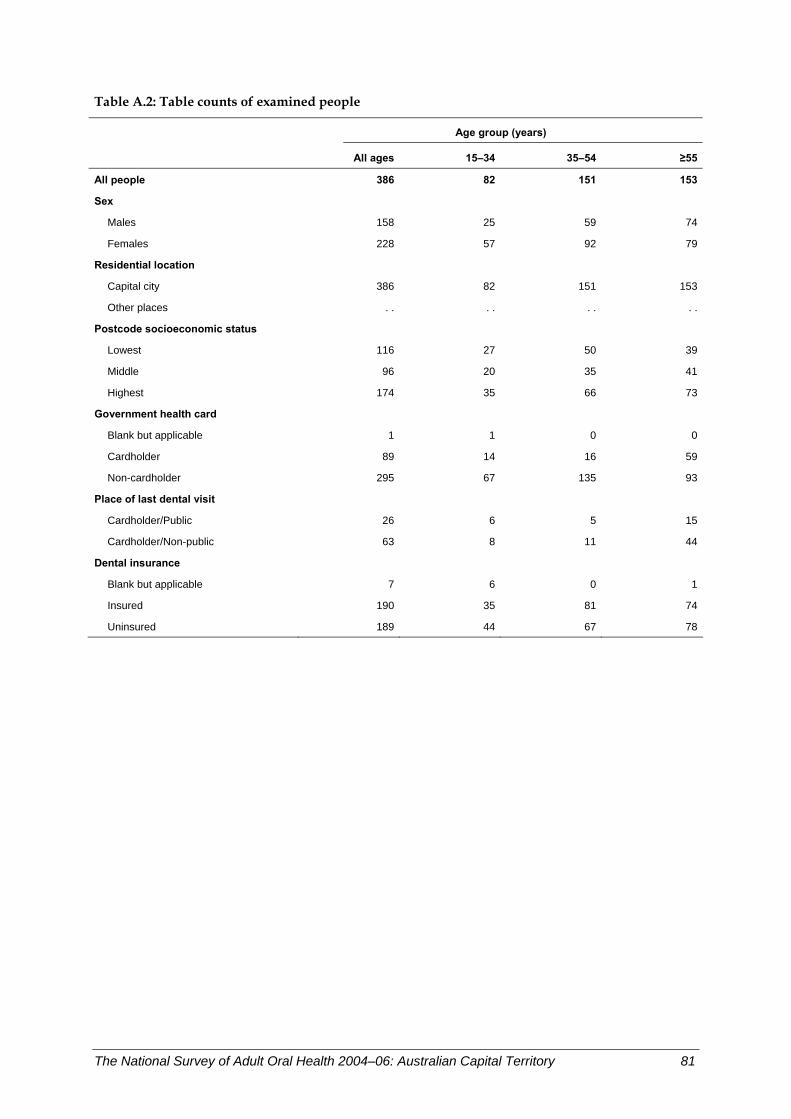
Table A.2: Table counts of examined people
Age group (years)
All ages 15–34 35–54 ≥55
All people 386 82 151 153
Sex
Males 158 25 59 74
Females 228 57 92 79
Residential location
Capital city 386 82 151 153
Other places . . . . . . . .
Postcode socioeconomic status
Lowest 116 27 50 39
Middle 96 20 35 41
Highest 174 35 66 73
Government health card
Blank but applicable 1 1 0 0
Cardholder 89 14 16 59
Non-cardholder 295 67 135 93
Place of last dental visit
Cardholder/Public 26 6 5 15
Cardholder/Non-public 63 8 11 44
Dental insurance
Blank but applicable 7 6 0 1
Insured 190 35 81 74
Uninsured 189 44 67 78
The National Survey of Adult Oral Health 2004–06: Australian Capital Territory 81
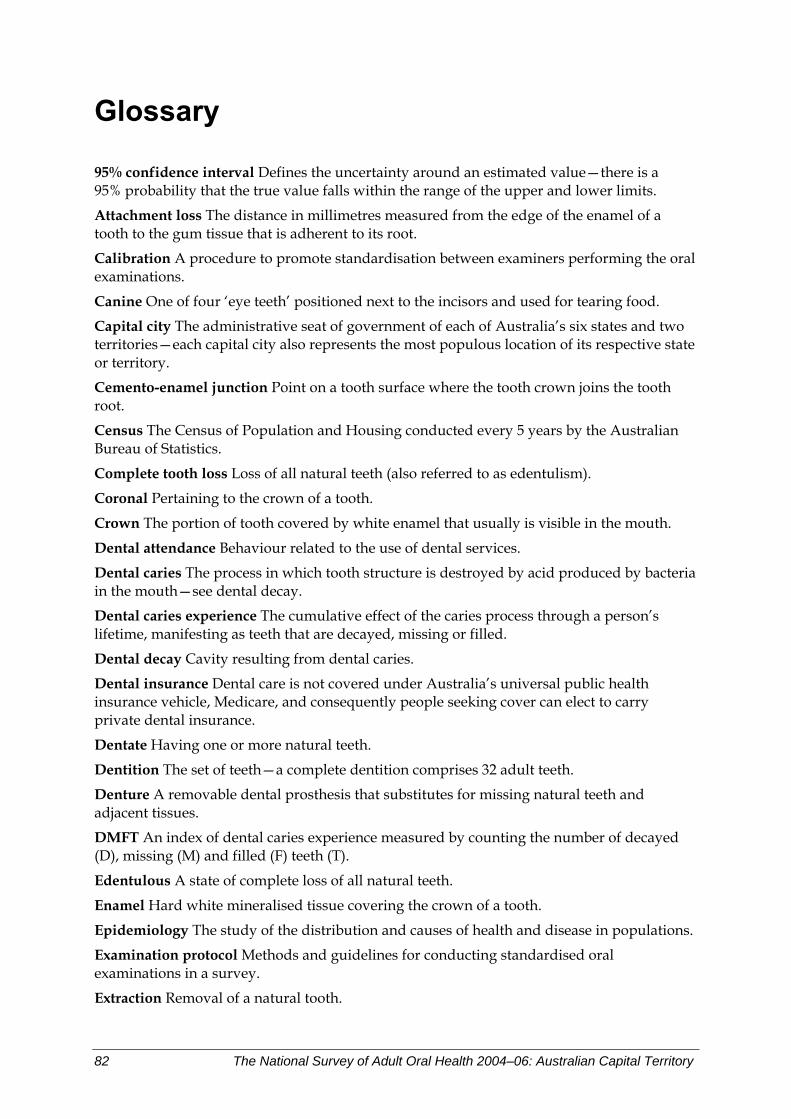
Glossary
95% confidence interval Defines the uncertainty around an estimated value—there is a 95% probability that the true value falls within the range of the upper and lower limits.
Attachment loss The distance in millimetres measured from the edge of the enamel of a tooth to the gum tissue that is adherent to its root.
Calibration A procedure to promote standardisation between examiners performing the oral examinations.
Canine One of four ‘eye teeth’ positioned next to the incisors and used for tearing food.
Capital city The administrative seat of government of each of Australia’s six states and two territories—each capital city also represents the most populous location of its respective state or territory.
Cemento-enamel junction Point on a tooth surface where the tooth crown joins the tooth root.
Census The Census of Population and Housing conducted every 5 years by the Australian Bureau of Statistics.
Complete tooth loss Loss of all natural teeth (also referred to as edentulism).
Coronal Pertaining to the crown of a tooth.
Crown The portion of tooth covered by white enamel that usually is visible in the mouth.
Dental attendance Behaviour related to the use of dental services.
Dental caries The process in which tooth structure is destroyed by acid produced by bacteria in the mouth—see dental decay.
Dental caries experience The cumulative effect of the caries process through a person’s lifetime, manifesting as teeth that are decayed, missing or filled.
Dental decay Cavity resulting from dental caries.
Dental insurance Dental care is not covered under Australia’s universal public health insurance vehicle, Medicare, and consequently people seeking cover can elect to carry private dental insurance.
Dentate Having one or more natural teeth.
Dentition The set of teeth—a complete dentition comprises 32 adult teeth.
Denture A removable dental prosthesis that substitutes for missing natural teeth and adjacent tissues.
DMFT An index of dental caries experience measured by counting the number of decayed (D), missing (M) and filled (F) teeth (T).
Edentulous A state of complete loss of all natural teeth.
Enamel Hard white mineralised tissue covering the crown of a tooth.
Epidemiology The study of the distribution and causes of health and disease in populations.
Examination protocol Methods and guidelines for conducting standardised oral examinations in a survey.
Extraction Removal of a natural tooth.
82 The National Survey of Adult Oral Health 2004–06: Australian Capital Territory
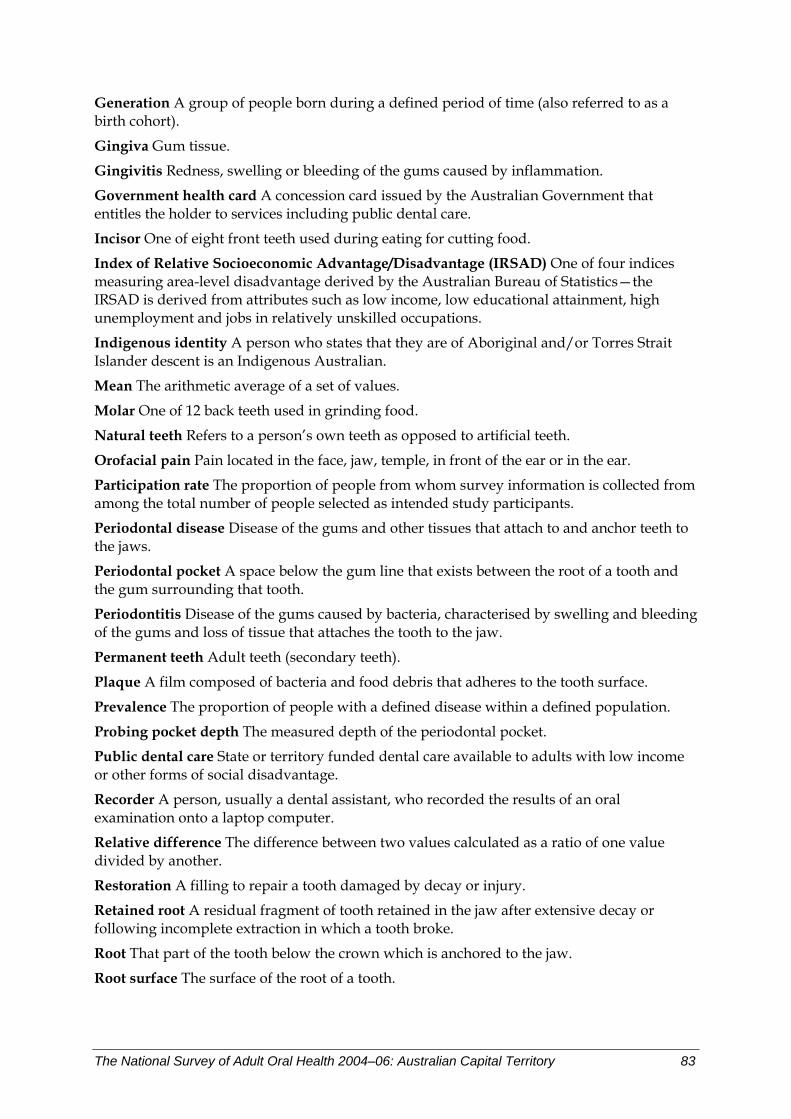
Generation A group of people born during a defined period of time (also referred to as a birth cohort).
Gingiva Gum tissue.
Gingivitis Redness, swelling or bleeding of the gums caused by inflammation.
Government health card A concession card issued by the Australian Government that entitles the holder to services including public dental care.
Incisor One of eight front teeth used during eating for cutting food.
Index of Relative Socioeconomic Advantage/Disadvantage (IRSAD) One of four indices measuring area-level disadvantage derived by the Australian Bureau of Statistics—the IRSAD is derived from attributes such as low income, low educational attainment, high unemployment and jobs in relatively unskilled occupations.
Indigenous identity A person who states that they are of Aboriginal and/or Torres Strait Islander descent is an Indigenous Australian.
Mean The arithmetic average of a set of values.
Molar One of 12 back teeth used in grinding food.
Natural teeth Refers to a person’s own teeth as opposed to artificial teeth.
Orofacial pain Pain located in the face, jaw, temple, in front of the ear or in the ear.
Participation rate The proportion of people from whom survey information is collected from among the total number of people selected as intended study participants.
Periodontal disease Disease of the gums and other tissues that attach to and anchor teeth to the jaws.
Periodontal pocket A space below the gum line that exists between the root of a tooth and the gum surrounding that tooth.
Periodontitis Disease of the gums caused by bacteria, characterised by swelling and bleeding of the gums and loss of tissue that attaches the tooth to the jaw.
Permanent teeth Adult teeth (secondary teeth).
Plaque A film composed of bacteria and food debris that adheres to the tooth surface.
Prevalence The proportion of people with a defined disease within a defined population.
Probing pocket depth The measured depth of the periodontal pocket.
Public dental care State or territory funded dental care available to adults with low income or other forms of social disadvantage.
Recorder A person, usually a dental assistant, who recorded the results of an oral examination onto a laptop computer.
Relative difference The difference between two values calculated as a ratio of one value divided by another.
Restoration A filling to repair a tooth damaged by decay or injury.
Retained root A residual fragment of tooth retained in the jaw after extensive decay or following incomplete extraction in which a tooth broke.
Root That part of the tooth below the crown which is anchored to the jaw.
Root surface The surface of the root of a tooth.
The National Survey of Adult Oral Health 2004–06: Australian Capital Territory 83
Sampling bias A flaw in either the study design or selection of participants that leads to an erroneous interpretation.
Socioeconomic Indices for Areas (SEIFA) A set of four indices derived by the Australian Bureau of Statistics from population census data to measure aspects of socioeconomic position for geographic areas.
Socioeconomic position Descriptive term for a position in society and usually measured by attributes such as income, education, occupation or characteristics of residential area.
State/territory Geographic regions of Australia—the nation has six states and two territories.
Statistical significance An indication from a statistical test that an observed association is unlikely (usually less than 5% probability) to be due to chance created when a random sample of people is selected from a population.
Trend The general direction in which change over time is observed.
Unerupted tooth A tooth that has failed to emerge through the gums into the mouth.
Weights Numbers applied to groups of study participants to correct for differences in probability of selection and in participation.
Wisdom tooth One of four molars, each positioned at the back of the mouth.
84 The National Survey of Adult Oral Health 2004–06: Australian Capital Territory
References
AHMAC (Australian Health Ministers’ Advisory Council) 2001. Steering Committee for National Planning for Oral Health. Oral health of Australians: National planning for oral health improvement. Adelaide: SA Department of Human Services.
AIHW (Australian Institute of Health and Welfare) 2000. Australia’s health 2000: The seventh biennial health report of the Australian Institute of Health and Welfare. Canberra: AIHW.
AIHW 2007. Health expenditure Australia 2005–06. Health and Welfare Expenditure Series no. 30. Cat. no. HWE 37. Canberra: AIHW.
Barnard PD 1993. National Oral Health Survey Australia 1987–1988. Canberra: Australian Government Publishing Service.
Benyamini Y, Leventhal H & Leventhal EA 2004. Self-rated oral health as an independent predictor of self-rated general health, self-esteem and life satisfaction. Social Science & Medicine 59(5):1109–16.
Bergman JD, Wright FA & Hammond RH 1991. The oral health of the elderly in Melbourne. Australian Dental Journal 36(4):280–5.
Brennan DS & Spencer AJ 2004. Changes in caries experience among Australian public dental patients between 1995/96 and 2001/02. Australian and New Zealand Journal of Public Health 28(6):542–8.
Brennan DS, Spencer AJ & Roberts-Thomson KF 2007. Caries experience among 45–54-year-olds in Adelaide, South Australia. Australian Dental Journal 52(2):122–7.
Brennan DS, Spencer AJ & Slade GD 2000. Caries experience among publicly-funded dental patients in Australia, 1995–96: type of care and geographic location. Australian Dental Journal 45(1):37–45.
Brennan DS, Spencer AJ & Slade GD 2001. Prevalence of periodontal conditions among public-funded dental patients in Australia. Australian Dental Journal 46(2):114–21.
Chalmers JM, Carter KD, Fuss JM, Spencer AJ & Hodge CP 2002. Caries experience in existing and new nursing home residents in Adelaide, Australia. Gerodontology 19(1):30–40.
Chalmers JM, Carter KD & Spencer AJ 2002. Caries incidence and increments in community-living older adults with and without dementia. Gerodontology 19(2):80–94.
Chalmers JM, Carter KD & Spencer AJ 2005. Caries incidence and increments in Adelaide nursing home residents. Special Care Dentistry 25(2):96–105.
Chalmers JM, Hodge C, Fuss JM, Spencer AJ & Carter KD 2002. The prevalence and experience of oral diseases in Adelaide nursing home residents. Australian Dental Journal 47(2):123–30.
Coates E, Slade GD, Goss AN & Gorkic E 1996. Oral conditions and their social impact among HIV dental patients. Australian Dental Journal 41(1):33–6.
Coates EA, Brennan D, Logan RM, Goss AN, Scopacasa B, Spencer AJ et al. 2000. Hepatitis C infection and associated oral health problems. Australian Dental Journal 45(2):108–14.
Dawson AS & Smales RJ 1994. Dental health changes in an Australian Defence Force population. Australian Dental Journal 39(4):242–6.
The National Survey of Adult Oral Health 2004–06: Australian Capital Territory 85
Dillman DA 2000. Mail and internet surveys: The tailored design method, 2nd edn. New York: John Wiley Company.
Elias AC & Sheiham A 1998. The relationship between satisfaction with mouth and number of position of teeth. Journal of Oral Rehabilitation 25:649–61.
Endean C, Roberts-Thomson K & Wooley S 2004. Anangu oral health: The status of the Indigenous population of the Anangu Pitjantjatjara lands. Australian Journal of Rural Health 12(3):99–103.
Hopcraft M & Morgan MV 2003a. Dental caries experience in a young adult military population. Australian Dental Journal 48(2):125–9.
Hopcraft MS & Morgan MV 2003b. Exposure to fluoridated drinking water and dental caries experience in Australian army recruits, 1996. Community Dentistry and Oral Epidemiology 31(1):68–74.
Hopcraft M & Morgan MV 2005. Dental caries experience in Australian Army recruits 2002–2003. Australian Dental Journal 50(1):16–20.
Hopcraft MS & Morgan MV 2006. Pattern of dental caries experience on tooth surfaces in an adult population. Community Dentistry and Oral Epidemiology 34(3):174–83.
Kingsford Smith D & Szuster F 2000. Aspects of tooth decay in recently arrived refugees. Australian and New Zealand Journal of Public Health 24(6):623–6.
Loe H & Silness J 1963. Periodontal disease in pregnancy: 1. Prevalence and severity. Acta Odontologica Scandinavica 21:533–51.
Marino R, Calache H, Wright C, Morgan M, Schofield SM & Minichiello V 2007. Profile of the oral health among ambulant older Greek and Italian migrants living in Melbourne. Australian Dental Journal 52(3):198–204.
Marino R, Wright FA & Minas IH 2001. Oral health among Vietnamese using a community health centre in Richmond, Victoria. Australian Dental Journal 46(3):208–15.
McGrath C & Bedi R 2002. Population based norming of the UK oral health related quality of life measure (OHQoL–UK). British Dental Journal 193:521–4.
Morgan MV, Stonnill A & Laslett AM 1992. Dental caries amongst Royal Australian Navy recruits, 1988. Australian Dental Journal 37(3):201–4.
NHANES (National Health and Nutrition Examination Survey). Dental examiners’ procedures manual. Hyattsville, MD: US Department of Health and Human Services, Centers for Disease Control and Prevention, National Center for Health Statistics. Viewed 14 February 2007 <http://www.cdc.gov/nchs/data/nhanes/nhanes_03_04/DentalExaminers-2004.pdf>.
Osborn M, Butler T & Barnard PD 2003. Oral health status of prison inmates–New South Wales, Australia. Australian Dental Journal 48(1):34–8.
Saub R & Evans RW 2001. Dental needs of elderly hostel residents in inner Melbourne. Australian Dental Journal 46(3):198–202.
Sheiham A, Steele JG, Marcenes W, Finch S & Walls AW 2002. The relationship between oral health status and body mass index among older people: a national survey of older people in Great Britain. British Dental Journal 192:703–6.
Slade GD & Spencer AJ 1995. Periodontal attachment loss among adults aged 60+ in South Australia. Community Dentistry and Oral Epidemiology 23(4):237–42.
86 The National Survey of Adult Oral Health 2004–06: Australian Capital Territory
Slade GD & Spencer AJ 1997. Distribution of coronal and root caries experience among persons aged 60+ in South Australia. Australian Dental Journal 42(3):178–84.
Slade GD, Spencer AJ, Gorkic E & Andrews G 1993. Oral health status and treatment needs of non-institutionalized persons aged 60+ in Adelaide, South Australia. Australian Dental Journal 38(5):373–80.
Slade GD, Spencer AJ & Roberts-Thomson KF (eds) 2007. Australia’s dental generations: The National Survey of Adult Oral Health 2004–06. AIHW cat. no. DEN 165. Canberra: Australian Institute of Health and Welfare (Dental Statistics and Research Series No. 34).
Smith K, Kruger E, Dyson K & Tennant M 2007. Oral health in rural and remote Western Australian indigenous communities: a two-year retrospective analysis of 999 people. International Dental Journal 57(2):93–9.
Surgeon General 2000. The health consequences of smoking: A report of the Surgeon General. Atlanta, Georgia: U.S. Department of Health and Human Services, Centers for Disease Control and Prevention, National Center for Chronic Disease Prevention and Health Promotion, Office on Smoking and Health.
Thomson WM, Slade GD & Spencer AJ 1995. Dental caries experience and use of prescription medications among people aged 60+ in South Australia. Gerodontology 12(12):104–10.
Wright FA, Hammond RH & Lewis JM 1994. Changes in periodontal conditions of adults from Melbourne, Australia. International Dental Journal 44(3):207–14.
The National Survey of Adult Oral Health 2004–06: Australian Capital Territory 87
88 The National Survey of Adult Oral Health 2004–06: Australian Capital Territory
List of tables
Table 1: Distribution of examiners and examinations among states and territories .................................7 Table 2: Periods of data collection in states and territories .........................................................................11 Table 3: Number and percentage of people sampled, interviewed and examined .................................12 Table 4: Percentage of people with selected sociodemographic and dental access characteristics in
the ACT population and three age groups .....................................................................................15 Table 5: Percentage of adults with complete tooth loss...............................................................................17 Table 6: Percentage of people with fewer than 21 teeth ..............................................................................19 Table 7: Percentage of dentate people who wear denture(s) ......................................................................21 Table 8: Average number of teeth per person missing due to pathology.................................................23 Table 9: Percentage of people with untreated coronal decay .....................................................................25 Table 10: Percentage of people with untreated root decay ...........................................................................27 Table 11: Percentage of people with one or more filled teeth.......................................................................29 Table 12: Average number of decayed, missing or filled teeth per person.................................................31 Table 13: Percentage of people with moderate or severe periodontitis.......................................................33 Table 14: Percentage of people with 4+ mm periodontal pocket depth......................................................35 Table 15: Percentage of people with 4+ mm clinical attachment loss..........................................................37 Table 16: Percentage of people with gingival inflammation.........................................................................39 Table 17: Percentage of people visiting dentist within last 12 months........................................................41 Table 18: Percentage of people who attended a private dental practice at last dental visit .....................43 Table 19: Percentage of people who paid for their last dental visit .............................................................45 Table 20: Percentage of people who received government-subsidised dental care in private sector .....47 Table 21: Percentage of people who usually visit a dental professional at least once a year ...................49 Table 22: Percentage of people who have a dentist they usually attend.....................................................51 Table 23: Percentage of people who usually visit a dentist for a check-up.................................................53 Table 24: Percentage of people who avoided or delayed dental care..........................................................55 Table 25: Percentage of people who reported that cost had prevented recommended
dental treatment .................................................................................................................................57 Table 26: Percentage of people who would have a lot of difficulty paying a $100 dental bill .................59 Table 27: Percentage of people avoiding foods due to dental problems.....................................................61 Table 28: Percentage of people rating their oral health fair or poor ............................................................63 Table 29: Percentage of people experiencing toothache ................................................................................65 Table 30: Percentage of people experiencing orofacial pain .........................................................................67 Table 31: Percentage of people who need dentures .......................................................................................69 Table 32: Percentage of people who need an extraction or filling................................................................71 Table 33: Percentage of people perceiving a need for a check up ................................................................73 Table 34: Percentage of people perceiving a need for treatment within 3 months ....................................75 Table 35: Age-standardised comparison of health cardholders and non-health cardholders .................77 Table 36: Age-standardised comparison of the dentally insured and the uninsured ...............................79