act insurance authority annual report 2010-2011 · australian capital territory insurance authority...
TRANSCRIPT

2010-11
ANNUAL REPORT
AUSTRALIAN CAPITAL TERRITORY INSURANCE AUTHORITY
NOMINAL DEFENDANT
2010-11
ANNUAL REPORT

ANNUAL REPORT
2010-11 AUSTRALIAN CAPITAL TERRITORY INSURANCE AUTHORITY
ANNUAL REPORT
2010-11 NOMINAL DEFENDANT

AUSTRALIAN CAPITAL TERRITORY INSURANCE AUTHORITY ANNUAL REPORT 2010-2011
ACT INSURANCE AUTHORITY
The Australian Capital Territory Insurance Authority is established under Section 7 of the ACT Insurance Authority Act 2005. The Authority commenced operations on 1 April 2001 to replace the Insurance Management Account that was introduced from 1 July 1998. The Authority meets the insurable claims and losses of ACT Government agencies.
The Authority reports to the Treasurer and is financed through risk-based premiums that reflect the asset holdings and liability risks faced by each agency.
© This work is copyright. Apart from any use as permitted under the Copyright Act 1968, no part may be reproduced by any process without written permission from the Territory Records Office, Shared Services, Treasury Directorate, ACT Government.
GPO Box 158, Canberra City ACT 2601.
Produced by Publishing Services for the ACT Insurance Authority
Printed on recycled paper
Publication No 11/1103
The Authority may be contacted at:
GPO Box 158 Canberra ACT 2601
Level 3, Nara Centre, 1 Constitution Avenue, Civic 2601
Further information is available from:
John Fletcher General Manager
ACT Insurance Authority
Phone: (02) 620 70268 Fax: (02) 620 70301 E-mail: john.fletcher @act.gov.au Website: http://www.treasury.act.gov.au/actia/
ISBN-13: 978-0-642-60572-6 ISBN-10: 0-642-60572-6 © Australian Capital Territory, Canberra 2011
2

AUSTRALIAN CAPITAL TERRITORY INSURANCE AUTHORITY ANNUAL REPORT 2010-2011 33
TRANSMITTAL CERTIFICATE

AUSTRALIAN CAPITAL TERRITORY INSURANCE AUTHORITY ANNUAL REPORT 2010-20114

AUSTRALIAN CAPITAL TERRITORY INSURANCE AUTHORITY ANNUAL REPORT 2010-2011
CONTENTS Transmittal Certificate 3
SECTION A: PERFORMANCE AND FINANCIAL MANAGEMENT REPORTING 7
A.1 The Organisation 7
A.2 Overview 8
A.3 Highlights 8
A.4 Outlook 9
A.5 Management Discussion and Analysis 10
A.6 Financial Report 14
A.7 Statement of Performance 63
A.8 Analysis of Agency Performance 70
SECTION B: CONSULTATION AND SCRUTINY REPORTING 73
B.1 Community Engagement 73
B.2 Internal & External Scrutiny 73
SECTION C: LEGISLATIVE AND POLICY BASED REPORTING 75
C.1 Risk Management and Internal Audit 75
C.2 Fraud Prevention 76
C.3 Public Interest Disclosure 76
C.4 Freedom of Information 77
C.5 Internal Accountability 77
C.6 HR Performance 78
C.7 Staffing Profile 79
C.8 Learning and Development 81
C.9 Workplace Health and Safety 81
C.10 Workplace Relations 82
C.11 Strategic Bushfire Management Plan 82
C.12 Strategic Asset Management 82
C.13 Government Contracting 82
C.15 Territory Records 83
C.16 Human Rights Act 2004 83
C.17 Commissioner for the Environment 83
C.18 ACT Multicultural Strategy 2010–13 83
C.19 Aboriginal and Torres Strait Islander Reporting 83
C.20 Ecologically Sustainable Development 84
C.21 ACT Women’s Plan 2010–2015 84
C.22 Model Litigant Guidelines 84
ANNEXED REPORT: OFFICE OF THE NOMINAL DEFENDANT ACT 85
The Organisation 85
Freedom of Information 87
Glossary 124
Alphabetical Index 126
5

AUSTRALIAN CAPITAL TERRITORY INSURANCE AUTHORITY ANNUAL REPORT 2010-20116

AUSTRALIAN CAPITAL TERRITORY INSURANCE AUTHORITY ANNUAL REPORT 2010-2011
SECTION A: PERFORMANCE AND FINANCIAL MANAGEMENT REPORTING
A.1 THE ORGANISATION The Australian Capital Territory Insurance Authority (the Authority) is established under Section 7 of the ACT Insurance Authority Act 2005.
As the ACT Government’s captive insurer for all ACT Government Directorates and statutory authorities, we meet the insurable claims and losses of ACT Government agencies.
The Authority works to protect the assets and services of the Territory by providing risk management support and insurance services to a large and diverse client base.
The portfolio represents just over $21 billion of insured assets, with annual premium revenue of $50 million, and $396.4 million in investments and other assets.
The Authority reports to the Treasurer through the Director-General Treasury and is financed through risk-based premiums that reflect the asset holdings and liability risks faced by each agency.
A.1.1 Principal Objectives
The objectives of the Authority are to:
• carry out the business of insurer of Territory risks;
• take out insurance of Territory risks with other entities;
• satisfy or settle claims in relation to Territory risks;
• with the Treasurer’s approval take action, for the realising, enforcing, assigning or extinguishing rights against third parties arising out of or in relation to its business, including, for example:
- taking possession of, dealing with or disposing of, property; or
- carrying on a third party’s business as a going concern;
• develop and promote good practices for the management of Territory risks;
• give advice to the Treasurer about insurance and the management of Territory risks;
• carry out the role of the Nominal Defendant of the ACT; and
• administer, on behalf of and under agreement with the Chief Minister and Cabinet Directorate, the Default Insurance Fund.
A.1.2 Functions
The functions of the Authority are specified in Section 8 of the Insurance Act 2005 and include:
• carrying on the business of insurer of Territory risks;
• insuring of Territory risks with other entities;
• managing claims in relation to Territory risks;
• promoting good risk management practices; and
• giving advice to the Minister about insurance and the management of Territory risks
The ACTIA operational model is focused on satisfying the Authority’s objectives and functions by taking a leadership role to reduce the total cost of risk to the Territory and individual agencies.
This focus leverages on the integration of core functions as the:
• Insurer and reinsurer of Territory risks
• Risk management advisor to Government
• Insurance advisor to Government.
A.1.3 Clients
The Authority insures all ACT Government Directorates and Statutory Authorities. The core services provided to Directorates are: insurance via indemnity agreements, claims and risk management services. The insurance coverage provided is broad form cover that includes:
• public liability:
• medical malpractice;
• professional indemnity;
• property damage; and
• others including standing timber, specialised motor, overseas travel, directors and officers and financial crime.
7
AUSTRALIAN CAPITAL TERRITORY INSURANCE AUTHORITY ANNUAL REPORT 2010-2011
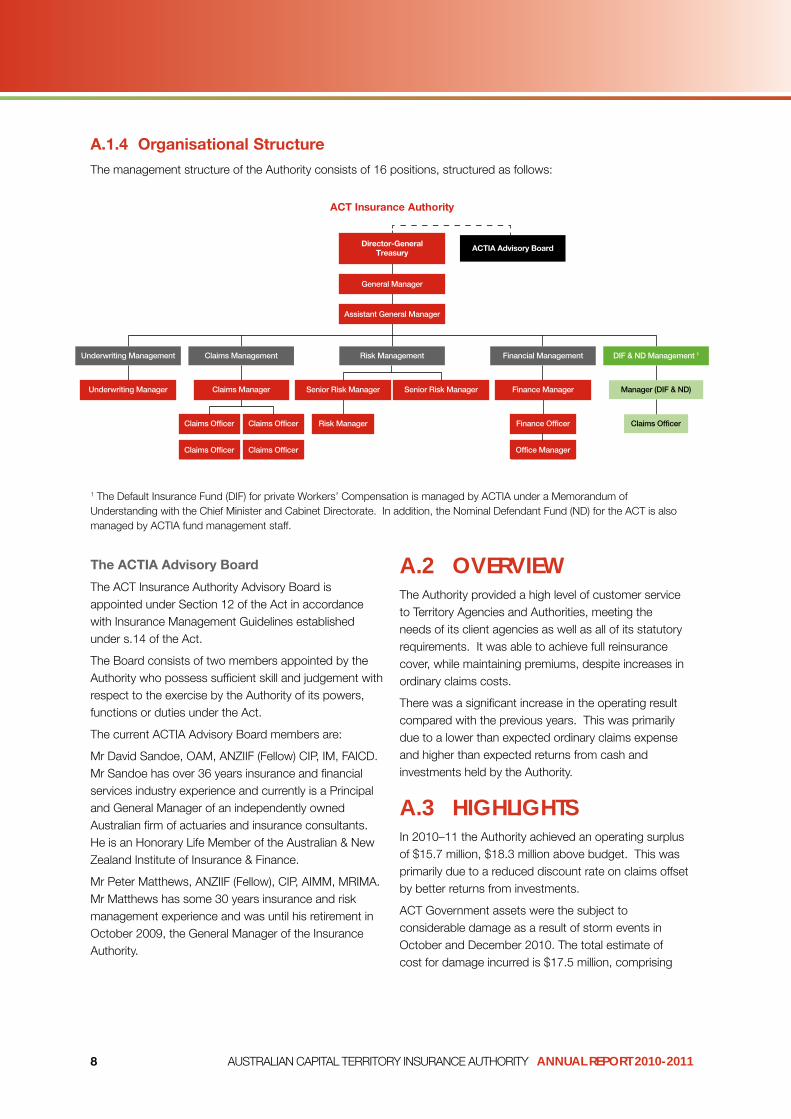
A.1.4 Organisational Structure
The management structure of the Authority consists of 16 positions, structured as follows:
ACT Insurance Authority
Director-General Treasury ACTIA Advisory Board
General Manager
Assistant General Manager
Risk Management
Senior Risk Manager
Claims Officer
Claims Officer
Claims Officer
Claims Officer Office Manager
Finance Officer Claims Officer Risk Manager
Senior Risk Manager
Underwriting Management
Underwriting Manager
Claims Management
Claims Manager
Financial Management
Finance Manager
DIF & ND Management 1
Manager (DIF & ND)
1 The Default Insurance Fund (DIF) for private Workers’ Compensation is managed by ACTIA under a Memorandum of Understanding with the Chief Minister and Cabinet Directorate. In addition, the Nominal Defendant Fund (ND) for the ACT is also managed by ACTIA fund management staff.
The ACTIA Advisory Board
The ACT Insurance Authority Advisory Board is appointed under Section 12 of the Act in accordance with Insurance Management Guidelines established under s.14 of the Act.
The Board consists of two members appointed by the Authority who possess sufficient skill and judgement with respect to the exercise by the Authority of its powers, functions or duties under the Act.
The current ACTIA Advisory Board members are:
Mr David Sandoe, OAM, ANZIIF (Fellow) CIP, IM, FAICD. Mr Sandoe has over 36 years insurance and financial services industry experience and currently is a Principal and General Manager of an independently owned Australian firm of actuaries and insurance consultants. He is an Honorary Life Member of the Australian & New Zealand Institute of Insurance & Finance.
Mr Peter Matthews, ANZIIF (Fellow), CIP, AIMM, MRIMA. Mr Matthews has some 30 years insurance and risk management experience and was until his retirement in October 2009, the General Manager of the Insurance Authority.
A.2 OVERVIEW The Authority provided a high level of customer service to Territory Agencies and Authorities, meeting the needs of its client agencies as well as all of its statutory requirements. It was able to achieve full reinsurance cover, while maintaining premiums, despite increases in ordinary claims costs.
There was a significant increase in the operating result compared with the previous years. This was primarily due to a lower than expected ordinary claims expense and higher than expected returns from cash and investments held by the Authority.
A.3 HIGHLIGHTS In 2010–11 the Authority achieved an operating surplus of $15.7 million, $18.3 million above budget. This was primarily due to a reduced discount rate on claims offset by better returns from investments.
ACT Government assets were the subject to considerable damage as a result of storm events in October and December 2010. The total estimate of cost for damage incurred is $17.5 million, comprising
8

AUSTRALIAN CAPITAL TERRITORY INSURANCE AUTHORITY ANNUAL REPORT 2010-2011
mainly of damage to infrastructure such as roads and storm water assets, with some building damage. ACTIA claims management staff provided assistance to affected agencies in the preparation and documentation of their claims. The Authority anticipates making a recovery of $12.5 million from reinsurers.
The public liability claims arising from the 2003 bushfires remain outstanding as legal action continues in the ACT Magistrates Court. The Territory has settled with all but one of the plaintiffs, a group known collectively as the “Stacks” plaintiffs.
The Authority has completed a review of the ACT Government Risk Management Policy for consideration by Government in 2011–12. The Authority’s risk management team have provided a range of advisory and training services to client agencies in support of risk management activities.
ACTIA continues to provide assistance to agencies on insurance issues relating to contracts with external bodies. Staff also provided evidence of the Government’s insurance when required and made arrangements for special insurance cover for events where this was warranted by the level of risk.
The ACTIA Advisory Board continued to provide important and valuable input to the Authority, particularly in relation to the reinsurance program and improvements to risk and claims management.
A.4 OUTLOOK It is almost certain that the cost of reinsurance premiums will increase in the coming years as the insurance market hardens and as the impact of natural disasters in Australia and internationally is factored into property reinsurance premiums. Classes other than property continue to perform well and any increases should be modest, market driven increases.
While improved claims and incident reporting practices by agencies has led to an increase in estimated liabilities, the number of claims reported is stabilizing. That said, the portfolio is extremely volatile given the heavy bias towards liability risks.
ACTIA will continue working with agencies to develop strategies to reduce the incidence and cost of insurance claims against the Government by promoting the implementation of good risk management practices.
ACTIA will further assist agencies with the provision of risk management training for agency managers and
staff, and to develop tailored risk training programs for their staff to address specific needs. These courses will provide training and assistance on general risk management principles and procedures that will guide agencies in the identification, assessment and treatment of risks.
The Authority intends to implement the following key strategies to achieve its objectives:
• provide professional advice to Government and Territory agencies on insurance and risk management issues;
• deliver a value for money reinsurance program to protect the Territory budget;
• continue to maximise reinsurance recoveries;
• review the Territory asset register as part of the insurance renewal process;
• develop business practices which will enable the Authority to achieve best practice results, and if feasible, reduce premiums for clients;
• review the ACTIA business continuity and risk management plan;
• proactively manage claims against the Territory in consultation with agency stakeholders and in accordance with the ACT model litigant requirements;
• conduct regular reviews of existing claims to ensure that appropriate management is being applied and that realistic claim estimates are included in financial statements;
• facilitate agency access to the claims reporting and data analysis to support a risk managed approach to operational and asset management;
• continue to assist agencies with the implementation of the ACT Government Risk Management Framework;
• work with selected agencies to reduce the number and severity of incidents and ultimate claims cost;
• deliver to agencies a program of general and targeted risk management training;
• administer the Office of the Nominal Defendant of ACT; and
• administer, on behalf of the Chief Minister’s Directorate, the Default Insurance Fund.
9

AUSTRALIAN CAPITAL TERRITORY INSURANCE AUTHORITY ANNUAL REPORT 2010-2011
A.5 MANAGEMENT DISCUSSION AND ANALYSIS General Overview
The Australian Capital Territory Insurance Authority (the Authority) is established under Section 7 of the Insurance Authority Act 2005.
Objectives
The key objectives of the ACT Insurance Authority are to:
• carry on the business of insurer of Territory risks;
• take out insurance of Territory risks with other entities;
• satisfy or settle claims in relation to Territory risks;
• with the Treasurer’s approval, take action for the realising, enforcing, assigning or extinguishing rights against third parties arising out of or in relation to its business, including, for example –
(i) taking possession of, dealing with or disposing of, property; or
(ii) carrying on a third parties business as a going concern;
• develop and promote good practices for the management of Territory risks;
• give advice to the Minister about insurance and the management of Territory risks;
• carry out the role of the Nominal Defendant of the ACT; and
• administer, on behalf of and under agreement with the Chief Minister and Cabinet Directorate, the Default Insurance Fund.
Summary of the Authority’s Operations
The Authority was established to insure the Territory. It operates as a ‘captive insurer’. This means that it can only insure the Territory’s risks. The Authority operates on a cost recovery basis by collecting premiums from ACT Government agencies. The Authority’s operating costs are largely driven by provisioning for future claims and current claims expense.
For the 2010–11 financial year, the operating result is $15.7 million. The Authority made a small underwriting gain due predominately to $9.3 million higher than expected ordinary reinsurance recoveries. Return from investments was $6.3 million higher than expected supporting an operating result of $18.3 million higher than budgeted.
In relation to the balance sheet, the Authority maintains a reasonable investment balance in order to meet the cost of future claims. The Authority’s financial position maintains reasonable liquidity on its balance sheet in terms of coverage of liabilities.
Risk Management
The Authority has developed and implemented a broad risk management plan in accordance with the Australian/ New Zealand Standard on risk management AS/NZS ISO 31000:2009 and the ACT Government’s “Enterprise Wide Risk Management Framework”. The Authority’s plan identifies and details risks and control measures and treatment action plans for risks in the financial, business and IT dependencies.
The Authority’s risk management plan identifies the following potential risks that may influence the future financial position of the Authority.
• Inadequate cash reserves within the Authority to meet the cost of future insurance claims on the Territory;
• Insufficient reinsurance coverage due to reduced reinsurance market capacity;
• Reduced investment income due to a subdued investment market;
• Escalating claims cost due to poor risk management in agencies; and
• Increases in or late notification of claims by agencies, and data errors may result in either the claim provision being misstated or reinsurers revising insurance terms. There is also the possibility that reinsurers may withdraw cover previously agreed. The Authority will continue to develop better claims reporting and recording practices.
Financial Performance
The following financial information is based on audited Financial Statements for 2009–10 and 2010–11, and the forward estimates contained in the 2010 2011 Budget Paper Number 4.
The Authority’s operating result for 2010–11 is a surplus of $15.7 million, a difference of $18.3 million from Budget. The outcome was due predominately to higher levels of revenue: reinsurance recoveries from ordinary claims were higher than budget as was interest, gains and disbursements from investment activities. This was partially offset by an improvement in ordinary claims expense as result of lower claims numbers and settlement sizes.
10

AUSTRALIAN CAPITAL TERRITORY INSURANCE AUTHORITY ANNUAL REPORT 2010-2011
Total Expenditure
1. Components of Expenditure
For the financial year ended 30 June 2011, the Authority recorded a total expenditure for ordinary activities of $62.8 million and bushfire related costs of $0.8 million. The largest components of the Authority’s ordinary expenditure for 2010–11 were insurance claims and related costs, which represent $49.0 million, and the purchasing of reinsurance, representing $10.8 million.
For the financial year ended 30 June 2011, the Authority recorded a total expenditure for the 2003 Bushfires of $0.8 million which reflects the downwards revision of the outstanding public liability claims.
Figure 1 – Components of Expenditure (excluding bushfire revisions)
Salaries related 3%
Administration 2%
External insurance premiums 18%
Claims related ordinary 77%
2. Comparison to Budget
Expenditure
Total ordinary expenditure of $62.8 million was $2.7 million, or 4 percent lower than the 2010–11 budget of $65.5 million. This lower than budgeted expenditure was largely the result of:
• outwards reinsurance cost being less than budgeted by $1.8 million.
• a decrease in insurance claims expenditure of $0.8 million – actuarial assumptions were revised to take account of reduced discount rates, increased inflation and slower than anticipated claim payments.
• The small to medium claims class had lower than expected numbers reported and smaller settlement sizes. This was partially offset by unfavourable case development for existing open and newly reported large claims.
3. Comparison to 2009–10 Actual Expenditure
Total ordinary expenditure was $8.2 million, or 12 percent lower than the 2009–10 actual result. This largely reflects ordinary claims decreasing in value by $8.5 million due to changes in economic indicators and decreases in the size and number of small to medium claims settlements.
4. Future Trends
Total expenditure for 2011–12 is budgeted to decrease by $7.2 million from the 2010–11 actual result, predominately reflecting an overall lower cost of claims.
Total Income
1. Components of Income
For the financial year ended 30 June 2011, the Authority recorded a total ordinary income of $78.5 million and a reinsurance recovery from bushfires of $0.8 million, of which $50.1 million was received from insurance premiums. The remainder of the Authority’s ordinary income is derived from reinsurance and other recoveries of $9.8 million and investment returns of $18.6 million.
Figure 2 – Components of Income (excluding bushfire revision)
Reinsurance Recoveries 12%
Investment interest and disbursements 22%
Unrealised gain 1%
Annual insurance premiums 65%
2. Comparison to Budget
Revenue
Ordinary revenue for the year ending 30 June 2011 was $78.5 million, which was $15.6 million higher than the 2010–11 budget of $62.9 million. This increase is primarily due to better than anticipated investment returns of $6.3 million and an unanticipated reinsurance recovery on ordinary claims of $9.3 million.
3. Comparison to 2009–10 Actual Income
Revenue
Ordinary revenue of $78.5 million in 2010–11 was $14.3 million, or 22 percent higher than the 2009–10 actual result of $64.2 million. The increase was due to higher investment returns of $2.6 million, higher annual premiums of $2.0 million and reinsurance recoveries from ordinary claims of $9.5 million.
4. Future Trends
Total income for 2011–12 is budgeted to decrease by $6.2 million, from the 2010–11 actual result, predominately reflecting an expected decrease in ordinary reinsurance recoveries.
11

AUSTRALIAN CAPITAL TERRITORY INSURANCE AUTHORITY ANNUAL REPORT 2010-2011
Authority Financial Position
Total Assets
1. Components of Total Assets
The total asset position as at 30 June 2011 is $396.4 million. The Authority held $251.3 million of its assets in cash equivalents and short term investments, $59.5.million in long-term investments and $81.2 million were anticipated reinsurance recoveries.
Figure 3 – Total Assets as at 30 June 2011
Reinsurance Recoveries 20%
Receivables 1%
Long term investments 15%
Short term investments 64%
2. Comparison to Budget
The total asset position as at 30 June 2011 is $396.4 million, $51.1 million lower than the 2010–11 budget of $447.5 million. The decrease primarily reflects a reduction in reinsurance recoveries for the public liability bushfire claim not anticipated in the budget. This
Table 1 – Current Ratio
was partially offset by better than anticipated reinsurance recoveries on normal claims and higher investment balances.
3. Comparison to 2009–10 Actuals
The Authority’s total asset position of $396.4 million is $50.7 million higher than the 2009–10 actual result of $345.7 million, due to an increase in investments held to meet the cost of future claims and the recognition of reinsurance recoveries from the 2010 storms.
4. Liquidity
‘Liquidity’ is the ability of the Authority to satisfy its short-term debts as they fall due. A common indicator for liquidity is the current ratio, which compares the ability to fund short term liabilities from short-term assets. A ratio of less than 1-to-1 may indicate a reliance on the next financial year’s annual insurance premiums to meet short-term debts. Table 1 indicates the liquidity position of the Authority.
The Authority’s current ratio for the financial year as at 30 June 2011 was 5.5 to 1, which is lower than the budgeted current ratio of 6.0:1. The decline reflects a slight increase in current outstanding claims liabilities.
The Authority is expecting to maintain a strong level of liquidity in the forward years with the current ratio at approximately 4:1 all years.
Description
Prior Year Actual $’000s 2009–10
Current Year Budget $’000s 2010–11
Current Year Actual $’000s 2010–11
Forward Year Budget $’000s 2011–12
Forward Year Budget $’000s 2012‑13
Forward Year Budget $’000s 2013‑14
Current 215,665 256,842 256,111 267,996 292,557 321,549 Assets
Current 39,809 42,756 46,805 60,879 71,878 77,889 Liabilities
Current 5.4:1 6.0:1 5.5:1 4.4:1 4.1:1 4.1:1 Ratio
12

AUSTRALIAN CAPITAL TERRITORY INSURANCE AUTHORITY ANNUAL REPORT 2010-2011
Total Liabilities
The majority of the Authority’s total liabilities of $379.3 million relate to outstanding claims liabilities, $377.8 million.
The Authority’s liabilities for the year ended 30 June 2011 of $379.3 million were $47.6 million lower than the 2010–11 budget of $426.9 million due primarily to a reduction in the public liability claim estimate for the 2003 bushfire.
Total liabilities are $35.0 million higher than the 2009–10 actual result of $344.3 million due primarily to an increase in the ordinary claims provision as a result of changing economic and actuarial assumptions.
Figure 4 – Total Liabilities as at 30 June 2011
Outstanding claims - bushfire 21%
Outstanding claims - ordinary 79%
13

AUSTRALIAN CAPITAL TERRITORY INSURANCE AUTHORITY ANNUAL REPORT 2010-2011
A.6 FINANCIAL REPORT
14

AUSTRALIAN CAPITAL TERRITORY INSURANCE AUTHORITY ANNUAL REPORT 2010-2011 15

AUSTRALIAN CAPITAL TERRITORY INSURANCE AUTHORITY ANNUAL REPORT 2010-201116

AUSTRALIAN CAPITAL TERRITORY INSURANCE AUTHORITY ANNUAL REPORT 2010-2011 17

AUSTRALIAN CAPITAL TERRITORY INSURANCE AUTHORITY ANNUAL REPORT 2010-201118

AUSTRALIAN CAPITAL TERRITORY INSURANCE AUTHORITY ANNUAL REPORT 2010-2011 19

AUSTRALIAN CAPITAL TERRITORY INSURANCE AUTHORITY ANNUAL REPORT 2010-2011
ACT Insurance Authority Operating Statement
For the Year Ended 30 June 2011
Note No.
Actual 2011
Budget 2011
Actual 2010
$’000 $’000 $’000 Ordinary activities
Underwriting Gross Earned Premiums 7 50,125 50,163 48,124 Outwards Reinsurance 7 (10,752) (12,558) (10,829) Net Earned Premiums 8 39,373 37,605 37,295
Claims Expense Claims Expense - Bushfire
7 7
(49,007) (811)
(49,804)- (57,488)
66,557 Reinsurance (Losses)/Recoveries 7 9,710 392 (259) Reinsurance (Losses)/Recoveries - Bushfire 7 807 - (66,342) Other Underwriting (Expense)/Income 7 163 - 337 Net Incurred Claims 9 (39,138) (49,412) (57,195)
Underwriting Gain/(Loss) 7 235 (11,807) (19,900)
Other Revenue Interest Revenue 10 187 12,129 55 Distribution Revenue 10 17,046 - 14,718 Unrealised Gains from Investments 10 1,166 - 1,032 Other Revenue 10 151 128 148
18,550 12,257 15,953
Other (Expenses)/ Income Construction Industry Premium Insurance 10 (309) 43 -
(309) 43 -
General and Administration Employee Expenses
Superannuation Expenses 11 11
(1,565)(241)
(1,395) (248)
(1,390)(225)
Supplies and Services 12 (971) (1,454) (1,055)
(2,777) (3,097) (2,670)
Operating Surplus/ (Deficit) 15,699 (2,604) (6,617)
Total Comprehensive Income/ (Deficit) 15,699 (2,604) (6,617)
The above Operating Statement should be read in conjunction with the accompanying notes.
\
20

AUSTRALIAN CAPITAL TERRITORY INSURANCE AUTHORITY ANNUAL REPORT 2010-2011
ACT Insurance Authority Balance Sheet
As at 30 June 2011
Note No.
Actual 2011
Budget 2011
Actual 2010
$’000 $’000 $’000
Current Assets Cash and Cash Equivalents 13 42 63 396 Investments 13 251,235 251,991 209,113 Receivables 14 3,624 2,008 3,571 Reinsurance Recoveries 15 517 1,030 694 Reinsurance Recoveries – Bushfire 15 - 1,664 1,207 Prepayments 18 693 86 684
Total Current Assets 256,111 256,842 215,665
Non Current Assets Investments 13 59,491 53,294 59,457 Reinsurance Recoveries 15 10,424 2,076 1,802 Reinsurance Recoveries - Bushfire 15 70,278 135,160 68,289 Prepayments 18 115 140 468
Total Non-Current Assets 140,308 190,670 130,016
Total Assets 396,419 447,512 345,681
Current Liabilities Payables 16 150 151 220
Outstanding Claims 17 43,514 40,484 35,184 Outstanding Claims - Bushfire 17 2,218 1,771 3,316 Employee Benefits 19 482 263 405 Other Liabilities 18 693 87 684
Total Current Liabilities 47,057 42,756 39,809
Non-Current Liabilities Outstanding Claims 17 254,156 238,650 225,095 Outstanding Claims - Bushfire 17 77,908 145,117 78,843 Employee Benefits 19 57 192 39 Other Liabilities 18 115 140 468
Total Non-Current Liabilities 332,236 384,099 304,445
Total Liabilities 379,293 426,855 344,254
Net Assets 17,126 20,657 1,427
Equity Contributed Equity 43,855 63,855 43,855 Accumulated (Deficits) (26,729) (43,198) (42,429)
Total Equity 17,126 20,657 1,427
The above Balance Sheet should be read in conjunction with the accompanying notes.
\
21

AUSTRALIAN CAPITAL TERRITORY INSURANCE AUTHORITY ANNUAL REPORT 2010-2011
ACT Insurance Authority Statement of Changes in Equity
For the Year Ended 30 June 2011
Accumulated Contributed Total Funds/ Equity Equity Original
(Deficits) Actual Actual Budget Actual 2011 2011 2011
2011 $’000 $’000 $’000 $’000
Balance at the Beginning of the Reporting (42,429) 43,855 1,427 13,261 Period
Comprehensive Income
Operating Surplus/(Deficit) 15,699 - 15,699 (2,604)
Total Comprehensive Income/ (Deficit) 15,699 - 15,699 (2,604)
Transactions Involving Equity Holders Affecting Accumulated Funds
Capital Injections - - - 10,000
Balance at the End of the Reporting Period (26,730) 43,855 17,126 20,657
Accumulated Contributed Total Funds/ Equity Equity
(Deficit) Actual Actual Actual 2010 2010
2010 $’000 $’000 $’000
Balance at the Beginning of the Reporting Period (35,812) 43,855 8,044
Comprehensive Income
Operating (Deficit) (6,617) - (6,617)
Total Comprehensive Income/ (Deficit) (6,617) - (6,617)
Transactions Involving Equity Holders Affecting Accumulated Funds
Capital Injections - - -
Balance at the End of the Reporting Period (42,429) 43,855 1,427
The above Statement of Changes in Equity should be read in conjunction with the accompanying notes.
\
22

AUSTRALIAN CAPITAL TERRITORY INSURANCE AUTHORITY ANNUAL REPORT 2010-2011
ACT Insurance Authority Cash Flow Statement
For the Year Ended 30 June 2011
Note Actual Budget Actual 2011 2011 2010
$’000 $’000 $’000
Cash Flows from Operating Activities Ordinary Activities Insurance Premiums Received 50,125 50,163 48,685 Net Workers’ Compensation Premiums 6 - -Net Construction Industry Premiums 380 41 (1,024) External Insurance Premiums (11,329) (12,557) (11,418) Insurance Claims Payments (11,597) (11,734) (11,664) Insurance Claims Payments – Bushfire (2,842) (2,412) (3,172) Reinsurance and Other Recoveries Received 2,309 1,366 2,297 Reinsurance Recoveries Received - Bushfire - - -
27,052 24,867 23,704 Other
Interest Received 10,905 12,129 11,537 Distributions Received 5,160 - 3,039 Other Receipts 187 169 198
General and Administration Payments (2,666) (3,084) (2,714) Other Payments (3) - -
13,583 9,214 12,060
Net Cash Inflows from Operating Activities 23 40,635 34,080 35,764
Cash Flows from Financing Activities
Capital Injections - 10,000 -
Net Cash Inflows from Financing Activities - 10,000 -
Cash Flows from Investing Activities
Proceeds from Sale/ Maturities of Investments 1,133 911 -Purchase of Investments (42,122) (44,991) (35,430)
Net Cash (Outflows) from Investing Activities (40,989) (44,080) (35,430)
Net (Decrease)/ Increase in Cash Held (354) - 334
Cash and Cash Equivalents at the Beginning of the 396 63 62 Reporting Period
Cash and Cash Equivalents at the End of the Reporting Period
13 42 63 396
The above Cash Flow Statement should be read in conjunction with the accompanying notes.
23

AUSTRALIAN CAPITAL TERRITORY INSURANCE AUTHORITY ANNUAL REPORT 2010-2011
ACT Insurance Authority Statement of Appropriation
For the Year Ended 30 June 2011
Budget 2011
$’000
Total Appropriated
2011 $’000
Appropriation Drawn
2011 $’000
Appropriation Drawn
2010 $’000
Capital Injections 10,000 10,000 - -
The above Statement of Appropriation should be read in conjunction with the accompanying notes
Column Heading Explanations
The Budget column shows the amounts that appear in the Cash Flow Statement in the Statement of Intent. This amount also appears in Cash Flow Statement.
The Total Appropriated column is inclusive of all appropriation variations occurring after the Original Budget.
The Appropriation Drawn is the total amount of the appropriation received by the Authority during the year. This amount appears in the Cash Flow Statement.
Variance between ‘Total Appropriated’ and ‘Appropriation Drawn’
The difference between the Total Appropriated and Appropriation Drawn is due to additional funds not being required as a result of the Authority’s improved cash position.
24

AUSTRALIAN CAPITAL TERRITORY INSURANCE AUTHORITY ANNUAL REPORT 2010-2011
ACT INSURANCE AUTHORITY Notes to and Forming Part of the Financial Statements
For the Year Ended 30 June 2011
NOTE INDEX
Note Page
1 Objectives of the ACT Insurance Authority 26 2 Summary of Significant Accounting Policies 26 3 Change in Accounting Policy and Accounting Estimates and Correction of a Prior Period Error 32 4 Significant Accounting Judgements and Estimates 33 5 Actuarial Assumptions and Methods 34 6 Insurance Contracts – Risk Management Policies and Procedures 38 7 Underwriting Result 39 8 Net Earned Premiums 40 9 Net Incurred Claims 40 10 Other Revenue and Expenses 41 11 Employee and Superannuation Expenses 42 12 Supplies and Services 42 13 Cash, Cash Equivalents and Investments 43 14 Receivables 44 15 Reinsurance Recoveries 45 16 Payables 46 17 Outstanding Claims 46 18 Prepayments and Other Liabilities 54 19 Employee Benefits 54 20 Financial Instruments 55 21 Remuneration of Auditor 61 22 Contingent Liabilities and Contingent Assets 62 23 Cash Flow Reconciliation 62
25

AUSTRALIAN CAPITAL TERRITORY INSURANCE AUTHORITY ANNUAL REPORT 2010-2011
ACT INSURANCE AUTHORITY Notes to and Forming Part of the Financial Statements
For the Year Ended 30 June 2011
Note 1. Objectives of the ACT Insurance Authority Operations and Principal Activities of the ACT Insurance Authority
The ACT Insurance Authority (the Authority) was established on 1 April 2001. The Authority is operated under the Insurance Authority Act 2005. The objectives of the Authority are: to carry out the business of insurer of Territory risks; to take out insurance of Territory risks with other entities; to satisfy or settle claims in relation to Territory risks; to take action, with the Treasurer’s approval, for the realising, enforcing, assigning or
extinguishing rights against third parties arising out of or in relation to its business, including, for example:
- taking possession of, dealing with or disposing of, property; or - carrying on a third party’s business as a going concern;
to develop and promote good practices for the management of Territory risks; to give advice to the Treasurer about insurance and the management of Territory risks; to carry out the role of the Nominal Defendant of the ACT; and to administer, on behalf of and under agreement with the Chief Minister and Cabinet
Directorate, the Default Insurance Fund, established on 1 July 2006.
Note 2. Summary of Significant Accounting Policies (a) Basis of Accounting
The Financial Management Act 1996 (FMA) requires the preparation of financial statements for Territory Authorities.
The FMA and the Financial Management Guidelines issued under the Act, requires that a Territory Authority’s financial statements include: (i) an Operating Statement for the year; (ii) a Balance Sheet at the end of the year; (iii) a Statement of Changes in Equity for the year; (iv) a Cash Flow Statement for the year; (v) a Statement of Appropriation for the year; (vi) a summary of the significant accounting policies adopted for the year; and (vii) such other statements as are necessary to fairly reflect the financial operations of the Territory
Authority during the year and its financial position at the end of the year.
These general purpose financial statements have been prepared to comply with ‘Generally Accepted Accounting Principles’ (GAAP) as required by the FMA. The financial statements have been prepared in accordance with: (i) Australian Accounting Standards; and (ii) ACT Accounting and Disclosure Policies.
The financial statements have been prepared using the accrual basis of accounting, which recognises the effects of transactions and events when they occur. The financial statements have also been prepared according to the historical cost convention except for financial assets and liabilities at fair value through the Operating Statement.
These financial statements are presented in Australian dollars, which is the Authority’s functional currency.
The ACT Insurance Authority is an individual reporting entity.
(b) Premium Revenue
Direct premium revenue comprises amounts charged to the policyholders, but excludes duties, Goods and Services Tax (GST) and other amounts collected on behalf of third parties. The earned portion of premiums received and receivable is recognised as revenue. Premium revenue is treated as earned from the date of attachment of risk. All premiums are written and earned in the current period as all policies cover the period from 1 July 2010 to 30 June 2011. As a consequence, the Liability Adequacy Test, which considers the adequacy of unearned premium liability, does not apply as there are no unearned premiums in the period.
26

AUSTRALIAN CAPITAL TERRITORY INSURANCE AUTHORITY ANNUAL REPORT 2010-2011
ACT INSURANCE AUTHORITY Notes to and Forming Part of the Financial Statements
For the Year Ended 30 June 2011
Note 2. Summary of Significant Accounting Policies (Continued)
(c) Workers’ Compensation
The Authority processes the payment of the ACT Government workers’ compensation premium to Comcare, which levies a single premium covering all Government agencies. Each agency pays its share of the premium into the Authority for the purpose of financing the premium payment to Comcare. As the Authority is not underwriting this workers’ compensation business, but rather acting as an agent for the Whole of Government, the amounts involved are not included in premiums revenue and claims expense.
(d) Construction Industry Premiums and Other Insurance Contracts
The Authority arranges insurance cover for contract works, travel, aviation, standing timber and public liability for volunteers on behalf of all ACT government agencies. The Authority bears no risk on these contracts. Similar to worker’s compensation, each agency pays its share of the premium to the Authority for the purpose of financing the premium payment to an external insurer. As the Authority is not underwriting the business, but rather acting as an agent for the Whole of Government, the amounts involved are not included in premium revenue and claims expense.
(e) Cash and Cash Equivalents
For the purposes of the Cash Flow Statement and the Balance Sheet, cash includes cash at bank, cash on hand and demand deposits. Cash equivalents are short-term, highly liquid investments that are readily convertible to known amounts of cash and which are subject to an insignificant risk of changes in value.
(f) Receivables
All premium and other debtors are recognised at the amounts receivable as they are due for settlement no more than 30 days from the date of recognition. Collectibility of premium and other debtors is reviewed on an ongoing basis. Debts which are known to be uncollectible are written off. An allowance for impairment losses is raised when some doubt as to collection exists, to the extent that any relevant premium has been earned. The Authority assesses, at each reporting date, whether there is any indication that a receivable may be impaired. Receivables are also reviewed for impairment whenever events or changes in circumstances indicate that the carrying amount may not be recoverable.
(g) Outwards Reinsurance Premium
The Authority reinsures at a catastrophe level for those classes for which it accepts insurance, which includes insurance against:
loss, damage, or destruction of Territory assets; and the legal liabilities incurred by the Territory for third party property damage and injury to third
parties.
Premiums paid to reinsurers are recognised as an expense in accordance with the pattern of reinsurance service received.
27

AUSTRALIAN CAPITAL TERRITORY INSURANCE AUTHORITY ANNUAL REPORT 2010-2011
ACT INSURANCE AUTHORITY Notes to and Forming Part of the Financial Statements
For the Year Ended 30 June 2011
Note 2. Summary of Significant Accounting Policies (Continued)
(h) Claims
Claims expense and a liability for outstanding claims are recognised in the financial statements. The liability covers claims reported but not yet paid, incurred but not yet reported (IBNR), incurred but not enough reported (IBNER) and the anticipated direct and indirect costs of settling those claims. Claims outstanding are assessed by reviewing individual claim files and estimating changes in the ultimate cost of settling claims, IBNRs and settlement costs using statistics based on past experience and trends.
The Authority has used the services of an independent actuary, PricewaterhouseCoopers Actuarial Services, to provide a full assessment of outstanding claims. Christa Majoribanks is the actuary responsible for the valuation of outstanding claims and is a Fellow of the Institute of Actuaries Australia. The valuation for this report was completed in July 2011, based on data at 30 June 2011.
The liability for outstanding claims is measured as the central estimate of the present value of the expected future payments, against claims incurred at the reporting date under general insurance contracts issued by the Authority, with an additional risk margin to allow for the inherent uncertainty in the central estimate. The expected future payments are estimated on the basis of the ultimate cost of settling claims, which is affected by factors arising during the period to settlement such as normal inflation and superimposed inflation. Superimposed inflation refers to factors such as trends in court awards, for example increases in the level and period of compensation for injury. The expected future payments are then discounted to present value using the Commonwealth Government Bond risk free rate.
(i) Reinsurance and Other Recoveries Receivable
Reinsurance and other recoveries receivable on paid claims, reported claims not yet paid, IBNER and IBNR are recognised as revenue.
Recoveries receivable are assessed in a manner similar to the assessment of outstanding claims. Recoveries are measured at the present value of the expected future receipts, calculated on the same basis as the liability for outstanding claims described in Note 2 (h) ‘Claims’.
(j) Acquisition Costs
Under the Insurance Authority Act 2005, the Authority is responsible for managing the insurance costs of the Territory and Territory entities. The costs incurred in obtaining and recording policies of insurance (acquisition costs) are not material and are therefore not separately identified from other costs.
(k) Investments
Short-term investments and long-term investments held with the Territory Banking Account with the Territory Banking Account. The short-term in a unit trust called the Cash Enhanced Portfolio and the long-term investment in a unit trust called the Fixed Interest Portfolio. The price of units in the unit trusts fluctuate in value. The net gain or loss on investments consists of the fluctuation in price of the unit trusts between the end of the last reporting period and the end of this reporting period as well as any profit on the sale of units in the unit trusts (the profit being the difference between the price at the end of the last reporting period and the sale price). The net gains or losses do not include interest or dividend income.
The investments are measured at fair value with any adjustments to the carrying amount being recorded in the Operating Statement. Fair value is based on an underlying pool of investments which have quoted market prices at the reporting date.
Distributions from the Cash Enhanced Portfolio are paid monthly and those from the Fixed Interest Portfolio are paid quarterly.
28

AUSTRALIAN CAPITAL TERRITORY INSURANCE AUTHORITY ANNUAL REPORT 2010-2011
ACT INSURANCE AUTHORITY Notes to and Forming Part of the Financial Statements
For the Year Ended 30 June 2011
Note 2. Summary of Significant Accounting Policies (Continued)
(l) Payables
Payables are a financial liability and are measured at the fair value of the consideration received when initially recognised and at amortised cost subsequent to initial recognition, with any adjustments to the carrying amount being recorded in the Operating Statement. All amounts are normally settled within 30 days after the invoice date. Payables include trade payables, accrued expenses and other payables.
Trade payables represent the amounts owing for goods and services received prior to the end of reporting period and unpaid at the end of reporting period and relating to the normal operation of the Authority.
Accrued expenses represent goods and services provided by other parties during the period that are unpaid at the end of the reporting period and where an invoice has not been received by the end of the reporting period.
Other payables are those unpaid invoices that do not directly relate to the normal operations of the Authority.
(m) Employee Benefits
Employee benefits include wages and salaries, annual leave, long service leave and applicable on-costs. On-costs include annual leave, long service leave, superannuation and other costs that are incurred when employees take annual and long service leave. These benefits accrue as a result of services provided by employees up to the reporting date that remain unpaid. They are recorded as a liability and as an expense.
Wages and Salaries Accrued wages and salaries are measured at the amount that remains unpaid to employees at the end of the reporting period.
Annual and Long Service Leave Annual leave and long service leave wholly within the next 12 months is measured based on the estimated amount of remuneration payable when the leave is taken.
Annual and long service leave including applicable on-costs that do not fall due within the next 12 months are measured at the present value of estimated future payments to be made in respect of services provided by employees up to the end of the reporting date. Consideration is given to the present wage and salary levels, experience of employee departures and periods of service. At each reporting end, the estimated future payments are discounted using market yields on Commonwealth Government bonds with terms to maturity that match, as closely as possible, the estimated future cash flows. In 2010-11, the discount factor used to calculate the present value of these future payments is 92.2% (92.9% in 2009-10).
The long service leave liability is estimated with reference to the minimum period of qualifying service. For employees with less than the required minimum period of 7 years qualifying service, the probability the employees will reach the required minimum period has been taken into account in estimating the provision for long service leave and the applicable on-costs.
The provision for annual leave and long service leave includes estimated on-costs. As these on-costs only become payable if the employee takes annual and long service leave while in-service, the probability that the employees while take annual and long service leave while in service has been taken into account in estimating the liability for the on-costs.
Annual leave and long service leave liabilities are classified as current liabilities in the Balance Sheet where there are no unconditional right to defer the settlement of the liability for at least 12 months. However, where there is an unconditional right to defer settlement of the liability for at least 12 months, annual leave and long service leave have been classified as a non-current liability in the Balance Sheet.
(n) Rounding of Amounts
All amounts in the financial statements have been rounded to the nearest thousand dollars ($’000). Use of ‘-‘ represents zero amounts or amounts rounded down to zero.
29

AUSTRALIAN CAPITAL TERRITORY INSURANCE AUTHORITY ANNUAL REPORT 2010-2011
ACT INSURANCE AUTHORITY Notes to and Forming Part of the Financial Statements
For the Year Ended 30 June 2011
Note 2. Summary of Significant Accounting Policies (Continued)
(o) Comparative Figures
Budget Figures Budget information provided for 2010-11 matches the budget information contained in the Authority’s Statement of Intent. The Financial Management Act 1996 requires the financial statements to facilitate a comparison with the Statement of Intent.
Prior Year Comparatives Comparative information has been disclosed in respect of the previous period for all amounts reported in the financial statements except where an Australian Accounting Standard does not require comparative information to be disclosed.
Where the presentation or classification of items in the financial statements is amended, the comparative amounts have been reclassified where practical. Where a reclassification has occurred, the nature, amount and reason for the reclassification is provided.
(p) Current and Non-Current Items
Assets and liabilities are classified as current or non-current in the Balance Sheet and in the relevant notes. Assets are classified as current where they are expected to be realised within 12 months after the reporting date. Liabilities are classified as current when they are due to be settled within twelve months after the reporting date or the Authority does not have an unconditional right to defer settlement of the liability for at least twelve months after the reporting date.
Assets or liabilities which do not fall within the current classification are classified as non-current.
(q) Superannuation
Superannuation payments are made to the Territory Banking Account each year, to cover the Authority’s superannuation liability for the Commonwealth Superannuation Scheme (CSS) and the Public Sector Superannuation Scheme (PSS). This payment covers the CSS/PSS employer contribution but does not include the productivity component. The productivity component is paid direct to Comsuper by the Authority. The CSS and PSS are defined benefit superannuation plans meaning that the defined benefits received by employees are based on years of service and average final salary.
Superannuation payments have also been made directly to superannuation funds for those members of the Public Sector who are part of superannuation accumulation schemes. This includes the Public Sector Superannuation Scheme Accumulation Plan (PSSAP) and schemes of employee choice.
Superannuation employer contribution payments, for the CSS and PSS, are calculated by taking the salary level at an employee’s anniversary date and multiplying it by the actuarially assessed nominal CSS or PSS employer contribution rate for each employee. The productivity component payments are calculated by taking the salary level, at an employee’s anniversary date and multiplying it by the employer contribution rate (approximately 3%) for each employee. Superannuation payments for the PSSAP are calculated by taking the salary level, at an employee’s anniversary date, and multiplying it by the appropriate employer contribution rate. Superannuation payments for fund of choice arrangements are calculated by taking an employee’s salary each pay and multiplying it by the appropriate employer contribution rate.
A superannuation liability is not recognised in the Balance Sheet as the Superannuation Provision Account recognises the total Territory superannuation liability for the CSS and PSS, and Comsuper and the external schemes recognise the superannuation liability for PSSAP and other schemes respectively.
The ACT Government is liable for the reimbursement of the emerging costs of benefits paid each year to members of the CSS and PSS in respect of the ACT Government service provided after 1 July 1989. These reimbursement payments are made from the Superannuation Provision Account.
(r) Reporting Period
These financial statements state the financial performance, changes in equity and cash flows of the Authority for the year ended 30 June 2011 together with the financial position of the Authority as at 30 June 2011.
30

AUSTRALIAN CAPITAL TERRITORY INSURANCE AUTHORITY ANNUAL REPORT 2010-2011
ACT INSURANCE AUTHORITY Notes to and Forming Part of the Financial Statements
For the Year Ended 30 June 2011
Note 2. Summary of Significant Accounting Policies (Continued)
(s) Equity Contributed by the ACT Government
Capital injections are made by the ACT Government, as owner of the Authority. Capital injections are treated as contributions to equity.
(t) Assets Backing General Insurance Liabilities
As part of its investment strategy, the Authority manages its investment portfolio to ensure that investments mature in accordance with the expected pattern of future cash flows arising from general insurance liabilities.
The Authority has determined that all assets are held to back general insurance liabilities on the basis that all assets are valued at fair value in the balance sheet. Financial assets are valued at fair value through profit or loss. Initial recognition is at cost in the balance sheet and subsequent measurement is at fair value with any resultant unrealised profits or losses recognised in the operating statement.
(u) Impact of Accounting Standards Issued but yet to be Applied
The following new and revised accounting standards and interpretations have been issued by the Australian Accounting Standards Board but do not apply to the current reporting period. These standards and interpretations are applicable to future reporting periods. The Authority does not intend to adopt these standards and interpretations early. It is estimated that the effect of adopting the below pronouncements, when applicable, will have no material financial impact on the Authority in future reporting periods: AASB 7 Financial Instruments: Disclosures (application date 1 January 2011) AASB 9 Financial Instruments (application date 1 January 2013); AASB 101 Presentation of Financial Statements (application date 1 January 2011); AASB 107 Statement of Cash Flows (application date 1 January 2011); AASB 108 Accounting Policies, Changes in Accounting Estimates and Errors (application date
1 January 2011); AASB 110 Events After Reporting Period (application date 1 January 2011); AASB 119 Employee Benefits (application date 1 January 2011); AASB 132 Financial Instruments: Presentation (application date 1 January 2011); AASB 139 Financial Instruments: Recognition and Measurement (application date 1 January 2011); AASB 1023 General Insurance Contracts (application date 1 January 2013); AASB 1031 Materiality (application date 1 January 2011); AASB 1053 Application of Tiers of Australian Accounting Standards (application date 1 January
2013); AASB 2009-11 Amendments to Australian Accounting Standards arising from AASB 9 [AASB 4,
101, 132, 136, 139 & 1023] (application date 1 January 2013); AASB 2010-2 Amendments to Australian Accounting Standards arising from Reduced Disclosure
Requirements [AASB 1,2, 3, 7, 8, 101, 107, 108, 110, 111, 112, 121, 124, 127, 128, 133, 134, 136, 141 & 1050 and Interpretations 2,4, 5, 15, 17, 127 & 129] (application date 1 January 2013);
AASB 2010-6 Amendments to Australian Accounting Standards – Disclosures on Transfer of Financial Assets [AASB 1 & AASB 7] (application date 1 July 2011); and
AASB 2010-07 Amendments to Australian Accounting Standards arising from AASB 9 (December 2010) [AASB 1, 3, 4, 7, 101, 108, 112, 120, 121, 127, 128, 132, 136, 137, 139 & 1023 and Interpretations 2, 5, 10, 12, 19 and 127] (application date 1 January 2013).
31

AUSTRALIAN CAPITAL TERRITORY INSURANCE AUTHORITY ANNUAL REPORT 2010-2011
ACT INSURANCE AUTHORITY Notes to and Forming Part of the Financial Statements
For the Year Ended 30 June 2011
Note 3. Change in Accounting Policy and Accounting Estimates, and Correction of a Prior Period Error
Changes in Accounting Estimate
Changes in Actuarial Assumptions The Authority uses actuaries (Refer Note 5: ‘Actuarial Assumptions and Methods’) to calculate the outstanding claims liability. Actuarial assumptions are based on past claims experience, risk exposure and projections of economic variables.
As such the estimate of the outstanding claims provision has changed.
This change has resulted in an increase to the estimate of the outstanding claims provision and expense in the current reporting period of approximately $27.6 million.
Changes in the Public Liability Bushfire Outstanding Claims and Reinsurance Recovery Provisions The Authority uses actuaries to calculate the public liability bushfire outstanding claims and reinsurance recovery provisions. Actuarial assumptions are based on projections of economic variables and legal advice.
As such the estimates for the public liability bushfire outstanding claims and the reinsurance recovery provisions have changed.
This change has resulted in an increase of $803,000 and $807,000 respectively to the estimates for the public liability bushfire outstanding claims provision and the public liability bushfire reinsurance recovery provision in the current reporting period.
Revision of the Employee Benefit Discount Rate As disclosed in Note 2(m) - Employee Benefits, annual leave and long service leave, including applicable on-costs, which do not fall due in the next 12 months, are measured at the present value of estimated payments to be made in respect of services provided by employees up to the reporting date. The estimated future payments are discounted back to present value using the government bond rate. Last financial year the discount rate was 92.9%, however, due to a change in the government bond rate, the rate is now 92.2%.
As such the estimate of the long service leave and annual leave liabilities has changed.
This change has resulted in a decrease to the estimate of the long service leave liability and expense in the current reporting period of approximately $2,000.
Change in Accounting Policy
Investment Classification Following a review of the underlying structure of the characteristics of the Cash Enhanced Portfolio, due to an increase in the investment exposure to credit based securities, the investment is now more susceptible to movements in capital value and therefore is no longer considered to qualify as a cash equivalent.
As such the value of the Cash Enhanced Portfolio has changed.
This change has resulted in an unrealised gain to the Cash Enhanced Portfolio of $1,132,000.
Correction of Prior Period Errors
The Authority had no correction of prior period errors during the reporting period.
32

AUSTRALIAN CAPITAL TERRITORY INSURANCE AUTHORITY ANNUAL REPORT 2010-2011
ACT INSURANCE AUTHORITY Notes to and Forming Part of the Financial Statements
For the Year Ended 30 June 2011
Note 4. Significant Accounting Judgements and Estimates The Authority makes estimates and assumptions in respect of certain key amounts recorded in the financial statements. Estimates and judgments are continually evaluated and are based on historical experience and other factors, including expectations of future events that are believed to be reasonable under the circumstances. The key areas in which critical estimates are applied are described below.
(a) The Ultimate Liability Arising from Claims Made Under Insurance Contracts
A provision is made at the year end for the estimated cost of claims incurred but not settled at the Balance Sheet date, including the cost of claims incurred but not yet reported to the Authority.
The estimated cost of claims includes direct expenses to be incurred in settling claims gross of the expected value of salvage and other recoveries. The Authority takes all reasonable steps to ensure that it has appropriate information regarding its claims exposures. However, given the uncertainty in establishing claims provisions, it is likely that the final outcome will prove to be different from the original liability established.
The estimation of claims incurred but not reported (IBNR) and claims incurred but not enough reported (IBNER) are generally subject to a greater degree of uncertainty than the estimation of the cost of settling property claims, where more information about the claim event is generally available.
IBNR claims may often not be apparent to the insured until many years after the events giving rise to the claims has happened.
The public liability and medical malpractice classes of business will typically display greater variations between initial estimates and final outcomes because there is a greater degree of difficulty in estimating IBNR and IBNER reserves.
For the property class, claims are typically reported soon after the claim event, and hence tend to display lower levels of volatility.
In calculating the estimated cost of unpaid claims, the Authority uses a variety of estimation techniques, generally based upon statistical analyses of historical experience, which assumes that the development pattern of the current claims will be consistent with past experience. Allowance is made, however, for changes or uncertainties which may create distortions in the underlying statistics or which might cause the cost of unsettled claims to increase or reduce when compared with the cost of previously settled claims including:
changes in the Authority’s processes which might accelerate or slow down the development and/or recording of paid or incurred claims, compared with the statistics from previous periods;
changes in the legal environment; the effects of inflation; changes in the mix of business; the impact of large losses; movements in industry benchmarks; and medical and technological developments.
A component of these estimation techniques is usually the estimation of the cost of notified but not paid claims. In estimating the cost of these, the Authority has regard to the claim circumstance as reported, any information available from the ACT Government Solicitor and information on the cost of settling claims with similar characteristics in previous periods.
Large claims are assessed separately, being measured on a case by case basis or projected separately, in order to allow for the possible distortive effect of the development and incidence of these large claims.
Where possible, the Authority adopts multiple techniques to estimate the required level of provisions. This assists in giving greater understanding of the trends inherent in the data being projected. The projections given by the various methodologies also assist in setting the range of possible outcomes. The most appropriate estimation technique is selected taking into account the characteristics of the business class and the extent of the development of each accident year.
Provisions are calculated gross of any reinsurance recoveries. A separate estimate is made of the amounts that will be recoverable from reinsurers based upon the gross provisions.
Details of specific assumptions used in deriving the outstanding claims liability at year end are detailed in Note 5:‘Actuarial Assumptions and Methods.’
33

AUSTRALIAN CAPITAL TERRITORY INSURANCE AUTHORITY ANNUAL REPORT 2010-2011
ACT INSURANCE AUTHORITY Notes to and Forming Part of the Financial Statements
For the Year Ended 30 June 2011
Note 4. Significant Accounting Judgements and Estimates (Continued)
(b) Assets Arising from Reinsurance Contracts
Assets arising from reinsurance contracts are also computed using the above methods. In addition, the recoverability of these assets is assessed on a periodic basis to ensure that the balance is reflective of the amounts that will ultimately be received, taking into consideration factors such as counterparty and credit risk. Impairment is recognised where there is objective evidence that the Authority may not receive amounts due and these amounts can be reliably measured.
(c) Employee Benefits
Significant judgments have been applied in estimating the liability for employee benefits. The estimated liability for employee benefits requires a consideration of the future wage and salary levels, experience of employee departures and periods of service. The estimate also includes an assessment of the probability that employees will meet the minimum service period required to qualify for long service leave and that on-costs will become payable. Further information on this estimate is provided in Note 2(m): ‘Employee Benefits’ and Note 3: ‘Changes in Accounting Policy and Accounting Estimates and Correction of a Prior Period Error’.
Note 5. Actuarial Assumptions and Methods
The Authority writes seven classes of business: motor, property, public liability, medical malpractice, directors and officers, financial crime and professional indemnity.
An actuarial process is used for determining the estimated value of outstanding claims liabilities, and is largely similar for all classes. A description is as follows:
Estimates are made of IBNR claims through a combination of analyses of past reporting patterns and application of assumed development rates to numbers of claims already reported to the Authority.
Analyses are made of numbers of past settlements. Adopted ultimate settlement proportions are applied to the estimated ultimate numbers of claims to obtain numbers of future settlements.
Analyses are made of past settlement sizes, and past changes in case estimates.
Estimates of outstanding claims are first adopted for the most developed insurance years, ensuring consistency of average sizes and relationship to case estimates. The same process is extended to the more recent years, taking into account the experience of the earlier years and any differences in experience to date.
In some classes (property, medical malpractice and public liability), separate analyses are made of large and small claims. In these classes, the incidence and sizes of large claims for recent years is drawn from experience in the more developed years.
Analyses are made on data, which is gross of reinsurance, and the resulting estimates of outstanding liabilities are therefore gross of reinsurance. Subsequent allowances, where needed, are then made for potential reinsurance recoveries to arrive at estimates of net outstanding liabilities.
Allowances are incorporated for all future claims escalation, whether from external inflation or superimposed inflation, and projected payments are discounted to present values.
34

AUSTRALIAN CAPITAL TERRITORY INSURANCE AUTHORITY ANNUAL REPORT 2010-2011
ACT INSURANCE AUTHORITY Notes to and Forming Part of the Financial Statements
For the Year Ended 30 June 2011
Note 5. Actuarial Assumptions and Methods (Continued) Actuarial Assumptions
The following assumptions have been made in determining the outstanding claims liabilities.
Property Public Medical Directors Financial Professional & Motor Liability Malpractice and Officers Crime Indemnity
Discounted Mean Term (for Outstanding 0.59 5.41 7.05 4.20 2.97 4.71 Claims) years years years years years years
Ultimate Claim Numbers (2010-11 Insurance Year)* 69 111 137 7 1 16
Average Settlement Size $58,200 $94,000†
and $3.7m†† $267,000†
and $5.3m†† $65,700 $150,000 $74,800
Expense Rate 5.0% 5.0% 5.0% 5.0% 5.0% 5.0%
Discount Rate 4.8% 5.4% 5.8% 5.1% 4.9% 5.2%
Inflation and Superimposed Inflation 4.0% 4.0% 4.0% 4.0% 4.0% 4.0%
* Ultimate claims reported for 2010-11 are the assumed number of claims that were incurred in the insurance year.† Adopted average claim size for small claims with total cost up to $1 million. †† Adopted average claim size for large claims with total cost of $1 million or greater.
Ultimate Loss Ratios
The loss ratio indicates whether or not net earned premium is sufficient to meet net incurred claims. Where net incurred claims is greater than net earned premium, the ratio will be higher than 100%. If the ratio is higher than 100%, investment revenue is being used to meet the cost of claims. Net incurred claims equals claims expense, less reinsurance and other recoveries.
It is not possible to calculate an ultimate loss ratio for each class of business as the premiums provided are across multiple classes. However, the Authority has the overall loss ratios for the entire portfolio for the last three insurance years available. This loss ratio is the net loss ratio, with past claim payments in historical dollars and future claim payments inflated to date of payment. The earned premium is the historical net earned premium (i.e. no adjustment for inflation).
Insurance Net Loss Year Ratio
2008-09 125% 2009-10 153% 20010-11 99%
35

AUSTRALIAN CAPITAL TERRITORY INSURANCE AUTHORITY ANNUAL REPORT 2010-2011
ACT INSURANCE AUTHORITY Notes to and Forming Part of the Financial Statements
For the Year Ended 30 June 2011
Note 5. Actuarial Assumptions and Methods (Continued)
Process Used to Determine Assumptions
A description of the processes used to determine these assumptions is provided below.
Average weighted term to settlement The average weighted term to settlement is calculated separately by class of business based on historic settlement patterns.
Average claim frequency The claim frequency given is the total number of claims reported for each class of business that relate to the most recent insurance year. Average claims frequency is commonly defined as the number of expected claims as a percentage of a measure of risk exposure. However, due to the nature of the insurance classes that the Authority covers, a reliable measure of exposure is not available to calculate a useful frequency.
Expense rate Claims handling expenses were calculated based on an assumed proportion of claims handling costs as a percentage of past payments (as advised by PricewaterhouseCoopers to the Authority).
Discount rate Discount rates derived from market yields on Commonwealth Government Bonds as at the balance date have been adopted. The discount rates shown above are the rates which match the weighted term to maturity.
Inflation Economic inflation assumptions are set by reference to current economic indicators.
Superimposed inflation Superimposed inflation occurs due to non-economic effects such as court settlements increasing at a faster rate than wages or CPI inflation. An allowance for superimposed inflation is made for each underlying model, where appropriate, after considering both the superimposed inflation present in the portfolio and industry superimposed inflation trends. While superimposed inflation is always considered to form part of the assumptions there currently is no allowance for inflation over and above economic inflation.
36
AUSTRALIAN CAPITAL TERRITORY INSURANCE AUTHORITY ANNUAL REPORT 2010-2011
ACT INSURANCE AUTHORITY Notes to and Forming Part of the Financial Statements
For the Year Ended 30 June 2011
Note 5: Actuarial Assumptions and Methods (Continued)
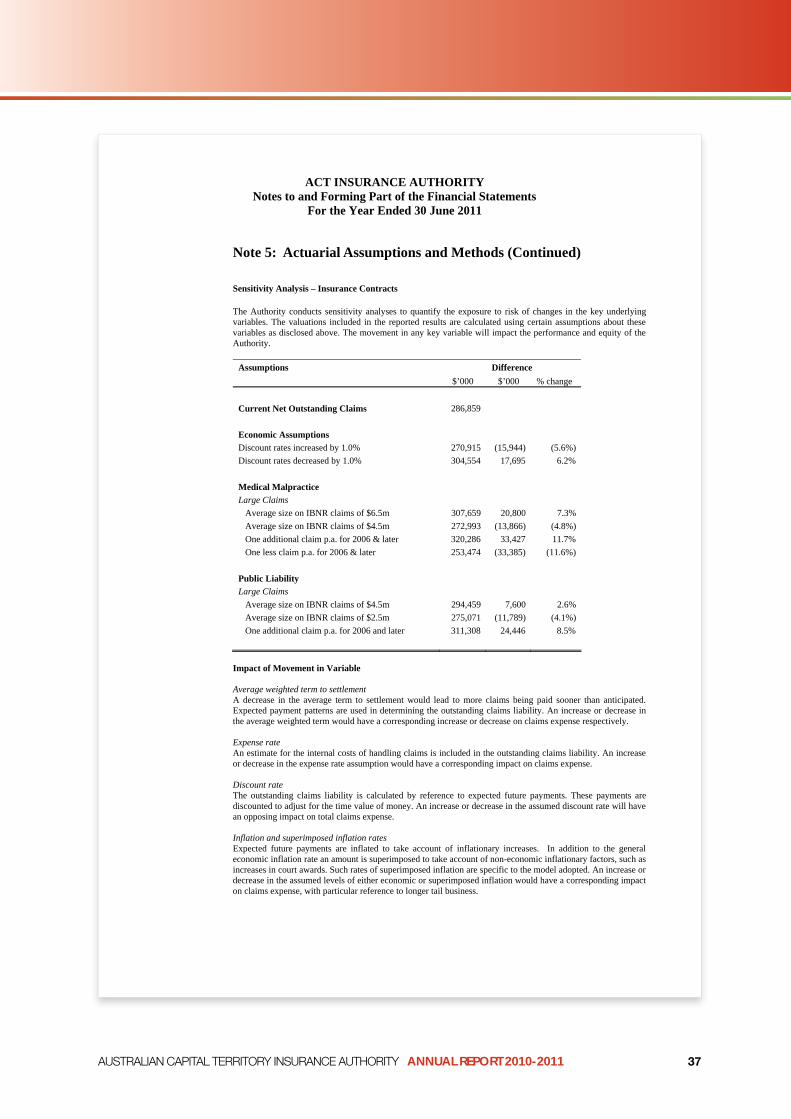
Sensitivity Analysis – Insurance Contracts
The Authority conducts sensitivity analyses to quantify the exposure to risk of changes in the key underlying variables. The valuations included in the reported results are calculated using certain assumptions about these variables as disclosed above. The movement in any key variable will impact the performance and equity of the Authority.
Assumptions Difference $’000 $’000 % change
Current Net Outstanding Claims
Economic Assumptions Discount rates increased by 1.0% Discount rates decreased by 1.0%
Medical Malpractice Large Claims Average size on IBNR claims of $6.5m Average size on IBNR claims of $4.5m One additional claim p.a. for 2006 & later One less claim p.a. for 2006 & later
Public Liability Large Claims Average size on IBNR claims of $4.5m Average size on IBNR claims of $2.5m One additional claim p.a. for 2006 and later
286,859
270,915 304,554
307,659 272,993 320,286 253,474
294,459 275,071 311,308
(15,944) 17,695
20,800 (13,866)
33,427 (33,385)
7,600 (11,789)
24,446
(5.6%) 6.2%
7.3% (4.8%) 11.7%
(11.6%)
2.6% (4.1%)
8.5%
Impact of Movement in Variable
Average weighted term to settlement A decrease in the average term to settlement would lead to more claims being paid sooner than anticipated. Expected payment patterns are used in determining the outstanding claims liability. An increase or decrease in the average weighted term would have a corresponding increase or decrease on claims expense respectively.
Expense rate An estimate for the internal costs of handling claims is included in the outstanding claims liability. An increase or decrease in the expense rate assumption would have a corresponding impact on claims expense.
Discount rate The outstanding claims liability is calculated by reference to expected future payments. These payments are discounted to adjust for the time value of money. An increase or decrease in the assumed discount rate will have an opposing impact on total claims expense.
Inflation and superimposed inflation rates Expected future payments are inflated to take account of inflationary increases. In addition to the general economic inflation rate an amount is superimposed to take account of non-economic inflationary factors, such as increases in court awards. Such rates of superimposed inflation are specific to the model adopted. An increase or decrease in the assumed levels of either economic or superimposed inflation would have a corresponding impact on claims expense, with particular reference to longer tail business.
37

AUSTRALIAN CAPITAL TERRITORY INSURANCE AUTHORITY ANNUAL REPORT 2010-2011
ACT INSURANCE AUTHORITY Notes to and Forming Part of the Financial Statements
For the Year Ended 30 June 2011
Note 6. Insurance Contracts – Risk Management Policies and Procedures
The financial condition and operation of the Authority are affected by a number of key risks including insurance risk, interest rate risk, credit risk, liquidity risk, financial risk and operational risk. Notes on the Authority’s policies and procedures in respect to managing insurance risks are set out in this note. The Authority’s policies and procedures for managing other risks are disclosed in Note 20: ‘Financial Instruments’.
(a) Objectives in Managing Risks Arising from Insurance Contracts and Policies for Mitigating Those Risks
The Authority has an objective to control insurance risk thus reducing the volatility of the operating result. The inherent uncertainty of insurance risk, which can lead to short-term variability is, to some extent, a feature of insurance business.
The Authority has developed, implemented and maintains a sound and prudent risk management strategy and a reinsurance management strategy. These strategies incorporate the Authority’s policies and procedures, processes and controls for risk management. These strategies address all material risks, financial and non-financial, likely to be faced by the Authority.
Key aspects of the processes established to mitigate insurance risks include: Actuarial models are used to calculate premiums and monitor claims patterns. Past experience and
statistical methods are used as part of the process. Documented procedures are followed for claims management. Reinsurance is used to limit the Authority’s exposure to large claims and catastrophes. When
selecting a reinsurer the Authority only considers those companies that provide high security. In order to assess this, the Authority uses ratings information from the public domain or gathered through internal investigations.
In order to limit the concentration of credit risk, in purchasing reinsurance, the Authority has regard to existing reinsurance assets and seeks to limit excessive exposure to any single reinsurer or group of related reinsurers.
(b) Development of Claims
There is a possibility that changes may occur in the estimate of our obligations at the end of a contract period. The tables in Note 17: ‘Outstanding Claims’ show the Authority’s estimate of outstanding claims for each underwriting year at successive year ends.
(c) Concentration of Insurance Risk
The Authority’s exposure to concentrations of insurance risk is mitigated by the Authority purchasing reinsurance on all classes of insurance policies. The main sources of concentration risk are bushfire, earthquakes and hail storms. The Authority purchases catastrophe reinsurance cover to limit exposure to any single event.
38

AUSTRALIAN CAPITAL TERRITORY INSURANCE AUTHORITY ANNUAL REPORT 2010-2011
ACT INSURANCE AUTHORITY Notes to and Forming Part of the Financial Statements
For the Year Ended 30 June 2011
Note 7. Underwriting Result Notes 2011 2010
$’000 $’000
(a) Underwriting Revenues Gross Earned Premiums
General Government Sector 42,750 41,217 Public Trading Enterprises 7,375 6,907
8 50,125 48,124
Reinsurance Recoveries/ (Losses) 9 9,710 (259) Reinsurance Recoveries/ (Losses) – Bushfire 9 807 (66,342) Recoveries From Other Insurers 9 163 337
10,680 (66,264)
60,805 (18,140) All underwriting revenues relate to operating activities.
(b) Underwriting Expenses Gross Claims Expense 9 49,007 57,488 Gross Claims Expense/ (Credit) – Bushfire 9 811 (66,557)
49,818 (9,069)
Outwards Reinsurance Premium Expense 8 10,752 10,829 10,752 10,829
60,570 1,760
(c) Underwriting Profit/(Loss) Underwriting Revenues 60,805 (18,140) Underwriting Expenses (60,570) (1,760)
235 (19,900)
The annual insurance premiums increased slightly in 2010-11 due an expected increase in the future claims costs for the public liability and property classes.
The expected cost of bushfire claims was impacted by reduced discount and inflation rates. Outstanding claims include a discount to allow for interest that is expected to be earned on claims until they are paid. A lower discount rate reduces the amount of expected interest and therefore increases the claim liability. A higher reinsurance recovery for bushfires was recognised to correspond to this increase in claims expense.
The expected cost of ordinary claims decreased due to changes in actuarial assumptions in the major claims classes. The decrease has been largely driven by a lower than expected number of claims reported as well as smaller settlements in more recent years.
Ordinary reinsurance recoveries increased predominately due to the recognition of a reinsurance recovery relating to 2010-11 storm damage claims.
39

AUSTRALIAN CAPITAL TERRITORY INSURANCE AUTHORITY ANNUAL REPORT 2010-2011
ACT INSURANCE AUTHORITY Notes to and Forming Part of the Financial Statements
For the Year Ended 30 June 2011
Note 8. Net Earned Premiums 2011 2010
$’000 $’000
Gross Written Premiums General Government Sector 42,750 41,217 Public Trading Enterprises 7,375 6,907
50,125 48,124
Outwards Reinsurance Premium Expense (10,752) (10,829) Net Earned Premiums 39,373 37,295
The gross written premiums increased slightly in 2010-11 due an expected increase in the future claims costs for the public liability and property classes.
Note 9. Net Incurred Claims 2011 2010 Current Prior Current Prior
Year Years Year Years $’000 $’000 $’000 $’000
Gross Incurred Claims and Related Expenses - Undiscounted (79,954) (27,396) (65,063) (1,157) - Undiscounted (Bushfire) - (1,243) - 97,329
(79,954) (28,639) (65,063) 96,172
- Discounted (57,139) 8,132 (46,955) (10,533) - Discounted (Bushfire) - (811) - 66,557
(57,139) 7,321 (46,955) 56,024 Total Gross Incurred Claims and Related Expenses (49,818) 9,069
Reinsurance and Other Recoveries - Undiscounted 12,144 (1,326) - 154 - Undiscounted (Bushfire) - 1,212 - (98,289) - Other Underwriting Income - 163 - 337
12,144 49 - (97,798)
- Discounted 9,755 (45) - (259) - Discounted (Bushfire) - 807 - (66,342) - Other Underwriting Income - 163 - 337
9,755 925 - (66,264) Total Reinsurance and Other Recoveries 10,680 (66,264) Net Incurred Claims (Discounted) (47,384) 8,246 (46,955) (10,240) Total Net Incurred Claims (Discounted) (39,138) (57,195)
The expected cost of ordinary claims was impacted by reduced discount and higher inflation rates. Changes in actuarial assumptions resulting from slower than anticipated payments during 2010-11, recognition of storm damage claims for 2010-11 and growth large medical malpractice claims, offset by lower than expected numbers of small claims developing in older years.
Bushfire claims and reinsurance recoveries decreased due to the withdrawal of some claimants and changes in economic assumptions.
40

AUSTRALIAN CAPITAL TERRITORY INSURANCE AUTHORITY ANNUAL REPORT 2010-2011
ACT INSURANCE AUTHORITY Notes to and Forming Part of the Financial Statements
For the Year Ended 30 June 2011
Note 10. Other Revenue and Expenses 2011 2010
$’000 $’000
(a) Other Revenue Interest and Distribution Received Interest Received from Bank 187 55 Distribution Received from the Territory Banking
Account 17,046 14,718 17,233 14,773
Other Revenue: Recoveries from Other Agencies 151 148 Unrealised Gain on Investments 1,166 1,032
1,317 1,180 18,550 15,953
(b) Other Expenses Outwards Insurance Premium Expense – Construction Industry Gross 2,173 1,654 Construction Industry Premium Receipts Gross (1,864) (1,654) Outwards Insurance Premium Expense – Externally Insured Contracts Gross 577 590 Externally Insured Contracts – Receipts Gross (577) (590)
309 0
(a). In 2010-11, interest and distributions received increased due to higher interest rates and a greater amount of funds held in the Cash Enhanced Fund. The Authority is endeavouring to increase funds invested in order to meet the cost of future claims.
(b). Unrealised gain from investment is the difference between the carrying amount at market value and the value of the long-term investments held with the Territory Banking Account. During 2010-11, the unit price of the Cash Enhanced Fund and Fixed Interest Fund increased resulting in an unrealised gain.
41

AUSTRALIAN CAPITAL TERRITORY INSURANCE AUTHORITY ANNUAL REPORT 2010-2011
ACT INSURANCE AUTHORITY Notes to and Forming Part of the Financial Statements
For the Year Ended 30 June 2011
Note 11. Employee and Superannuation Expenses 2011 2010
$’000 $’000
(a) Employee Expenses Salaries 1,469 1,392 Annual Leave Expense 13 4 Long Service Leave Expense 78 (18) Other Employee Benefits and On-Costs - 9 Workers Compensation Premium 5 3
Total Employee Expenses 1,565 1,390
(b) Superannuation Expense Superannuation Contribution to the Territory
Banking Account 174 159 Productivity Benefit 22 20 Superannuation Payment to Comsuper (for the
PSSAP) 10 12 Superannuation to External Providers 35 34
Total Superannuation Expenses 241 225
The Authority makes payment on a fortnightly basis to the Territory Banking Account for its portion of the Territory’s Commonwealth Superannuation Scheme (CSS) and Public Sector Superannuation Scheme (PSS) superannuation liability. The productivity benefit for these schemes is paid directly to Comsuper.
Superannuation payments have been made direct to Comsuper to cover the superannuation liability for employees that are in the Public Sector Superannuation Scheme Accumulation Plan (PSSAP).
Superannuation payments are also made to external providers as part of the employee fund of choice arrangements, and to employment agencies for the superannuation contribution the Authority is required to make for the contract staff it employs.
a This relates to the ACTPS Enterprise Agreement sign-on bonus.
Note 12. Supplies and Services 2011 2010
$’000 $’000
Rental Expenses 113 105 Contractors and Consultants 504 606 Insurance 6 6 Computing Costs 105 77 Repairs and Maintenance 4 2 Printing 4 5 Communications 11 9 Publications 6 5 Postage and Courier 1 1 Staff Development 51 12 Stationery 14 16 Travel 39 106 Audit Fees 53 48
Other 60 57 971 1,055
The decrease in contractors and consultants is due to less demand for the services of the actuaries and insurance consultants than in the last reporting period.
42

AUSTRALIAN CAPITAL TERRITORY INSURANCE AUTHORITY ANNUAL REPORT 2010-2011
ACT INSURANCE AUTHORITY Notes to and Forming Part of the Financial Statements
For the Year Ended 30 June 2011
Note 13. Cash and Cash Equivalents, and Investments
2011 2010 Current Non- Total Current Non- Total
Current Current $’000 $’000 $’000 $’000 $’000 $’000
(a). Cash and Cash Equivalents
Current Cash at Bank 42 - 42 396 - 396
Total Cash and Cash Equivalents 42 42 396 396
(b). Investments
Current Investments with Territory
Banking Account – Cash Enhanced Portfolio 251,235 - 251,235 209,113 - 209,113
Non-Current Investments with Territory
Banking Account – Fixed Interest Portfolio - 59,491 59,491 - 59,457 59,457
Total Investments 251,235 59,491 310,726 209,113 59,457 268,570
Total Cash and Cash Equivalents, and Investments 251,277 59,491 310,768 209,509 59,457 268,966
The Authority holds a bank account with the Commonwealth Bank. The average interest rate on cash at bank was 4.5% (2010 4.6%). Other investments are held with the Territory Banking Account. The weighted average floating interest rate on the Cash Enhanced Portfolio is 6.71% (2010: 5.78%) and the rate of return of investment on the Fixed Interest Portfolio was 5.54% (2010 7.94%). These funds are able to be withdrawn upon request.
An increase in investments reflects the increase in funds invested in order to meet the cost of future claims.
43

AUSTRALIAN CAPITAL TERRITORY INSURANCE AUTHORITY ANNUAL REPORT 2010-2011
ACT INSURANCE AUTHORITY Notes to and Forming Part of the Financial Statements
For the Year Ended 30 June 2011
Note 14. Receivables 2011 2010
$’000 $’000
Current Interest Receivable 3,020 1,852 Net GST Receivable 115 225 Other Receivables 489 1,494
3,624 3,571 Less: Allowance for Impairment Losses - -Total Receivables 3,624 3,571
Ageing Of Receivables
Not Overdue Past Due Total Less than 30 to 60 Days Greater than 30 Days 60 Days
$’000 $’000 $’000 $’000 $’000 2011
Not Impaired1
Receivables 3,446 109 - 69 3,624 Impaired
Receivables
2010 Not
Impaired1
Receivables 3,571 - - - 3,571 Impaired
Receivables - - - - -
1 ‘Not Impaired’ refers to Net Receivables (that is Gross Receivables less Impaired Receivables).
Reconciliation of the Allowance for Impairment Losses 2011 2010 $’000 $’000
Allowance for Impairment Losses at the Beginning of the Period - 8 Additional Allowances Recognised - 4 Reduction in Allowance Resulting from a Write Back against the - (12)
Receivables Allowance for Impairment Losses at the End of Reporting
Period - -
Classification of ACT Government/ Non-ACT Government 2011 2010 Receivables $’000 $’000
Receivables with ACT Government Entities Interest Receivable 3,017 1,848 Contract Works Premium 411 1,101
Other 37 184 3,465 3,133
Receivables with Non-ACT Government Entities
Other Receivables 159 438
Total Receivables 3,624 3,571
The Authority does not hold any collateral for receivables that are overdue or determined to be impaired.
44

AUSTRALIAN CAPITAL TERRITORY INSURANCE AUTHORITY ANNUAL REPORT 2010-2011
ACT INSURANCE AUTHORITY Notes to and Forming Part of the Financial Statements
For the Year Ended 30 June 2011
Note 15. Reinsurance Recoveries 2011 2010
$’000 $’000
(a) Current: Ordinary Reinsurance Recoveries – Undiscounted Undiscounted Expected Future Recoveries 527 705 Discounted Present Value (10) (11)
517 694
Bushfire Reinsurance Recoveries – Undiscounted Undiscounted Expected Future Recoveries - 1,220 Discount to Present Value - (13)
- 1,207 Total Current Reinsurance Recoveries Discounted 517 1,901
(b) Non-Current Ordinary Recoveries – Undiscounted Undiscounted Expected Future Recoveries 12,916 7,493 Discount to Present Value (2,492) (443) Less: Allowance for the Impairment of Reinsurance Assets - (5,248)
10,424 1,802 Bushfire Reinsurance Recoveries - Undiscounted Undiscounted Expected Future Recoveries 85,008 85,000 Discount to Present Value (14,730) (16,711)
70,278 68,289 Total Non-Current Reinsurance Recoveries Discounted 80,702 70,091
Total Ordinary Reinsurance Recoveries – Discounted 10,941 2,496 Total Bushfire Reinsurance Recoveries - Discounted 70,278 69,496 Total Reinsurance Recoveries Discounted 81,219 71,992
(c) Reconciliation of the Movement of Reinsurance Recoveries Provision for Reinsurance Recoveries at the Beginning of the Period 71,992 140,798 Reinsurance Received (963) 2,297 Movement in Provision due to Changes in Claims 10,190 (71,103) Provision for Reinsurance Recoveries at the End of Reporting Period 81,219 71,992
Bushfire reinsurance recoveries increased due to changes in economic assumptions. The Authority’s self insured retention on this claim has been exceeded. A recovery is expected on ordinary public liability claims in the bushfire year as well as public liability in the 2006-07 insurance year, medical malpractice claims in the 1999-2000 and 2000–01 insurance years and property in the 2006-07 and 2010-11 insurance years. The provision for impairment of reinsurance assets recognises the amount the Authority estimates will not be paid due to financial difficulties of HIH Insurance Ltd (HIH) has been removed as all likely recoveries from HIH have been received. HIH was the lead medical malpractice reinsurer.
45

AUSTRALIAN CAPITAL TERRITORY INSURANCE AUTHORITY ANNUAL REPORT 2010-2011
ACT INSURANCE AUTHORITY Notes to and Forming Part of the Financial Statements
For the Year Ended 30 June 2011
Note 16. Payables 2011 2010
$’000 $’000
Current Payables Trade Payables 150 220
Aging of Payables Payables are aged as follows: Not Overdue 150 220
150 220 Classification of ACT Government/Non- ACT Government Payables
Payables with ACT Government Entities Trade Payables 26 48 Payables with Non- ACT Government Entities Trade Payables 124 172
Total Payables 150 220
Note 17. Outstanding Claims 2011 2010
$’000 $’000
(a) Undiscounted Expected Future Claim Payments Central Estimate 343,945 264,599 Risk Margin 60,261 47,322 Claims Handling Costs 16,532 13,082
420,738 325,003 Discount to Present Value (123,068) (64,724) Liability for Outstanding Claims 297,670 260,279
Current 43,514 35,184 Non-Current 254,156 225,095
297,670 260,279
(b) Undiscounted Expected Future Claim Payments (Bushfire) Central Estimate 95,160 99,247 Discount to Present Value (15,034) (17,088) Liability for Outstanding Claims 80,126 82,159
Current 2,218 3,316 Non-Current 77,908 78,843
80,126 82,159
Total Undiscounted Expected Future Claim Payments 515,898 424,250 Total Discounted Claims Provision as per Balance Sheet 377,796 342,438
All figures in Note 17 (a) have been calculated by actuaries as outlined in Note 2(h): ‘Claims’.
46

AUSTRALIAN CAPITAL TERRITORY INSURANCE AUTHORITY ANNUAL REPORT 2010-2011
ACT INSURANCE AUTHORITY Notes to and Forming Part of the Financial Statements
For the Year Ended 30 June 2011
Note 17. Outstanding Claims (Continued)
(c) Risk Margina
The process of determining risk margin
The overall risk margin was determined allowing for diversification between different portfolios and the relative uncertainty of the outstanding claims estimate for each portfolio. Uncertainty was analysed for each portfolio taking into account potential uncertainties relating to the actuarial models and assumptions, the quality of the underlying data used in the models, the general insurance environment, and the impact of legislative reform.
The estimate of uncertainty is greater for long tail classes when compared to short tail classes due to the longer time until settlement of outstanding claims.
The assumptions regarding uncertainty for each class were applied to the net central estimates. The results were aggregated, allowing for diversification in order to arrive at an overall provision which is intended to have a 75% probability of adequacy, meaning that the outstanding claims liability has a 75% chance of being great enough to reflect all possible future claims. A 75% level of sufficiency is the minimum required by the Australian Prudential Regulatory Authority (APRA).
Risk margins applied
Class Risk margin (%) PropertyFinancial Crime Public Liability Professional Indemnity Directors and Officers Medical Malpractice
18 30 17 18 23 17
Overall margin (weighted average) 17
(d) Inflation and Discount Rates a
The following average inflation (normal and superimposed) rates and discount rates were used in the measurement of outstanding claims:
2011 2010 % %
For the succeeding year Inflation rate 4.0 4.0 Discount rate 4.8 4.5
For the subsequent year Inflation rate 4.0 4.0 Discount rate 5.1 5.0
(e) Term to Settlement a
The weighted average expected term to settlement of the outstanding claims from the balance date is estimated to be 6.1 years (2010 – 4.4 years). The weighted average expected term to settlement has been based on industry averages and it has been adjusted to reflect the specific classes of insurance offered by the Authority.
a Notes (c) to (e) exclude bushfires
47
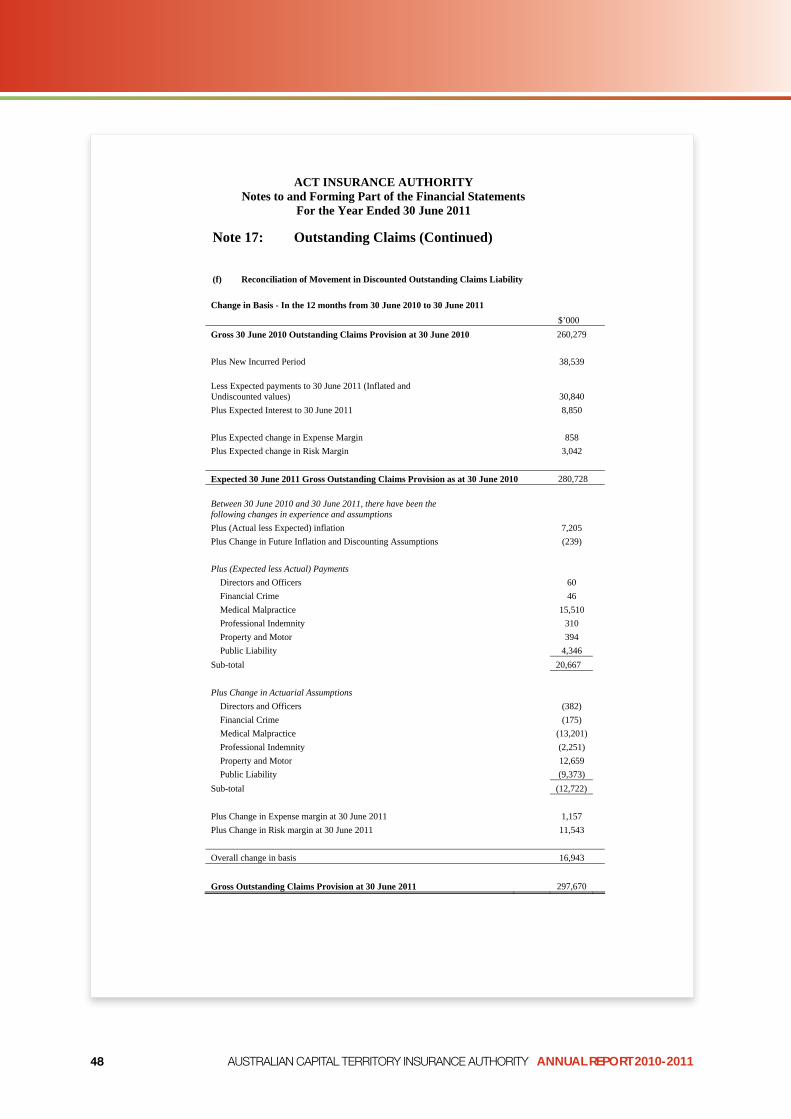
AUSTRALIAN CAPITAL TERRITORY INSURANCE AUTHORITY ANNUAL REPORT 2010-2011
ACT INSURANCE AUTHORITY Notes to and Forming Part of the Financial Statements
For the Year Ended 30 June 2011
Note 17: Outstanding Claims (Continued)
(f) Reconciliation of Movement in Discounted Outstanding Claims Liability
Change in Basis - In the 12 months from 30 June 2010 to 30 June 2011 $’000
Gross 30 June 2010 Outstanding Claims Provision at 30 June 2010 260,279
Plus New Incurred Period 38,539
Less Expected payments to 30 June 2011 (Inflated and Undiscounted values) 30,840 Plus Expected Interest to 30 June 2011 8,850
Plus Expected change in Expense Margin 858 Plus Expected change in Risk Margin 3,042
Expected 30 June 2011 Gross Outstanding Claims Provision as at 30 June 2010 280,728
Between 30 June 2010 and 30 June 2011, there have been the following changes in experience and assumptions Plus (Actual less Expected) inflation 7,205 Plus Change in Future Inflation and Discounting Assumptions (239)
Plus (Expected less Actual) Payments Directors and Officers 60 Financial Crime 46 Medical Malpractice 15,510 Professional Indemnity 310 Property and Motor 394 Public Liability 4,346
Sub-total 20,667
Plus Change in Actuarial Assumptions Directors and Officers (382) Financial Crime (175) Medical Malpractice (13,201) Professional Indemnity (2,251) Property and Motor 12,659 Public Liability (9,373)
Sub-total (12,722)
Plus Change in Expense margin at 30 June 2011 1,157
Plus Change in Risk margin at 30 June 2011 11,543
Overall change in basis 16,943
Gross Outstanding Claims Provision at 30 June 2011 297,670
48

AUSTRALIAN CAPITAL TERRITORY INSURANCE AUTHORITY ANNUAL REPORT 2010-2011
ACT INSURANCE AUTHORITY Notes to and Forming Part of the Financial Statements
For the Year Ended 30 June 2011
Note 17. Outstanding Claims (Continued) (f) Reconciliation of Movement in Discounted Outstanding Claims Liability – Continued a
The expected gross central estimate of $270.06 million compares to the actual gross outstanding claims provision of $297.67 million, indicating a total increase of $27.61 million. This increasing of the provision may be broken down into six main components:
a $7.205 million increase due to higher than expected inflation;
a $0.239 million decrease due to increases in the assumed discount rates since 30 June 2010;
a $20.667 million increase as a result of actual payments being less than expected over the 12 months. The increase in the estimate assumes that, all other things being equal, the difference in payments expected to be made in the 12 months would be deferred to some time in the future; and
a $12.722 million decrease due to changes in actuarial assumptions. These have resulted from:
o An increase in the Property insurance class largely resulting from the December 2010 storms. The impact on the net central estimate will be smaller due to expected reinsurance recoveries;
o A reduction for the Medical Malpractice insurance class resulting from:
lower assumed ultimate number of claims and small finalisations in response to more favourable experience in small claims, offset by deterioration in case estimates of reported large claims; and
lengthening in the payment pattern leading to a greater impact from the discounting of the liability;
o a reduction in the Public Liability insurance class resulting from lower than expected numbers of small settlements and more favourable experience in case estimate development for reported large claims.
o a reduction in the Professional Indemnity insurance class resulting from favourable experience in the development of large claims
o a reduction in the Directors’ and Officers’ insurance class resulting from lower than expected number of claims reported;
a $1.157 million increase in the expense margin as a result of the increase in the central estimate of outstanding claims; and
an increase of $11.543 million in the risk margin resulting from an increase in the central estimate of outstanding claims.
a Note (f) excludes bushfires
49

AUSTRALIAN CAPITAL TERRITORY INSURANCE AUTHORITY ANNUAL REPORT 2010-2011
ACT INSURANCE AUTHORITY Notes to and Forming Part of the Financial Statements
For the Year Ended 30 June 2011
Note 17. Outstanding Claims (Continued) Claims Development Table – Bushfires Claims
The following tables show the development of gross and net undiscounted oustanding claims relative to the ultimate expected claims for the three classes of bushfire-related claims in 2002-03 accident year.
i) Gross Accident year 2002-03
Standing Timber Property Public Liab Prof. Indem Total $ '000 $ '000 $ '000 $ '000 $ '000
Estimate of ultimate claims cost At end of accident year 64,508 58,909 - - 112,967 One year later 56,028 65,066 15,500 - 136,594 Two years later 56,028 60,496 15,500 - 132,024 Three years later 56,028 60,596 15,500 - 132,124 Four years later 56,028 60,596 15,500 - 132,124 Five years later 56,028 60,596 46,985 - 163,609 Six years later 56,028 60,596 193,503 1,485 311,612 Seven years later 56,028 60,596 96,526 1,882 215,032 Eight years later 56,028 60,596 95,336 1,834 213,794 Current estimate of cumulative claims cost 56,028 60,596 95,336 1,834 213,794 Cumulative payments -51,024 -57,624 -10,336 -8 -118,632 Outstanding claims undiscounted 5,004 3,332 85,000 1,826 95,162 Discount 0 0 -14,731 -303 -15,036 Outstanding claims 5,004 3,332 70,269 1,523 80,126
ii) Net Accident year 2002-03
Standing Timber Property Public Liab Prof. Indem Total $ '000 $ '000 $ '000 $ '000 $ '000
Estimate of ultimate claims cost At end of accident year 4,058 4,961 - - 9,019 One year later 4,028 6,053 - - 15,581 Two years later 4,028 6,784 - - 16,312 Three years later 4,028 6,884 - - 16,412 Four years later 4,028 6,984 - - 16,512 Five years later 4,028 7,084 - - 16,612 Six years later 4,028 6,884 5,827 1,485 18,224 Seven years later 4,028 6,884 5,827 1,882 18,621 Eight years later 4,028 6,884 5,827 1,834 18,573 Current estimate of cumulative claims cost 4,028 6,884 5,827 1,834 18,573 Cumulative payments -4,028 -6,884 -5,827 -8 -16,747 Outstanding claims undiscounted 0 0 0 1,826 1,826 Discount 0 0 0 -303 -303 Outstanding claims 0 0 0 1,523 1,523
Note: Claims incurred policy classes are public liability, financial crime and motor. Claims made policy classes are medical malpractice, directors and officers and professional indemnity. Table may not add to Balance Sheet due to rounding.
50

AUSTRALIAN CAPITAL TERRITORY INSURANCE AUTHORITY ANNUAL REPORT 2010-2011
ACT INSURANCE AUTHORITY Notes to and Forming Part of the Financial Statements
For the Year Ended 30 June 2011
Note 17. Outstanding Claims (Continued) Claims development tables
Summary of all claims incurred classes
The following tables show the development of gross and net undiscounted outstanding claims relative to the ultimate expected claims for the eight most recent accident years.
i) Gross
Accident year 2003-04 2004-05 2005-06 2006-07 2007-08 2008-09 2009-10 2010-11 Total $ '000 $ '000 $ '000 $ '000 $ '000 $ '000 $ '000 $ '000 $ '000
Estimate of ultimate claims cost: At end of accident year One year later Two years later Three years later Four years later Five years later Six years later Seven years later
Current estimate Cummulative payments
Oustanding claims undiscounted
Discount
5,654 8,717 8,670 7,537 6,815 8,055 4,921 4,800
4,800 (1,673)
9,560 11,904 10,604
6,433 7,242 8,683 5,744
0
5,744 (1,887)
11,534 11,670
9,304 9,744 9,495 7,542
0 0
7,542 (1,689)
13,513 13,385 14,670 18,324 14,276
0 0 0
14,276 (2,320)
9,356 11,211
8,209 10,547
0 0 0 0
10,547 (916)
10,942 14,397 15,941
0 0 0 0 0
15,941 (828)
11,957 12,371 14,000 0
0 0 0 0 0 0 0 0 0 0 0 0
14,000 12,371 85,221 (520) (6) (9,841)
3,126 3,857 5,852 11,956 9,632 15,113 13,479 12,364 75,380
(732) (976) (1,315) (3,137) (2,396) (3,560) (3,921) (4,386) (20,422) Outstanding claims 2,395 2,881 4,538 8,819 7,236 11,553 9,559 7,978 54,958
2003 and prior years 8,912 Outstanding claims 63,870
ii) Net
Accident year 2003-04 2004-05 2005-06 2006-07 2007-08 2008-09 2009-10 2010-11 Total $ '000 $ '000 $ '000 $ '000 $ '000 $ '000 $ '000 $ '000 $ '000
Estimate of ultimate claims cost: At end of accident year One year later Two years later Three years later Four years later Five years later Six years later Seven years later
Current estimate Cummulative payments
Oustanding claims undiscounted
Discount
5,654 8,717 8,670 7,537 6,815 8,055 4,921 4,800
4,800 (1,673)
3,126
(732)
9,560 11,904 10,604
6,433 7,242 8,683 5,744
0
5,744 (1,887)
11,534 11,670
9,304 9,744 9,495 7,542
0 0
7,542 (1,689)
13,513 11,123 12,835 17,025 13,660
0 0 0
13,660 (2,320)
9,356 11,211
8,209 10,547
0 0 0 0
10,547 (916)
10,942 14,397 15,941
0 0 0 0 0
15,941 (828)
11,957 12,371 14,000 0
0 0 0 0 0 0 0 0 0 0 0 0
14,000 12,371 84,605 (520) (6) (9,841)
3,857 5,852 11,340 9,632 15,113 13,479 12,364 74,764
(976) (1,315) (3,064) (2,396) (3,560) (3,921) (4,386) (20,349) Outstanding claims 2,395 2,881 4,538 8,276 7,236 11,553 9,559 7,978 54,415
2003 and prior years 8,603 Outstanding claims 63,018
51

AUSTRALIAN CAPITAL TERRITORY INSURANCE AUTHORITY ANNUAL REPORT 2010-2011
ACT INSURANCE AUTHORITY Notes to and Forming Part of the Financial Statements
For the Year Ended 30 June 2011
Claims development tables Summary of all claims made classes
The following tables show the development of gross and net undiscounted outstanding claims relative to the ultimate expected claims for the eight most recent accident years.
i) Gross
Accident year 2003-04 2004-05 2005-06 2006-07 2007-08 2008-09 2009-10 2010-11 Total $ '000 $ '000 $ '000 $ '000 $ '000 $ '000 $ '000 $ '000 $ '000
Estimate of ultimate claims cost: At end of accident year 10,078 25,204 19,260 23,304 22,558 29,076 36,409 35,304 One year later 14,480 21,000 20,133 25,216 30,013 19,786 35,445 0 Two years later 14,512 23,861 14,193 22,316 29,878 20,708 0 0 Three years later 14,605 18,275 22,217 28,970 22,316 0 0 0 Four years later 14,016 22,778 12,525 38,089 0 0 0 0 Five years later 15,317 25,955 14,578 0 0 0 0 0 Six years later 11,767 28,768 0 0 0 0 0 0 Seven years later 13,860 0 0 0 0 0 0 0
Current estimate 13,860 28,768 14,578 38,089 22,316 20,708 35,445 35,304 209,066 Cummulative payments (4,988) (4,855) (2,045) (1,401) (919) (820) (348) (86) (15,461)
8,871 23,913 12,533 36,688 21,397 19,889 35,096 35,218 193,605 Oustanding claims undiscounted
Discount (2,313) (6,105) (3,842) (11,526) (7,341) (7,882) (14,176) (14,168) (67,354) Outstanding claims 6,558 17,808 8,691 25,162 14,056 12,006 20,920 21,050 126,251
2003 and prior years Outstanding claims
35,451 161,703
ii) Net
Accident year 2003-04 2004-05 2005-06 2006-07 2007-08 2008-09 2009-10 2010-11 Total $ '000 $ '000 $ '000 $ '000 $ '000 $ '000 $ '000 $ '000 $ '000
Estimate of ultimate claims cost: At end of accident year 10,078 25,204 19,110 23,304 22,558 29,076 36,409 35,304 One year later 14,480 21,109 20,133 24,751 30,013 19,786 35,445 0 Two years later 12,993 23,861 14,193 22,316 29,878 20,708 0 0 Three years later 14,605 18,275 22,217 28,970 22,316 0 0 0 Four years later 14,016 22,778 12,525 38,089 0 0 0 0 Five years later 15,317 25,955 14,578 0 0 0 0 0 Six years later 11,767 28,768 0 0 0 0 0 0 Seven years later 13,860 0 0 0 0 0 0 0
Current estimate 13,860 28,768 14,578 38,089 22,316 20,708 35,445 35,304 209,066 Cummulative payments (4,988) (4,855) (2,045) (1,401) (919) (820) (348) (86) (15,461)
Oustanding claims undiscounted 8,871 23,913 12,533 36,688 21,397 19,889 35,096 35,218 193,605 Discount (2,313) (6,105) (3,842) (11,526) (7,341) (7,882) (14,176) (14,168) (67,354) Outstanding claims 6,558 17,808 8,691 25,162 14,056 12,006 20,920 21,050 126,251
2003 and prior years 35,451 Outstanding claims 161,703
52

AUSTRALIAN CAPITAL TERRITORY INSURANCE AUTHORITY ANNUAL REPORT 2010-2011
ACT INSURANCE AUTHORITY Notes to and Forming Part of the Financial Statements
For the Year Ended 30 June 2011
Claims development tables Summary of all long tail policy classes
The following tables show the development of gross and net undiscounted outstanding claims relative to the ultimate expected claims for the eight most recent accident years.
i) Gross
Accident year 2003-04 2004-05 2005-06 2006-07 2007-08 2008-09 2009-10 2010-11 Total $ '000 $ '000 $ '000 $ '000 $ '000 $ '000 $ '000 $ '000 $ '000
Estimate of ultimate claims cost: At end of accident year One year later Two years later Three years later Four years later Five years later Six years later Seven years later
Current estimate Cummulative payments
Oustanding claims undiscounted
Discount
15,732 23,197 23,181 22,142 20,831 23,373 16,688 18,659
18,659 (6,661)
34,764 32,904 34,465 24,708 30,019 34,638 34,512
0
34,512 (6,742)
30,795 31,802 23,497 31,961 22,021 22,119
0 0
22,119 (3,734)
36,817 38,601 36,986 47,294 52,365
0 0 0
52,365 (3,721)
31,914 41,224 38,087 32,863
0 0 0 0
32,863 (1,834)
40,018 34,183 36,650
0 0 0 0 0
36,650 (1,648)
48,366 49,444
0 0 0 0 0 0
49,444 (869)
47,675 0 0 0 0 0 0 0
47,675 294,287 (92) (25,302)
11,998 27,770 18,385 48,644 31,029 35,002 48,576 47,582 268,985 (3,046) (7,082) (5,157) (14,665) (9,738) (11,443) (18,098) (18,554) (87,775)
Outstanding claims 8,953 20,690 13,229 33,980 21,291 23,559 30,479 29,028 181,209
2003 and prior years Claims handling expense Risk margin Outstanding claims Short tail outstanding claims Total gross outstanding claims as per balance sheet
44,363 11,626 42,707
279,905 17,765
297,670
ii) Net
Accident year 2003-04 2004-05 2005-06 2006-07 2007-08 2008-09 2009-10 2010-11 Total $ '000 $ '000 $ '000 $ '000 $ '000 $ '000 $ '000 $ '000 $ '000
Estimate of ultimate claims cost: At end of accident year One year later Two years later Three years later Four years later Five years later Six years later Seven years later
Current estimate Cummulative payments
Oustanding claims undiscounted
Discount
15,625 23,075 21,612 22,142 20,831 23,373 16,688 18,659
18,659 (6,661)
11,998 (3,046)
34,601 32,820 34,348 24,592 30,019 34,638 34,512
0
34,512 (6,742)
30,491 31,664 23,497 31,961 22,021 22,119
0 0
22,119 (3,734)
36,679 35,738 35,152 45,995 51,749
0 0 0
51,749 (3,721)
31,777 41,224 38,087 32,863
0 0 0 0
32,863 (1,834)
40,018 34,183 36,650
0 0 0 0 0
36,650 (1,648)
48,366 49,444
0 0 0 0 0 0
49,444 (869)
47,675 0 0 0 0 0 0 0
47,675 293,671 (92) (25,302)
27,770 18,385 48,028 31,029 35,002 48,576 47,582 268,369 (7,082) (5,157) (14,592) (9,738) (11,443) (18,098) (18,554) (87,703)
Outstanding claims 8,953 20,690 13,229 33,437 21,291 23,559 30,479 29,028 180,666
2003 and prior years Claims handling expense Risk margin Outstanding claims Short tail outstanding claims Total net outstanding claims as per balance sheet
44,054 11,626 42,707
279,053 7,806
286,859
53

AUSTRALIAN CAPITAL TERRITORY INSURANCE AUTHORITY ANNUAL REPORT 2010-2011
ACT INSURANCE AUTHORITY Notes to and Forming Part of the Financial Statements
For the Year Ended 30 June 2011
Note 18. Prepayments and Other Liabilities
(a) Prepayments Current Construction Industry Premium Prepayments Non-Current Construction Industry Premium
Prepayments
Note No.
2011 $’000
693
115
2010 $’000
684
468 808 1,152
(b) Other Liabilities Current Construction Industry Premium Received in
Advance from Agencies 693 684 Non-Current Construction Industry Premium Received in
Advance from Agencies 115 468 2 (d) 808 1,152
Premiums on large capital works are written to cover the life of the project. The decrease in prepayments and the corresponding liabilities in 2010-11 is due to greater one-off Commonwealth Government funding in 2009-10.
Note 19. Employee Benefits 2011
$’000 2010
$’000 Current Employee Benefits Accrued Salaries 42 30 Annual Leave 210 197 Long Service Leave 230 169 Other - 9
482 405 Non-Current Employee Benefits
Long Service Leave 57 39 57 39
Total Employee Benefits 539 444
2011 2010 Employee Numbers Number Number Full-time Equivalents at the End of the Reporting Period 14 14
For Disclosure Purposes Only Estimate of When Leave is Payable
2011 $’000
2010 $’000
Estimated Amount Payable Within 12 Months Annual leave 162 197
Long Service Leave 26 25 Accrued Salaries 42 30 Other - 9
Total Employee Benefits Payable Within 12 Months 230 261
Estimated Amount Payable After 12 Months Long Service Leave 261 183
Annual Leave 48 -Total Employee Benefits Payable After 12 Months 309 183 Total Employee Benefits 539 444
54

AUSTRALIAN CAPITAL TERRITORY INSURANCE AUTHORITY ANNUAL REPORT 2010-2011
ACT INSURANCE AUTHORITY Notes to and Forming Part of the Financial Statements
For the Year Ended 30 June 2011
Note 20. Financial Instruments (a) Accounting Policies, Terms and Conditions
Details of the significant policies and methods adopted, including the criteria for recognition, the basis of measurement, and the basis on which income and expenses are recognised, with respect to each class of financial asset and financial liability are disclosed in Note 2: ‘Summary of Significant Accounting Policies’.
Derivative Instruments
The Authority is not a party to derivative financial instruments.
(b) Fair Value of Financial Assets and Liabilities
The carrying amounts and fair values of financial assets and liabilities at the end of the reporting period are:
Carrying Amount Fair Value Carrying Amount Fair Value 2011 2011 2010 2010
$’000 $’000 $’000 $’000 Financial Assets
Cash and Cash Equivalents 42 42 396 396
Investments with the Territory Banking Account – Cash Enhanced Fund 251,235 251,235 209,113 209,113
Investments with the Territory Banking Account 59,491 59,491 59,457 59,457 – Fixed Interest Fund
Receivables 3,509 3,509 3,346 3,346
Total Financial Assets 314,277 314,277 272,312 272,312
Financial Liabilities
Payables 150 150 110 110
Total Financial Liabilities 150 150 110 110
55

AUSTRALIAN CAPITAL TERRITORY INSURANCE AUTHORITY ANNUAL REPORT 2010-2011
ACT INSURANCE AUTHORITY Notes to and Forming Part of the Financial Statements
For the Year Ended 30 June 2011
Note 20. Financial Instruments (Continued) (c) Credit risk
Credit risk is the risk that one party to a financial instrument will fail to discharge an obligation and cause the other party to incur a financial loss.
The Authority’s credit risk is limited to the amount of the financial assets it holds less any allowance for impairment. A large proportion of the Authority’s receivables are from other ACT Government agencies which mean that the credit risk of these receivables going into default is low. The Authority expects to collect all financial assets that are not past due or impaired.
Though not a financial instrument, the credit risk of a reinsurer defaulting is significant, refer to Note 15: ‘Reinsurance Recoveries’. The Authority minimises this credit risk by: - limiting individual reinsurer participation to 25% in the Industrial Special Risk (ISR) cover, the
principle catastrophe reinsurance for the Fund; - requiring each reinsurer to have a Standard and Poors security rating of ‘A-’ or higher on placement;
and - arranging replacement insurance for the unexpired portion of the treaty, in the event of reinsurer
downgrades below acceptable levels.
The following graph shows the credit risk relating to the security of the individual reinsurers with which the Authority has outstanding recoveries.
Outstanding reinsurance recoveries - rating
2%
92%
1%
0%
5%
AA-
A+
A
A-
Ceased
Note: Ceased refers to HIH in liquidation.
There have been new reinsurers added to the reinsurance program for 2010-11. These reinsurers have a credit rating of AA-.
56

AUSTRALIAN CAPITAL TERRITORY INSURANCE AUTHORITY ANNUAL REPORT 2010-2011
ACT INSURANCE AUTHORITY Notes to and Forming Part of the Financial Statements
For the Year Ended 30 June 2011
Note 20. Financial Instruments (Continued) (d) Interest rate risk
Interest rate risk is the risk that the fair value or future cash flows of a financial instrument will fluctuate because of changes in market interest rates.
A small percentage of Authority’s financial assets are held in floating interest rate arrangements, whereas the Authority’s financial liabilities are not subject to floating interest rates. This means that the Authority is not exposed to movements in interest payable, however, it is exposed to movements in interest receivable. Interest rates increased during the year ended 30 June 2011 and as such have resulted in an increase in the amount of interest received. The majority of the Authority’s financial assets are not subject to interest rate risk.
Interest rate risk for financial assets is managed by the Authority by only investing limited funds in cash. These funds are only invested in arrangements that are low risk. The interest rate risk for financial liabilities is not actively managed by the Authority as these liabilities are held in no-interest bearing arrangements. The discount rates for the outstanding claims provision are derived from market yields on Commonwealth Government Bonds at the balance date. There have been no changes in risk exposure or processes for managing risk since last reporting period.
Sensitivity Analysis
Taking into account past performance, future expectations and economic forecasts, the impact on profit or loss and the impact on equity in the table below are ‘reasonably possible’ over the next 12 months if interest rates change by -/+ 1.0%.
30 June 2011 (1.0%) +1.0% Profit/(Loss)
Impact Profit/(Loss)
Impact $’000 $’000
Cash and Cash Equivalents - -Outstanding Claims Provision Discount to Present Value 2,977 (2,977) Total Increase/ (Decrease) 2,977 (2,977)
30 June 2010 (1.0%) +1.0% Profit/(Loss)
Impact Profit/(Loss)
Impact $’000 $’000
Cash and Cash Equivalents (4) 4 Outstanding Claims Provision Discount to Present Value 3,424 (3,424) Total Increase/ (Decrease) 3,420 (3,420)
57

AUSTRALIAN CAPITAL TERRITORY INSURANCE AUTHORITY ANNUAL REPORT 2010-2011
ACT INSURANCE AUTHORITY Notes to and Forming Part of the Financial Statements
For the Year Ended 30 June 2011
Note 20. Financial Instruments (Continued) (e) Liquidity Risk
Liquidity risk is the risk that the Authority will encounter difficulties in meeting obligations associated with financial liabilities that are settled by delivering cash or another financial asset.
Though the majority of the Authority’s liabilities are not financial instruments, but insurance claims, the Authority may be considered to have a liquidity risk. In order to limit liquidity risk in the future, the Authority has put in place the following strategies: - to set premiums at a level that will fully cover claims costs and associated expenses; and - to reduce claims cost by improving risk management practices at the agencies.
The Authority’s exposure to liquidity risk and the management of this risk has not changed since the previous reporting period.
The following table sets out the Authority’s maturity analysis for financial assets and liabilities as well as the exposure to interest rates, including the weighted average interest rates by maturity period as at 30 June 2011. All financial assets and liabilities which have a floating interest rate or are non-interest bearing will mature in one year or less. All amounts appearing in the following maturity analysis are shown on an undiscounted cash flow basis.
Fixed interest maturing in: 2011
Financial Instruments
Financial Assets Cash and Cash Equivalents Investments – Cash Enhanced Investments – Fixed Interest Receivables Total Financial Assets
Weighted Average Interest Rate
Financial Liabilities Payables Total Financial Liabilities
Notes
13 13 13 14
6.71%
16
Floating interest
rate $'000
42 ---
42
1 year or less $'000
-----
over 1 to 5
years $'000
-----
more than
5 years $'000
-----
Non-interest bearing
$'000
-251,235 59,491
3,508 314,235
Total $'000
42 251,235 59,491
3,508 314,277
--
--
--
--
150 150
150 150
Net Financial Assets 42 - - - 314,085 314,127
Reconciliation of Net Financial Assets to Net Assets Notes 2011 $’000
Net Financial Assets (as above) 314,127 Net GST Receivable 115 Employee Benefits 19 (539) Reinsurance Recoveries 15 81,219 Other Assets 807 Other Liabilities (807) Outstanding Claims 17 (377,796) Net Assets as per the Balance Sheet 17,126
58

AUSTRALIAN CAPITAL TERRITORY INSURANCE AUTHORITY ANNUAL REPORT 2010-2011
ACT INSURANCE AUTHORITY Notes to and Forming Part of the Financial Statements
For the Year Ended 30 June 2011
Note 20. Financial Instruments (Continued) The following table sets out the Authority’s maturity analysis for financial assets and liabilities as well as the exposure to interest rates, including the weighted average interest rates by maturity period as at 30 June 2010. All financial assets and liabilities which have a floating interest rate or are non-interest bearing will mature in one year or less. All amounts appearing in the following maturity analysis are shown on an undiscounted cash flow basis.
Fixed interest maturing in: 2010
Financial Instruments Notes
Floating interest
rate $'000
1 year or less $'000
over 1 to 5
years $'000
more than
5 years $'000
Non-interest bearing
$'000 Total $'000
Financial Assets Cash and Cash Equivalents Investments – Cash Enhanced Investments – Fixed Interest Receivables Total Financial Assets
13 13 13 14
396 ---
396
-----
-----
-----
-209,113 59,457
3,346 271,916
396 209,113 59,457
3,346 272,312
Weighted Average Interest Rate
5.78%
Financial Liabilities Payables Total Financial Liabilities
16 --
--
--
--
110 110
110 110
Weighted average interest rate 5.78% -
Net Financial Assets 396 - - - 271,806 272,202
Reconciliation of Net Financial Assets to Net Assets Notes 2010 $’000
Net Financial Assets (as above) Net GST Receivable
Employee Benefits Reinsurance Recoveries Other Assets Other Liabilities Outstanding Claims
Net Assets as per the Balance Sheet
19 15
17
272,202 115
(444) 71,992 1,152
(1,152) (342,438)
1,427
Carrying Amount of Each Category of Financial Instruments Financial Assets
2011 $’000
2010 $’000
Financial Assets at Fair Value through the Profit and Loss Designated upon Initial Recognition
Loans and Receivables 310,726
3,508268,570
3,346
Financial Liabilities
Financial Liabilities Measured at Amortised Cost 150 110
Gains/ (Loss) on Each Category of Financial Asset
Financial Assets at Fair Value through Profit and Loss Designated upon Initial Recognition 1,166 1,032
59

AUSTRALIAN CAPITAL TERRITORY INSURANCE AUTHORITY ANNUAL REPORT 2010-2011
ACT INSURANCE AUTHORITY Notes to and Forming Part of the Financial Statements
For the Year Ended 30 June 2011
Note 20. Financial Instruments (Continued) (f) Price Risk
Price risk is the risk that the fair value or future cashflows of a financial instrument will fluctuate because of changes in market prices (other than those arising from interest rate risk or currency risk), whether these changes are caused by factors specific to individual financial instruments or its issuer, or factors affecting all similar financial instruments traded in the market.
The price risk which the Authority is exposed to results from its investment in Cash Enhanced and the Fixed Interest portfolios. The Authority has units in the Cash Enhanced and Fixed Interest portfolios which fluctuate in value. The price fluctuations in the units of the Cash Enhanced and the Fixed Interest portfolios are caused by movements in the underlying investments of the portfolios. The underlying investments are managed by an external fund manager who invests in a variety of different investment funds and bonds, including bonds issued by the Commonwealth Government, the State Government guaranteed Treasury corporations and semi-government authorities, as well as investment grade corporate issues. To limit price risk, all bonds that make up the underlying investments of the fixed interest portfolio must have a long term credit rating of BBB- or greater. Anything rated BBB- or greater is considered ‘investment grade’.
The aim of the fund manager is to match the total return of the UBS Australian Composite Bond Index before taking into account fund fees and expenses. The Authority’s exposure to price risk and management of the risk has not changed since last reporting period.
Taking into account past performance, future expectations, economic forecasts, and Treasury management’s knowledge and experience of the financial markets, the impact on profit or loss and the impact on equity in the table below are ‘reasonably possible’ over the next 12 months if interest rates change-/+ 0.5% for the Cash Enhanced Fund and -/+2.0% for the Fixed Interest Fund from the target benchmark with all other variables held constant.
June 2011 (0.5%) 0.5% Benchmark/ Volatility
Factor Profit/(Loss)
Impact Profit/(Loss)
Impact $’000 $’000
Cash Enhanced Portfolio
UBS Australian Composite Bond Index -/+ 5.0%
(1,256) 1,256
June 2010 (0.5%) 0.5% Benchmark/ Volatility
Factor Profit/(Loss)
Impact Profit/(Loss)
Impact $’000 $’000
Cash Enhanced Portfolio
UBS Australian Composite Bond Index -/+ 5.0% (1,046) 1,046
June 2011 (2.0%) 2.0% Benchmark/ Volatility
Factor Profit/(Loss)
Impact Profit/(Loss)
Impact $’000 $’000
Fixed Interest Portfolio
UBS Australian Composite Bond Index -/+ 2.0%
(1,190) 1,190
June 2010 (2.0%) 2.0% Benchmark/ Volatility
Factor Profit/(Loss)
Impact Profit/(Loss)
Impact $’000 $’000
Fixed Interest Portfolio
UBS Australian Composite Bond Index -/+ 2.0% (1,189) 1,189
60

AUSTRALIAN CAPITAL TERRITORY INSURANCE AUTHORITY ANNUAL REPORT 2010-2011
2011
2010
ACT INSURANCE AUTHORITY Notes to and Forming Part of the Financial Statements
For the Year Ended 30 June 2011
Note 20. Financial Instruments (Continued) (g) Fair Value Hierarchy
The Authority is required to classify financial assets and financial liabilities into a fair value hierarchy that reflects the significance of the inputs used in determining their fair value. The fair value hierarchy is made up of the following three levels: Level 1 - quoted prices (unadjusted) in active markets for identical assets or liabilities; Level 2 - inputs other than quoted prices included within Level 1 that are observable for the asset or liability,
either directly (i.e. as prices) or indirectly (i.e. derived from prices); and Level 3 - inputs for the asset or liability that are not based on observable market data (unobservable inputs).
The carrying amount of financial assets measured at fair value, as well as the methods used to estimate the fair value are summarised in the table below. All other financial assets and liabilities are measured, subsequent to initial recognition, at amortised cost and as such are not included in the table below.
Classification According to Fair Value Hierarchy Level 1 Level 2 Level 3 Total
$’000 $’000 $’000 $’000 Financial Assets Financial Assets at Fair Value from the
Balance Sheet Investment with the Territory Banking
Account – Cash Enhanced Portfolio Investment with the Territory Banking
Account - Fixed Interest Portfolio
-
-
251,235
59,491
-
-
251,235
59,491
Total - 310,726 - 310,726 Transfer Between Categories There have been no transfers of financial assets or financial liabilities between Level 1 and Level 2 during the reporting period.
Classification According to Fair Value Hierarchy Level 1 Level 2 Level 3 Total
$’000 $’000 $’000 $’000 Financial Assets Financial Assets at Fair Value from the
Balance Sheet Investment with the Territory Banking
Account – Cash Enhanced Portfolio Investment with the Territory Banking
Account - Fixed Interest Portfolio
-
-
209,113
59,457
-
-
209,113
59,457
Total - 268,570 - 268,570
Transfer Between Categories There have been no transfers of financial assets or financial liabilities between Level 1 and Level 2 during the reporting period.
Note 21. Remuneration of Auditor The Auditor’s remuneration consists of financial audit services provided to the Authority by the ACT Auditor-General’s Office.
Note 2011 $’000
2010 $’000
Audit Fees Paid to the ACT Auditor-General’s Office 12 53 48
No other services were provided by the ACT Auditor-General’s Office.
61

AUSTRALIAN CAPITAL TERRITORY INSURANCE AUTHORITY ANNUAL REPORT 2010-2011
ACT INSURANCE AUTHORITY Notes to and Forming Part of the Financial Statements
For the Year Ended 30 June 2011
Note 22. Contingent Liabilities and Contingent Assets No contingent liabilities or assets were recognised at the reporting date.
Note 23. Cash Flow Reconciliation (a) Reconciliation of Cash and Cash Equivalents at the end of the Reporting Period in the Cash Flow
Statement to the Equivalent Items in the Balance Sheet. 2011 2010
$’000 $’000
Total Cash and Cash Equivalents Recorded in the Balance Sheet 42 396 Cash and Cash Equivalents at the end of the Reporting Period as Recorded in the Cash Flow Statement 42 396
(b) Reconciliation of Net Cash Inflows from Operating Activities to the Operating Surplus/ (Deficit)
2011 2010 $’000 $’000
Operating Surplus/ (Deficit) 15,699 (6,617) Add/ Less Items Classified as Investing or Financing Changes in Net Market Value of Investments (1,166) (1,032) Cash Before Changes in Operating Assets and Liabilities 14,533 (7,649)
Change in Operating Assets and Liabilities (Increase)/ Decrease in Reinsurance Recoveries (Increase) in Interest Receivable Decrease/ (Increase) in Other Receivables
(9,227) (1,168)
1,115
68,806 (197)
(1,365) (Decrease)/ Increase in Payables (70) 68 Increase/ (Decrease) in Outstanding Claims 35,358 (23,899) Increase in Employee Benefits 95 -Net Changes in Operating Assets and Liabilities 26,103 43,413 Net Cash Inflows from Operating Activities 40,635 35,764
62

AUSTRALIAN CAPITAL TERRITORY INSURANCE AUTHORITY ANNUAL REPORT 2010-2011
A.7 STATEMENT OF PERFORMANCE
63

AUSTRALIAN CAPITAL TERRITORY INSURANCE AUTHORITY ANNUAL REPORT 2010-201164

AUSTRALIAN CAPITAL TERRITORY INSURANCE AUTHORITY ANNUAL REPORT 2010-2011 65

AUSTRALIAN CAPITAL TERRITORY INSURANCE AUTHORITY ANNUAL REPORT 2010-201166

AUSTRALIAN CAPITAL TERRITORY INSURANCE AUTHORITY ANNUAL REPORT 2010-2011 67

AUSTRALIAN CAPITAL TERRITORY INSURANCE AUTHORITY ANNUAL REPORT 2010-2011
ACT INSURANCE AUTHORITY Statement of Performance
For the Year Ended 30 June 2011
Description of Objectives The ACT Insurance Authority’s key objectives are: to carry out the business of insurer of Territory risks; to take out insurance of Territory risks with other entities; to satisfy or settle claims in relation to Territory risks; to take action, with the Treasurer’s approval, for the realising, enforcing, assigning or extinguishing rights against
third parties arising out of or in relation to its business, including, for example: - taking possession of, dealing with or disposing of, property; or - carrying on a third party’s business as a going concern;
to develop and promote good practices for the management of Territory risks; to give advice to the Treasurer about insurance and the management of Territory risks; to carry out the role of the Nominal Defendant of the ACT; and to administer, on behalf of and under agreement with the Chief Minister’s and Cabinet Directorate, the Default
Insurance Fund.
Objective Performance Indicators
Original Target
Actual Result
Variance Variance %
Explanation of Material Variances
Carry out the business of insurer of Territory risks
Conduct an annual customer satisfaction survey achieving high levels of overall customer satisfaction with insurance management services 1
90% 89% (1%) (1.1%)
General and administrative expense as a percentage of total revenue. Industry benchmark 5.9%
4.6% excludes bushfires
3.5% (1.1%) (24%) Ordinary revenue was higher than expected due to investment returns. General and administrative expenses were less than budget.
Determine annual insurance premiums for Territory agencies that allow full funding of claim costs and associated expenses 2
1 1 0 0%
The average number of days to process an insurance claim payment 3
20 7 (13) (65%) Agency payments are processed as a priority.
Notes: 1 Surveys are sent to the Director-Generals of all ACT Government Directorates and Statutory Authorities insured by ACTIA. Respondents are asked to rate performance against the ACTIA Customer Service Charter that details what agency's can expect from ACTIA when doing business with the Authority 2 ACTIA completes an annual review of agency insurance premiums, with assistance from the fund actuary Pricewaterhousecoopers. Premiums are determined based on agency claims history, asset ownership and risk profile. 3 This is from date settlement agreed until date of payment
68

AUSTRALIAN CAPITAL TERRITORY INSURANCE AUTHORITY ANNUAL REPORT 2010-2011
Objective Performance Indicators
Original Target
Actual Result
Variance Variance %
Explanation of Material Variances
Conduct annual property asset audits to ensure that values reflect insurance replacement costs 4
1 1 0 0%
Take out insurance Review the Territory’s 1 1 0 0% of Territory risks insurance and with other entities reinsurance programs
to ensure they are appropriate for its needs 5
Satisfy or settle claims in relation to Territory risks
Hold quarterly reviews of all liability claims to assess the claim management strategy and reserve for matters where the Territory’s liability may exceed $100,000
4 4 0 0%
Number of active insurance claims (includes pre-ACTIA claims)
9,000 8,275 (725) (8%) There were fewer claims and incidents reported to ACTIA
Develop and promote good practices for the management of Territory risks
Provide Risk Profile Reports to assist agencies by benchmarking and measuring their risk management progress
12 1 (11) (8%) Provision of reports agreed with Agency Heads on a bi-annual basis, rather than monthly, following Management Council consultation.
Conduct risk management training courses
12 26 14 11% Increased demand for risk management training.
Work with selected agencies to minimise claims costs
4 agencies
4 agencies
0 0%
Notes: 4 ACTIA completes a review of the replacement values detailed in the Territory's asset schedule as part of the property reinsurance renewal.
5 ACTIA completes an annual review of the Territory's insurance arrangements. This includes a review of the Territory's reinsurance program structure, an analysis of market conditions and the suitability of policy terms and conditions.
69

AUSTRALIAN CAPITAL TERRITORY INSURANCE AUTHORITY ANNUAL REPORT 2010-2011
A.8 ANALYSIS OF AGENCY PERFORMANCE The financial year 2010–11 was a favourable year for the development of the Territory’s insurance claims. No unanticipated large claims emerged and the number of matters reported was in line with expectations.
The Authority’s property reinsurance policy has responded to a $17.5 million property damage claim resulting from storm and water damage.
While the liability profile is exhibiting increasing signs of maturity, considerable volatility continues. This is primarily due to ACTIA having been in existence only a short time so that there is limited data and very little experience from which to derive actuarial assumptions. The majority of ACTIA’s claims are long tailed in nature, meaning that it may take many years for the matters to settle. This also results in increased uncertainty. Further revisions in the outstanding claims expense are expected in the future as ACTIA’s portfolio grows and reaches a mature state.
ACTIA continues to promote good risk management practices in agencies. The Authority’s risk management team continues to provide advice and assistance to agencies. During the year ACTIA staff delivered a total of 26 general and agency specific risk management training courses to various Territory agencies.
Improved claims management practices within ACTIA also contributed to the improved operating result. A new claims management process was introduced which closes claims and incidents in a shorter time. The result is less open claims/incidents resulting in a decline in case estimates and smaller actuarial margins. The reclassification of claims to incidents in earlier insurance years also helped to drive down reserves and decrease actuarial margins.
The performance indicators for the Authority for 2010–11 are outlined below:
• Conduct an annual customer satisfaction survey
Outcome
ACTIA’s Customer Service Charter details the standards that our customers can expect when dealing with us. To gauge our effectiveness against these commitments ACTIA surveyed fund members to identify their level of satisfaction with the services provided.
Surveys were sent to the Chief Executives Officers of all ACT Government Directorates and Statutory Authorities insured by ACTIA.
The survey asked respondents to rate their level of satisfaction against key areas of service delivery including insurance claims management and risk management. Respondents were asked to confirm that they were satisfied with the overall performance of the Authority as their insurance service provider, 89% “agreed” or “strongly agreed” with this statement.
Although the overall satisfaction levels are high, ACTIA is liaising with all respondents to identify and clarify those areas in which its performance does not meet their expectations.
• General and administrative expense as a percentage of total revenue
Outcome
General and administrative expenses were 3.5% of ordinary revenue. This is 1.1% less than the target of 4.6%.
• Determine annual insurance premiums for Territory agencies
Outcome
ACTIA completes an annual review of agency insurance premiums, with assistance from the fund actuary PricewaterhouseCoopers. Premiums are determined based on agency claims history, asset ownership and risk profile. An insurance questionnaire, claims experience report and an ongoing asset review exercise enabled the renewal premiums to reflect current risk profiles.
• Average Number of Days to Process an Insurance Payment
Outcome
During 2010–11 it took an average of 7 days to reimburse agencies for insurance settlements. This is 13 days less than the target of 20 days.
• Conduct annual property asset audits to ensure that values reflect replacement costs
Outcome
ACTIA completed a review of the replacement values detailed in the Territory’s asset schedule as part of the property reinsurance renewal. The Authority worked with individual agencies to refine the detail included in schedules provided by agencies for inclusion in the Authority’s property reinsurance renewal.
70
AUSTRALIAN CAPITAL TERRITORY INSURANCE AUTHORITY ANNUAL REPORT 2010-2011
• Review the Territory’s insurance and reinsurance programs
Outcome
ACTIA completes an annual review of the Territory’s insurance arrangements. This includes a review of the Territory’s reinsurance program structure, an analysis of market conditions and the suitability of policy terms and conditions. ACTIA was able to achieve placement of 100% of the Territory’s reinsurance program. The cost of reinsurance renewals placed in 2010–11 for the following year was consistent with prices paid in the previous year despite market pressure to increase premiums.
• Quarterly review of claims
Outcome
Four claims review meetings were held for general liability and medical malpractice claims during 2010–11. Claims estimated at $100,000 or greater were reviewed and reserves adjusted where appropriate. The reviews were attended by representatives of the Government Solicitor’s Office, ACTIA and ACTIA’s insurance brokers, Marsh, as well as external insurers and their solicitors, where appropriate.
• Number of active insurance claims and incidents
Outcome
The Authority’s claims management system shows that there were 1,585 open claims and incidents and that 6,690 claims and incidents were closed during the financial year. It is important to note, however, that the vast majority of reported incidents will not result in actual settlements.
It is expected that the number of open claims will increase over time due to the lengthy period between claims notification and settlement for much of ACTIA’s business.
• Provide Risk Management Profile Reports
Outcome
In May 2011, ACTIA issued Risk Profile Reports to agency Chief Executive Officers, with additional distribution to agency officers involved in management of operational insurance and risk management.
The reports contained a detailed claims history, claims costs and provided a commentary on issues or trends, where identified, across classes of insurance. The reports also included suggested risk management actions for information and action.
In consultation with Director-Generals at Management Council, agreement was made to revise the timing for provision of reports to occur biannually, rather than monthly as originally planned, at
30 June to coincide with annual insurance cover renewal and at 30 December as a mid year review.
• Conduct of risk management training courses
Outcome
During 2010–11 the Authority’s Risk Managers delivered 26 training sessions to approximately 232 Territory staff from various agencies. There were 14 training activities provided in addition to the planned target of 12. Training sessions delivered canvassed general introductory and intermediate level risk management, and topic specific training sessions in the modification and use of risk management software tailored to meet agency requirements.
• Work with selected agencies to minimise claim costs
Outcome
ACTIA continues to work with key agencies, analysing claims data and developing strategies to reduce the incidence of claims against the Government by implementing robust risk management practices, which in turn assists in the reduction of costs incurred by the Territory. The Authority provides support to identify causes and contributing factors resulting in claims events and in developing effective mitigation strategies.
The Authority’s risk managers provided support to executive managers in the stewardship of internal risk management accountability and decision making processes, in addition to working with key staff operationally within agencies.
The Authority provides support for activities such as: the design and support of incident reporting databases, provision of advice regarding risk management policies and procedures, tailored training and one on one assistance, support in developing, monitoring and reviewing effective risk management treatment strategies.
71

AUSTRALIAN CAPITAL TERRITORY INSURANCE AUTHORITY ANNUAL REPORT 2010-201172

AUSTRALIAN CAPITAL TERRITORY INSURANCE AUTHORITY ANNUAL REPORT 2010-2011
SECTION B: CONSULTATION AND SCRUTINY REPORTING
B.1 COMMUNITY ENGAGEMENT The Authority strives to continually improve the delivery of services. Feedback from our Government clients on their expectation and level of satisfaction with the quality of our services is actively sought. It was not necessary for the Authority to undertake consultation with the public during 2010–11. However, two key roles of the Authority are to manage the risks of the Territory and to arrange appropriate insurance for those risks where possible. Hence it does not deal directly with the community, but it does assist agencies to manage insurance and risk issues that relate to community matters such as running public events. These activities may include:
• advice to an agency as to the adequacy of a community group’s insurance cover; and
• assisting an agency to prepare a full risk assessment and management plan for a public event.
B.2 INTERNAL & EXTERNAL SCRUTINY The valuation of outstanding insurance claims for 2010–11, completed by the Authority’s actuaries PricewaterhouseCoopers, was peer reviewed by CumpstonSarjeant Consulting Actuaries. The valuation was found to be reasonable.
73

AUSTRALIAN CAPITAL TERRITORY INSURANCE AUTHORITY ANNUAL REPORT 2010-201174

AUSTRALIAN CAPITAL TERRITORY INSURANCE AUTHORITY ANNUAL REPORT 2010-2011
SECTION C: LEGISLATIVE AND POLICY BASED REPORTING
C.1 RISK MANAGEMENT AND INTERNAL AUDIT C.1.1 Internal Audit
Internal Audit is an independent assurance and consulting activity that reviews and evaluates the effectiveness of the Authority’s risk management, internal control, and governance practices. The results of the Authority’s Internal Audit function are reported to the joint Chief Minister and Cabinet Directorate (CMCD)/ Treasury Directorate Audit Committee (the Committee) and through the Committee to the Directors-General. The Committee’s functions are governed by the Audit Committee Charter.
The Committee is comprised of an Independent Chair and four members: two from CMCD and two from the Treasury Directorate. Alternate members have also been appointed in each Directorate to attend me ief Finance Officers from each Directorate and a representative from the Auditor General’s Office are also invited to attend meetings as observers. The Directors-General of each Directorate have a standing invitation to attend Committee meetings.
The objective of the Committee is to provide independent assurance and assistance to the Directors General on their Directorate’s risk, control and compliance framework, and its external accountability responsibilities.
The Committee, in fulfilling its objectives, assists the Director-General in the discharge of their responsibilities for exercising due care; diligence and skill in relation to the Directorate’s reporting of financial information; application of accounting policies; adequacy of internal controls; financial and risk management and compliance with applicable laws.
The Authority has identified areas of operational risk and developed a cyclical internal audit program designed to review these risks over a 3-year period. Internal audit services for the Authority also include a review of the financial reporting requirements to ensure these complied with the Government’s directions.
75

AUSTRALIAN CAPITAL TERRITORY INSURANCE AUTHORITY ANNUAL REPORT 2010-2011
Ten Audit Committee meetings were held during the year. The number of meetings attended by committee members and observers is as follows:
Name of Member Position Duration Meetings Attended
Mr John Gordon Independent Chair July 2010 to June 2011 10 / 10
Ms Catherine Hudson CMCD Committee Member July 2010 to May 2011 7 / 9
Mr Andrew Kefford CMCD Committee Member May 2011 to June 2011 1 / 1
Ms Sue Hall CMCD Committee Member July 2010 to June 2011 6 / 10
Mr Luke McAlary CMCD Alternate Committee July 2010 to June 2011 1 / 1 Member
Ms Kirsten Thompson Treasury Directorate July 2010 to June 2011 9 / 10 Committee Member
Ms Marsha Guthrie Treasury Directorate July 2010 to June 2011 8 / 10 Committee Member
Ms Kate Neser Observer July 2010 3 / 3
Mr Paul Ogden Observer August 2010 to June 2011 7 / 7
Ms Lisa Holmes Observer July 2010 to November 2010 4 / 7
Ms Anita Hargreaves Observer November 2010 to June 2011 2 / 3
Representative from Observer July 2010 to June 2011 8 / 10 Auditor-General’s Office
C.1.2 Risk Management Plan
The Authority has developed and implemented a broad risk management plan in accordance with the Australian/New Zealand Standard on risk management AS/NZS ISO 31000:2009 and the ACT Government’s “Enterprise Wide Risk Management Framework”. The Authority’s plan identifies and details risks and control measures and treatment / loss mitigation plans for identified categories of risk including financial, business and IT risks. The Risk Management Plan is reviewed annually.
C.2 FRAUD PREVENTION C.3 PUBLIC INTEREST The Authority conducts a risk assessment of its DISCLOSURE operational activities and its Fraud and Integrity Plan The Public Interest Disclosure Act 1994 requires each annually. A full risk assessment was carried out in ACT Government agency to establish and maintain 2010–2011. Appropriate delegations and separation procedures to facilitate the making of public interest of duties are in place for financial and administrative disclosures. The Treasury Directorate’s Procedures operations. There were no reports or allegations of fraud for Actioning Public Interest Disclosures applies to the or corruption received during the year. Authority.
There were no incidents requiring disclosure under the Act during the financial year.
76

AUSTRALIAN CAPITAL TERRITORY INSURANCE AUTHORITY ANNUAL REPORT 2010-2011
C.4 FREEDOM OF INFORMATION Section 7 Statement
The ACT Insurance Authority was established in 2001 by the Insurance Authority Act 2000, and now operates under the amended Insurance Authority Act 2005 (the Act). Its functions under the Act include to:
• carrying on the business of insurer of Territory risks;
• insuring Territory risks with other entities;
• managing claims in relation to Territory risks; and
• promoting good risk management practice by client agencies.
The Authority is responsible for:
• advising the Treasurer and Treasury on appropriate self-insurance strategies;
• the oversight of the management of the Government’s own insurance arrangements;
• issuing policies of insurance to Government agencies; and
• the oversight of risk management policy and its implementation in ACT Government agencies.
Documents held include insurance claim files, insurance declarations and agreements, management files and finance records.
Section 8 Statement
The Authority’s Section 8 Statement is included with that of the Treasury Directorate as published.
The Authority received no requests for access to documents under the Freedom of Information Act 1989 during 2010–11.
C.5 INTERNAL ACCOUNTABILITY The Authority is responsible to the ACT Treasurer. In May 2005, the Insurance Authority Act 2000 was replaced by the Insurance Authority Act 2005. The passing of the Insurance Authority Act 2005 completed the change in governance arrangements commenced in 2003–04. Under the new Act the Director-General of Treasury is the Authority and an advisory Board is established.
Under the Government’s Administrative Arrangement Orders, the ACT Insurance Authority resides within the Treasury Directorate’s portfolio.
C.5.1 Advisory Board
The ACT Insurance Authority Advisory Board is appointed under Section 12 of the Act in accordance with Insurance Management Guidelines established under s.14 of the Act.
Guideline No.1 of 2005 requires that the Board should consist of two members appointed in writing by the Authority who must, in the opinion of the Authority, possess sufficient skill and judgement with respect to the following:
• at the request of the Treasurer or the Authority, providing advice to the Treasurer or the Authority on any question relating to the exercise by the Authority of its powers, functions or duties under the Act; and
• if, in the opinion of the Board, it should provide advice to the Treasurer or the Authority on any matter relating to the exercise by the Authority of its powers, functions or duties under the Act—providing advice on its own initiative.
Name of Member Position Duration Meetings Attended
Mr David Sandoe Member (Chair) July 10 to June 11 4
Mr Peter Matthews Member July 10 to June 11 4
Ms Megan Smithies Under Treasurer July 10 to June 11 2
Mr Roger Broughton Executive Director Investment and July 10 to June 11 4 Economics Division
John Fletcher General Manager ACTIA – Observer July 10 to June 11 4
Mr Phang‑Chun Lim Observer July 10 to June 11 4
Mr Peter Osborne Observer July 10 to June 11 4
77

AUSTRALIAN CAPITAL TERRITORY INSURANCE AUTHORITY ANNUAL REPORT 2010-2011
In regard to these appointments and retirements, the C.6 HR PERFORMANCE Director-General of Treasury is the Authority and the appointees are chosen based on skills relevant to the above requirements. Appointments must not exceed 3 years and can be revoked by the Authority for misconduct, neglect of duty or if the member becomes unable to carry out the duties of the office satisfactorily.
Mr David Sandoe, OAM,ANZIIF (Fellow) CIP, FAIM, FAICD. Mr Sandoe has over 37 years insurance and financial services industry experience and currently is a Principal and General Manager of an independently owned Australian firm of actuaries and insurance consultants. He is an Honorary Life Member of the Australian & New Zealand Institute of Insurance & Finance.
Mr Peter Matthews, ANZIIF (Fellow), CIP, AIMM, MRIMA. Mr Matthews has some 30 years insurance and risk management experience and was until his retirement in October, 2009 General Manager of the Insurance Authority.
The Board met on four occasions during 2010–11.
The remuneration of the Advisory Board members is determined by the Remuneration Tribunal.
The Advisory Board was consulted on the following major issues during 2010–11:
• reviews of major claims;
• reinsurance program for 2011–12;
• risk management matters; and
• actuarial and financial matters.
C.5.2 Audit Arrangements
Internal Audit of the authority is provided by a joint Audit Committee, which provides services to the Authority, Treasury Directorate and the Chief Minister’s and Cabinet Directorate. The Committee’s functions are governed by the Audit Committee Charter. The membership includes appointees from the two agencies and an independent Chair. Observers also regularly attend meetings including a representative from the ACT Auditor-General’s Office.
The Authority has identified areas of operational risk and developed a cyclical internal audit program designed to review these risks.
The Authority is committed to providing employment opportunities for those in identified EEO groups. Officers with disabilities are employed and appropriate strategies have been implemented to ensure they have a safe and supportive work environment.
The Authority adheres to the principles of equity and diversity as detailed in the Public Service Equity and Diversity Framework. Where possible the Authority integrates the framework into its strategic and operational planning processes. While staff have been employed by the Authority on the basis of merit of their qualifications and skills, the Authority is committed to providing employment opportunities for those in identified EEO groups. The Authority aims to create a workplace where the strengths, talents and contributions of all staff are recognised and valued. The Authority has adopted a range of measures aimed at achieving equity, diversity and work and life balance. These include:
• providing access to study leave;
• providing access to flex time and ensuring staff do not work excessive hours; and
• providing flexible working arrangements.
78

AUSTRALIAN CAPITAL TERRITORY INSURANCE AUTHORITY ANNUAL REPORT 2010-2011
C.7 STAFFING PROFILE The following tables provides statistical information for permanent staff of the Authority for 2010–11:
FTE & Headcount
Female Male
FTE by Gender 9 5
Headcount by Gender 9 5
% of Workforce 64% 36%
Classifications
Administrative Officers 5 5
Senior Officers 4 4 8
Classification Group Female Male Total
Executive Officers 1 1
Total 9 5 14
Employment Category by Gender
Employment Category Female Male Total
Casual
Permanent Full-time 9 4 13
Permanent Part-time
Temporary Full-time 1 1
Temporary Part-time
Total 9 5 14
79
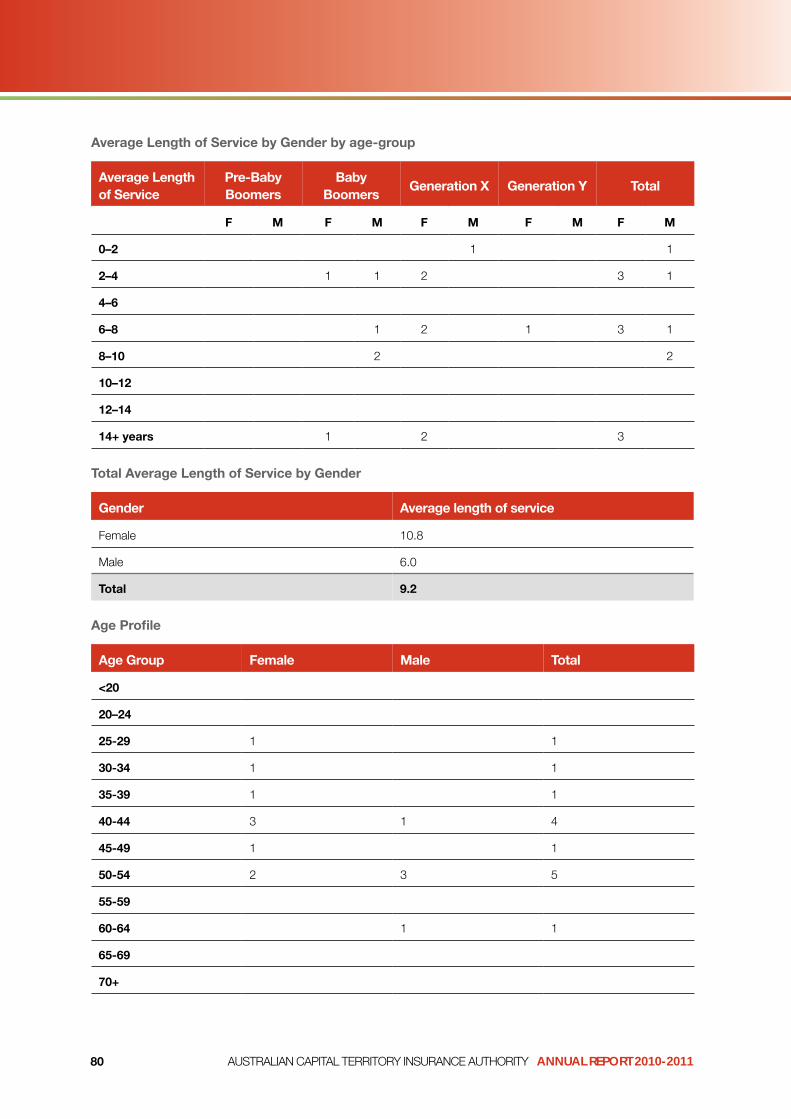
AUSTRALIAN CAPITAL TERRITORY INSURANCE AUTHORITY ANNUAL REPORT 2010-2011
25‑29
30‑34
40‑44
Average Length of Service by Gender by age‑group
Average Length of Service
Pre‑Baby Boomers
Baby Boomers
Generation X Generation Y Total
F M F M F M F M F M
0–2 1 1
2–4 1 1 2 3 1
4–6
6–8 1 2 1 3 1
8–10 2 2
10–12
12–14
14+ years 1 2 3
Total Average Length of Service by Gender
Female 10.8
Gender Average length of service
Male 6.0
Total 9.2
Age Profile
Age Group Female Male Total
<20
20–24
1 1
1 1
35‑39 1 1
3 1 4
45‑49 1 1
2 3 5
60‑64 1 1
70+
80
50‑54
55‑59
65‑69

AUSTRALIAN CAPITAL TERRITORY INSURANCE AUTHORITY ANNUAL REPORT 2010-2011
Agency Profile
Branch/Division FTE Headcount
ACT INSURANCE AUTHORITY 14 14
Total 14 14
Agency Profile by Employment Type
Branch/Division Permanent Temporary Casual
ACT INSURANCE 14 0 0 AUTHORITY
Total 14 0 0
Equity & Workplace Diversity
A B C
Aboriginal and/or Torres Strait Islander Employment
Culturally & Linguistically Diverse (CALD) Employment
Employment of people with a disability
Number of employees who identify in any of the Equity & Diversity categories (A, B, C)*
Women
Headcount 0 0 1 1 9
% of Total 0.0% 0.0% 7.1% 7.1% 64.3% Staff
C.8 LEARNING AND DEVELOPMENT The key development and learning priorities for the Authority have been identified as risk management, insurance and finance. During 2010–11 staff undertook formal training courses and attended conferences and seminars in these areas. Staff undertook 25 courses from the ACTPS Training Calender. There was one participant in the Executive Development Program.
The training undertaken in 2010–11 totalled $46,000. This expenditure represents the direct cost of training and development courses and does not include the salary equivalent of time away from the workplace in respect of staff that attended seminars and other training opportunities at no direct cost.
C.9 WORKPLACE HEALTH AND SAFETY Work Safety Act 2008 (WSA) Reporting Requirements
During 2010–11 there were no occurrences of:
• Notices of non compliances issued to the Authority under section 171;
• Reports issues under section 166 in relation to any failure to comply with either a compliance agreement; enforceable undertaking; improvement notice and/or a prohibition notice;
• Improvement or prohibition notices received;
• Notices issued under section 167 – Failure to comply with a safety duty; and
• Notices issued under 170 – Failure to comply – failure not addressed.
81

AUSTRALIAN CAPITAL TERRITORY INSURANCE AUTHORITY ANNUAL REPORT 2010-2011
Section 38 of the Work Safety Act 2008 outlines conditions under which a serious event at or near the workplace must be reported to Work Safety ACT. During 2010–11, the Authority was not required to notify any incidents under Section 38.
The Authority adheres to the Occupational Health and Safety principles set out in the Public Sector Management Standards. The Authority is committed to promoting and maintaining a high standard of health safety and well being for all staff, contractors and visitors. Resources are provided to ensure that all employees understand the basic principles of injury prevention and management. Expert assistance is available where necessary and health and safety representatives are appropriately trained.
Measures taken during the year to ensure the health, safety and welfare of employees:
• two officers have purchased leave arrangements;
• four officers have flexible working arrangements;
• four officers are members of the Nara Centre Emergency Response Training Team;
• four officers had an influenza vaccination; and
• three officers hold a first aid certificate.
The Authority is covered by the following Treasury Agreements and services:
• The Treasury Work Safety Policy Statement;
• The Treasury Workplace Health and Safety Improvement Strategy 2010–12;
• The Treasury Consultative Committee;
• The Treasury Worker Consultation Unit;
• Injury Prevention programs;
• The Treasury Physiotherapy Program;
• The Treasury Wellness Reviews and Early Psychological Intervention Program;
• The Treasury Minimising Pain and Reducing Body tressing Injuries in the Workplace Program; and
• The Treasury Employee Health and Wellbeing Campaign.
Details of the above Treasury Agreements and Services can be found in the Treasury Directorate’s Annual Report 2010–11.
C.10 WORKPLACE RELATIONS The Authority’s staff are covered under the Treasury Enterprise Agreement. There are no Special Employment Arrangements (SEAs) or Australian Workplace Agreements (AWAs) in place.
C.11 STRATEGIC BUSHFIRE MANAGEMENT PLAN The Authority is office based and does not use any bush-fire prone government land.
C.12 STRATEGIC ASSET MANAGEMENT The Authority has no assets other than furniture and fittings and investments. The Authority has some capacity to invest funds over the medium and long term.
The Authority employs 14 staff occupying 213.72m2 at the Nara Centre. The average area occupied by each is up to 15.27m2.
C.13 GOVERNMENT CONTRACTING The Authority employs consultants to perform a number specialised functions. Consultants provide insurance broking services, actuarial services, and legal advice. Contractors are employed to address short term staffing requirements. Expenditure on consultants and contractors was 52% of administration expenditure in 2010–11. The procurement selection and management processes for all contractors including consultants complied with the Government Procurement Act 2001 and the Government Procurement Regulation 2007. KPIs have been developed for key consultants. Procurement processes above $20,000 have been reviewed by ACT Procurement Solutions, and if necessary, by the Government Procurement Board consistent with the provisions of the Government Procurement Regulation 2007. The Authority has complied with all employee and industrial relations obligations in relation to contractors employed.
82

AUSTRALIAN CAPITAL TERRITORY INSURANCE AUTHORITY ANNUAL REPORT 2010-2011
External Sources of Labour
Contracts with a total financial year cost greater than $20,000
Name Description Cost Date let Procurement Type
Marsh Insurance consultants $407,000 June 2008 Open Tender
Pricewaterhouse Coopers Actuarial advice and $140,500 October 2007 Open Tender business services
C.15 TERRITORY RECORDS The Authority complies with the Territory Records Act 2002.
The Authority has adopted the “whole of government” approach to record creation and storage, as directed by Territory Records Office for all new files created from 1 July 2009 onwards.
ACTIA generates individual claim files for each claimant or plaintiff, and relevant details are recorded in the Authority’s claims management computer system. An archive field has been allocated in this system to record file movements to Territory archiving facilities. Boxed files are issued with a barcode reference number once they are archived by Record Services. These codes are then recorded in the archive field on the claimant file in the claims system database. A hard copy of all archive transfers complete with the box reference numbers is kept in a secure place. Staff within the Authority have undergone appropriate training in records management.
C.16 HUMAN RIGHTS ACT 2004 The Authority adheres to the principles as set out in the Human Rights Act 2004. The Authority is committed to a workplace that respects, protects and promotes human rights. Where possible the Authority will integrate the human rights standards into its strategic and operational planning processes. Staff are able to undertake training on human rights principles as part of their personal development programs and have access to information on human rights and the scrutiny process. The Authority has not developed any policy proposals that require consultation with the Human Rights Unit and the Authority does not administer any legislation which has substantial human rights implications.
C.17 COMMISSIONER FOR THE ENVIRONMENT The Authority has made no reports to, nor received requests for information from, the Commissioner for the Environment. The activities of the Authority do not have a significant environmental impact.
C.18 ACT MULTICULTURAL STRATEGY 2010–13 The Authority adheres to the principles as set out in the ACT Multicultural Strategy 2010–2013. The Authority is committed to a client focused service delivery in a culturally and linguistically diverse society. Where possible the Authority will integrate the strategy into its strategic and operational planning processes
C.19 ABORIGINAL AND TORRES STRAIT ISLANDER REPORTING The Authority adheres to the principles of the ACT Whole of Government Indigenous policy. However the nature of our business means that the strategic areas for action and change detailed in the ACT Whole of Government Indigenous Reporting Framework are not applicable to the Authority.
83

AUSTRALIAN CAPITAL TERRITORY INSURANCE AUTHORITY ANNUAL REPORT 2010-2011
C.20 ECOLOGICALLY SUSTAINABLE DEVELOPMENT The Authority applies appropriate management practices that are consistent with the principles of ecological sustainable development. The Authority uses recycled paper and cardboard where possible and uses energy efficient office machines. Recycling bins are provided for staff. Where possible electronic communications are used in preference to paper.
The Treasury Directorate’s Annual Report section on Ecologically Sustainable Development also applies to the Authority.
C.21 ACT WOMEN’S PLAN 2010–2015 The Authority is committed to valuing and investing in women. In particular it supports and promotes flexible work arrangements for female staff.
The Treasury Directorate’s Annual Report section on the ACT Women’s Plan also applies to the Authority.
C.22 MODEL LITIGANT GUIDELINES This report is prepared in accordance with section 5AC of the Law Officer Act 1992.
The Chief Executive has the following procedures in place to ensure that the Authority is aware of and complying with the Guidelines.
(1) the General Manager is advised on a monthly basis on the status of all current litigation and legal proceedings. The General Manager is also advised on a weekly basis of the current status of all Freedom of Information requests
(2) the Authority’s legal services are provided by the ACT Government Solicitor’s office, which reviews the Authority’s instructions to ensure compliance with the guidelines. The Authority is able to rely upon the ACTGS to identify those matters where a question arises as to compliance with the Model Litigant Guidelines and to address it or elevate it within the department as appropriate; and
(3) all staff involved in claims procedures or other decisions which may at some point become the subject of litigation are informed of the guidelines and instructed to comply with them, referring any queries to the ACTGS.
The Authority is not aware of any breaches of the Model Litigant Guidelines during the financial year.
84
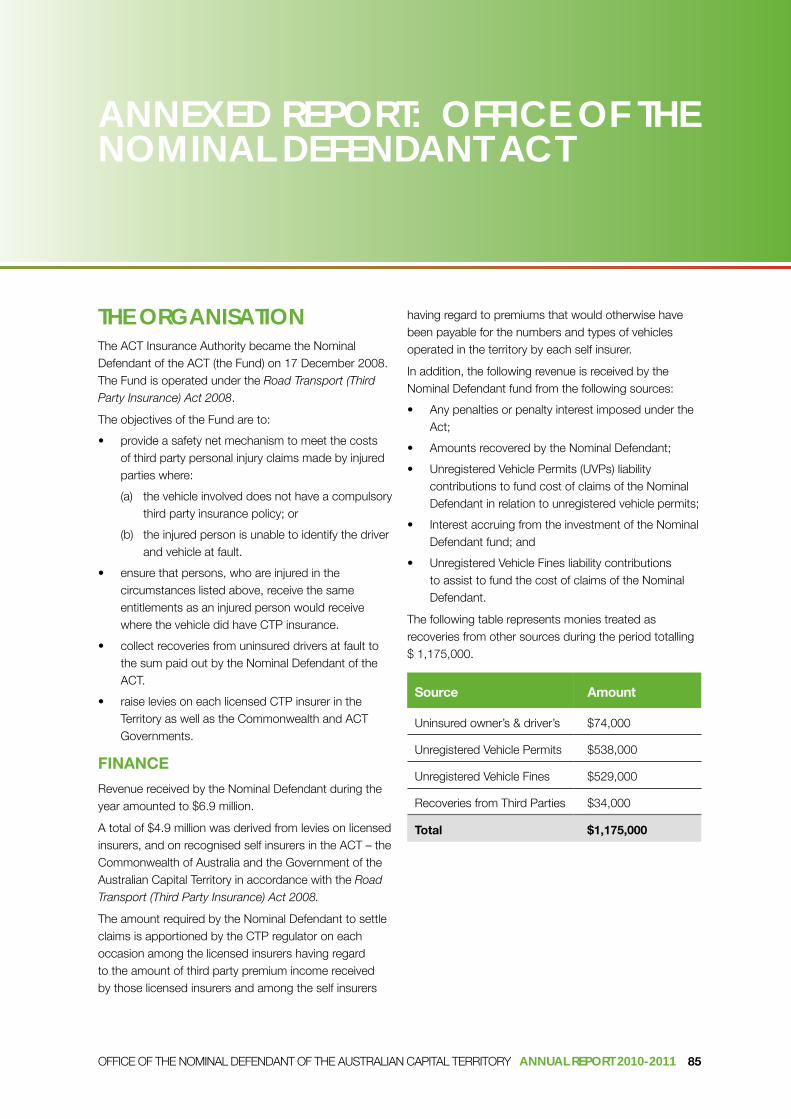
OFFICE OF THE NOMINAL DEFENDANT OF THE AUSTRALIAN CAPITAL TERRITORY ANNUAL REPORT 2010-2011
ANNEXED REPORT: OFFICE OF THE NOMINAL DEFENDANT ACT
THE ORGANISATION The ACT Insurance Authority became the Nominal Defendant of the ACT (the Fund) on 17 December 2008. The Fund is operated under the Road Transport (Third Party Insurance) Act 2008.
The objectives of the Fund are to:
• provide a safety net mechanism to meet the costs of third party personal injury claims made by injured parties where:
(a) the vehicle involved does not have a compulsory third party insurance policy; or
(b) the injured person is unable to identify the driver and vehicle at fault.
• ensure that persons, who are injured in the circumstances listed above, receive the same entitlements as an injured person would receive where the vehicle did have CTP insurance.
• collect recoveries from uninsured drivers at fault to the sum paid out by the Nominal Defendant of the ACT.
• raise levies on each licensed CTP insurer in the Territory as well as the Commonwealth and ACT Governments.
FINANCE
Revenue received by the Nominal Defendant during the year amounted to $6.9 million.
A total of $4.9 million was derived from levies on licensed insurers, and on recognised self insurers in the ACT – the Commonwealth of Australia and the Government of the Australian Capital Territory in accordance with the Road Transport (Third Party Insurance) Act 2008.
The amount required by the Nominal Defendant to settle claims is apportioned by the CTP regulator on each occasion among the licensed insurers having regard to the amount of third party premium income received by those licensed insurers and among the self insurers
having regard to premiums that would otherwise have been payable for the numbers and types of vehicles operated in the territory by each self insurer.
In addition, the following revenue is received by the Nominal Defendant fund from the following sources:
• Any penalties or penalty interest imposed under the Act;
• Amounts recovered by the Nominal Defendant;
• Unregistered Vehicle Permits (UVPs) liability contributions to fund cost of claims of the Nominal Defendant in relation to unregistered vehicle permits;
• Interest accruing from the investment of the Nominal Defendant fund; and
• Unregistered Vehicle Fines liability contributions to assist to fund the cost of claims of the Nominal Defendant.
The following table represents monies treated as recoveries from other sources during the period totalling $ 1,175,000.
Source Amount
Uninsured owner’s & driver’s $74,000
Unregistered Vehicle Permits $538,000
Unregistered Vehicle Fines $529,000
Recoveries from Third Parties $34,000
Total $1,175,000
85

OFFICE OF THE NOMINAL DEFENDANT OF THE AUSTRALIAN CAPITAL TERRITORY ANNUAL REPORT 2010-2011
CLAIMS
There are currently 80 open claims remaining as at 30 June 2011 with a combined total provision for claims payable of $14.1 million.
The total claims expense recognised during the reporting period was $3.3 million.
During the 2011 insurance year, damages resulting from the use of uninsured vehicles accounted for 31% of claims while damages resulting from unidentified vehicles accounted for 69% of claims.
During the same period there were approximately 0.155 claims per 1,000 vehicles registered in the ACT. A comparison between the number of vehicles registered and the number of claims made to the Fund is shown in Figure 1.
Figure 1: Claim frequency and vehicle registrations
0.000
0.050
0.100
0.150
0.200
0.250
0.300
0
50
100
150
200
250
300
Cla
ims
per
tho
usan
d v
ehic
les
AC
T ve
hic
les
reg
iste
red
('000
)
2000 2001 2002 2003 2004 2005 2006 2007 2008 2009 2010 2011
Accident year
Vehicles registered Previous frequency Adopted frequency
Source: Nominal Defendant Liability Valuation Report as at 30 June 2011 produced by KPMG Actuarial
Note:
• The vehicle registrations for 2011 are sourced from Road User Services ACT, and other years from previous actuarial reports.
• Claim frequency refers to number of road incidents giving rise to a claim, whether one or more claimants. The measure is expressed per thousand vehicles registered.
86

OFFICE OF THE NOMINAL DEFENDANT OF THE AUSTRALIAN CAPITAL TERRITORY ANNUAL REPORT 2010-2011
The average claim size in this period was $129,846, while the average CTP claim per policy cost was $20.13. A comparison between the average size of a claim and the cost of a CTP policy is shown at Figure 2.
Figure 2: Average claim size and cost per policy by accident year
0
5
10
15
20
25
-
20
40
60
80
100
120
140
160
CPP
$
Gro
ss a
vera
ge c
laim
siz
e ($
'000
)
2000 2001 2002 2003 2004 2005 2006 2007 2008 2009 2010 2011
Accident year
Previous CPP Average claim size Cost Per Policy
Source: Nominal Defendant Liability Valuation Report as at 30 June 2010 produced by KPMG Actuarial
Note:
• Average claim size and Cost Per Policy (CPP) are in expected payment date values, but without allowance for time value of money (i.e. present value discounting), and are gross of all recoveries.
• The historical data component is sourced from previous actuarial reports.
Where the Nominal Defendant has made payments on a claim involving an uninsured motor vehicle, attempts are made to recover the cost of those payments from the owner or driver concerned. Although the financial resources of all uninsured drivers are investigated, in the majority of cases formal recovery action would be futile because the fund is unable to locate the uninsured driver or the uninsured has limited or no financial resources.
As at 30 June 2011 the Nominal Defendant had cash and investments of $17.2 million.
FREEDOM OF INFORMATION Section 7 Statement
The functions and operations of the Fund are outlined in the “Operations and Principal Activities” section at the beginning of the annexed report.
Documents held include insurance claims, management files and finance records.
Section 8 Statement:
The Fund’s Section 8 Statement is included with that of the ACT Treasury as published.
The Fund received no requests for access to documents under the Freedom of Information Act 1989 during 2010–11.
87

OFFICE OF THE NOMINAL DEFENDANT OF THE AUSTRALIAN CAPITAL TERRITORY ANNUAL REPORT 2010-2011
Financial Statements For the Year Ended
30 June 2011
Office of the Nominal Defendant of the ACT
88

OFFICE OF THE NOMINAL DEFENDANT OF THE AUSTRALIAN CAPITAL TERRITORY ANNUAL REPORT 2010-2011 89

OFFICE OF THE NOMINAL DEFENDANT OF THE AUSTRALIAN CAPITAL TERRITORY ANNUAL REPORT 2010-201190

OFFICE OF THE NOMINAL DEFENDANT OF THE AUSTRALIAN CAPITAL TERRITORY ANNUAL REPORT 2010-2011 91

OFFICE OF THE NOMINAL DEFENDANT OF THE AUSTRALIAN CAPITAL TERRITORY ANNUAL REPORT 2010-201192

OFFICE OF THE NOMINAL DEFENDANT OF THE AUSTRALIAN CAPITAL TERRITORY ANNUAL REPORT 2010-2011 93

OFFICE OF THE NOMINAL DEFENDANT OF THE AUSTRALIAN CAPITAL TERRITORY ANNUAL REPORT 2010-201194

OFFICE OF THE NOMINAL DEFENDANT OF THE AUSTRALIAN CAPITAL TERRITORY ANNUAL REPORT 2010-2011
Office of the Nominal Defendant of the ACT Operating Statement
For the Year Ended 30 June 2011
Note Actual Actual No 2011 2010
$’000 $’000
Income Interest and Distribution Revenue 6 831 534 Levies 7 4,891 5,191 Unrealised Gain on Investments 11 - 73 Other Revenue 8 1,175 1,018
Total Income 6,897 6,816
Expenses Claims Expenses 9 3,285 5,041 Supplies and Services 10 335 410 Unrealised Loss on Investments 11 16 -
Total Expenses 3,636 5,451
Operating Surplus 3,261 1,365 Total Comprehensive Income 3,261 1,365
The above Operating Statement should be read in conjunction with the accompanying notes.
95
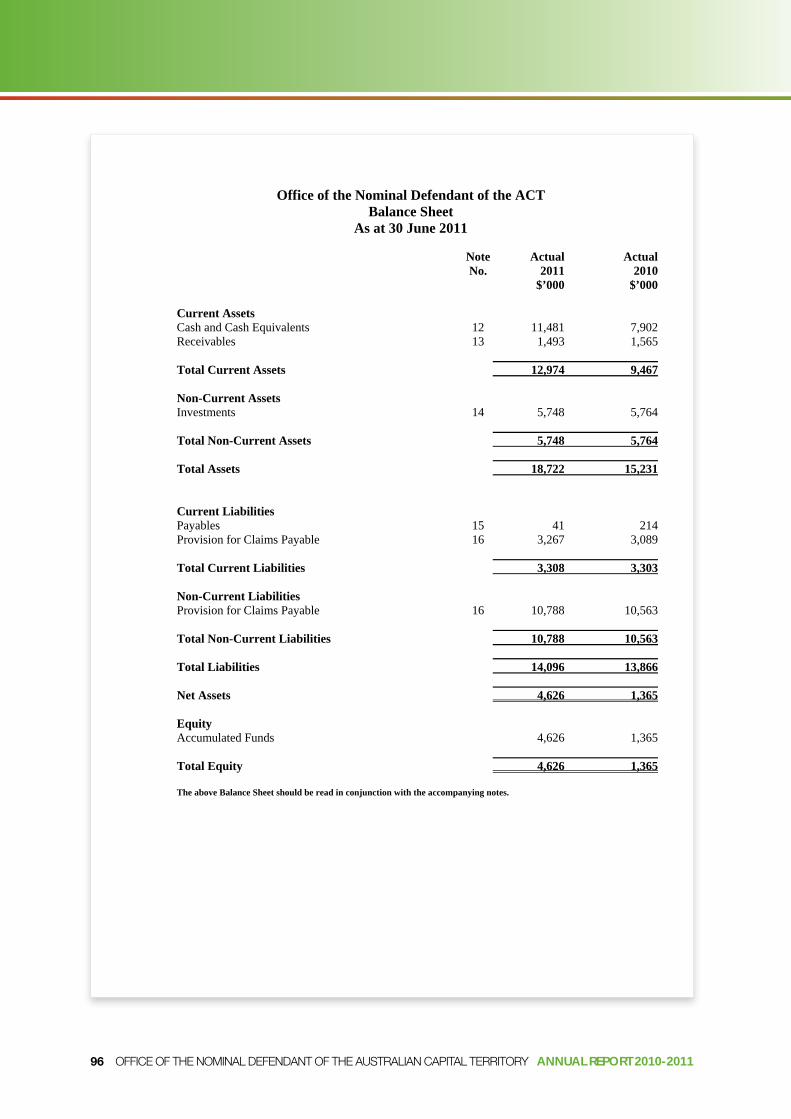
OFFICE OF THE NOMINAL DEFENDANT OF THE AUSTRALIAN CAPITAL TERRITORY ANNUAL REPORT 2010-2011
Office of the Nominal Defendant of the ACT Balance Sheet
As at 30 June 2011
Note Actual Actual No. 2011 2010
$’000 $’000
Current Assets Cash and Cash Equivalents 12 11,481 7,902 Receivables 13 1,493 1,565
Total Current Assets 12,974 9,467
Non-Current Assets Investments 14 5,748 5,764
Total Non-Current Assets 5,748 5,764
Total Assets 18,722 15,231
Current Liabilities Payables 15 41 214 Provision for Claims Payable 16 3,267 3,089
Total Current Liabilities 3,308 3,303
Non-Current Liabilities Provision for Claims Payable 16 10,788 10,563
Total Non-Current Liabilities 10,788 10,563
Total Liabilities 14,096 13,866
Net Assets 4,626 1,365
Equity Accumulated Funds 4,626 1,365
Total Equity 4,626 1,365
The above Balance Sheet should be read in conjunction with the accompanying notes.
96

OFFICE OF THE NOMINAL DEFENDANT OF THE AUSTRALIAN CAPITAL TERRITORY ANNUAL REPORT 2010-2011
Office of the Nominal Defendant of the ACT Statement of Changes in Equity
For the Year Ended 30 June 2011
Accumulated Total Funds Equity Actual Actual
2011 2011 $’000 $’000
Balance at the Beginning of the Reporting Period 1,365 1,365
Comprehensive Income Operating Surplus/(Deficit) 3,261 3,261 Total Comprehensive Income 4,626 4,626
Balance at the End of the Reporting Period 4,626 4,626
Accumulated Total Funds Equity Actual Actual
2010 2010 $’000 $’000
Balance at the Beginning of the Reporting Period - -
Comprehensive Income Operating Surplus/(Deficit) 1,365 1,365 Total Comprehensive Income 1,365 1,365
Balance at the End of the Reporting Period 1,365 1,365
The above Statement of Changes in Equity should be read in conjunction with the accompanying notes.
97

OFFICE OF THE NOMINAL DEFENDANT OF THE AUSTRALIAN CAPITAL TERRITORY ANNUAL REPORT 2010-2011
Office of the Nominal Defendant of the ACT Cash Flow Statement
For the Year Ended 30 June 2011
Note Actual Actual No. 2011 2010
$’000 $’000
Cash Flows from Operating Activities Receipts Interest and Distribution Received 877 588 Recoveries 108 349 Fees and Fines 1,071 576 Levies 4,861 5,261 Goods and Services Input Tax Credits from the Australian Taxation Office 273 298 Total Receipts from Operating Activities 7,190 7,072
Payments Supplies and Services 509 210 Payment of Claims 2,879 3,150 Goods and Services Tax Paid to Suppliers 223 251
Total Payments from Operating Activities 3,611 3,611
Net Cash Inflows from Operating Activities 19 3,579 3,461
Net Increase in Cash and Cash Equivalents Held 3,579 3,461 Cash and Cash Equivalents at Beginning of Reporting Period 7,902 4,441
Cash and Cash Equivalents at End of Reporting Period 19 11,481 7,902
The above Cash Flow Statement should be read in conjunction with the accompanying notes.
98

OFFICE OF THE NOMINAL DEFENDANT OF THE AUSTRALIAN CAPITAL TERRITORY ANNUAL REPORT 2010-2011
Office of the Nominal Defendant of the ACT Notes to and Forming Part of the Financial Statements
For the Year Ended 30 June 2011
NOTE INDEX
Page Note 1 Objectives of the Office of the Nominal Defendant of the ACT 100
Prior Year Error
Note 2 Summary of Significant Accounting Policies 100 Note 3 Impact of Accounting Standards Issued but Yet to be Applied 104 Note 4 Critical Accounting Judgements and Estimates 104 Note 5 Change in Accounting Policy and Accounting Estimates and Corrections of a 109
Income Notes Note 6 Interest and Distributions 111 Note 7 Levies 111 Note 8 Other Revenue 112
Expense Notes Note 9 Claims Expenses 112 Note 10 Supplies and Services 112 Note 11 Unrealised Gain /(Loss) on Investments 113
Asset Notes Note 12 Cash and Cash Equivalents 113 Note 13 Receivables 113 Note 14 Investments 114
Liabilities Notes Note 15 Payables 115 Note 16 Provision for Claims Payable 115
Other Notes Note 17 Financial Instruments 116 Note 18 Contingent Liabilities and Contingent Assets 123 Note 19 Cash Flow Reconciliation 123 Note 20 Auditor’s Remuneration 123
99

OFFICE OF THE NOMINAL DEFENDANT OF THE AUSTRALIAN CAPITAL TERRITORY ANNUAL REPORT 2010-2011
Office of the Nominal Defendant of the ACT Notes to and Forming Part of the Financial Statements
For the Year Ended 30 June 2011
NOTE 1 OBJECTIVES OF THE OFFICE OF THE NOMINAL DEFENDANT OF THE ACT
Operations and Principal Activities of the Office of the Nominal Defendant of the ACT The ACT Insurance Authority took over the assets and liabilities of the Office of the Nominal Defendant of the ACT (the Fund) from the previous Nominal Defendant on 17 December 2008, and commenced operations on 1 January 2009. On establishment, $13.2 million was transferred to the Fund from the previous Nominal Defendant. The Fund is operated under the Road Transport (Third Party Insurance) Act 2008. The objectives of the Fund are to:
provide a safety net mechanism to meet the costs of third party personal injury claims made by injured parties where: a. the vehicle involved does not have a compulsory third party insurance policy; or b. the injured person is unable to identify the driver and vehicle at fault;
ensure that persons, who are injured in the circumstances listed above, receive the same entitlements as an injured person would receive where the vehicle did have Compulsory Third Party (CTP) insurance;
collect recoveries from uninsured drivers at fault to the sum paid out by the Nominal Defendant of the ACT; and
raise levies on each licensed CTP insurer in the Territory as well as the Commonwealth and ACT Governments.
NOTE 2 SUMMARY OF SIGNIFICANT ACCOUNTING POLICIES
(a) Basis of Accounting These general purpose financial statements have been prepared to comply with ‘Generally Accepted Accounting Principles’ (GAAP). These financial statements have been prepared in accordance with Australian Accounting Standards, and ACT Accounting and Disclosure Policies.
The financial statements have been prepared using the accrual basis of accounting, which recognises the effects of transactions and events when they occur. The financial statements have also been prepared according to the historical cost convention, except for assets which were valued in accordance with the (re)valuation policies applicable to the fund during the reporting period.
The financial statements are presented in Australian dollars, which is the Fund’s functional currency.
The Fund is an individual reporting entity.
(b) The Reporting Period
The financial statements state the financial performance, change in equity and cash flows of the Fund for the year ended 30 June 2011 together with the financial position of the Fund as at 30 June 2011.
100

OFFICE OF THE NOMINAL DEFENDANT OF THE AUSTRALIAN CAPITAL TERRITORY ANNUAL REPORT 2010-2011
Office of the Nominal Defendant of the ACT Notes to and Forming Part of the Financial Statements
For the Year Ended 30 June 2011
NOTE 2 SUMMARY OF SIGNIFICANT ACCOUNTING POLICIES – CONTINUED
(c) Comparative Figures
Prior Year Comparatives Comparative information has been disclosed in respect of the previous period for amounts reported in the financial statements, except where an Australian Accounting Standard does not require comparative information to be disclosed.
Where the presentation or classification of items in the financial statements is amended, the comparative amounts have been reclassified where practical. Where a reclassification has occurred, the nature, amount and reason for the reclassification is provided
(d) Rounding All amounts in the financial statements have been rounded to the nearest thousand dollars ($’000). Use of “-” represents zero amounts or amounts rounded down to zero. Some totals throughout this report may not add due to rounding.
(e) Revenue Recognition Revenue is recognised at the fair value of the consideration received or receivable in the Operating Statement. All revenue is recognised to the extent that it is probable that the economic benefits will flow to the Fund and the revenue can be reliably measured.
Levies Monies required to satisfy claims are apportioned by way of levies placed on Comprehensive Third Party Insurers and Self-Insurers in the ACT. The levies are calculated based on the market share. Levies are recognised in the Operating Statement when they have been earned.
Interest Interest rate revenue is recognised using the effective interest method.
(f) Current and Non-Current Items Assets and liabilities are classified as either current or non-current in the Balance Sheet and in the relevant notes. Assets are classified as current where they are expected to be realised within 12 months after the reporting date. Liabilities are classified as current when they are due to be settled within 12 months after the reporting date or the Fund does not have an unconditional right to defer settlement of the liability for at least 12 months after the reporting date. Assets or liabilities which do not fall within the current classification are classified as non-current.
101

OFFICE OF THE NOMINAL DEFENDANT OF THE AUSTRALIAN CAPITAL TERRITORY ANNUAL REPORT 2010-2011
Office of the Nominal Defendant of the ACT Notes to and Forming Part of the Financial Statements
For the Year Ended 30 June 2011
NOTE 2 SUMMARY OF SIGNIFICANT ACCOUNTING POLICIES – CONTINUED
(g) Cash and Cash Equivalents For the purposes of the Cash Flow Statement and the Balance Sheet, cash includes cash at bank and cash on hand. Cash equivalents include any short-term, highly liquid investments that are readily convertible to known amounts of cash and which are subject to an insignificant risk of changes in value. Cash equivalents include short-term investments held in the Justice and Community Safety (JACS) Trust Investment Account managed by an external fund manager on behalf of the Public Trustee for the ACT. Short-term investments in the JACS Trust Investment Account are measured at fair value.
(h) Receivables Accounts receivable (including interest and other receivables) are recognised at fair value and subsequently measured at amortised cost, with any adjustments to the carrying amount being recorded in the Operating Statement.
The collectability of trade and other receivables is reviewed on an ongoing basis. Debts which are known to be uncollectible are written off. An allowance for impaired losses is raised when some doubt as to collection exists. The allowance for impairment losses is based on objective evidence and review of overdue balances. The Fund considers the following is objective evidence of impairment:
a. becoming aware of financial difficulties of debtors; or b. default payments.
(i) Investments Long-term investments for the Fund are held with the Public Trustee for the ACT in a unit trust called the Fixed Interest Trust Portfolio. The price of units in the unit trust fluctuates in value. The net gain or loss on investments consists of the fluctuation in price of the unit trust between the end of the last reporting period and the end of this reporting period as well as any profit on the sale of units in the unit trust (the profit being the difference between the price at the end of the last reporting period and the sale price). The net gains or losses do not include interest or dividend income.
Long-term investments are measured at fair value with any adjustments to the carrying amount being recorded in the Operating Statement. Fair value is based on an underlying pool of investments which have quoted market prices at reporting date.
102

OFFICE OF THE NOMINAL DEFENDANT OF THE AUSTRALIAN CAPITAL TERRITORY ANNUAL REPORT 2010-2011
Office of the Nominal Defendant of the ACT Notes to and Forming Part of the Financial Statements
For the Year Ended 30 June 2011
NOTE 2 SUMMARY OF SIGNIFICANT ACCOUNTING POLICIES – CONTINUED
(j) Payables Payables are a financial liability and are measured at the fair value of the consideration received when initially recognised and at amortised cost subsequent to initial recognition, with any adjustments to the carrying amount being recorded in the Operating Statement. All amounts are normally settled within 30 days after the invoice date.
Payables include Trade Payables, Accrued Expenses and Other Payables.
Trade Payables represent the amounts owing for goods and services received prior to the end of the reporting period and unpaid at the end of the reporting period and relating to the normal operations of the Fund.
Accrued expenses represent goods and services provided by other parties during the reporting period that are unpaid at the end of the reporting period and where an invoice has not been received by period-end.
Other Payables are those unpaid invoices that do not directly relate to the normal operations of the Fund.
(k) Provision for Claims Payable The provision covers claims reported but not yet paid, incurred but not yet reported claims (“IBNR”), incurred but not enough reported (“IBNER”) and the anticipated direct and indirect costs of settling those claims. Claims outstanding are assessed by review of individual claim files and estimating changes in the ultimate cost of settling claims, IBNRs and settlement costs using statistics based on past experience and trends.
An assessment of outstanding claims is done annually by an independent actuary. The Fund has used the services of an independent actuary, KPMG Actuaries Pty Ltd, to provide a full assessment of outstanding claims at 30 June 2011.
The expected future payments are estimated on the basis of the ultimate cost of settling claims, which is affected by factors arising during the period to settlement such as normal inflation and “superimposed inflation”. Superimposed inflation refers to factors such as trends in court awards, for example increases in the level and period of compensation for injury. The expected future payments are then discounted to present value using the Commonwealth Government Bonds risk free rate.
Payables estimated to fall due within a 12-month period are classified as a current liability and all other payables as a non-current liability.
(l) Recoveries The Fund may receive recoveries from the uninsured drivers, claimant third parties, and court associated recoveries. The recoveries are included in the actuarial calculations, and are netted off from the value of outstanding claims.
103

OFFICE OF THE NOMINAL DEFENDANT OF THE AUSTRALIAN CAPITAL TERRITORY ANNUAL REPORT 2010-2011
Office of the Nominal Defendant of the ACT Notes to and Forming Part of the Financial Statements
For the Year Ended 30 June 2011
NOTE 3 IMPACT OF ACCOUNTING STANDARDS ISSUED BUT YET TO BE APPLIED
The following new and revised accounting standards and interpretations have been issued by the Australian Accounting Standards Board but do not apply to the current reporting period. These standards and interpretations are applicable to future reporting periods. The Fund does not intend to adopt these standards and interpretations early. It is estimated that the effect of adopting the below pronouncements, when applicable, will have no material financial impact on the Fund in future reporting periods:
AASB 7 Financial Instruments: Disclosures (application date 1 January 2011); AASB 9 Financial Instruments (application date 1 January 2013); AASB 101 Presentation of Financial Statements (application date 1 January 2011); AASB 107 Statement of Cash Flows (application date 1 January 2011); AASB 108 Accounting Policies, Changes in Accounting Estimates and Errors (application date
1 January 2011); AASB 110 Events After Reporting Period (application date 1 January 2011); AASB 119 Employee Benefits (application date 1 January 2011); AASB 132 Financial Instruments: Presentation (application date 1 February 2011); AASB 139 Financial Instruments: Recognition and Measurement (application date 1 January 2011); AASB 1031 Materiality (application date 1 January 2011); AASB 1053 Application of Tiers of Australian Accounting Standards (application date 1 January 2013) AASB 2009-11 Amendments to Australian Accounting Standards arising from AASB 9 [AASB 4, 101,
132, 136, 139 & 1023] (application date 1 January 2013); AASB 2010-2 Amendments to Australian Accounting Standards arising from Reduced Disclosure
Requirements [AASB 1,2, 3, 7, 8, 101, 107, 108, 110, 111, 112, 121, 124, 127, 128, 133, 134, 136, 141 & 1050 and Interpretations 2,4, 5, 15, 17, 127 & 129] (application date 1 January 2013);
AASB 2010-6 Amendments to Australian Accounting Standards – Disclosures on Transfer of Financial Assets [AASB 1 & AASB 7] (application date 1 July 2011); and
AASB 2010-07 Amendments to Australian Accounting Standards arising from AASB 9 (December 2010) [AASB 1, 3, 4, 7, 101, 108, 112, 120, 121, 127, 128, 132, 136, 137, 139 & 1023 and Interpretations 2, 5, 10, 12, 19 and 127] (application date 1 January 2013).
NOTE 4 CRITICAL ACCOUNTING JUDGEMENTS AND ESTIMATES
(a) Measurement of the Provision for Outstanding Claims
The Fund is not required to comply with AASB 1023: General Insurance Contracts as its operations are not underpinned by contracts of insurance with its customers. Contracts of insurance need to be in existence in order for a reporting entity to apply AASB 1023. Instead, liabilities are reported under AASB 137: Provisions, Contingent Liabilities and Contingent Assets. The measurement of liabilities under AASB 137 is based on an actuarial assessment, in the context of the Fund’s claims, equating to the central estimate of claim liabilities (i.e. without an explicit risk margin).
104

OFFICE OF THE NOMINAL DEFENDANT OF THE AUSTRALIAN CAPITAL TERRITORY ANNUAL REPORT 2010-2011
Office of the Nominal Defendant of the ACT Notes to and Forming Part of the Financial Statements
For the Year Ended 30 June 2011
NOTE 4 CRITICAL ACCOUNTING JUDGEMENTS AND ESTIMATES - CONTINUED
(b) Actuarial Assumptions
The actuarial estimate of provision for claims payable comprises:
future compensation payments on open reported claims;
future compensation payments for claims that have been incurred but not reported (i.e. IBNR);
any recoveries, including input tax credits, recoveries from owners of unregistered vehicles and sharing
recoveries, where relevant;
an estimate of the costs associated with managing the claims, such as the staff costs for employees managing the claims; and
claims inflated and discounted to a ‘present value’ basis.
Analysis and estimates are analysed in aggregate, without being subdivided by claim types.
The approaches used in estimating the liability for all claims were as follows:
Method 1
historical claim payments of the previous and current Nominal Defendant and outstanding case estimates were summarised by accident and payment year;
adequacy of case estimates was assessed by comparing the outstanding case estimates for a given accident year at each year end, with payments in the following year added to outstanding case estimates at the following year end, and consideration given to the need to assume future increases in case estimates; and
a rate of payout was assumed, with the projected payments then discounted to a present value, to allow for the expected timing of those payments.
Method 2
projection of IBNR claims by examining the rate of reporting as a frequency relative to vehicle registrations;
claim payments were inflated to a common year (the 2010-11 year) using historical inflation indices;
the payment pattern per number of claims incurred was analysed for each accident year, and an assumption made regarding a base average claim size and payment pattern for the run off of claims incurred to 30 June 2011; and
the average claim size and pattern was applied to the reported and projected future reported claim numbers to derive projected payments, with the projected payments adjusted for future claims inflation and discounting to present value, allowing for the expected timing of those payments.
A blend of methods was adopted reflecting the relative strengths of those methods in projecting liabilities at different stages of development.
105

OFFICE OF THE NOMINAL DEFENDANT OF THE AUSTRALIAN CAPITAL TERRITORY ANNUAL REPORT 2010-2011
Office of the Nominal Defendant of the ACT Notes to and Forming Part of the Financial Statements
For the Year Ended 30 June 2011
NOTE 4 CRITICAL ACCOUNTING JUDGEMENTS AND ESTIMATES -CONTINUED
(b) Actuarial Assumptions - Continued
Table 1 outlines the main assumptions which were made in estimating the provision for claims payable.
Table 1 – Selected Actuarial Assumptions
Assumption 2011 2010
Claim frequency per thousand vehicles 0.155 per 1,000 0.185 per 1,000
Gross average claim size 2010-11 values (Method 2) $97,000 $84,400
Case estimate development factors (Method 1) 1.2 reducing to 1 1.2 reducing to 1
Claims inflation – wage inflation 4.25% pa 4.25% pa
Claims inflation – superimposed inflation 3.0% pa 3.0% pa
Discount rate 5.05% pa 4.86% pa
Discounted average term to settlement 3.30 years 3.32 years
Claims handling expenses 7% 5.5%
Projected Claim Numbers The projected claim numbers have been determined based on assumed pattern of claim emergence using chain ladder projections or the application of average claim frequencies to measures of exposure. This projection results in an underlying assumed average claim frequency per thousand registered vehicles. Individual years will vary based on experience to date.
Case estimate development factors For those years with reliance on Method 1, the projected increase over case estimates in each year ranges from 1.2 (i.e. an increase of 20%) for a more recent year, reducing to 1 after eight years of development (i.e. no further increase in estimates after that point).
Claims Inflation Rate A base wage inflation rate of 4.25% per annum has been selected. However, claims costs have a tendency to increase above the rate of wage inflation over time. A rate of 3.00% per annum for additional (ie superimposed) inflation has been adopted. Method 2 uses these assumptions, while inflation is implicit in Method 1.
Discount Rate
The estimate of the Fund’s liability is provided on both a discounted (i.e. allowing for future investment income) and undiscounted basis. To discount the liability, the Fund has used the market yield as at 30 June 2011 on long-duration Commonwealth bonds, which gives weighted average discount rates of 5.05%.
106
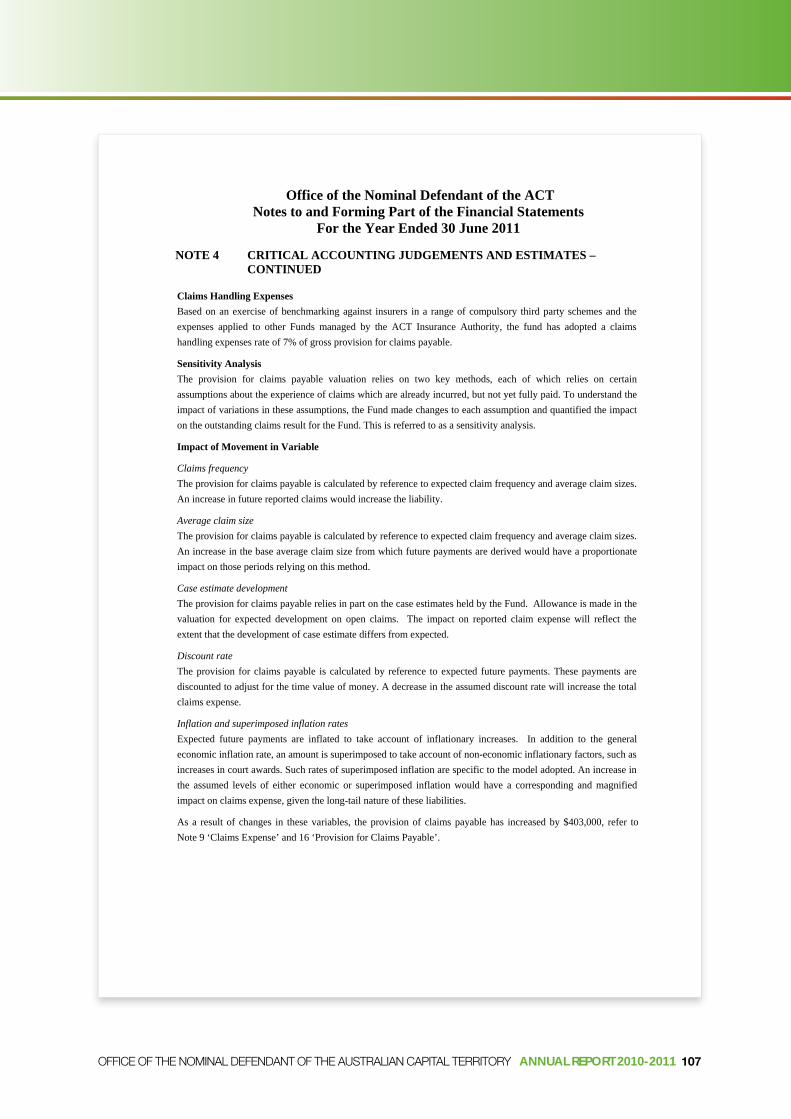
OFFICE OF THE NOMINAL DEFENDANT OF THE AUSTRALIAN CAPITAL TERRITORY ANNUAL REPORT 2010-2011
Office of the Nominal Defendant of the ACT Notes to and Forming Part of the Financial Statements
For the Year Ended 30 June 2011
NOTE 4 CRITICAL ACCOUNTING JUDGEMENTS AND ESTIMATES – CONTINUED
Claims Handling Expenses Based on an exercise of benchmarking against insurers in a range of compulsory third party schemes and the expenses applied to other Funds managed by the ACT Insurance Authority, the fund has adopted a claims handling expenses rate of 7% of gross provision for claims payable.
Sensitivity Analysis The provision for claims payable valuation relies on two key methods, each of which relies on certain assumptions about the experience of claims which are already incurred, but not yet fully paid. To understand the impact of variations in these assumptions, the Fund made changes to each assumption and quantified the impact on the outstanding claims result for the Fund. This is referred to as a sensitivity analysis.
Impact of Movement in Variable
Claims frequency The provision for claims payable is calculated by reference to expected claim frequency and average claim sizes. An increase in future reported claims would increase the liability.
Average claim size The provision for claims payable is calculated by reference to expected claim frequency and average claim sizes. An increase in the base average claim size from which future payments are derived would have a proportionate impact on those periods relying on this method.
Case estimate development The provision for claims payable relies in part on the case estimates held by the Fund. Allowance is made in the valuation for expected development on open claims. The impact on reported claim expense will reflect the extent that the development of case estimate differs from expected.
Discount rate The provision for claims payable is calculated by reference to expected future payments. These payments are discounted to adjust for the time value of money. A decrease in the assumed discount rate will increase the total claims expense.
Inflation and superimposed inflation rates Expected future payments are inflated to take account of inflationary increases. In addition to the general economic inflation rate, an amount is superimposed to take account of non-economic inflationary factors, such as increases in court awards. Such rates of superimposed inflation are specific to the model adopted. An increase in the assumed levels of either economic or superimposed inflation would have a corresponding and magnified impact on claims expense, given the long-tail nature of these liabilities.
As a result of changes in these variables, the provision of claims payable has increased by $403,000, refer to Note 9 ‘Claims Expense’ and 16 ‘Provision for Claims Payable’.
107

OFFICE OF THE NOMINAL DEFENDANT OF THE AUSTRALIAN CAPITAL TERRITORY ANNUAL REPORT 2010-2011
Office of the Nominal Defendant of the ACT Notes to and Forming Part of the Financial Statements
For the Year Ended 30 June 2011
NOTE 4 CRITICAL ACCOUNTING JUDGEMENTS AND ESTIMATES – CONTINUED
Uncertainty
General sources of uncertainty
General areas of uncertainty include:
data error – the base data can contain material errors or may not be representative of the current portfolio of business;
model error – incorrect or inappropriate models may be used to project the future claims;
parameter error – the selected values for various assumptions within the valuation are in some cases based on judgement and may not accurately represent the future values for the parameters;
random error – claims development is, by its nature, subject to random variation; and
unforeseen development due to events including jury decisions, court interpretations, legislative changes, public attitudes, potential sources of ‘latent claims’ (e.g. child claims in the context of compulsory third party), and social/economic conditions such as inflation.
Fund specific sources of uncertainty
Specific sources of uncertainty of note include:
the change in administration of the portfolio, with limited data post transfer, and any potential change in the way claims are managed which are as yet an unknown;
the small number of claims in each year leads to significant volatility. Separating trends from variation can be challenging; and
the currency of the data. Delays in entering data into the database will affect how up to date the data is. The need for numerous adjustments introduces additional risk to the process. The number of amendments is reducing over time, and the Fund’s claims management are investigating building in error flagging to the database.
108
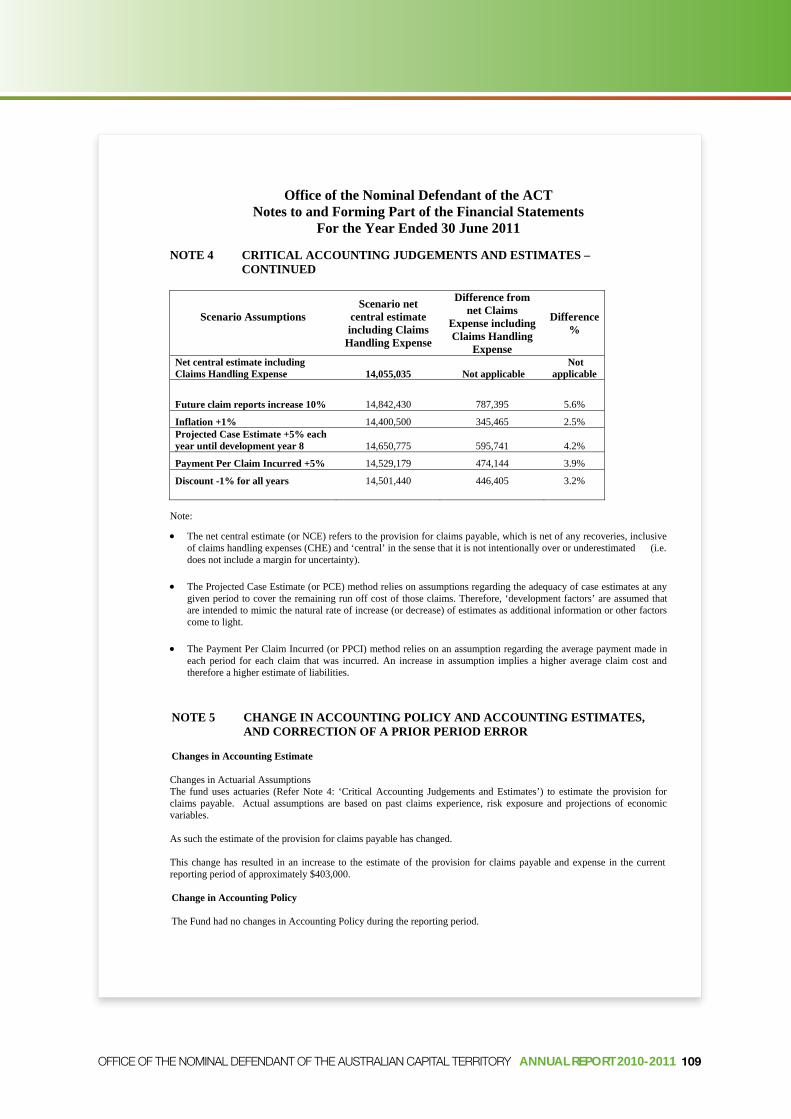
OFFICE OF THE NOMINAL DEFENDANT OF THE AUSTRALIAN CAPITAL TERRITORY ANNUAL REPORT 2010-2011
Office of the Nominal Defendant of the ACT Notes to and Forming Part of the Financial Statements
For the Year Ended 30 June 2011
NOTE 4 CRITICAL ACCOUNTING JUDGEMENTS AND ESTIMATES – CONTINUED
Scenario Assumptions Scenario net
central estimate including Claims
Handling Expense
Difference from net Claims
Expense including Claims Handling
Expense
Difference %
Net central estimate including Not Claims Handling Expense 14,055,035 Not applicable applicable
Future claim reports increase 10% 14,842,430 787,395 5.6%
Inflation +1% 14,400,500 345,465 2.5% Projected Case Estimate +5% each year until development year 8 14,650,775 595,741 4.2%
Payment Per Claim Incurred +5% 14,529,179 474,144 3.9%
Discount -1% for all years 14,501,440 446,405 3.2%
Note:
The net central estimate (or NCE) refers to the provision for claims payable, which is net of any recoveries, inclusive of claims handling expenses (CHE) and ‘central’ in the sense that it is not intentionally over or underestimated (i.e. does not include a margin for uncertainty).
The Projected Case Estimate (or PCE) method relies on assumptions regarding the adequacy of case estimates at any given period to cover the remaining run off cost of those claims. Therefore, ‘development factors’ are assumed that are intended to mimic the natural rate of increase (or decrease) of estimates as additional information or other factors come to light.
The Payment Per Claim Incurred (or PPCI) method relies on an assumption regarding the average payment made in each period for each claim that was incurred. An increase in assumption implies a higher average claim cost and therefore a higher estimate of liabilities.
NOTE 5 CHANGE IN ACCOUNTING POLICY AND ACCOUNTING ESTIMATES, AND CORRECTION OF A PRIOR PERIOD ERROR
Changes in Accounting Estimate
Changes in Actuarial Assumptions The fund uses actuaries (Refer Note 4: ‘Critical Accounting Judgements and Estimates’) to estimate the provision for claims payable. Actual assumptions are based on past claims experience, risk exposure and projections of economic variables.
As such the estimate of the provision for claims payable has changed.
This change has resulted in an increase to the estimate of the provision for claims payable and expense in the current reporting period of approximately $403,000.
Change in Accounting Policy
The Fund had no changes in Accounting Policy during the reporting period.
109

OFFICE OF THE NOMINAL DEFENDANT OF THE AUSTRALIAN CAPITAL TERRITORY ANNUAL REPORT 2010-2011
Office of the Nominal Defendant of the ACT Notes to and Forming Part of the Financial Statements
For the Year Ended 30 June 2011
NOTE 5 CHANGE IN ACCOUNTING POLICY AND ACCOUNTING ESTIMATES, AND CORRECTION OF A PRIOR PERIOD ERROR - CONTINUED
Correction of Prior Period Error
Monies required to satisfy claims are apportioned by way of levies placed on Comprehensive Third Party Insurers and Self-Insurers in the ACT. Levies are recognised in the Operating Statement when they have been earned. The proportion of levies received or receivable not yet earned at the reporting date in 2009-10 was recognised in the balance sheet as levies received in advance. As there is no mechanism in the Road Transport (Third Party Insurance) Act 2008 for the Fund to repay levies, levies received in advance should have been recognised as revenue rather than a liability.
As this error was made in the 2009-10 reporting period, the Balance Sheet and Operating balances as at 30 June 2010 were restated as follows:
Revenue Received in Advance of $1,365,000 was removed from the Fund’s Balance Sheet;
Accumulated Funds were increased by $1,365,000;
Levies was increased by $1,365,000; and
Operating Surplus was increased by $1,365,000.
The section below, ‘Restatement of Financial Statements as a result of Correction of an Error’ shows the restatement of each line item effected by the error.
Restatement of Financial Statements as a result of Correction of an Error
30 June 2010 Comparative Year
Financial Statement Line Item/ Balance Affected Note No. Actual Correction of Restated 2010 Error Actual
$’000 Adjustment 2010 $’000 $’000
Operating Statement (Extract) Income Levies 7 3,826 1,365 5,191 Total Income 5,451 1,365 6,816 Operating Surplus - 1,365 1,365
Balance Sheet (Extract) Current Liabilities Levies Received in Advance 16 1,365 (1,365) -Total Current Liabilities 4,668 (1,365) 3,303 Total Liabilities 15,231 (1,365) 13,866 Net Assets - 1,365 1,365 Equity Accumulated Funds - 1,365 1,365 Total Equity - 1,365 1,365
Statement of Changes in Equity (Extract) Operating Surplus - 1,365 1,365
110

OFFICE OF THE NOMINAL DEFENDANT OF THE AUSTRALIAN CAPITAL TERRITORY ANNUAL REPORT 2010-2011
Office of the Nominal Defendant of the ACT Notes to and Forming Part of the Financial Statements
For the Year Ended 30 June 2011
NOTE 5 CHANGE IN ACCOUNTING POLICY AND ACCOUNTING ESTIMATES, AND CORRECTION OF A PRIOR PERIOD ERROR - CONTINUED
Restatement of Financial Statements as a result of Correction of an Error (Continued)
Financial Statement Line Item/ Balance Affected Actual Correction of Restated 2010 Error Actual
$’000 Adjustment 2010 $’000 $’000
Note 7. Levies (Extract)
Levies from insurers 3,783 1,365 5,148 Levies from the Commonwealth Government 11 - 11 Levies from the ACT Government 32 - 32 Total Levies 3,826 1,365 5,191
Note 16. Levies Received in Advance (Extract)
Levies Received in Advance 1,365 (1,365) -Total Levies Received in Advance 1,365 (1,365) -
NOTE 6 INTEREST AND DISTRIBUTIONS
2011 2010 $’000 $’000
Revenue Received from ACT Government Entities Interest Revenue from Investments 456 182 Distribution Revenue from Investments 359 346
Revenue from Non-ACT Government Entities Interest Revenue from Bank 16 6
Total Interest Revenue 831 534
NOTE 7 LEVIES
Claims and administrative costs of the Fund are paid by raising a levy on all licensed Compulsory Third Party insurers in the ACT and the Commonwealth and Territory Governments.
Levies from Insurers1 4,836 5,148 Levies from the Commonwealth Government 15 11 Levies from the ACT Government 40 32
Total Levies 4,891 5,191
Correction of Prior Period Error see Note 5
111
1

OFFICE OF THE NOMINAL DEFENDANT OF THE AUSTRALIAN CAPITAL TERRITORY ANNUAL REPORT 2010-2011
Office of the Nominal Defendant of the ACT Notes to and Forming Part of the Financial Statements
For the Year Ended 30 June 2011
NOTE 8 OTHER REVENUE
2011 2010 $’000 $’000
Unregistered Vehicle Permits 538 463 Unregistered Vehicle Fines 529 206 Uninsured Owner/ Driver 74 99 Recoveries from Third Parties 34 250
Total Revenue 1,175 1,018
Recoveries from uninsured owners/ drivers and third parties are very unpredictable and may vary significantly from year to year.
NOTE 9 CLAIMS EXPENSES
Settlements 2,029 2,425 Medical Costs 221 227 Investigation Costs 34 47 Legal Costs 598 451 Movement in Provision for Claims Payable 403 1,891
Total Claims Expenses 3,285 5,041
NOTE 10 SUPPLIES AND SERVICES
Administration Expenses 197 137 Audit Fees 26 24 Purchased Administrative Services from the ACT Insurance Authority
and Default Insurance Fund 112 249
Total Supplies and Services 335 410
112

OFFICE OF THE NOMINAL DEFENDANT OF THE AUSTRALIAN CAPITAL TERRITORY ANNUAL REPORT 2010-2011
Office of the Nominal Defendant of the ACT Notes to and Forming Part of the Financial Statements
For the Year Ended 30 June 2011
NOTE 11 UNREALISED GAIN/ (LOSS) ON INVESTMENTS
2011 2010 $’000 $’000
Unrealised Gain on Investments - 73 Unrealised Loss on Investments (16) -
Total Unrealised (Loss)/Gain on Investments (16) 73
NOTE 12 CASH AND CASH EQUIVALENTS
The Fund holds a bank account with the Commonwealth Bank as part of the whole-of-government banking arrangements. The Fund also held short-term investments with Public Trustee in the JACS Trust Investment Account throughout the year. The investment earned a floating interest rate of 4.5% (4.6% in 2010). These funds are able to be withdrawn upon request and are not subject to movement in market value and, as such, meet the definition of a cash equivalent.
Cash at Bank 4 391 Investments 11,477 7,511
Total Cash and Cash Equivalents 11,481 7,902
An increase in cash and cash equivalents reflects the building of funds in order to meet the cost of future claims.
NOTE 13 RECEIVABLES
Current Receivables Interest 85 131 GST Receivable 47 98 Accrued Levies 1,361 1,336 Total Receivables 1,493 1,565
Aging of Receivables Not Overdue Past Due Total
Less Than 30 to 60 Greater than 30 Days Days 60 days
$’000 $’000 $’000 $’000 $’000 2011 Not Impaired1
Receivables 1,493 - - - 1,493 Impaired Receivables - - - - -
2010 Not Impaired1
Receivables 1,565 - - - 1,565 Impaired Receivables - - - - -
1) ‘Not Impaired’ refers to Net Receivables (that is Gross Receivables less Impaired Receivables). The Fund does not hold any collateral for receivables that are overdue or determined to be impaired.
113
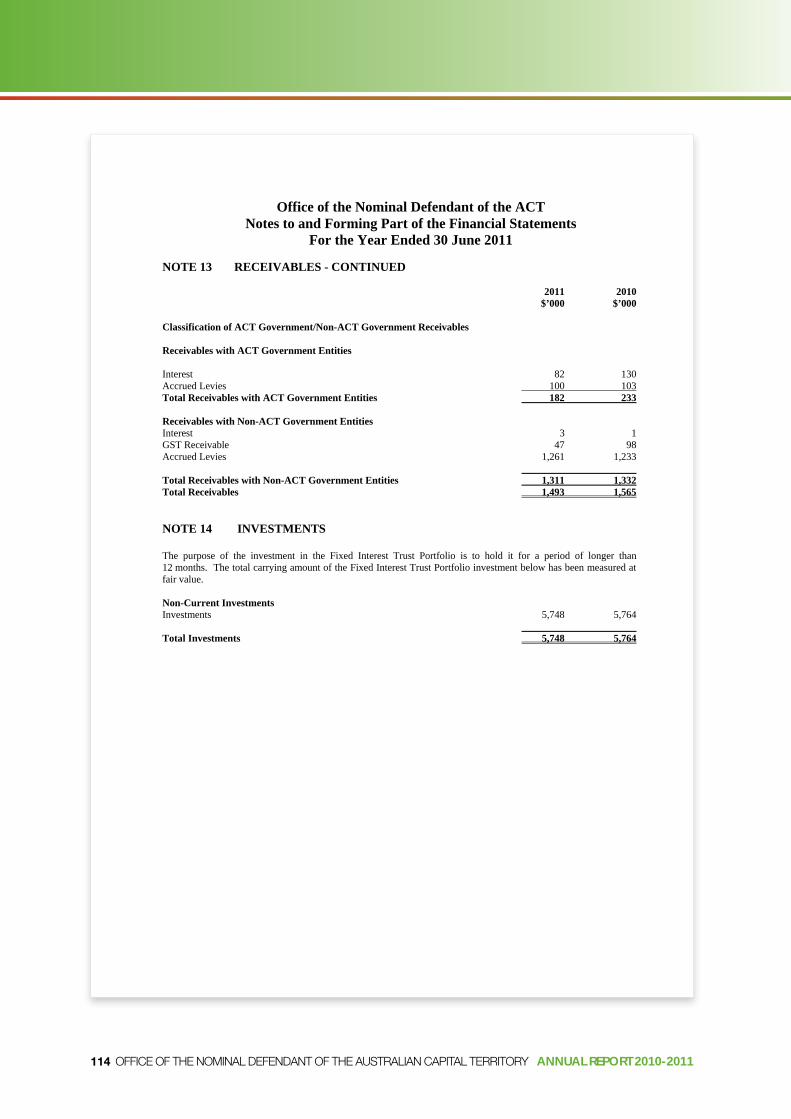
OFFICE OF THE NOMINAL DEFENDANT OF THE AUSTRALIAN CAPITAL TERRITORY ANNUAL REPORT 2010-2011
Office of the Nominal Defendant of the ACT Notes to and Forming Part of the Financial Statements
For the Year Ended 30 June 2011
NOTE 13 RECEIVABLES - CONTINUED
2011 2010 $’000 $’000
Classification of ACT Government/Non-ACT Government Receivables
Receivables with ACT Government Entities
Interest 82 130 Accrued Levies 100 103 Total Receivables with ACT Government Entities 182 233
Receivables with Non-ACT Government Entities Interest 3 1 GST Receivable 47 98 Accrued Levies 1,261 1,233
Total Receivables with Non-ACT Government Entities 1,311 1,332 Total Receivables 1,493 1,565
NOTE 14 INVESTMENTS
The purpose of the investment in the Fixed Interest Trust Portfolio is to hold it for a period of longer than 12.months. The total carrying amount of the Fixed Interest Trust Portfolio investment below has been measured at fair value.
Non-Current Investments Investments 5,748 5,764
Total Investments 5,748 5,764
114

OFFICE OF THE NOMINAL DEFENDANT OF THE AUSTRALIAN CAPITAL TERRITORY ANNUAL REPORT 2010-2011
Office of the Nominal Defendant of the ACT Notes to and Forming Part of the Financial Statements
For the Year Ended 30 June 2011
NOTE 15 PAYABLES 2011 2010
$’000 $’000 Current Payables Trade Payables 4 4 Accrued Expenses 37 210
Total Payables 41 214
Payables are Aged as follows: Not Overdue 41 214 Overdue for more than 60 days - -
Total Payables 41 214
Classification of ACT Government/Non-ACT Government Payables
Payables with ACT Government Entities
Accrued Expenses 37 210 Total Payables with ACT Government Entities 37 210
Payables with Non-ACT Government Entities
Trade Payables 4 4 Total Payables with Non-ACT Government Entities 4 4
Total Payables 41 214
NOTE 16 PROVISION FOR CLAIMS PAYABLE
Inflated and Discounted Liability
2011 2010 $’000 $’000
Gross Central Estimate 14,365 14,208 Recoveries (1,315) (1,337) Claims Handling Expense 1,005 781 Net Central Estimate 14,055 13,652
Current Provision for Claims Payable Provision for Claims Payable 3,267 3,089
Non-Current Provision for Claims Payable Provision for Claims Payable 10,788 10,563
Total Provision for Claims Payable 14,055 13,652
There were 80 open claims as at 30 June 2011 and 63 as at 30 June 2010.
115
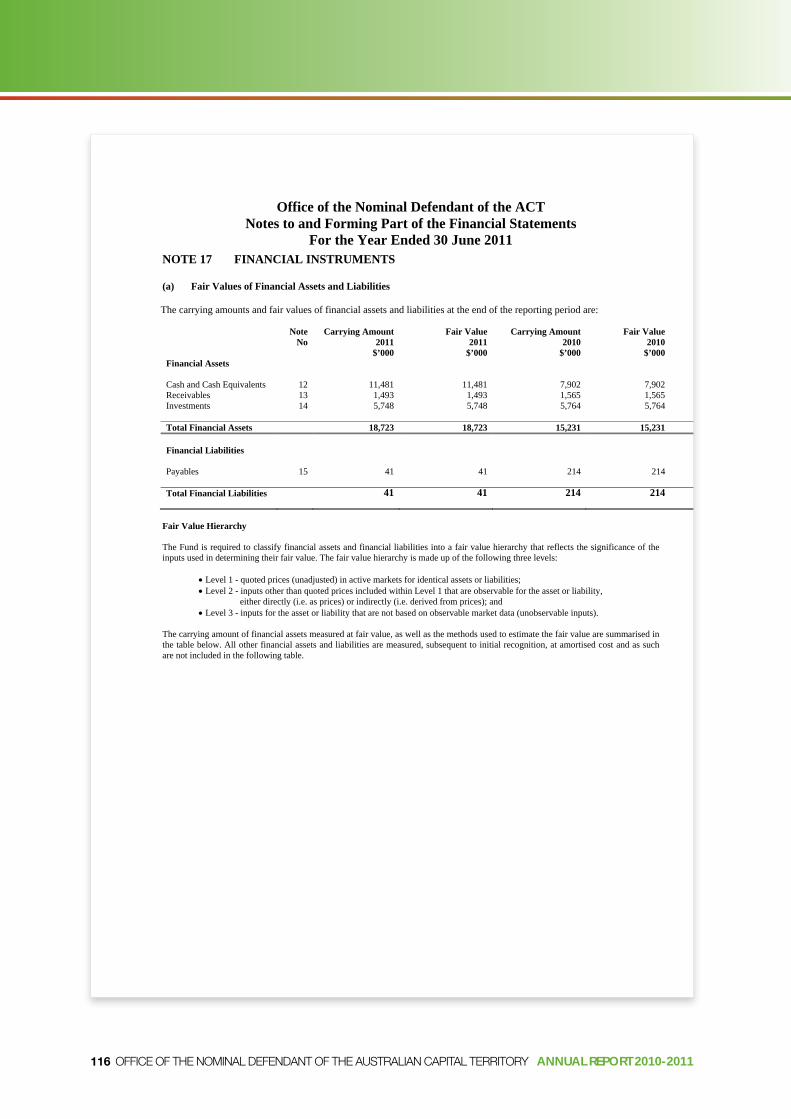
OFFICE OF THE NOMINAL DEFENDANT OF THE AUSTRALIAN CAPITAL TERRITORY ANNUAL REPORT 2010-2011
Office of the Nominal Defendant of the ACT Notes to and Forming Part of the Financial Statements
For the Year Ended 30 June 2011 NOTE 17 FINANCIAL INSTRUMENTS
(a) Fair Values of Financial Assets and Liabilities
The carrying amounts and fair values of financial assets and liabilities at the end of the reporting period are:
Note Carrying Amount Fair Value Carrying Amount Fair Value No 2011 2011 2010 2010
$’000 $’000 $’000 $’000 Financial Assets
Cash and Cash Equivalents 12 11,481 11,481 7,902 7,902 Receivables 13 1,493 1,493 1,565 1,565 Investments 14 5,748 5,748 5,764 5,764
Total Financial Assets 18,723 18,723 15,231 15,231
Financial Liabilities
Payables 15 41 41 214 214
Total Financial Liabilities 41 41 214 214
Fair Value Hierarchy
The Fund is required to classify financial assets and financial liabilities into a fair value hierarchy that reflects the significance of the inputs used in determining their fair value. The fair value hierarchy is made up of the following three levels:
Level 1 - quoted prices (unadjusted) in active markets for identical assets or liabilities; Level 2 - inputs other than quoted prices included within Level 1 that are observable for the asset or liability,
either directly (i.e. as prices) or indirectly (i.e. derived from prices); and Level 3 - inputs for the asset or liability that are not based on observable market data (unobservable inputs).
The carrying amount of financial assets measured at fair value, as well as the methods used to estimate the fair value are summarised in the table below. All other financial assets and liabilities are measured, subsequent to initial recognition, at amortised cost and as such are not included in the following table.
116
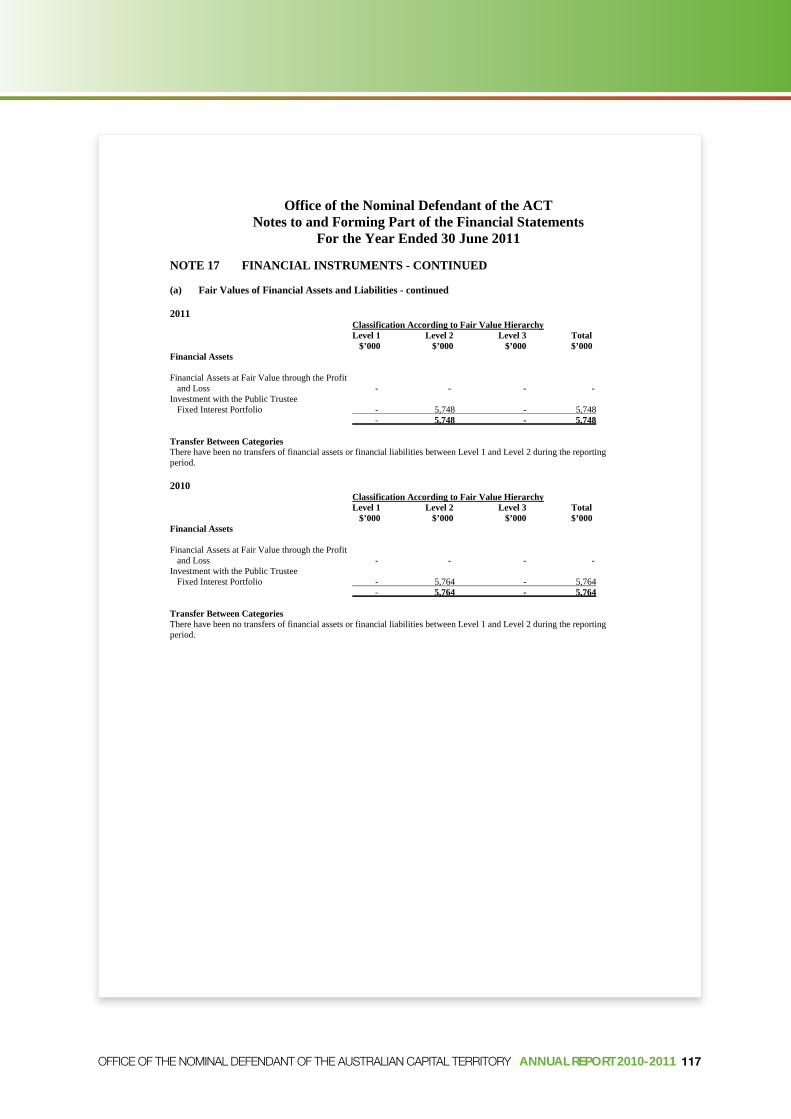
OFFICE OF THE NOMINAL DEFENDANT OF THE AUSTRALIAN CAPITAL TERRITORY ANNUAL REPORT 2010-2011
Office of the Nominal Defendant of the ACT Notes to and Forming Part of the Financial Statements
For the Year Ended 30 June 2011
NOTE 17 FINANCIAL INSTRUMENTS - CONTINUED
(a) Fair Values of Financial Assets and Liabilities - continued
2011 Classification According to Fair Value Hierarchy Level 1 Level 2 Level 3 Total
$’000 $’000 $’000 $’000 Financial Assets
Financial Assets at Fair Value through the Profit and Loss - - - -
Investment with the Public Trustee Fixed Interest Portfolio - 5,748 - 5,748
- 5,748 - 5,748
Transfer Between Categories There have been no transfers of financial assets or financial liabilities between Level 1 and Level 2 during the reporting period.
2010 Classification According to Fair Value Hierarchy Level 1 Level 2 Level 3 Total
$’000 $’000 $’000 $’000 Financial Assets
Financial Assets at Fair Value through the Profit and Loss - - - -
Investment with the Public Trustee Fixed Interest Portfolio - 5,764 - 5,764
- 5,764 - 5,764
Transfer Between Categories There have been no transfers of financial assets or financial liabilities between Level 1 and Level 2 during the reporting period.
117

OFFICE OF THE NOMINAL DEFENDANT OF THE AUSTRALIAN CAPITAL TERRITORY ANNUAL REPORT 2010-2011
Office of the Nominal Defendant of the ACT Notes to and Forming Part of the Financial Statements
For the Year Ended 30 June 2011
NOTE 17 FINANCIAL INSTRUMENTS - CONTINUED
(b) Interest Rate Risk
Interest rate risk is the risk that the fair value or future cash flows of a financial instrument will fluctuate because of changes in market interest rates.
Most of the Fund’s financial assets are held in floating interest rate arrangements and all of its financial liabilities are non.-interest bearing. This means that the Fund is not exposed to movements in interest payable, however, it is exposed to movements in interest receivable. Interest rates decreased during the year ended 30 June 2011 and this resulted in an decrease in the amount of interest received. There are no unrecognised financial assets or liabilities.
Interest rate risk for financial assets is managed by the Fund by only investing in floating interest rate investments that are low risk. Interest rate risk for financial liabilities is not actively managed by the Fund as these liabilities are held in non-interest bearing arrangements.
There have been no changes in risk exposure or processes for managing risk since the last reporting period.
Carrying Amount of Each Category of Financial Assets and Liabilities Financial Assets
2011 2010 $’000 $’000
Financial Assets at Fair Value through the Profit and Loss Designated upon Initial Recognition 5,748 5,764
Loans and Receivables 1,446 1,467
(Loss)/gain on Each Category of Financial Assets and Financial Liabilities
(Loss)/ Gain on Financial Assets at Fair Value through the Profit and Loss Designated upon Initial Recognition (16)
Sensitivity Analysis
Taking into account past performance, future expectations and economic forecasts, the impact on profit or loss and the impact on equity in the table below are ‘reasonably possible’ over the next 12 months if interest rates change by -/+ 1.0% per annum.
Carrying Amount -1.0% +1.0%
Profit/ (Loss) Profit/ (Loss) $’000 $’000 $’000
Financial Assets: Cash and Cash Equivalents 11,481
(115) 115
Total( Decrease)/ Increase 11,481 (115) 115
118
73

OFFICE OF THE NOMINAL DEFENDANT OF THE AUSTRALIAN CAPITAL TERRITORY ANNUAL REPORT 2010-2011
Office of the Nominal Defendant of the ACT Notes to and Forming Part of the Financial Statements
For the Year Ended 30 June 2011
NOTE 17 FINANCIAL INSTRUMENTS - CONTINUED
(c) Credit Risk
Credit risk is the risk that one party to a financial instrument will fail to discharge an obligation and cause the other party to incur a financial loss. The Fund’s credit risk is limited to the amount of the financial assets it holds net any allowance for impairment.
Credit risk for investments is managed by the Fund by only investing surplus funds with the Public Trustee for the ACT. The Public Trustee for the ACT has set appropriate investment criteria for the external fund manager it has engaged to manage the surplus funds of agencies, resulting in an insignificant credit risk. No significant concentration of credit risk has been identified by the Fund.
A large proportion of the Fund’s receivables are from major Australian insurers and the government. The credit risk of these receivables going into default is considered low. A small proportion of receivables are expected from drivers or owners identified as at fault. These receivables have been impaired as part of the actuarial valuation. The Fund expects to collect all financial assets that are not past due or impaired.
There have been no changes in credit risk since the last reporting period.
(d) Liquidity Risk
Liquidity risk is the risk that the Fund will encounter difficulties in meeting obligations associated with financial liabilities that are settled by delivering cash or another financial asset. To limit its exposure to liquidity risk, the Fund keeps sufficient cash on hand to meet its payables. The Fund’s outstanding claims, while not financial liabilities, are unlikely to settle in any one financial year. At any particular point in time, through raising levies, the Fund has sufficient current financial assets to meet its current financial liabilities. This ensures that the Fund has enough liquidity to meet its emerging financial liabilities.
119
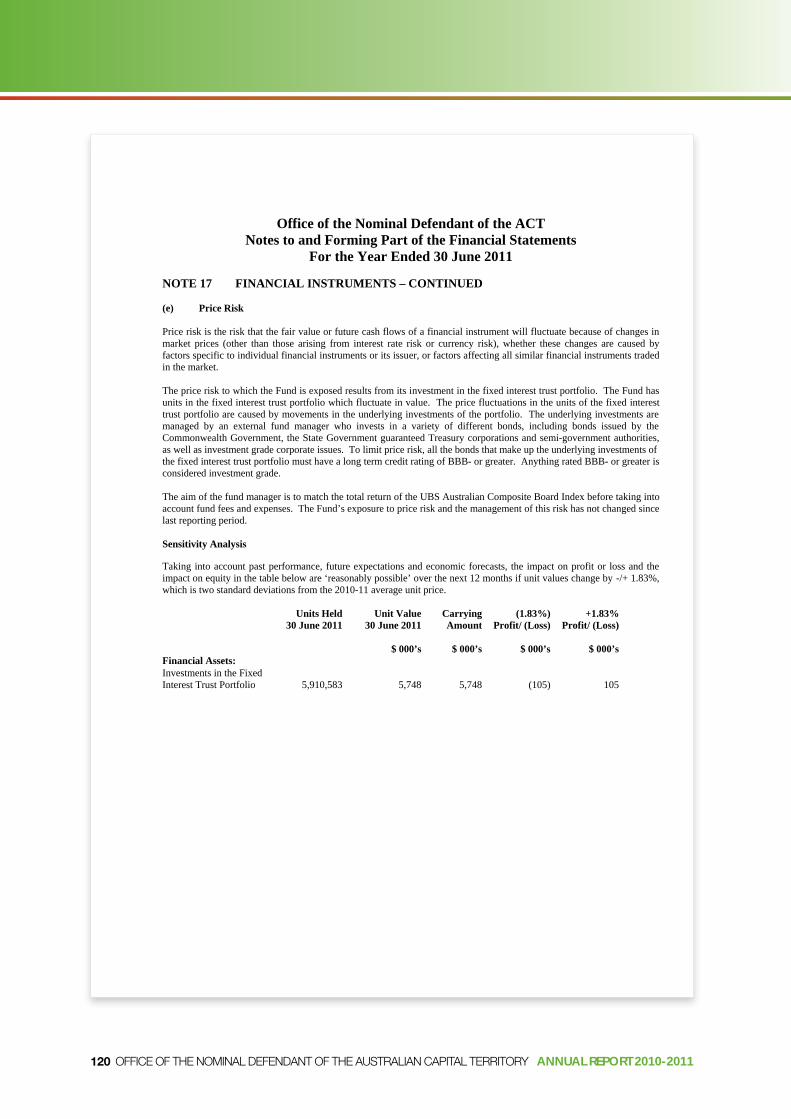
OFFICE OF THE NOMINAL DEFENDANT OF THE AUSTRALIAN CAPITAL TERRITORY ANNUAL REPORT 2010-2011
Office of the Nominal Defendant of the ACT Notes to and Forming Part of the Financial Statements
For the Year Ended 30 June 2011
NOTE 17 FINANCIAL INSTRUMENTS – CONTINUED
(e) Price Risk
Price risk is the risk that the fair value or future cash flows of a financial instrument will fluctuate because of changes in market prices (other than those arising from interest rate risk or currency risk), whether these changes are caused by factors specific to individual financial instruments or its issuer, or factors affecting all similar financial instruments traded in the market.
The price risk to which the Fund is exposed results from its investment in the fixed interest trust portfolio. The Fund has units in the fixed interest trust portfolio which fluctuate in value. The price fluctuations in the units of the fixed interest trust portfolio are caused by movements in the underlying investments of the portfolio. The underlying investments are managed by an external fund manager who invests in a variety of different bonds, including bonds issued by the Commonwealth Government, the State Government guaranteed Treasury corporations and semi-government authorities, as well as investment grade corporate issues. To limit price risk, all the bonds that make up the underlying investments of the fixed interest trust portfolio must have a long term credit rating of BBB- or greater. Anything rated BBB- or greater is considered investment grade.
The aim of the fund manager is to match the total return of the UBS Australian Composite Board Index before taking into account fund fees and expenses. The Fund’s exposure to price risk and the management of this risk has not changed since last reporting period.
Sensitivity Analysis
Taking into account past performance, future expectations and economic forecasts, the impact on profit or loss and the impact on equity in the table below are ‘reasonably possible’ over the next 12 months if unit values change by -/+ 1.83%, which is two standard deviations from the 2010-11 average unit price.
Units Held 30 June 2011
Unit Value 30 June 2011
Carrying Amount
(1.83%) Profit/ (Loss)
+1.83% Profit/ (Loss)
$ 000’s $ 000’s $ 000’s $ 000’s Financial Assets: Investments in the Fixed Interest Trust Portfolio 5,910,583 5,748 5,748 (105) 105
120

OFFICE OF THE NOMINAL DEFENDANT OF THE AUSTRALIAN CAPITAL TERRITORY ANNUAL REPORT 2010-2011
Office of the Nominal Defendant of the ACT Notes to and Forming Part of the Financial Statements
For the Year Ended 30 June 2011
NOTE 17 FINANCIAL INSTRUMENTS – CONTINUED
The following table sets out the Fund’s maturity analysis for financial assets and liabilities as well as the exposure to interest rates, including the weighted average interest rates by maturity period as at 30 June 2011. All financial assets and liabilities which have a floating interest rate or are non-interest bearing will mature in one year or less. All amounts appearing in the following maturity analysis are shown on an undiscounted cash flow basis.
Fixed interest maturing in:
2011 Floating over 1 more Non-
Notes
interest rate
$'000
1 year or less $'000
to 5 years$'000
than 5 years $'000
interest bearing
$'000 Total $'000
Financial Instruments
Financial Assets Cash and Cash Equivalents 12 11,481 - - - - 11,481 Receivables 13 - - - - 132 132 Investments 14 - - - - 5,748 5,748 Total Financial Assets 11,481 - - - 5,880 17,361
Weighted average interest rate - - - -
Financial Liabilities Payables Total Financial Liabilities
15 --
--
--
--
41 41
41 41
Weighted Average Interest Rate - - - - - -
Net Financial Assets/ Liabilities 11,481 - - - 5,839 17,320
Reconciliation of Net Financial Assets to Net Assets as per the Balance Sheet
Note 2011 $’000
Net Financial Assets (as above) Accrued Levies Provision for Claims Payable Net Assets as per the Balance Sheet
13 16
17,320 1,361
(14,055) 4,626
121

OFFICE OF THE NOMINAL DEFENDANT OF THE AUSTRALIAN CAPITAL TERRITORY ANNUAL REPORT 2010-2011
Office of the Nominal Defendant of the ACT Notes to and Forming Part of the Financial Statements
For the Year Ended 30 June 2011
NOTE 17 FINANCIAL INSTRUMENTS – CONTINUED
Fixed interest maturing in: 2010 Floating over 1 more Non-
interest rate 1 year to 5 than interest or less years 5 years bearing Total
Financial Instruments Notes $'000 $'000 $'000 $'000 $'000 $'000
Financial Assets Cash and Cash Equivalents Receivables Investments Total Financial Assets
12 13 14
7,902 --
7,902
----
----
----
-229
5,764 5,993
7,902 229
5,764 13,895
Weighted average interest rate 5.23% - - - -
Financial Liabilities Payables Total Financial Liabilities
15 --
--
--
--
214 214
214 214
Weighted Average Interest Rate - - - - - -
Net Financial Assets 7,902 - - - 5,779 13,681
Reconciliation of Net Financial Assets to Net Assets Note 2010 $’000
Net Financial Assets (as above) Accrued Levies Provision for Claims Payable Net Assets as per the Balance Sheet
13 16
13,681 1,336
(13,652) 1,365
122

OFFICE OF THE NOMINAL DEFENDANT OF THE AUSTRALIAN CAPITAL TERRITORY ANNUAL REPORT 2010-2011
Office of the Nominal Defendant of the ACT Notes to and Forming Part of the Financial Statements
For the Year Ended 30 June 2011
NOTE 18 CONTINGENT LIABILITIES AND CONTINGENT ASSETS
No contingent liabilities or assets were recognised at the reporting date.
NOTE 19 CASH FLOW RECONCILIATION
2011 $’000
2010 $’000
(a). Reconciliation of Cash and Cash Equivalents at the End of the Reporting Period in the Cash Flow Statement to the Equivalent Items in the Balance Sheet
Total Cash and Cash Equivalents Recorded in Balance Sheet 11,481 7,902
Cash and Cash Equivalents at the End of the Reporting Period as Recorded in the Cash Flow Statement 11,481 7,902
(b). Reconciliation of Net Cash Inflows/ (Outflows) from Operating Activities to the Operating Surplus
Operating Surplus 3,261 1,365
Add/(Less) Items Classified as Investing or Financing
Gain in Net Market Value of Investments - (73) Unrealised Loss on Investments 16 -Cash before Operating Assets and Liabilities 16 (73)
Changes in Operating Assets and Liabilities
Increase/(Decrease) in Receivables 72 74 Increase/(Decrease) in Provision for Claims Payable 403 2,095 (Decrease)/Increase in Payables (173) -
Net Changes in Operating Assets and Liabilities 302 2,169
Net Cash Inflows From Operating Activities 3,579 3,461
NOTE 20 AUDITOR’S REMUNERATION
Auditor’s remuneration consists of financial audit services provided to the Fund by the ACT Auditor-General’s Office.
Audit Services Audit Fees Paid to the ACT Auditor-General’s Office 26 24
Total Auditor’s Fees 26 24
No other services were provided by the ACT Auditor-General’s Office
123

AUSTRALIAN CAPITAL TERRITORY INSURANCE AUTHORITY ANNUAL REPORT 2010-2011
GLOSSARY Actuary
An actuary uses complex mathematical methods, to analyse past loss data and other statistics and develop systems for determining outstanding claims liability and future premiums.
Compulsory Third Party Insurance (CTP) insurance
Insures against the risk of liability for personal injury caused by a motor accident.
Directors and officers insurance
Covers directors and officers of a company for negligent acts or omissions, and for misleading statements that result in suits against the company, often by shareholders.
IBNR
Claims incurred but not yet reported or not enough reported
Insurance incident
An incident or event that may give rise to an insurance claim at a future date.
Insurance claim
An insurance incident which has developed to the stage where there has been a demand for compensation which may or may not involve legal proceedings.
Insurance year
1 July to 30 June.
Medical malpractice insurance
Professional liability coverage for physicians and other specialists against suits alleging negligence or errors and omissions that have harmed patients.
Property insurance
Covers damage to or loss of policyholders’ property.
Professional indemnity insurance
Covers professionals for causing loss or injury to their clients.
Public liability insurance
Insurance for what the policyholder is legally obligated to pay because of bodily injury or property damage caused to another person.
Reinsurance
Insurance bought by insurers. A reinsurer assumes part of the risk. The business is global and some of the largest reinsurers are based abroad. Reinsurers don’t pay policyholder claims. Instead, they reimburse insurers for claims paid.
Risk Management
Management of the varied risks to which a business firm or association might be subject. It includes analysing all exposures to gauge the likelihood of loss and choosing options to better manage or minimize loss. These options typically include reducing and eliminating the risk with safety measures.
124

AUSTRALIAN CAPITAL TERRITORY INSURANCE AUTHORITY ANNUAL REPORT 2010-2011
COMPLIANCE INDEX Transmittal Certificate 3
SECTION A: PERFORMANCE AND FINANCIAL MANAGEMENT REPORTING 7
A.1 The Organisation 7
A.2 Overview 8
A.3 Highlights 8
A.4 Outlook 9
A.5 Management Discussion and Analysis 10
A.6 Financial Report 14
A.7 Statement of Performance 63
A.8 Analysis of Agency Performance 70
SECTION B: CONSULTATION AND SCRUTINY REPORTING 73
B.1 Community Engagement 73
B.2 Internal & External Scrutiny 73
SECTION C: LEGISLATIVE AND POLICY BASED REPORTING 75
C.1 Risk Management and Internal Audit 75
C.2 Fraud Prevention 76
C.3 Public Interest Disclosure 76
C.4 Freedom of Information 77
C.5 Internal Accountability 77
C.6 HR Performance 78
C.7 Staffing Profile 79
C.8 Learning and Development 81
C.9 Workplace Health and Safety 81
C.10 Workplace Relations 82
C.11 Strategic Bushfire Management Plan 82
C.12 Strategic Asset Management 82
C.13 Government Contracting 82
C.15 Territory Records 83
C.16 Human Rights Act 2004 83
C.17 Commissioner for the Environment 83
C.18 ACT Multicultural Strategy 2010–13 83
C.19 Aboriginal and Torres Strait Islander Reporting 83
C.20 Ecologically Sustainable Development 84
C.21 ACT Women’s Plan 2010–2015 84
C.22 Model Litigant Guidelines 84
125

AUSTRALIAN CAPITAL TERRITORY INSURANCE AUTHORITY ANNUAL REPORT 2010-2011
ALPHABETICAL INDEX Aboriginal and Torres Strait Islander Reporting 83
ACT Multicultural Strategy 2010–13 83
ACT Women’s Plan 2010–2015 84
Alphabetical Index 126
Analysis of Agency Performance 70
ANNEXED REPORT: OFFICE OF THE NOMINAL DEFENDANT ACT 85
Compliance Index 125
Commissioner for the Environment 83
Community Engagement 73
Ecologically Sustainable Development 84
Financial Report 14
Fraud Prevention 76
Freedom of Information 77, 87
Glossary 124
Government Contracting 82
Highlights 8
HR Performance 78
Human Rights Act 2004 83
Internal & External Scrutiny 73
Internal Accountability 77
Learning and Development 81
Management Discussion and Analysis 10
Model Litigant Guidelines 84
Outlook 9
Overview 8
Public Interest Disclosure 76
Risk Management and Internal Audit 75
SECTION A: PERFORMANCE AND FINANCIAL MANAGEMENT REPORTING 7
SECTION B: CONSULTATION AND SCRUTINY REPORTING 73
SECTION C: LEGISLATIVE AND POLICY BASED REPORTING 75
Staffing Profile 79
Statement of Performance 63
Strategic Bushfire Management Plan 82
Strategic Asset Management 82
Territory Records 83
The Organisation 7, 85
Transmittal Certificate 3
Workplace Health and Safety 81
Workplace Relations 82
126