august 2020 - macdonald-laurier institute
TRANSCRIPT

August 2020

Board of DirectorsCHAIR Pierre Casgrain Director and Corporate Secretary, Casgrain & Company Limited, Montreal
VICE-CHAIR Laura Jones Executive Vice-President of the Canadian Federation of Independent Business, Vancouver
MANAGING DIRECTOR Brian Lee Crowley, Ottawa
SECRETARY Vaughn MacLellan DLA Piper (Canada) LLP, Toronto
TREASURER Martin MacKinnon Co-Founder and CEO, B4checkin, Halifax
DIRECTORS Wayne Critchley Senior Associate, Global Public Affairs, Ottawa
Blaine Favel CEO, Kanata Earth Inc, Cut Knife, Saskatchewan
Colleen Mahoney Sole Principal, Committee Digest,Toronto
Jayson Myers CEO, Jayson Myers Public Affairs Inc., Aberfoyle
Dan Nowlan Vice Chair, Investment Banking, National Bank Financial, Toronto
Hon. Christian Paradis Co-founder and Senior advisor, Global Development Solutions, Montréal
Gerry Protti Chairman, BlackSquare Inc, Calgary
Vijay Sappani CEO, Ela Capital Inc, Toronto
Veso Sobot Director of Corporate Affairs, IPEX Group of Companies, Toronto
Jacquelyn Thayer Scott COO, Airesun Global Ltd; President Emerita, Cape Breton University, Sydney
Advisory CouncilJohn Beck President and CEO, Aecon Enterprises Inc, Toronto
Erin Chutter Executive Chair, Global Energy Metals Corporation, Vancouver
Navjeet (Bob) Dhillon President and CEO, Mainstreet Equity Corp, Calgary
Jim Dinning Former Treasurer of Alberta, Calgary
David Emerson Corporate Director, Vancouver
Richard Fadden Former National Security Advisor to the Prime Minister, Ottawa
Brian Flemming International lawyer, writer, and policy advisor, Halifax
Robert Fulford Former Editor of Saturday Night magazine, columnist with the National Post, Ottawa
Wayne Gudbranson CEO, Branham Group Inc., Ottawa
Calvin Helin Aboriginal author and entrepreneur, Vancouver
David Mulroney Former Canadian Ambassador to China, Toronto
Peter John Nicholson Inaugural President, Council of Canadian Academies, Annapolis Royal
Hon. Jim Peterson Former federal cabinet minister, Counsel at Fasken Martineau, Toronto
Barry Sookman Senior Partner, McCarthy Tétrault, Toronto
Rob Wildeboer Executive Chairman, Martinrea International Inc, Vaughan
Research Advisory BoardJanet Ajzenstat Professor Emeritus of Politics, McMaster University Brian Ferguson Professor, Health Care Economics, University of Guelph Jack Granatstein Historian and former head of the Canadian War Museum Patrick James Dornsife Dean’s Professor, University of Southern CaliforniaRainer Knopff Professor Emeritus of Politics, University of CalgaryLarry Martin Principal, Dr. Larry Martin and Associates and Partner, Agri-Food Management Excellence, Inc
Christopher Sands Senior Research Professor, Johns Hopkins UniversityElliot Tepper Senior Fellow, Norman Paterson School of International Affairs, Carleton UniversityWilliam Watson Associate Professor of Economics, McGill University
For more information visit: www.MacdonaldLaurier.ca

The author of this document has worked independently and is solely responsible for the views presented here. The opinions are not necessarily those of the
Macdonald-Laurier Institute, its Directors or Supporters.
Copyright © 2021 Macdonald-Laurier Institute. May be reproduced freely for non-profit and educational purposes.
Contents
Cover photo credits: iStock
Executive Summary / Sommaire .................................................................... 4
Introduction ........................................................................................................... 9
The development of the oil sands ................................................................ 12
Canada’s share of US imports is rising ........................................................ 16
Innovation and the oil sands ........................................................................... 17
The oil sands: A Canadian success story ................................................... 21
Conclusion ............................................................................................................ 31
About the author ................................................................................................ 32
References ............................................................................................................ 33
Endnotes .............................................................................................................. 36

A NATIONAL PROJECT:HOW OIL SANDS INVESTMENT AND PRODUCTION BENEFIT CANADA’S ECONOMY
4
Executive Summary
S ince 1998, investment and production of the country’s oil sands deposits has been one of the forces driving Canada’s economic growth. However,
the impact of investing in an oil sands extraction project is different from ac-tual oil production. This paper is the first to document how the impact of oil sands investment differs from that associated with production. It also breaks down the effect that oil sands investment and production have on the econo-mies of both Alberta and the rest of Canada.
The study simulates two scenarios: $10 billion of investment spending on a typical oil sands megaproject, and a $10 billion expansion of oil sands pro-duction. The analysis compares the economic impact of investment with that of production, particularly how reliant each type of activity is on domestic suppliers in Alberta and the rest of the country, how much they import, how many jobs are created, and the average pay of these jobs.
Both investment and production in the oil sands are important to Canada’s economy – and are expected to remain so. Oil sands production continues to grow as investment projects come on stream; it accounts for 70 percent of Canada’s oil output, with most destined for the growing US market for oil from Canada. Meanwhile, investment in the oil sands remains substantial by its own historical standards and by comparison with sluggish business invest-ment in most other sectors in recent years. Though substantially less than at its peak at the height of the oil boom in 2014, at $8.3 billion in 2020 oil sands investment is still 4.5 percent of all business investment in Canada. This ex-ceeds all investments made by the retail trade industry, construction, or all business services, and is four times more than auto manufacturing.
There is a growing market in the United States for Canadian crude oil. While total US imports of oil from all sources declined as its own shale oil produc-tion surged, imports of Canadian oil rose steadily to account for more than half of all US oil imports. Currently, Canada exports about 3.8 million barrels per day (bpd) to the US, and this is expected to rise to between 4.2 and 4.4 million bpd over the next few years.

5Philip Cross | April 2021
This paper’s analysis using the Statistics Canada input-output model indicates that boosting oil sands investment and production each by $10 billion affects total GDP by about the same amount, but the results are much different for employment both within Alberta and across Canada.
Oil sands investment leads to more jobs and labour income than does in-creased spending on oil production, but production is much more stable than capital spending, especially during downturns. Investment also has a slightly greater ripple effect on provinces outside of Alberta than does production. Provinces outside of Alberta garner 18.3 percent of the increase in GDP from investment and 13.5 percent from production. Because oil sands produc-tion uses much more capital and requires few workers in Alberta and capital goods tend to be made in provinces like Ontario and Quebec, the provinces outside of Alberta account for a larger share of the gains in employment, at 21.2 percent for investment and 33.9 percent from the expansion of oil sands production. Apart from Alberta, Central Canada, notably Ontario, benefits the most of any region from both oil sands investment and production.
Furthermore, the jobs added by oil sands growth – in either investment or production – pay well above the average. In Alberta, the very high pay for people directly involved in oil sands production lifts the average income from more output to $96,043 compared with $81,811 from investment.
The oil sands are a uniquely Canadian success story and an increasingly rare example of innovation in Canada. To protect the large investments already made in the oil sands against its demonization by its opponents, further in-novation will be required to further lower operating costs and emissions. The track record of relentless innovation by the industry suggests such an out-come is eminently possible. It will then be important for the industry and governments in Canada to set the public record straight on what this industry has accomplished and its importance to Canada’s economy. This paper con-tributes to a better understanding of the oil sands.
Production is much more stable than capital spending, especially during downturns.
A NATIONAL PROJECT:HOW OIL SANDS INVESTMENT AND PRODUCTION BENEFIT CANADA’S ECONOMY
6
Sommaire
D epuis 1998, la production et l’investissement dans les sables bitumineux du pays sont un des moteurs de la croissance économique au Canada.
Cependant, investir dans un projet d’extraction de sables bitumineux n’a pas le même impact que de produire effectivement du pétrole. Cette étude est la première à documenter la manière dont ces activités diffèrent sur le plan des retombées. Elle décompose également l’effet de l’investissement et de la pro-duction dans le secteur des sables bitumineux sur les économies de l’Alberta et du reste du Canada.
Deux scénarios sont envisagés dans le cadre de l’étude : l’ajout de dix mil-liards de dollars en dépenses d’investissement dans un mégaprojet typique de sables bitumineux, et un accroissement de la production, d’un montant de 10 milliards de dollars. L’analyse compare les retombées de l’investissement à celles de la production, en particulier l’interdépendance entre chacune de ces activités et les fournisseurs nationaux en Alberta et dans le reste du pays, la quantité d’importations, le nombre d’emplois créés et le salaire moyen lié à ces emplois.
Les investissements et la production dans les sables bitumineux sont tous les deux importants pour l’économie canadienne – et devraient le rester. La pro-duction dans ce secteur continue de croître au fur et à mesure que les projets d’investissement entrent en production; elle compte pour 70 pour cent de la production de pétrole du Canada, dont la majeure partie est destinée au marché croissant du pétrole canadien aux États-Unis. Parallèlement, les inves-tissements dans les sables bitumineux demeurent considérables par rapport à leurs propres normes historiques et à la faiblesse de l’investissement des entreprises dans la plupart des autres secteurs ces dernières années. Bien qu’ils soient nettement inférieurs au sommet atteint au plus fort du boom pétrolier en 2014, les investissements dans les sables bitumineux, qui ont atteint 8,3 milliards de dollars en 2020, représentent encore 4,5 pour cent des investissements des entreprises au Canada. Ils dépassent l’ensemble des investissements réalisés dans l’industrie du commerce de détail, la construc-tion ou les services aux entreprises, et représentent le quadruple de l’inves-tissement dans l’automobile.

7Philip Cross | April 2021
Le marché du pétrole brut canadien est en pleine expansion aux États-Unis. Alors que les importations américaines totales de pétrole, toutes sources confondues, ont diminué en raison de l’augmentation de la production de pétrole de schiste, les importations américaines de sources canadiennes aug-mentent régulièrement et représentent maintenant plus de la moitié de toutes les importations de pétrole des États-Unis. Actuellement, le Canada exporte environ 3,8 millions de barils par jour vers les États-Unis, et ce chiffre devrait atteindre entre 4,2 et 4,4 millions de bpj au cours des prochaines années.
L’analyse effectuée dans la présente étude, à l’aide du modèle d’entrées-sor-ties de Statistique Canada, indique qu’une relance de l’investissement ou de la production de 10 milliards de dollars, dans le secteur des sables bitu-mineux, a une incidence à peu près équivalente sur le PIB total, quoique les résultats de l’investissement ou de la production sur le plan de l’emploi sont très différents tant en Alberta qu’à travers le pays.
Si investir plutôt que d’augmenter la production dans les sables bitumineux crée plus d’emplois et de revenus salariaux, en revanche, la production est une force stabilisante beaucoup plus importante que l’investissement, sur-tout en période de ralentissement. L’investissement a également un effet d’entraînement légèrement plus important que la production hors de l’Alber-ta. En effet, le reste du pays se partage l’équivalent de 18,3 pour cent de l’aug-mentation du PIB en conséquence de l’investissement, mais l’équivalent de 13,5 pour cent en conséquence de l’accroissement de la production. Puisque la production dans les sables bitumineux exige plus de capital et moins de main-d’œuvre en Alberta, et que les biens d’équipement ont tendance à être fabriqués dans des provinces comme l’Ontario et le Québec, les retombées sont encore plus importantes dans le reste du pays en matière d’emploi : soit 21,2 pour cent des gains pour l’investissement et 33,9 pour cent des gains pour l’accroissement de la production. Hors de l’Alberta, c’est le centre du Canada, notamment l’Ontario, qui bénéficie le plus des investissements et de la production dans les sables bitumineux.
Si investir plutôt que d’augmenter la production dans les sables
bitumineux crée plus d’emplois et de revenus salariaux.

A NATIONAL PROJECT:HOW OIL SANDS INVESTMENT AND PRODUCTION BENEFIT CANADA’S ECONOMY
8
En outre, les emplois créés par l’expansion des sables bitumineux – que ce soit du côté de l’investissement ou de la production – sont bien mieux ré-munérés qu’en moyenne. En Alberta, les emplois bien rémunérés rattachés directement à la production de sables bitumineux font passer le revenu moy-en à 96 043 $ en conséquence de l’accroissement de la production, contre 81 811 $ en conséquence des investissements.
Les sables bitumineux créent un modèle canadien de réussite unique et un exemple d’innovation de plus en plus rare. Pour protéger les importants investissements déjà réalisés de l’image diabolisée que leur donnent leurs opposants, il faudra continuer d’innover pour réduire davantage les coûts d’exploitation et les émissions. Or, l’industrie n’a jamais cessé d’innover, ce qui permet de croire qu’un tel résultat est éminemment possible. Il sera alors important pour l’industrie et les gouvernements au Canada de rétablir les faits relativement aux accomplissements de cette industrie et sur son impor-tance pour l’économie du Canada. Ce document vise à mieux faire compren-dre les sables bitumineux.

9Philip Cross | April 2021
Introduction
S ince 1998, investment and production of the country’s oil sands deposits has been one of the forces driving Canada’s economic growth. However,
the impact of investing in an oil sands extraction project is different from actual oil production. This paper is the first to document how the impact of oil sands investment differs from that associated with production. The importance of this difference became evident in 2020, when investment in the oil sands fell sharply but relative stability of production and employment provided an important firewall against an unprecedented contraction in the economy. The paper also breaks down the effect that oil sands investment and production has on the economies of both Alberta and the rest of Canada.
The study uses Statistics Canada’s input-output model derived from its supply and use tables to simulate two scenarios.1 One is investment spending on a typical oil sands megaproject of $10 billion. The second is an expansion of oil sands production by $10 billion. Investment and production increase by the same amount to facilitate comparisons of their impact on GDP, employment, and labour income, both in Alberta and across the country. The analysis com-pares the economic impact of investment with the economic impact of pro-duction, particularly how reliant each type of activity is on domestic suppliers in Alberta and the rest of the country, how much they import, how many jobs are created, and the average pay of these jobs.
A $10 billion outlay is comparable to oil sands projects such as phases of Ca-nadian Natural Resource’s Horizon,2 the Fort Hills project developed by Sun-cor Energy, and Imperial Oil’s Kearl project (Morgan 2018b). Invariably such large projects are spread out over several years. However, the input-output model requires simulating the results as if all the investment and production occur in one year.3 Assuming that all the investment occurs in one year facil-itates the comparison with production (where a $10 billion increase in one year is possible), which is the goal of this exercise. Furthermore, discounting future values with today’s near zero interest rates makes little difference.
Given how several oil sands projects have been delayed or cancelled (Teck’s Frontier project was the latest in 2020) due to a combination of regulatory
A NATIONAL PROJECT:HOW OIL SANDS INVESTMENT AND PRODUCTION BENEFIT CANADA’S ECONOMY
10
roadblocks and low prices, studying such projects may seem like a review of past accomplishments rather than of potential future benefits. While a better understanding of the role the oil sands played in the recent growth of Can-ada’s economy is always instructive (especially when our growth led the G7 nations after the global recession in 2009), the expansion of the oil sands is still about the future as much as the past.
Both investment and production in the oil sands remain important to Cana-da’s economy. Oil sands production continues to grow as investment projects come on stream, so the simulation showing how higher oil production affects the economy is still relevant to Canada today. Meanwhile, investment in the oil sands remains substantial by its own historical standards and by compari-son with sluggish business investment in most other sectors in recent years; at $8.3 billion in 2020, oil sands investments is 4.5 percent of all business fixed investment in Canada. This exceeds all investments made by the retail trade industry, construction, or all business services, and is four times more than auto manufacturing where every capital project receives government subsi-dies and blanket coverage from the media.
To fully appreciate the impact of the development of the oil sands on the Ca-nadian economy, this study also summarizes how both the reality and the per-ception of the oil sands have evolved since their beginnings early in the 20th century. From this angle, the oilsands are not only a creator of wealth and jobs but a stellar example for others of how Canadian ownership and indig-enous innovation can help boost Canada’s economy. Unfortunately, negative public and media perceptions of the oil sands (telegraphed by their disparag-ing and completely inaccurate description as the ‘tar sands’), encouraged by competitors overseas and customers in the United States who have benefited enormously from heavily discounted prices for bitumen from the oil sands,4 have largely precluded Canadians from looking at this industry as an example to emulate and not a pariah to defame.
A resurgence of oil sands investment and production is still a realistic scenar-io. The International Energy Agency has projected that the demand for oil will remain high for decades, so the probable downturn in future US shale oil production as deposits are exhausted will leave few alternatives to develop-ing more oil sands deposits. Already we have seen the oil sands fill a supply
Both investment and production in the oil sands remain important
to Canada’s economy.

11Philip Cross | April 2021
gap, replacing heavy oil previously sourced from Mexico and Venezuela when their supply dwindled due to falling reserves and a reluctance to invest amid political turmoil. Recurring cycles in its fortunes is a constant for the industry. Relentless innovation in lowering the costs and the environmental impact of the oil sands could make both investors and the public more supportive in the future of further development of the oil sands.
The results of this paper should not be interpreted as favouring investment over production or production in place of investment. The two are inextri-cably linked. Increasing oil sands production first requires large investments that make more extraction possible. Enhanced investments in the oil sands are made solely with the goal of boosting future production. What this study shows is that the two have different impacts on GDP, imports, and employ-ment and labour income, both in Alberta and across the nation.
This paper begins with an overview of how the oil sands grew over time, high-lighting the ongoing importance of innovation in their development. The oil sands are a unique resource, requiring new technologies largely developed by Canadian companies and scientists. The analysis then presents the differ-ential impacts of oil sands investment and production on Canada’s economy.
OIL SANDS ARE NOT TAR SANDS
A word on terminology: this study uses the term “oil sands,” which
is what the industry has called this resource since the early 1950s when
one of the first companies was named the Great Canadian Oil Sands (the
predecessor to Suncor today) (Ebner 2007). Some writers misleadingly
use the term “tar sands” when referring to the oil sands. Tar sands is tech-
nically incorrect because oil is the goal of oil sands extraction even if its
texture sometimes resembles that of pine tar or coal tar. While the texture
resembles tar, in fact there is no tar in the oil sands (most tar does not exist
in nature but is man-made by extracting it from coal, wood, or petroleum).
The tar-like texture of crude bitumen reflects how the oil is englobed in
a mixture of clay, sand, water, and bitumen, which has to be removed at
considerable expense to extract the oil embedded inside. The viscosity of
oil derived from oil sand varies depending on the method used for its ex-
traction: naturally occurring bitumen in its raw state has a gummy viscosity
ten times thicker than peanut butter, while the oil extracted by injecting
steam flows like cream.
The reason people insist on using the term “tar sands,” even though it
incorrectly implies the presence of tar, is primarily political. Calling some-
thing tar rather than oil devalues its image to a cheap product of limited
use, mostly for road paving, whereas oil is one of the most versatile prod-

A NATIONAL PROJECT:HOW OIL SANDS INVESTMENT AND PRODUCTION BENEFIT CANADA’S ECONOMY
12
The development of the oil sandsThe first attempts at commercial development of the oil sands date back more than a century. The Abasand Oils refinery and separation plant south of Fort McMurray began to operate in 1941, partly reflecting the shortage of North American oil supplies during the Second World War. The Abasands venture was distinctive “in that it blended American expertise and Canadian capital and resources” instead of the typical formula of combining American capital with Canadian resources (Ferguson 1985, 94). However, its operations were plagued by technical problems and fires. Exploratory work increased after the war, and the Great Canadian Oil Sands Consortium was formed in 1953 (Ferguson 1985, 153).
Commercial production began in 1967. Syncrude was the second major oil sands venture, a project sponsored by a consortium of American and Cana-dian oil firms and governments in Canada in response to the 1973 surge in world oil prices (Ferguson 1985, 155). Prime Minister Jean Chrétien in his 2007 autobiography (when oil prices were setting records) claimed credit for helping in 1975 to finance “the initial development of the oil sands with grants, incentives, and subsidies.” Chréttien went on to quote former Alberta Premier Peter Lougheed: “If we have the oil sands today, we owe Jean Chré-tien a big thank you” (Chrétien 2007, 387). Such grandiose claims prove the adage that victory has a thousand fathers, but defeat is an orphan. Despite a boost from these tax changes and the 1973-1974 energy crisis, growth in the oil sands remained modest in the 1970s and 1980s.
The development of the oil sands did not begin in earnest until the late 1990s, when a change in the tax treatment of investments and the development of
ucts in our economy, although most crude oil requires refining to make it
into products of economic use. Most people would be surprised to learn
that there is more oil embedded in the plastics and textiles of their vehicle
than in the gas tank (Epstein 2014, 74).
Almost invariably, opponents of oil sands development refer to them
as tar sands, especially in the environmental lobby industry. The term
should be avoided as it is both technically wrong and politically charged.
Statistics Canada, for example, would never use the word for both these
reasons. Any serious analyst should follow suit. It is encouraging that The
Economist, which has long used the term “tar sands,” in 2020 correctly re-
ferred to them as the oil sands. The French language conspicuously avoids
any such controversy by calling the oil sands “les sables bitumineux” or
bituminous sands. However, it is probably too late to adopt this convention
in English.

13Philip Cross | April 2021
new technologies sparked a surge in growth despite the low oil prices pre-vailing at that time. More precisely, in 1996 the Alberta government changed the royalty charge so companies paid just 1 percent of revenues until they had recouped their capital costs (Poitras 2018, 37). The federal government also modified its tax policy to allow investments to be written off faster. At the same time, the technical process of extracting and transporting ore using bucket-wheels and conveyor belts was being phased out in favour of more efficient large shovels and trucks.
The oil sands have accounted for a sharply rising share of Canada’s oil pro-duction since the 1990s (Figure 1).6 This reflects both the rapid increase of investment in oil sands production and a levelling off of production from conventional oil wells. The oil sands accounted for about 15 percent of Can-ada’s oil production in the early 1980s, rising to nearly 25 percent by the mid-1990s. However, the surge of investment after 1997 boosted the oil sands share of production to over 40 percent by 2004 (Figure 1). This was only the beginning of the oil sands’ rise to dominance in the Canadian oil industry.
Crude oil prices began to climb starting in 2003, rising to a record of over US$100 a barrel in 2008 for West Texas Intermediate. (The paper will talk about the disparity between prices for US crude and Canadian crude (West-ern Canada Select) a bit later on.) By 2009, oil sands production accounted for more than half of all of Canada’s oil output. After a brief downturn due to the global financial crisis, world oil prices remained near $100 a barrel until late 2014. By 2015 the oil sands represented 65 percent of Canada’s oil out-put. Since then, prices have averaged about $50 a barrel, although volatility also has increased. The ensuing drop in investment constrained the growth in the oil sands’ share of domestic output to 70 percent in 2019.
FIGURE 1: OIL SANDS’ SHARE OF CANADIAN OIL PRODUCTION
Source: Statistics Canada tables 25-10-0014-01, 25-10-0063-01.

A NATIONAL PROJECT:HOW OIL SANDS INVESTMENT AND PRODUCTION BENEFIT CANADA’S ECONOMY
14
Investment and production in the oil sands
While production shows a string of almost unbroken annual gains, investment has been more cyclical than production (Figure 2). However, despite lower investment in 1998, 2003, 2009, and 2015 when prices fell, the broad trend for investment was a marked acceleration up to 2015. Investment increased from about $1 billion in 1996 to $10 billion in 2005, but it took only three more years for investment to rise by another $10 billion to reach $20 billion in 2008. After a large drop during the Great Recession of 2009, investment soared to its all-time peak of $35.7 billion in 2014. Since then, plunging oil prices followed by the 2020 pandemic saw investment retreat to $8.3 billion.
While investment in the oil sands in 2020 pales in comparison to its level at the peak of the oil boom in 2014, $8.3 billion remains a sizeable level of investment, the equivalent of 4.5 percent of all business fixed investment in Canada as of the third quarter of 2020. Oil sands investment in 2020 remains larger than any year before 2005, a period when the oil sands were regarded as developing rapidly, and almost equal to investment in 2009. Lower prices after 2015 have not stopped every new project in the oil sands. While most new investments consist of expanding existing operations,7 new greenfield projects were started by Canadian Natural Resources at its 40,000-barrel-a-day Kirby North project, while Imperial Oil’s $2.6 billion Aspen project in 2018 had a goal of 75,000 barrels a day, with the possibility of doubling its capacity at a later date.
Production has been more stable than investment, increasing every year from 1991 until 2020 with the exception of minor declines in 1999 and in 2005. Prices boomed in the late 1990s, the mid 2000s and after 2009, alter-nating with busts when oil prices plunged in 2002, 2009, and after 2015. Besides low prices, the industry also faced new carbon levies and higher
FIGURE 2: OIL SANDS INVESTMENT AND PRODUCTION
Source: Statistics Canada tables 25-10-0014-01, 25-10-0063-01, 34-10-0036-01, 34-10-0016-01 and 25-10-0064-01 (for investment in 2016*).

15Philip Cross | April 2021
royalties and corporate income taxes in Alberta after the NDP government’s election in 2015. Despite this volatility, the resilience of oil sands production is reflected in how the output in 2019 of 2.9 million barrels a day essentially matched the 3.1 million forecast by the Canadian Energy Research Institute in 2015 (Millington and Murillo, xii).
The more stable course of production compared with investment partly re-flects that it takes years of investment to complete a project and start pro-ducing, while less investment only implies that future output will increase at a slower rate. For example, a drop in investment in 2003 was not reflected in output until 2005, while the very steep decline in investment during the global recession of 2009 was not apparent in production until it levelled off in 2012. IHS Markit projects that the plunge in oil prices due to the 2020 pandemic will not significantly lower production over the next 10 years, which it forecasts will increase by 1.1 million barrels per day (bpd) to 3.8 mil-lion by 2030. Half of this increase comes from existing projects and half from projects where capital has already been deployed and even some greenfield projects (Birn and Hwang 2020, 3)
One reason oil sands production does not decline when prices fall is the high level of fixed costs. The leading producer Suncor estimates that nearly
“80 percent of our costs in oil sands are fixed” (Williams 2015). High fixed costs mean little is saved by lowering output. As a result, one industry exec-utive has observed that “Once you build a plant you’re going to produce as much as you can. You’re not going to shut down the plant and walk away. With a drilling rig, you can stop drilling and move to the States” (quoted in McMahon 2013). Raising production at a large oil sands plant lowers average costs. Canadian Natural Resources estimated that expanding production in 2015 lowered its operating expenses at its flagship Horizon mine by $10 a barrel (Dawson 2015).
Conversely, reducing oil sands production could increase costs. For example, stopping production could trigger a requirement that billions of dollars be spent for reclamation of tailing ponds (Tuttle 2015). It could also damage oil reservoirs and hamper the resumption of production since closing min-ing projects has meant in the past “they lost their steam chamber” (Mor-gan 2016). Shutting in situ steam projects is even more problematic because
Production has been more stable than investment, increasing every
year from 1991 until 2020.
A NATIONAL PROJECT:HOW OIL SANDS INVESTMENT AND PRODUCTION BENEFIT CANADA’S ECONOMY
16
firms have no experience with stopping production for extended periods. One report cited concerns about stopping in situ production because of
“substantial risks to the reservoir, well-bores, surface facilities and overall performance of the project” (Cattaneo 2016).
The time horizon for oil sands investments and production is much longer than the industry norm. Investments take years before generating more pro-duction, while plants will continue producing for decades. While this impos-es long lags before production can react to price changes, it also makes oil sands production more resilient to industry downturns than conventional or shale operations. The more stable course of oil sands production than con-ventional drilling is reflected in much lower layoff rates; on average, from 1995 to 2016, the layoff rate in oil and gas extraction (which is dominated by the oil sands) was six percentage points lower than in drilling and explora-tion, with layoffs peaking during the 2015 price crash at a rate of 6 percent for extraction versus 18 percent in drilling and exploration (Chen and Moris-sette 2020, 3).
The long planning horizon for the oil sands also means that most are well capitalized, which also is an advantage during the inevitable downturns in a cyclical industry. For example, the price slump starting in 2015 triggered a wave of bankruptcies among shale producers, but mostly just consolidations and mergers in the oil sands. The greater stability of oil sands production and employment was evident during the sharp downturn of the oil indus-try during the 2020 pandemic. Employment in oil and gas extraction fell only 0.9 percent from 54,899 in February 2020 to 54,421 in December 2020, while employment in drilling and exploration plunged 17.0 percent from 72,649 to 60,671.8
Canada’s share of US imports is rising
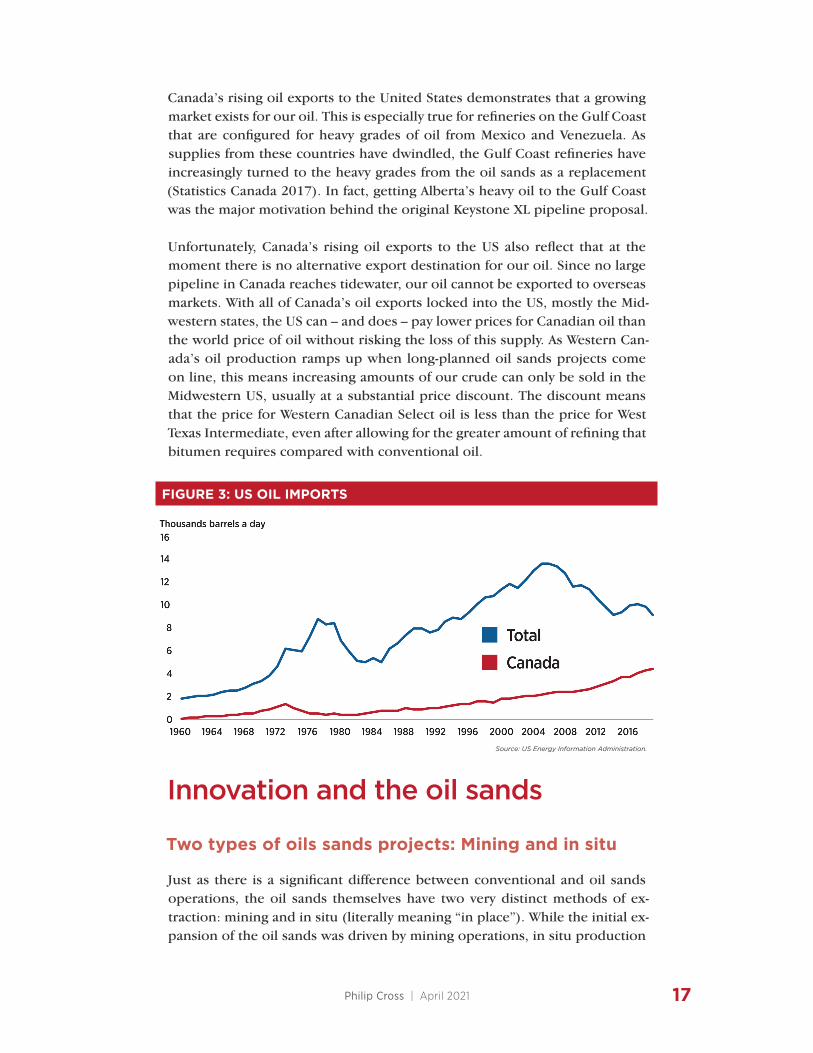
There is a growing market in the United States for Canadian crude oil. While total US imports of oil from all sources declined as its own shale oil produc-tion surged, imports of Canadian oil rose steadily to account for more than half of all US oil imports (Figure 3). Currently, Canada exports about 3.8 mil-lion bpd to the US, and this is expected to rise to between 4.2 and 4.4 million bpd over the next few years. Even with the cancellation of the Keystone XL project, the new Line 3 and Trans Mountain pipelines will ensure enough capacity to increase exports to the US. Western Canada’s oil production alone was 4.64 million bpd in 2020 and is scheduled to rise to 4.72 million bpd in 2021 and 5.17 in 2025 according to the Canadian Association of Petroleum Producers.9
17Philip Cross | April 2021
FIGURE 3: US OIL IMPORTS
Source: US Energy Information Administration.
Canada’s rising oil exports to the United States demonstrates that a growing market exists for our oil. This is especially true for refineries on the Gulf Coast that are configured for heavy grades of oil from Mexico and Venezuela. As supplies from these countries have dwindled, the Gulf Coast refineries have increasingly turned to the heavy grades from the oil sands as a replacement (Statistics Canada 2017). In fact, getting Alberta’s heavy oil to the Gulf Coast was the major motivation behind the original Keystone XL pipeline proposal.
Unfortunately, Canada’s rising oil exports to the US also reflect that at the moment there is no alternative export destination for our oil. Since no large pipeline in Canada reaches tidewater, our oil cannot be exported to overseas markets. With all of Canada’s oil exports locked into the US, mostly the Mid-western states, the US can – and does – pay lower prices for Canadian oil than the world price of oil without risking the loss of this supply. As Western Can-ada’s oil production ramps up when long-planned oil sands projects come on line, this means increasing amounts of our crude can only be sold in the Midwestern US, usually at a substantial price discount. The discount means that the price for Western Canadian Select oil is less than the price for West Texas Intermediate, even after allowing for the greater amount of refining that bitumen requires compared with conventional oil.
Innovation and the oil sands
Two types of oils sands projects: Mining and in situ
Just as there is a significant difference between conventional and oil sands operations, the oil sands themselves have two very distinct methods of ex-traction: mining and in situ (literally meaning “in place”). While the initial ex-pansion of the oil sands was driven by mining operations, in situ production

A NATIONAL PROJECT:HOW OIL SANDS INVESTMENT AND PRODUCTION BENEFIT CANADA’S ECONOMY
18
now accounts for well over half of all oil sands output. Both the economic and the environmental impact of each is quite different.
Mining operations in the oil sands using shovels and trucks began in the late 1990s. The method basically consists of physically removing the sand and its embedded oil and trucking them to a facility where they are crushed and turned into slurry. Water and sand are extracted from the slurry. The water is recycled, while the sand and other solids are left in a tailing pond. Most min-ing projects upgrade the mined bitumen into light quality crude for sale to refineries, with cokers removing hydrocarbons and lowering the viscosity of the bitumen so it flows more easily through pipelines (except for Shell’s Atha-basca and Kearl Lake operations). Mining projects typically are much larger than in situ operations, with the largest operated by Suncor, Syncrude, Atha-basca Oil Sands, Canadian Natural Resources, and Imperial Oil.
The first attempt at the in situ application of steam into the oil sands was in 1924 (Ferguson 1985, 65). However, the first in situ project did not start to operate until 2001 using Steam-Assisted Gravity Drainage (SAGD). In this process, water is pumped from underground and then heated by natural gas-fueled steam generators. The steam is injected into the uppermost of two horizontally-drilled, slotted wells to heat the bitumen. After a period of weeks or months, the steam released through the slots heats the oil embedded in the sands and liquefies it. Gravity then draws the liquefied heavy oil mixed with water into the slots of the lower well and is carried to the surface. The heavy oil and water are then separated and the water is sent back to the steam generators for re-use (Dawson 2015). In situ processes use much less water than mining operations. However, if two wells are situated relatively close-ly to each other, their placement can have a major impact on productivity, though the results are often hard to predict.
The increased use of solvents has lowered costs to the point that the process is described as solvent-assisted SAGD (solvents include propane, pentane, and butane). Solvents also have the advantage of producing a less viscous product, reducing the need to blend bitumen with diluent to move it through pipe-lines. Another in situ process involves cyclic steam simulation (CSS), which injects steam from a wellbore into the reservoir. The largest in situ projects are operated by EnCana, CNR, ConocoPhiliips, and Husky (Alberta Energy Regulator 2020).
Mining operations in the oil sands using shovels and trucks
began in the late 1990s.

19Philip Cross | April 2021
In situ projects have several advantages. SAGD allows the recovery of deep-ly-ing bitumen more than 250 feet below ground (strip mining is only econom-ical for deposits less than 70 metres from the surface) (The Economist 2014). In situ fares better in the low-price environment prevailing since 2015 because these operations are smaller, more flexible, and usually have lower costs. In situ usually does not involve upgrading bitumen on-site to produce synthetic crude oil, which lowers the extraction cost (although synthetic crude is easier to transport). SAGD also has the advantage of not requiring federal govern-ment approval, a process that has slowed work on mining operations.
One drawback of in situ operations is that greenhouse gas (GHG) emissions are higher because natural gas is heated to produce steam. Some, including Canada’s current environment minister, have proposed that switching from natural gas to nuclear power would reduce emissions (Wells 2020). The in-dustry is pursuing the idea of using carbon dioxide as a resource rather than seeing it as waste; the “holy grail” is to produce methanol from captured GHG emissions and hydrogen (McKenzie-Brown 2014).
GHG emissions are not uniform across the oil sands, any more than con-ventional oil wells have the same environmental footprint (oil facilities in Nigeria, for example, have high emissions due to extensive flaring) (Alberta Oil Magazine 2015). The IEA’s chief economist observed that statistically the contribution of the oil sands to global GHG emissions “is not peanuts, it is a small fraction of peanuts” (McCarthy 2012). A 2014 study for Congress found that Canada’s oil sands crude emissions on average were only 17 percent higher than US crude when measured from “well to wheels” (Congressional Research Service 2014, 5). There are several methods of measuring emissions from oil: the first is the upstream emissions released from extraction through upgrading; the second is well-to-refinery-gate, which measures emissions from extraction, upgrading, transporting crude oil to the refinery, and then refining it; a third is well-to-tank, which adds in emissions from transporting the refined product to distribution centres (such as gas stations); and the fourth is well-to-wheels, which adds the emissions that occur when the cus-tomer combusts the final product (Sleep et. al. 2021, 8). New technologies have lowered upstream GHG emissions 14 to 19 percent. However, emissions
GHG emissions are not uniform across the oil sands, any more than
conventional oil wells have the same environmental footprint.

A NATIONAL PROJECT:HOW OIL SANDS INVESTMENT AND PRODUCTION BENEFIT CANADA’S ECONOMY
20
vary substantially from project to project, even when the same technological process is used (Sleep et. al. 2021, 4).
Innovation is as constant for the oil sands as negative media coverage
The proliferation of the new techniques described in the previous section, which have been developed in less than two decades, illustrates how inno-vation flourishes in the oil sands. Technological innovation has focused on extracting and then separating the sand that englobes the oil. Northern Pro-duction Co. made the first attempt at exploiting the oil sands.10 It imported a drilling rig in 1915 to get at the light oil it thought lay underneath the bitumen. Canada’s almost complete reliance on imports of oil in the 1920s piqued government interest in the oil sands. However, the oil sands evolved from “a highly alluring resource in 1920, an interesting one by 1926, and irrelevant amidst the price collapse of the early 1930s” (Ferguson 1985, 35).
The Great Canadian Oil Sands (the predecessor to Suncor) began commercial production in 1967 using mining techniques (Gault 2014). Alternatives to mining began to appear as far back as 1956, when scientists floated the idea of using a controlled underground nuclear explosion to create the heat to separate the oil from the sand, reducing its viscosity enough so it could be extracted by conventional drilling methods (Sweeny 2010, 96). The SAGD process was partly developed with assistance from the Alberta Oil Sands Tech-nology and Research Authority (AOSTRA), created in 1974 with $100 million from Alberta’s Heritage fund as an arms-length institution to develop new technologies for extracting the oil sands.
Most innovation in the oil sands today is directed at in situ technology. SAGD is increasingly being modified by the use of solvents that lower costs and GHG emissions. “Toe-to-Heel Air Injection” involves the underground com-bustion of a portion of the bitumen, which then melts the rest, enabling it to flow into a horizontal production well. This method reduces the carbon footprint and the need for upgrading. Radio waves may prove to be another way to heat the bitumen without using any natural gas or water. Microwaves are also being used to melt bitumen. Another technology being explored is flooding a thick copper cable with an electrical current to create an alternat-ing magnetic field to melt bitumen (The Economist 2014). Canada’s Oil Sands Innovation Alliance encourages and diffuses innovation; it fosters the sharing of innovative technologies and funds the development of new projects that improve technology or reduce the industry’s environmental footprint.
The oil sands industry lost the public relations battle about its environmen-tal impact long ago. As noted, underground SAGD has overtaken mining as the leading production process in the oil sands, and this has considerably reduced the environmental footprint of upstream processing. Nevertheless,
21Philip Cross | April 2021
almost all media stories on the oil sands are accompanied by a photo of gi-gantic shovels loading bitumen into huge trucks, travelling across a landscape scarred by open pit mining, and skirting tailing ponds presumably full of tox-ic materials. The Economist spoke for many (at least in Europe) when it called the strip mining of the oil sands “One of the bleakest scenes of man-made destruction” (The Economist 2014). These apocalyptic photos have become
“the coveted oil sands porn of the industry’s critics” (Gault 2014).
Media portrayals rarely present what an oil sands mine looks like after the land has been rehabilitated, something all companies must commit to and set aside funds for when they begin operations. Equally rare are photos of relatively pristine SAGD sites, where most of the mining work is conducted underground with no need for waste ponds. As one critic admitted, in situ plants “are squeaky clean with little to no above-ground toxins. By melting bitumen below ground (in situ) instead of mining the stuff in an open pit, they produce no tailings ponds” (Lovins and Cohen 2011, 115). The boreal footprint of the oil sands is less than 10 percent of the 11,000 square kilome-tres Quebec has flooded to build its massive hydro power facilities (McArthur and Macgregor 2013). Yet most Quebec politicians continue to denounce Alberta’s “dirty oil” while ignoring the environmental damage of its self-styled clean hydro.11
The oil sands: A Canadian success story
The oil sands are a uniquely Canadian success story and an increasingly rare example of innovation in Canada. Canadians took the lead in developing the oil sands. As far back as 1920 the federal government organized a research committee to investigate the chemical composition of bitumen. The Great Canadian Oil Sands company led the development of these deposits in the 1950s and 1960s. BP sold its oil sands leases to Canadian Natural Resources (CNR) in 1999, choosing instead to focus on Russia, Angola, and the Gulf of Mexico. CNR turned those leases into its Horizon project.
The largest oil sands plants today are operated by Canadian companies includ-ing Suncor Energy, CNR, and Cenovus Energy (Cenovus was the oil company spun off from EnCana when it decided to separate its oil and gas operations in 2009). Canada’s participation in the oil sands extends to First Nations. A Métis community in Alberta owned the first Aboriginal oil sands company, One Earth Oil & Gas Inc., which developed the Gift Bluesky heavy oil project by building on work done by First Nations entrepreneurs on the oil services side of the industry (Cattaneo 2013).

A NATIONAL PROJECT:HOW OIL SANDS INVESTMENT AND PRODUCTION BENEFIT CANADA’S ECONOMY
22
The participation of foreign oil companies in the oil sands has fluctuated with oil prices. The Atlantic Richfield Company (ARCO), an American com-pany, partnered with Syncrude in an oil sands venture, but abandoned the project in 1974 when prices suddenly dropped. In its place, the governments of Canada, Ontario, and Alberta took over the 30 percent share abandoned by ARCO (Alberta Oil Magazine 2011). This began a trend of multinationals rushing to invest in the oil sands when prices and profitability are high, but then abandoning them when low prices make their high fixed costs and poor environmental image too much to bear. Several large foreign companies have left, including BP, Statoil, Total, ConocoPhillips, Royal Dutch Shell, and Mar-athon Oil.
Complicating matters is that European oil companies (like Statoil and Total) saw their brand image enhanced and they possibly even gained some market share when the EU banned imports from the oil sands (the ban was largely symbolic given the difficulty of moving Canada’s oil to tidewater ports in or-der to access overseas markets). As noted elsewhere, the oil sands generally have a positive image in Canada but a poor one overseas, partly because oil sands companies did not do enough to counter the salacious image estab-lished early on by environmentalists.
The hostility to the oil sands is most pronounced in Europe. Its oil companies bowed to pressure from environmentalists and withdrew their investments in the sector, the EU banned imports of oil extracted from oil sands, BP refused for years to recognize oil sands deposits as economically viable,12 and leading media outlets like The Economist insisted on using the derogatory term “tar sands.” This hostility in Europe influenced the public debate in parts of the US and Quebec, a back channel overlooked by the communications strategy of the oil sands industry (if it ever had one).
One reason multinationals have not been leading players in the oil sands is that while their ability to deploy large amounts of capital is useful, and some-times imperative for megaprojects costing billions of dollars, their technical expertise cannot be transferred to the oil sands. The unique technologies needed to extract the oil sands were developed in Alberta, including AOSTRA and universities in Alberta. SAGD was developed by AOSTRA in collaboration with Imperial Oil, with its first commercial application at Foster Creek in 2002
The oil sands are a uniquely Canadian success story and an increasingly rare
example of innovation in Canada.
23Philip Cross | April 2021
(Gault 2014). Almost immediately, the Houston-based Oil & Gas Journal re-vised its estimate of Canada’s oil reserves upward, from 4.9 to 180 billion barrels (Gault 2014).
The input-output model
Statistics Canada’s Input-Output supply and use tables provide a detailed ac-counting of how spending on the oil sands affects Canada’s economy. It uses company tax records to document the exact trail of purchases that oil sands producers make from other businesses, the provinces where business is con-ducted, the incomes they pay to workers, and the taxes collected by govern-ments. All the results are in current dollars, since the input-output tables are not adjusted for price changes.
I measured the impacts of oil sands investment and production on GDP and employment in terms of their direct, indirect, and induced effects. The direct impact reflects the increase in the oil sands operations themselves of more investment and production by measuring the initial requirements for an extra dollar’s worth of output. The indirect effects measure inter-industry purchas-es made from suppliers (both domestic and foreign) to meet the increased demand of investment and output in the oil sands. These suppliers include those providing manufactured products needed in building capital goods, and those providing services including legal, financial, engineering, and even mundane services such as cleaning and security. The induced effect includes the consumer spending that results from the rise in incomes generated by both the direct and indirect increases just outlined.
By necessity, the model reflects the technology and purchasing patterns used when these tax records were collected. While it is possible that new technol-ogies and rising pressures on profit margins would lead to slightly different results if new projects were undertaken today, past experience suggests that technology and buying patterns tend to evolve gradually. The characteristics of both investment and production in the oil sands are different for mining compared with in situ. Unfortunately, the Statistics Canada model cannot dif-ferentiate between the two, and even if it could, confidentiality requirements would likely forbid their publication. Therefore, the results in this paper re-flect the blended results of the two methods.
I used the Input-Output model to simulate the impact of $10 billion of in-vestment in the oil sands, based on actual industry outlays in 2017. The bulk of this investment spending ($7.892 billion) was directed to production fa-cilities for oil and gas exploration and other engineering construction. Other major outlays in support of this investment include $292 million for oil and gas exploration, $154 million for research and development, $54 million for trucks and trailers, and $42 million for custom software.

A NATIONAL PROJECT:HOW OIL SANDS INVESTMENT AND PRODUCTION BENEFIT CANADA’S ECONOMY
24
Investment in 2017 was broadly representative of recent oil sands invest-ments. For example, 82.2 percent of oil sands investments in 2017 were for construction and 17.8 percent for machinery and equipment. This is close to their averages of 77.4 percent for construction and 22.6 percent for ma-chinery and equipment for the period 2017 to 2020.13 Oil sands investment has evolved over time. Between 2006 and 2010, for example, spending was more concentrated on machinery and equipment (at 37.5 percent), reflecting a greater reliance on mining (which uses excavators and trucks) than in situ projects. In recent years, investment has been directed more to in situ proj-ects, which tend to have a smaller scale, lower costs, and use less labour. This shift is captured in the investment data for 2017, which shows that the use of machinery and equipment has fallen by more than half.
The simulation of a $10 billion increase in oil sands production was more straightforward. The only specification needed in the model was to boost oil sands extraction by $10 billion, and then follow what past patterns show would be required in terms of purchases from other industries here and abroad to meet that higher demand and the increase in consumer spending that would be induced by higher incomes.
The economic impact of oil sands investment and production differs substantially
Boosting oil sands investment and production each by $10 billion affects total GDP by about the same amount, but the results are much different for em-ployment both within Alberta and across Canada. The expansion of oil sands production results in a net increase in nominal GDP of $10.042 billion, while raising investment by the same amount lifts overall GDP by $10.059 billion. These gains would boost Canada’s overall GDP by 0.5 percent, a substantial impact at a time of chronically slow growth.
Meanwhile, higher investment in the oil sands increases overall employment by 81,734, equal to 0.4 percent of total jobs in Canada, while the simulat-ed hike to production leads to a gain of 38,237 jobs, the equivalent to 0.2 percent of employment.14 The smaller employment increase from higher oil sands production reflects the capital-intensity of these operations; once built, they require only modest amounts of labour to expand production. Put an-other way, these facilities have very high labour productivity. Raising output by $10 billion only requires 4195 more workers directly employed in the oil sands plants themselves, and an additional 23,009 employees among firms that supply the oil sands. This implies an average output per employee of $367,593 (or $420,734 using full-time equivalents). The high level of labour productivity is reflected in high levels of wages and salaries in the industry.
However, the mirror image of the high labour productivity of the oil sands is their capital intensity, which lowers their overall Total Factor Productivity

25Philip Cross | April 2021
(which accounts for inputs of both labour and capital). Put another way, the oil sands can be a higher cost method of extracting oil than conventional oil production (Alberta 2016, 5). However, the oil sands compare favourably with other capital-intensive extraction methods, such as off-shore drilling and the fracking of shale oil deposits.
A $10 billion investment in the oil sands increases total spending by $13.5 billion. This includes the direct effect of the $10 billion investment in the oil sands and the indirect effects of supplying more inputs to make these invest-ments and the induced effect from consumers having more wages and sala-ries to spend. Of this $13.5 billion of spending, $3.1 billion goes to imports from other countries (and therefore does not appear in GDP), especially for the specialized machinery and equipment needed to build an oil sands plant. Another $2.1 billion goes to higher interprovincial imports, mostly from On-tario ($1.0 billion), BC ($0.4 billion) and Quebec ($0.3 billion). Even Alberta sees its own exports rise by $86 million, much of it energy to meet higher industrial demand in other provinces from the upturn in business.
Raising oil sands production by $10 billion leads to a total increase in spend-ing of $11.8 billion. Of this, $1.5 billion goes to imports, less than half the leakage that occurs if the same amount is spent on investment (which re-quires machinery and equipment that are not produced in Canada). Another $1.5 billion goes to interprovincial trade, which almost matches the $2.1 bil-lion from investment. Again, the largest beneficiaries are Ontario ($0.8 bil-lion), BC ($0.3 billion), and Quebec ($0.2 billion).
Oil sands can be a higher cost method of extracting oil than conventional oil production.
Production Investment
GDP $ 10,042,341,000 $ 10,058,667,000
Jobs 38,237 81,734
Labour income
$ 3,217,003,000 $ 6,349,226,000
TABLE 1: THE ECONOMIC IMPACT OF $10 BILLION INCREASES IN OIL SANDS PRODUCTION AND INVESTMENT
A NATIONAL PROJECT:HOW OIL SANDS INVESTMENT AND PRODUCTION BENEFIT CANADA’S ECONOMY
26
Alberta benefits the most
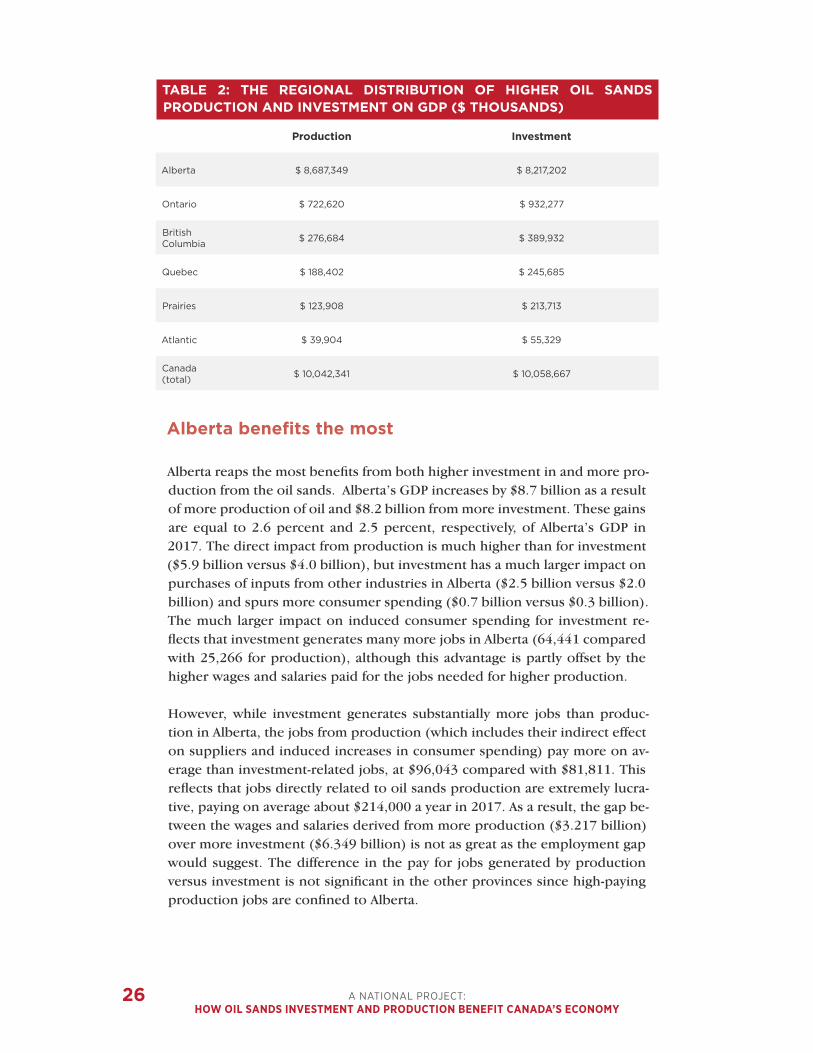
Alberta reaps the most benefits from both higher investment in and more pro-duction from the oil sands. Alberta’s GDP increases by $8.7 billion as a result of more production of oil and $8.2 billion from more investment. These gains are equal to 2.6 percent and 2.5 percent, respectively, of Alberta’s GDP in 2017. The direct impact from production is much higher than for investment ($5.9 billion versus $4.0 billion), but investment has a much larger impact on purchases of inputs from other industries in Alberta ($2.5 billion versus $2.0 billion) and spurs more consumer spending ($0.7 billion versus $0.3 billion). The much larger impact on induced consumer spending for investment re-flects that investment generates many more jobs in Alberta (64,441 compared with 25,266 for production), although this advantage is partly offset by the higher wages and salaries paid for the jobs needed for higher production.
However, while investment generates substantially more jobs than produc-tion in Alberta, the jobs from production (which includes their indirect effect on suppliers and induced increases in consumer spending) pay more on av-erage than investment-related jobs, at $96,043 compared with $81,811. This reflects that jobs directly related to oil sands production are extremely lucra-tive, paying on average about $214,000 a year in 2017. As a result, the gap be-tween the wages and salaries derived from more production ($3.217 billion) over more investment ($6.349 billion) is not as great as the employment gap would suggest. The difference in the pay for jobs generated by production versus investment is not significant in the other provinces since high-paying production jobs are confined to Alberta.
Production Investment
Alberta $ 8,687,349 $ 8,217,202
Ontario $ 722,620 $ 932,277
British Columbia
$ 276,684 $ 389,932
Quebec $ 188,402 $ 245,685
Prairies $ 123,908 $ 213,713
Atlantic $ 39,904 $ 55,329
Canada (total)
$ 10,042,341 $ 10,058,667
TABLE 2: THE REGIONAL DISTRIBUTION OF HIGHER OIL SANDS PRODUCTION AND INVESTMENT ON GDP ($ THOUSANDS)
27Philip Cross | April 2021
Production Investment
Alberta 25,266 64,441
Ontario 6,963 8,466
BC 2,380 3,767
Quebec 2,070 2,610
Atlantic 410 548
Canada 38,237 81,734
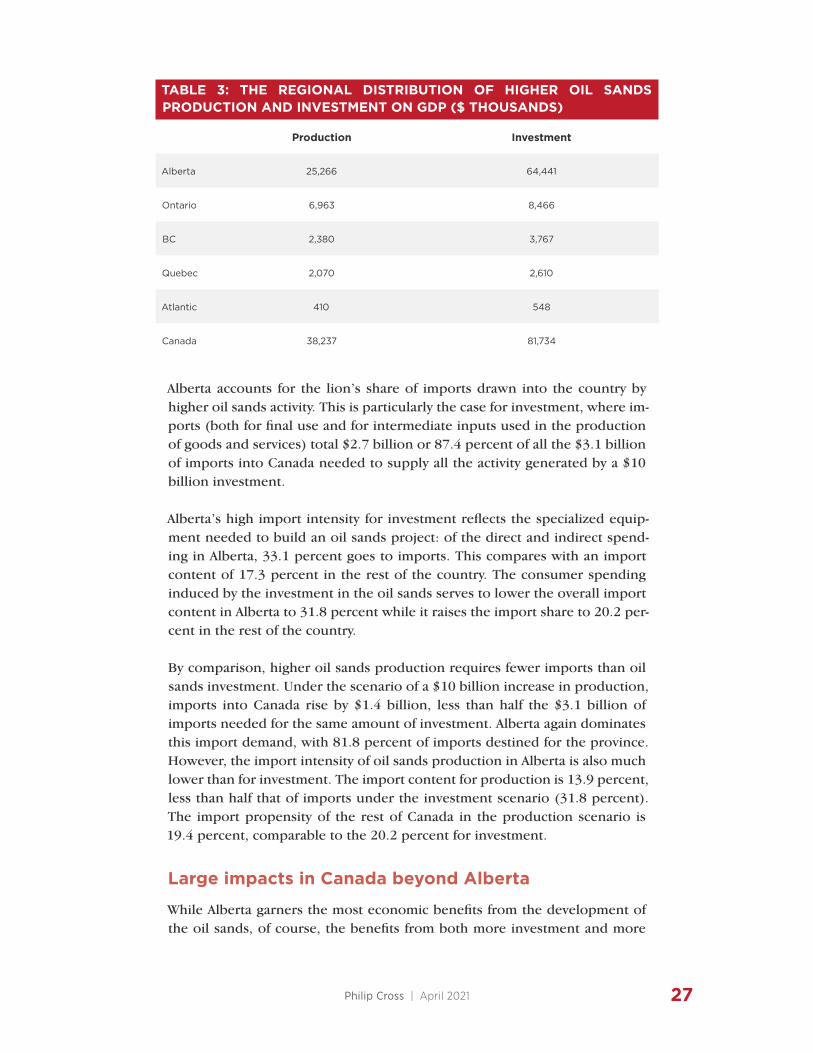
TABLE 3: THE REGIONAL DISTRIBUTION OF HIGHER OIL SANDS PRODUCTION AND INVESTMENT ON GDP ($ THOUSANDS)
Alberta accounts for the lion’s share of imports drawn into the country by higher oil sands activity. This is particularly the case for investment, where im-ports (both for final use and for intermediate inputs used in the production of goods and services) total $2.7 billion or 87.4 percent of all the $3.1 billion of imports into Canada needed to supply all the activity generated by a $10 billion investment.
Alberta’s high import intensity for investment reflects the specialized equip-ment needed to build an oil sands project: of the direct and indirect spend-ing in Alberta, 33.1 percent goes to imports. This compares with an import content of 17.3 percent in the rest of the country. The consumer spending induced by the investment in the oil sands serves to lower the overall import content in Alberta to 31.8 percent while it raises the import share to 20.2 per-cent in the rest of the country.
By comparison, higher oil sands production requires fewer imports than oil sands investment. Under the scenario of a $10 billion increase in production, imports into Canada rise by $1.4 billion, less than half the $3.1 billion of imports needed for the same amount of investment. Alberta again dominates this import demand, with 81.8 percent of imports destined for the province. However, the import intensity of oil sands production in Alberta is also much lower than for investment. The import content for production is 13.9 percent, less than half that of imports under the investment scenario (31.8 percent). The import propensity of the rest of Canada in the production scenario is 19.4 percent, comparable to the 20.2 percent for investment.
Large impacts in Canada beyond Alberta
While Alberta garners the most economic benefits from the development of the oil sands, of course, the benefits from both more investment and more
A NATIONAL PROJECT:HOW OIL SANDS INVESTMENT AND PRODUCTION BENEFIT CANADA’S ECONOMY
28
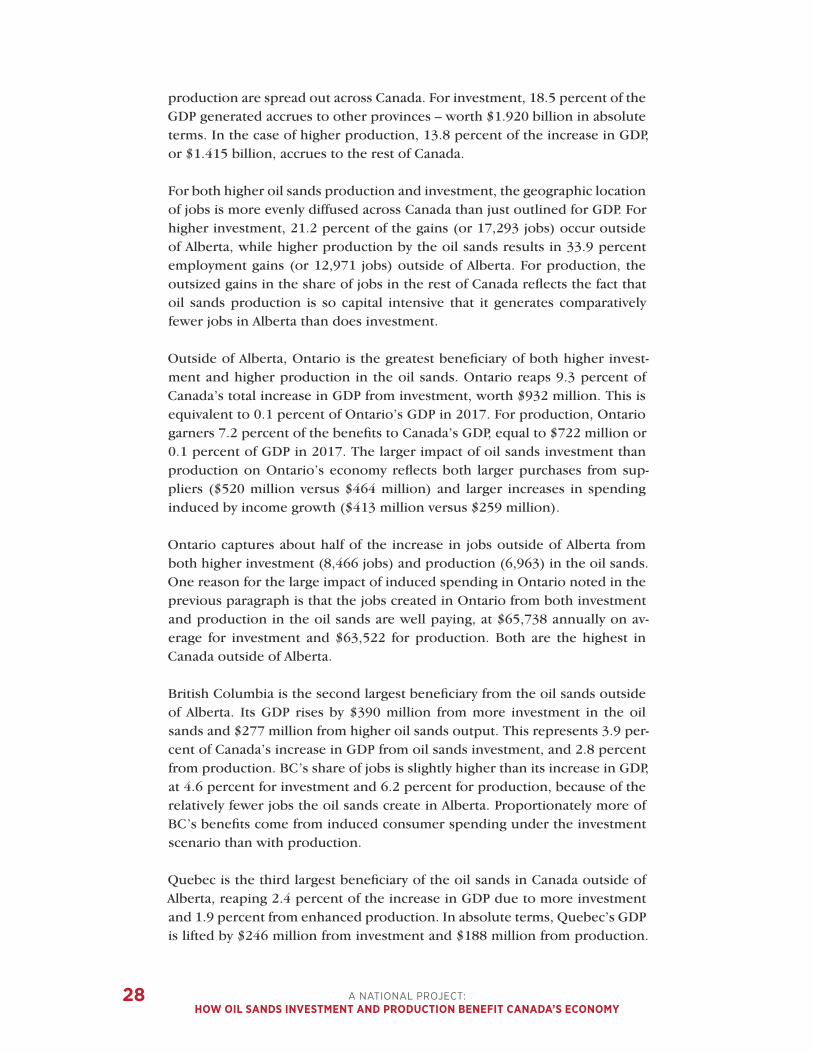
production are spread out across Canada. For investment, 18.5 percent of the GDP generated accrues to other provinces – worth $1.920 billion in absolute terms. In the case of higher production, 13.8 percent of the increase in GDP, or $1.415 billion, accrues to the rest of Canada.
For both higher oil sands production and investment, the geographic location of jobs is more evenly diffused across Canada than just outlined for GDP. For higher investment, 21.2 percent of the gains (or 17,293 jobs) occur outside of Alberta, while higher production by the oil sands results in 33.9 percent employment gains (or 12,971 jobs) outside of Alberta. For production, the outsized gains in the share of jobs in the rest of Canada reflects the fact that oil sands production is so capital intensive that it generates comparatively fewer jobs in Alberta than does investment.
Outside of Alberta, Ontario is the greatest beneficiary of both higher invest-ment and higher production in the oil sands. Ontario reaps 9.3 percent of Canada’s total increase in GDP from investment, worth $932 million. This is equivalent to 0.1 percent of Ontario’s GDP in 2017. For production, Ontario garners 7.2 percent of the benefits to Canada’s GDP, equal to $722 million or 0.1 percent of GDP in 2017. The larger impact of oil sands investment than production on Ontario’s economy reflects both larger purchases from sup-pliers ($520 million versus $464 million) and larger increases in spending induced by income growth ($413 million versus $259 million).
Ontario captures about half of the increase in jobs outside of Alberta from both higher investment (8,466 jobs) and production (6,963) in the oil sands. One reason for the large impact of induced spending in Ontario noted in the previous paragraph is that the jobs created in Ontario from both investment and production in the oil sands are well paying, at $65,738 annually on av-erage for investment and $63,522 for production. Both are the highest in Canada outside of Alberta.
British Columbia is the second largest beneficiary from the oil sands outside of Alberta. Its GDP rises by $390 million from more investment in the oil sands and $277 million from higher oil sands output. This represents 3.9 per-cent of Canada’s increase in GDP from oil sands investment, and 2.8 percent from production. BC’s share of jobs is slightly higher than its increase in GDP, at 4.6 percent for investment and 6.2 percent for production, because of the relatively fewer jobs the oil sands create in Alberta. Proportionately more of BC’s benefits come from induced consumer spending under the investment scenario than with production.
Quebec is the third largest beneficiary of the oil sands in Canada outside of Alberta, reaping 2.4 percent of the increase in GDP due to more investment and 1.9 percent from enhanced production. In absolute terms, Quebec’s GDP is lifted by $246 million from investment and $188 million from production.

29Philip Cross | April 2021
Jobs in Quebec increase by 2070 in the scenario where oil sands production rises and by 2610 in the case of more investment.
Combined with Ontario, central Canada reaps 13.6 percent of the jobs and 11.7 percent of the GDP generated by oil sands investment. For oil sands pro-duction, central Canada’s share of GDP is slightly less than for investment at 9.1 percent, but its share of jobs jumps to 23.6 percent. The larger share of jobs mostly reflects the fact that oil sands production generates relatively few jobs in the oil sands in Alberta itself. So while the share of jobs in central Can-ada is higher for oil sands production than for investment, in absolute terms oil sands investment generates more jobs in central Canada than oil sands production does, even if central Canada’s share of jobs from production is higher than from investment.
For analytical purposes, Manitoba and Saskatchewan are combined into the Prairie region in Tables 1 and 2. The Prairies garner 2.1 percent of all Cana-da’s gains in GDP as a result of the simulated increase in investment and 1.2 percent from higher production. In absolute terms, this represents $213.7 million and $123.9 million, respectively. The Prairie’s share of job growth is slightly higher than its GDP gains, at 2.3 percent and 2.9 percent, respectively.
Few of the benefits of higher oil sands investment and production reach the Atlantic provinces. Altogether they generate about $55 million of GDP from oil sands investment and $40 million from production, which represent 0.6 percent of the Canada-wide gains from investment and 0.4 percent from pro-duction. The Atlantic region’s share of employment gains is slightly larger than its increase in GDP, at 0.7 percent for investment and 1.1 percent for production. Within the Atlantic provinces, New Brunswick gains the most in both GDP and employment.
The jobs added by oil sands growth pay well
Canada-wide, the employment gains from both higher oil sands investments and production pay well above the average. The 81,734 jobs generated by ex-panding investment in the oil sands by $10 billion pay an average of $77,682 a year (including wages and salaries and supplementary benefits). The 38,237 jobs attributable to a $10 billion increase in oil sands output have an average
Oil sands investment generates more jobs in central Canada
than oil sands production.
A NATIONAL PROJECT:HOW OIL SANDS INVESTMENT AND PRODUCTION BENEFIT CANADA’S ECONOMY
30
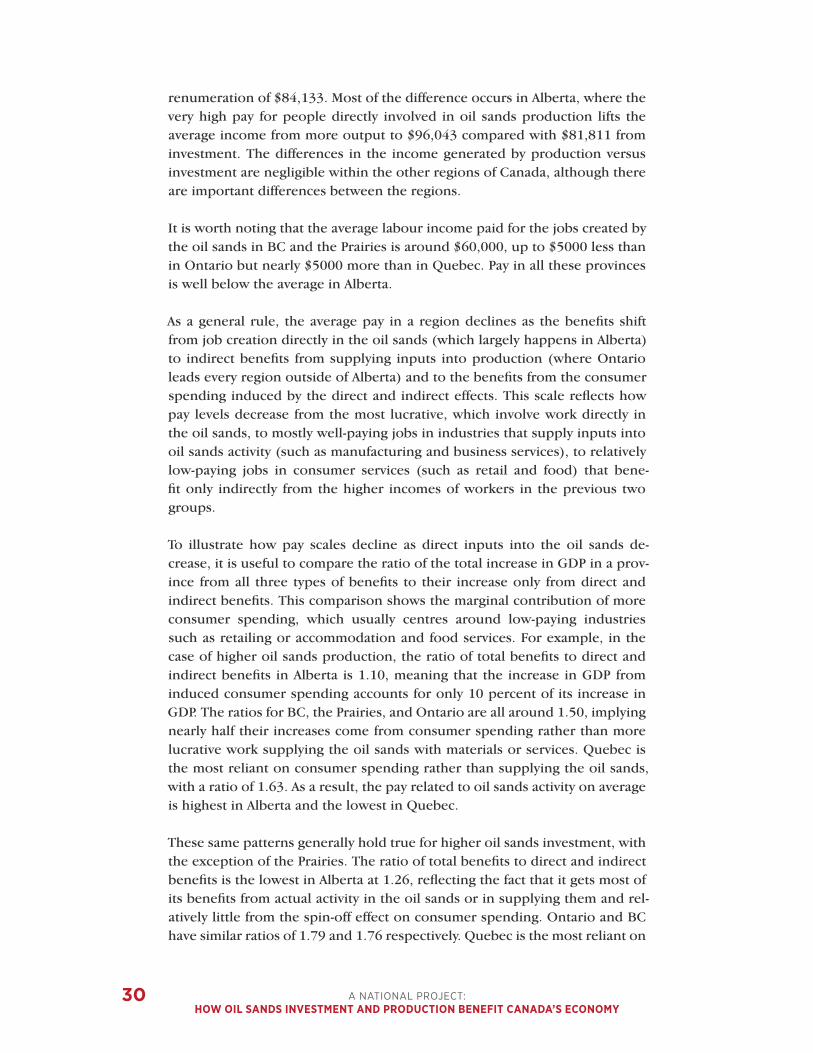
renumeration of $84,133. Most of the difference occurs in Alberta, where the very high pay for people directly involved in oil sands production lifts the average income from more output to $96,043 compared with $81,811 from investment. The differences in the income generated by production versus investment are negligible within the other regions of Canada, although there are important differences between the regions.
It is worth noting that the average labour income paid for the jobs created by the oil sands in BC and the Prairies is around $60,000, up to $5000 less than in Ontario but nearly $5000 more than in Quebec. Pay in all these provinces is well below the average in Alberta.
As a general rule, the average pay in a region declines as the benefits shift from job creation directly in the oil sands (which largely happens in Alberta) to indirect benefits from supplying inputs into production (where Ontario leads every region outside of Alberta) and to the benefits from the consumer spending induced by the direct and indirect effects. This scale reflects how pay levels decrease from the most lucrative, which involve work directly in the oil sands, to mostly well-paying jobs in industries that supply inputs into oil sands activity (such as manufacturing and business services), to relatively low-paying jobs in consumer services (such as retail and food) that bene-fit only indirectly from the higher incomes of workers in the previous two groups.
To illustrate how pay scales decline as direct inputs into the oil sands de-crease, it is useful to compare the ratio of the total increase in GDP in a prov-ince from all three types of benefits to their increase only from direct and indirect benefits. This comparison shows the marginal contribution of more consumer spending, which usually centres around low-paying industries such as retailing or accommodation and food services. For example, in the case of higher oil sands production, the ratio of total benefits to direct and indirect benefits in Alberta is 1.10, meaning that the increase in GDP from induced consumer spending accounts for only 10 percent of its increase in GDP. The ratios for BC, the Prairies, and Ontario are all around 1.50, implying nearly half their increases come from consumer spending rather than more lucrative work supplying the oil sands with materials or services. Quebec is the most reliant on consumer spending rather than supplying the oil sands, with a ratio of 1.63. As a result, the pay related to oil sands activity on average is highest in Alberta and the lowest in Quebec.
These same patterns generally hold true for higher oil sands investment, with the exception of the Prairies. The ratio of total benefits to direct and indirect benefits is the lowest in Alberta at 1.26, reflecting the fact that it gets most of its benefits from actual activity in the oil sands or in supplying them and rel-atively little from the spin-off effect on consumer spending. Ontario and BC have similar ratios of 1.79 and 1.76 respectively. Quebec is the most reliant on

31Philip Cross | April 2021
consumer spending with a ratio of 1.96, implying that Quebec benefits almost as much from induced gains in consumer spending as from supplying inputs into more oil sands investments.
It is noteworthy that the ratio of all growth from oil sands investment to growth excluding induced consumer spending is 1.57 for the Prairies. This is almost in the middle between Alberta and the other provinces, with most of the difference due to Saskatchewan (with a ratio of 1.48 versus 1.85 for Man-itoba). This low ratio for Saskatchewan is because investment in the oil sands requires more purchases from suppliers in Saskatchewan than from Manitoba, totalling $96 million. This may reflect the location of a large steel manufac-turer in Saskatchewan which specializes in the type of equipment used in the construction of oil sands facilities. The work in such manufacturing typically is high value and well-paying.
ConclusionThe oil sands are a uniquely Canadian success story and an increasingly rare example of innovation in Canada. To protect the large investments already made in the oil sands against its demonization by its opponents, further in-novation will be required to further lower operating costs and emissions. The track record of relentless innovation by the industry suggests such an out-come is eminently possible. It will then be important for the industry and governments in Canada to set the public record straight on what this industry has accomplished and its importance to Canada’s economy. This paper is a contribution to a better understanding of the oil sands.

A NATIONAL PROJECT:HOW OIL SANDS INVESTMENT AND PRODUCTION BENEFIT CANADA’S ECONOMY
32
About the authorPhilip Cross is a Munk Senior Fellow at the Macdonald-Laurier Institute. Prior to joining MLI, Mr. Cross spent 36 years at Statistics Can-ada specializing in macroeconomics. He was appointed Chief Economic Analyst in 2008 and was responsible for ensuring quality and coher-ency of all major economic statistics. During his career, he also wrote the “Current Economic Conditions” section of the Canadian Econom-ic Observer, which provides Statistics Canada’s view of the economy. He is a frequent commen-tator on the economy and interpreter of Statis-tics Canada reports for the media and general public. He is also a member of the CD Howe Business Cycle Dating Committee.

33Philip Cross | April 2021
ReferencesAlberta Oil Magazine. 2015. “A Crude Comparison.” Alberta Oil Magazine, July.
Alberta Oil Magazine. 2011. “Canada’s New Boss Finds His ‘Dream Job.’” Al-berta Oil Magazine, September.
Alberta. 2016. Trends in Labour Productivity in Alberta. Government of Al-berta, October.
Alberta Energy Regulator. 2020. “ST53: Alberta In Situ Oil Sands Production Summary.” Alberta Energy Regulator. Available at https://www.aer.ca/provid-ing-information/data-and-reports/statistical-reports/st53.
Birn, Kevin and Celina Hwang. 2020. Longer-Term Outlook for Canadian Oil Sands Largely Intact Despite Largest Annual Production Decline in 2020. IHS Markit, July 28.
Canadian Energy Research Institute. 2011. Economic Impacts of New Oil Sands Projects in Alberta (2010-2035). Canadian Energy Research Institute, May 11.
Cattaneo, Claudia. 2013. “Oil Sands Deal.” Financial Post, September 25.
Cattaneo, Claudia. 2016. “Oilsands Steam Ahead.” Financial Post, February 25.
Chen, Wen-Hao and Rene Morissette. 2020. “How Do Workers Displaced from Energy-producing Sectors Fare after Job Loss? Evidence from the Oil and Gas Industry.” Statistics Canada Catalogue no. 11-626-X. Economic Insights No. 123, September.
Chretien, Jean. 2007. My Years as Prime Minister. Knopf Canada.
Congressional Research Service. 2014. Keystone XL: Greenhouse Gas Emis-

A NATIONAL PROJECT:HOW OIL SANDS INVESTMENT AND PRODUCTION BENEFIT CANADA’S ECONOMY
34
sions Assessments in the Draft Environmental Impact Statement. Congres-sional Research Service, March 20.
Cross, Philip. 2013. Extracting the Most Value from Canada’s Petroleum. Commentary. Macdonald-Laurier Institute (October).
Dawson, Chester. 2015. “As Oil Slips Below $50, Canada Digs in for Long Haul.” New York Times, January 14.
Dawson, Chester. 2015. “Crude Slump Hits Oil-Sands Projects.” Wall Street Journal, July 24.
Ebner, David. 2007. “Oil Versus Tar: Here’s Where It Gets Sticky.” Globe and Mail, March 12.
The Economist. 2014. “The Steam from Below.” The Economist, September 6.
The Economist. 2020. “Alberta Goes Green: The Home of the Oil Sands Looks for Cleaner Ways to Make a Living.” The Economist, December 5.
Epstein, Alex. 2014. The Moral Case for Fossil Fuels. Portfolio.
Ferguson, Barry Glen. 1985. Athabasca Oil Sands Northern Resource Explo-ration, 1875-1951. Alberta Culture/Canadian Plains Research Center.
Gault, Sebastian. 2014. “Full Steam Ahead.” Alberta Oil Magazine, February.
Gould, Ed. 1976. The History of Canada’s Oil & Gas Industry. Hancock House.
Krugel, Lauren. 2012. “CNRL Plans to Boost Capital Spending in 2013.” Globe and Mail, December 5.
Lovins, L. Hunter, and Boyd Cohen. 2011. Climate Capitalism: Capitalism in the Age of Climate Change. Hill and Wang.
McArthur, Susan, and Ian Macgregor. 2013. “Keystone follies: Canadian oil sands not a major source of climate change.” Financial Post, April 9. Available at https://financialpost.com/opinion/keystone-follies-canadian-oil-sands-not-causing-climate-change.
McCarthy, Shawn. 2012. “World Needs Oil Sands Crude, IEA Say.” Globe and Mail, November 27.
McKenzie-Brown, Peter. 2014. “Grand Challenge.” Oilweek, October.

35Philip Cross | April 2021
McMahon, Tamsin. 2013. “The Future of Jobs.” Canadian Business, March 25.
Millington, Dinara and Carlos A. Murillo. 2015. Canadian Oil Sands Supply Costs and Development Projects (2015-2035). Canadian Energy Research In-stitute, Study No. 152, August.
Morgan, Geoffrey. 2014. “Shelved and Supersized: An Oil Sands Paradox.” Fi-nancial Post, October 14.
Morgan, Geoffrey. 2016. “Oilsands Firms May Be Forced to Cut Production as Danger of Negative Bitumen Prices Loom. Financial Post, January 25.
Morgan, Geoffrey. 2018. “Fort Hills Won’t Be Last Big Project from Suncor in Oilsands, CEO Says.” Financial Post, September 11.
Patriquin, Martin. 2019. “Quebec slags Alberta’s oil bounty, while gorging it-self on it at the same time.” CBC News, May 2. Available at https://www.cbc.ca/news/opinion/quebec-oil-1.5118791.
Poitras, Jacques. 2018. Pipe Dreams: The Fight for Canada’s Energy Future. Penguin Random House.
Sleep, Sylvia, Zainab Dadashi, Yuanlei Chen, Adan Brandt, Heather MacLean, and Joule Bergerson. 2021. “Improving Robustness of LCA Results through Stakeholder Engagement: A Case Study of Emerging Oil Sands Technologies.” Journal of Cleaner Production 281 (January).
Statistics Canada. 2017. Canada’s Merchandise Trade with the U.S. by State. Catalogue 13-605-X (June 19).
Sweeny, Alastair. 2010. Black Bonanza: Alberta’s Oil Sands and the Race to Secure North America’s Energy Future. Wiley.
Tuttle, Robert. 2015. “Canadian Oil Sands Output Growth Defies Plunge in Prices.” Bloomberg, July 20.
US Energy Information Administration. Open Data. Available at https://www.eia.gov/opendata/qb.php?sdid=TOTAL.PAIMPCN.A and https://www.eia.gov/opendata/qb.php?sdid=TOTAL.PAIMPUS.A.
Wang, Weimin. 2020. The Decline in Production and Investment in Canada’s Oil and Gas Sector and its Impact on the Economy. Statistics Canada Cata-logue 11-626-X (July 8).
Wells, Paul. 2020. “The Interview, with Johnathan Wilkinson.” Maclean’s, No-vember.
A NATIONAL PROJECT:HOW OIL SANDS INVESTMENT AND PRODUCTION BENEFIT CANADA’S ECONOMY
36
Williams, Nia. 2015. “Canadian oil sands producers stay defiant in face of price slump.” Financial Post, January 20. Available at https://www.reuters.com/article/canada-oil-costs-idUSL1N0UU30O20150120.
Yergin, Daniel. 2011. The Quest: Energy, Security, and the Remaking of the Modern World. Penguin.
Endnotes1 For a description of how the input-output tables can be used to analyze
the oil and gas sector, see Wang (2020).
2 The Horizon project cost over $10 billion spread over five years (see Krugel 2012). Horizon has a production schedule of 50 years (Hussain 2015). Other comparable projects included Total’s $11 billion Joslyn mine. Mega projects were staggered to avoid construction at the same time, which would have created shortages of labour and material (Mor-gan 2014). See also Imperial Oil’s Kearl and Sunrise by Husky Energy.
3 The Canadian Energy Research Institute (2011) provides an example of studying the impact of investment spending as it is spread out over sev-eral years.
4 For example, IHS Markit estimates the discount cost Canadian producers $14 billion in 2019. See https://www.canadianenergycentre.ca/canadas-pipeline-capacity-woes-slashed-at-least-14-billion-from-oil-producers-bottom-line/.
5 However, The Economist did refer to the oil sands in 2014 (The Econo-mist 2014).
6 Figure 1 shows the supply of oil sands measured in cubic metres rather than as a percentage of GDP because the data for supply extend from 1985 to the present, while the GDP data stop in 2007. However, the supply and production of the oil sands is virtually the same, so the two concepts are used interchangeably.
7 Similarly, almost all investment in oil refining in North America in recent decades has been directed at expanding existing facilities, partly because of the difficulty of obtaining permits due to NIMBYism. So, while critics cite the absence of new refineries as a sign of a dying industry, refining capacity has actually increased (see Cross 2013).
37Philip Cross | April 2021
8 Available at Statistics Canada, Table 14-10-0201-01. Employment by in-dustry, monthly, unadjusted for seasonality.
9 Available at https://www.capp.ca/wp-content/uploads/2019/11/2019_Crude_Oil_Forecast_Markets_and_Transportation-338794.pdf.
10 In fact, innovation has flourished in Canada’s oil industry more broadly. North America’s first oil well was dug in Ontario in 1857, Canada was first to refine kerosene, and it built the world’s first oil pipeline between Petrolia and Sarnia in 1862 (Gould 1976, 60).
11 For example, Bloc Québécois leader Yves-François Blanchet denounced Alberta’s “toxic oilsands,” Premier Francois Legault called oil “dirty ener-gy,” and the National Assembly unanimously passed a resolution that the Energy East pipeline was “not socially acceptable” in Quebec (Patriquin 2019).
12 BP and Royal Dutch Shell publicly argued about which international oil company first identified climate change as a risk (Yergin 2011, 499).
13 Available at Statistics Canada, Table 34-10-0036-01: Capital and Repair Expenditures, Non-Residential Tangible Assets by Industry.
14 Almost all these jobs are full time; expressed in terms of Full-Time Equiv-alents (FTEs) the increase from raising production is 31,901 jobs versus 72,269 for investment. Almost all employment directly in the oil sands and its suppliers (such as manufacturing, transportation, and finance) are full-time jobs. Most part-time jobs are the result of the induced ef-fect of higher consumer spending, which creates jobs in services such as retailing and restaurants where part-time employment predominates.

For more information visit: www.MacdonaldLaurier.ca
Critically Acclaimed, Award-Winning InstituteThe Macdonald-Laurier Institute fills a gap in Canada’s democratic infrastructure by focusing our work on the full range of issues that fall under Ottawa’s jurisdiction.
• One of the top five think tanks in Canada andNo. 1 in Ottawa according to the University ofPennsylvania.
• Cited by five present and former Canadian PrimeMinisters, as well as by David Cameron, theBritish Prime Minister.
• First book, The Canadian Century: Moving outof America’s Shadow, won the Sir Antony FisherInternational Memorial Award in 2011.
• Hill Times says Brian Lee Crowley is one of the100 most influential people in Ottawa.
• The Wall Street Journal, the Economist, theGlobe and Mail, the National Post and manyother leading national and internationalpublications have quoted the Institute’s work.
Where You’ve Seen Us
Ideas Change the World
Independent and non-partisan, the Macdonald-Laurier Institute is increasingly recognized as the thought leader on national issues in Canada, prodding governments, opinion leaders and the general public to accept nothing but the very best public policy solutions for the challenges Canada faces.
“The study by Brian Lee Crowley and Ken Coates is a ‘home run’. The analysis by Douglas Bland will make many uncomfortable but it is a wake up call that must be read.” FORMER CANADIAN PRIME MINISTER PAUL MARTIN ON MLI’S PROJECT ON ABORIGINAL PEOPLE AND THE NATURAL RESOURCE ECONOMY.

What Do We Do?When you change how people think, you change what they want and how they act. That is why thought leadership is essential in every field. At MLI, we strip away the complexity that makes policy issues unintelligible and present them in a way that leads to action, to better quality policy decisions, to more effective government, and to a more focused pursuit of the national interest of all Canadians. MLI is the only non-partisan, independent national public policy think tank based in Ottawa that focuses on the full range of issues that fall under the jurisdiction of the federal government.
What Is in a Name?The Macdonald-Laurier Institute exists not merely to burnish the splendid legacy of two towering figures in Canadian history – Sir John A. Macdonald and Sir Wilfrid Laurier – but to renew that legacy. A Tory and a Grit, an English speaker and a French speaker – these two men represent the very best of Canada’s fine political tradition. As prime minister, each championed the values that led to Canada assuming her place as one of the world’s leading democracies. We will continue to vigorously uphold these values, the cornerstones of our nation.
Working for a Better Canada Good policy doesn’t just happen; it requires good ideas, hard work, and being in the right place at the right time. In other words, it requires MLI. We pride ourselves on independence, and accept no funding from the government for our research. If you value our work and if you believe in the possibility of a better Canada, consider making a tax-deductible donation. The Macdonald-Laurier Institute is a registered charity.
For more information visit: www.MacdonaldLaurier.ca
Our Issues
The Institute undertakes an impressive program of thought leadership on public policy. Some of the issues we have tackled recently include:
• Aboriginal people and the management of our natural resources;
• Making Canada’s justice system more fair and efficient;
• Defending Canada’s innovators and creators;
• Controlling government debt at all levels;
• Advancing Canada’s interests abroad;
• Ottawa’s regulation of foreign investment; and
• How to fix Canadian health care.
About the Macdonald-Laurier Institute

A NATIONAL PROJECT:HOW OIL SANDS INVESTMENT AND PRODUCTION BENEFIT CANADA’S ECONOMY
40
W H A T P E O P L E A R E S A Y I N G A B O U T ML I
I want to congratulate the Macdonald-Laurier Institute for 10 years of excellent service to Canada. The Institute's commitment to public policy innovation has put them on the cutting edge of many of the country's most pressing policy debates. The Institute works in a persistent and constructive way to present new and insightful ideas about how to best achieve Canada's potential and to produce a better and more just country. Canada is better for the forward-thinking, research-based perspectives that the Macdonald-Laurier Institute brings to our most critical issues.
The Macdonald-Laurier Institute has been active in the field of Indigenous public policy, building a fine tradition of working with Indigenous organizations, promoting Indigenous thinkers and encouraging innovative, Indigenous-led solutions to the challenges of 21st century Canada. I congratulate MLI on its 10 productive and constructive years and look forward to continuing to learn more about the Institute's fine work in the field.
May I congratulate MLI for a decade of exemplary leadership on national and international issues. Through high-quality research and analysis, MLI has made a significant contribution to Canadian public discourse and policy development. With the global resurgence of authoritarianism and illiberal populism, such work is as timely as it is important. I wish you continued success in the years to come.
The Macdonald-Laurier Institute has produced countless works of scholarship that solve today's problems with the wisdom of our political ancestors.If we listen to the Institute's advice, we can fulfill Laurier's dream of a country where freedom is its nationality.
The Honourable Jody Wilson-Raybould
The Honourable Irwin Cotler
The Honourable Pierre Poilievre
The Right Honourable Paul Martin
@MLInstitute
facebook.com/MacdonaldLaurierInstitute
youtube.com/MLInstitute
linkedin.com/company/macdonald-laurier-institute
613-482-8327 • [email protected]
323 Chapel Street, Suite 300, Ottawa, Ontario K1N 7Z2
M A C D O N A L D - L A U R I E R I N S T I T U T E
Ideas change the world