taxing the 1%? - macdonald-laurier institute · e retentissement politique des questions touchant...
TRANSCRIPT
TAXING THE 1%?The limits of redistribution and a plan for inclusive growth
SEAN SPEERAPRIL 2017

Board of Directors
CHAIR Rob Wildeboer Executive Chairman, Martinrea International Inc.
VICE CHAIR Jacquelyn Thayer Scott
Past President and Professor, Cape Breton University, Sydney
MANAGING DIRECTOR Brian Lee Crowley
SECRETARY Lincoln Caylor Partner, Bennett Jones LLP, Toronto
TREASURER Martin MacKinnon CFO, Black Bull Resources Inc., Halifax
DIRECTORS
Pierre Casgrain Director and Corporate Secretary of Casgrain & Company Limited
Erin Chutter President and CEO of Global Cobalt Corporation
Laura Jones Executive Vice-President of the Canadian Federation of Independent Business (CFIB).
Vaughn MacLellan DLA Piper (Canada) LLP
Advisory Council
John Beck Chairman and CEO, Aecon Construction Ltd., Toronto
Navjeet (Bob) Dhillon President and CEO, Mainstreet Equity Corp., Calgary
Jim Dinning Former Treasurer of Alberta
Hon. David Emerson Former federal cabinet minister, corporate director and public policy adviser
Richard Fadden Former National Security Advisor to the Prime Minister and former Deputy Minister of National Defence
Brian Flemming International lawyer, writer, and policy advisor
Robert Fulford Former Editor of Saturday Night magazine, columnist with the National Post
Wayne Gudbranson CEO, Branham Group Inc., Ottawa
Stanley Hartt Counsel, Norton Rose LLP
Calvin Helin International speaker, best-selling author, entrepreneur and lawyer.
Peter John Nicholson Former President, Canadian Council of Academies, Ottawa
Hon. Jim Peterson Former federal cabinet minister, Counsel at Fasken Martineau, Toronto
Maurice B. Tobin the Tobin Foundation, Washington DC
Research Advisory Board
Janet Ajzenstat Professor Emeritus of Politics, McMaster University
Brian Ferguson Professor, Health Care Economics, University of Guelph
Jack Granatstein Historian and former head of the Canadian War Museum
Patrick James Professor, University of Southern California
Rainer Knopff Professor of Politics, University of Calgary
Larry Martin Principal, Dr. Larry Martin and Associates and Partner, Agri-Food Management Excellence, Inc.
Christopher Sands Senior Fellow, Hudson Institute, Washington DC
William Watson Associate Professor of Economics, McGill University

Table of ContentsExecutive Summary ..............................................................................................................................2
Sommaire ..............................................................................................................................................2
Introduction .........................................................................................................................................4
Who Are The 1%? ..................................................................................................................................4
The Limits of Redistribution .................................................................................................................9
A Positive Program for Upward Mobility ............................................................................................14
Conclusion .........................................................................................................................................20
About the Author.................................................................................................................................21
References ...........................................................................................................................................22
Endnotes .............................................................................................................................................26
The author of this document has worked independently and is solely responsible for the views presented here. The opinions are not necessarily those of the Macdonald-Laurier Institute, its directors or supporters.
Copyright © 2017 Macdonald-Laurier Institute. May be reproduced freely for non-profit and educational purposes.

Taxing the 1%? The limits of redistribution and a plan for inclusive growth2
Executive Summary
T he political resonance of income and wealth redistribution seems to have grown in the past several years and shows no signs of abating. High-income earners from British Columbia to Newfoundland and Labrador are increasingly being called upon to pay their “fair share,” despite being subject to a series of tax increases. The so-called “top 1%” seem to loom large in our politics.
At its root, this disproportionate interest in the top 1% of income earners is a broader debate about the tensions between freedom and equality, efficiency and equity, and redistribution and reward. The way we address these fundamental questions reflects the political preferences and compromises in our political system.
The focus on preferences and compromises does not mean no evidence can brought to bear in an-swering these questions, including who comprises the 1%, what the limits are of redistribution, and whether there are alternative ideas to support upward mobility. This study seeks to draw on such evidence to contribute to this ongoing policy debate.
We present the following facts for 2014 (the latest data from Statistics Canada):
• The top 1%’s share of national income has fallen since 2006 and was 10.3 percent in 2014. That this drop has occurred as political rhetoric about concentrated wealth and the need for more redistribution has increased is difficult to understand.
• The top 1% pays 20.5 percent of total federal and provincial (or territorial) income taxes. Over the past 30 years, its share of total income taxes has generally risen.
• Those who make up the top 1% do not remain static year after year. There is considerable fluid-ity in the group: 27.9 percent join or leave the group each year, while every five years there is a full 48.5 percent change. These percentages of churn have been generally constant for the past 20 years.
The study then examines existing research and evidence on the limits of income and wealth redistri-bution not only with regards to work, investment, and entrepreneurialism, but also philanthropy and charitable giving as well as government revenues.
As an alternative, we have set out some policy ideas – including bolstering opportunity in our In-digenous communities, promoting affordable and responsible home ownership, and supporting blue-collar workers – to form the basis of a more positive, pro-mobility agenda for all Canadians. The goal should be to strengthen the conditions of equality-of-opportunity rather than equality-of-result. This vision would focus less on the zero-sum question of “fair share” and more on inclusive growth.

Sean Speer | April 2017 3
Sommaire
L e retentissement politique des questions touchant la redistribution de la richesse et des revenus semble avoir pris de l’ampleur au cours des dernières années, une tendance qui n’est pas en voie de se dissiper. Partout au pays, de la Colombie-Britannique jusqu’à Terre-Neuve-et-Labrador, on demande de plus en plus aux contribuables à revenus élevés, qui pourtant font déjà l’objet d’une série de hausses d’impôts, de verser leur « juste part ». Notre régime politique prête un intérêt très par-ticulier à ce qu’on appelle la tranche supérieure de 1 % des contribuables aux revenus les plus élevés.
Cet intérêt disproportionné à l’égard de la tranche supérieure de 1 % est né du débat beaucoup plus large entourant la difficile conciliation entre liberté et égalité, efficience et équité et système de redis-tribution et de récompense. La façon dont nous traitons de ces questions fondamentales traduit nos préférences politiques et les compromis auxquels nous parvenons au sein de notre système politique.
Or, si nous focalisons tant l’attention sur les préférences et les compromis, ce n’est pas par manque d’éléments convaincants pour répondre à ces questions : qui fait partie du 1 %, quelles sont les lim-ites de la redistribution et y a-t-il d’autres moyens d’encourager l’ascension sociale? La présente étude rassemble des faits pouvant contribuer au débat politique en cours.
Nous présentons les faits suivants pour l’année 2014 (selon les dernières données de Statistique Canada) :
• La part du revenu national attribuable à la tranche supérieure de 1 % diminue depuis 2006 et est passée à 10,3 pour cent en 2014. Que cette diminution soit survenue au moment même où s’est intensifiée la rhétorique politique à l’égard de la concentration de la richesse et du besoin d’un effort accru de redistribution est donc difficile à expliquer.
• Quelque 20,5 pour cent des impôts sur le revenu versés aux gouvernements – au palier fédéral et provincial (ou territorial) – est prélevé sur les revenus de la tranche supérieure de 1 %. Cette proportion est généralement en hausse depuis 30 ans.
• Année après année, la composition de la tranche supérieure de 1 % n’est jamais restée figée. Elle a fluctué de façon considérable : les contribuables qui accèdent à cette tranche de revenus et la quit-tent chaque année représentent 27,9 pour cent de l’effectif, de sorte qu’au cours d’une période de cinq ans le renouvellement est de 48,5 pour cent. Ces entrées et ces sorties se sont produites essentiellement au même taux depuis 20 ans.
Dans cette étude, on se penche sur la recherche existante et les faits prouvant que la redistribution des revenus et de la richesse a des limites non seulement en ce qui concerne l’emploi, l’investisse-ment et l’esprit d’entrepreneuriat, mais aussi sur la philanthropie et les causes caritatives, de même que sur les recettes des gouvernements.
On énonce ici quelques idées de politique à titre de solutions de rechange – notamment la multipli-cation des débouchés dans les collectivités autochtones, le soutien à l’accession à la propriété abor-dable et responsable et l’appui aux ouvriers – pour servir de fondation à un agenda promobilité plus positif pour tous les Canadiens. Le but est d’accroître l’égalité des chances plutôt que l’égalité des résultats. Cette perspective porte moins sur l’objectif à somme nulle que constitue la « juste part » et davantage sur celui de la croissance inclusive.

Taxing the 1%? The limits of redistribution and a plan for inclusive growth4
Introduction
T he so-called “top 1%” – that is, the small share of the population with the highest one per- cent of incomes – have come to assume a disproportionate role in our political discourse. They have appeared in the prime minister’s one-year recap of his government’s accomplish-ments (Prime Minister’s Office 2016), ministerial speeches (Canada 2016b), and, of course, the latest budget (Canada 2017). It seems to be a lot of attention for only 268,505 people – or a population group only slighter larger than Saskatoon.
Their oversized role in our politics is attributable to growing attention to income disparity and the political fecundity of redistribution – and not just at the federal level. Seven of ten Canadian provinc-es have raised personal income taxes on high-income earners since 2010 (Lammam et al. 2016). And the rhetoric in Ottawa and several provincial capitals suggests more may be to come.
Yet, for all the focus placed on the top 1%, there is a little discussion about who these people are, the extent to which there are costs to redistribution, or if there might be alternative policies to support upward mobility and low- and middle-income opportunity. This study seeks to help close this gap.
Its principal observation is simple – considerable evidence shows that an overreliance on redistribu-tion imposes substantial costs on the economy and Canadian society. Punishing high-income earn-ers can ultimately be self-defeating. Policy-makers should instead reach for a positive, pro-mobility agenda. Costs associated with new initiatives and measures can be offset by eliminating or reform-ing regressive and unproductive corporate subsidies, redundant program spending, and outdated government operations. The result would be a fairer and more efficient policy agenda for inclusive growth and opportunity.
The first section of the paper draws on Statistics Canada data to outline the characteristics and traits of Canada’s top 1%. The second describes the limits of income and wealth redistribution not only on work, investment, and entrepreneurialism, but also on philanthropy and charitable giving, as well as government revenues. The final section sets out a positive program to foster the conditions that will lead to upward mobility for all citizens.
Who Are The 1%?
T he top 1% is often described by politicians and pundits in the abstract. The people in this group are faceless and nameless, rarely being seen as employers, philanthropists, or commu- nity leaders. This inattention to who they are, where they live, what they do, and their place in Canadian society, is regrettable. It undoubtedly contributes to a disconnect with the rest of the population and risks breeding an “us versus them” mentality.
Fortunately, data and evidence about the top 1% are accessible. Statistics Canada releases an annual dataset that covers the characteristics and traits of this subset of the population. The most recent data are for 2014. The truth is, we know a lot about these people.
The top 1% comprises 268,505 citizens who each earned at least $227,100 per year in total income.1 This threshold is lower than in the United States where in 2014 the top 1% had a minimum income of $465,626 (Greenberg 2017). In Canada, nearly 80 percent of the top 1% are men, 81.5 percent are married, and the average age is 52 (see table 1). (This compares to all tax filers, where 48.2 percent are males, 56.8 percent are married, and the average age is 48.)

Sean Speer | April 2017 5
TABLE 1: Demographics of the top 1%, 2014
TOTAL MEN WOMEN
Gender - 78.3% 21.7%
Married or Common Law
81.5% 85.5% 67.7%
Age 52 - -
Source: Statistics Canada 2016c.
At 39.9 percent of tax filers in 2014, Ontario is home to the largest share of Canada’s top 1%, though its share has steadily fallen since 2010. Ontario and Alberta combined account for 65.5 percent of Canada’s top 1%, which is above those provinces’ share of the country’s total tax filers at 49.1 per-cent, and overall population at 50.1 percent (see figure 1).
FIGURE 1: Percentage of the top 1% by province and territory, 2010-2014
Source: Statistics Canada 2016c.
The amount of income the top 1% earned, the proportion of their income that came from employ-ment, and of course the taxes they paid, differed from province to province. Those living in Ontario had the highest total income, earning $487,100 on average in 2014. Those in Alberta had the next highest income, at $474,200 in 2014. The top 1% in Newfoundland and Labrador had the lowest total annual income among the provinces at $367,500 on average.
Overall, the median income for the top 1% in Canada was $313,200 in 2014 and the average income was $466,700. Their average income grew by 0.4 percent between 2009 and 2014, whereas average
BIL
LIO
N
-40
-30
-20
-10
0
10
20
30
2014 2015 2016
Federal government
Provinces
390
400
0%
10%
20%
30%
40%
50%
2010 20122011 2013 2014
ABSKMBONQCNBNSPENL BC YT

Taxing the 1%? The limits of redistribution and a plan for inclusive growth6
total income growth for all tax filers in that period grew by 4.2 percent. The top 1% was responsible for 10.3 percent of national income in 2014, a figure that has fallen since 2006 (see figure 2).
FIGURE 2: Top 1%’s share of national income, 2000-2014
Source: Statistics Canada 2016c.
It is noteworthy that the top 1%’s share of national income has fallen to its lowest levels in years, even as the political rhetoric has grown. It is difficult to explain this disconnect. It is notable that the top 1%’s share of national income fell sharply in the 2008 recession, which is evidence that the rich are not immune to economic downturns.
The share of the top 1%’s income from wages and salaries was 64.4 percent in 2014. The rest came from capital gains and other non-wage sources, such as real estate or equities. The wages and sala-ries component of the top 1%’s income is the highest in Newfoundland and Labrador (74.2 percent) and the lowest in Quebec (52.2 percent). Amongst all tax filers, wages and salaries account for 67.7 percent of income.
The tax bill of the top 1% also differs across the provinces and territories. Those living in Ontario paid an effective tax rate of 36.7 percent and an average of $179,000 in income taxes in 2014, while those in the top 1% in Newfoundland and Labrador paid an average of $116,700. The share of total income taxes paid by the top 1% ranges from 28.3 percent in Alberta to 7.9 percent in New Brunswick.
Overall, on average, the amount of taxes the top 1% paid (federal and provincial or territorial income taxes) across the country was $159,500 in 2014. This means that the top 1% of income earners paid 20.5 percent of the total share of federal and provincial or territorial income taxes. Over the past 30 years, the top 1%’s share of total income taxes has risen consistently (see figure 3), apart from a slight drop in recent years due to a decline in income, as observed in figure 2.
390
400
0%
10%
20%
30%
40%
50%
2010 20122011 2013 2014
ABSKMBONQCNBNSPENL BC YT
2000 2001 2002 2003 2004 2005 2006 2007 2008 2009 2010 2011 2012 2013 2014
10.710.6 10.6
10.3 10.3 10.3
11.1
10.8 10.8
11.1
11.5
12.112
11.5
11.2

Sean Speer | April 2017 7
FIGURE 3: Share of federal and provincial or territorial income taxes paid by the top 1%, 1984-2014
Source: Statistics Canada 2016c.
The shift to greater progressivity in the federal and provincial/territorial income system is not limited to the top 1% of Canadian earners. The top 10% (2.7 million tax filers) paid 54 percent of total in-come taxes in 2014, which was up from 49 percent in 1984. The bottom 50% (13.4 million tax filers) saw their share of income taxes paid fall from 5.0 percent to 4.3 percent over this same 30-year period (Speer and Crowely 2016).
One of the most interesting insights from these data is the extent to which the 1% is a fluid subset of the population. It is not a static, unchanging group, but rather a dynamic one that sees people join and leave regularly. Of those who were among the top 1% of earners in the previous year, 72.1 percent of them remained in the group in the current year. After five years, only 51.5 percent of them remained in the top 1%. This means that each year, roughly a quarter of those in the top 1% change – and nearly half of them do so every five years. These percentages have been generally constant for the past 20 years (see figure 4).
FIGURE 4: Percentage of the top 1% in the same quantile in last year and last five years, 1994-2014
Source: Statistics Canada 2016c.
0
5
10
15
20
25
84 85 86 87 88 89 90 91 92 93 94 95 96 97 98 99 00 01 02 03 04 05 06 07 08 09 10 11 12 13 14
0
20
40
60
80
1994 1995 1996 1997 1998 1999 2000 2001 2002 2003 2004 2005 2006 2007 2008 2009 2010 2011 2012 2013 2014
Percentage in the same quantile last year Percentage in the same quantile five years ago
0
5
10
15
20
25
84 85 86 87 88 89 90 91 92 93 94 95 96 97 98 99 00 01 02 03 04 05 06 07 08 09 10 11 12 13 14
0
20
40
60
80
1994 1995 1996 1997 1998 1999 2000 2001 2002 2003 2004 2005 2006 2007 2008 2009 2010 2011 2012 2013 2014
Percentage in the same quantile last year Percentage in the same quantile five years ago

Taxing the 1%? The limits of redistribution and a plan for inclusive growth8
This finding is consistent with other longitudinal analyses of social mobility across different income groups in Canada. A 2012 study, which used Statistics Canada data to track a sample of a million Ca-nadians to see how their income changed over a 20-year period, found clear evidence of social mo-bility over the lifecycle (Lammam, Karabegovic, and Veldhuis 2012). Between 1990 and 2009, nearly nine of ten of those in the bottom income group had moved to a higher group. This upward shift was matched by a 36 percent downward move from those in the highest income group to a lower one over the same timeframe.
The US record on social mobility may not be as strong as in Canada, but that country also had regular churn amongst top 1% of income earners. A 2015 study examined fluidity in and out of the top 1% in the US over a roughly 40-year period between 1968 and 2011 (Hirschi and Rank 2015). Its analy-sis showed that 11 percent of the population was part of the 1% for one or more years between the ages of 25 and 60 (see figure 5). The main conclusion is that “many experience short-term and/or intermittent mobility into top-level income, versus a smaller set that persist within top-level income over many consecutive years.”
FIGURE 5: Years in the top 1% of income earners in the united states, 1968-2011
Source: Hirschi and Rank 2015.
These data about the state of Canada’s top 1% of income earners, their share of overall income, their tax bill, and the extent to which it is not a caste system, but rather subject to fluidity and churn present a different picture than is often painted by politicians. A better understanding of these basic details provides a fuller context in which to consider government policies and how they con-tribute to or detract from income growth and enable the conditions for greater dynamism among our income groups.
0
20
40
60
80
1994 1995 1996 1997 1998 1999 2000 2001 2002 2003 2004 2005 2006 2007 2008 2009 2010 2011 2012 2013 2014
Percentage in the same quantile last year Percentage in the same quantile five years ago
0
2
4
6
8
10
12
1 or more years
2 or more years
3 or more years
4 or more years
5 or more years
10 or more years
10 or more consecutive
years

Sean Speer | April 2017 9
The Limits of Redistribution
T he modern state is primarily a vehicle for wealth redistribution, particularly at the federal level where the government does not provide basic services. Many of our political debates are about the balance between freedom and equality, and what role the welfare state is to take in delivering on the resulting goals and priorities. That is to say, choices about the level of redistribu-tion and the means by which it is achieved are primarily a reflection of political preferences and the compromises reached in our political system. But that does not mean that no evidence can brought to bear on these questions. There are, of course, limits to redistribution. There are, after all, reasons that not all wealth is centrally managed and apportioned.
The key, then, is to help inform the political debate by highlighting the economic and social costs of redistribution and the inherent trade-offs that policy-makers must consider. We are led to believe that we can “ask” the 1% to pay higher taxes with no consequences. This is false.
Economic costs and revenue gapsThe economic costs of high levels of taxation are well established not only in a considerable body of literature, but increasingly in practice. It is notable, for instance, that jurisdictions such as New Brunswick and France have recently reversed tax increases on high-income earners because it failed to produce significant revenue and was seen to be discouraging key economic activity (Curry 2016; Penketh 2014).
We should not be surprised. The behavioural response in these two jurisdictions is consistent with economic research on the costs and distortions imposed by personal income taxes in general, and high marginal tax rates on high-income earners in particular (OECD 2010).
A 2013 literature review highlights a general consensus on the economic costs of high marginal tax rates, including for high-income earners (Murphy, Clemens, and Veldhuis 2013). The study shows that while there is some debate among economists about the extent to which high marginal tax rates influence individual decisions and in turn impose costs, there is no real dispute over the basic prem-ise. The consensus is sufficiently broad to include long-time Republican economic adviser Martin Feldstein and former Obama administration adviser Christina Romer (Feldstein 1995; Romer and Romer 2012).
The economic costs manifest themselves in different ways, including with regards to work, invest-ment, and entrepreneurship. Those costs have to do with marginal incentives. Think of your own life. Would you pick up another work shift if any additional income was taxed at 20 percent? Almost cer-tainly. But what about 53 percent, as is the case in Ontario? Or 75 percent, as it was briefly in France? That people respond to high marginal tax rates is not only well-rooted in the theory and evidence, it is also intuitive from our own experiences.
A 2010 study by the Department of Finance sought to understand Canadians’ responsiveness to tax rate changes (Department of Finance 2010). The department’s findings are rife with technical jargon, but they do explain the issue well.
The degree to which people respond to changes to marginal tax rates is often called the “elasticity of taxable income.” Elasticity generally describes the sensitivity of one economic variable to changes in another. Here it relates to the behavioural response to marginal tax rate changes. The behavioural response can range from doing less work, making fewer investments, or undertaking less entrepre-neurial activity, to making greater efforts to reduce one’s tax burden by shifting to non-taxable or less-taxed forms of compensation.
Taxing the 1%? The limits of redistribution and a plan for inclusive growth10
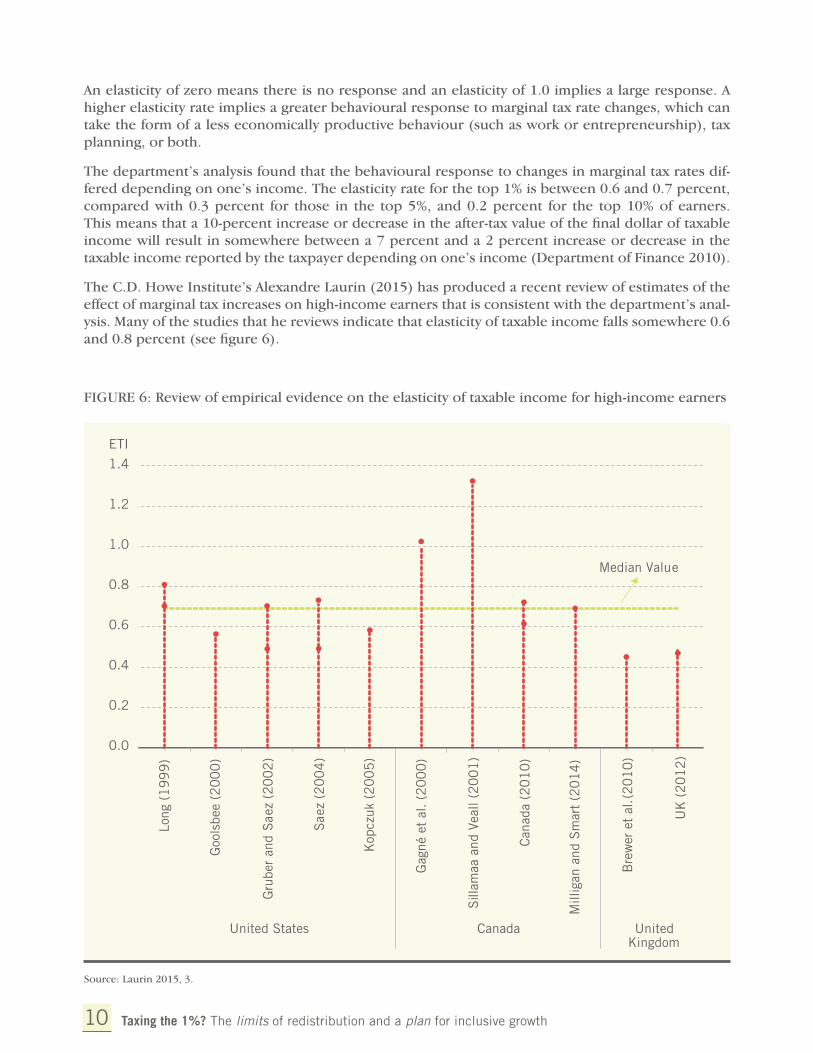
An elasticity of zero means there is no response and an elasticity of 1.0 implies a large response. A higher elasticity rate implies a greater behavioural response to marginal tax rate changes, which can take the form of a less economically productive behaviour (such as work or entrepreneurship), tax planning, or both.
The department’s analysis found that the behavioural response to changes in marginal tax rates dif-fered depending on one’s income. The elasticity rate for the top 1% is between 0.6 and 0.7 percent, compared with 0.3 percent for those in the top 5%, and 0.2 percent for the top 10% of earners. This means that a 10-percent increase or decrease in the after-tax value of the final dollar of taxable income will result in somewhere between a 7 percent and a 2 percent increase or decrease in the taxable income reported by the taxpayer depending on one’s income (Department of Finance 2010).
The C.D. Howe Institute’s Alexandre Laurin (2015) has produced a recent review of estimates of the effect of marginal tax increases on high-income earners that is consistent with the department’s anal-ysis. Many of the studies that he reviews indicate that elasticity of taxable income falls somewhere 0.6 and 0.8 percent (see figure 6).
FIGURE 6: Review of empirical evidence on the elasticity of taxable income for high-income earners
Source: Laurin 2015, 3.
Sources: UK (2012), pp. 18-19, Canada (2010) p. 49, various other sources.
0.0
0.2
0.4
0.6
0.8
1.0
1.2
1.4
ETI
Median Value
United States Canada United Kingdom
Long
(1
99
9)
Goo
lsbe
e (2
00
0)
Gru
ber
and
Sae
z (2
00
2)
Sae
z (2
00
4)
Kop
czuk
(2
00
5)
Gag
né e
t al
. (2
00
0)
Sill
amaa
and
Vea
ll (2
00
1)
Can
ada
(20
10
)
Mill
igan
and
Sm
art
(20
14
)
Bre
wer
et
al. (
20
10
)
UK
(2
01
2)
Lorem ipsum
Sean Speer | April 2017 11
It is important to recognize that the question of elasticity of taxable income is the subject of rigorous debate and that there remains variation in the estimates. University of British Columbia economist Kevin Milligan (2015b) also points out that context matters. Elasticity rates can depend on several factors including which level of government is involved, overall tax rates and the tax policy mix, and the enforcement of tax avoidance measures (ibid.).
The current government’s new marginal tax rate of 33 percent for those earning $200,000 will be an interesting case study. Recall that during the 2015 election campaign the Liberal Party had estimated the new tax rate would generate $2.8 billion per year (Liberal Party 2015). Yet, once in government, this projection was revised downwards to $2 billion based presumably on the advice of federal of-ficials (Department of Finance 2015). The principal difference is that the Department of Finance is using an elasticity rate of 0.4 percent, which is higher than the one the Liberal Party used in its elec-tion platform, though of course lower than the elasticity rate found in much of the research (Curry and Leblanc 2015).
It is too early to assess how individuals will respond to the marginal tax rate increase and whether the government’s revenue projections will come to fruition. Laurin (2015) is sceptical and has contended that it may ultimately generate less than $1 billion per year. Milligan (2015a) is more optimistic and assumes that the government will follow through with anti-tax avoidance measures. But the disagree-ment is a matter of degree rather than of principle.
The point is that all taxes impose economic costs and a key part of tax policy is about generating suffi-cient revenue to fund government spending while minimizing costs and distortions (Clemens 2008). Raising taxes on the top 1% is no different – in fact, one can argue that it is a powerful example of this tax policy principle in practice. It not only can carry considerable costs in terms of key economic be-haviours and outcomes, but it also may not generate as much government revenue as its proponents anticipate. A key consideration for Canadian policy-makers and the general public is the magnitude of costs that we are prepared to accept to achieve progressivity and redistributionist goals.
Economists describe this question as the efficiency and equity trade-off, by which they are referring to the competing economic and non-economic objectives that underpin tax policy. Some politicians and Canadians may be prepared to forgo higher economic activity to meet equity and fairness goals. But it is essential that they make these judgments with clear evidence and that they are honest about the implicit trade-offs that are being made. As a commentary by The Economist (2011) put it: “Higher rates on the rich are… not a free lunch.” Our politicians would be wise not to forget it.
Possible effects on philanthropy and charitable giving The effects of high marginal tax rates on high-income earners are not limited to the economic sphere either. They can also have impact on philanthropy and charitable giving.
The economic research on the relationship between high marginal tax rates and philanthropy is less clear than the literature on the effects of high taxation on work, investment, and entrepreneurship as well as tax planning. Part of the explanation is that the field is less studied. Another factor is the com-plex interaction between marginal tax rates and tax preferences for charitable giving and the possible effects on individual behaviour.
It is useful to briefly discuss the state of philanthropy and charitable giving in Canada and the role of the top 1% of earners in that sphere before reviewing the evidence on the effects of high mar-ginal tax rates.

Taxing the 1%? The limits of redistribution and a plan for inclusive growth12
The total value of charitable donations claimed by Canadian tax filers reached $8.8 billion in 2014.2 This amount came from the reported donations of just 21.3 percent of Canada’s tax filers, though the percentage of donors fluctuated among provinces and territories. The province with the highest pro-portion of donors was Manitoba (24.8 percent). The province with the lowest proportion of donors was News Brunswick (19.8 percent) (see figure 7).
FIGURE 7: Percentage of tax filers donating to charities by province, 2014
Source: Lammam, MacIntyre, and Ren 2016, 4.
Canadians from all income groups give to charities, but high-income earners are disproportionately responsible for the bulk of annual giving. Those with incomes above $80,000 represent roughly 30 percent of total donors and nearly 60 percent of the total dollar value of donations (Statistics Canada 2016a). Past Statistics Canada research finds that those with annual household incomes of $120,000 or more donate twice as much as those with household incomes between $80,000 and $100,000, and even more relative to those who earn less (Turcotte 2012).
This is not unique to Canada. A body of scholarly research shows that the proportion of income given as philanthropic contributions tends to rise with income (Auten, Clotfelter, and Schmalbeck 2000, 403). And it holds that the highest-income earners – namely, the top 1% – are responsible for a con-siderable share of overall charitable giving. Some examples from the research include:
• Havens and Schervish (2000) showed that households in the top 4% of the income distribution in the United States provided over 40 percent of the total charitable contributions in 1995. They also reported that the households in the highest 1% of the income distribution (annual income above $250,000 in 1994) provided 33 percent of the total charitable dollars in 1995.
• Auten, Clotfelter, and Schmalbeck (2000) noted that in the US, the wealthiest 1.4% of decedents were responsible for 86 percent of charitable giving from bequests.
Sources: UK (2012), pp. 18-19, Canada (2010) p. 49, various other sources.Lorem ipsum
0
5
10
15
20
25
30
Canada BC AB SK MB ON QC NB NS PEI NFLD YK NWT NU

Sean Speer | April 2017 13
• A 2007 study conducted by the Center for Philanthropy (2007) at Indiana University found that the wealthiest 2.3% of givers gave 56.5 percent of total donations.
• A 2015 study by the Philanthropy Roundtable (n.d.) found that the top 1% was responsible for one-third of all charitable dollars donated in the United States.
What effect do increases to marginal tax rates on the 1% have on charitable giving? It is an important question. If it leads to lower charitable giving, one can argue that society is not necessarily better off because there has merely been a substitution between civil society and the state.
In Canada, the question is complicated by the interaction between one’s marginal tax rate and one’s eligibility for the Charitable Donation Tax Credit, which reduces a tax filer’s tax liability. The federal tax credit is worth 15 percent on a tax filer’s first $200 in charitable donations and now as much as 33 percent for donations thereafter to reflect the federal government’s new high-income tax rate (Golombek 2015b). This means that individuals can significantly reduce their tax liability by claiming the tax credit as well as provincial tax credits and that the magnitude of tax avoidance increases as marginal tax rates go up (see table 2).
TABLE 2: Example of tax benefit from federal charitable donation tax credit, 2016
2016 INCOME DONATION TAX BENEFIT
$215,000 $20,000 $30 on first $200 (15% x $200)
$4,950 on $15,000 (33% x $15,000)
$1,392 on $,4800 (29% on $4,800)
Total – $6,372
Thus higher marginal income tax rates increase the marginal benefit of the tax credit to shield income and may in turn actually contribute to higher levels of charitable giving particularly for high-income individuals. There is certainly evidence – including recent analysis by the federal Department of Fi-nance (2016) – that charitable giving is responsive to changes in government incentives. It is fair to say that most econometric analysis would point in this direction (List 2011).
It stands to reason, therefore, that a higher marginal benefit represented by higher marginal tax rates may spur more charitable giving. To the extent that this perspective is accurate, it would suggest that there is not a trade-off between higher taxes and charitable giving in the same way that policy-makers must confront trade-offs related to the economic costs of high marginal tax rates.
Yet this question is complicated by the multitude of factors that influence charitable giving. Notably, according to research from Statistics Canada, most people cite “compassion for those in need” and “personally believe in a cause” as the principal reasons behind charitable giving (Golombek 2015a). It is also noteworthy that 69 percent of people report that limited resources are the primary expla-nation for not giving more (Rivait 2015). These responses suggest that the marginal value of tax in-centives and their effect on the after-tax price of donations may not have as significant an impact on charitable giving as some of the research implies.
Another perspective is that after-tax income is a greater determinant of charitable donations than marginal tax rates. This interpretation does not preclude tax incentives but contends that charitable

Taxing the 1%? The limits of redistribution and a plan for inclusive growth14
giving is more responsive to disposable income. The basic premise is that the greater an individual’s income or wealth, the more likely he or she is to give to charity. To the extent that this perspective is accurate, it would follow that higher tax rates and thus lower after-tax income would result in less giv-ing. Policy-makers would therefore face a similar trade-off between equity and fairness goals achieved through taxation and the possible effects on philanthropy.
The US experience of the 1980s would seem to corroborate this point of view. Top marginal tax rates were lowered from 70 percent to 33 percent and charitable donations increased by a total of 27.8 per-cent between 1982 and 1989 (Francis and Clemens 1999). This experience suggests that the opposite is also likely to be true: tax increases that result in less after-tax income may lower charitable giving.
This assessment is consistent with recent research from the American Legislative Exchange Coun-cil that examined the relationship between taxation and charitable giving. The report found that a 1-percent increase in the personal income tax burden is associated with a 0.35 percent decrease in charitable giving per dollar of state income (Freeland, Wilterdink, and Jonathan Williams 2015). The authors found that tax reductions of the same magnitude could produce a proportionate increase in charitable donations.
This analysis is not definitive. More econometric work needs to be done to test these findings more rigorously and for Canada specifically. But it is notable that charitable giving in Canada – both the percentage of tax filers donating to charities and the share of aggregate income donated to charities – hit a 10-year low in 2014 (the most recent year of available data) (Lammam and MacIntyre 2016). It has, in fact, fallen consistently since 2010 when tax rates began to rise. This observation is far from causation, however. More analysis needs to be done.
But to the extent that it shows that charitable giving is related to both the tax burden and an individu-al’s ability to pay, it would suggest that hiking taxes may discourage charitable giving. And given that the top 1% of earners are disproportionately responsible for charitable giving, the consequence could be significant. Future MLI research will investigate this question more directly to better understand the possible effects of raising income taxes on the top 1% on philanthropy and charitable giving.
A Positive Program for Upward Mobility
T he upshot is that a marginal tax increase on the top 1% could not only impose economic and social costs but also generate less government revenue. Targeting tax increases on the top 1% of earners is thus more of a political pose than an evidence-based policy position. It is ul-timately self-defeating. There must be a better way to enable social mobility in general and low- and middle-income growth in particular. As we said in a recent Macdonald-Laurier Institute commentary:
A policy agenda to achieve this objective [low- and middle-income wage growth] ought to focus on encouraging more opportunity and social mobility and greater overall wealth rather than equalizing outcomes through more redistribution. That is, the goal should be to help low- and middle-income earners climb the socio-economic ladder instead of bringing high-income Canadians down a few pegs. (Crowley and Speer 2015)
A positive vision for inclusive growth, which draws on a range of government policies related to work and family, education, and savings and investment, can be a constructive alternative to more and more redistribution. Such a vision would seek a dynamic solution to concerns about unequal eco-nomic outcomes and should receive broad-based support across the political spectrum.

Sean Speer | April 2017 15
It is worth noting that the economic performance of Canada’s middle class has generally been posi-tive in the past decade. Not only have middle-class earners experienced absolute increases in income; they have also seen relative increases. Median per capita income and median total household income have steadily increased since about 2005 and now are higher than those in the United States (Speer 2017). The New York Times has thus called Canada’s middle class the richest in the world (Leonhardt and Quealy 2014).
But that does not mean there is no room for improvement or that Canada is a global leader based on all indicators associated with opportunity and mobility. We still have progress to make particularly among those groups who have not tended to benefit from Canada’s economic dynamism, such as Indigenous peoples, disabled Canadians, and single-parent families.
A pro-mobility agenda would emphasize enabling the conditions for universal opportunity rather than collective results. It would focus less on the zero-sum and divisive question of “fair share” and instead more on inclusive growth. Supporting higher levels of intergenerational mobility is one area where further attention is needed.
Intergenerational mobility is measured by the correlation between a father’s income and his son’s. A high correlation means a close link in intergenerational incomes. A low correlation means that a fa-ther’s income has limited influence on his son’s. A higher correlation means that a son is more likely to follow his father’s financial footsteps.
New Statistics Canada research shows that Canada’s intergenerational mobility ratio is 0.32 (Chen and Ostrovsky 2016). This is higher than previously assumed, but still lower than in the United States where the ratio is as high as 0.50 (Watson 2016). Several countries – including Denmark, Norway, Finland, Australia, Sweden, and Germany – perform better according to this recent analysis (Jerrim, Choi and Rodriquez 2013).
There is certainly room for improvement, especially for low- and middle-income families. University of Ottawa economist Miles Corak has shown that earnings mobility is closely tied to family income for those in top income groups, but less so for low- and middle-income groups (Corak 2016).3 He attri-butes this divergence at least in part to what US commentator J.D. Vance has described as the “social capital” – including personal networks and connections – that is available to those in high-income groups (Vance 2016).
Public policy will never be able to serve as a substitute for these pre-existing advantages, but poli-cy-makers can take some positive steps to improve the conditions for intergenerational mobility.
Corak’s 2013 paper for Canada 2020 on the components of an equality-of-opportunity agenda is one of the more accessible and practical on the subject (Corak 2013). It also provides a set of policy recommendations that could secure broad-based political support, including low-income grants for post-secondary education, improvements to foreign credential recognition, fewer temporary foreign workers, an expanded Working Income Tax Benefit, more flexible maternity and parental leave, and more generous child-care benefits. Many of these ideas are already part of a political consensus in Ottawa.
There is no doubt that other levels of government should also work to improve inclusiveness and op-portunity. But this study will add three ideas or reforms for Ottawa to adopt as part of a larger effort to exercise national leadership in this area. The goal is to contribute to the Trudeau government’s vision of inclusive growth by setting out concrete recommendations to enable greater conditions for upward mobility for all Canadians.
Taxing the 1%? The limits of redistribution and a plan for inclusive growth16
Indigenous education and social services Few population groups are less immune to the intergenerational transmission of poverty than In-digenous people living on reserves. The conditions that enable poverty are durably present in these communities. Statistics Canada (2015) data show that those on-reserve face housing issues such as overcrowding, high levels of family breakdown, low relative levels of education, and so on.
Changing these conditions and their accompanying outcomes should be a priority for Ottawa. It is both a rightful area of federal jurisdiction and a pressing issue – what a former Globe and Mail col-umnist has called a “stain on the country” – that must be forcefully addressed (Simpson 2015).
The government has signaled its commitment to improving the conditions for Indigenous peoples and made initial steps in this direction. But there are so many challenges that it is important to focus in the short-term on the areas where the most attention is needed.
A top priority must be to work with Indigenous communities to improve service standards related to water quality, fire protection, housing, education, and health care. The woeful condition of basic in-frastructure and services in many communities is a major barrier to economic and social opportunity.
The federal government has effectively doubled general infrastructure spending over the next decade but it remains unclear what share will be earmarked for on-reserve projects (Canada 2016a). A sig-nificant percentage should be dedicated to investments in these communities. It is difficult to justify funding “green infrastructure” or “social infrastructure” in non-Indigenous communities when there are 80 First Nation communities with drinking water advisories (Health Canada, n.d.). Scarce public resources should be targeted where the need is highest.
There may be opportunities to use the public-private partnership model for project management and operation of infrastructure projects on reserve (Quesnel and Green 2017). This would enable the government to draw on private sector expertise particularly in rural and remote communities, and address some of the past problems with project management and post-completion operations.
Ottawa must also place greater emphasis on pre- and post-natal services and care for Indigenous fam-ilies and their children. Evidence shows that early development is critical for a student’s long-term success. By the time a student reaches intermediate or high school age, it is frankly too late for this level of intervention (Coates 2015). The reality is that young First Nations students often come from traumatic home environments without adequate nutrition, sleep, or personal support.
Dealing with the causes that contribute to the risks so many Indigenous children face – poverty, poor housing, poor diet, domestic turmoil and the like – will be extremely difficult. There is a large in-ter-generational cost, however, of not improving the conditions for present-day youth. Such an agen-da likely involves day care arrangements, community nutrition programs, pre-and post-natal care for expectant mothers and babies, and various other interventions that are ideally managed, designed, and delivered by the community. Failure to look after children before they go to school reduces ed-ucational outcomes and undermines individual prospects and opportunities.
But fundamentally it is about strengthening Indigenous families and communities. This focus has a range of public policy implications including direct payments for child-care, better education and support for new parents with respect to nutrition and health, and effective programming related to substance abuse and other social pathologies. Income support programs must be carefully designed to ensure that they do not inadvertently reward family breakdown by pricing fathers out of the mar-riage market.
There is also, of course, a great need to improve educational standards on reserve. The previous gov-ernment’s First Nations Control of First Nations Education Act represented a good-faith attempt to
Sean Speer | April 2017 17
address both curriculum and funding gaps in on-reserve education (Indigenous and Northern Affairs Canada 2015). It is highly unlikely that the bill will return in its previous form, but there is an oppor-tunity to proceed with a version of the law on a regional or opt-in basis, which would help improve education and skills among Indigenous youth.
Affordable and responsible home ownership Pro-home ownership policies have fallen out of favour since the 2008-09 financial crisis. There is a perception that government policies to induce higher levels of home ownership were largely respon-sible for the US banking challenges and thus the whole experience is an indictment of such policies. The conclusion is that government should be neutral on encouraging or promoting homeownership.
There is no question that the 2008-09 experience is a lesson about the pitfalls of poorly-conceived government policy. But it does not follow that government should be neutral on home ownership. It simply means that government policy to support home ownership should be designed to minimize possible negative effects. There is an important distinction between smart pro-home ownership poli-cies and dumb ones. We should adopt smart policies and avoid dumb ones. But that does not change the fact that there are good reasons for public policy to support home ownership.
Why should government policy support homeownership? Notwithstanding post-financial crisis neg-ativity, home ownership remains a powerful conveyor belt to the middle class. Home ownership is associated with a raft of economic and social benefits including better educational and health out-comes, stronger families, safer communities, higher levels of civic participation, and greater wealth accumulation (Crowley and Speer 2016). There are few policy areas more likely to generate upward mobility and economic opportunity than housing and home ownership.
Yet unaffordable prices in key markets are an obstacle for millions of Canadians. What is driving these price spikes?
Housing prices are a function of supply and demand and government policies affect both parts of the market equation. Demand-side policies include government-backed mortgage insurance, financial subsidies for first-time home buyers, and the regulatory framework for home sales and mortgage borrowing. Supply-side policies primarily involve land-use regulations and building and construction codes that determine the quantity of land, the extent to which land can be used for residential homes, and construction costs. So much of the housing policy debate focuses on de-mand-side issues and neglects supply-side considerations. This is a clear case of policy-makers fail-ing to look in the mirror and the extent to which government actions and policies are contributing to the problem.
Restrictive land-use regulations or building codes that limit supply can lead to higher housing pric-es. This is a fine outcome for those who already own their home, but it does not help those who are precluded from entering the housing market. This tension is increasingly causing problems in major urban centres such as Toronto and Vancouver.
Urban containment policies and strategies have limited low-rise housing supply for the past several years. The result has been to drive up the price of these housing types in both markets. It may not be the explicit goal of policy-makers, but the consequence of these policies is to effectively pit present home owners against aspiring home owners. At its core, the question is one of inequality and oppor-tunity as much as housing.
As President Obama’s former chair to the Council of Economic Advisers has explained: “While land use regulations sometimes serve reasonable and legitimate purposes, they can also give extranormal returns to entrenched interests at the expense of everyone else” (Furman 2016).

Taxing the 1%? The limits of redistribution and a plan for inclusive growth18
That Toronto’s single-family detached home construction was at a 10-year low in February 2017 may benefit entrenched interests, including existing home owners, but it is at the expense of those who do not presently own and cannot afford to do so as a result of government-induced supply limita-tions (CMHC 2017). And there is increasing evidence that unaffordability is not just at the expense of those who cannot afford to own in high-cost localities such as Toronto and Vancouver. Unaffordable housing prices in our most dynamic, job-creating cities can start to have broader economic costs in the form of opportunity costs for the national economy. The labour market in these cities is shouting at the top of its lungs for workers. But housing policy is causing those cries to go unanswered.
Policy-makers rarely discuss many of the trade-offs between opening up the market to greater hous-ing supply and other objectives – ranging from the environment to other quality-of-life consider-ations . The result is that policies are made without a clear sense or justification of these trade-offs, especially to the extent that they affect low- and middle-income citizens.
The federal government has a limited role to play in urban policy such as land-use regulations. But Ottawa does transfer considerable sums to the provinces and municipalities for infrastructure and social housing. It stands to reason that these funds should come attached with conditions that those governments assess the benefits and costs of land-use rules and building and construction regulations with a particular focus on their impact on low- and middle-income citizens attempting to enter the housing market and pursue job opportunities. Increasing funding for affordable hous-ing while provinces and cities are contributing to unaffordable housing prices risks throwing good money after bad.
It seems counterproductive to lament the oversized economic and political influence of the top 1% and then insist upon land-use policies that buttress their real-estate values at the expense of others. Policy-makers must collect more information about the effects of current policies on housing prices. Only then can we have a more informed debate about what trade-offs we are prepared to make to enable the conditions for equality-of-opportunity.
Support for blue-collar workersThe US election has shone a political light on the plight of low-skilled workers and threat of eco-nomic dislocation caused by trade, innovation, and general disruption. There is a new interest in understanding the role of public policy in supporting this cohort of the population – particularly men without post-secondary education.
The circumstances in Canada and the US are not precisely the same. US workers have generally ex-perienced less income growth than their Canadian counterparts and the rise of populist politics has been more pronounced in the US. But that does not mean that policy-makers in Canada ought to dismiss concerns about job insecurity and the effects on workers, families, and communities.
The truth is that underneath this country’s strong relative performance on median wage growth and social mobility are some concerning figures, particularly for blue-collar male workers. Research by leading Canadian economists Nicole Fortin and Thomas Lemiuex (2015) finds that median earnings among males have stagnated or even fallen in parts of the country. Labour force participation among men with basic education or skill levels is essentially flat (Crowley 2017). New analysis about the prospect of automation has people worried about the employment prospects of this cohort (The Canadian Press 2017).
The potential for large-scale dislocation for these workers has contributed to rising levels of econom-ic anxiety. Perceptions about one’s place in the middle class and the economic future have become increasingly negative (Employment and Social Development Canada n.d.). The US presidential elec-tion illustrates the political manifestation of these sentiments in practice.
Sean Speer | April 2017 19
Policy-makers must respond carefully to these growing public feelings. Dismissiveness is not only un-democratic and inegalitarian, it risks breeding political polarization and divisiveness. But an overre-action in the form of protectionism and corporate welfarism risks eroding the broad-based benefits of innovation and higher productivity. There must be a balance in determining how best to realize the benefits of dynamic capitalism while supporting those affected by the process of creative destruction.
We cannot flinch in face of dislocation and disruption. Dynamic capitalism has produced tremendous wealth and it would be a mistake to try to halt its dynamic churn in order to freeze the status quo. A “robot tax,” or other barriers to innovation and productivity enhancements, risk making us all poorer (Kessler 2017).
It can be difficult to resist these temptations, however, because our collective imagination precludes us from foreseeing the new jobs, industries, and opportunities that creative destruction will produce in the future. It is the equivalent of asking an agricultural worker from the late nineteenth centu-ry about the advent of the Internet. We must therefore not succumb to a present-ist fallacy in our policy-making.
But we must also ensure that dislocated workers – particularly blue-collar ones – are not dismissed or neglected. Pensioning them off with a guaranteed annual income is not the solution either. It fails to recognize that work is integral to one’s self-esteem and dignity. A regular government paycheque cannot provide these intangibles.
Policy-makers should adopt both positive and negative steps that will create the conditions for work and opportunity in an era of economic dislocation and unequal skills distribution.
Positive actions include improving education and retraining programming to help those affected de-velop new skills, supporting labour mobility so people can move to places with higher job prospects, increasing the Working Income Tax Benefit so low-income workers can accept employment, and experimenting with wage subsidies for low-skilled workers. Government can proactively undertake these positive actions to help blue-collar workers participate in the labour force.
Negative actions include reducing the barriers to blue-collar work, namely, reducing the tax and reg-ulatory obstacles to resource development. Natural resource development employs many blue-collar workers whose jobs cannot be sent offshore. It is thus counterintuitive to lament the decline in job prospects for these workers, and then put up further barriers to these industries. Roads, pipelines, mines, and processing plants face too many obstacles and take too long to approve. The result is to drive away capital investment and well-paying jobs to other jurisdictions. Surely the “do no harm” precept ought to apply.
Taxing the 1%? The limits of redistribution and a plan for inclusive growth20
Conclusion
T he political resonance of income and wealth redistribution has grown in the past half decade and shows no signs of abating. Calls for high-income earners to pay their “fair share” continue to mount in spite of a series of tax increases across the country from British Columbia to New-foundland and Labrador and virtually everywhere in between. The top 1% has come to loom large in our politics.
The questions about redistribution are inherently political. Negotiating the tension between free-dom and equality, efficiency and equity, and the welfare state’s role in redistribution, is core to much of modern politics. It reflects political preferences and the compromises reached in our po-litical system.
But it is not to say that no evidence can brought to bear on these questions. There are, of course, limits to redistribution. There are reasons that not all wealth is centrally managed and apportioned.
This study has sought to inform the political debate by drawing on Statistics Canada data to better understand the characteristics and traits of Canada’s top 1%. It has also reviewed existing research and evidence on the limits of income and wealth redistribution not only with regards to work, investment, and entrepreneurialism, but also for philanthropy and charitable giving, as well as government revenues.
As an alternative, we have set out some basic policy ideas to form the basis of a more positive, pro-mo-bility agenda for all Canadians. The goal should be to strengthen the conditions of equality-of-oppor-tunity rather than equality-of-result. This vision would place the focus less on the zero-sum question of “fair share” and more on inclusive growth.

Sean Speer | April 2017 21
About the Author
S ean Speer is a Munk Senior Fellow at the Macdonald-Laurier Institute. He previously served in different roles for the federal government including as senior economic advisor to the Prime Minister and director of policy to the Minister of Finance. He has been cited by The Hill Times as one of the most influential people in government and by Embassy Magazine as one of the top 80 people influencing Canadian foreign policy. He has written extensively about federal policy issues, including personal income taxes, government spending, social mobility, and economic competitiveness. His articles
have appeared in every major national and regional newspaper in Canada (including the Globe and Mail and National Post) as well as prominent US-based publications (including Forbes and The American). Sean holds an M.A. in History from Carleton University and has studied economic history as a PhD candidate at Queen’s University.

Taxing the 1%? The limits of redistribution and a plan for inclusive growth22
References
Auten, Gerald E., Charles T. Clotfelter, and Richard L. Schmalbeck. 2000. “Taxes and philanthropy among the wealthy.” In Joel B. Slemrod, ed., Does Atlas Shrugged? The Economic Consequences of Taxing the Rich. New York: Russell Sage Foundation.
Canada. 2016a. “Fall Economic Statement 2016: A Plan for Middle Class Progress.” Government of Canada. Available at www.budget.gc.ca/fes-eea/2016/docs/statement-enonce/fes-eea-2016-eng.pdf
———. 2016b. “Speech: A Plan for Middle Class Progress – Fall Economic Statement.” Fall Economic Statement 2016, November 1. Available at www.budget.gc.ca/fes-eea/2016/docs/speech-discours/01-11-2016-en.html.
———. 2017. “Building a Strong Middle Class.” Government of Canada, March 22. Available at www.budget.gc.ca/2017/docs/plan/budget-2017-en.pdf.
Canada Mortgage and Housing Corporation (CMHC). 2017. “Canadian housing starts trend upwards in February.” CMHC, March 8. Available at https://www.cmhc-schl.gc.ca/en/corp/nero/ nere/2017/2017-03-08-0816.cfm?utm_source=twitter-main&utm_medium=link&utm_campaign=mac.
Canadian Press. 2017. “Ottawa warned about job losses that could stem from automation.” CBC News, March 18. Available at www.cbc.ca/news/business/job-automation-federal- government-1.4031206.
Center on Philanthropy. 2007. “Bank of America Study of High–Net Worth Philanthropy.” Center on Philanthropy, Indiana University.
Chen, Wen-Hao and Yuri Ostrovsky. 2016. “Intergenerational Income Transmission: New Evidence from Canada.” Statistics Canada, June 17. Available at www.statcan.gc.ca/pub/11f0019m/ 11f0019m2016379-eng.htm.
Clemens, Jason, ed. 2008. “The Impact and Cost of Taxation in Canada: The Case for Flat Tax Reform.” Fraser Institute. Available at https://www.fraserinstitute.org/sites/default/files/impact-and-cost-of-taxation-in-canada-2008.pdf.
Coates, Ken. 2015. “Five Priorities for Aboriginal Canada in Election 2015.” MLI Inside Policy, July 31. Available at www.macdonaldlaurier.ca/ken-coates-in-inside-policy-five-priorities- for-aboriginal-canada-in-election-2015/.
Corak, Miles. 2013. “Public policies for equality and social mobility in Canada.” Canada 2020, February. Available at canada2020.ca/wp-content/uploads/2013/02/Canada-2020-Background-paper-Public-policies-for-equality-and-mobility-in-Canada.pdf.
Corak, Miles. 2016. “’Inequality is the root of social evil,’ or maybe not? Two stories about inequality and public policy.” Canadian Public Policy 42(4): 367-414.
Crowley, Brian Lee. 2017. “New Rhetoric, New Realities, and the Emerging Conflict Between Elites and Ordinary People.” MLI Commentary, March. Available at macdonaldlaurier.ca/files/pdf/MLICommentaryEmergingConflictSpeechMarch2017_F.pdf.
Crowley, Brian Lee and Sean Speer. 2015. “From a Mandate for Change to a Plan to Govern: Creating Economic Opportunity for the Middle Class.” MLI Commentary, December 3. Available at http://www.macdonaldlaurier.ca/files/pdf/MLICommentarySpeerCrowley-12-15WebReady.pdf.
———. 2016. “A Home for Canada’s Middle Class: A Plan for Housing Affordability and Opportunity in Canada.” Macdonald-Laurier Institute, September. Available at www.macdonaldlaurier.ca/files/pdf/MLISpeerHousingAffordability09-16-webreadyV5.pdf.
Sean Speer | April 2017 23
Curry, Bill. 2016. “New Brunswick first to lower top rate over federal plan to tax the rich.” Globe and Mail, February 3. Available at www.theglobeandmail.com/news/politics/new-brunswick- first-to-lower-top-rate-over-federal-plan-to-tax-the-rich/article28548631/
Curry, Bill and Daniel Leblanc. 2015. “How Liberals gauged response to high-income tax hike explains estimate gap.” Globe and Mail, December 9. Available at www.theglobeandmail.com/news/politics/how-liberals-gauged-response-to-high-income-tax-hike-explains-estimate-gap/article27678069/.
Department of Finance Canada. 2010. “Tax Expenditures and Evaluations 2010 – The Response of Individuals to Changes in Marginal Income Tax Rates.” Department of Finance Canada. Available at fin.gc.ca/taxexp-depfisc/2010/taxexp1003-eng.asp#tocpart2-11.
———. 2015. “Update of Economic and Fiscal Projections.” Department of Finance Canada. Available at www.budget.gc.ca/efp-peb/2015/pub/efp-peb-15-en.pdf.
———. 2016. “Report on Federal Tax Expenditures – Concepts, Estimates and Evaluations 2016.” Department of Finance Canada. Available at https://www.fin.gc.ca/taxexp-depfisc/2016/taxexp 1609-eng.asp#_Toc442180666.
Economist. 2011. “Diving into the rich pool.” The Economist, September 24. Available at www.economist.com/node/21530093.
Employment and Social Development Canada. n.d. “Pre-Budget Tour: The State of the Middle Class.” Employment and Social Development Canada. Available at https://www.slideshare.net/jyduclos/2017-prebudget-tour-the-state-of-the-middle-class.
Feldstein, Martin. 1995. “Behavioral Responses to Tax Rates: Evidence from TRA86.” National Bureau of Economic Research, January. Available at www.nber.org/papers/w5000.pdf?new_window=1.
Fortin, Nicole and Thomas Lemieux. 2015. “Changes in Wage Inequality in Canada: An Interprovincial Perspective.” Institute for Research on Public Policy, September 24. Available at irpp.org/research-studies/aots5-fortin-lemieux/.
Francis, Johanna and Jason Clemens. 1999. “Charitable donations and tax incentives.” Fraser Forum, June. Available at https://www.heartland.org/_template-assets/documents/publications/2268.pdf.
Freeland, William, Ben Wilterdink and Jonathan Williams. 2015. “The Effect of State Taxes on Charitable Giving.” American Legislative Exchange Council, September. Available at https://www.alec.org/app/uploads/2015/09/2015-State-Factor_Charitable-Giving.pdf.
Furman, Jason. 2015. “Barriers to Shared Growth: The Case of Land Use Regulation and Economic Rents.” The Urban Institute, November 20. Available at https://obamawhitehouse.archives.gov/sites/default/files/page/files/20151120_barriers_shared_growth_land_use_regulation_and_economic_rents.pdf.
Golombek, Jamie. 2015a. What Trudeau’s change to the top tax rate might mean for charitable donation credits.” National Post, November 27. Available at business.financialpost.com/personal-finance/taxes/what-trudeaus-change-to-the-top-tax-rate-might-mean-for-charitable-donation-credits.
———. 2015b. “Good news for wealthy donors: New high-income tax bracket to be matched by higher tax credit.” National Post, December 8. Available at business.financialpost.com/personal-finance/taxes/good-news-for-wealthy-donors-new-high-income-tax-bracket-to-be-matched-by-higher-tax-credit.
Greenberg, Scott. 2017. “Summary of the Latest Federal Income Tax Data, 2016 Update.” Tax Foundation, February 1. Available at https://taxfoundation.org/summary-latest-federal- income-tax-data-2016-update/.

Taxing the 1%? The limits of redistribution and a plan for inclusive growth24
Havens, John J. and Paul G. Schervish. 2000. Millionaires and the Millennium: New Estimates of the Forthcoming Wealth Transfer and the Prospects for a Golden Age of Philanthropy. Boston College: Social Welfare Research Institute.
Health Canada. n.d. “Questions and Answers: Drinking Water and Wastewater in First Nations communities south of 60.” Health Canada. Available at www.hc-sc.gc.ca/fniah-spnia/promotion/public-publique/water-eau-eng.php.
Hirschi, Thomas and Mark Rank. 2015. “The Life Course Dynamics of Affluence.” PLoS One 10, 1. Available at journals.plos.org/plosone/article/file?id=10.1371/journal.pone.0116370&type =printable.
Indigenous and Northern Affairs Canada. 2015. “Bill C-33: First Nations Control of First Nations Education Act.” Indigenous and Northern Affairs Canada, July 7. Available at https://www.aadnc-aandc.gc.ca/eng/1358798070439/1358798420982.
Jerrim, John, Albaro Choi, Rosa Simancas Rodriquez. 2013. “Cross-national comparisons of intergenerational mobility: Are the earnings measures used robust?” October. Available at https://editorialexpress.com/cgi-bin/conference/download.cgi?db_name=XXIEEP& paper_id=73.
Kessler, Sarah. 2017. “Lawrence Summers says Bil Gates’ idea for a robot tax is ‘profoundly misguided.’” Quartz, March 6. Available at https://qz.com/925412/lawrence-summers-says- bill-gates-idea-for-a-robot-tax-is-profoundly-misguided/.
Lammam, Charles and Hugh MacIntyre. 2016. “Charitable giving in Canada on the wane, hits 10-year low.” Toronto Star (republished at Fraser Institute), December 16. Available at https://www.fraserinstitute.org/article/charitable-giving-in-canada-on-the-wane-hits-10-year-low .
Lammam, Charles, Amela Karabegovic, Niels Veldhuis. 2012. “Measuring Income Mobility in Canada.” Fraser Institute, November 20. Available at https://www.fraserinstitute.org/studies/measuring-income-mobility-in-canada.
Lammam, Charles, Hugh MacIntyre, and Feixue Ren. 2016. “Generosity in Canada and the United States: The 2016 Generosity Index.” Fraser Research Bulletin, December. Available at https://www.fraserinstitute.org/sites/default/files/generosity-in-canada-and-the-united-states-the-2016-generosity-index.pdf.
Lammam, Charles, Hugh MacIntyre, Feixue Ren, Ben Eisen, and Milagros Palacios. 2016. “Canada’s Rising Personal Tax Rates and Falling Tax Competitiveness.” Fraser Institute, March. Available at https://www.fraserinstitute.org/sites/default/files/canadas-rising-personal-tax-rates-and-falling-tax-competitiveness.pdf.
Laurin, Alexandre. 2015. “Shifting the Federal Tax Burden to the One-Percenters: A Losing Proposition.” CD Howe Institute E-Brief, December 3. Available at https://www.cdhowe.org/sites/default/files/attachments/research_papers/mixed/e-brief_222_0.pdf.
Leonhardt, David and Kevin Quealy. 2014. “This simply table summarizes our story on American living standards.” New York Times, April 22. Available at https://www.nytimes.com/2014/04/23/upshot/this-simple-table-summarizes-our-story-on-american-living-standards.html?mtrref=undefined&_r=1.
Liberal Party. 2015. “A New Plan for a Strong Middle Class.” Liberal Party of Canada. Available at https://www.liberal.ca/wp-content/uploads/2015/10/New-plan-for-a-strong-middle-class.pdf.
List, John. 2011. “The Market for Charitable Giving.” Journal of Economic Perspectives 25, 2, pp. 157-180.
Milligan, Kevin. 2015a. “How to stop the rich from dodging higher taxes.” Maclean’s, December 3. Available at www.macleans.ca/economy/economicanalysis/how-to-stop-the-rich-from-dodging- higher-taxes/.

Sean Speer | April 2017 25
Milligan, Kevin. 2015b. “What elasticity of taxable income should we use for 2016?” Policy Options, December 10. Available at policyoptions.irpp.org/2015/12/10/what-elasticity-of-taxable- income-should-we-use-for-2016/.
Murphy, Robert, Jason Clemens and Niels Veldhuis. 2013. “The Economic Costs of Increased Marginal Tax Rates in Canada.” Fraser Institute Studies in Budget and Tax Policy, October. Available at https://www.fraserinstitute.org/sites/default/files/economic-costs-of-increased-marginal-tax-rates-in-canada.pdf.
OECD, Tax Policy Reform and Economic Growth. Paris: OECD Publishing, 2010.
Penketh, Anne. 2014. “France forced to drop 75% supertax after meagre returns.” The Guardian, December 31. Available at https://www.theguardian.com/world/2014/dec/31/france-drops- 75percent-supertax.
Philanthropy Roundtable. n.d. “Who Gives Most to Charity.” Philanthropy Roundtable. Available at www.philanthropyroundtable.org/almanac/who_gives_most_to_charity/.
Prime Minister’s Office. 2016. “Prime Minister of Canada marks one year anniversary of the swearing-in of the 29th Ministry.” November 4. Available at pm.gc.ca/eng/news/2016/11/04/prime-minister-canada-marks-one-year-anniversary-swearing-29th-ministry.
Quesnel, Joseph and Kenneth Green. 2017. “Look to public-private partnerships to build infrastructure for Ontario’s Ring of Fire.” Thunder Bay Chronicle Journal, March 1. Available at https://www.fraserinstitute.org/article/look-to-public-private-partnerships-to-build-infrastructure-for-ontarios-ring-of-fire.
Rivait, Jonathon. 2015. “Where the donations go: Why and how Canadians gave $12.8 billion in charities.” National Post, December 17. Available at news.nationalpost.com/news/graphics/where-donations-go-why-and-how-canadians-donated-12-8-billion-to-charities.
Romer, Christina and David Romer. 2012. “The Incentive Effects of Marginal Tax Rates: Evidence from the Interwar Era.” National Bureau of Economic Research, February. Available at www.nber.org/papers/w17860.pdf.
Sheikh, Munir. 2015. “Great Gatsby v. Zero Dollar Linda: Assessing the Relationship Between Income Inequality, Social Mobility, and the Tax-Transfer System.” Macdonald-Laurier Institute, April. Available at www.macdonaldlaurier.ca/files/pdf/MLISheikhGreatGatsbyPaper04-15-webready-V2.pdf.
Simpson, Jeffrey. 2015. “Progress for Aboriginal Peoples Still Haunted by the Past.” MLI Inside Policy, April 8. Available at www.macdonaldlaurier.ca/jeffrey-simpson-in-inside-policy- progress-for-aboriginal-peoples-still-haunted-by-the-past/.
Speer, Sean. 2017. “Sketching Out a Plan for Inclusive Growth: The Case for Less Red Ink.” MLI Commentary, February. Available at www.macdonaldlaurier.ca/files/pdf/MLICommentary Speers2017_F.pdf.
Speer, Sean and Brian Lee Crowley. 2016. “The Limits of Redistribution and the Promise of Opportunity.” Toronto Sun (republished at Macdonald-Laurier Institute), November 27. Available at www.macdonaldlaurier.ca/the-limits-of-redistribution-and-the-promise-of-opportunity-sean-speer-and-brian-lee-crowley-in-sun-papers/
Statistics Canada. 2015. “Aboriginal Peoples: Fact Sheet for Canada.” Statistics Canada, November 30. Available at www.statcan.gc.ca/pub/89-656-x/89-656-x2015001-eng.htm.
———. 2016a. “Charitable donors, 2014.” Statistics Canada, February 22. Available at www.statcan.gc.ca/daily-quotidien/160222/dq160222e-eng.htm.

Taxing the 1%? The limits of redistribution and a plan for inclusive growth26
———. 2016b. “Table 204-0002 – High income trends of tax filers in Canada, provinces and census metropolitan areas (CMA), specific geographic area thresholds, annual (percent unless otherwise noted).” Statistics Canada, CANSIM (database), November 21 (date modified). Available at http://www5.statcan.gc.ca/cansim/a26?lang=eng&id=2040002
———. 2016c. “Table 204-0001 – High income trends of tax filers in Canada, provinces, territories and census metropolitan areas (CMA), national thresholds, annual (percent unless otherwise noted),” Statistics Canada, CANSIM (database), November 21 (date modified). Available at http://www5.statcan.gc.ca/cansim/
Turcotte, Martin. 2012. “Charitable giving by Canadians.” Component of Statistics Canada Catalogue no. 11-008-X, April 16. Available at www.statcan.gc.ca/pub/11-008-x/2012001/article/ 11637-eng.pdf.
Vance, J.D. 2016. Hillbilly Elegy: A Memoir of a Family and Culture in Crisis. New York: HarperCollins.
Watson, William. 2016. “Turns out income mobility in Canada isn’t as impressive as we thought.” National Post, June 22. Available at business.financialpost.com/fp-comment/william-watson- turns-out-income-mobility-in-canada-isnt-as-impressive-as-we-thought.
Endnotes
1 The income threshold differs considerably among Census Metropolitan Areas. The highest threshold in 2014 was in Calgary, Alberta, at $436,700. The lowest was in Saguenay, Quebec, at $170,200 (Statistics Canada 2016b).
2 This amount excludes non-reported donations.
3 There is some competing analysis, including a recent MLI study (Sheikh 2015).
Critically Acclaimed, Award-Winning InstituteThe Macdonald-Laurier Institute fills a gap in Canada’s democratic infrastructure by focusing our work on the full range of issues that fall under Ottawa’s jurisdiction.
• The Macdonald-Laurier Institute fills a gap in Canada’s democratic infrastructure by focusing our work on the full range of issues that fall under Ottawa’s jurisdiction.
• One of the top three new think tanks in the world according to the University of Pennsylvania.
• Cited by five present and former Canadian Prime Ministers, as well as by David Cameron, the British Prime Minister.
• First book, The Canadian Century: Moving out of America’s Shadow, won the Sir Antony Fisher International Memorial Award in 2011.
• Hill Times says Brian Lee Crowley is one of the 100 most influential people in Ottawa.
• The Wall Street Journal, the Economist, the Globe and Mail, the National Post and many other leading national and international publications have quoted the Institute’s work.
Where You’ve Seen Us
Ideas Change the World
Independent and non-partisan, the Macdonald-Laurier Institute is increasingly recognized as the thought leader on national issues in Canada, prodding governments, opinion leaders and the general public to accept nothing but the very best public policy solutions for the challenges Canada faces.
“The study by Brian Lee Crowley and Ken Coates is a ‘home run’. The analysis by Douglas Bland will make many uncomfortable but it is a wake up call that must be read.” FORMER CANADIAN PRIME MINISTER PAUL MARTIN ON MLI’S PROJECT ON ABORIGINAL PEOPLE AND THE NATURAL RESOURCE ECONOMY.
For more information visit: www.MacdonaldLaurier.ca
Macdonald-Laurier Institute

What Do We Do?When you change how people think, you change what they want and how they act. That is why thought leadership is essential in every field. At MLI, we strip away the complexity that makes policy issues unintelligible and present them in a way that leads to action, to better quality policy decisions, to more effective government, and to a more focused pursuit of the national interest of all Canadians. MLI is the only non-partisan, independent national public policy think tank based in Ottawa that focuses on the full range of issues that fall under the jurisdiction of the federal government.
What Is in a Name?The Macdonald-Laurier Institute exists not merely to burnish the splendid legacy of two towering figures in Canadian history – Sir John A. Macdonald and Sir Wilfrid Laurier – but to renew that legacy. A Tory and a Grit, an English speaker and a French speaker – these two men represent the very best of Canada’s fine political tradition. As prime minister, each championed the values that led to Canada assuming her place as one of the world’s leading democracies. We will continue to vigorously uphold these values, the cornerstones of our nation.
Working for a Better Canada Good policy doesn’t just happen; it requires good ideas, hard work, and being in the right place at the right time. In other words, it requires MLI. We pride ourselves on independence, and accept no funding from the government for our research. If you value our work and if you believe in the possibility of a better Canada, consider making a tax-deductible donation. The Macdonald-Laurier Institute is a registered charity.
Our Issues
The Institute undertakes an impressive programme of thought leadership on public policy. Some of the issues we have tackled recently include:
• Aboriginal people and the management of our natural resources;
• Getting the most out of our petroleum resources;
• Ensuring students have the skills employers need;
• Controlling government debt at all levels;
• The vulnerability of Canada’s critical infrastructure;
• Ottawa’s regulation of foreign investment; and
• How to fix Canadian health care.
About the Macdonald-Laurier Institute
For more information visit: www.MacdonaldLaurier.ca

Ian Lee, Geoffrey A. Manne, Julian Morris, and Todd J. Zywicki | October 2013For more information visit: www.MacdonaldLaurier.ca
Macdonald-Laurier Institute Publications
The Canadian CenturyBy Brian Lee Crowley, Jason Clemens, and Niels Veldhuis
SMOKING GUN: STRATEGIC CONTAINMENT OF CONTRABAND TOBACCO AND CIGARETTE TRAFFICKING IN CANADA Christian Leuprecht
MARCH 2016
A Macdonald-Laurier Institute Publication
Smoking GunChristian Leuprecht
A Macdonald-Laurier Institute Publication
Unearthing the Full Economic Impact of Canada’s Natural Resources
What are they? How important are they?
Philip Cross
16.6% Directly contributed
to Canada’s GDP
Nearly
14% of Canada’s jobs
Nearly
²/³ of spending in business investment and exports
May 2015
1September 2016
A HOME FOR CANADA’S MIDDLE CLASS
A Macdonald-Laurier Institute Publication
September 2016
A Plan for Housing Affordability and Opportunity in Canada
Brian Lee Crowley and Sean Speer
UNDERSTANDING FPICFrom assertion and assumption on ‘free, prior and informed consent’ to a new model for Indigenous engagement on resource development
KEN S. COATES AND BLAINE FAVEL
APRIL 2016
Aboriginal Canada and the Natural Resource Economy Series9
A MACDONALD-LAURIER INSTITUTE PUBLICATION
UNDERSTANDING UNDRIPChoosing action on priorities over sweeping claims about the United Nations Declaration on the Rights of Indigenous Peoples
BLAINE FAVEL AND KEN S. COATES
MAY 2016
Aboriginal Canada and the Natural Resource Economy Series10
A MACDONALD-LAURIER INSTITUTE PUBLICATION
Unearthing the Full Economic Impact of Canada’s Natural ResourcesPhilip Cross
OCTOBER 2016
A MACDONALD-LAURIER INSTITUTE PUBLICATION
A New Digital Policy for the Digital Age
A MANDATE REVIEW OF THE CRTCLen Katz and Sean Speer
Dixon Entrance
QueenCharlot te
Sound
He
ca
t e S
t ra
i t
Burns LakeBear Lake
WhitecourtBRUDERHEIM
Fort St. James
BRITISH COLUMBIAALASKA ALBERTA
Tumbler Ridge
Smoky River
Houston
Pump Station Kilometre Post (KP) Clore and Hoult Tunnels
Stewart
New Aiyansh
SmithersTerrace
Kitimat
Fraser Lake
Tumbler Ridge
Mackenzie
Chetwynd Dawson Creek
Hudson’s Hope
Fort St. John
Fairview
Peace RiverWabasca
Slave LakeHigh Prairie
Grande Prairie
Valleyview
Swan Hills Athabasca
Lac La Biche
Edmonton VegrevilleEdson
LeducDrayton Valley
CamroseWetaskiwin
Ponoka
StettlerLacombe
Rocky Mountain HouseRed Deer
Innisfail
Drumheller
Airdrie
Calgary
BanffGolden
High River
ClaresholmElkford
Invermere
Revelstoke
Nakusp
Salmon Arm
Vernon
Kamloops
Williams Lake
Lillooet Ashcroft
MerrittWhistler
Campell River
Port McNeill
Port Hardy
Quesnel
Valemount
Prince George
Vanderhoof
Grande Cache
Hinton
Jasper
Fox Creek
McBride
Vancouver
Victoria
Dixon Entrance
KITIMATTERMINAL
Clearwater
Bella BellaBella Coola
Prince Rupert
Risk, Prevention, and OpportunityRobert Hage
NORTHERN GATEWAY AND THE MARINE ENVIRONMENT
March 2015
A Macdonald-Laurier Institute Publication
A Mandate Review of the CRTCLen Katz and Sean Speer
Risk, Prevention and OpportunityRobert Hage
A Home for Canada’s Middle ClassBrian Lee Crowley and Sean Speer
Understanding FPICKen S. Coates and Blaine Favel
Understanding UNDRIPBlaine Favel and Ken S. Coates
RESEARCH PAPERS
Winner of the Sir Antony Fisher
International Memorial Award BEST THINK
TANK BOOK IN 2011, as awarded by the Atlas Economic Research
Foundation.
Do you want to be first to hear about new policy initiatives? Get the inside scoop on upcoming events?
Visit our website www.MacdonaldLaurier.ca and sign up for our newsletter.
JULY 2016
A Macdonald-Laurier Institute Series
Medicare’s Mid-life crisis
6
Toward a more fair medicare: Why Canadian health care isn’t equitable or sustainable and how it can be
Sean Speer and Ian Lee
Toward a More Fair MedicareSean Speer and Ian Lee

Taxing the 1%? The limits of redistribution and a plan for inclusive growth30
CONTACT US: Macdonald-Laurier Institute 8 York Street, Suite 200 Ottawa, Ontario, Canada K1N 5S6
TELEPHONE: (613) 482-8327
WEBSITE: www.MacdonaldLaurier.ca
CONNECT WITH US:
@MLInstitute
www.facebook.com/ MacdonaldLaurierInstitute
www.youtube.com/ MLInstitute
Scan this QR code to get your copy of our iphone app or to visit our mobile website
What people are saying about the Macdonald-Laurier Institute
In five short years, the institute has established itself as a steady source of high-quality research and thoughtful policy analysis here in our nation’s capital. Inspired by Canada’s deep-rooted intellectual tradition of ordered liberty – as exemplified by Macdonald and Laurier – the institute is making unique contributions to federal public policy and discourse. Please accept my best wishes for a memorable anniversary celebration and continued success.
THE RIGHT HONOURABLE STEPHEN HARPER
The Macdonald-Laurier Institute is an important source of fact and opinion for so many, including me. Everything they tackle is accomplished in great depth and furthers the public policy debate in Canada. Happy Anniversary, this is but the beginning.
THE RIGHT HONOURABLE PAUL MARTIN
In its mere five years of existence, the Macdonald-Laurier Institute, under the erudite Brian Lee Crowley’s vibrant leadership, has, through its various publications and public events, forged a reputation for brilliance and originality in areas of vital concern to Canadians: from all aspects of the economy to health care reform, aboriginal affairs, justice, and national security.
BARBARA KAY, NATIONAL POST COLUMNIST
Intelligent and informed debate contributes to a stronger, healthier and more competitive Canadian society. In five short years the Macdonald-Laurier Institute has emerged as a significant and respected voice in the shaping of public policy. On a wide range of issues important to our country’s future, Brian Lee Crowley and his team are making a difference.
JOHN MANLEY, CEO COUNCIL