august 2016 global insight - rbc wealth management
TRANSCRIPT

August 2016
R B C W E A L T H M A N A G E M E N T
Global InsightPerspect ives f rom the Global Por t fol io Advisory Committee
For important and required non-U.S. analyst disclosures, see page 18.
Global equityFollow the leaders
Global fixed incomeThe eye of the storm
CommoditiesThe golden bull
CurrenciesSterling gets a pounding
Digital disruption Waves of change are pushing the U.S. Technology sector across the digital frontier and opening up attractive investment opportunities.
Kelly Bogdanov | Page 4

2 Global Insight | August 2016
Table of contents
4 Digital disruption
It’s a new age for “new tech” as innovative disruptors are stretching the boundaries of what’s possible. With compelling growth opportunities and valuations at reasonable levels, investors should look to add exposure to the U.S. Technology sector.
8 Global equity: Follow the leaders
While we are stuck in a slow growth world, we don’t think investors need to shift into a highly defensive stance. Rather, in what may be becoming a stock picker’s market, selectivity is key, and investors should focus on companies with “the right stuff.”
11 Global fixed income: The eye of the storm
The relative calm that has settled upon fixed income markets should persist through much of the month. But volatility will likely begin to fire back up in September as most central banks hold their next policy meetings. .
Inside the markets
3 RBC’s investment stance
8 Global equity
11 Global fixed income
13 Commodities
14 Currencies
15 Key forecasts
16 Market scorecard
All values in U.S. dollars and priced as of market close, July 29, 2016, unless otherwise stated.
Global Insight August 2016

3 Global Insight | August 2016
RBC’s investment stance
Views explanation
(+/=/–) represents the Global Portfolio Advisory Committee’s (GPAC) view over a 12-month investment time horizon.
+ Overweight implies the potential for better-than-average performance for the asset class or for the region relative to other asset classes or regions.
= In-line implies the potential for average performance for the asset class or for the region relative to other asset classes or regions.
– Underweight implies the potential for below-average performance for the asset class or for the region relative to other asset classes or regions.
Global asset views
Source - RBC Wealth Management
Asset Class
View
— = +Equities
Fixed Income
See “Views explanation” below for details
Expect below average performance
Expect above average performance
Equities
• Global equities should deliver moderate gains in the coming year as major economies, excluding the U.K., are likely to keep growing at least slowly and corporate earnings should improve as the Energy sector recovers. Valuations are below average in Asia, and above average in North America and Europe. While they are not so high as to choke off the rally, additional “easy” multiple expansion seems unlikely in the near term.
• The current environment calls for greater selectivity within equity portfolios—not just in terms of which markets or sectors to own, but also in terms of which stocks to own. We favor secular and stable growers that are less dependent on the economic cycle. Our modest Underweight recommendation for global equities overall stems mostly from concerns around economic and earnings growth in the U.K. and Europe.
Fixed Income
• Volatility in fixed income markets should quiet down in August following the gyrations that surrounded the Brexit vote during the first half of the summer. The Bank of England is the only central bank scheduled to meet in August and it is expected to cut the benchmark rate 25 basis points to 0.25%. Given weak Q2 GDP growth in the U.S. and a continued focus on global developments, we still believe the Federal Reserve will refrain from hiking interest rates in 2016.
• We remain constructive on corporate credit overall, but continue to recommend being selective about adding exposure as spreads for many sectors are at the tightest levels so far this year. Rather than chase performance, we would exercise patience in putting new money to work at current levels in some segments of the credit market—for example, U.S. high yield—preferring to wait for better entry points.
Global asset class view

4 Global Insight | August 2016
Digital disruptionThe U.S. Information Technology sector is riding a wave of innovation that we believe can take it to higher levels and pull the S&P 500 up with it. Cloud computing, cyber security software, the “Internet of Things,” together with other emerging technologies have created new investment categories within the sector. In our view, reasonable valuations combined with attractive growth prospects make this sector a timely candidate for overweighting in portfolios.
We are long past the days when the personal computer was considered the hub of the U.S. Tech sector. Nor is the smartphone, which burst on the scene in 2007, the center of the Tech investment universe anymore. Over the past few years, tech innovation has leaped well beyond those categories despite subpar U.S. and global economic growth.
Now the sector revolves around an array of newer technologies such as cloud computing, big data analytics, cybersecurity software, “smart” advertising on mobile devices, video streaming over the internet, and semiconductors geared toward the “Internet of Things.” A “fintech” category is also emerging, aimed at delivering financial services more efficiently through technology solutions.
For those and other innovative tech areas, growth opportunities are compelling. For example, RBC Capital Markets believes internet advertising will represent 44% of total global advertising by 2018, up from 28% in 2014. It estimates cybersecurity spending will surge 47% from 2013 to 2018, and regards the adoption of cloud computing as only in its adolescent phase. At the same time, it estimates mobile data traffic will likely continue to skyrocket (see chart).
Focus article
Kelly BogdanovSan Francisco, United States
Forecast global mobile data trafficIn exabytes per year
4474
119
179
261
367
2015 2016E 2017E 2018E 2019E 2020E
Source - RBC Capital Markets, Cisco VNI Report (2015); 2016 and onward are Cisco estimates; 1 exabyte = 1 billion gigabytes
Mobile data could grow exponentially by 2020.
5 Global Insight | August 2016
Digital disruption
Meanwhile, next-generation technologies are in the works including mass data intelligence, augmented reality, artificial intelligence, human-to-computer interfaces, advanced robotics, autonomous vehicles, and the convergence of health care and technology.
The digital hubWe believe investors should zero in on the U.S. Tech sector because it is the source of much of this innovation.
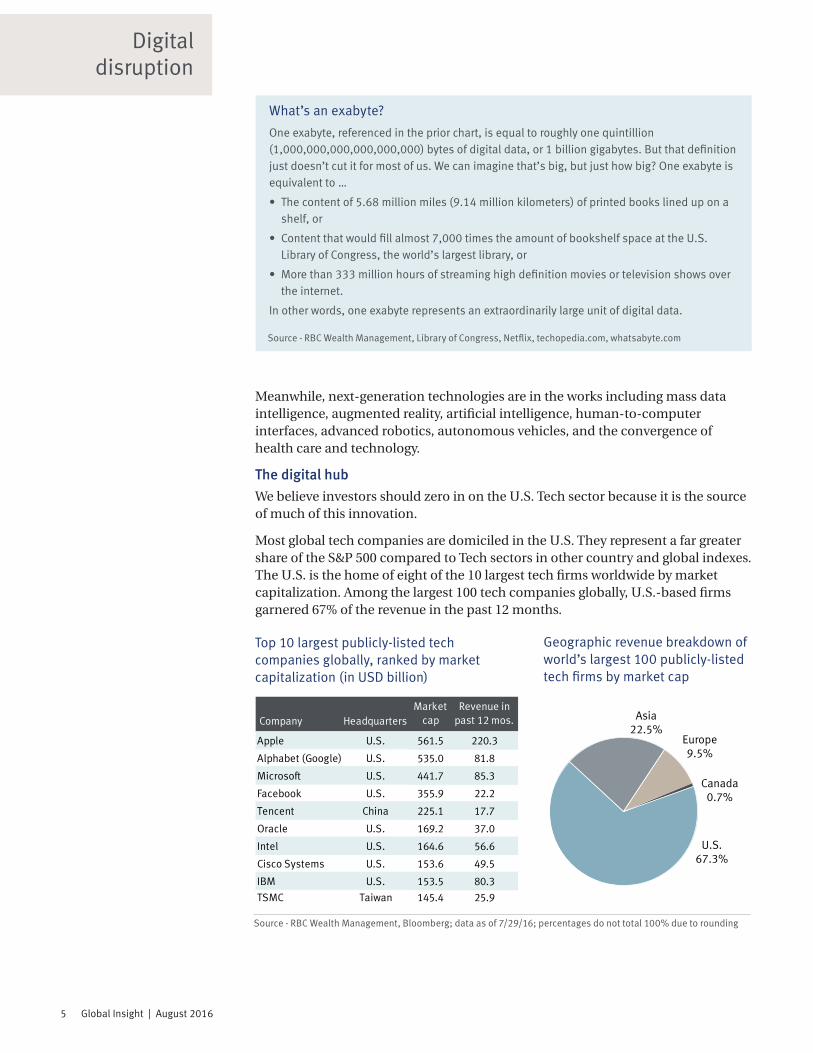
Most global tech companies are domiciled in the U.S. They represent a far greater share of the S&P 500 compared to Tech sectors in other country and global indexes. The U.S. is the home of eight of the 10 largest tech firms worldwide by market capitalization. Among the largest 100 tech companies globally, U.S.-based firms garnered 67% of the revenue in the past 12 months.
What’s an exabyte?
Source - RBC Wealth Management, Library of Congress, Netflix, techopedia.com, whatsabyte.com
One exabyte, referenced in the prior chart, is equal to roughly one quintillion (1,000,000,000,000,000,000) bytes of digital data, or 1 billion gigabytes. But that definition just doesn’t cut it for most of us. We can imagine that’s big, but just how big? One exabyte is equivalent to …
• The content of 5.68 million miles (9.14 million kilometers) of printed books lined up on a shelf, or
• Content that would fill almost 7,000 times the amount of bookshelf space at the U.S. Library of Congress, the world’s largest library, or
• More than 333 million hours of streaming high definition movies or television shows over the internet.
In other words, one exabyte represents an extraordinarily large unit of digital data.
Top 10 largest publicly-listed tech companies globally, ranked by market capitalization (in USD billion)
Source - RBC Wealth Management, Bloomberg; data as of 7/29/16; percentages do not total 100% due to rounding
Company HeadquartersMarket
capRevenue in
past 12 mos.
Apple U.S. 561.5 220.3
Alphabet (Google) U.S. 535.0 81.8
Microsoft U.S. 441.7 85.3
Facebook U.S. 355.9 22.2
Tencent China 225.1 17.7
Oracle U.S. 169.2 37.0
Intel U.S. 164.6 56.6
Cisco Systems U.S. 153.6 49.5
IBM U.S. 153.5 80.3
TSMC Taiwan 145.4 25.9
U.S. 67.3%
Asia 22.5%
Europe 9.5%
Canada 0.7%
Geographic revenue breakdown of world’s largest 100 publicly-listed tech firms by market cap

6 Global Insight | August 2016
Digital disruption
So much change has unfolded so rapidly, the composition of the sector has shifted dramatically.
“New tech”—companies geared toward the innovations cited previously—represents the largest part of the U.S. Tech sector by market capitalization at almost 42%, according to RBC Capital Markets. Examples of such companies include Facebook (“smart” mobile advertising, development of virtual reality), salesforce.com (cloud computing), and PayPal (fintech).
Companies mainly leveraged toward technologies that prevailed 5–10 or so years ago—“old tech”—make up the second-largest share of the sector at roughly 31%. Examples of these companies are Texas Instruments (chips for cellphones and other traditional applications), Juniper Networks (legacy routing, switching, and related networking solutions), and Micron Technology (DRAM, SRAM, and other memory chips).
“Transitional tech” firms, which have old tech foundations but are increasingly generating revenue from new tech innovations they have developed or acquired, represent the rest of the sector. These types of companies include Microsoft (cloud computing along with its traditional Windows software business), Visa (a “fintech” firm due to mobile payments initiative and classified as Tech by Standard & Poor’s), and Cisco Systems (networking software and equipment for “Internet of Things” combined with traditional networking).
Capture relative value
Despite the rapid take-up of significant innovations and emergence of new tech, the sector’s valuation is reasonable based on a number of measures.
The Tech sector is trading below the market multiple and at nearly a 4% discount to its long-term average price-to-earnings ratio, while the S&P 500 is trading at a 16% premium to its norm (see left chart on following page).
Tech’s free cash flow yield—one measure of expected return—exceeds the S&P 500 and all other sectors except for Financials and Telecommunications.
Admittedly, valuation metrics of some tech stocks seem quite stretched, including those of select new tech firms. But when earnings growth is taken into consideration, new tech is actually the cheapest category (see right chart on next page). New tech’s revenue outlook also appears to be bright. The sector seems positioned to increase revenue 7.1% in the next 12 months, well ahead of old and transitional tech at 4.5% and 2.1%, respectively, and the S&P 500 at 4.0%, according to consensus forecasts.
Market cap share of U.S. Tech sector by innovation category
New tech 41.7%
Old tech 30.8%
Transitional tech
27.5%
Source - RBC Capital Markets, FactSet; data as of 6/20/16
New and transitional tech make up 69% of the sector.
Tech is cheaper than the S&P 500 and its historical average.

7 Global Insight | August 2016
Digital disruption
The sector is our technical analyst’s favorite for new buying.
Most new tech companies are secular growers—meaning, they are caught up in long-term innovation trends that are separate from the economic cycle. We believe such companies deserve premium valuations because of their scarcity, especially since growth is more difficult to come by in this subpar economic environment.
Semi-toughTechnical indicators also point toward improved performance for the Tech sector. The bellwether semiconductor and internet industries recently broke out above previous resistance levels and seem likely to trade higher, in our view. The relative strength of semis is noteworthy because in the past such moves often led to or coincided with strength in the Tech sector as a whole and the broader U.S. equity market. RBC Wealth Management’s technical analyst believes “… a new wave of buying interest is starting to show up in some of the larger technology names, many of which are starting to break out of long trading ranges, and could be starting some longer-term uptrends. This is our favorite market sector for new buying …”
Potential bugs in the systemReasonable valuations and innovation trends don’t fully shield the sector from outside threats. At this stage, we are monitoring two potential risks for the sector:
• Global IP growth – If global industrial production (IP) slows down, mature cyclically-oriented old tech companies and some transitional tech firms that are leveraged to the economic cycle may have more difficultly growing.
• Dollar strength – Sources of revenue for the U.S. Tech sector are among the most geographically diverse of all sectors, so another period of dollar strength would negatively impact U.S. Tech earnings, mostly due to adverse currency “translation effects.”
Have a byteIn our view, despite the potential headwinds, innovation trends combined with reasonable valuations and attractive growth prospects amid this sluggish economic environment are compelling reasons to overweight the U.S. Tech sector in portfolios. We believe the innovation wave has the sector well positioned to help lead the S&P 500 in the next year or longer. We regard U.S. Tech as a timely overweight opportunity for inclusion in U.S. and global portfolios, and view new tech as the most attractive category for long-term investors.
Tech & S&P 500 P/E ratios based on 12-month forward earnings
18.6
15.8
17.918.4
Technology sector S&P 500
Long-term Current
Source - RBC Wealth Management, Bloomberg; “Current” data represents 8/1/16; long-term is quarterly data back to Q1 1990
Price-to-earnings growth ratios (PEG) based on next 12 months forecasts
1.52.0 2.2 2.2
3.0
New
tech
Tech
sect
or
Old
tech
S&
P50
0
Tran
siti
onal
tech
RBC Capital Markets, Thomson Financial, FactSet; data based on consensus forecasts on 6/20/16

8 Global Insight | August 2016
Global equity
Equity views
Source - RBC Wealth Management
Jim Allworth Vancouver, Canada
Kelly Bogdanov San Francisco, United States
Patrick McAllisterToronto, Canada
Frédérique Carrier London, United Kingdom [email protected]
Yufei Yang Hong Kong, China [email protected]
So far, Brexit’s impact on equity markets has been a two-day “flash in the pan”—especially when we look at markets in local currency terms. For example, in London the FTSE All-Share Index rallied strongly off its Brexit low and currently stands 5% ahead of where it was the day of the vote. But over that same interval, the pound collapsed to 30-year lows. That leaves the FTSE All-Share down 8% in dollar terms. Looked at the same way, European stocks are almost 4% lower, Canada’s TSX is flat, and the S&P 500 is up 2.5%.
More importantly, the Brexit result has dimmed what was already a tepid outlook for global economic growth. Most of this comes from slower growth on the Continent and a likely (mild) recession in the U.K. But the disappointing first estimate of U.S. Q2 GDP growth has cast an additional pall over global economic prospects.
Earnings expectations, already down from more optimistic levels earlier in the year, may erode further. As a consequence, the advance in equity prices has now pushed the price-to-earnings (P/E) ratios of most developed markets up to more expensive levels.
P/E ratios could still go higher: in fact, we believe they are likely to if corporate bond yields drop further. But any stock market advance that builds from here is unlikely to be a tide that lifts all boats. Rather, we expect investors to focus increasingly on sectors and individual businesses that appear capable of delivering worthwhile sales and earnings growth—a tall order in a slower growth world. The Digital disruption article on page 4 focuses on one such secular growth sector—Technology—and specifically on one category, so-called “new tech.”
Follow the leaders
Region Current
Global –
United States =
Canada +
Continental Europe –
United Kingdom –
Asia (ex-Japan) =
Japan =
This is not a “sector rotation” story—i.e., head to the sectors that typically do well in this part of the cycle—but rather a “head to high conviction sales and earnings growth” environment. Only companies that deliver on growth will continue to command investor favour. Unless global economic growth meaningfully reaccelerates, we would look for a gradual narrowing of market leadership and a market P/E ratio that moves higher amid a combination of much more extravagant multiples accorded those companies investors anoint as proven growers, those with “the right stuff,” and much less vibrant valuations for everyone else.
For a global equity portfolio, we believe a modest Underweight in equities is appropriate. This stems mostly from our concerns about the long period of policy uncertainty facing the EU and U.K. economies. This is not a call for investors to shift into a highly defensive stance. As long as no U.S. recession or renewed global economic contraction is in sight, and we don’t think either is, then, in our opinion, equities can be given the benefit of the doubt and are likely to be the best-performing asset class. However, it is very much a call for selectivity where a focus on businesses that can thrive despite the shallow global growth trajectory is likely to be rewarded disproportionately.

9 Global Insight | August 2016
Global equity
Regional highlightsUnited States• After trading in a sideways range for
more than two years, the S&P 500 broke out to a new all-time high in July. This is encouraging because such a move has historically resulted in additional gains. Since 1954, on the 12 previous occasions that it took the S&P 500 one year or more to reach a new peak, the market rose 92% of the time 12 months later. The average gain was 12%, not including dividends.
• There are also fundamental reasons to believe the market could work its way higher over the next year. The worst of the “earnings recession” seems to be over as Energy sector losses have been the main culprit holding back S&P 500 earnings. Those losses should diminish substantially in Q3 and the sector could move into the black in Q4. This would likely push S&P 500 earnings growth to the mid-single-digit range or better for the first time since Q4 2014.
• If the bull market persists as we expect it will, strong secular and stable growth companies should reassert their leadership roles. The Information Technology sector seems particularly well positioned. We also favor the Consumer Discretionary and Consumer Staples sectors. Furthermore, small-cap stocks are attractive for investors with above-average risk tolerances.
Canada• We maintain our Overweight
recommendation in Canadian equities due to our constructive outlook for key sectors. We believe earnings expectations for banks have troughed; the Energy sector should benefit from further rebalancing in the crude oil market while heightened geopolitical uncertainty creates a favorable backdrop for the gold sector.
• The Canadian banks are trading at a price-to-earnings valuation roughly in line with the long-term average. While industry headwinds suggest limited prospects for valuation expansion, we believe subdued earnings expectations and historically attractive dividend yields offer reasonable value.
• The rail industry has been mired in a protracted period of weak demand since 2014’s record volumes. In response, management teams have taken action to rationalize costs. As a result, any eventual return of volume growth could translate into substantial earnings growth.
• RBC Capital Markets’ latest WTI crude oil forecast calls for an average price of $59 per barrel in 2017, a 31% increase over the 2016 forecast of $45. Historically, the S&P/TSX has outperformed the S&P 500 in years when crude oil prices have increased 10% or more.
• Global geopolitical and economic uncertainties coupled with ongoing monetary stimulus provide a strong case for gold exposure. We expect precious metal producer share prices to remain highly sensitive to the price of the underlying commodity and would be selective with our entry point for investors looking to add exposure.
Continental Europe & U.K.• The FTSE All-Share Index is now
above its pre-EU referendum level in local currency (GBP) terms. This resilient performance can be explained by three factors. First, markets have reacted to the faster-than-expected transition to a new prime minister, which removed one layer of political uncertainty. Second, the anticipation of supportive action from the Bank of England has helped to stabilize sentiment. Third, many large companies, most of which are

10 Global Insight | August 2016
Global equity
exporters, have benefitted from the steep decline of the local currency (-12%).
• Yet, the ambiguity regarding the U.K.’s future position in the EU, its largest export partner, remains acute and is affecting hiring and investment decisions, as illustrated by the recent flash Composite PMI, which fell into contractionary territory (47.7).
• Our bias remains towards large-cap, non-cyclical companies with diversified international exposure. Opportunities in the embattled domestic cyclical sector may appear, though it is still too early, in our view. We continue to be cautious of the banking sector, which will likely suffer in the lower-for-longer interest rate environment.
• By contrast, European economic indicators are holding up well for now. The weakening euro may give a much needed tailwind to meagre earnings expectations, currently below 2%. With a very heavy political agenda over the next 15 months, and a banking sector challenged by negative interest rates and crippling nonperforming loans (Italy), we find other regions more attractive.
Asia• Asian markets continued to rebound
after the initial selloff following
the Brexit result. The MSCI AC Asia Pacific Index pared all losses in 2016.
• Japanese stocks led the rally in July thanks to the yen weakening to 106 per dollar. Expectations that Prime Minister Shinzo Abe would come up with major fiscal stimulus grew after the ruling Liberal Democratic Party scored a convincing victory in Japan’s Upper House election. In June, Abe delayed the planned sales tax hike and pledged to take “bold” measures to support the economy. Japan’s TOPIX Index is trading at a price-to-book multiple of 1.14x.
• China’s economy continued to steady. GDP grew 6.7% in Q2, in line with the Q1 reading and slightly better than the 6.6% consensus forecast. Both industrial output and retail sales came in better than expected. Consumer spending remained resilient. Fixed asset investment slowed to 9% as property investment eased from the April peak.
• The yuan came under pressure after the Brexit vote. Both onshore and offshore RMB weakened to around 6.7 per dollar. However, the depreciation didn’t lead to significant capital outflow like that seen at the end of 2015 and the beginning of 2016. China’s foreign exchange reserves rose by $13.5B in June.
Performance of select equity indexes since May
-25%
-20%
-15%
-10%
-5%
0%
5%
10%
May 1 May 16 May 31 Jun 15 Jun 30 Jul 15
U.K. FTSE All-Share
MSCI World
STOXX Europe 600
STOXX Europe 600 Banks
Source - RBC Wealth Management, Bloomberg; data through 7/28/16
European banks have been hit hard by Brexit while the U.K. has recovered.

11 Global Insight | August 2016
Global fixed income
Sovereign yield curves
Source - Bloomberg
0.0%
0.5%
1.0%
1.5%
2.0%
2.5%
1Yr 5Yr 9Yr 13Yr 17Yr 21Yr 25Yr 29Yr
U.S.
Canada
U.K.
Fixed income markets should remain relatively calm through August after a tumultuous period of volatility in the first six weeks of summer. With the exception of the Bank of England, which will convene on August 4, most central banks will not hold regular policy meetings again until September. That barren central bank calendar combined with direction provided at July meetings leaves few catalysts for government bond markets on the near-term horizon. The welcome respite will likely prove brief as we expect September to be a fairly volatile month.
The Bank of England signaled at its July policy meeting, the first after the Brexit referendum, that stimulus was likely coming in August. In addition to a prospective cut to its benchmark interest rate, the BoE plans to share its near-term outlook for growth and inflation at its August meeting. Over the medium term, investors will be keenly attuned to inflation data given the steep decline of the British pound will likely prove inflationary, perhaps limiting the scope of growth-inducing monetary stimulus.
We remain constructive but increasingly selective on corporate credit. The summer doldrums are likely to take hold this month in credit markets after a very healthy month of new supply in July. Expectations for prolonged accommodation from major central banks continued to feed a thirst for yield in July, pushing spreads to the tightest levels of 2016 in many sectors.
Regional highlightsUnited States• The Fed held policy steady at the July
FOMC meeting but noted that near-term risks to its economic outlook
The eye of the storm
-0.40
3.85
0.25
-0.50
0.50
0.75
-0.10
4.35*
0.50
0.00
0.50
0.25
China
U.K.
Eurozone
Canada
U.S.
07/29/16 1 Year Out
Japan
*1-yr base lending rate for working capital, PBoC Source - RBC Investment Strategy Committee, RBC Capital Markets, Global Portfolio Advisory Committee, Consensus Economics
Central bank rate (%)
Rajan Bansi Toronto, Canada | [email protected]
Tom GarretsonMinneapolis, United States
Alana Awad Toronto, Canada [email protected]
Christopher Girdler London, United Kingdom [email protected]
have diminished. We continue to believe a rate hike will not come before 2017. The Fed is likely to exhibit caution given the full impact of Brexit remains uncertain. Inflation has yet to move convincingly toward the Fed’s 2% target, which is also likely to support the Fed’s inclination to stand pat.
• Credit spreads tightened sharply in July to the lowest levels in over a year. The high-yield market led the way with particular strength in the energy sector despite a sharp decline in oil prices to $42 from the $50 level achieved in June. While we continue to believe that the U.S. credit markets will perform well over a medium-term horizon, we would exercise caution at this point when putting new money to work given the magnitude of the rally to date.
• The global hunt for yield has driven valuations in the $25 par preferred share market to extreme levels, in our view. The $1,000 par fixed-to-float market has not participated to the same extent, and we see opportunities for investors to swap out of $25 par holdings and into $1,000 par securities of the same issuer and with similar structures, but with more attractive yield-to-calls.

12 Global Insight | August 2016
Global fixed income
Yields rebound post-Brexit
-0.5%
0.0%
0.5%
1.0%
1.5%
2.0%
2.5%
Jan '16 Feb '16 Mar '16 Apr '16 May '16 Jun '16 Jul '16
United States 10Y
United Kingdom 10Y
Germany 10Y
Brexit
Source - RBC Wealth Management, Bloomberg; data through 7/29/16
Global yields have stabilized as near-term Brexit concerns have eased, but long-term questions should keep yields contained.
Canada• The Canadian preferred share market
rallied 2.6% during July. We believe that preferred shares continue to offer the best relative yield of the CAD investment-grade options. The yield that investors currently earn on preferred shares presents a better risk-return profile than we believe exists in the corporate bond market.
• Canadian government bonds in the 1- to 10-year range held up better than comparable U.S. issues in July as the latter sold off in response to stronger domestic economic data. With the Brexit result now in the rear view mirror, we anticipate the theme of monetary policy divergence between Canada and the U.S. to be the primary driver of government bond yields. That said, market activity is likely to be to be muted given expectations for future rate hikes have been pushed out until 2017.
Continental Europe & U.K.• The U.K.’s decision to leave the
EU continued to affect European fixed income markets through July. Uncertainty has kept Gilt yields at depressed levels, a situation that we expect to linger for some time.
Despite a recent move higher, the 10-year Gilt yield is 50 basis points lower than it was pre-Brexit, sitting at 0.88%. We struggle to find a catalyst to take yields higher in the U.K., particularly over the short term where additional loosening of monetary policy is expected.
• Investors in European government bonds have largely written off any effect of Brexit. Peripheral country spreads have fully recovered and German bund yields are back to pre-Brexit levels around 0%. While these yield levels seem perplexing, the European Central Bank’s (ECB) bond purchase programs should keep European yields anchored. Providing inflation expectations remain low and growth tepid, the ECB would not surprise were it to introduce further easing measures over the summer months. As such, we remain comfortable taking duration risk.
• European credit has seen a strong recovery rally since the initial shock of Brexit. U.K. corporates retain a Brexit premium and we expect this to remain, particularly in financials and retail names. Valuations are catching our attention, but we fail to find them appropriate for conservative fixed income investors.
* Under review ** Eurozone utilizes German Bunds Source - RBC Investment Strategy Committee, RBC Capital Markets, Global Portfolio Advisory Committee
10-year rate (%)
0.00*
NA
1.75*
0.50*
1.35*
2.25*
-0.11
2.79
0.68
-0.12
1.03
1.45
Japan
China
U.K.
Eurozone**
Canada
U.S.
07/29/16 1 Year Out

13 Global Insight | August 2016
Commodities
Mark Allen Toronto, Canada [email protected]
The golden bull
Global gold equity cost structure
$400
$600
$800
$1,000
$1,200
$1,400
$1,600
$1,800
2007 2008 2009 2010 2011 2012 2013 2014 2015 2016E
Cash costsSustaining capitalG&AExplorationGrowth capexCorporate taxesInterest expense
Average gold price Recent spot price: $1,320/oz
Source - RBC Capital Markets, RBC Wealth Management; data as of 7/26/16
High industry costs have led to a substantial jump higher in cash margins as the price of gold has increased from $1,100/oz. to over $1,300/oz.
There are many reasons to look favorably on gold. Low and negative bond yields offer investors limited opportunity in fixed income. After a long, multi-year run in U.S. equities, valuations are now somewhat above historical averages. Growth data from the world’s two-largest economies—the U.S. and China—have been choppy over the past year. Aggressive monetary policy and high sovereign debt burdens around the world have reduced the dry powder available for the next period economic slowdown. Finally, the recent vote by the British to exit the E.U. has weighed on the outlook for Europe.
With this macroeconomic backdrop and amid equity market volatility, investors have turned to gold as a safe haven this year. This trend has been reflected in a resurgence of gold ETF holdings and a spiking of speculative long positions in gold on the COMEX.
While the price of gold has moved up significantly, from about $1,100/oz. at the beginning of the year to over $1,300/oz. recently, gold equities have risen much further than bullion with the VanEck Vectors Gold Miners ETF roughly doubling year to date. The pronounced difference in performance can be explained by the operating leverage in the industry. Looking at the
top nine gold miners, production costs, including corporate overhead and select capital expenditures, are estimated at about $1,150/oz. this year (see chart). With a cost base this high, the cash margin for the industry has expanded dramatically as gold prices have risen, hence delivering a substantial run in gold equities. In a recent publication, RBC Capital Markets estimated that Tier I (large cap) and Tier II (mid cap) producers were discounting gold prices on average that were largely in line with spot gold at levels just over $1,300/oz.
Strong demand for gold reinforced by recent fund flows in the investment realm, and more constrained mine supply growth provide fundamental supports. The Brexit result has introduced more geopolitical and economic uncertainty for a major trading block. We think Brexit is also likely to lead the Federal Reserve to a lower-for-longer tilt on interest rates, which may attenuate future appreciation of the U.S. dollar. Low and negative bond yields, significant appreciation of U.S. equities in recent years, and economic and geopolitical uncertainty all provide solid arguments for gold as portfolio ballast, in our opinion. We would expect this environment to provide continued support to the price of gold going forward.
2016E 2017E
Oil (WTI $/bbl) 45.00 59.00
Natural Gas ($/mmBtu) 2.40 3.00
Gold ($/oz) 1,250 1,500
Copper ($/lb) 2.10 2.25
Corn ($/bu) 3.86 3.92
Wheat ($/bu) 4.65 5.00
Source - RBC Capital Markets forecasts (oil, natural gas, gold, and copper), Bloomberg consensus forecasts (corn and wheat)
Commodity forecasts

14 Global Insight | August 2016
Currencies
U.S. dollarThe dollar continued to strengthen throughout early July, maintaining its post-Brexit gains when measured on a holistic basis. After recent weakness in U.S. data, signs of a rebound in Q2, including a healthy payroll report and retail sales, had helped to underpin the move. Despite this, a weaker GDP report at the end of the month resulted in a decline for the greenback, with the dollar surrendering some of its gains. While the jury may be out on the chances of Fed rate hikes this year, several Fed speakers have been quick to remind markets of the potential for a rate hike, and we maintain our bullish outlook for the dollar.
EuroThe single currency has been gradually moving lower the past month due to a confluence of factors. Much hinges on whether the European Central Bank delivers changes to its quantitative easing programme should post-Brexit data suggest the euro area economy needs greater stimulus. With low inflation, political uncertainty, and lower global growth, we remain strategically bearish on the EUR.
British poundSterling has remained at depressed levels after the U.K. referendum result led to a sudden, sharp decline. As highlighted last month, we moved to a negative outlook for the pound, but
The Brexit impact on sterling immediately apparentGBP/USD
1.25
1.35
1.45
1.55
1.65
Aug '15 Nov '15 Feb '16 May '16
Source - Bloomberg, RBC Wealth Management; data through 7/29/16
Velocity of downturn dependent on severity of decline in economic activity.
Paul Bowman London, United Kingdom [email protected]
Currency Current Forecastpair rate Sep 2017 Change*
Major currencies
USD Index 95.53 100.59 5%
CAD/USD 0.77 0.77 0%
USD/CAD 1.30 1.30 0%
EUR/USD 1.12 1.03 -8%
GBP/USD 1.32 1.20 -9%
USD/CHF 0.97 1.06 9%
USD/JPY 102.06 95.00 -7%
AUD/USD 0.76 0.67 -12%
NZD/USD 0.72 0.59 -18%
EUR/JPY 114.06 98.00 -14%
EUR/GBP 0.84 0.86 2%
EUR/CHF 1.08 1.09 1%
Emerging currencies
USD/CNY 6.64 7.40 11%
USD/INR 67.00 72.00 7%
USD/SGD 1.34 1.58 18%
USD/PLN 3.90 4.08 5%
* Defined as the implied appreciation or depreciation of the first currency in the pair quote. Examples of how to interpret data found in the Market Scorecard. Source - RBC Capital Markets, Bloomberg
Currency forecasts
the key to the velocity of any further decline will depend on the immediate economic impacts of the Brexit vote, as well as the process and speed of trade negotiations. On the former, we will need to wait until August/September for first indications, while on the latter the wait may be much longer.
Canadian dollarA more positive-than-expected statement from the Bank of Canada has caused markets to pare back expectations of a future rate cut and kept the currency well supported. However, this move has been somewhat muted against the backdrop of a stronger USD. Partner this central bank optimism with RBC Capital Markets’ forecast for a further rally in oil prices and we remain comfortable with our modestly bullish view.
Japanese yenThe yen rallied very strongly as investors sought safe havens following the U.K.’s shock referendum result. USD/JPY dipped below 100 for the first time since 2013. Since then, speculation about potential coordinated fiscal and monetary easing has seen the yen aggressively trade in a broad 100–107 range. Despite a considerable amount of volatility between last month and now, we still struggle to find real direction amongst all the noise, and would remain vigilant in managing yen exposure during this difficult period.

15 Global Insight | August 2016
Source - RBC Investment Strategy Committee, RBC Capital Markets, Global Portfolio Advisory Committee
Key forecasts
Canada — in transition• Q1 growth improved to 2.5%. Q2 likely much weaker.
Fort McMurray fires a big drag, should reverse in Q3. House construction firm, PMI off its high, but steady. Energy capex weak. Consumer attitude restrained by resource sector weakness. Mfg. sales ex-petroleum products growing consistently, as are exports including services and tourism all helped by weak loonie.
Eurozone — plateauing• Q2 growth slowed to 1.7% in Q2. Germany and Spain
solid. France and Italy fading after a better Q1. Bank loans to private sector up year over year. PMIs still in expansion zone. New orders weaker. Fractious politics, Brexit weighing on consumer and business sentiment. Tourism bookings down sharply. Italian banks keeping ECB ultra loose. GDP growth to hold steady in 2016 and 2017.
United Kingdom — weakening• Q2 GDP improved ahead of Brexit vote. However,
PMIs, new orders slumped into contraction territory in July. Construction weak as is business confidence. Important services sector also affected. Employment firmer prior to vote as were household earnings.
• Mild recession expected in 2nd half. Economy likely to underperform as EU uncertainty takes a toll.
China — slowing• Q2 firm, GDP now at +6.7% y/y. Domestic loan growth
distorted lately by paydown of U.S. dollar debt, but loans still growing faster than GDP. PMIs and new orders improved in July. Services sector PMI also strengthening. Employment, wages, retail sales all growing, but somewhat more slowly. Exports, industrial production, mfg. output all steady in June.
• Fixed asset investment slowing. Currency weaker. House prices higher year over year in major centers.
Japan — conflicted, still weak• GDP growth regained positive territory in Q1, but barely
positive over 12 mos. Leading indicators and mfg. PMI have ticked higher, services somewhat weaker. Corporate earnings solid, but business confidence weak.
• Wages growing, but household spending weak. Low oil prices, strong currency putting inflation targets in jeopardy. Planned sales tax increase has been put off until 2018, new fiscal package announced.
United States — sustained growth• Q2 GDP growth a disappointing 1.2% largely due to
continued inventory liquidation. Mfg. new orders and production expanding faster. Consumer balance sheets, income growth, employment, confidence all strong. Spending up 4.2% in Q2, saving solid. Housing steady, permits higher. Capex soft, exports weak. Leading indicators, confidence point to sustained, albeit slow, domestic growth.
2.4% 2.4%1.8% 2.0%
1.6% 0.1% 1.3% 2.0%
2014 2015 2016E 2017E
2014 2015Real GDP Growth Inflation Rate
2.4%
1.2%1.5% 1.8%1.9%
1.1%
2.0% 2.3%
2014 2015 2016E 2017E
2.5% 2.2%
1.2% 1.2%1.5% 0.1%1.0%
2.0%
2014 2015 2016E 2017E
7.4% 6.9%6.3%
5.8%
2.0% 1.5%2.3% 2.3%
2014 2015 2016E 2017E
0.8%1.5% 1.5% 1.5%
0.4% 0.3% 0.5%
1.5%
2014 2015 2016E 2017E
0.0%0.5% 0.0%
1.0%
2.8%
0.8% 0.5%1.3%
2014 2015 2016E 2017E
Forecasts are under review.

16 Global Insight | August 2016
Index (local currency) Level 1 Month YTD 12 Month
S&P 500 2,173.60 3.6% 6.3% 3.3%
Dow Industrials (DJIA) 18,432.24 2.8% 5.8% 4.2%
NASDAQ 5,162.13 6.6% 3.1% 0.7%
Russell 2000 1,219.94 5.9% 7.4% -1.5%
S&P/TSX Comp 14,582.74 3.7% 12.1% 0.8%
FTSE All-Share 3,653.83 3.9% 6.1% 0.0%
STOXX Europe 600 341.89 3.6% -6.5% -13.7%
German DAX 10,337.50 6.8% -3.8% -8.6%
Hang Seng 21,891.37 5.3% -0.1% -11.1%
Shanghai Comp 2,979.34 1.7% -15.8% -18.7%
Nikkei 225 16,569.27 6.4% -12.9% -19.5%
India Sensex 28,051.86 3.9% 7.4% -0.2%
Singapore Straits Times 2,868.69 1.0% -0.5% -10.4%
Brazil Ibovespa 57,308.21 11.2% 32.2% 12.7%
Mexican Bolsa IPC 46,660.67 1.5% 8.6% 4.3%
Bond Yields 7/29/16 6/30/16 7/31/15 12 mo chg
US 2-Yr Tsy 0.655% 0.582% 0.661% -0.01%
US 10-Yr Tsy 1.453% 1.470% 2.180% -0.73%
Canada 2-Yr 0.540% 0.518% 0.409% 0.13%
Canada 10-Yr 1.027% 1.061% 1.441% -0.41%
UK 2-Yr 0.110% 0.099% 0.568% -0.46%
UK 10-Yr 0.685% 0.867% 1.882% -1.20%
Germany 2-Yr -0.625% -0.661% -0.232% -0.39%
Germany 10-Yr -0.119% -0.130% 0.644% -0.76%
Commodities (USD) Price 1 Month YTD 12 Month
Gold (spot $/oz) 1,351.00 2.2% 27.3% 23.3%
Silver (spot $/oz) 20.34 8.7% 46.8% 37.6%
Copper ($/metric ton) 4,915.25 1.6% 4.5% -5.9%
Uranium ($/lb) 25.00 -7.4% -27.3% -30.6%
Oil (WTI spot/bbl) 41.60 -13.9% 12.3% -11.7%
Oil (Brent spot/bbl) 42.46 -14.5% 13.9% -18.7%
Natural Gas ($/mmBtu) 2.88 -1.6% 23.1% 5.9%
Agriculture Index 290.17 -6.5% 2.3% 1.5%
Currencies Rate 1 Month YTD 12 Month
US Dollar Index 95.53 -0.6% -3.1% -1.9%
CAD/USD 0.77 -0.9% 6.1% 0.3%
USD/CAD 1.30 0.8% -5.8% -0.5%
EUR/USD 1.12 0.6% 2.9% 1.7%
GBP/USD 1.32 -0.6% -10.2% -15.3%
AUD/USD 0.76 1.9% 4.3% 3.9%
USD/CHF 0.97 -0.7% -3.3% 0.3%
USD/JPY 102.06 -1.1% -15.1% -17.6%
EUR/JPY 114.06 -0.5% -12.7% -16.2%
EUR/GBP 0.84 1.2% 14.6% 20.1%
EUR/CHF 1.08 -0.1% -0.5% 2.0%
USD/SGD 1.34 -0.6% -5.6% -2.4%
USD/CNY 6.64 -0.2% 2.2% 6.8%
USD/BRL 3.25 1.1% -18.0% -5.0%
Equity returns do not include dividends, except for the German DAX. Equity performance and bond yields in local currencies. U.S. Dollar Index measures USD vs. six major currencies. Currency rates reflect market convention (CAD/USD is the exception). Currency returns quoted in terms of the first currency in each pairing. Examples of how to interpret currency data: CAD/USD 0.77 means 1 Canadian dollar will buy 0.77 U.S. dollar. CAD/USD -0.3% return means the Canadian dollar has fallen 0.3% vs. the U.S. dollar during the past 12 months. USD/JPY 102.06 means 1 U.S. dollar will buy 102.06 yen. USD/JPY -17.6% return means the U.S. dollar has fallen 17.6% vs. the yen during the past 12 months.
Source - RBC Wealth Management, RBC Capital Markets, Bloomberg; data through 7/29/16.
Equities bounced sharply following the Brexit lows. Canadian market far exceeding peers year to date.
Oil corrected as U.S. supply discipline came into question.
Despite initial Brexit gains, the Dollar Index ended July lower due to the weak U.S. Q2 GDP report
Market scorecard
Though the BoE chose not to cut rates in July, expectations it will in August dragged yields to new lows.

17 Global Insight | August 2016
Research resourcesThis document is produced by the Global Portfolio Advisory Committee within RBC Wealth Management’s Portfolio Advisory Group. The RBC Wealth Management Portfolio Advisory Group provides support related to asset allocation and portfolio construction for the firm’s investment advisors / financial advisors who are engaged in assembling portfolios incorporating individual marketable securities. The Committee leverages the broad market outlook as developed by the RBC Investment Strategy Committee, providing additional tactical and thematic support utilizing research from the RBC Investment Strategy Committee, RBC Capital Markets, and third-party resources.
Global Portfolio Advisory Committee members:
Jim Allworth – Co-chair; Investment Strategist, RBC Dominion Securities Inc.
Rajan Bansi – Co-chair; Head of Fixed Income Strategies, RBC Wealth Management Portfolio Advisory Group, RBC Dominion Securities Inc.
Mark Allen – Portfolio Advisor, RBC Wealth Management Portfolio Advisory Group, RBC Dominion Securities Inc.
Alana Awad – Fixed Income Portfolio Advisor, RBC Dominion Securities Inc.
Craig Bishop – Lead Strategist, U.S. Fixed Income Strategies Group, RBC Wealth Management Portfolio Advisory Group, RBC Capital Markets, LLC
Mark Bayko – Head, Multi-Asset Portfolios & Practice Management, RBC Dominion Securities Inc.
Kelly Bogdanov – Portfolio Analyst, RBC Wealth Management Portfolio Advisory Group, RBC Capital Markets, LLC
Paul Bowman – Director, Head of Structured Solutions and FX Strategy, Royal Bank of Canada Investment Management (U.K.) Ltd.
Frédérique Carrier – Director, Head of Equities, Royal Bank of Canada Investment Management (U.K.) Ltd.
Jean-François Dion – Head, Equity Portfolio Management, RBC Dominion Securities Inc.
Janet Engels – Head of U.S. Equities, RBC Wealth Management Portfolio Advisory Group, RBC Capital Markets, LLC
Hakan Enoksson – Head of Fixed Income - British Isles, Royal Bank of Canada Investment Management (U.K.) Ltd.
Tom Garretson – Fixed Income Portfolio Advisor, RBC Capital Markets, LLC
Christopher Girdler – Fixed Income Portfolio Manager/Strategist, Royal Bank of Canada Investment Management (U.K.) Ltd.
Patrick McAllister – Canadian Equities Portfolio Advisor, RBC Dominion Securities Inc.
Jay Roberts – Head of Investment Solutions & Products, Wealth Management Hong Kong, RBC Dominion Securities Inc.
The RBC Investment Strategy Committee (RISC), consists of senior investment professionals drawn from individual, client-focused business units within RBC, including the Portfolio Advisory Group. The RBC Investment Strategy Committee builds a broad global investment outlook and develops specific guidelines that can be used to manage portfolios. RISC is chaired by Daniel Chornous, CFA, Chief Investment Officer of RBC Global Asset Management Inc.
Additional Global Insight authors
Yufei Yang, RBC Dominion Securities Inc.

18 Global Insight | August 2016
Required disclosuresAnalyst Certification All of the views expressed in this report accurately reflect the personal views of the responsible analyst(s) about any and all of the subject securities or issuers. No part of the compensation of the responsible analyst(s) named herein is, or will be, directly or indirectly, related to the specific recommenda-tions or views expressed by the responsible analyst(s) in this report.
Important DisclosuresIn the U.S., RBC Wealth Management operates as a division of RBC Capital Markets, LLC. In Canada, RBC Wealth Management includes, without limita-tion, RBC Dominion Securities Inc., which is a foreign affiliate of RBC Capital Markets, LLC. This report has been prepared by RBC Capital Markets, LLC which is an indirect wholly-owned subsidiary of the Royal Bank of Canada and, as such, is a related issuer of Royal Bank of Canada.
Non-U.S. Analyst Disclosure: Mark Allen, Jim Allworth, Alana Awad, Rajan Bansi, Mark Bayko, Jean-François Dion, Dominick Hardy, Patrick McAllister, Jay Roberts, Joseph Wu, and Yufei Yang, employees of RBC Wealth Manage-ment USA’s foreign affiliate RBC Dominion Securities Inc.; and Frédérique Carrier, Hakan Enoksson, Christopher Girdler, Paul Bowman, employees of RBC Wealth Management USA’s foreign affiliate Royal Bank of Canada Invest-ment Management (UK) Limited; contributed to the preparation of this publi-cation. These individuals are not registered with or qualified as research analysts with the U.S. Financial Industry Regulatory Authority (“FINRA”) and, since they are not associated persons of RBC Wealth Management, they may not be subject to FINRA Rule 2241 governing communications with subject companies, the making of public appearances, and the trading of securities in accounts held by research analysts.
In the event that this is a compendium report (covers six or more compa-nies), RBC Wealth Management may choose to provide important disclosure information by reference. To access current disclosures, clients should refer to http://www.rbccm.com/GLDisclosure/PublicWeb/DisclosureLookup.aspx?EntityID=2 to view disclosures regarding RBC Wealth Management and its affiliated firms. Such information is also available upon request to RBC Wealth Management Publishing, 60 South Sixth St, Minneapolis, MN 55402.
References to a Recommended List in the recommendation history chart may include one or more recommended lists or model portfolios maintained by RBC Wealth Management or one of its affiliates. RBC Wealth Management recommended lists include the Guided Portfolio: Prime Income (RL 6), the Guided Portfolio: Dividend Growth (RL 8), and the Guided Portfolio: ADR (RL 10), and former lists called the Guided Portfolio: Large Cap (RL 7), the Guided Portfolio: Midcap 111 (RL 9), and the Guided Portfolio: Global Equity (U.S.) (RL 11). RBC Capital Markets recommended lists include the Strategy Focus List and the Fundamental Equity Weightings (FEW) portfolios. The abbreviation ‘RL On’ means the date a security was placed on a Recommended List. The abbreviation ‘RL Off’ means the date a security was removed from a Recommended List.
and Underperform (U) most closely correspond to Buy, Hold/Neutral and Sell, respectively, the meanings are not the same because our ratings are determined on a relative basis (as described below).
Explanation of RBC Capital Markets, LLC Equity Rating SystemAn analyst’s “sector” is the universe of companies for which the analyst provides research coverage. Accordingly, the rating assigned to a particular stock represents solely the analyst’s view of how that stock will perform over the next 12 months relative to the analyst’s sector average. Although RBC Capital Markets, LLC ratings of Top Pick (TP)/Outperform (O), Sector Perform (SP), and Underperform (U) most closely correspond to Buy, Hold/Neutral and Sell, respectively, the meanings are not the same because our ratings are determined on a relative basis (as described below).
Ratings: Top Pick (TP): Represents analyst’s best idea in the sector; expected to provide significant absolute total return over 12 months with a favorable risk-reward ratio. Outperform (O): Expected to materially outperform sector average over 12 months. Sector Perform (SP): Returns expected to be in line with sector average over 12 months. Underperform (U): Returns expected to be materially below sector average over 12 months.
Risk Rating: As of March 31, 2013, RBC Capital Markets, LLC suspends its Average and Above Average risk ratings. The Speculative risk rating reflects a security’s lower level of financial or operating predictability, illiquid share trading volumes, high balance sheet leverage, or limited operating history that result in a higher expectation of financial and/or stock price volatility.
Valuation and Price Target ImpedimentsWhen RBC Wealth Management assigns a value to a company in a research report, FINRA Rules and NYSE Rules (as incorporated into the FINRA Rulebook) require that the basis for the valuation and the impediments to obtaining that valuation be described. Where applicable, this information is included in the text of our research in the sections entitled “Valuation” and “Price Target Impediment”, respectively.
The analyst(s) responsible for preparing this research report received com-pensation that is based upon various factors, including total revenues of RBC Capital Markets, LLC, and its affiliates, a portion of which are or have been generated by investment banking activities of the member companies of RBC Capital Markets, LLC and its affiliates.
Other DisclosuresPrepared with the assistance of our national research sources. RBC Wealth Management prepared this report and takes sole responsibility for its content and distribution. The content may have been based, at least in part, on material provided by our third-party correspondent research services. Our third-party correspondent has given RBC Wealth Management general permis-sion to use its research reports as source materials, but has not reviewed or approved this report, nor has it been informed of its publication. Our third-party correspondent may from time to time have long or short positions in, effect transactions in, and make markets in securities referred to herein. Our third-party correspondent may from time to time perform investment banking or other services for, or solicit investment banking or other business from, any company mentioned in this report.
RBC Wealth Management endeavors to make all reasonable efforts to provide research simultaneously to all eligible clients, having regard to local time zones in overseas jurisdictions. In certain investment advisory accounts, RBC Wealth Management will act as overlay manager for our clients and will initiate transactions in the securities referenced herein for those accounts upon receipt of this report. These transactions may occur before or after your receipt of this report and may have a short-term impact on the market price of the securities in which transactions occur. RBC Wealth Management research is posted to our proprietary Web sites to ensure eligible clients receive coverage initiations and changes in rating, targets, and opinions in a timely
As of June 30, 2016
Rating Count Percent Count PercentBuy [Top Pick & Outperform] 878 50.51 246 28.02Hold [Sector Perform] 741 42.64 129 17.41Sell [Underperform] 119 6.85 10 8.40
Investment Banking Serv ices Prov ided During Past 12 Months
Distribution of Ratings - RBC Capital Markets, LLC Equity Research
Distribution of RatingsFor the purpose of ratings distributions, regulatory rules require member firms to assign ratings to one of three rating categories - Buy, Hold/Neutral, or Sell - regardless of a firm’s own rating categories. Although RBC Capital Markets, LLC ratings of Top Pick (TP)/Outperform (O), Sector Perform (SP)

19 Global Insight | August 2016
manner. Additional distribution may be done by sales personnel via e-mail, fax, or regular mail. Clients may also receive our research via third-party vendors. Please contact your RBC Wealth Management Financial Advisor for more information regarding RBC Wealth Management research.
Conflicts Disclosure: RBC Wealth Management is registered with the Se-curities and Exchange Commission as a broker/dealer and an investment ad-viser, offering both brokerage and investment advisory services. RBC Wealth Management’s Policy for Managing Conflicts of Interest in Relation to Invest-ment Research is available from us on our Web site at http://www.rbccm.com/GLDisclosure/PublicWeb/DisclosureLookup.aspx?EntityID=2. Conflicts of interests related to our investment advisory business can be found in Part II of the Firm’s Form ADV or the Investment Advisor Group Disclosure Docu-ment. Copies of any of these documents are available upon request through your Financial Advisor. We reserve the right to amend or supplement this policy, Part II of the ADV, or Disclosure Document at any time.
The authors are employed by one of the following entities: RBC Wealth Management USA, a division of RBC Capital Markets, LLC, a securities broker-dealer with principal offices located in Minnesota and New York, USA; by RBC Dominion Securities Inc., a securities broker-dealer with principal offices located in Toronto, Canada; by RBC Investment Services (Asia) Limited, a subsidiary of RBC Dominion Securities Inc., a securities broker-dealer with principal offices located in Hong Kong, China; and by Royal Bank of Canada Investment Management (U.K.) Limited, an investment management com-pany with principal offices located in London, United Kingdom.
The Global Industry Classification Standard (“GICS”) was developed by and is the exclusive property and a service mark of MSCI Inc. (“MSCI”) and Standard & Poor’s Financial Services LLC (“S&P”) and is licensed for use by RBC. Neither MSCI, S&P, nor any other party involved in making or compiling the GICS or any GICS classifications makes any express or implied warranties or representations with respect to such standard or classification (or the results to be obtained by the use thereof), and all such parties hereby expressly disclaim all warranties of originality, accuracy, com-pleteness, merchantability and fitness for a particular purpose with respect to any of such standard or classification. Without limiting any of the foregoing, in no event shall MSCI, S&P, any of their affiliates or any third party involved in making or compiling the GICS or any GICS classifications have any liability for any direct, indirect, special, punitive, consequential or any other damages (including lost profits) even if notified of the possibility of such damages.
DisclaimerThe information contained in this report has been compiled by RBC Wealth Management, a division of RBC Capital Markets, LLC, from sources believed to be reliable, but no representation or warranty, express or implied, is made by Royal Bank of Canada, RBC Wealth Management, its affiliates or any other person as to its accuracy, completeness or correctness. All opinions and estimates contained in this report constitute RBC Wealth Management’s judgment as of the date of this report, are subject to change without notice and are provided in good faith but without legal responsibility. Past perfo rmance is not a guide to future performance, future returns are not guar-anteed, and a loss of original capital may occur. Every province in Canada, state in the U.S., and most countries throughout the world have their own laws regulating the types of securities and other investment products which may be offered to their residents, as well as the process for doing so. As a result, the securities discussed in this report may not be eligible for sale in some jurisdictions. This report is not, and under no circumstances should be construed as, a solicitation to act as securities broker or dealer in any jurisdiction by any person or company that is not legally permitted to carry on the business of a securities broker or dealer in that jurisdiction. Nothing in this report constitutes legal, accounting or tax advice or individually tailored investment advice. This material is prepared for general circulation to clients, including clients who are affiliates of Royal Bank of Canada, and does not have regard to the particular circumstances or needs of any specific person who may read it. The investments or services contained in this report may not be suitable for you and it is recommended that you consult an independent investment advisor if you are in doubt about the suitability of such investments or services. To the full extent permitted by law neither
Royal Bank of Canada nor any of its affiliates, nor any other person, accepts any liability whatsoever for any direct or consequential loss arising from any use of this report or the information contained herein. No matter contained in this document may be reproduced or copied by any means without the prior consent of Royal Bank of Canada. In the U.S., RBC Wealth Management oper-ates as a division of RBC Capital Markets, LLC. In Canada, RBC Wealth Manage-ment includes, without limitation, RBC Dominion Securities Inc., which is a foreign affiliate of RBC Capital Markets, LLC. This report has been prepared by RBC Capital Markets, LLC. Additional information is available upon request.
To U.S. Residents: This publication has been approved by RBC Capital Markets, LLC, Member NYSE/FINRA/SIPC, which is a U.S. registered broker-dealer and which accepts responsibility for this report and its dissemination in the United States. RBC Capital Markets, LLC, is an indirect wholly-owned subsidiary of the Royal Bank of Canada and, as such, is a related issuer of Royal Bank of Canada. Any U.S. recipient of this report that is not a registered broker-dealer or a bank acting in a broker or dealer capacity and that wishes further information regarding, or to effect any transaction in, any of the securi-ties discussed in this report, should contact and place orders with RBC Capital Markets, LLC. International investing involves risks not typically associated with U.S. investing, including currency fluctuation, foreign taxation, political instability and different accounting standards.
To Canadian Residents: This publication has been approved by RBC Dominion Securities Inc. RBC Dominion Securities Inc.* and Royal Bank of Canada are separate corporate entities which are affiliated. *Member-Canadian Investor Protection Fund. ®Registered trademark of Royal Bank of Canada. Used under license. RBC Wealth Management is a registered trademark of Royal Bank of Canada. Used under license.
RBC Wealth Management (British Isles): This publication is distributed by Royal Bank of Canada Investment Management (U.K.) Limited and RBC Invest-ment Solutions (CI) Limited. Royal Bank of Canada Investment Management (U.K.) Limited is authorised and regulated by the Financial Conduct Authority (Reference number: 146504). Registered office: Riverbank House, 2 Swan Lane , London, EC4R 3BF, UK. RBC Investment Solutions (CI) Limited is regulated by the Jersey Financial Services Commission in the conduct of investment business in Jersey. Registered office: Le Gallais Chambers, 54 Bath Street, St Helier, Jersey JE4 8YD, registered company number 119162.
To Hong Kong Residents: This publication is distributed in Hong Kong by Royal Bank of Canada, Hong Kong Branch which is regulated by the Hong Kong Monetary Authority and the Securities and Futures Commission (‘SFC’), RBC Investment Services (Asia) Limited and RBC Investment Management (Asia) Limited, both entities are regulated by the SFC. Financial Services provided to Australia: Financial services may be provided in Australia in accordance with applicable law. Financial services provided by the Royal Bank of Canada, Hong Kong Branch are provided pursuant to the Royal Bank of Canada’s Australian Financial Services Licence (‘AFSL’) (No. 246521).
To Singapore Residents: This publication is distributed in Singapore by the Royal Bank of Canada, Singapore Branch, a registered entity granted offshore bank licence by the Monetary Authority of Singapore. This material has been prepared for general circulation and does not take into account the objectives, financial situation, or needs of any recipient. You are advised to seek inde-pendent advice from a financial adviser before purchasing any product. If you do not obtain independent advice, you should consider whether the product is suitable for you. Past performance is not indicative of future performance. If you have any questions related to this publication, please contact the Royal Bank of Canada, Singapore Branch. Royal Bank of Canada, Singapore Branch accepts responsibility for this report and its dissemination in Singapore.
© 2016 RBC Capital Markets, LLC - Member NYSE/FINRA/SIPC© 2016 RBC Dominion Securities Inc. - Member Canadian Investor Protection Fund © 2016 RBC Europe Limited© 2016 Royal Bank of CanadaAll rights reserved