the portfolio perspective presented by bob pugh, cfa president, insight wealth management
TRANSCRIPT

The Portfolio Perspective
Presented by Bob Pugh, CFA
President, Insight Wealth Management

This slide show, presentation, related discussion, and all other materials provided are to be considered general
educational information rather than any form of solicitation of or investment advice for any individual or group of
individuals. Solicitation of and specific investment advice for any individual or group of individuals must be based on
a detailed evaluation of their personal needs and circumstances, and accompanied by appropriate
disclosures including a copy of IWM’s Form ADV, Part II.

Bob Pugh, CFA Brief Biography President; Insight Wealth Management in Gainesville, VA, providing independent wealth and
investment management services to individuals, families and charitable organizations. Member of the Schwab Institutional network of select independent advisors
President of the CFA Society of Washington, DC, 2005 to 2007 Eastern Region Presidents Council Representative, CFA Institute, term beginning September
2009 Over twenty years of experience as a financial educator and analyst, and portfolio manager,
including the Central Intelligence Agency, director of investment research, and senior financial analyst with the Prince William County government.
Advised and managed investment portfolios for individuals and endowments for over ten years Graduate degrees in global political economy from the Johns Hopkins University, School of
Advanced International Studies, and in financial economics from the University of North Carolina at Greensboro
Faculty member; Johns Hopkins University’s Carey School of Business teaching graduate-level courses in investment analysis, portfolio management, and corporate finance since 2001
Volunteer; President of the Prince William Symphony Orchestra and over ten years service with the Prince William County Personal Finance Program
Contact information available at www.insightwealth.com
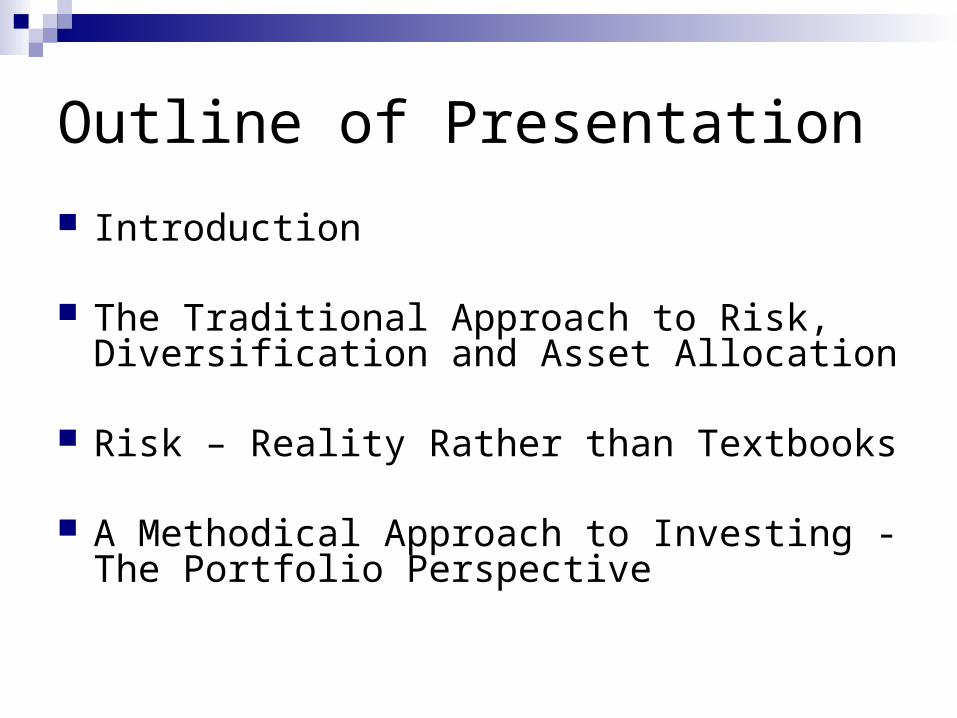
Outline of Presentation
Introduction
The Traditional Approach to Risk, Diversification and Asset Allocation
Risk – Reality Rather than Textbooks
A Methodical Approach to Investing - The Portfolio Perspective

Introduction

The Portfolio Perspective - Risk
What do “Jurassic Park” and construction of investment portfolios have in common?

The Portfolio Perspective - Risk
What do “Jurassic Park” and construction of investment portfolios have in common?
Non-linear dynamics, complexity, chaotic systems, unpredictability
Traditional financial models and measures of risk assume constant relationships among variables
Assessing your risk tolerance is the most important step in constructing a portfolio
What is investment risk?
The Traditional Approach to Risk, Diversification and Asset Allocation

Risk
Traditional measures of risk include variance, standard deviation, beta, etc.
Still important because they provide consistent measures to compare investments and portfolio performance
These measures are necessary but not sufficient

Diversification and Asset Allocation
Diversification - Having enough securities in a portfolio, or allocation to an asset class, to produce the market’s risk and return without excessive exposure to the risk of any individual security
Asset Allocation - Structuring a portfolio to include diversified exposure to various asset classes to achieve the portfolio’s return and risk objectives
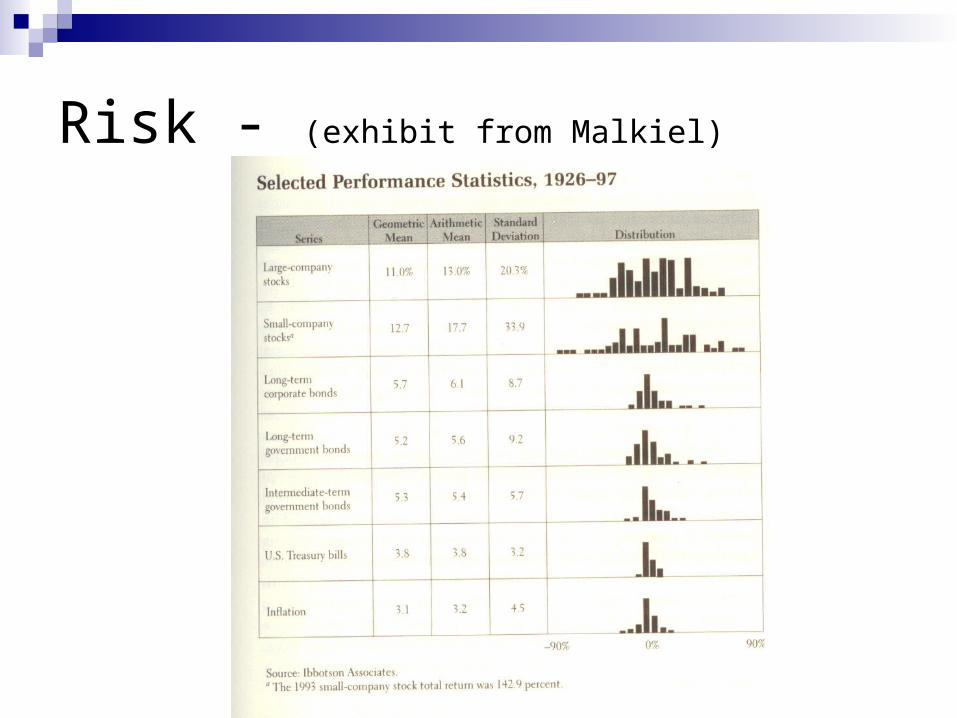
Risk - (exhibit from Malkiel)
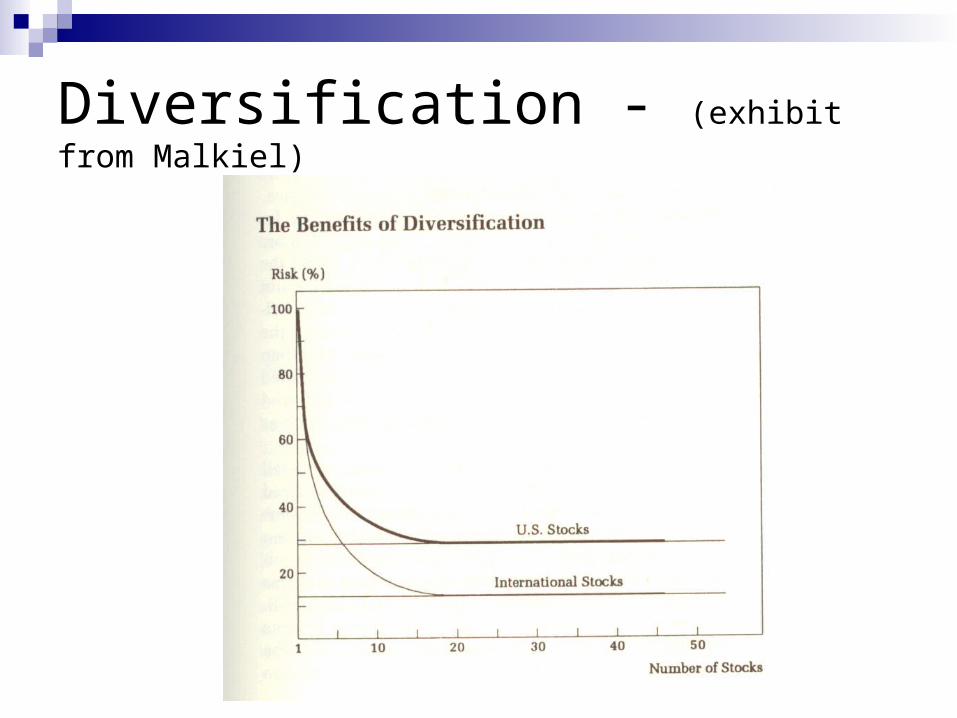
Diversification - (exhibit from Malkiel)

Asset Allocation and the Efficient Frontier(exhibit from Malkiel)
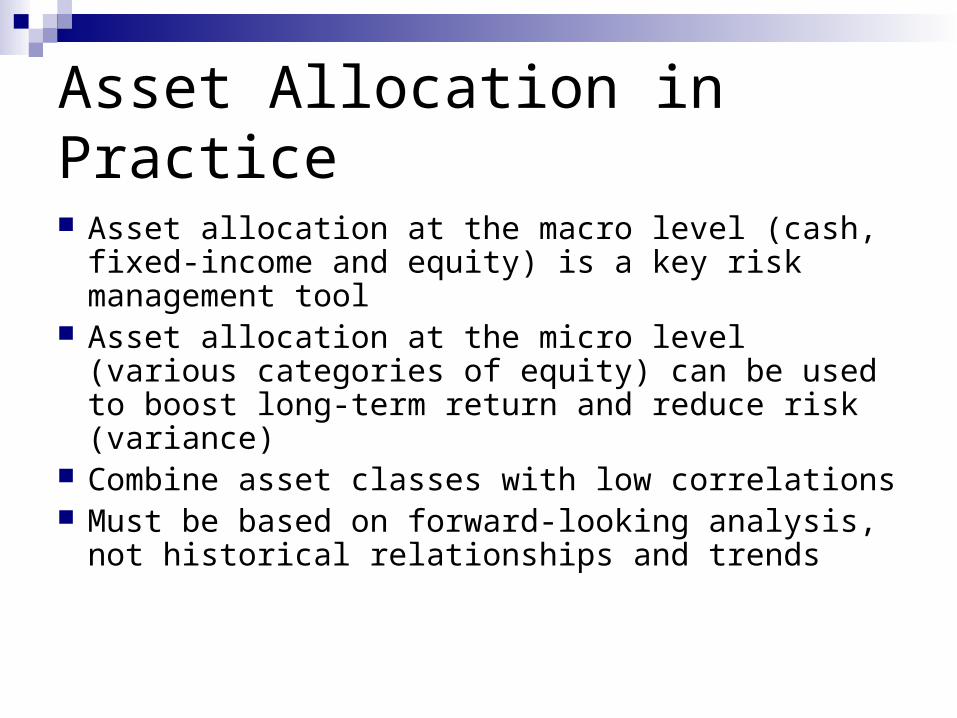
Asset Allocation in Practice
Asset allocation at the macro level (cash, fixed-income and equity) is a key risk management tool
Asset allocation at the micro level (various categories of equity) can be used to boost long-term return and reduce risk (variance)
Combine asset classes with low correlations Must be based on forward-looking analysis, not
historical relationships and trends
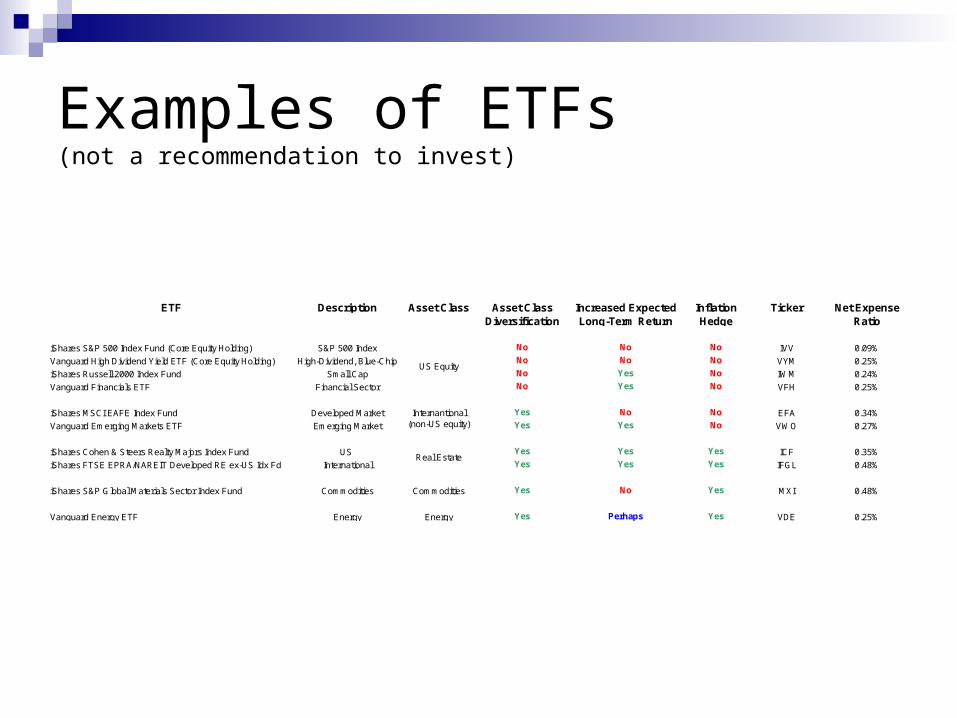
Examples of ETFs(not a recommendation to invest)
ETF Description Asset Class Ticker
iShares S&P 500 Index Fund (Core Equity Holding) S&P 500 Index No No No IVV 0.09%
Vanguard High Dividend Yield ETF (Core Equity Holding) High-Dividend, Blue-Chip No No No VYM 0.25%
iShares Russell 2000 Index Fund Small Cap No Yes No IWM 0.24%
Vanguard Financials ETF Financial Sector No Yes No VFH 0.25%
iShares MSCI EAFE Index Fund Developed Market Yes No No EFA 0.34%
Vanguard Emerging Markets ETF Emerging Market Yes Yes No VWO 0.27%
iShares Cohen & Steers Realty Majors Index Fund US Yes Yes Yes ICF 0.35%
iShares FTSE EPRA/NAREIT Developed RE ex-US Idx Fd International Yes Yes Yes IFGL 0.48%
iShares S&P Global Materials Sector Index Fund Commodities Commodities Yes No Yes MXI 0.48%
Vanguard Energy ETF Energy Energy Yes Perhaps Yes VDE 0.25%
US Equity
Internantional (non-US equity)
Real Estate
Asset Class Diversification
Increased Expected Long-Term Return
Inflation Hedge
Net Expense Ratio
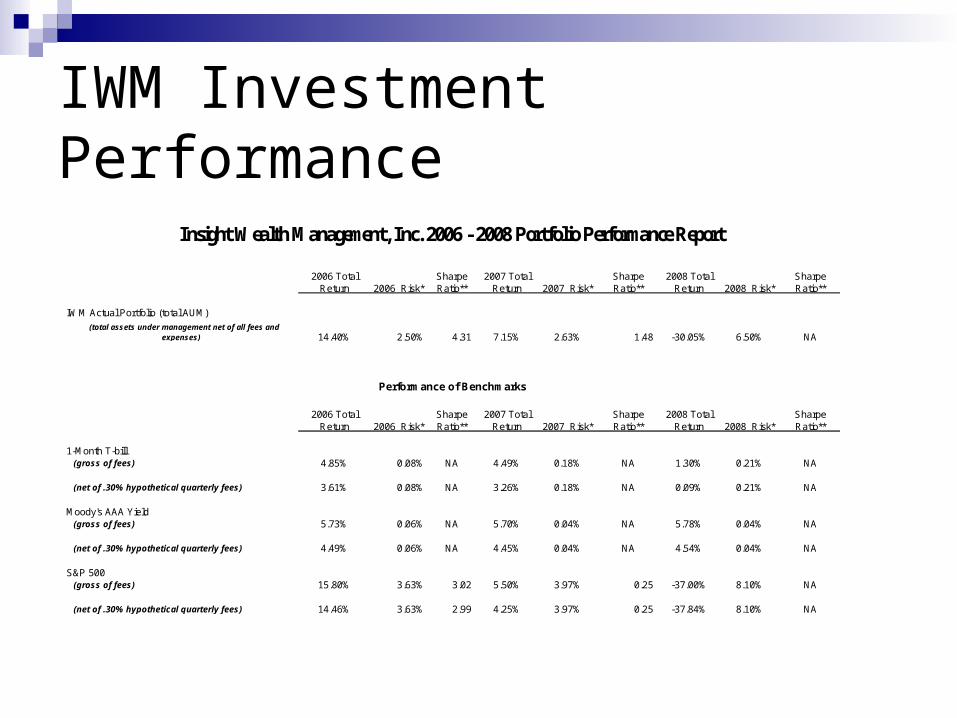
IWM Investment Performance
Sharpe Sharpe SharpeRatio** Ratio** Ratio**
IWM Actual Portfolio (total AUM)
14.40% 2.50% 4.31 7.15% 2.63% 1.48 -30.05% 6.50% NA
Sharpe Sharpe SharpeRatio** Ratio** Ratio**
1-Month T-bill (gross of fees) 4.85% 0.08% NA 4.49% 0.18% NA 1.30% 0.21% NA
(net of .30% hypothetical quarterly fees) 3.61% 0.08% NA 3.26% 0.18% NA 0.09% 0.21% NA
Moody's AAA Yield (gross of fees) 5.73% 0.06% NA 5.70% 0.04% NA 5.78% 0.04% NA
(net of .30% hypothetical quarterly fees) 4.49% 0.06% NA 4.45% 0.04% NA 4.54% 0.04% NA
S&P 500 (gross of fees) 15.80% 3.63% 3.02 5.50% 3.97% 0.25 -37.00% 8.10% NA
(net of .30% hypothetical quarterly fees) 14.46% 3.63% 2.99 4.25% 3.97% 0.25 -37.84% 8.10% NA
Insight Wealth Management, Inc. 2006 - 2008 Portfolio Performance Report
Performance of Benchmarks
2006 Total Return 2007 Risk*
2007 Total Return
(total assets under management net of all fees and expenses)
2006 Risk*2008 Total
Return 2008 Risk*
2008 Total Return 2008 Risk*
2006 Total Return 2006 Risk*
2007 Total Return 2007 Risk*
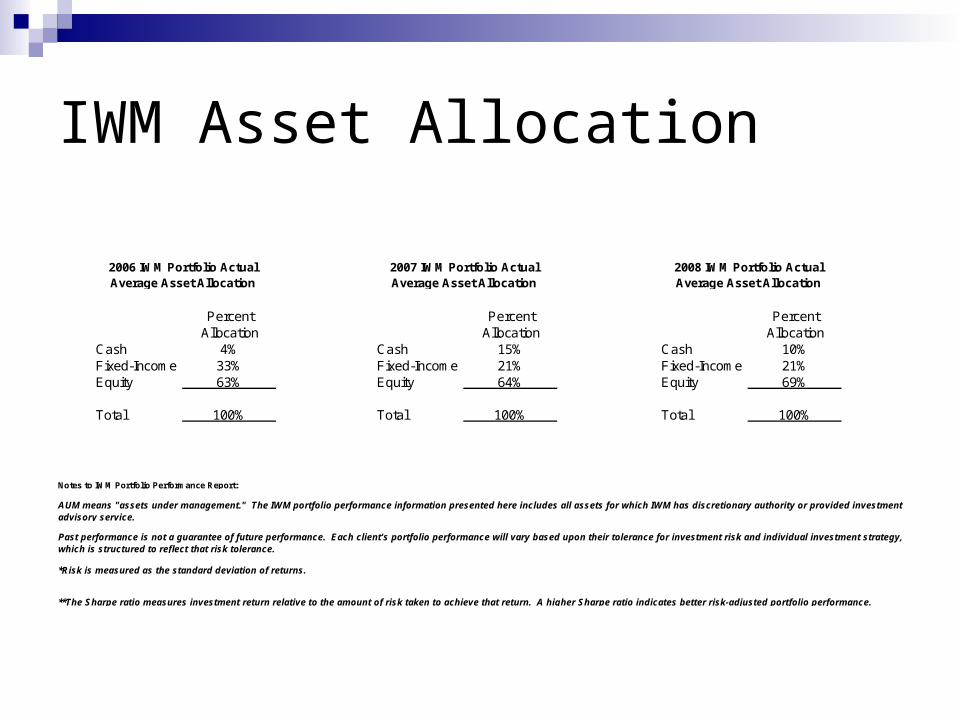
IWM Asset Allocation
Percent Percent PercentAllocation Allocation Allocation
Cash 4% Cash 15% Cash 10%Fixed-Income 33% Fixed-Income 21% Fixed-Income 21%Equity 63% Equity 64% Equity 69%
Total 100% Total 100% Total 100%
2006 IWM Portfolio Actual Average Asset Allocation
2007 IWM Portfolio Actual Average Asset Allocation
2008 IWM Portfolio Actual Average Asset Allocation
Notes to IWM Portfolio Performance Report:
Past performance is not a guarantee of future performance. Each client's portfolio performance will vary based upon their tolerance for investment risk and individual investment strategy, which is structured to reflect that risk tolerance.
**The Sharpe ratio measures investment return relative to the amount of risk taken to achieve that return. A higher Sharpe ratio indicates better risk-adjusted portfolio performance.
*Risk is measured as the standard deviation of returns.
AUM means "assets under management." The IWM portfolio performance information presented here includes all assets for which IWM has discretionary authority or provided investment advisory service.

Risk – A More Practical Approach

Risk – Jurassic Park Again
In the second Jurassic Park film, “The Lost World” Hammond tries to convince complexity theory mathematician Ian Malcolm to venture into his dinosaur world a second time saying, “Don’t worry. I’m not making the same mistakes again.” Malcolm responds, “No, you’re making all new ones.”
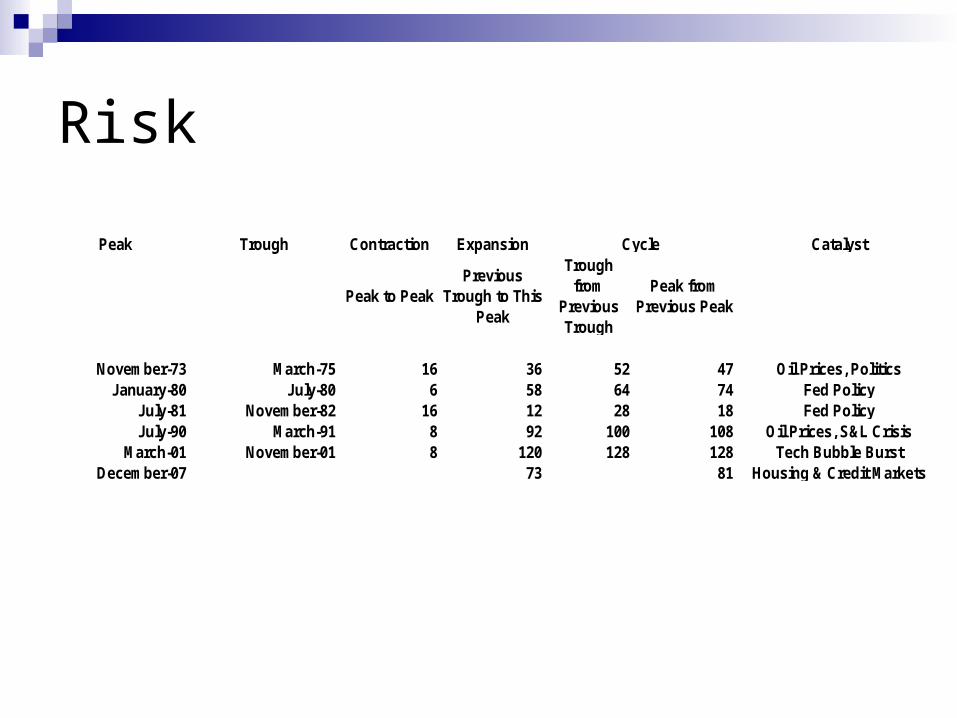
Risk
Peak Trough Contraction Expansion
November-73 March-75 16 36 52 47January-80 July-80 6 58 64 74
July-81 November-82 16 12 28 18July-90 March-91 8 92 100 108
March-01 November-01 8 120 128 128December-07 73 81
CycleTrough
from Previous Trough
Peak from Previous Peak
Peak to PeakPrevious
Trough to This Peak
Oil Prices, S&L CrisisTech Bubble Burst
Housing & Credit Markets
Catalyst
Oil Prices, PoliticsFed PolicyFed Policy
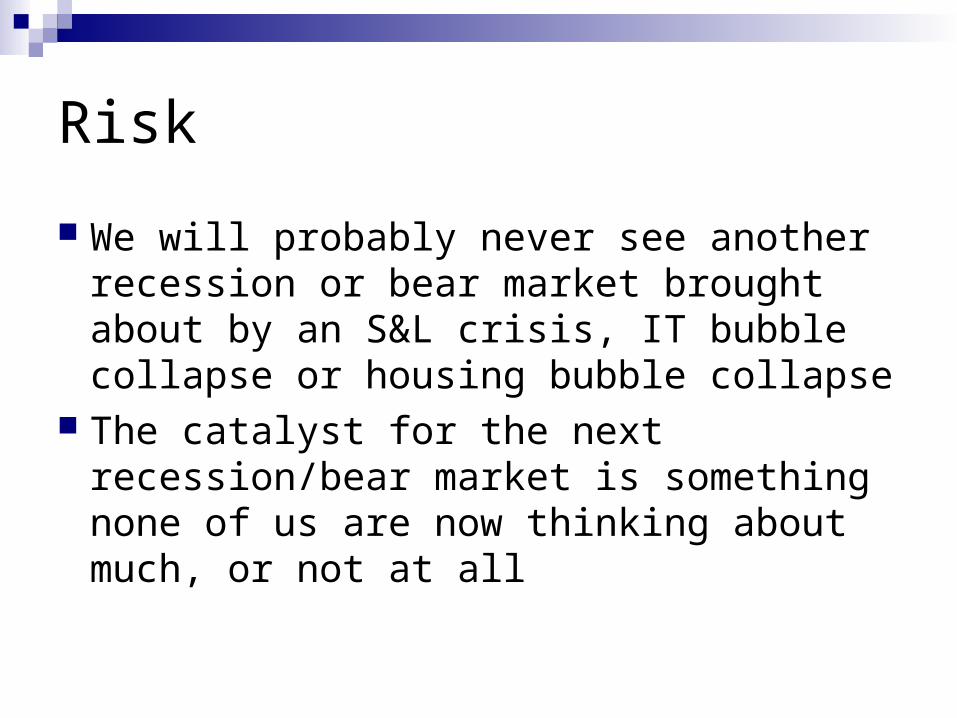
Risk
We will probably never see another recession or bear market brought about by an S&L crisis, IT bubble collapse or housing bubble collapse
The catalyst for the next recession/bear market is something none of us are now thinking about much, or not at all

Risk
Variables and relationships among variables are not constant. That includes return, standard deviation and correlation. Short-term fluctuations and changes Long-term structural change Economic and market conditions
Changes can not be predicted
The efficient frontier is very sensitive to inputs of these measures. Since they can never be determined precisely and are in a constant state of change, the efficient frontier and any resulting asset allocation is a theoretical exercise rather than a practical tool for investing.
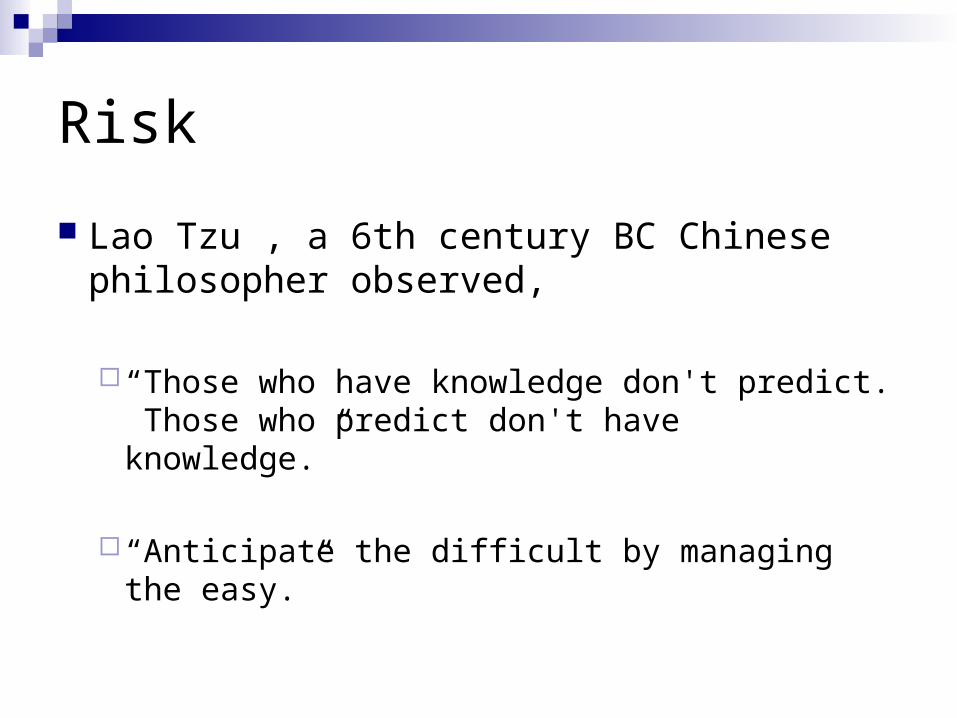
Risk
Lao Tzu , a 6th century BC Chinese philosopher observed,
“Those who have knowledge don't predict. Those who predict don't have knowledge.”
“Anticipate the difficult by managing the easy.”
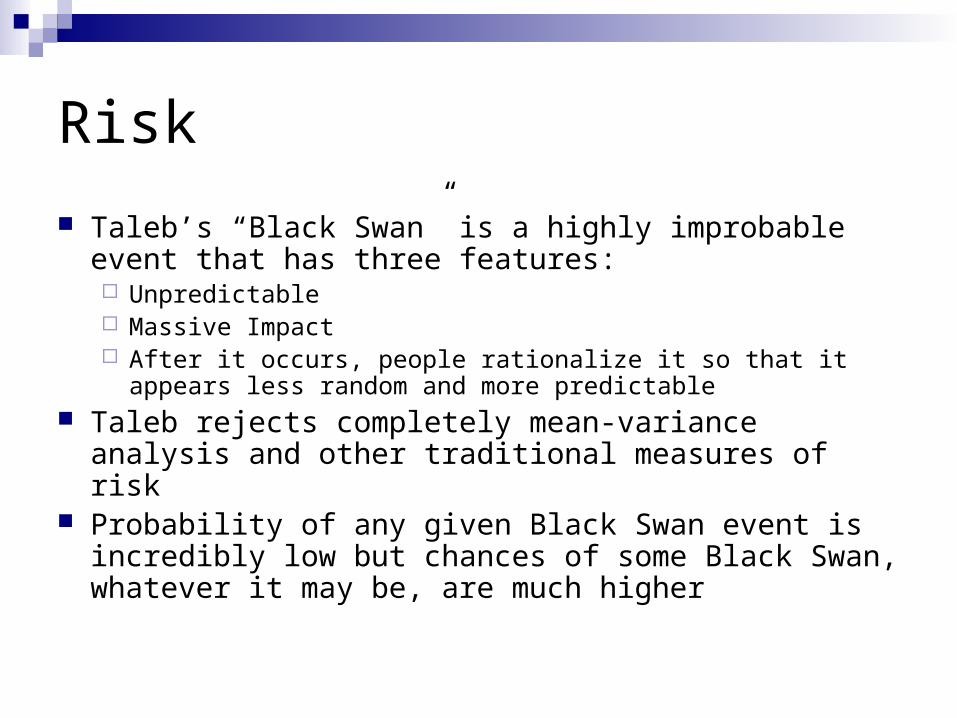
Risk
Taleb’s “Black Swan” is a highly improbable event that has three features: Unpredictable Massive Impact After it occurs, people rationalize it so that it appears less
random and more predictable Taleb rejects completely mean-variance analysis and
other traditional measures of risk Probability of any given Black Swan event is incredibly
low but chances of some Black Swan, whatever it may be, are much higher
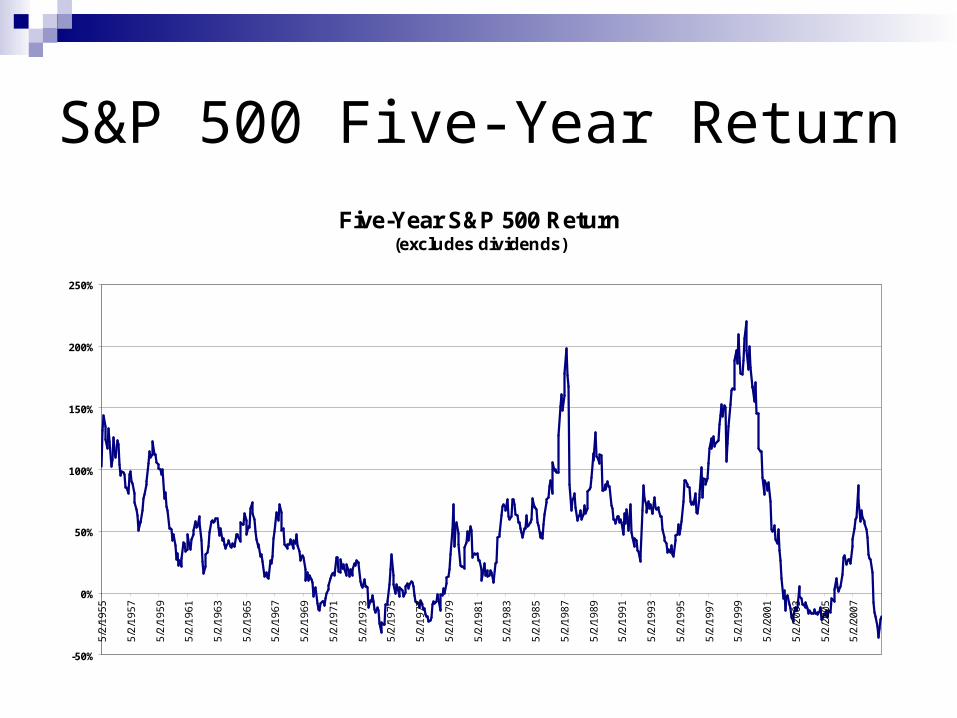
S&P 500 Five-Year ReturnFive-Year S&P 500 Return
(excludes dividends)
-50%
0%
50%
100%
150%
200%
250%
5/2
/19
55
5/2
/19
57
5/2
/19
59
5/2
/19
61
5/2
/19
63
5/2
/19
65
5/2
/19
67
5/2
/19
69
5/2
/19
71
5/2
/19
73
5/2
/19
75
5/2
/19
77
5/2
/19
79
5/2
/19
81
5/2
/19
83
5/2
/19
85
5/2
/19
87
5/2
/19
89
5/2
/19
91
5/2
/19
93
5/2
/19
95
5/2
/19
97
5/2
/19
99
5/2
/20
01
5/2
/20
03
5/2
/20
05
5/2
/20
07
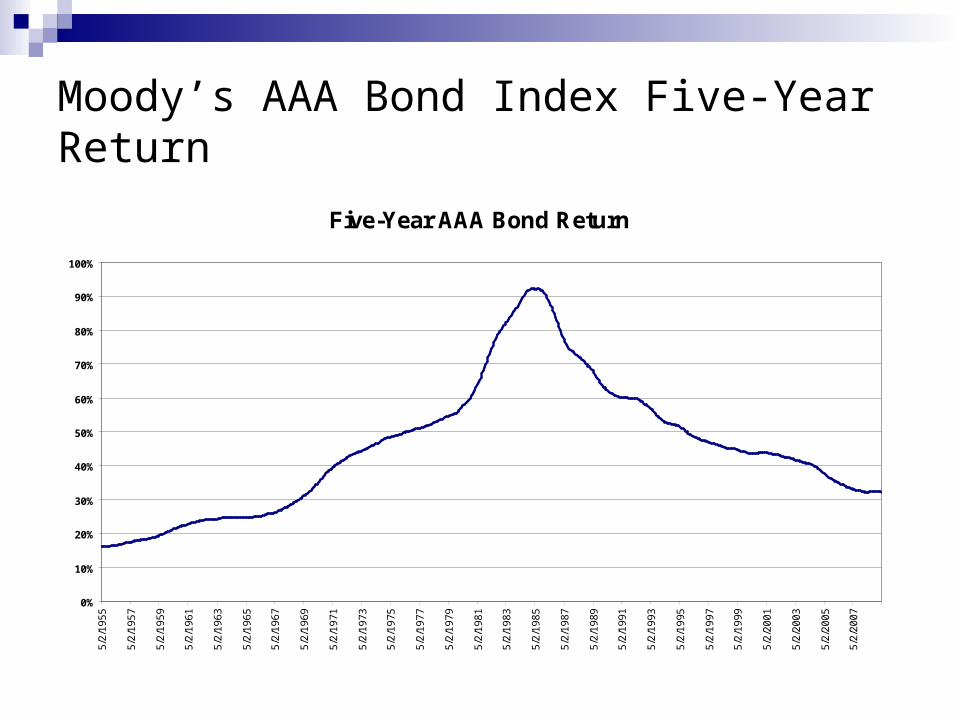
Moody’s AAA Bond Index Five-Year Return
Five-Year AAA Bond Return
0%
10%
20%
30%
40%
50%
60%
70%
80%
90%
100%
5/2
/19
55
5/2
/19
57
5/2
/19
59
5/2
/19
61
5/2
/19
63
5/2
/19
65
5/2
/19
67
5/2
/19
69
5/2
/19
71
5/2
/19
73
5/2
/19
75
5/2
/19
77
5/2
/19
79
5/2
/19
81
5/2
/19
83
5/2
/19
85
5/2
/19
87
5/2
/19
89
5/2
/19
91
5/2
/19
93
5/2
/19
95
5/2
/19
97
5/2
/19
99
5/2
/20
01
5/2
/20
03
5/2
/20
05
5/2
/20
07

70% S&P 500 30% AAA Bond Allocation Five-Year Return
70/30 Allocation Five-Year Returns(excludes S&P 500 dividends)
-50%
0%
50%
100%
150%
200%
7/2
/19
56
10
/1/1
95
7
1/2
/19
59
4/1
/19
60
7/3
/19
61
10
/1/1
96
2
1/2
/19
64
4/1
/19
65
7/1
/19
66
10
/2/1
96
7
1/2
/19
69
4/1
/19
70
7/1
/19
71
10
/2/1
97
2
1/2
/19
74
4/1
/19
75
7/1
/19
76
10
/3/1
97
7
1/2
/19
79
4/1
/19
80
7/1
/19
81
10
/1/1
98
2
1/3
/19
84
4/1
/19
85
7/1
/19
86
10
/1/1
98
7
1/3
/19
89
4/2
/19
90
7/1
/19
91
10
/1/1
99
2
1/3
/19
94
4/3
/19
95
7/1
/19
96
10
/1/1
99
7
1/4
/19
99
4/3
/20
00
7/2
/20
01
10
/1/2
00
2
1/2
/20
04
4/1
/20
05
7/3
/20
06
10
/1/2
00
7
1/2
/20
09

A Methodical Approach to Investing – The Portfolio Perspective

What are the Problems Here?

What are the Problems Here?
Inadequate Planning(not enough life boats)
“Don’t Worry, Be Happy” attitude(Titanic can’t sink – enjoy yourselves!)
Trusting People Who Shouldn’t be Trusted(Company executives and others putting their
interests ahead of passenger safety)

What Do I Do Now?
Investors have taken a hit in the recent market crash
Those with a well thought-out plan for the long haul that reflects their ability to take investment risk are OK
For those who did not have a plan, there's no way to undo damage already done
It’s never too late to plan, invest methodically, and move forward

Macro versus Micro
Many Investors Can’t See the Forest (their portfolio) for the Trees (stocks, mutual funds and other investment
vehicles)

The Portfolio Management Process
Determine the Portfolio’s Objectives Develop an Investment Strategy to Achieve
those Objectives Implement the Investment Strategy (i.e., select
securities) Monitor and Measure Portfolio Performance Rebalance and Modify as Needed
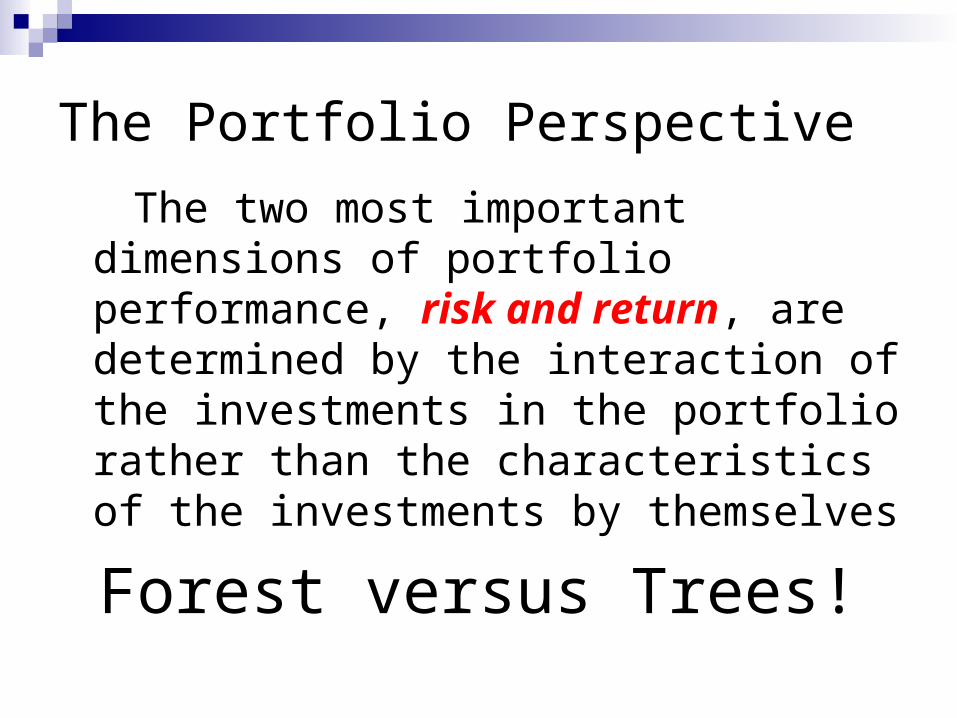
The Portfolio Perspective
The two most important dimensions of portfolio performance, risk and return, are determined by the interaction of the investments in the portfolio rather than the characteristics of the investments by themselves
Forest versus Trees!

The Portfolio Perspective
Investor’s First Portfolio Objective - Determine how much investment risk they can tolerate based on their own ability and willingness to take risk
Investor’s Second Portfolio Objective - Structure their portfolio to generate an acceptable level of return without exceeding the risk threshold
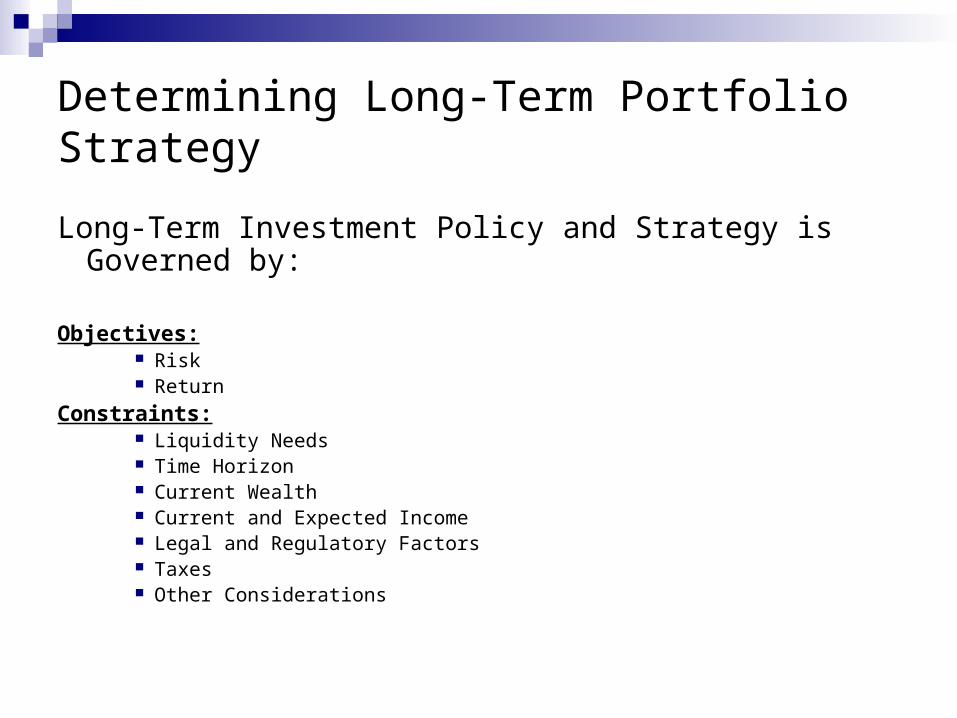
Determining Long-Term Portfolio Strategy
Long-Term Investment Policy and Strategy is Governed by:
Objectives: Risk Return
Constraints: Liquidity Needs Time Horizon Current Wealth Current and Expected Income Legal and Regulatory Factors Taxes Other Considerations

Determining Long-Term Portfolio Strategy
Let’s Assess Your Ability to Withstand Investment Risk and Construct an Asset
Allocation!
Write Down Your Answers to the Questions
On the Next Slide
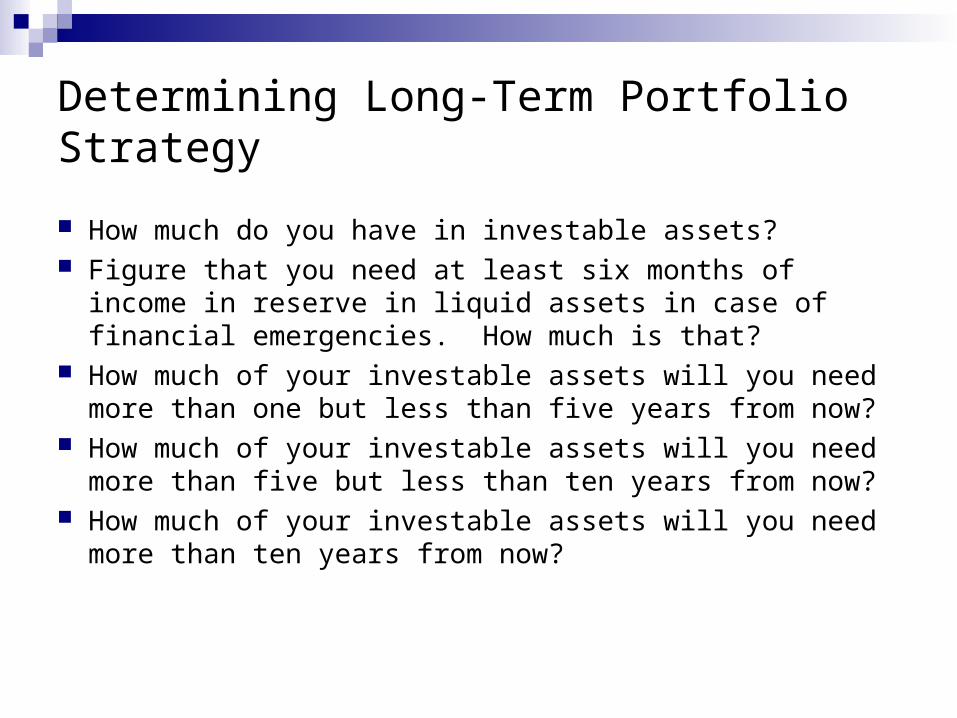
Determining Long-Term Portfolio Strategy
How much do you have in investable assets? Figure that you need at least six months of income in
reserve in liquid assets in case of financial emergencies. How much is that?
How much of your investable assets will you need more than one but less than five years from now?
How much of your investable assets will you need more than five but less than ten years from now?
How much of your investable assets will you need more than ten years from now?

Determining Long-Term Portfolio Strategy
Rules of Thumb for Asset Allocation
Liquid, Safe Assets Such as FDIC-Insured Accounts - Six months of income in reserve and funds to meet annual expenses
Short-Term, High-Grade Fixed-Income – Funds you will need more than one but less than five years from now (short-term bond/CD ladder)
Higher Yielding Fixed-Income or Conservative Equity – Funds you will need more than five but less than ten years from now
Relatively More Aggressive Equity and Other Investments - Funds you will need more than ten years from now
Determining Long-Term Portfolio Strategy
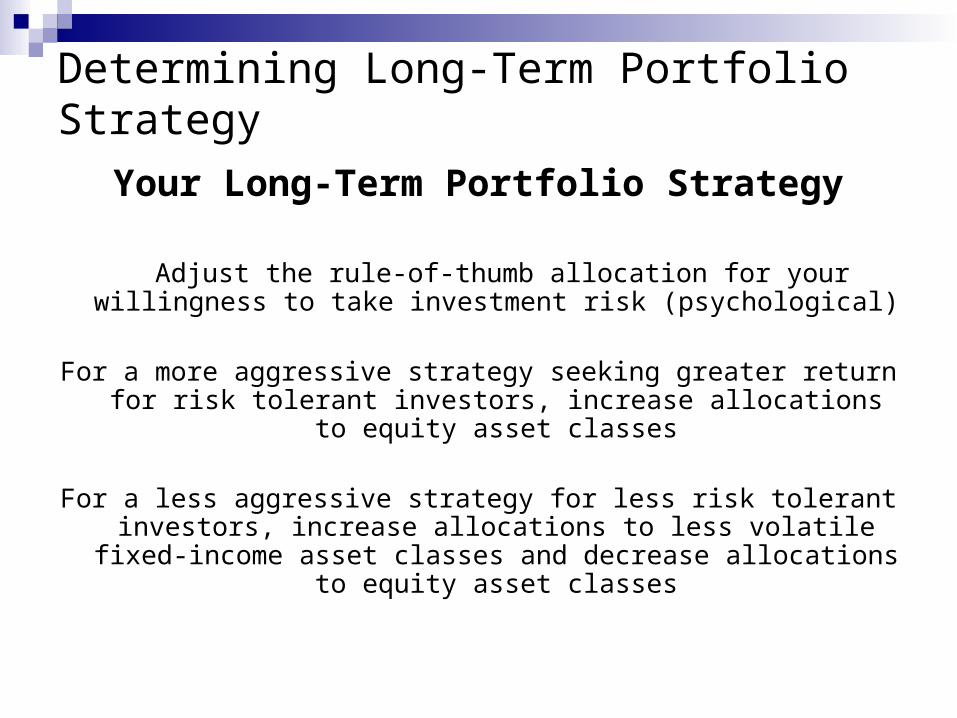
Your Long-Term Portfolio Strategy
Adjust the rule-of-thumb allocation for your willingness to take investment risk (psychological)
For a more aggressive strategy seeking greater return for risk tolerant investors, increase allocations to equity asset classes
For a less aggressive strategy for less risk tolerant investors, increase allocations to less volatile fixed-income asset classes and decrease
allocations to equity asset classes
Determining Long-Term Portfolio Strategy
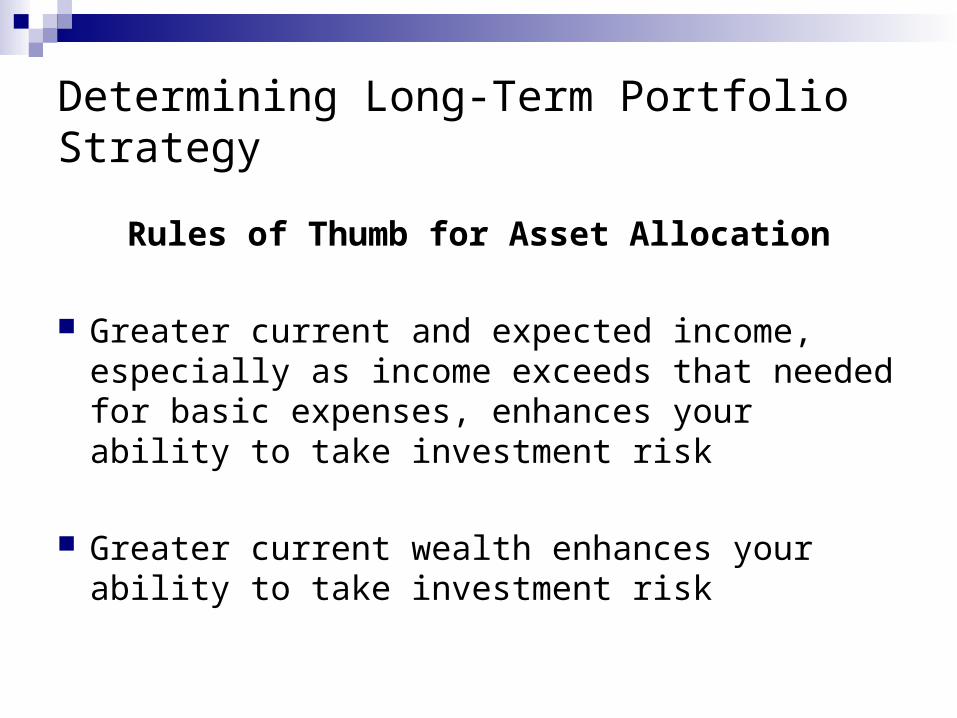
Rules of Thumb for Asset Allocation
Greater current and expected income, especially as income exceeds that needed for basic expenses, enhances your ability to take investment risk
Greater current wealth enhances your ability to take investment risk

Situational Profiling(from Maginn, Tuttle, Pinto and McLeavey)
Source of Wealth Measure of Wealth Stage of Life
FoundationAccumulationMaintenanceDistribution

Investor Personality Typing(from Maginn, Tuttle, Pinto and McLeavey)
Decisions Based Primarily on Thinking
Decisions Based Primarily on Feeling
More risk averse
Methodical Cautious
Less risk averse
Individualist Spontaneous

Determining Long-Term Portfolio Strategy
Return Objective
The return objective is based on achieving personal financial goals such as retirement, education of children, philanthropy, leaving an inheritance, or whatever else the investor might choose
The return objective must be consistent with the risk objective. Taking more risk in the portfolio than the investor can tolerate can lead to disaster
If a portfolio can’t achieve desired goals without exceeding the risk tolerance, the personal financial goals and return objective must be revised
Determining Long-Term Portfolio Strategy
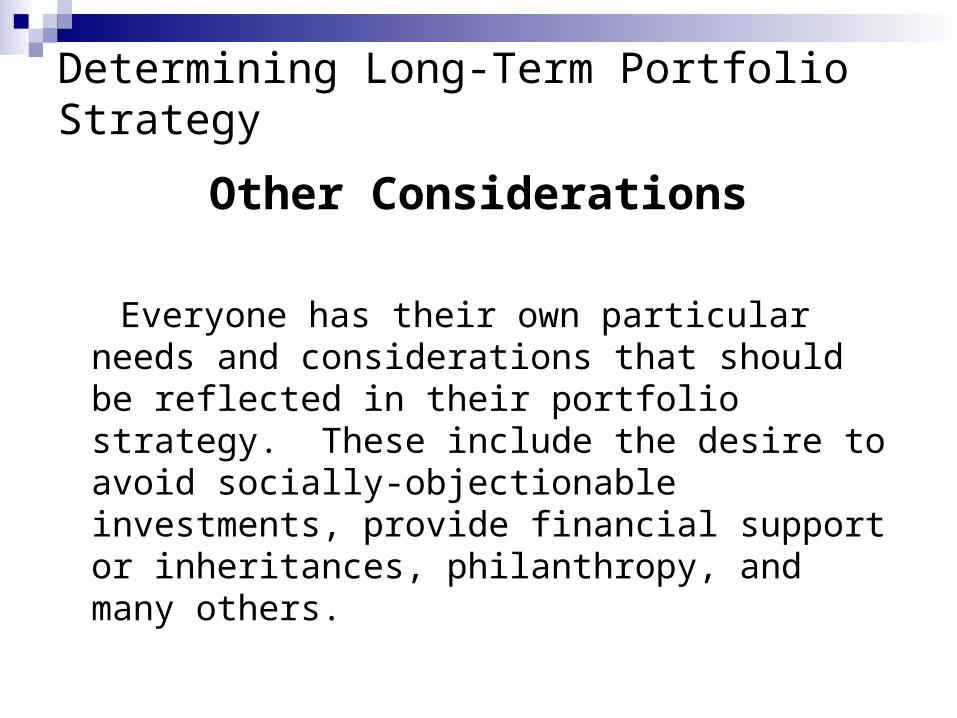
Other Considerations
Everyone has their own particular needs and considerations that should be reflected in their portfolio strategy. These include the desire to avoid socially-objectionable investments, provide financial support or inheritances, philanthropy, and many others.
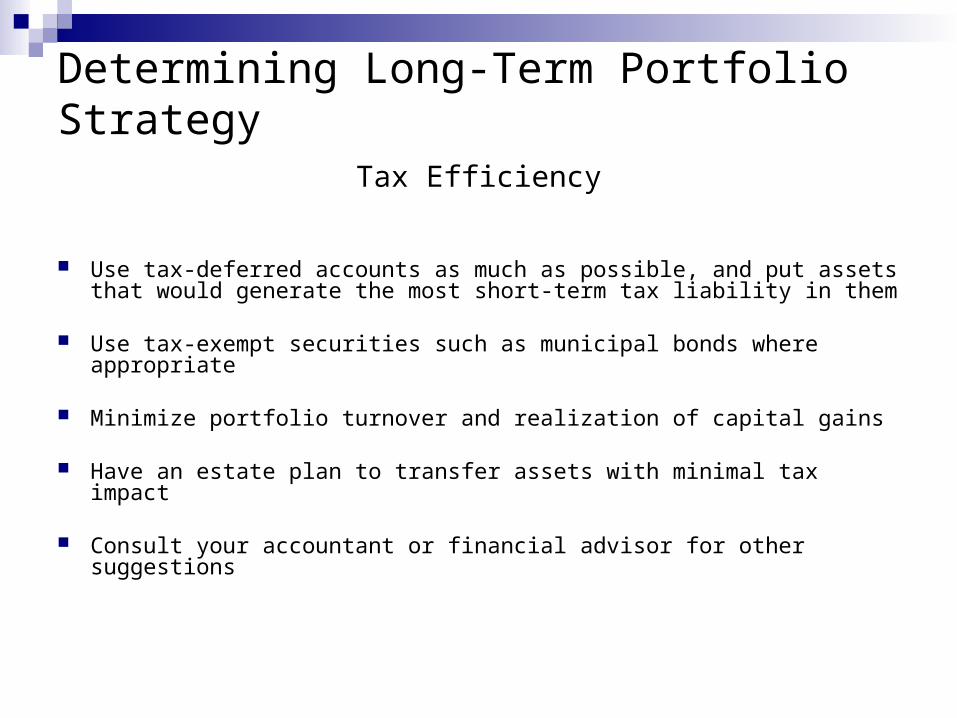
Determining Long-Term Portfolio Strategy
Tax Efficiency
Use tax-deferred accounts as much as possible, and put assets that would generate the most short-term tax liability in them
Use tax-exempt securities such as municipal bonds where appropriate
Minimize portfolio turnover and realization of capital gains
Have an estate plan to transfer assets with minimal tax impact
Consult your accountant or financial advisor for other suggestions
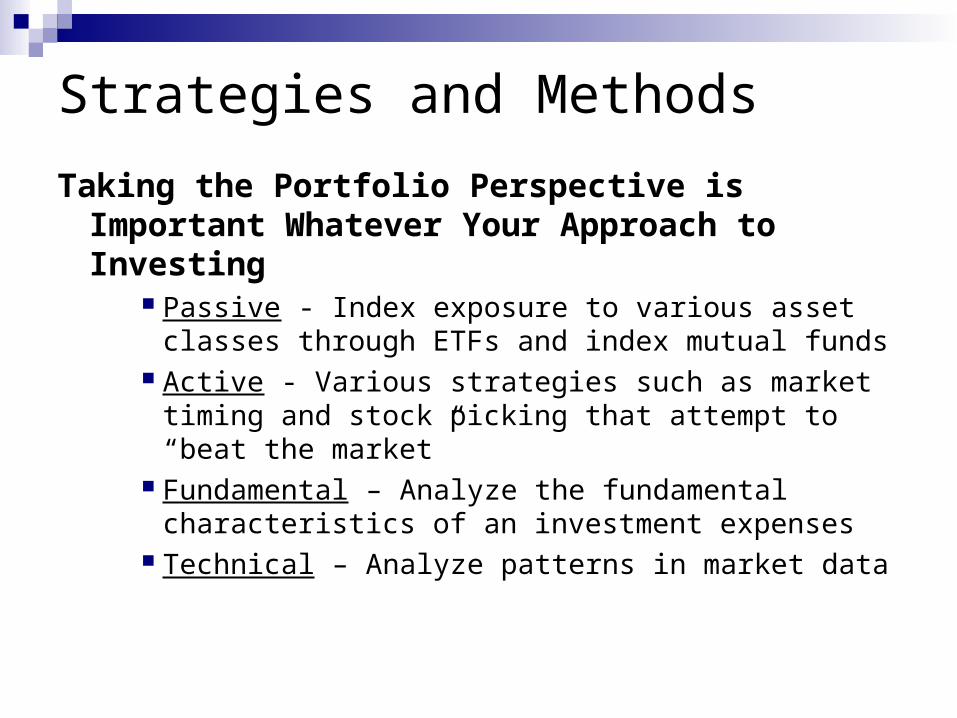
Strategies and Methods
Taking the Portfolio Perspective is Important Whatever Your Approach to Investing
Passive - Index exposure to various asset classes through ETFs and index mutual funds
Active - Various strategies such as market timing and stock picking that attempt to “beat the market”
Fundamental – Analyze the fundamental characteristics of an investment expenses
Technical – Analyze patterns in market data
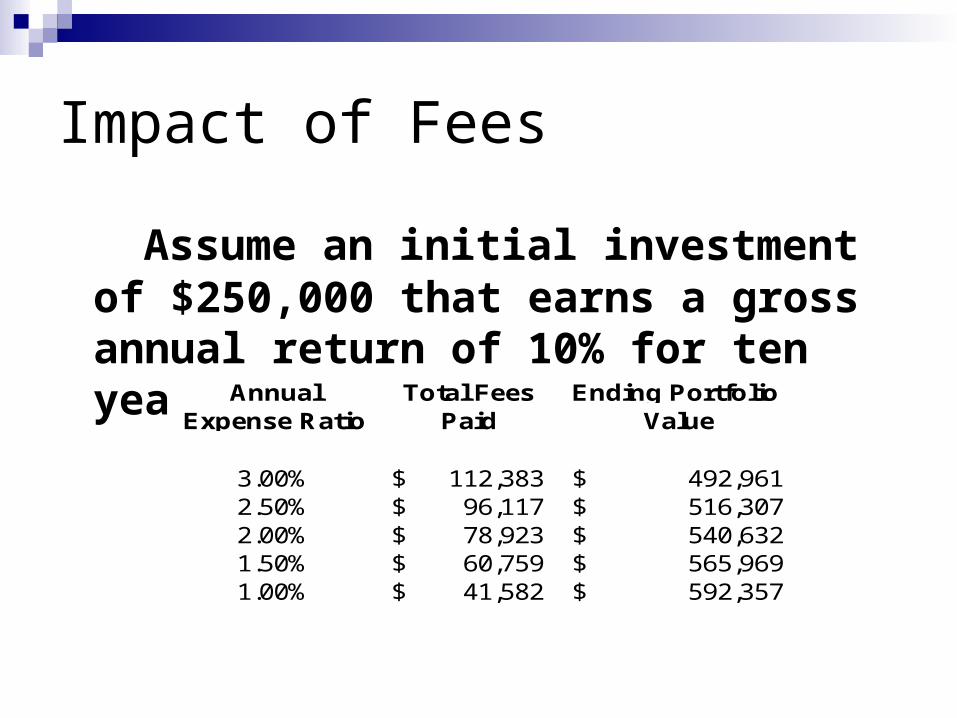
Impact of Fees
Assume an initial investment of $250,000 that earns a gross annual return of 10% for ten years:
Annual Total Fees Ending Portfolio Expense Ratio Paid Value
3.00% 112,383$ 492,961$ 2.50% 96,117$ 516,307$ 2.00% 78,923$ 540,632$ 1.50% 60,759$ 565,969$ 1.00% 41,582$ 592,357$

Suggestions for Further Reading
“Unconventional Success: A Fundamental Approach to Personal Investment,” by David F. Swensen. Free Press
“A Random Walk Down Wall Street: The Time-Tested Strategy for Successful Investing,” by Burton G. Malkiel. W. W. Norton
“Common Sense on Mutual Funds,” by John C. Bogle. John Wiley & Sons, Inc.
“The Little Book of Common Sense Investing,” by John C. Bogle. John Wiley & Sons, Inc.
“Against the Gods” and “Capital Ideas Evolving,” by Peter L. Bernstein. John Wiley & Sons, Inc.
“Managing Investment Portfolios: A Dynamic Process,” by Maginn, Tuttle, Pinto and McLeavey. CFA Institute
“The Black Swan” and “Fooled by Randomness, by Nassim Nicholas Taleb. Random House”