august 2, 2021 am fef hydrogen san jose trip generation memo
TRANSCRIPT
8451 Miralani Drive, Suite A • San Diego, CA 92126 • (858) 560-4911
1
ATTN: Kristi Kandel I&D Consulting
E-Mail: ▼[email protected]
FROM: Justin P. Schlaefli PE, TE, PTOE TOTAL PAGES (Including Cover):2 (plus attachments)
DATE: August 2, 2021 TIME: 11:36:07 AM JOB NUMBER: 000821
SUBJECT: FEF Hydrogen San Jose Trip Generation Memo Confidential Communications
This transmittal is intended for the recipient named above. Unless otherwise expressly indicated, this entire communication is confidential and privileged information. If you are not the intended recipient, do not disclose, copy, distribute or use this information. If you received this
transmission in error, please notify us immediately by telephone, at our expense and destroy the information.
The purpose of this memo is to discuss the trip generation characteristics of the proposed Hydrogen Fuel station in San Jose, CA. Proposed Project and Potential Future Demand of Hydrogen Fuel Traffic The proposed project includes the integration of two hydrogen fuel dispensers (4 vehicle fuel positions) to an existing gas station located at 510 East Santa Clara Street in the City of San Jose. The proposed hydrogen fuel dispensers would supplement standard gasoline fueling dispensers at the existing site. The proposed site plan is included as Attachment 1. To determine the trip generation of the hydrogen station, similar approved land use projects were referenced. The trip generation methodology from the Fountain Valley Traffic Report dated November 14, 2018 for a hydrogen fueling station was utilized in determining the trip generation for the proposed project. In that study, traffic volumes were obtained from three other operating hydrogen fueling stations throughout Southern California. Counts were conducted to obtain an average daily trip, AM, and PM peak hour volumes for each station. A trip generation rate of 83 trips per vehicle fueling position (VFP) was calculated to be the average rate for all three stations. An AM rate of 8.5 trips per VFP and PM rate of 7.5 trips per VFP were also determined. The referenced report is provided in Attachment 2 of this memo. Additionally, volumes for average daily trips, AM and PM peak hours were conducted in 2019 and 2020 at three more hydrogen fueling stations in Southern California. The volumes from those sites had an average daily trip of 67 vehicles per VFP with 3 trips per VFP in the AM, and 3 trips per VFP in the PM. This represents a slight decrease over time compared to the 2018 study. It is likely that hydrogen fuel trip rates will remain relatively stable with small yearly fluctuations for the immediate future. The referenced data is provided in Attachment 2 of this memo. Although the volumes for hydrogen fuel use have fluctuated over time (2018 to 2020) with the 2018 volumes being the highest and 2020 the lowest, the 2018 volumes are the most conservative and representative of what traffic is expected to be for hydrogen use. The traffic demand for hydrogen use is expected to remain stable for the future.
MEMO

Job #000821 © Urban Systems Associates, Inc. FEF San Jose August 2, 2021
8451 Miralani Drive, Suite A • San Diego, CA 92126 • (858) 560-4911
2
Vol. In % O ut% In O ut Vol. In % O ut% In O ut
Hydrogen Fuel 4 VFP 83.00 Per VFP 332 8.50 Per VFP 34 50% 50% 17 17 7.50 Per VFP 30 50% 50% 15 15
Total 4 332 34 17 17 30 15 15
Source:
Note:ADT= Average Daily TripsVFP = Vehicle Fueling Position
Land Use Intensity Rate* ADTAM PM
Peak Rate* Peak Rate*
*Rates are used from ITE Trip Generation Manual 10th Edition (Some ADT rates not available)
For the determination of the trip generation for the proposed project, the 2018 rate of 83 trips per VFP was used as a conservative approach. The trip generation for the proposed project is shown on Table A.
Table A: Trip Generation
The proposed project is expected to generate 332 ADT with 34 AM (17 in / 17 out) peak hour trips and 30 PM (15 in / 15 out) peak hour trips. Vehicle Miles Traveled The City of San Jose has adopted Council Policy 5-1 in order to ensure compliance with State Law (SB743) and appropriately screen and analyze proposed projects. Projects which do not meet the screening criteria must complete a Vehicle Miles Traveled (VMT) analysis. These requirements are outlined in the City’s Transportation Analysis Handbook (April 2020). Primary screening criteria are listed in Table 1 as reproduced on the following page. As discussed above, the proposed project is expected to generate 332 ADT. Therefore, the proposed project would not qualify as a “Small Infill Project” under the screening criteria in Table 1. Likewise, the project does not fall into the “Local-Serving Public Facilities” category and is not a residential or office project. However, as a fueling station, the proposed project falls into the “Local-Serving Retail” category. As discussed in the OPR Technical Advisory (April 2018), “By adding retail opportunities into the urban fabric and thereby improving retail destination proximity, local-serving retail development tends to shorten trips and reduce VMT. Thus, lead agencies generally may presume such development creates a less-than-significant transportation impact”. In this case, fueling stations have commonly been defined as a “Local-Serving Retail” development falling under this guidance. It is assumed that by providing fueling services directly where people live, there is a reduction in travel distance as people can obtain services locally. This would reduce Vehicle Miles Traveled. The proposed project would not alter the retail square footage which qualifies as a retail use less than 100,000 sf. The fuel dispensers require parking of vehicles and no drive-through operations are present as defined by the City under Council Policy 6-10. The project meets the screening criteria for CEQA Transportation Analysis for Development Projects outlined in the City of San Jose, Transportation Analysis Handbook and consistent with Council Policy 5-1. Therefore, no additional CEQA Transportation analysis would be necessary. Conclusion Based on the information provided above, the project would cause a de-minimis increase in traffic with no additional improvements necessary. Likewise, the project would be screened out of CEQA Transportation analysis.

Job #000821 © Urban Systems Associates, Inc. FEF San Jose August 2, 2021
8451 Miralani Drive, Suite A • San Diego, CA 92126 • (858) 560-4911
3
Job #000821 © Urban Systems Associates, Inc. FEF San Jose August 2, 2021
8451 Miralani Drive, Suite A • San Diego, CA 92126 • (858) 560-4911
4
Attachment 1 Site Plan
N
1
1
T
H
S
T
R
E
E
T
E
S
A
N
T
A
C
L
A
R
A
S
T
R
E
E
T
CANOPY
±16.0'
CANOPY
±10.0'
CANOPY
±16.0'
CANOPY
±10.0'
0'
SCALE 1"=10'
10' 20'
N
W
S
E
LANDSCAPE AREA
EXISTING LANDSCAPE AREA = 570 SF
EXISTING LANDSCAPE AREA / TOTAL LOT AREA = 570 / 19,200 = 0.03 (3%)
PROPOSED LANDSCAPE AREA = 1,269 SF
PROPOSED LANDSCAPE AREA / TOTAL LOT AREA = 1,269 / 19,200 = 0.07 (7%)
NEWLY CREATED LANDSCAPE AREA = 699 SF
PROPOSED LAND DISTURBANCE AREA
NOTE:
EXISTING BUILDING, EXISTING SERVICE STATION AND OVERALL
SITE TO REMAIN AS IS.
NEW WORK IS LIMITED TO PROPOSED PROJECT AREA FOR
A. HYDROGEN EQUIPMENT
B. HYDROGEN FUELING DISPENSERS
HYDROGEN DISPENSERS
HYDROGEN DISPENSERS ARE ADA COMPLIANT WITH HOSES,
CONTROLS & CARD READERS NO MORE THAN 48" MAX HEIGHT
WITH A 30" X 48" CLEAR SPACE, SEE SHEET 4 FOR DISPENSER
3D IMAGE.
SHEET 3 OF 6
SITE PLANNER
REVISION DATES:
LA PROJECT NUMBER
07/21/2021
ADDRESS:
DEREK FINNEGAN
PROPOSED
SITE PLAN
PROJECT INFORMATION
LOCATION MAP NOT TO SCALE
SITE PLAN NOTES:
REVISION NOTES:
FEF - SAN JOSE
510 E. SANTA CLARA ST
SAN JOSE, CA 95112
20074
LARS ANDERSEN & ASSOCIATES, INC.
CIVIL ENGINEERS - LAND SURVEYORS - PLANNERS
5281 California Avenue,
#260
Irvine, CA 92617
ZONING INFORMATION
APN: 467-26-109
JURISDICTION: CITY OF SAN JOSE
ZONING: GC - GENERAL COMMERCIAL
SITE AREA
LOT AREA 19,200 SF (0.44 AC)
BUILDING DATA
EXISTING BUILDING AREA 1,444 SF
PROPOSED BUILDING AREA (NO CHANGE) 1,444 SF
SETBACKS NORTH EAST SOUTH WEST
REQUIRED: 15' 0' 0' 15'
PROVIDED: 44.5' 74.5' 35.4' 46.1'
PARKING SUMMARY
EXISTING PARKING SUMMARY
EXISTING STANDARD PARKING PROVIDED 4 STALLS
EXISTING DISPENSER PARKING PROVIDED 8 STALLS
TOTAL EXISTING PARKING PROVIDED 12 STALLS
PARKING REQUIRED PER CITY CODE
REQUIRED C-STORE: (@ 1 / 200 SF GFA) 2 STALLS
REQUIRED AUTO SERVICE:
(4 / BAY) 8 STALLS
(1 / EMPLOYEE) 3 STALLS
(1 / INFO STOP) 1 STALLS
(1 / AIR & WATER) + 1 STALLS
TOTAL PARKING REQUIRED 15 STALLS
PROPOSED PARKING SUMMARY
PROPOSED STANDARD PARKING PROVIDED 11 STALLS
PROPOSED DISPENSER PARKING PROVIDED 12 STALLS
PROPOSED ADA PARKING PROVIDED 1 STALLS
TOTAL PROPOSED PARKING PROVIDED 24 STALLS
BICYCLE / MOTORCYCLE PARKING PROVIDED:
MOTORCYCLE PARKING PROVIDED 3 STALLS
LONG TERM BICYCLE PARKING PROVIDED (LOCKER) 1 STALLS
SHORT TERM BICYCLE PARKING PROVIDED 2 STALLS
DATE:
PERVIOUS / IMPERVIOUS AREA
EXISTING PERVIOUS AREA = 570 SF (3%) LOT AREA
EXISTING IMPERVIOUS AREA = 18,630 SF (97%) LOT AREA
PROPOSED PERVIOUS AREA = 1,269 SF (7%) LOT AREA
PROPOSED IMPERVIOUS AREA = 17,931 SF (93%) LOT AREA
NEWLY CREATED PERVIOUS AREA = 699 SF
N
S

Job #000821 © Urban Systems Associates, Inc. FEF San Jose August 2, 2021
8451 Miralani Drive, Suite A • San Diego, CA 92126 • (858) 560-4911
5
Attachment 2 Fountain Valley Report & Volumes for Hydrogen
Fueling Sites
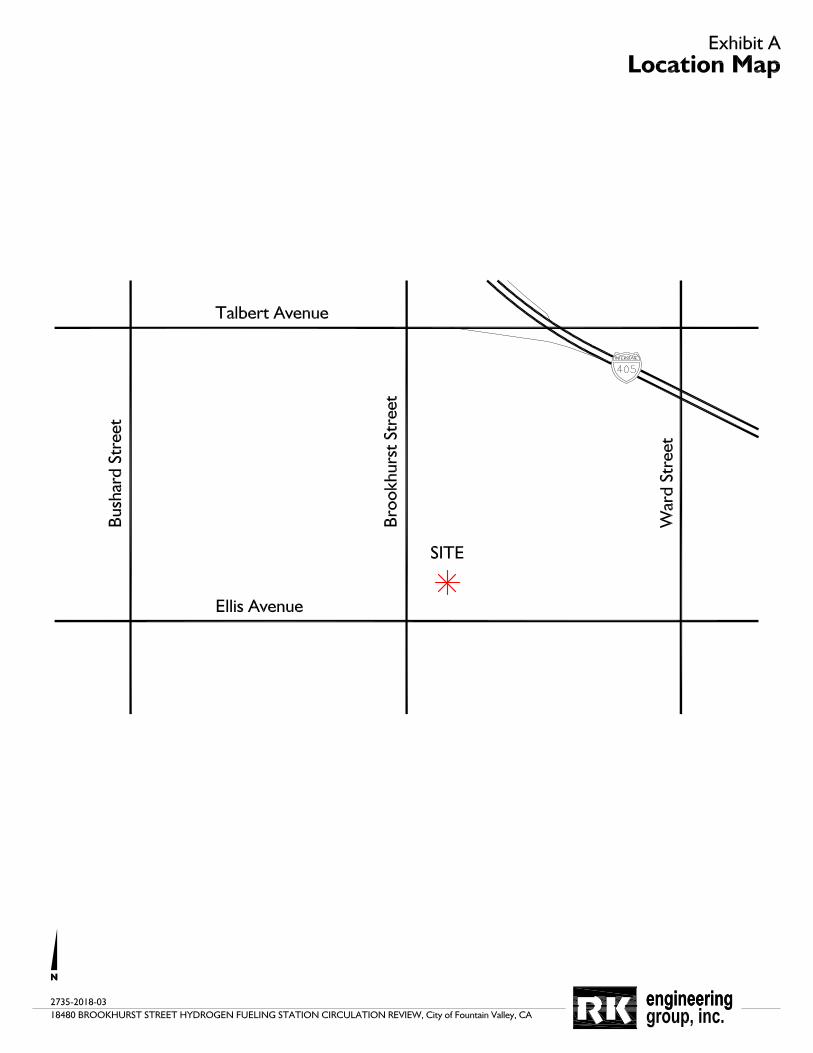
November 13, 2018 Mr. Eugene Gordin, P.E., Ph.D SGE CONSULTING STRUCTURAL ENGINEERS 2081 Business Center Dr. #105 Irvine, CA 92612 Subject: 18480 Brookhurst Street Hydrogen Fueling Station Circulation Review Dear Mr. Gordin: Introduction RK ENGINEERING GROUP, INC. (RK) is pleased to submit this Circulation Review for the proposed Hydrogen Fueling Station to be located at 18480 Brookhurst Street. The site is located at the Northeast corner of Brookhurst Street at Ellis Avenue in the City of Fountain Valley (see exhibit A) and includes an Arco gas station which will remain in operation. The site plan for the project is shown in Exhibit B. The City of Fountain Valley staff has requested additional project information regarding the existing southernmost driveway on Brookhurst Street, the potential trip generation of the project and the preparation of the circulation plan for the site. The project is located within an existing Arco service station and convenience mart located at the Northeast corner of Brookhurst Street and Ellis Avenue. The project would add four fueling positions for Hydrogen fuel cell vehicles (FCV) located south of the existing building within the project site. Although there is currently limited demand for the four fueling positions, they are being installed now in response to the State of California’s goal of hydrogen fuel as a future alternative to gasoline. At the present time, there are limited number of hydrogen fueling facilities throughout Southern California. In most cases, a single pump/ fueling position has been provided at the existing service stations within the region. Local hydrogen fueling stations include sites in Costa Mesa, Lake Forest, Long Beach, and Newport Beach. There would be no major building or circulation changes with the proposed installation of the hydrogen fueling facility at the existing site. The existing eight (8) fueling position service station and convenience mart has been at this location for a number of years. The site currently has right-in, right-out access driveways at two locations along Brookhurst Street and two locations along Ellis Avenue adjacent to the site. Vehicles enter the existing facility at the southerly driveway on Brookhurst Street, and proceed through the existing fuel pumps in the northerly direction. Then, vehicles enter/exit

SGE CONSULTING STRUCTURAL ENGINEERS RK 14015 Page 2
the site at either of the two driveway locations on Ellis Avenue. The project does not anticipate reconstruction of the existing station or any substantial modifications to the existing circulation within the site. Goals of the Circulation Study include the following: 1. Discuss the two (2) Brookhurst Street access driveways and the need to retain the
southerly and northerly driveways on Brookhurst Street 2. Development of the potential trip generation for the site for both the AM/PM peak of
the street hours and on a daily basis 3. Provide a review of the internal circulation for the new hydrogen fueling station
facilities for both vehicles (patrons utilizing the facility) and trucks (delivery of hydrogen fuel)
RK has reviewed the circulation for the proposed hydrogen fuel facility and it has determined to be adequate from traffic circulation standpoint. It can be accommodated by the site with the existing driveways and circulation system. The on-site circulation proposed is designed in a manner that will not impact off-site traffic along Brookhurst Street and Ellis Avenue. RK has reviewed the Brookhurst Street access, the potential trip generation of the site, and the overall circulation for both vehicle and deliveries to the new hydrogen fueling facility. No major issues have been identified based upon this review. Brookhurst Street Access There are currently two right-in, right-out driveways located on Brookhurst Street adjacent to the project site. Between the two driveways there is an existing OCTA (Orange County Transportation Authority) bus stop, including a concrete bus pad. At the present time, vehicles generally enter the southerly driveway and then traverse through the gas station in a northerly direction to exit the northerly driveway. Vehicles also enter the site from the two Ellis Avenue driveways at the southerly end of the site. RK has reviewed the existing driveway conditions on Brookhurst Street including both the southerly and northerly driveways. The proposed project does not include a major renovation of the overall project site plan or significant change in the circulation. As a result of this, it desirable to keep both of the Brookhurst driveways as currently constructed at the project site. In the future, if a major modification to the existing site plan occurs, then consideration can be given to reviewing the need for both Brookhurst Street driveways as a result of any significant changes to the overall site plan.

SGE CONSULTING STRUCTURAL ENGINEERS RK 14015 Page 3
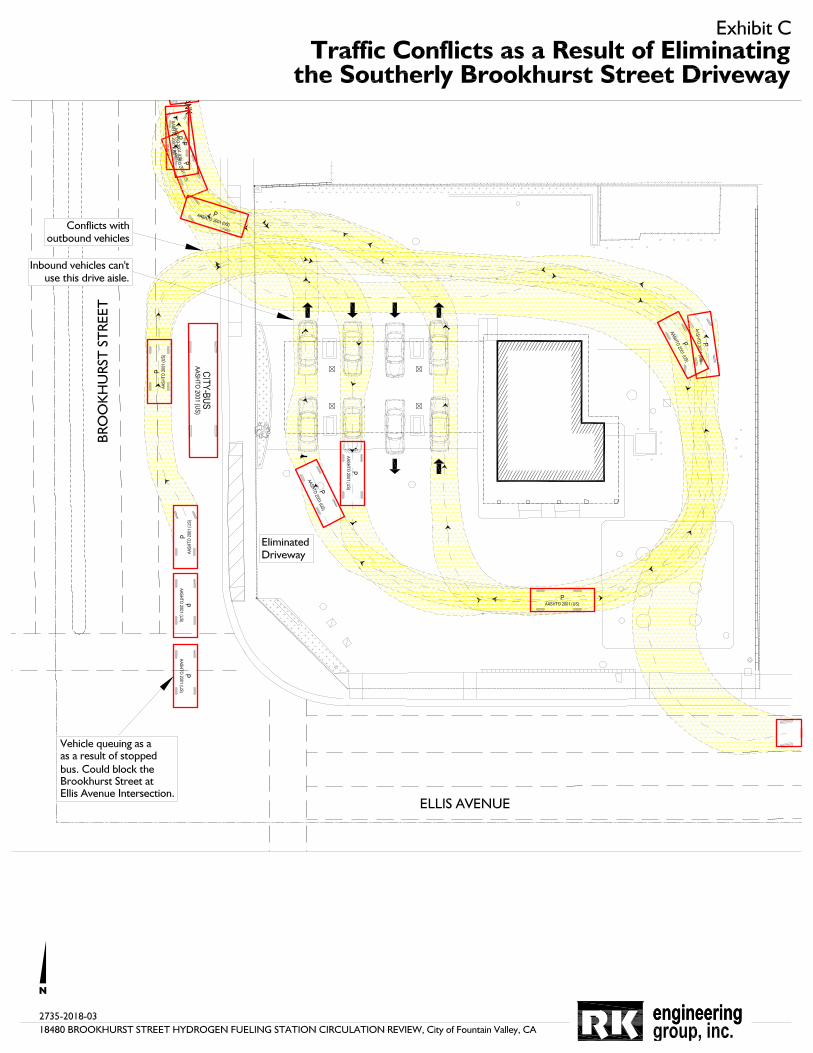
The issue of eliminating the southerly Brookhurst Street driveways has previously been discussed with the City. Other modifications to the existing site were made a few years ago. This was discussed at length with the Fountain Valley Planning Commission and the existing circulation and driveway configuration was approved by the Commission at that time. As a result of the existing OCTA bus stop, it is desirable to retain the two driveways including the existing southerly driveway. If it is eliminated, northbound vehicles accessing the site could be stuck behind OCTA transit busses. This could cause backups into the intersection of Brookhurst Street at Ellis Avenue while vehicles are trying to enter the northerly driveway. As shown in Exhibit C by closing the southerly driveway excess queuing on Brookhurst Street would occur as a result of the stopped busses and it could cause additional on-site traffic congestion. With the southerly driveway, vehicles accessing the site vehicles could quickly enter the site without queuing behind OCTA busses. The project applicant and consultants have discussed the existing circulation driveways with the Fountain Valley Fire Department. The Fire Department had no concerns with the existing driveway configurations and their ability to serve the proposed hydrogen fueling facility. If the southerly Brookhurst Street driveway is eliminated, then vehicles driving northbound on Brookhurst Street would have to enter the site via the northerly driveways. The current northbound flow within the service gas station would have to be reversed to flow in a southerly direction. As a result of the existing site design, vehicles would have to make a U-turn into the site to utilize the existing gasoline pumps closest to Brookhurst Street. Vehicles would not be able to use the existing pumps on the west side of the site. Due to the proximity to the driveway, all vehicles would then have to utilize the other pumps and could cause potential congestion and queuing within the station. By closing down the southerly Brookhurst Street Driveway, more vehicles accessing the site would potentially utilize the Ellis Avenue driveway. This would require these vehicles to make an eastbound left turn into the site which is not as desirable as entering the site directly from Brookhurst Street. Based upon the fact that the project site plan is not being substantially changed, there is no need to close the southerly Brookhurst Street driveway. The existing southerly driveway on Brookhurst Street would sufficiently facilitate traffic into and out of the site with the proposed incorporation of the hydrogen fueling facility. The southerly driveway would provide access to the hydrogen fueling pumps, since there is two-way traffic flow at the new pump site.
SGE CONSULTING STRUCTURAL ENGINEERS RK 14015 Page 4
Trip Generation RK Engineering Group has completed a review of the potential trip generation for the proposed hydrogen fueling facility. As previously indicated, the proposed project would include two hydrogen fueling pumps with four fueling positions. Although there is not a current demand for all four fueling positions, they are being provided in response to the State of California’s goal of hydrogen fuel as a future alternative to gasoline. Trip generation represents the amount of traffic that is entering into and out of the site during 7-9 AM, 4-6 PM peak hours and on a daily basis. The most prominent resource of trip generation is the ITE (Institute Transportation Engineers) 10th Edition Trip Generation Manual. Another resource available is the SANDAG (San Diego Association of Government) Brief Guide Of Vehicular Traffic Trip Generation Rates for the San Diego Region. Unfortunately, hydrogen fueling facilities are relatively new and have not been incorporated into either of these primary resources for trip generation. As more and more of the facilities are developed, additional empirical studies can be completed and can be added to the ITE and SANDAG databases for reference in planning future projects. As a result of the lack of significant published data on hydrogen fuel facility trip generation, RK has reviewed other potential sources of data to establish trip generation for the project site. This has included a review of actual sales transactions at three existing hydrogen fueling facilities in Southern California at the following locations:
• 2050 Harbor Boulevard, Costa Mesa, CA 92627 • 20731 Lake Forest Drive, Lake Forest, CA 92630 • 3401 Long Beach Boulevard, Long Beach, CA 90807
Each of these facilities are currently operating, include one hydrogen fueling pump/ fueling position, and have been operating for some significant period of time. There is also another facility located in Newport Beach at the northeast corner of Jamboree Road at San Joaquin Hills Road; however, it is much more underutilized in comparison to the other three locations mentioned above. Each of these three facilities were monitored for inbound and outbound traffic during a 24-hour period. Based upon the information collected, trip generation has been estimated for the project. RK received transaction time-dated activity reports from the operator for the three existing Southern California facilities. This information was collected for a one-month period during September 2018 on both an hourly and daily basis. RK extracted the data for typical Tuesday through Thursday conditions. This information is included in Appendix A. A total of twelve business days were reviewed for each of the three stations. A summary of number of trips generated during both the AM/PM peak hour, and on a daily basis is

SGE CONSULTING STRUCTURAL ENGINEERS RK 14015 Page 5
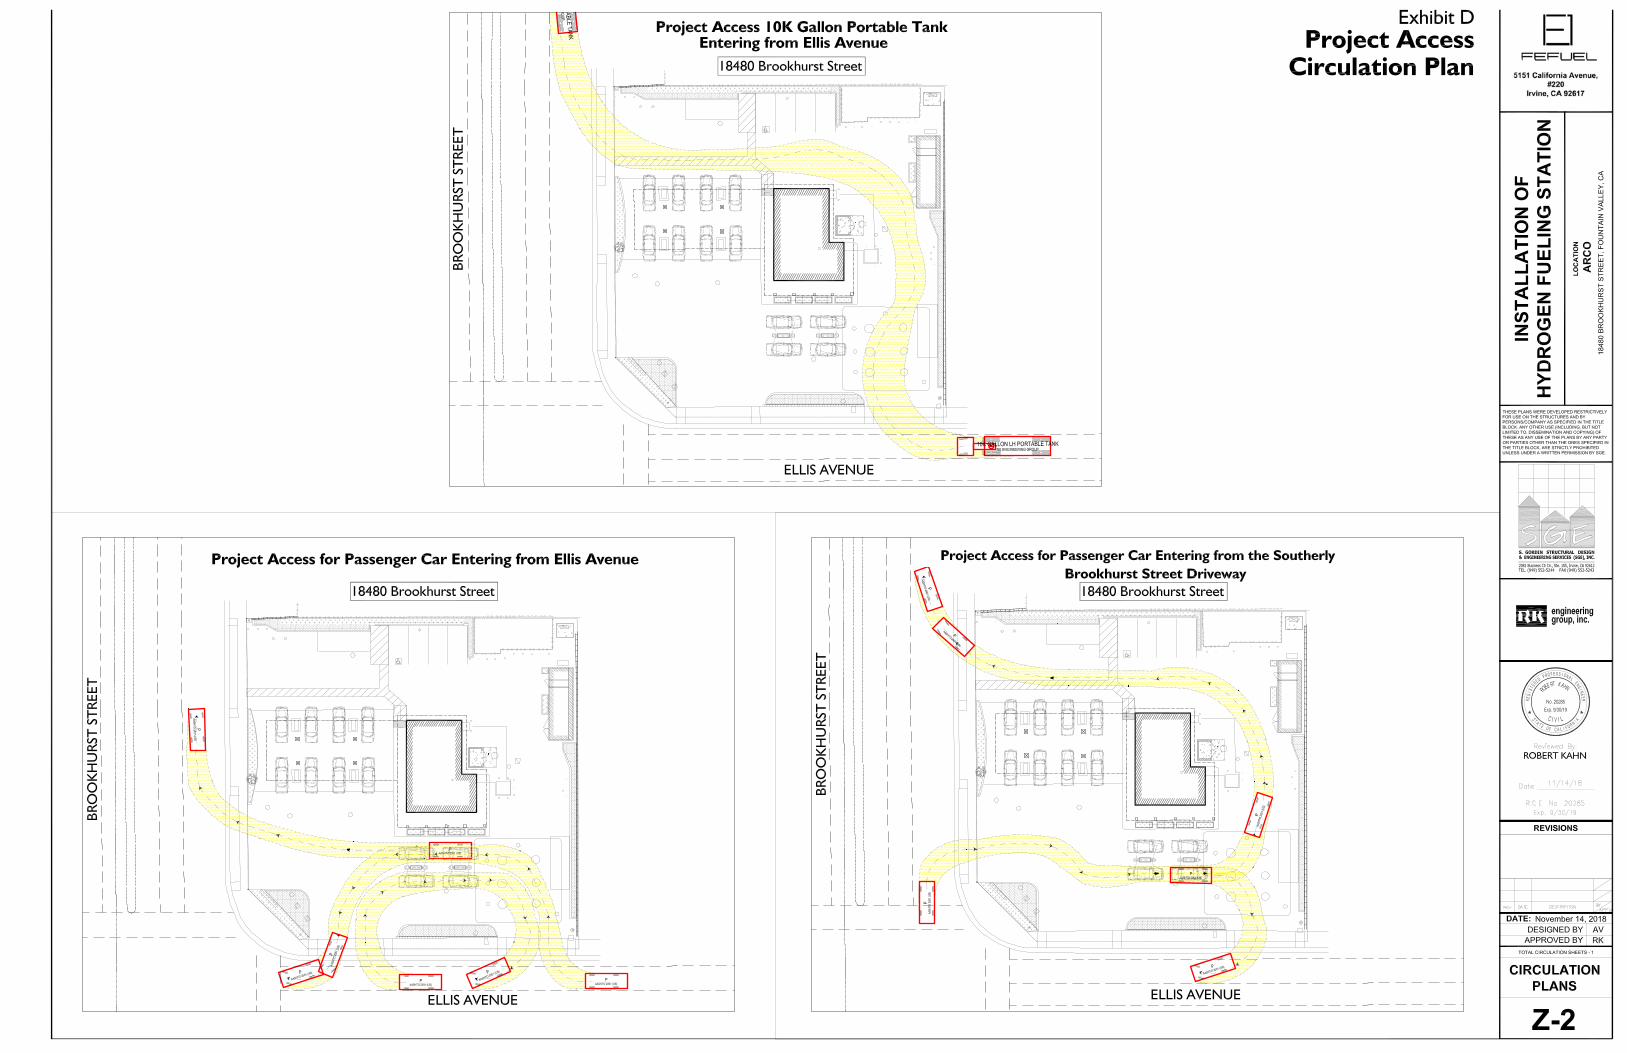
included in Table 1. It should be noted that these facilities currently include one hydrogen fueling pump and fueling position at each of these station facilities. RK Engineering Group also collected an independent count at each of the three sites for a typical Tuesday which are shown in Table 2. These sites indicate that the typical facility generates approximately 68.67 trip ends per day per fueling position with 6.67 vehicle per hour per fueling position during the AM peak hour and 8.67 vehicles per hour per fueling position during the PM peak hour. Based upon the information from Tables 1 & 2, potential trip generation for the proposed site has been estimated. The proposed site will include two hydrogen fueling pumps with up to four fueling positions. Expanding the trip generation based upon the previous trip generation data for the site has been estimated for future conditions when an increase in hydrogen fuel demand is expected to occur. RK recommends using the results from Table 1, because of the substantial amount of data collected over several days. Based upon this information, project trip generation is shown in Table 3. The proposed project would generate up to 332 trip ends per day with 34 vehicles per hour during the AM peak hour and 30 vehicles per hour during PM peak hour. It should be noted that the AM and PM peak hours are for the peak hours of street traffic, which is typically used for traffic assessment purposes. The trip generation in Table 3 is conservative since it will take a substantial amount of time before the demand for four (4) fueling positions to occur. For example, of the roughly 25 million light-duty vehicles in California, only 5,000 currently run on hydrogen. Internal Circulation Review RK has reviewed the internal circulation for the proposed Hydrogen Fueling Station which has included the entering and exiting movements for vehicles utilizing the proposed hydrogen fuel pumps to be located in the southerly portion of the site adjacent to Ellis Avenue. RK has also reviewed the potential fuel delivery truck circulation which is only expected to occur approximately once a week. Vehicles utilizing the hydrogen fueling pumps could enter the site from either the Brookhurst Street southerly driveway or the Ellis Avenue driveways directly into the site in either westbound or eastbound direction. The hydrogen fueling trucks would most likely enter the site from Ellis Avenue and traverse around the existing building to unload the hydrogen fuel and then leave the site via the northerly Brookhurst Street driveway. The Circulation Plan for both the automobiles and fueling trucks is shown on Exhibit D. Exhibit D indicates both the inbound and outbound movements for each of these vehicle types. Based upon a review of the Site Plan and Exhibit D, no particular circulation problems are anticipated for users of the hydrogen fueling facility or the delivery of the

SGE CONSULTING STRUCTURAL ENGINEERS RK 14015 Page 6
hydrogen fuel site. Therefore, the proposed circulation shown in Exhibit D is adequate from a traffic circulation standpoint. Keeping the southerly driveway open on Brookhurst Street will reduce potential queuing at the OCTA bus stop and will facilitate on-site circulation. Conclusions RK Engineering Group, Inc. has completed a circulation review for the proposed hydrogen fueling station to be located at existing Arco station at 18480 Brookhurst Street in the City of Fountain Valley. RK has reviewed the existing two driveways on Brookhurst Street and two driveways on Ellis Avenue and has concluded that the existing driveways are adequate to accommodate the proposed project. This study has also estimated the potential trip generation during both the AM/ PM peak hours and on a daily basis. Finally, the project access has been reviewed, and the project access and internal circulation and has been found to be acceptable. RK appreciates this opportunity to work with SGE Consulting Structural Engineers, if you have any questions please call me at (949) 474-0809. Respectfully submitted, RK ENGINEERING GROUP, INC.
Robert Kahn, P.E. Principal Registered Civil Engineer 20285 Registered Traffic Engineer 0555 Attachment RK:sl/rk14015.doc JN:2735-2018-03

______________________________________________________________________________
______________________________________________________________________________
Exhibits


______________________________________________________________________________
______________________________________________________________________________
Tables
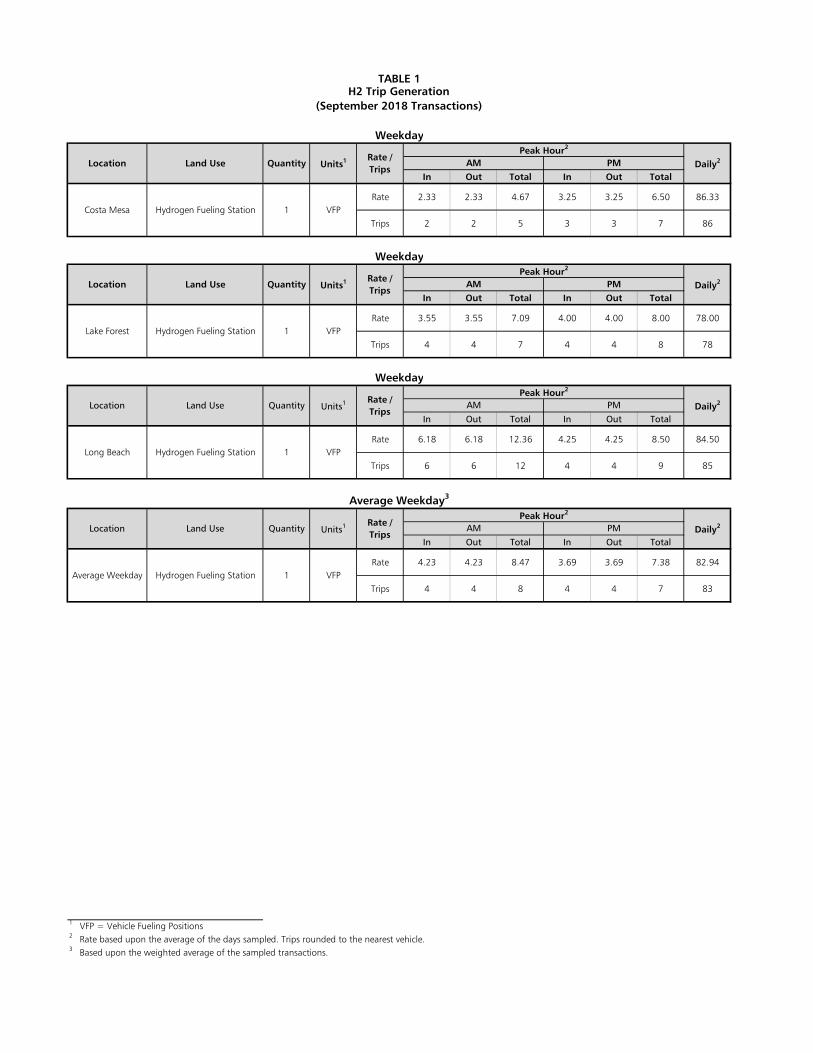
In Out Total In Out Total
Rate 2.33 2.33 4.67 3.25 3.25 6.50 86.33
Trips 2 2 5 3 3 7 86
In Out Total In Out Total
Rate 3.55 3.55 7.09 4.00 4.00 8.00 78.00
Trips 4 4 7 4 4 8 78
In Out Total In Out Total
Rate 6.18 6.18 12.36 4.25 4.25 8.50 84.50
Trips 6 6 12 4 4 9 85
In Out Total In Out Total
Rate 4.23 4.23 8.47 3.69 3.69 7.38 82.94
Trips 4 4 8 4 4 7 83
1 VFP = Vehicle Fueling Positions2 Rate based upon the average of the days sampled. Trips rounded to the nearest vehicle.3 Based upon the weighted average of the sampled transactions.
TABLE 1H2 Trip Generation
(September 2018 Transactions)
Location Land Use Quantity Units1Peak Hour2
Daily2AM PM
Daily2AM PM
Weekday
Weekday
Location Land Use Quantity Units1Peak Hour2
Costa Mesa Hydrogen Fueling Station 1 VFP
Rate /Trips
Weekday
Location Land Use Quantity Units1Peak Hour2
Daily2AM PM
Average Weekday3
Location Land Use Quantity Units1Peak Hour2
Daily2AM PM
1Lake Forest Hydrogen Fueling Station VFP
Rate /Trips
Long Beach Hydrogen Fueling Station 1 VFP
Rate /Trips
Average Weekday Hydrogen Fueling Station 1 VFP
Rate /Trips

In Out Total In Out Total
Rate 2.00 2.00 4.00 3.00 3.00 6.00 46.00
Trips 2 2 4 3 3 6 46
In Out Total In Out Total
Rate 4.00 4.00 8.00 7.00 7.00 14.00 84.00
Trips 4 4 8 7 7 14 84
In Out Total In Out Total
Rate 4.00 4.00 8.00 3.00 3.00 6.00 76.00
Trips 4 4 8 3 3 6 76
In Out Total In Out Total
Rate 3.33 3.33 6.67 4.33 4.33 8.67 68.67
Trips 4 3 7 5 4 9 69
1 VFP = Vehicle Fueling Positions2 Rate based upon the average of the days sampled. Trips rounded to the nearest vehicle.3 Based upon the weighted average of the observed counts.
TABLE 2H2 Trip Generation
(Observed Study 10/09/18)
Weekday
Location Land Use Quantity Units1 Rate /Trips
Peak Hour2
Daily2AM PM
Costa Mesa Hydrogen Fueling Station 1 VFP
WeekdayPeak Hour2
Daily2AM PM
Lake Forest Hydrogen Fueling Station 1 VFP
Location Land Use Quantity Units1 Rate /Trips
WeekdayPeak Hour2
Daily2AM PMRate /Trips
Long Beach Hydrogen Fueling Station 1 VFP
Location Land Use Quantity Units1
Average Weekday Hydrogen Fueling Station 1 VFP
Average Weekday3
Location Land Use Quantity Units1 Rate /Trips
Peak Hour2
Daily2AM PM


______________________________________________________________________________
______________________________________________________________________________
Appendices
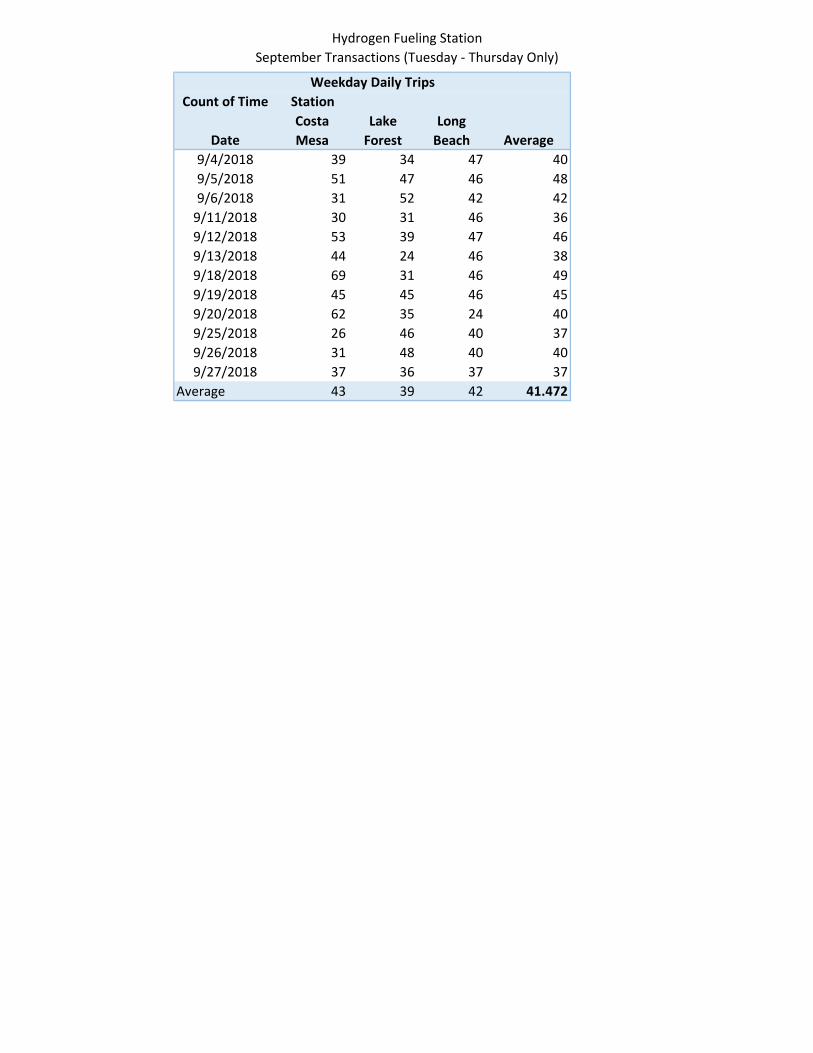
Hydrogen Fueling StationSeptember Transactions (Tuesday ‐ Thursday Only)
Count of Time Station
DateCosta Mesa
Lake Forest
Long Beach
9/4/2018 39 34 47 409/5/2018 51 47 46 489/6/2018 31 52 42 429/11/2018 30 31 46 369/12/2018 53 39 47 469/13/2018 44 24 46 389/18/2018 69 31 46 499/19/2018 45 45 46 459/20/2018 62 35 24 409/25/2018 26 46 40 379/26/2018 31 48 40 409/27/2018 37 36 37 37
Average 43 39 42 41.472
Weekday Daily Trips
Average

Hydrogen Fueling StationSeptember Transactions (Tuesday ‐ Thursday Only)
Count of Time TimeStation Date 7 AM 8 AM Grand TotalCosta Mesa 13 16 29
9/4/2018 3 2 5 39/5/2018 1 3 4 39/6/2018 1 2 3 2
9/10/2018 1 1 19/12/2018 2 2 29/19/2018 1 1 19/20/2018 5 1 6 59/26/2018 2 3 5 39/27/2018 1 1 2 1
Grand Total 13 16 29Average Max 2.333
Count of Time TimeStation Date 4 PM 5 PM Grand TotalCosta Mesa 32 25 57
9/4/2018 3 3 39/5/2018 1 2 3 29/6/2018 1 1 2 1
9/11/2018 3 3 39/12/2018 2 2 4 29/13/2018 1 6 7 69/18/2018 5 4 9 59/19/2018 3 1 4 39/20/2018 6 3 9 69/25/2018 3 3 6 39/26/2018 1 2 3 29/27/2018 3 1 4 3
Grand Total 32 25 57Average Max 3.250
Max
Max
Hydrogen Fueling StationSeptember Transactions (Tuesday ‐ Thursday Only)
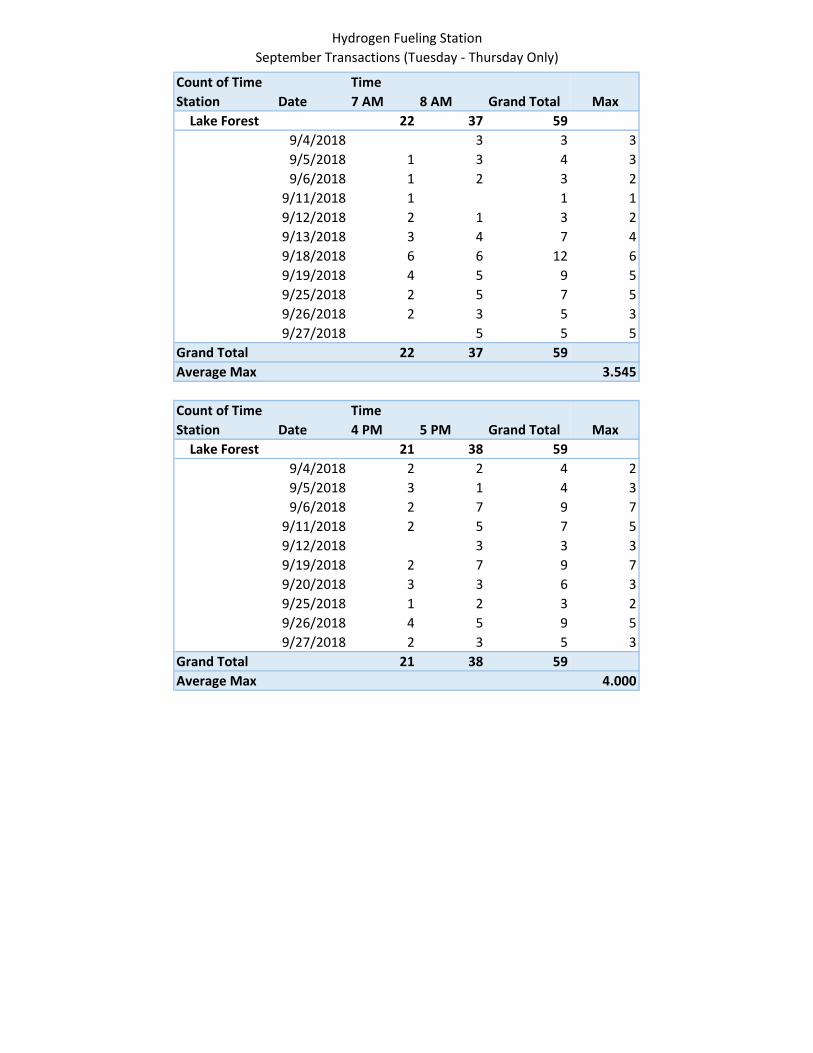
Count of Time TimeStation Date 7 AM 8 AM Grand TotalLake Forest 22 37 59
9/4/2018 3 3 39/5/2018 1 3 4 39/6/2018 1 2 3 2
9/11/2018 1 1 19/12/2018 2 1 3 29/13/2018 3 4 7 49/18/2018 6 6 12 69/19/2018 4 5 9 59/25/2018 2 5 7 59/26/2018 2 3 5 39/27/2018 5 5 5
Grand Total 22 37 59Average Max 3.545
Count of Time TimeStation Date 4 PM 5 PM Grand TotalLake Forest 21 38 59
9/4/2018 2 2 4 29/5/2018 3 1 4 39/6/2018 2 7 9 7
9/11/2018 2 5 7 59/12/2018 3 3 39/19/2018 2 7 9 79/20/2018 3 3 6 39/25/2018 1 2 3 29/26/2018 4 5 9 59/27/2018 2 3 5 3
Grand Total 21 38 59Average Max 4.000
Max
Max
Hydrogen Fueling StationSeptember Transactions (Tuesday ‐ Thursday Only)
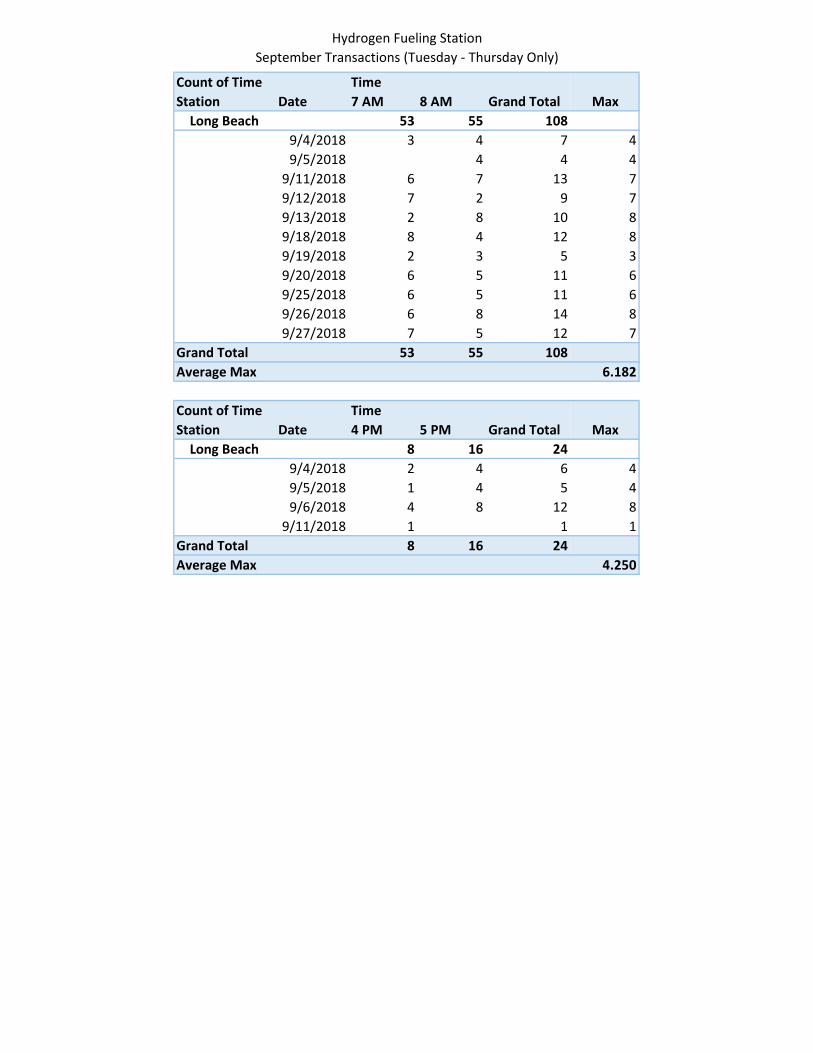
Count of Time TimeStation Date 7 AM 8 AM Grand TotalLong Beach 53 55 108
9/4/2018 3 4 7 49/5/2018 4 4 4
9/11/2018 6 7 13 79/12/2018 7 2 9 79/13/2018 2 8 10 89/18/2018 8 4 12 89/19/2018 2 3 5 39/20/2018 6 5 11 69/25/2018 6 5 11 69/26/2018 6 8 14 89/27/2018 7 5 12 7
Grand Total 53 55 108Average Max 6.182
Count of Time TimeStation Date 4 PM 5 PM Grand TotalLong Beach 8 16 24
9/4/2018 2 4 6 49/5/2018 1 4 5 49/6/2018 4 8 12 8
9/11/2018 1 1 1Grand Total 8 16 24Average Max 4.250
Max
Max

City:Location:Count Type:Date: 10/9/2018
Hydrogen FuelingPump Usage
0:00 00:15 00:30 00:45 01:00 11:15 01:30 01:45 12:00 02:15 02:30 02:45 03:00 03:15 03:30 03:45 04:00 04:15 04:30 04:45 05:00 05:15 05:30 05:45 06:00 06:15 06:30 06:45 07:00 07:15 07:30 07:45 18:00 08:15 18:30 08:45 09:00 09:15 09:30 09:45 010:00 110:15 110:30 010:45 011:00 011:15 011:30 011:45 012:00 012:15 112:30 112:45 013:00 113:15 113:30 113:45 014:00 014:15 114:30 014:45 015:00 015:15 015:30 015:45 016:00 016:15 116:30 016:45 117:00 117:15 017:30 017:45 018:00 018:15 118:30 018:45 019:00 119:15 119:30 119:45 020:00 020:15 120:30 220:45 021:00 021:15 021:30 021:45 022:00 122:15 022:30 022:45 023:00 023:15 023:30 023:45 0TOTAL 23
Costa Mesa2050 Harbor BoulevardHydrogen Fueling Pump Count
Counts Unlimited, Inc.PO Box 1178
Corona, CA 92878(951) 268‐6268

City:Location:Count Type:Date: 10/9/2018
Hydrogen FuelingPump Usage
0:00 00:15 00:30 00:45 01:00 01:15 01:30 01:45 02:00 02:15 02:30 02:45 03:00 03:15 13:30 03:45 04:00 04:15 04:30 04:45 05:00 05:15 05:30 05:45 06:00 06:15 06:30 06:45 07:00 17:15 07:30 17:45 28:00 08:15 18:30 08:45 19:00 09:15 19:30 19:45 110:00 110:15 110:30 010:45 011:00 011:15 011:30 011:45 112:00 112:15 012:30 112:45 013:00 113:15 113:30 013:45 114:00 014:15 014:30 014:45 015:00 115:15 015:30 115:45 016:00 016:15 116:30 116:45 017:00 317:15 117:30 117:45 218:00 118:15 218:30 118:45 019:00 019:15 119:30 119:45 020:00 020:15 120:30 120:45 021:00 121:15 221:30 121:45 022:00 022:15 022:30 022:45 023:00 023:15 123:30 023:45 0TOTAL 42
Lake Forest20731 Lake Forest DriveHydrogen Fueling Pump Count
Counts Unlimited, Inc.PO Box 1178
Corona, CA 92878(951) 268‐6268

City:Location:Count Type:Date: 10/9/2018
Hydrogen FuelingPump Usage
0:00 00:15 00:30 00:45 01:00 01:15 01:30 01:45 02:00 02:15 02:30 02:45 03:00 03:15 03:30 03:45 04:00 04:15 04:30 04:45 05:00 05:15 15:30 05:45 16:00 06:15 16:30 06:45 07:00 07:15 17:30 27:45 08:00 18:15 08:30 18:45 19:00 09:15 19:30 19:45 010:00 210:15 110:30 110:45 111:00 111:15 111:30 211:45 212:00 112:15 112:30 012:45 113:00 113:15 013:30 013:45 114:00 014:15 114:30 014:45 015:00 115:15 015:30 115:45 016:00 016:15 116:30 016:45 017:00 017:15 117:30 117:45 118:00 118:15 018:30 118:45 019:00 019:15 119:30 019:45 120:00 020:15 020:30 020:45 021:00 021:15 021:30 021:45 022:00 022:15 022:30 022:45 023:00 023:15 023:30 023:45 0TOTAL 38
Long Beach3401 Long Beach BoulevardHydrogen Fueling Pump Count
Counts Unlimited, Inc.PO Box 1178
Corona, CA 92878(951) 268‐6268
Job #000821 © Urban Systems Associates, Inc. FEF San Jose August 2, 2021
8451 Miralani Drive, Suite A • San Diego, CA 92126 • (858) 560-4911
6
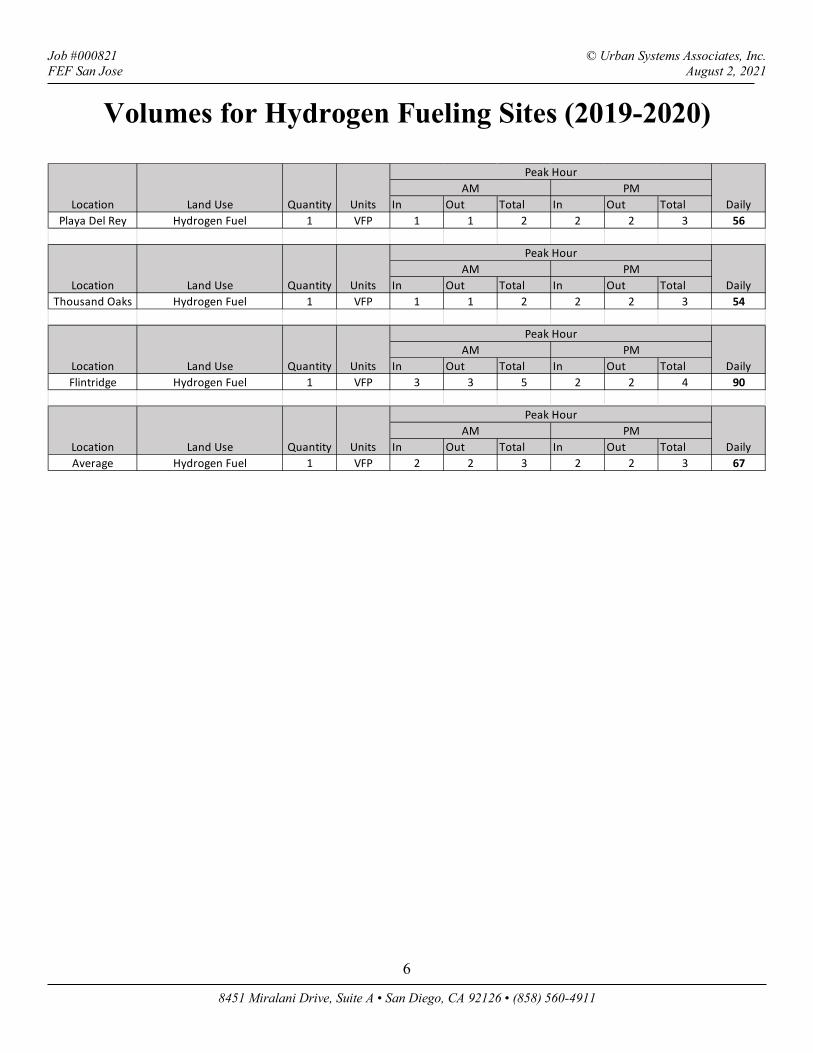
In Out Total In Out TotalPlaya Del Rey Hydrogen Fuel 1 VFP 1 1 2 2 2 3 56
In Out Total In Out TotalThousand Oaks Hydrogen Fuel 1 VFP 1 1 2 2 2 3 54
In Out Total In Out TotalFlintridge Hydrogen Fuel 1 VFP 3 3 5 2 2 4 90
In Out Total In Out TotalAverage Hydrogen Fuel 1 VFP 2 2 3 2 2 3 67
DailyUnitsQuantityLand UseLocationAM PM
Peak Hour
DailyAM PM
Location Land Use Quantity Units
Peak Hour
DailyAM
Location Land Use Quantity Units
Peak Hour
DailyAM PM
PM
Location Land Use Quantity Units
Peak Hour
Volumes for Hydrogen Fueling Sites (2019-2020)