audits, identity theft investigations, and taxpayer
TRANSCRIPT

Volume 2 TAS Research and Related Studies
Audits, Identity Theft Investigations, and Taxpayer Attitudes:
Evidence from a National Survey
Audits, Identity Theft Investigations, and Taxpayer Attitudes: Evidence from a National Survey

TAS RESEARCH AND RELATED STUDIES — Taxpayer Attitudes 148
Taxpayer Attitudes
Penalty Study
Settlement Initiatives
Telephone Service
TaxpayerEngagement
Use of IRS Services
OICProgram
EITC Letters
Collection Agencies
Audits, Identity Theft Investigations, and Taxpayer Attitudes: Evidence from a National Survey1
EXECUTIVE SUMMARY . . . . . . . . . . . . . . . . . . . . . . . . . . . . . . . . . . . . . . . . . . . . . . . . . . . . . . . . . . . . . . 149
INTRODUCTION . . . . . . . . . . . . . . . . . . . . . . . . . . . . . . . . . . . . . . . . . . . . . . . . . . . . . . . . . . . . . . . . . . . . 150
THE SLIPPERY SLOPE FRAMEWORK . . . . . . . . . . . . . . . . . . . . . . . . . . . . . . . . . . . . . . . . . . . . . . . . . . 152
Attitudes towards paying taxes . . . . . . . . . . . . . . . . . . . . . . . . . . . . . . . . . . . . . . . . . . . . . . . . . . . . . 153
Tax Knowledge and Prior Experiences . . . . . . . . . . . . . . . . . . . . . . . . . . . . . . . . . . . . . . . . . . . . . . . 154
Justice Perceptions . . . . . . . . . . . . . . . . . . . . . . . . . . . . . . . . . . . . . . . . . . . . . . . . . . . . . . . . . . . . . . 155
Social Norms . . . . . . . . . . . . . . . . . . . . . . . . . . . . . . . . . . . . . . . . . . . . . . . . . . . . . . . . . . . . . . . . . . 156
RESEARCH QUESTIONS . . . . . . . . . . . . . . . . . . . . . . . . . . . . . . . . . . . . . . . . . . . . . . . . . . . . . . . . . . . . . . 157
SURVEY INSTRUMENT AND SAMPLE DESIGN . . . . . . . . . . . . . . . . . . . . . . . . . . . . . . . . . . . . . . . . . . 157
Sample Selection . . . . . . . . . . . . . . . . . . . . . . . . . . . . . . . . . . . . . . . . . . . . . . . . . . . . . . . . . . . . . . . . 158
Sample Characteristics . . . . . . . . . . . . . . . . . . . . . . . . . . . . . . . . . . . . . . . . . . . . . . . . . . . . . . . . . . . 159
PRELIMINARY FINDINGS . . . . . . . . . . . . . . . . . . . . . . . . . . . . . . . . . . . . . . . . . . . . . . . . . . . . . . . . . . . . . 161
Attitudes of Audited and Non-audited Schedule C Taxpayers and Wage Earners . . . . . . . . . . . . . . . 162
Attitudes of Audited Schedule C Filers by Audit Type and Outcome . . . . . . . . . . . . . . . . . . . . . . . . 163
Attitudes of ID Theft Victims . . . . . . . . . . . . . . . . . . . . . . . . . . . . . . . . . . . . . . . . . . . . . . . . . . . . . 167
Survey Results Within the Slippery Slope Framework . . . . . . . . . . . . . . . . . . . . . . . . . . . . . . . . . . . 168
SUMMARY AND DIRECTIONS FOR FUTURE RESEARCH . . . . . . . . . . . . . . . . . . . . . . . . . . . . . . . . . . 171
REFERENCES . . . . . . . . . . . . . . . . . . . . . . . . . . . . . . . . . . . . . . . . . . . . . . . . . . . . . . . . . . . . . . . . . . . . . . 172
APPENDIX A: SURVEY INSTRUMENT . . . . . . . . . . . . . . . . . . . . . . . . . . . . . . . . . . . . . . . . . . . . . . . . . . 176
APPENDIX B: SURVEY ITEMS, FACTOR ANALYSES AND CRONBACH ALPHA’S OF SCALES . . . 188
1 Matthias Kasper, Sebastian Beer, Erich Kirchler & Brian Erard are the authors of this study. They also wish to thank the National Taxpayer Advocate and the Taxpayer Advocate Service (TAS) for their sponsorship and support of this research study, and, in particular, Jeff Wilson, Kim Bloomquist, and Carol Hatch for their ongoing assistance.
Taxpayer Advocate Service — 2017 Annual Report to Congress — Volume Two 149
EITC Letters
Collection Agencies
OICProgram
Taxpayer Attitudes
Penalty Study
Settlement Initiatives
Telephone Service
TaxpayerEngagement
Use of IRS Services
EXECUTIVE SUMMARY
This report presents preliminary results from a study of taxpayer attitudes and how they are influenced by IRS audits and identity (ID) theft investigations .2 The analysis explores how attitudes among self-employed taxpayers are shaped by different types of audits and different audit outcomes . It also investigates how taxpayer attitudes differ among wage earners who have experienced an ID theft investigation and those who have not . The results are preliminary, and the analysis will need to be further refined to understand how attitudes regarding interactions with the IRS ultimately impact future taxpayer behavior .
To address these questions, we surveyed 3,486 tax filers comprised of 757 wage earners and 2,729 Schedule C filers . Among the Schedule C filers, 1,363 were audited and 1,366 were not audited . Our analysis reveals that nearly 39 percent of audited Schedule C filers do not seem to recall being audited, including about 45 percent of those who received a refund as a result of their examination . Audit recollection is especially poor among taxpayers who have experienced a correspondence examination, which suggests that correspondence examinations may not be perceived as actual audits . For field and office audits, the majority of participants do remember being audited, suggesting that these types of examinations might have a stronger effect on taxpayer attitudes and behavior .
When comparing different types of taxpayers, we find that self-employed taxpayers are more prone to think about cheating . This finding is in line with the literature on the link between opportunity to cheat and noncompliant behaviors . Moreover, we find that self-employed taxpayers perceive higher audit probabilities and higher fines for noncompliance . Consequently, they sense a greater threat of deterrence . Compared to non-audited Schedule C filers, we find that audited Schedule C filers perceive a higher risk of being audited and thus higher levels of coercive power . Surprisingly, audited self-employed taxpayers indicate a stronger sense of procedural justice, information justice, interpersonal justice, and distributive justice than those who have not been audited . This indicates that those who have actually experienced an IRS audit process are more likely to view IRS procedures as transparent, respectful, and appropriate in their outcomes than those who have not . However, this result might be driven by the relatively large share of taxpayers who received either no adjustment or a tax refund as a result of the audit . Under our sampling design, less than half (44 percent) of audited taxpayers in our sample received a positive tax adjustment (i.e ., owed additional tax as a result of the audit) .
When exploring how attitudes vary across different audit types and outcomes, we find lowest levels of perceived justice among taxpayers who have received a positive adjustment to their taxes .3 Similarly, these taxpayers report the lowest levels of trust in the IRS, the strongest perceptions of enforced compliance, and the greatest audit risk . Moreover, they indicate higher levels of anger and perceived threat when thinking of the IRS . Interestingly, we observe the strongest contrast between different audit outcomes for distributive justice, where taxpayers who receive no tax adjustment4 score higher than taxpayers who experience either a positive adjustment or a refund . Likewise, we observe the highest levels of positive sentiments among individuals who receive no audit adjustment in either direction . This suggests that receiving a tax refund does not necessarily induce positive opinions about the IRS . Further analysis on the dynamics between audit outcomes, perceptions of the IRS, and subsequent reporting behavior might contribute to the understanding of differential responses to audits found in prior research (Beer, Kasper, Kirchler, & Erard, 2015) .
2 ID theft investigations include cases where the taxpayer is known to be ID theft victim, where the IRS suspects ID theft on the return, or the where the IRS suspects the return does not appear to be a legitimate claim for refund.
3 In other words, the audit determined that these taxpayers owed additional tax.4 The audit determined these taxpayers had reported the correct amount of tax on the return being examined.

TAS RESEARCH AND RELATED STUDIES — Taxpayer Attitudes 150
Taxpayer Attitudes
Penalty Study
Settlement Initiatives
Telephone Service
TaxpayerEngagement
Use of IRS Services
OICProgram
EITC Letters
Collection Agencies
Survey responses of taxpayers who experienced an IRS investigation involving a potentially fraudulent refund claim by someone improperly using their identification reveal that only about one-third of these victims recall the incident . To gain a better understanding of how IRS investigative procedures of alleged, or suspected ID theft or other suspected fraudulent refund claims impact taxpayer attitudes, more research is needed to understand why so many respondents seem unable to recall either being a victim of ID theft or the IRS questioning the legitimacy of their refund claim . Further research is also warranted on how the duration and effectiveness of IRS ID theft or potentially fraudulent refund investigations affects taxpayer attitudes and behavior .
Finally, following the reasoning of the Slippery Slope Framework (Kirchler, 2007), we have analyzed correlations between the survey scales and found that perceptions of audit risk and penalties are closely related to perceived coercive power . Perceptions that the IRS exercises power in legitimate ways and feelings of trust in the tax authority are highly related to tax knowledge, justice perceptions, and social norms . Perceptions of coercive power and trust elicit different emotions, which are related to enforced or voluntary compliance . While enforced compliance correlates positively with thoughts about cheating on taxes, voluntary compliance is negatively related to these thoughts .
INTRODUCTION
This report presents findings from a preliminary study of taxpayer attitudes and how they are influenced by audits and ID theft investigations .5 We compare opinions towards the tax system and paying taxes among audited and unaudited self-employed taxpayers (Schedule C filers) as well as wage earners who have and have not experienced an IRS ID theft investigation . In the case of self-employed taxpayers, we investigate how both the type of audit and the outcome of the examination shape taxpayer attitudes . In the case of wage-earners, we explore the attitudinal implications of IRS procedures for handling cases involving potential ID theft and fraudulent tax refund claims .
Despite ongoing efforts to increase compliance, the tax gap remains high, currently estimated to be $458 billion (IRS, 2016) . However, the drivers of tax noncompliance are not fully understood, and relatively little is known about how taxpayer attitudes influence their compliance behavior . Prior work by the Taxpayer Advocate Service (Beers, LoPresti, and San Juan, 2012) finds low levels of trust in both the federal government, overall, and the IRS, in particular, among small business owners who are classified as high-risk (i.e., less compliant taxpayers) . The study also found that such individuals perceive both the tax system and the IRS as relatively unfair, which suggests that negative attitudes might contribute to tax noncompliance .
A more recent TAS study shows that operational tax audits, which are generally targeted towards high-risk taxpayers, successfully identify returns with unreported taxes and increase subsequent reporting compliance (Beer et al ., 2015) . This is in line with a substantial body of evidence on the deterrent effect of audits (e.g . Allingham & Sandmo, 1972; Alm, Jackson & McKee, 2009; DeBacker, Heim, Tran, & Yuskavage, 2015; Kleven, Knudsen, Kreiner, Pedersen, & Saez, 2011; Slemrod, Blumenthal, & Christian, 2001) . However, for audited taxpayers who do not experience an additional tax assessment, the TAS study finds detrimental audit effects . As the drivers of behavioral responses to audits remain unclear, an important step is to gain a better understanding of how experiencing an audit shapes taxpayer attitudes . For instance, experiencing a coercive enforcement activity could reduce tax morale among honest taxpayers . Likewise, audited taxpayers might infer that the risk of a future
5 ID theft investigations include cases where the taxpayer is known to be ID theft victim, where the IRS suspects ID theft on the return, or the where the IRS suspects the return does not appear to be a legitimate claim for refund.

Taxpayer Advocate Service — 2017 Annual Report to Congress — Volume Two 151
EITC Letters
Collection Agencies
OICProgram
Taxpayer Attitudes
Penalty Study
Settlement Initiatives
Telephone Service
TaxpayerEngagement
Use of IRS Services
examination is low given that the IRS was unable to detect additional taxable income . Attitudinal changes, such as a decline in tax morale or a shift in risk attitudes, could explain unexpected behavioral responses to tax audits (Lederman, 2017) .
Indeed, the notion that more audits must result in more compliance is increasingly being challenged . A recent study that analyzes panel data from 50 countries finds a U-shaped relationship between audit levels and tax compliance (Mendoza, Wielhouwer, & Kirchler, 2017) . This indicates that excessive enforcement might backfire . Moreover, several laboratory experiments that analyze the effects of tax audits on subsequent reporting compliance find “bomb-crater” effects, where compliance decreases in response to audits (Guala & Mittone, 2005; Kastlunger, Kirchler, Mittone, & Pitters, 2009; Maciejovsky, Kirchler, & Schwarzenberger, 2007; Mittone, 2006) . Similarly, Gemmell and Ratto (2012) find that random tax audits reduce subsequent reporting compliance among taxpayers who are found to be compliant . One possible explanation is that such taxpayers misperceive the probability of future audits (Mittone, Panebianco, & Santoro, 2017) . On the other hand, tax audits might crowd out the intrinsic motivation to comply among honest individuals (Lederman, 2017) or further decrease the willingness to pay among taxpayers whose cheating has not been detected during an audit .
Evidence suggests that a sizeable share of taxpayers do comply with their tax obligations even when faced with very low audit probabilities (Alm, McClelland, & Schulze, 1992) . In the absence of high levels of deterrence, a growing body of literature suggests that other factors, such as the interaction climate between tax administrations and taxpayers shape the willingness to cooperate (Alm, Kirchler, & Muehlbacher, 2012) . Traditionally, tax authorities have relied heavily on enforcement to combat tax evasion . However, they have also recognized that noncompliant behavior does not always reflect a lack of willingness to cooperate . Some individuals might be committed to pay their fair share of taxes, yet they might be unable to do so (Braithwaite, 2003) . It is unlikely that enforcement is the ideal regulatory strategy for such taxpayers . Therefore, tax agencies have increasingly combined “enforcement”, “service”, and “trust” paradigms to establish high levels of compliance (Alm, 2012; Alm & Torgler, 2011) . As emphasized by Alm and Torgler (2011), the establishment of an effective compliance strategy typically involves: (i) increasing the number and improving the quality of tax audits; (ii) acting more consumer-oriented and providing high-quality services; and (iii) reducing perceived unfairness and highlighting the link between taxes and government services to promote voluntary compliance .
To improve the interaction climate between taxpayers and the IRS, it is crucial to look beyond audits . In its 2016 Annual Report to Congress, the National Taxpayer Advocate identified fraud detection as one of the most serious problems (TAS, 2016) . Taxpayers are increasingly exposed to fraud and ID theft, resulting in improper refunds totaling over $5 billion for tax year 2010 alone . In response, the IRS has upgraded its screening process and tightened the rules to authenticate tax return information . Yet the false positive rates of IRS fraud detection systems are substantial . Over the first nine months of calendar year 2016, false positive rates reportedly exceeded 50 percent for many IRS filters and business rules for detecting fraudulent returns and ID theft, including one review process with a false positive rate of approximately 91 percent . These false positives led to delays in processing legitimate claims of about $9 billion in tax refunds of more than 30 days, on average . This not only imposes a financial hardship on taxpayers, it also has the potential to erode trust in the IRS, which could adversely impact voluntary compliance .
Kirchler (2007) proposes a conceptual framework to study how the interaction climate between taxpayers and the tax agency affects willingness to cooperate . The “Slippery Slope Framework” suggests that enforcement capacity (power) and trust affect taxpayers’ willingness to cooperate . When taxpayers

TAS RESEARCH AND RELATED STUDIES — Taxpayer Attitudes 152
Taxpayer Attitudes
Penalty Study
Settlement Initiatives
Telephone Service
TaxpayerEngagement
Use of IRS Services
OICProgram
EITC Letters
Collection Agencies
are perceived as potential criminals and treated accordingly, compliance results from the fear of penalties alone . The resulting climate is antagonistic, where the tax agency and taxpayers work against each other . However, when the agency views taxpayers as clients and provides high-quality services, taxpayers are more likely to believe that paying taxes is the right thing to do . The resulting climate is synergistic . We use this framework to assess how the interaction between the IRS and taxpayers shape taxpayer attitudes .
More specifically, we explore how the attitudes of self-employed taxpayers are shaped by different types of audit experiences (office, field, and correspondence) and different audit outcomes (positive tax adjustment, no-change, and refund) . We also investigate how the IRS’ handling of ID theft cases affects the attitudes of affected wage earners towards paying taxes . To address these questions, TAS commissioned a survey of about 3,500 taxpayers, including both audited and unaudited Schedule C filers as well as wage earners that did and did not experience an ID theft investigation or the questioning of the legitimacy of a claim . Our analysis reveals differences in attitudes among different types of taxpayers . Audited self-employed taxpayers indicate higher perceived levels of audit risk and fines for noncompliance and lower levels of trust in the IRS . They are also relatively more likely to agree strongly with the statement that “paying taxes feels like something is taken away from me rather than a contribution to society” than non-audited self-employed taxpayers . Moreover, our results indicate that taxpayer attitudes vary in accordance with the type of audit they experience and the outcome of the examination . For instance, individuals who have experienced a correspondence audit report lower levels of perceived justice in IRS procedures . Audited taxpayers who have received a positive tax adjustment report a higher perceived audit risk, lower levels of justice and less trust in the IRS than taxpayers experiencing no adjustment to their taxes or a refund . This report sets the groundwork for a more thorough analysis of the dynamics between taxpayer attitudes and tax compliance behavior . Exploring these dynamics will shed light on how taxpayer perceptions of audits shape their opinions and, in turn, affect future compliance behavior .
The remainder of this report is organized as follows . In the following section, we introduce the “Slippery Slope Framework” and summarize the literature on the psychological determinants of tax compliance . Section 3 introduces our research questions, while Section 4 describes our survey instrument, sampling methodology, and data . We report the preliminary findings from our analysis of the research questions in Section 5 . Section 6 summarizes our main findings and provides an outlook on promising avenues for future research .
THE SLIPPERY SLOPE FRAMEWORK
The Slippery Slope Framework (SSF, Figure 1) is a conceptual framework that explains tax compliance behavior . It provides an overview of a large body of literature on the determinants of tax compliance (e.g . Alm et al ., 1992; Alm & Torgler, 2011, Andreoni, Erard & Feinstein, 1998; Kirchler, 2007) . The SSF assumes that tax compliance behavior is a function of both trust in the tax authority and the power of that authority . Taxpayers cooperate voluntarily when they perceive that the tax system is just, when they feel that they are being treated fairly by the tax agency, and when they view paying taxes as a social norm (Tyler et al ., 2015) . Consequently, building trust elevates voluntary tax compliance . However, taxpayers also respond to coercion . A tax authority’s power reflects its capacity to enforce compliance through audits, penalties, and criminal investigations . While enforced compliance results from an extensive decision process under which individuals weigh the costs and benefits of noncompliance, voluntary cooperation is more intuitive and spontaneous (Rand, Greene & Nowak, 2012) .

Taxpayer Advocate Service — 2017 Annual Report to Congress — Volume Two 153
EITC Letters
Collection Agencies
OICProgram
Taxpayer Attitudes
Penalty Study
Settlement Initiatives
Telephone Service
TaxpayerEngagement
Use of IRS Services
FIGURE 5.1, The Slippery Slope Framework (adapted from Kirchler, 2007; Kirchler, Hoelzl, & Wahl, 2008, p. 212)
The Slippery Slope framework assumes that a combination of trust and power explains compliance behavior . For low levels of trust and power, compliance is low . But with increasing levels of either trust or power, compliance increases . To achieve high levels of compliance, tax agencies should establish a trustful relationship with taxpayers and provide high-quality services . At the same time, the agency should be able to coerce taxpayers to cooperate when they are not willing to do so . The literature on the relationship between deterrence and compliance originates from Becker’s theory of crime (1968), which has been adapted to address the issue of tax compliance by Allingham and Sandmo (1972) and Srinivasan (1973) . For instance, Alm, Jackson, and McKee (1992) use laboratory experiments to show that reporting compliance increases with greater audit and penalty rates . On the other hand, a growing body of literature examines the relationship between trust and voluntary compliance (Kirchler, 2007) . Below, we summarize the literature on the dynamics between attitudes towards paying taxes, trust, and compliance .
Attitudes towards paying taxesAttitudes towards paying taxes are generally negative (Eriksen & Fallan, 1996), and aversion to pay taxes even seems to exceed rational economic motivation to avoid monetary costs . A series of experimental studies has revealed that individuals prefer to avoid tax-related costs over avoiding equal, or larger, costs that are not related to taxes (Sussman & Olivola, 2011) . One common explanation for negative attitudes towards paying taxes is that the tax burden is perceived to be too high; attitudes towards taxes are lowest among high income individuals (Lewis, 1979) . On the other hand, taxpayers who perceive the system as fair also exhibit more positive attitudes toward paying taxes (Wilson & Sheffrin,

TAS RESEARCH AND RELATED STUDIES — Taxpayer Attitudes 154
Taxpayer Attitudes
Penalty Study
Settlement Initiatives
Telephone Service
TaxpayerEngagement
Use of IRS Services
OICProgram
EITC Letters
Collection Agencies
2005) . Other factors that seem to affect the willingness to cooperate are religious and political beliefs (Wahlund, 1992; Prinz, 2004; Alm & Torgler, 2006) as well as age, gender, education, and income (Hofmann, Voracek, Bock, & Kirchler, 2017) .
One approach to studying attitudes towards paying taxes is to evaluate individual’s perceptions regarding honest and dishonest taxpayers . For instance, Kirchler (1998) finds that tax evaders are perceived as relatively smart . Honest taxpayers are described as hardworking and intelligent, whereas typical taxpayers are considered to be rather dull and lazy . More recent evidence suggests that the picture is slightly more nuanced (Kasper, Olsen, Kogler, Stark & Kirchler, 2018) . Tax evaders are still perceived as significantly smarter than typical taxpayers, yet individuals who save on taxes without breaking the law (tax avoiders) are considered to be even more intelligent . Overall, tax avoiders and honest taxpayers are evaluated more positively than typical taxpayers and tax evaders .
One strand of existing research explores attitudes towards taxes among different occupational groups . Self-employed taxpayers (especially, those in newly established businesses) oppose paying taxes, because taxes are perceived as a restriction on entrepreneurial freedom and are believed to demotivate economic activity (Kirchler, 1998; 1999) . Consequently, self-employed taxpayers exhibit a relatively high propensity to evade . Blue-collar workers express equally negative attitudes . They argue that politicians use taxes for their own benefit . Civil servants and wage earners, on the other hand, tend to report more positive attitudes that link taxes to social justice and welfare . Negative attitudes towards paying taxes also result from a perceived waste of tax dollars .
A major driver of negative attitudes towards paying taxes is tax system complexity, particularly in the absence of high-quality taxpayer services . The National Taxpayer Advocate has repeatedly named complexity as one of the most severe impediments to voluntary compliance (see, for instance, TAS, 2012) . More specifically, the volume of the federal tax code has increased steadily over the last several decades (Owens & Hamilton, 2004); the tax code is subject to changes at a rate of more than once per day, on average (IRS, 2012) . As the tax law is very difficult to understand (Moser, 1994) and most taxpayers are not sufficiently literate to comprehend its specifics (Lewis, 1982), ordinary taxpayers blame the complexity of the system for their lack of competence and interest in taxes (McKerchar, 2001) . Not surprisingly, only a fraction of taxpayers feels competent when reporting their taxes (Sakurai & Braithwaite, 2003) . Complexity imposes substantial compliance costs on taxpayers (TAS, 2012) . At the same time, it presents multinational corporations and high-income earners with ample opportunity to exploit loopholes to avoid paying taxes . This is perceived as unfair and erodes tax morale (i.e., the intrinsic motivation to pay taxes) .
Negative attitudes towards paying taxes result from poor tax system design, complexity in tax law, and excessive compliance costs . However, taxpayers’ willingness to cooperate is not driven by institutional factors alone . The following sections discuss individual determinants of tax compliance behavior .
Tax Knowledge and Prior ExperiencesSeveral studies investigate the link between tax knowledge and the willingness to comply . On average, levels of tax knowledge are low . For instance, several studies show that taxpayers have inconsistent views on tax policy reform, advocating tax rate cuts and increased public expenditures at the same time (e.g., Kemp, 2008; Kirchler, 1997) . Moreover, many taxpayers seem not to understand the concept of progressive taxation (McCaffery & Baron, 2004; Roberts, Hite & Bradley, 1994) . At a conceptual level, a majority of taxpayers perceive that a flat tax system is less fair than a progressive system . However, their preference ranking reverses once it is established that doubling one’s income increases the tax

Taxpayer Advocate Service — 2017 Annual Report to Congress — Volume Two 155
EITC Letters
Collection Agencies
OICProgram
Taxpayer Attitudes
Penalty Study
Settlement Initiatives
Telephone Service
TaxpayerEngagement
Use of IRS Services
burden by more than a factor of two under a progressive tax system . These findings illustrate the difficulty of assessing the degree of public approval of tax policy reform .
Previous research suggests that increasing tax knowledge has positive implications for tax compliance . Eriksen and Fellan (1996) find that advancing tax knowledge alters attitudes towards evasion . Kirchler (1999) shows that owners of business startups oppose paying taxes more strongly than more experienced self-employed taxpayers, and Kirchler and Maciejovsky (2001) observe a positive correlation between knowledge of tax law and tax morale among entrepreneurs . A recent survey of self-employed taxpayers in Austria and Germany finds more positive attitudes towards taxes and a higher willingness to comply voluntarily among taxpayers with high levels of tax knowledge (Olsen et al., 2017) . However, Rodriguez-Justicia and Theilen (2017) suggest that the effect of education on tax morale is conditional on net social benefits . While education has a positive impact on tax morale for net beneficiaries, tax morale is low among highly educated net contributors .
Taxpayers learn from past experiences with tax authorities and from communication with each other . For instance, several studies find substantial indirect revenue effects of tax audits . Specifically, taxpayers who have not been audited report more income when they learn that others have been audited (Alm et al ., 2009; Dubin, Graetz, & Wilde, 1990; Dubin, 2007) . On the other hand, the audit experience itself directly impacts subsequent reporting compliance (e.g., DeBacker et al ., 2015; Kleven et al ., 2011; Slemrod et al ., 2001) . A recent TAS study shows that the outcome of an audit affects taxpayers’ willingness to comply (Beer et al ., 2015) . Taxpayers who have received an additional tax assessment increase their reported income in subsequent years . In contrast, taxpayers with no additional assessment report less in the years following the audit . The study provides several different possible explanations . Honest taxpayers may have learned that they had been reporting too much tax, causing them to legitimately report less in future years . Alternatively, perceptions of a coercive enforcement experience may have reduced tax morale, thereby crowding out voluntary compliance (Lederman, 2017) . Another possibility is that the lack of an additional tax assessment led some audited taxpayers to perceive the IRS is unable to detect unreported taxes or that the risk of a future examination is low (Mittone et al ., 2017) . At this point it is unclear which of these explanations prevails and, despite previous research on the link between tax knowledge, prior experiences, and compliance behavior, causal effects remain largely unknown .
Justice PerceptionsPerceived justice is a fundamental determinant of voluntary compliance (Andreoni et al ., 1992, Hofmann, Gangl, Kirchler, & Stark, 2014) . Fairness in the interaction between tax authorities and taxpayers is achieved by mutual respect, neutrality, and goodwill (Tyler, 2006) . Following Colquitt (2001), the literature usually distinguishes between procedural justice, informational justice, interpersonal justice, and distributive justice .
Procedural justice refers to the transparency, consistency, and neutrality of processes . It is affected by individuals’ ability to express their views and to influence the outcome of a decision . Informational justice and interpersonal justice relate to fairness in interactions (Bies & Moag, 1986) such as justification (explaining decisions), truthfulness (no deception), respect (politeness), and propriety (no improper remarks) . While fairness in explanations establishes informational justice, interpersonal justice relates to sensitivity and respect (Greenberg, 1990) . Distributive justice results from a match between the outcome of a decision and the goals of the decision; for instance, improving cooperation or promoting social welfare . To achieve distributive justice, the tax burden should be allocated fairly among taxpayers with equal incomes (horizontal equity) and unequal incomes (vertical equity) .

TAS RESEARCH AND RELATED STUDIES — Taxpayer Attitudes 156
Taxpayer Attitudes
Penalty Study
Settlement Initiatives
Telephone Service
TaxpayerEngagement
Use of IRS Services
OICProgram
EITC Letters
Collection Agencies
Moreover, Alm et al ., (2012) point out that benefits from social goods should be reflected in individual tax payments (exchange fairness) .
A professional tax administration is key to achieving fairness in taxation . Tax agencies can strengthen perceived justice by treating taxpayers equally and respectfully, providing high quality services, and ensuring that taxpayers pay their fair share . As large-scale tax avoidance threatens to erode ordinary taxpayers’ trust in the system (Kasper, Kogler, & Kirchler, 2015), this is particularly relevant (Hartner, Rechberger, Kirchler, & Wenzel, 2011) . One focus of this study is thus to assess whether taxpayers perceive that the tax system is fair, both in general terms and with respect to various IRS administrative procedures .
Social NormsSocial norms play a critical role in tax compliance behavior (Alm, McClelland & Schulze, 1999) . The literature typically distinguishes between descriptive and injunctive norms (Wenzel, 2005) . Injunctive norms describe individuals’ perceptions of which behaviors are socially approved, whereas descriptive norms are individuals’ perceptions of how relevant others actually behave . Injunctive and descriptive norms affect the willingness of taxpayers to comply . For instance, perceived levels of tax evasion affect attitudes towards tax noncompliance . The more common that taxpayers perceive noncompliance to be, the less negative is their attitude towards these behaviors and the more likely it is that they will become noncompliant, themselves (Welch, Xu, Bjanason, Petee, O’Donnell, & Magro, 2005) . Torgler (2005) finds a relationship between tax morale and descriptive norms; individuals who are personally aware of tax evasion committed by others exhibit lower levels of tax morale . On the other hand, a field experiment in the UK finds that appealing to social norms can result in increased tax compliance (Hallsworth et al ., 2016) .
Social norms are stronger within relevant reference groups (Wenzel, 2004) . That is, taxpayers respond more strongly to the behavior of others when they identify with them . Survey studies find a positive link between patriotism and pro-social behavior (Huddy & Khatib, 2007; Wenzel, 2007), and experimental work suggests a positive effect of patriotism on tax compliance (Gangl, Torgler, & Kirchler, 2016) . Social norms thus have the potential to increase or decrease the willingness to cooperate . They help to explain why noncompliance is widespread among certain occupational groups but not tolerated among others .

Taxpayer Advocate Service — 2017 Annual Report to Congress — Volume Two 157
EITC Letters
Collection Agencies
OICProgram
Taxpayer Attitudes
Penalty Study
Settlement Initiatives
Telephone Service
TaxpayerEngagement
Use of IRS Services
RESEARCH QUESTIONS (SECTION 3)
This study addresses two research questions . The first question is: “How do attitudes towards paying taxes vary among different types of taxpayers?” For this question, we focus on a comparison of self-employed taxpayers (audited and unaudited) and wage earners (who did or did not experience either IRS ID theft processing procedures or who experienced the IRS questioning the legitimacy of their refund return) . The second research question is: Do attitudes among audited self-employed taxpayers vary in accordance with the type of audit and the outcome of the examination?”
As wage income is usually subject to third-party reporting, wage earners tend to have relatively few opportunities for tax noncompliance in comparison with self-employed taxpayers (Kleven et al ., 2011) . However, it is unlikely that opportunity alone drives tax compliance behavior . Personal beliefs, social norms, and past experiences with the IRS shape taxpayer attitudes . Personal experiences might be particularly relevant for taxpayers who have been victims of tax fraud involving ID theft or who have been suspected of tax fraud . Solving these cases frequently delays legitimate refund claims substantially, which imposes financial hardship on taxpayers, potentially erodes trust in the IRS, and might adversely impact voluntary compliance . Against this background, analyzing the attitudes of different occupational groups will contribute to an understanding of the determinants of tax noncompliance .
Attitudes of self-employed taxpayers who recently experienced an audit might explain differential behavioral responses to examinations (Gemmel & Ratto, 2012; Beer et al ., 2015) . For instance, audited taxpayers might misperceive the probability of future audits (Mittone et al ., 2017) . Alternatively, audits might crowd out the intrinsic motivation to comply among honest individuals (Lederman, 2017) or further decrease the willingness to pay of taxpayers whose cheating has gone undetected . Behavioral responses will likely reflect the type and outcome of the examination . Field audits, for instance, might have a more powerful impact on attitudes than correspondence audits . Similarly, taxpayers may have a more positive outlook following an audit that concludes with a tax refund than one that results in an additional tax assessment . However, the attitudinal implications of tax audits that result in no tax change are less clear . In such cases the subjective appraisal of the audit experience might have a strong effect on future reporting behavior .
SURVEY INSTRUMENT AND SAMPLE DESIGN (SECTION 4)
The Slippery Slope Framework was employed as a guide in designing the survey instrument . We have constructed scales from the survey responses to relevant sets of related questions that reflect the various determinants of compliance behavior under this framework . For instance, the perceived audit probability scale is based on a combination of the individual rankings (on a scale from 1 to 9) for two questions on the perceived risk of audit (questions DF1 and DF2) .6 Figure 5 .2 provides an overview of the survey scales . A copy of the survey instrument is provided in Appendix A . The individual survey items, the correlations between these items, and the construction of scales based on these items are presented in Appendix B .
6 Some individual questions were specified in a form where the ranking had the opposite interpretation of those provided for related questions. In such cases, the original ranking was subtracted from nine to make it consistent with the other items (as is standard practice).

TAS RESEARCH AND RELATED STUDIES — Taxpayer Attitudes 158
Taxpayer Attitudes
Penalty Study
Settlement Initiatives
Telephone Service
TaxpayerEngagement
Use of IRS Services
OICProgram
EITC Letters
Collection Agencies
FIGURE 5.2, List of Survey Scales
Survey Scale Description
Audit probability Perceived audit probability
Fines Perceived severity of fines for noncompliance
Tax knowledge Subjective competence when filing taxes
Attitudes General attitude towards paying taxes
Motivation Subjective motivation to comply (obligation vs. contribution to society)
Justice
Procedural justice Perceived justice in IRS procedures (e.g., audit, ID theft)
Informational justice Perceived transparency in communications with IRS
Interpersonal justice Perceived fairness of treatment by IRS employees
Distributive justice Perceived fairness of outcomes of IRS procedures (e.g., audit, ID theft)
Social norms Perceived compliance levels of other taxpayers
Coercive power IRS enforcement capacity
Legitimate power Legitimacy of enforcement
Trust Trust in the IRS
Emotions
Fear Fear of the IRS
Anger Anger at the IRS
Caution Feeling cautious regarding the IRS
Threat Feeling threatened by the IRS
Protection Feeling protected by the IRS
Enforced compliance Compliance out of fear for punishment
Voluntary compliance Compliance out of moral obligation
Thought about cheating Have taxpayers thought about cheating?
Note: Survey items are provided in Appendix B
Sample SelectionSeparate survey samples were drawn for different taxpayer groups . Two samples of wage earners were drawn of approximately 400 respondents each . The first was a random sample of wage earners who appeared to have been subject to an ID theft investigation or a suspected illegitimate refund claim . Ultimately, some of the respondents were dropped from the sample after discovering that they likely did not actually experience such an investigation . After their removal, we were left with 357 respondents . The second wage earner sample was drawn randomly from the overall wage-earner population .
Separate samples of audited and unaudited self-employed taxpayers were selected . To be eligible for selection, an audited taxpayer had to meet the following criteria:
■■ Had an operational audit between tax years 2010 and 2015 .
■■ Filed a Schedule C return for at least the three years covering the first tax year preceding the audit through the first tax year following the audit .
■■ All income tax returns were filed chronologically .
■■ The audit for tax year T was initiated prior to the filing of the tax year T+2 return .
■■ No examinations were initiated or ongoing two years prior to the audit under consideration .

Taxpayer Advocate Service — 2017 Annual Report to Congress — Volume Two 159
EITC Letters
Collection Agencies
OICProgram
Taxpayer Attitudes
Penalty Study
Settlement Initiatives
Telephone Service
TaxpayerEngagement
Use of IRS Services
■■ The taxpayer was not a resident of Puerto Rico7
To explore differences in taxpayer attitudes according to the type of audit (office, field, and correspondence) and the audit outcome (positive tax adjustment, no-change, and tax refund), we drew separate samples of audited self-employed taxpayers for each of the nine (3x3) possible audit type and outcome combinations . For each type of audit, a target of 100 respondents was set for taxpayers receiving a tax refund as a result of the audit, 150 respondents for those experiencing no tax change, and 200 for those experiencing an additional tax assessment . To help insure that a reasonably comparable “control group” of unaudited Schedule C filers could be sampled, we performed a propensity score analysis of the likelihood of an audit . Where possible, we under sampled taxpayers with very high or very low propensity scores and oversampled those with more moderate scores . In certain cases, these targets could not be met, so additional respondents were drawn from a different category in such cases .
Once the surveys of the audit samples were completed, we selected samples of unaudited Schedule C filers meant to be broadly similar to the audited Schedule C respondents . A generalized propensity scoring procedure was employed that matched unaudited self-employed taxpayers to the audit respondents on the basis of the predicted likelihood associated with each of the three types of audit .8 This matching process was carried out separately for each audit tax year (2010 through 2015) to account for the fact that the audit selection process tends to vary from year to year . Separate “control samples” were drawn for each audit tax year . Within each year, separate subsamples were randomly drawn for each of six different propensity score classes . The sample sizes were set sufficiently high to ensure that the target number of respondents could be achieved within each subsample .
Sample CharacteristicsUltimately, the sampling process resulted in a combined sample of 3,486 useable responses .9 Overall, 61 percent of the respondents are male, and the mean age in the sample is 55 (SD=13 .4) . A majority of respondents holds at least a high-school degree and works full-time . Our sample includes almost 900 individuals who state that they are currently not working; most of them (622) are retired . The final sample includes 2,729 self-employed taxpayers (1,363 audited and 1,366 non-audited) and 757 wage earners (357 who experienced an ID theft investigation and 400 from the general population .) Some socio-economic and demographic statistics for our sample are presented in Figures 5 .3 and 5 .4 .
7 Residents of Puerto Rico were excluded, because most are not required to pay federal individual income tax.8 Additional details on the sample selection process are available from the authors upon request.9 A total of 3,531 surveys were completed; however, as previously mentioned, 45 of the ID theft cases were later dropped,
leaving 3,486 total cases.

TAS RESEARCH AND RELATED STUDIES — Taxpayer Attitudes 160
Taxpayer Attitudes
Penalty Study
Settlement Initiatives
Telephone Service
TaxpayerEngagement
Use of IRS Services
OICProgram
EITC Letters
Collection Agencies
FIGURE 5.3, Socio-Economic and Demographic Characteristics of Non-Audited Schedule C Taxpayers, Wage Earners and Potential ID Theft Victims10
Schedule C, Not Audited Wage Earners ID Theft Total
N 1,366 400 357 2,123
Gender
Male 870 211 204 1,285
Female 494 189 153 836
Age
Mean 56.85 50.75 44.78 53.67
SD 12.95 17.04 15.05 14.07
Range 23-99 11-92 21-84 11-99
Education
Elementary school D D D 11
Some high school 40 10 17 67
High school graduate 220 88 73 381
Some college 296 101 85 482
College graduate 500 132 115 747
Post-graduate work 271 61 56 388
Vocational school 26 D D 35
Not sure/refused D D D 12
Employment status
Working part-time 197 54 52 303
Working full-time 796 210 217 1,223
Not working 373 136 88 597
Employment type
Employed by someone else 287 227 234 748
Self-employed 495 15 16 526
Both 211 22 19 252
Unemployment type
On temporary layoff from a job D 0 D 12
Looking for work 18 15 15 48
Retired 271 101 38 410
Disabled 42 10 13 65
Other 36 10 16 62
Under our sampling design, almost 50 percent (1,363 out of 2,729) of the Schedule C taxpayers who were surveyed had experienced fairly recent audits . Table 2 presents some socio-economic and demographic statistics of the audited respondents . We distinguish between different audit types and audit outcomes . Overall, 454 taxpayers received a field audit, 453 an office audit, and 456 a correspondence audit . Further, 603 individuals received an additional assessment, 503 no additional assessment, and 257 taxpayers a tax refund . The mean age of audited Schedule C taxpayers is slightly higher than the sample average (57 .41 years, SD=12 .44) and 62 percent are male . The majority of audited self-employed taxpayers have at least a college diploma and work full-time . Among those who responded to the questions regarding employment type, most are exclusively self-employed, although some report also working for another employer .
10 A ‘D’ indicates a number less than 10, which was sanitized to prevent inadvertent disclosure.

Taxpayer Advocate Service — 2017 Annual Report to Congress — Volume Two 161
EITC Letters
Collection Agencies
OICProgram
Taxpayer Attitudes
Penalty Study
Settlement Initiatives
Telephone Service
TaxpayerEngagement
Use of IRS Services
FIGURE 5.4, Social-Economic and Demographic Characteristics of Audited Schedule C Taxpayers11
Field audit Office audit Correspondence audit Total
Audit outcome + 0 - + 0 - + 0 -
N 202 182 70 200 168 85 201 153 102 1,363
Gender
Male 130 113 40 133 115 59 114 89 46 839
Female 72 69 30 67 53 26 87 64 56 524
Age
Mean 58.44 61.28 59.60 58.15 59.27 57.11 52.83 55.88 53.99 57.41
SD 12.45 11.88 11.11 12.31 12.16 12.36 12.47 12.20 11.94 12.44
Range 27-90 30-89 29-82 25-99 20-84 30-81 26-88 33-82 29-80 20-99
Education
Elementary school D 2D D D D D D D D 13
Some high school D D D D D D 13 D D 36
High school graduate 35 21 12 28 19 D 35 23 14 196
Some college 41 33 10 39 33 17 46 24 28 271
College graduate 59 66 128 70 54 32 61 59 32 461
Post-graduate work 59 49 117 55 53 25 37 39 19 353
Vocational school D D D D D D D D D 21
Not sure/refused D D D D D D D D D 12
Employment status
Working part-time 26 32 10 30 30 14 28 33 23 226
Working full-time 136 100 39 138 108 51 128 84 52 836
Not working 40 50 21 32 30 20 45 36 27 301
Employment type
Employed by some-one else
30 20 D 44 24 18 68 45 26 281
Self-employed 100 85 36 88 87 36 50 44 27 553
Both 32 27 D 36 27 11 38 28 22 228
Unemployment type
On temporary layoff from a job
D D D D D D D D D D
Looking for work D D D D D D D D D 15
Retired 27 42 15 22 24 14 23 26 19 212
Disabled D D D D D D D D D 28
Other D D D D D D D D D 37
Note: Symbols +, 0, - indicate audits with positive outcome, no adjustment, and refund.
PRELIMINARY FINDINGS (SECTION 5)
This section presents the findings of our survey of self-employed taxpayers and wage earners . First, we analyze differences between audited Schedule C taxpayers, non-audited schedule C taxpayers, and wage earners . Second, we investigate the relationship between different audit types (field audit, office audit, or correspondence audit) and outcomes (positive adjustment, no adjustment, refund) and taxpayer attitudes . Third, we analyze how attitudes of taxpayers who are aware that their ID may have been stolen
11 A ‘D” indicates a number less than 10, which was sanitized to prevent inadvertent disclosure.

TAS RESEARCH AND RELATED STUDIES — Taxpayer Attitudes 162
Taxpayer Attitudes
Penalty Study
Settlement Initiatives
Telephone Service
TaxpayerEngagement
Use of IRS Services
OICProgram
EITC Letters
Collection Agencies
to unlawfully claim a tax refund or who the IRS suspects of an illegitimate refund claim differ from those who are not in this situation . Finally, we examine how the results relate to the assumptions of the Slippery Slope Framework .
Attitudes of Audited and Non-audited Schedule C Taxpayers and Wage EarnersTo investigate how attitudes vary among taxpayers, we have performed a multivariate analysis of covariance (MANCOVA) using taxpayer type (Schedule C audited, Schedule C non-audited, and wage earners) as the explanatory variable and survey scales (as presented in Figure 5 .5) as the dependent variables .12 After controlling for gender and age, we find significant effects of taxpayer type (F(42, 5986) = 6 .87, p < .001, eta2 = .046); gender (F(21,2992) = 5 .22; p < .001, eta2 = .035), and age (F(21,2992) = 10 .37; p < .001, eta2 = .068) . Figure 5 .5 shows the adjusted means and standard errors of the survey scales by taxpayer type . These survey scales represent the mean of the responses to the relevant survey items .
FIGURE 5.5, Estimated means and standard errors of survey scales by taxpayer type
Survey Scale Schedule C Audited Schedule C Not Audited Wage Earners
N 1,306 1,324 387
Audit probability 4.36 (0.05)a 4.00 (0.05)b 3.74 (0.10)c
Fines 6.57 (0.06)a 6.70 (0.06)a 6.30 (0.11)b
Tax knowledge 5.21 (0.08) 5.34 (0.08) 5.45 (0.15)
Attitudes 6.15 (0.06) 6.21 (0.06) 6.18 (0.12)
Motivation 6.20 (0.07)a 6.53 (0.07)b 6.32 (0.13)ab
Justice
Procedural 6.21 (0.07)a 5.84 (0.07)b 6.07 (0.13)ab
Informational 6.44 (0.07)a 6.23 (0.07)b 6.30 (0.13)ab
Interpersonal 6.62 (0.07)a 6.19 (0.07)b 6.25 (0.13)b
Distributive 6.42 (0.07)a 5.91 (0.07)b 6.24 (0.13)ab
Social norms 5.27 (0.06) 5.36 (0.06) 5.25 (0.11)
Coercive power 6.37 (0.06)a 6.09 (0.06)b 5.93 (0.11)b
Legitimate power 6.38 (0.05) 6.50 (0.05) 6.42 (0.10)
Trust 5.27 (0.06)a 5.50 (0.06)b 5.56 (0.11)b
Emotions
Fear 3.96 (0.06)a 3.57 (0.06)b 3.49 (0.12)b
Anger 4.72 (0.08)a 3.98 (0.08)b 3.59 (0.14)b
Caution 5.54 (0.08)a 5.27 (0.08)b 5.18 (0.15)b
Threat 3.15 (0.07)a 2.65 (0.07)b 2.55 (0.12)b
Protection 6.23 (0.07)a 5.99 (0.07)b 5.61 (0.13)c
Enforced compliance 4.95 (0.07)a 4.94 (0.07)a 4.59 (0.13)b
Voluntary compliance 7.71 (0.05) 7.84 (0.05) 7.69 (0.09)
Thought about cheating 2.04 (0.05)a 2.01 (0.05)a 1.74 (0.10)b
Note: covariates age=56.31 and gender=1.39 (1=male, 2=female). a, b, c indicate differences between means at the 5% level.
12 See Maxwell, Delaney, and Kelley (2017) for an introduction to this methodology.

Taxpayer Advocate Service — 2017 Annual Report to Congress — Volume Two 163
EITC Letters
Collection Agencies
OICProgram
Taxpayer Attitudes
Penalty Study
Settlement Initiatives
Telephone Service
TaxpayerEngagement
Use of IRS Services
The results indicate that self-employed taxpayers are more likely to consider cheating, are more likely to view taxpaying as a coercive process, and perceive higher audit probabilities and fines for noncompliance than wage earners . Audited self-employed taxpayers perceive an especially high risk of audit . Consequently, audited Schedule C filers exhibit lower trust in the IRS and are relatively more likely to agree strongly with the statement: “Paying taxes feels like something is taken away from me rather than a contribution to society .”
Interestingly, audited self-employed taxpayers perceive higher degrees of procedural justice, information justice, interpersonal justice, and distributive justice than the unaudited control group . This indicates that those who recently experienced IRS audit procedures view them as more transparent, respectful, and appropriate in their outcomes than those who have not . A deeper investigation of these differences in justice perceptions is undertaken below, where we break down the results by audit type and examination outcome
The survey responses reveal that experiencing an audit induces strong negative emotions . Audited taxpayers report higher levels of fear, anger, threat, and caution when thinking about the IRS . Moreover, audited taxpayers also feel less protected by the IRS . We do not observe differences in self-reported tax knowledge, attitudes towards paying taxes, and social norms between different taxpayer types .
Attitudes of Audited Schedule C Filers by Audit Type and Outcome We first investigate whether audited taxpayers are aware that they were audited . Figure 5 .6 shows that only 61 .3 percent of audited self-employed taxpayers indicate they have been audited . However, we observe substantial differences between audit types . Audit awareness is particularly low in case of correspondence audits, where only 38 .8 percent indicate they had been audited . For field audits, more than two-thirds (67 .0 percent) recall the audit, while the rate of recall is highest for the office audit group (73 .7 percent) . Audit awareness is generally higher in the case of positive tax adjustments than when then examination results in either no adjustment or a tax refund . Surprisingly, only 55 .3 percent of audited taxpayers who received a refund as a result of the examination recall the audit .

TAS RESEARCH AND RELATED STUDIES — Taxpayer Attitudes 164
Taxpayer Attitudes
Penalty Study
Settlement Initiatives
Telephone Service
TaxpayerEngagement
Use of IRS Services
OICProgram
EITC Letters
Collection Agencies
FIGURE 5.6, Awareness of Audit by Audit Type and Outcome (N = 1,363 Schedule C Taxpayers)
Audit Outcome
Positive Adjustment No Adjustment Refund Total
Audit Awareness
Audit Type Yes No Yes No Yes No Yes No
Fieldn 150 52 128 54 46 24 324 130
% 74.3 25.7 70.3 29.7 65.7 34.3 67.0 33.0
Officen 135 65 132 36 67 18 334 119
% 67.2 32.8 78.6 21.4 78.8 21.2 73.7 26.3
Correspondencen 99 102 49 104 29 73 177 289
% 49.3 50.7 32.0 68.0 28.4 71.6 38.8 61.2
TotalN 384 219 309 194 142 115 835 528
% 63.7 36.3 61.4 38.6 55.3 44.7 61.3 38.7
To assess how different types of audits and examination outcomes shape the attitudes of self-employed taxpayers, we perform a multivariate analysis of covariance (MANCOVA) using audit type (field audit, office audit, correspondence audit) and audit outcome (positive adjustment, no adjustment, refund) as explanatory variables and the survey responses (as presented in Figure 5 .4) as the dependent variables . After controlling for gender and age, we find significant effects of audit type (F(42, 5225) = 3 .61, p < .001, eta2 = .056), audit outcome, (F(42,5225) = 6 .28; p < .001, eta2 = .094), the interaction between audit type and outcome (F(84,5112) =1 .29; p < .05, eta2 = .021), gender (F(21,1275) = 3 .86; p < .001, eta2 = .060), and age (F(21,1275) = 4 .65; p < .001, eta2 = .071) . Figure 5 .7 shows the adjusted means and standard errors by the interaction of audit type and outcome (‘+’ = tax increase, ‘0’ = no change, ‘-’ = refund); Table 7 shows means and standard errors separately for audit type and audit outcome . Again, the survey scales are constructed based on the rankings from relevant underlying survey items (which range from one to nine) .

Taxpayer Advocate Service — 2017 Annual Report to Congress — Volume Two 165
EITC Letters
Collection Agencies
OICProgram
Taxpayer Attitudes
Penalty Study
Settlement Initiatives
Telephone Service
TaxpayerEngagement
Use of IRS Services
FIGURE 5.7, Estimated Means and (Standard Errors) of Survey Scales by Nine Groups of Audited Schedule C Taxpayers13
Field Audit Office Audit Correspondence Audit
Survey Scale + 0 - + 0 - + 0 -
N 190 174 67 194 162 83 193 146 97
Audit probability4.39
(0.14)4.10
(0.15)4.29
(0.24)4.88
(0.14)4.14
(0.16)4.01
(0.22)4.55
(0.14)4.33
(0.16)3.93
(0.20)
Fines6.40
(0.15)6.50
(0.16)6.56
(0.26)6.49
(0.15)6.89
(0.17)6.48
(0.23)6.56
(0.15)6.67
(0.18)6.42
(0.22)
Tax Knowledge4.71
(0.20)4.82
(0.21)4.60
(0.34)5.43
(0.20)5.38
(0.22)5.38
(0.31)5.68
(0.20)5.55
(0.23)4.78
(0.29)
Attitudes5.92
(0.17)5.96
(0.18)5.90
(0.28)6.06
(0.17)6.42
(0.18)6.40
(0.25)6.03
(0.17)6.58
(0.19)6.30
(0.24)
Motivation5.96
(0.19)6.15
(0.20)6.05
(0.32)6.11
(0.19)6.35
(0.20)6.52
(0.28)6.40
(0.19)6.13
(0.21)6.43
(0.27)
Justice
Procedural justice5.88
(0.19)6.81
(0.19)6.68
(0.31)5.93
(0.18)6.66
(0.20)6.99
(0.28)5.61
(0.19)6.05
(0.21)5.85
(0.26)
Informational justice6.35
(0.18)6.71
(0.19)7.08
(0.31)6.34
(0.18)6.96
(0.20)7.08
(0.28)5.94
(0.18)6.14
(0.21)5.85
(0.26)
Interpersonal justice6.54
(0.18) 7.07
(0.19)7.28
(0.30)6.66
(0.18)7.11
(0.19)7.35
(0.27)5.95
(0.18)6.34
(0.20)5.76
(0.25)
Distributive justice5.77
(0.18)7.77
(0.19)6.97
(0.30)5.42
(0.18)7.63
(0.19)7.51
(0.27)5.13
(0.18)6.53
(0.20)6.17
(0.25)
Social norms5.27
(0.16)5.42
(0.17)5.20
(0.27)5.04
(0.16)5.38
(0.17)5.11
(0.24)5.44
(0.16)5.25
(0.18)5.16
(0.23)
Coercive power6.47
(0.16)6.18
(0.17)6.93
(0.26)6.47
(0.16)6.19
(0.17)6.36
(0.24)6.40
(0.16)6.32
(0.18)6.10
(0.22)
Legitimate power6.09
(0.15)6.38
(0.15)6.29
(0.24)6.33
(0.14)6.62
(0.16)6.54
(0.22)6.22
(0.15)6.50
(0.17)6.28
(0.20)
Trust5.01
(0.16)5.28
(0.17)5.12
(0.27)5.06
(0.16)5.56
(0.17)5.53
(0.24)5.11
(0.16)5.46
(0.18)5.51
(0.24)
Emotions
Fear3.76
(0.17)3.84
(0.18)4.02
(0.29)4.41
(0.17)3.98
(0.19)3.84
(0.26)4.02
(0.17)3.58
(0.20)4.01
(0.24)
Anger4.70
(0.20)4.61
(0.21)4.93
(0.34)5.27
(0.20)4.32
(0.22)4.74
(0.30)5.10
(0.20)4.14
(0.23)4.32
(0.28)
Caution5.26
(0.20)5.23
(0.21)5.73
(0.34)5.64
(0.20)5.45
(0.22)5.78
(0.31)5.90
(0.20)5.30
(0.23)5.83
(0.29)
Threat3.06
(0.19)3.03
(0.20)3.32
(0.32)3.64
(0.19)3.07
(0.20)2.88
(0.28)3.46
(0.19)2.61
(0.21)2.97
(0.26)
Protection3.51
(0.18)3.67
(0.19)3.75
(0.30)4.40
(0.18)3.68
(0.19)3.80
(0.27)0.06
(0.18)4.11
(0.20)4.15
(0.25)
Enforced compliance4.74
(0.18)4.93
(0.19)4.56
(0.31)4.90
(0.18)4.56
(0.20)5.00
(0.28)5.54
(0.18)4.72
(0.21)5.07
(0.26)
Voluntary compliance7.54
(0.13)7.79
(0.13)7.85
(0.21)7.70
(0.12)7.80
(0.14)7.79
(0.19)7.85
(0.13)7.63
(0.14)7.59
(0.18)
Thought about cheating2.11
(0.14)1.93
(0.14)2.21
(0.23)2.16
(0.14)1.95
(0.15)2.31
(0.21)2.01
(0.14)2.01
(0.16)1.90
(0.19)
Note: Symbols +, 0, - indicate audits with positive adjustment, no adjustment, and refund. Covariates age=57,41, gender=1.38 (1=male, 2=female).
13 Taxpayers rated these issues on a 9 Point Likert scale where one equals ‘do not agree at all’ and nine equals ‘agree completely’.

TAS RESEARCH AND RELATED STUDIES — Taxpayer Attitudes 166
Taxpayer Attitudes
Penalty Study
Settlement Initiatives
Telephone Service
TaxpayerEngagement
Use of IRS Services
OICProgram
EITC Letters
Collection Agencies
FIGURE 5.8, Estimated Means and (Standard Errors) of Survey Scales by Audit Type and Outcome14
Audit Type Audit Outcome
Survey Scale Fa Oa Ca + 0 -
N 431 439 436 577 482 247
Audit probability4.26
(0.11)4.34
(0.10)4.27
(0.10)4.61a (0.08)
4.19b (0.09)
4.08b(0.13)
Fines6.49
(0.12)6.62
(0.11)6.55
(0.11)6.48
(0.09)6.69
(0.10)6.49
(0.14)
Tax Knowledge4.71a (0.15)
5.40b(0.14)
5.33b (0.14)
5.27 (0.12)
5.25 (0.13)
4.92 (0.18)
Attitudes5.93a (0.12)
6.29b (0.12)
6.30b (0.12)
6.00 (0.10)
6.32 (0.11)
6.20 (0.15)
Motivation6.05
(0.14)6.32
(0.13)6.32
(0.13)6.16
(0.11)6.21
(0.12)6.33
(0.17)
Justice
Procedural justice6.46a (0.14)
6.53a (0.13)
5.84b(0.13)
5.81a (0.11)
6.51b (0.12)
6.51b (0.16)
Informational justice6.72a (0.14)
6.79a (0.13)
5.98b (0.13)
6.21a (0.11)
6.60b (0.12)
6.67b (0.16)
Interpersonal justice6.96a(0.13)
7.04a (0.13)
6.12b (0.12)
6.39a (0.10)
6.84b (0.11)
6.80b (0.16)
Distributive justice6.84a (0.13)
6.85a (0.13)
5.94b (0.12)
5.44a (0.10)
7.31b (0.11)
6.89c (0.16)
Social norms5.30
(0.12)5.18
(0.11)5.28
(0.11)5.25
(0.09)5.35
(0.11)5.15
(0.14)
Coercive power6.53
(0.12)6.34
(0.11)6.28
(0.11)6.45
(0.09)6.23
(0.10)6.46
(0.14)
Legitimate power6.25
(0.11)6.50
(0.10)6.33
(0.10)6.21
(0.08)6.50
(0.09)6.37
(0.13)
Trust5.14
(0.12)5.39
(0.11)5.36
(0.11)5.06a (0.09)
5.44b (0.10)
5.39b (0.14)
Emotions
Fear3.87
(0.13)4.08
(0.12)3.87
(0.12)4.64
(0.10)3.80
(0.11)3.96
(0.15)
Anger4.75
(0.15)4.78
(0.14)5.52
(0.14)5.02a (0.12)
4.36b (0.13)
4.66ab (0.18)
Caution5.41
(0.15)5.62
(0.14)5.68
(0.14)5.60ab (0.12)
5.33a(0.13)
5.80b (0.18)
Threat3.14
(0.14)3.19
(0.13)3.01
(0.13)3.39a (0.11)
2.90b (0.12)
3.05ab (0.17)
Protection3.64a (0.13)
3.64a (0.13)
4.11b (0.12)
3.67 (0.10)
3.82 (0.11)
3.90 (0.16)
Enforced compliance4.74
(0.14)4.82
(0.13)5.11
(0.13)5.06a (0.11)
4.73b (0.12)
4.87ab (0.16)
Voluntary compliance7.73
(0.09)7.76
(0.09)7.69
(0.09)7.70
(0.07)7.74
(0.08)7.74
(0.11)
Thought about cheating2.08
(0.10)2.14
(0.10)1.97
(0.10)2.09
(0.08)1.96
(0.09)2.14
(0.12)
Note: Symbols FA indicate field audit, OA indicates office audit and CA indicates correspondence audit; +, 0, - indicate audits with positive adjustment, no adjustment, and refund. Covariates age=57,41, gender=1.38 (1=male, 2=female). a, b, c indicate differences at the 5% level.
14 Taxpayers rated these issues on a 9 Point Likert scale where one equals ‘do not agree at all’ and nine equals ‘agree completely’.
Taxpayer Advocate Service — 2017 Annual Report to Congress — Volume Two 167
EITC Letters
Collection Agencies
OICProgram
Taxpayer Attitudes
Penalty Study
Settlement Initiatives
Telephone Service
TaxpayerEngagement
Use of IRS Services
Our results reveal a more nuanced relationship among audit type, audit outcome, and taxpayer attitudes . With regard to audit type, we find that self-employed taxpayers who experienced a field audit report less tax knowledge than taxpayers who underwent an office or correspondence audit . Similarly, this group exhibits more negative attitudes toward paying taxes . On the other hand, we find that taxpayers who experienced a correspondence audit report relatively low perceived levels of procedural, informational, interpersonal, and distributive justice . This group feels more protected by the IRS . These survey scales — tax knowledge, attitudes toward paying taxes, justice, and protection — account for the main areas where taxpayer opinions differ in accordance with audit type . No statistically significant differences were found with respect to the other survey scales .
With regard to audit outcomes among self-employed taxpayers, we find that those receiving a positive tax adjustment tend to report higher levels of audit risk . Further, this group perceives lower levels of procedural, informational, interpersonal, and distributive justice than the other groups . Surprisingly, taxpayers who experienced no adjustment to their taxes report higher levels of distributive justice (appropriateness of the audit outcome) than taxpayers who received a tax refund . Taxpayers who received a positive tax adjustment report relatively low levels of trust in the IRS . Moreover, these taxpayers report relatively high levels of anger, perceived threat, and enforced compliance . We do not observe significant differences in any other survey scale .
As in the previous analysis, age had a greater impact on attitudes and perceptions than gender . This is in line with a recent meta-analysis of socio-demographic characteristics and tax compliance (Hofmann et al ., 2017) which found that compliance increases with age and is slightly higher among women .
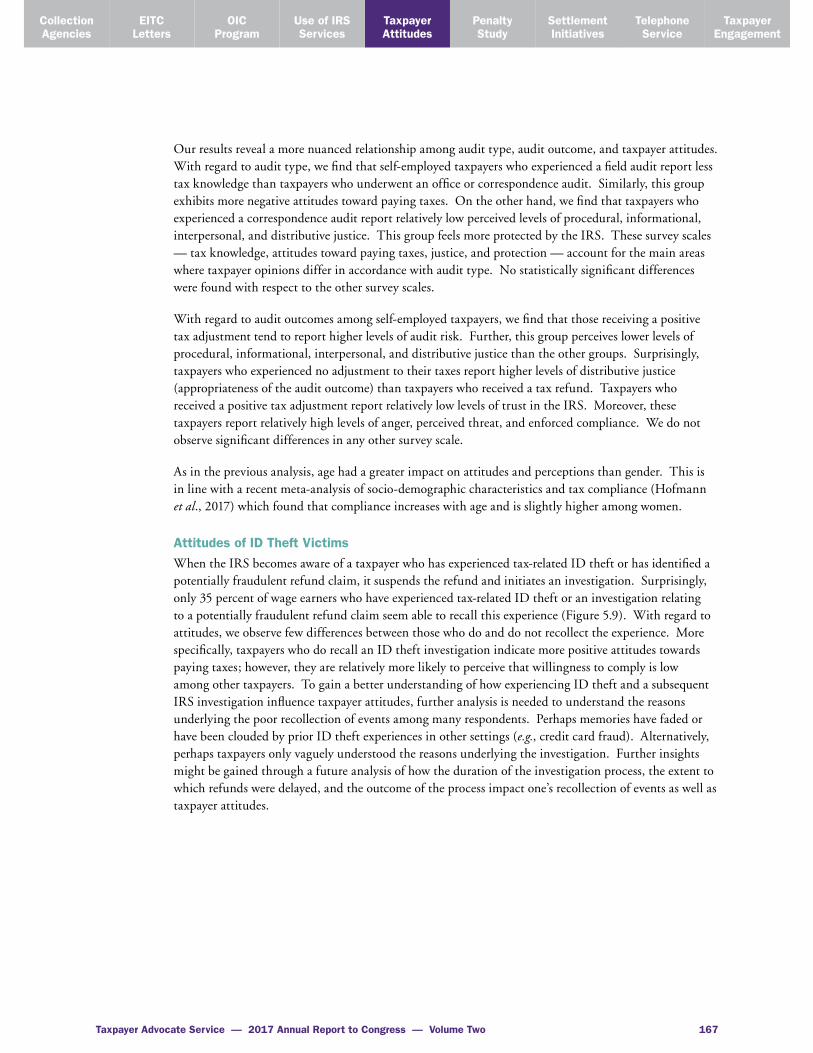
Attitudes of ID Theft VictimsWhen the IRS becomes aware of a taxpayer who has experienced tax-related ID theft or has identified a potentially fraudulent refund claim, it suspends the refund and initiates an investigation . Surprisingly, only 35 percent of wage earners who have experienced tax-related ID theft or an investigation relating to a potentially fraudulent refund claim seem able to recall this experience (Figure 5 .9) . With regard to attitudes, we observe few differences between those who do and do not recollect the experience . More specifically, taxpayers who do recall an ID theft investigation indicate more positive attitudes towards paying taxes; however, they are relatively more likely to perceive that willingness to comply is low among other taxpayers . To gain a better understanding of how experiencing ID theft and a subsequent IRS investigation influence taxpayer attitudes, further analysis is needed to understand the reasons underlying the poor recollection of events among many respondents . Perhaps memories have faded or have been clouded by prior ID theft experiences in other settings (e.g., credit card fraud) . Alternatively, perhaps taxpayers only vaguely understood the reasons underlying the investigation . Further insights might be gained through a future analysis of how the duration of the investigation process, the extent to which refunds were delayed, and the outcome of the process impact one’s recollection of events as well as taxpayer attitudes .

TAS RESEARCH AND RELATED STUDIES — Taxpayer Attitudes 168
Taxpayer Attitudes
Penalty Study
Settlement Initiatives
Telephone Service
TaxpayerEngagement
Use of IRS Services
OICProgram
EITC Letters
Collection Agencies
FIGURE 5.9, Means (and Standard Deviations) of Survey Scales for ID Theft Victims
Awareness of ID Theft
Yes No
Survey Scales n = 125 n = 232 t-statistic p-value
Audit probability 3.92 (1.87) 4.23 (1.96) 1.49 .069
Fines 6.26 (2.40) 6.68 (2.32) 1.61 .054
Tax knowledge 6.06 (2.76) 5.76 (2.80) -0.97 .166
Attitudes 6.68 (2.17) 6.25 (2.32) -1.72 .043
Motivation 6.61 (2.38) 6.31 (2.76) -1.06 .145
Justice 6.56 (2.17) 6.33 (2.20) -0.96 .170
Procedural 6.70 (2.54) 6.41 (2.31) -1.11 .134
Informational 6.28 (2.71) 6.34 (2.55) 0.21 .416
Interpersonal 6.69 (2.54) 6.39 (2.56) -1.08 .146
Distributive 6.59 (2.58) 6.19 (2.47) -1.47 .071
Social norms 5.13 (2.33) 5.65 (2.25) 2.08 .019
Coercive power 6.30 (1.74) 6.47 (1.75) 0.86 .195
Legitimate power 6.65 (1.76) 6.64 (2.10) -0.05 .479
Emotions
Trust 5.83 (1.89) 5.69 (2.12) -0.61 .273
Fear 3.50 (2.08) 3.31 (2.26) -0.77 .220
Anger 4.39 (2.57) 3.73 (2.68) -2.25 .012
Caution 5.28 (3.97) 5.02 (3.08) -0.78 .218
Threat 2.78 (2.43) 2.51 (2.27) -1.05 .147
Protection 5.55 (2.64) 5.20 (2.73) 1.18 .119
Enforced compliance 5.39 (2.53) 5.32 (2.80) -0.21 .419
Voluntary compliance 8.01 (1.44) 7.56 (1.90) -2.29 .011
Thought about cheating 1.76 (1.55) 1.69 (1.65) -0.42 .339
Survey Results Within the Slippery Slope FrameworkThis section explores the relationship between the survey scales . According to the Slippery Slope Framework, trust and power induce either voluntary or enforced compliance . The perceived probability of audits and the severity of fines are expected to relate to coercive power . On the other hand, tax knowledge, positive attitudes towards taxes, justice perceptions, and social norms should be correlated with trust . While coercive power likely elicits feelings of fear, anger, caution, and threat, high levels of trust should correspond with feeling protected . The framework assumes that power and trust promote compliance; however, the underlying motives differ . Taxpayers might comply either because they fear punishment (enforced compliance) or because they perceive compliance as the right thing to do (voluntary compliance) . Taxpayers who perceive coercive power and possess little trust may consider cheating but resist if they feel that the risks outweigh the potential tax savings . Conversely, taxpayers who perceive legitimate power and high trust cooperate voluntarily and are less inclined to think about cheating .
To explore the attitudes of taxpayers who have interacted with the IRS, we investigate survey responses of audited Schedule C filers . As this sample involves taxpayers who have had fairly recent interactions with the IRS, we assess direct experiences rather than assumptions . Figure 5 .10 depicts correlations between survey scales for audited self-employed taxpayers .

Taxpayer Advocate Service — 2017 Annual Report to Congress — Volume Two 169
EITC Letters
Collection Agencies
OICProgram
Taxpayer Attitudes
Penalty Study
Settlement Initiatives
Telephone Service
TaxpayerEngagement
Use of IRS Services
FIG
UR
E 5.1
0, C
orre
lati
ons
Bet
wee
n D
eter
min
ants
of
Com
plia
nce
Con
side
red
in t
he S
lippe
ry S
lope
Fra
mew
ork
and
Emot
ions
(N
= 1
,363
Aud
ited
Sch
edul
e C
Tax
paye
rs)15
Cor
rela
tion
sA
pF
KA
MJ
PJIJ
IPD
JS
NC
PLP
TEf
Ea
Ec
Et
Ep
EC
VC
C
Audi
t pr
obab
ility
(A
p; D
F1-2
)1
.00
Fine
s (F
; D
F4)
.20
1.0
0
Tax
know
ledg
e (K
; TK
1-3
)-.0
3-.0
41
.00
Attitu
des
(A;
TS1-
3)
-.12
-.06
.22
1.0
0
Mot
ivat
ion
(M; M
)-.1
0-.1
1.1
4.4
41
.00
Just
ice
(J)
-.13
-.11
.14
.33
.27
1.0
0
Proc
edur
al
(PJ;
PJ1
-3)
-.17
-.11
.19
.34
.27
.90
1
.00
Info
rmat
iona
l (I
J; IJ
1-3
)-.0
9-.0
8.1
7.3
0.2
2.9
1
.78
1.0
0
Inte
rper
sona
l (I
P; IP1
-3)
-.09
-.09
.15
.27
.24
.92
.7
7.8
61
.00
Dis
trib
utiv
e (D
J; D
J1-3
)-.1
0-.1
0.1
3.2
6.2
3.8
2
.66
.60
.66
1.0
0
Soc
ial n
orm
s (S
N;
PC
1-2
).0
9.0
5.0
9.0
2.1
5.0
7
.06
.05
.08
.06
1.0
0
Coe
rciv
e po
wer
(C
P; C
P2
-3)
.24
.24
-.11
-.19
-.23
-.25
-.25
-.20
-.21
-.20
.06
1.0
0
Legi
tim
ate
pow
er
(LP;
LP1
-3)
-.13
-.07
.20
.44
.39
.63
.6
2.5
8.5
9.4
6.1
6-.2
11
.00
Trus
t (T
; T1
-8)
-.19
-.17
.23
.47
.48
.66
.6
4.5
9.6
3.5
1.1
7-.4
0.8
01
.00
Fear
(Ef
; E1
-3)
.22
.21
-.20
-.16
-.24
-.22
-.2
2-.2
0-.2
0-.1
7-.0
4.2
3-.2
0-.3
0
1.0
0
Ang
er (
Ea;
E4
-5)
.22
.18
-.21
-.37
-.41
-.44
-.4
5-.3
8-.4
0-.3
4-.0
8.3
7-.5
1-.6
0
.56
1.0
0
Cau
tion
(Ec
; E6
).1
4.1
8-.1
2-.1
1-.1
9-.1
7
-.15
-.15
-.16
-.13
-.06
.22
-.55
-.24
.50
.46
1.0
0
Thre
at (
Et; E7
-8)
.25
.19
-.19
-.33
-.35
-.42
-.4
3-.3
4-.3
7-.3
3-.0
6.3
1-.4
6-.5
5
.54
.65
.38
1.0
0
Prot
ection
(E
p; E9
-10
)-.0
7-.0
4.1
5.3
1.3
2.3
9
.39
.35
.36
.28
.15
-.24
.48
.5
6
-.14
-.33
-.11
-.30
1.0
0
Enfo
rced
co
mpl
ianc
e (E
C;
EC1-
3)
.22
.20
-.11
-.13
-.26
-.03
-.0
4-.0
1-.0
3-.0
4-.0
0.2
2-.0
3.1
5
.44
.25
-.29
.30
-.03
1.0
0
Volu
ntar
y co
mpl
ianc
e (V
C; VC
1-3
)-.0
4-.0
5.0
7.3
7.5
0.1
4
.15
.13
.13
.11
.18
-.11
.32
.32
-.1
4-.2
5-.0
7-.2
5.2
4-.2
11
.00
Thou
ght
abou
t ch
eating
(C
; PC
4)
.03
.00
.01
-.02
-.08
.00
-.0
1-.0
3.0
0.0
3-.1
3.0
7-.0
6-.0
4.1
0.1
1.1
0.0
5-.0
4.0
7-.1
61
.00
15
The
copy
of
the
surv
ey d
ocum
ent
in t
he A
ppen
dix
A de
tails
whi
ch s
urve
y qu
estion
s re
late
to
the
variou
s de
term
inan
ts o
f co
mpl
ianc
e.
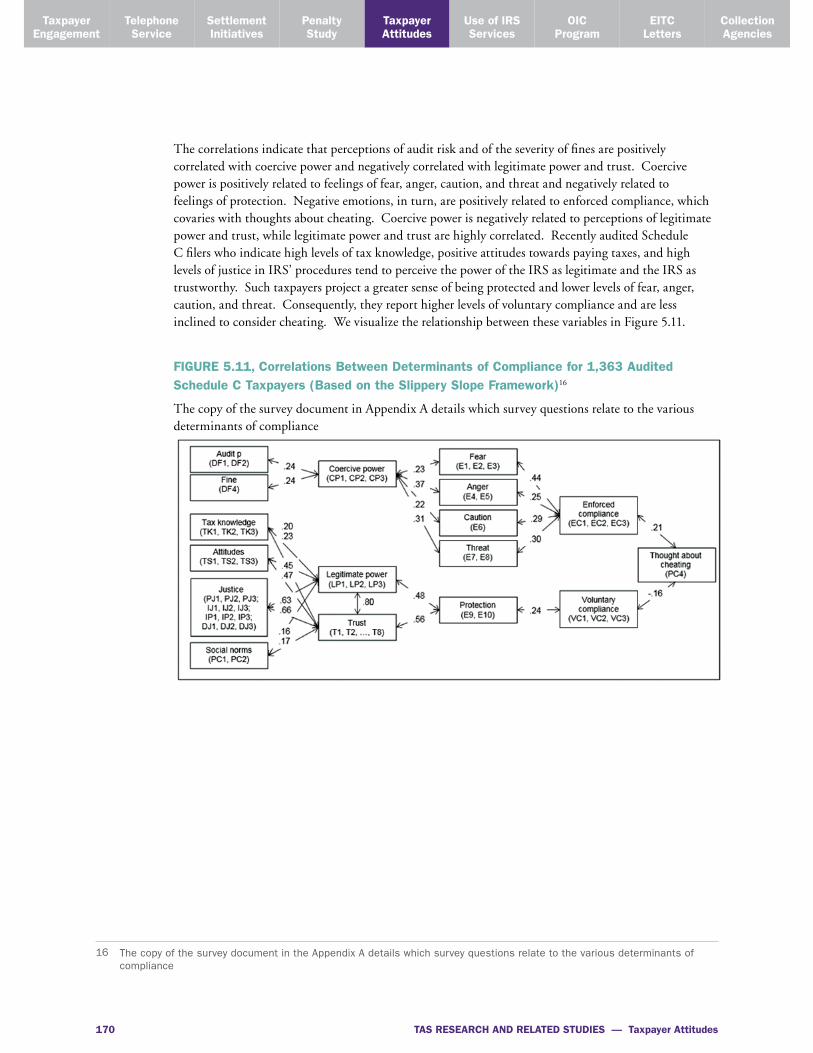
TAS RESEARCH AND RELATED STUDIES — Taxpayer Attitudes 170
Taxpayer Attitudes
Penalty Study
Settlement Initiatives
Telephone Service
TaxpayerEngagement
Use of IRS Services
OICProgram
EITC Letters
Collection Agencies
The correlations indicate that perceptions of audit risk and of the severity of fines are positively correlated with coercive power and negatively correlated with legitimate power and trust . Coercive power is positively related to feelings of fear, anger, caution, and threat and negatively related to feelings of protection . Negative emotions, in turn, are positively related to enforced compliance, which covaries with thoughts about cheating . Coercive power is negatively related to perceptions of legitimate power and trust, while legitimate power and trust are highly correlated . Recently audited Schedule C filers who indicate high levels of tax knowledge, positive attitudes towards paying taxes, and high levels of justice in IRS’ procedures tend to perceive the power of the IRS as legitimate and the IRS as trustworthy . Such taxpayers project a greater sense of being protected and lower levels of fear, anger, caution, and threat . Consequently, they report higher levels of voluntary compliance and are less inclined to consider cheating . We visualize the relationship between these variables in Figure 5 .11 .
FIGURE 5.11, Correlations Between Determinants of Compliance for 1,363 Audited Schedule C Taxpayers (Based on the Slippery Slope Framework)16
The copy of the survey document in Appendix A details which survey questions relate to the various determinants of compliance
16 The copy of the survey document in the Appendix A details which survey questions relate to the various determinants of compliance

Taxpayer Advocate Service — 2017 Annual Report to Congress — Volume Two 171
EITC Letters
Collection Agencies
OICProgram
Taxpayer Attitudes
Penalty Study
Settlement Initiatives
Telephone Service
TaxpayerEngagement
Use of IRS Services
SUMMARY AND DIRECTIONS FOR FUTURE RESEARCH (SECTION 6)
In this report, we present the preliminary findings from an analysis of survey responses on attitudes held by different types of taxpayers . At this early stage, we have focused on descriptive results from the survey . Future work will analyze these data in greater detail . One striking finding is that many (nearly 39 percent) audited self-employed taxpayers do not seem to recall their audit experience . This lack of recollection is especially prevalent among those who have experienced a correspondence audit, which suggests that many taxpayers do not view this form of examination as an audit . In the case of field and office examinations, the majority of respondents do remember being audited, suggesting that these audit types might have a greater impact on taxpayer attitudes and behavior . Surprisingly, only 55 .3 percent of self-employed taxpayers who received a tax refund following the examination recall having been audited . This is even more surprising as only 20 percent of these taxpayers received a correspondence audit .
When comparing different types of taxpayers, we find that self-employed taxpayers are more likely to report that they have considered cheating on their taxes . This is in line with the literature on the link between opportunity to cheat and noncompliant behaviors . Moreover, we find that self-employed taxpayers perceive a greater risk of audit and higher fines for noncompliance than wage earners . Consequently, they are more likely to view paying taxes as a coercive process . When comparing audited and non-audited Schedule C filers, we find that audited taxpayers perceive a higher risk of being audited and thus higher levels of coercive power . This finding supports a deterrent effect of audits (Alm, Jackson & McKee, 2009) . Surprisingly, audited self-employed taxpayers report higher perceived levels of procedural justice, information justice, interpersonal justice, and distributive justice than their unaudited counterparts . This indicates that those who have direct experience with an IRS audit process are more likely to perceive IRS procedures as transparent, respectful, and appropriate in their outcomes than those who have not . However, this result might be driven by the relatively large share of taxpayers who received either no adjustment or a tax refund as a result of the examination . Under our sampling design, only 44 .2 percent of audited taxpayers in our sample received a positive adjustment on an audit .
Indeed, when exploring how attitudes differ in accordance with audit types and outcomes, we find the lowest levels of perceived justice among taxpayers who have received a positive tax adjustment as a result of the examination . Similarly, these taxpayers report the lowest levels of trust in the IRS, the highest levels of enforced compliance, and the highest perceived audit risk . They further indicate higher levels of anger and perceived threat when thinking about the IRS . Interestingly, we observe the strongest contrast between different audit outcomes for distributive justice, where taxpayers who have experienced no tax change following an examination score higher than taxpayers who have experienced either a positive tax adjustment or a tax refund . Likewise, we observe higher levels of positive emotions within the no-change group . This suggests that receiving a tax refund does not necessarily induce positive opinions about the IRS . Further analyses on the dynamics between audit outcomes, perceptions of the IRS, and subsequent reporting behavior might contribute to the understanding of differential responses to audits found in prior research (Beer et al ., 2015) .
Survey responses of taxpayers who experienced an IRS investigation involving a potentially fraudulent refund claim by someone improperly using their identification reveal that only about one-third of ID theft victims recall the incident . To gain a better understanding of how an ID theft experience (or suspected ID theft or illegitimate refund) and the subsequent IRS investigative procedures impact taxpayer attitudes, more research is needed to understand why so many apparent victims seem unable to recall their experience . Further research is also warranted on how the duration and effectiveness of IRS ID theft investigations affects taxpayer attitudes and behaviors .

TAS RESEARCH AND RELATED STUDIES — Taxpayer Attitudes 172
Taxpayer Attitudes
Penalty Study
Settlement Initiatives
Telephone Service
TaxpayerEngagement
Use of IRS Services
OICProgram
EITC Letters
Collection Agencies
The current results suggest that audits influence attitudes towards paying taxes . An important question is whether these changes in attitudes are associated with actual changes in compliance behavior . In future research, we plan to investigate this issue by linking survey responses to tax returns spanning a number of years . Statistical techniques will be employed to control for differences between audited and unaudited taxpayers and to account for different audit types and examination outcomes . This work will build on our prior TAS study (Beer et al ., 2015) on audit impacts by accounting not only for tax return characteristics, but also for taxpayer attitudes .
REFERENCES
Allingham, M . & Sandmo, A . (1972) . Income tax evasion: a theoretical analysis . Journal of Public Economics, 1, 323-338 .
Alm, J . (2012) . Measuring, explaining, and controlling tax evasion: lessons from theory, experiments, and field studies . International Tax and Public Finance, 19, 54-77 .
Alm, J ., Jackson, B . R ., & McKee, M . (1992) . Estimating the determinants of taxpayer compliance with experimental data . National Tax Journal, 45(1), 107-114 .
Alm, J ., Jackson, B . R ., & McKee, M . (2009) . Getting the word out: Enforcement information dissemination and compliance behavior . Journal of Public Economics, 93, 392-402 .
Alm, J ., Kirchler, E ., & Muehlbacher, M . (2012) . Combining psychology and economics in the analysis of compliance: from enforcement to cooperation . Economic Analysis and Policy, 42(2), 133-151 .
Alm, J ., McClelland, G . H ., & Schulze, W . D . (1992) . Why do people pay taxes? Journal of Public Economics, 48, 21-38 .
Alm, J ., McClelland, G . H ., & Schulze, W . D . (1999) . Changing the social norm of tax compliance by voting . Kyklos, 52, 141-171 .
Alm, J . & Torgler, B . (2006) . Culture differences and tax morale in the United States and in Europe . Journal of Economic Psychology, 27, 224-246 .
Alm, J . & Torgler, B . (2011) . Do ethics matter? Tax compliance and morality . Journal of Business Ethics, 101, 635-651 .
Andreoni, J ., Erard, B ., & Feinstein, J . (1998) . Tax compliance . Journal of Economic Literature, 36(2), 818-860 .
Becker, G .S . (1968) . Crime and punishment: An economic approach, Journal of Political Economy, 76(2), 169-217 .
Beer, S ., Kasper, M ., Kirchler, & Erard, B . (2015) . Audit impact study . National Taxpayer Advocate Service 2015 Annual Report to Congress, 2, 68-98 .
Beers, T ., LoPresti, E ., & San Juan, E . (2012) Factors influencing voluntary compliance by small businesses: preliminary survey results . National Taxpayer Advocate Service 2012 Annual Report to Congress, 2, 1-70 .
Bies, R .J . & Moag, J . S . (1986) . Interactional justice: Communication criteria of fairness . In R . J . Lewicki, B . H . Sheppard, & M . H . Bazerman (Eds .), Research on negotiation in organizations, (Vol . 1, pp . 43-55) . Greenwich, Conn .: JAI Press .
Braithwaite, V . (2003) . Taxing democracy: Understanding tax avoidance and evasion . In V . Braithwaite (Ed .), Dancing with tax authorities: Motivational postures and non-compliant actions (pp . 15-39) . Aldershot, UK: Ashgate .

Taxpayer Advocate Service — 2017 Annual Report to Congress — Volume Two 173
EITC Letters
Collection Agencies
OICProgram
Taxpayer Attitudes
Penalty Study
Settlement Initiatives
Telephone Service
TaxpayerEngagement
Use of IRS Services
Colquitt, J . A . (2001) . On the dimensionality of organizational justice: A construct validation of a measure . Journal of Applied Psychology, 86(3), 386-400 .
DeBacker, J ., Heim, B . T ., Tran, A ., & Yuskavage, A . (2015) . Once bitten, twice shy? the lasting impact of IRS audits on individual tax reporting . Technical report .
Dubin, J . A . (2007) . Criminal investigation enforcement activities and taxpayer noncompliance . Public Finance Review 35(4), 500-529 .
Dubin, J . A ., Graetz, M . J ., & Wilde, L . L . (1990) . The effect of audit rates on the federal individual income tax, 1977–1986 . National Tax Journal, 43(4), 395-409 .
Eriksen, K . & Fallan, L . (1996) . Tax knowledge and attitudes towards taxation; A report on a quasi-experiment . Journal of Economic Psychology, 17(3), 387-402 .
Gemmel, N . & Ratto, M . (2012) . Behavioral responses to taxpayer audits: evidence from random taxpayer inquiries . National Tax Journal 65(1), 33-58 .
Gangl, K ., Torgler, B ., & Kirchler, E . (2016) . Patriotism’s impact on cooperation with the state: an experimental study on tax compliance . Political Psychology, 37(6), 867-881 .
Greenberg, J . (1990) . Organizational justice: yesterday, today, and tomorrow, Journal of Management, 16(2), 399-432 .
Guala, F . & Mittone, L . (2005) . Experiments in economics: external validity and the robustness of phenomena . Journal of Economic Methodology, 12(4), 495-515 .
Hallsworth, M ., List, J . A ., Metcalfe, R . D ., & Vlaev, I . (2017) . The behavioralist as tax collector: using natural field experiments to enhance tax compliance . Journal of Public Economics, 148, 14-31 .
Hartner, M ., Rechberger, S ., Kirchler, E ., & Wenzel, M . (2011) . Perceived distributive fairness of EU transfer payments, outcome favorability, identity, and EU-tax compliance . Law & Policy, 33(1), 60-81 .
Huddy, L . & Khatib, N . (2007) . American patriotism, national identity, and political involvement . American journal of political science, 51(1), 63-77 .
Hofmann, E ., Gangl, K ., Kirchler, E ., & Stark, J . (2014) . Enhancing tax compliance through coercive and legitimate power of tax authorities by concurrently diminishing or facilitating trust in tax authorities . Law & Policy, 36(3), 290-313 .
Hofmann, E ., Voracek, M ., Bock, C ., & Kirchler, E . (2017) . Tax compliance across sociodemographic categories: meta-analyses of survey studies in 111 countries . Journal of Economic Psychology, 62, 63-71 .
IRS (2016) . Tax Gap Estimates for Tax Years 2008-2010 . Retrieved from https://www .irs .gov/newsroom/the-tax-gap .
Kasper, M ., Kogler, C ., & Kirchler, E . (2015) . Tax policy and the news: An empirical analysis of taxpayers‘ perceptions of tax-related media coverage and its impact on tax compliance . Journal of Behavioral and Experimental Economics, 54, 58-63 .
Kasper, M ., Olsen, J ., Kogler, C ., Stark, J ., & Kirchler, E . (2018) Individual attitudes and social representations of taxation, tax avoidance and tax evasion . In N . Hashimzade, & Y . Epifantseva (Eds .), The Routledge Companion on Tax Avoidance Research (pp . 289-303) . New York: Routledge .
Kastlunger, B ., Kirchler, E ., Mittone, L ., & Pitters, J . (2009) .Sequences of audits, tax compliance, and taxpaying strategies . Journal of Economic Psychology, 30, 405-418 .

TAS RESEARCH AND RELATED STUDIES — Taxpayer Attitudes 174
Taxpayer Attitudes
Penalty Study
Settlement Initiatives
Telephone Service
TaxpayerEngagement
Use of IRS Services
OICProgram
EITC Letters
Collection Agencies
Kemp, S . (2008) . Lay perceptions of government economic activity . In A . Lewis (Ed .), The Cambridge handbook of psychology and economic behaviour (pp . 255-280) . Cambridge, UK: Cambridge University Press .
Kirchler, E . (1997) . The unequal equality: Social stereotypes about female and male entrepreneurs . Revue Internationale de Psychologie Sociale, 10, 63-77 .
Kirchler, E . (1998) . Differential representations of taxes: Analysis of free associations and judgments of five employment groups . Journal of Socio-Economics, 27, 117-131 .
Kirchler, E . (1999) . Reactance to taxation: employers attitudes towards taxes . The Journal of Socio-Economics, 28(2), 131-138 .
Kirchler, E . (2007) . The economic psychology of tax behaviour . Cambridge: Cambridge University Press .
Kirchler, E ., Hoelzl, E ., & Wahl, I . (2008) . Enforced versus voluntary tax compliance: the “slippery slope“ framework . Journal of Economic Psychology, 29(2), 210-225 .
Kirchler, E . & Maciejovsky, B . (2001) . Tax compliance within the context of gain and loss situations, expected and current asset position, and profession . Journal of Economic Psychology, 22(2), 173-194 .
Kleven, H . J ., Knudsen, M ., Kreiner, C . T ., Pedersen, S . L ., & Saez, E . (2011) . Unwilling or unable to cheat? evidence from a tax audit experiment in Denmark . Econometrica, 79(3), 651-692 .
Lederman, L . (forthcoming) . Does enforcement crowd ut voluntary tax compliance? B .Y .U . Law Review . O
Lewis, A . (1979) . An empirical assessment of tax mentality . Public Finance, 34(2), 245-257 .
Lewis, A . (1982) . The Psychology of taxation . Oxford, UK: Martin Robertson .
Maxwell, S . E ., Delaney, H . D ., & Kelley, K . (2017) . Designing experiments and analyzing data (3rd edition) . New York; Routledge .
Maciejovsky, B ., Kirchler, E ., & Schwarzenberger, H . (2007) . Misperception of chance and loss repair: on the dynamics of tax compliance . Journal of Economic Psychology, 28(6), 678-691 .
McCaffery, E . J ., & Baron, J . (2004) . Framing and taxation: evaluation of the tax policies involving household composition . Journal of Economic Psychology, 25(6), 679-705 .
Mendoza, J . P ., Wielhouwer, J . L ., & Kirchler, E . (2017) . The backfiring effect of auditing on tax compliance . Journal of Economic Psychology, 62, 284-294 .
Mittone, L . (2006) . Dynamic behaviour in tax evasion: an experimental approach . The Journal of Socio-Economics, 35(5), 813-835 .
Mittone, L ., Panebianco, F ., & Santoro, A . (2017) . The bomb-crater effect of tax audits: beyond the misperception of chance . Journal of Economic Psychology, 61, 252-243 .
Moser, H . (1994) . Zur Kritik der Sprache von Gesetzen . Anmerkungen eines Sprachwissenschaftlers . In C . Smekal und E . Theurl (eds .), Stand und Entwicklung der Finanzpsychologie, 171-184 . Baden-Baden: Nomos .
Olsen, J ., Kasper, M ., Kogler, C ., Muehlbacher, S ., & Kirchler, E . (2017) . Mental accounting of income tax and value added tax among self-employed business owners . Paper presented at the 2nd International Conference on Taxpayer Rights in Vienna, Austria .

Taxpayer Advocate Service — 2017 Annual Report to Congress — Volume Two 175
EITC Letters
Collection Agencies
OICProgram
Taxpayer Attitudes
Penalty Study
Settlement Initiatives
Telephone Service
TaxpayerEngagement
Use of IRS Services
Owens, J . & Hamilton S . (2004) . Experience and innovations in other countries . In H . J . Aaron and J . Slemrod (eds .), The crisis in tax administration (pp . 347-388) . Washington, DC: Brookings Institution Press .
Prinz, A . (2004) . Steuermoral und Religiösität in Ost- und Westdeutschland . Schmollers Jahrbuch, Zeitschrift für Wirtschafts- und Sozialwissenschaften, 124, 511-537 .
Rand, D . G ., Greene, J . D ., & Nowak, M . A . (2012) . Spontaneous giving and calculated greed . Nature, 489, 427-430 .
Roberts, M . L ., Hite, P . A ., & Bradley, C . F . (1994) . Understanding attitudes towards progressive taxation . Public Opinion Quaterly, 58(2), 165-190 .
Rodriguez-Justicia & Theilen (forthcoming) . Education and tax morale . Journal of Economic Psychology .
Sakurai, Y . & Braithwaite, V . (2003) . Taxpayers’ perceptions of practitioners: Finding one who is effective and does the right thing? Journal of Business Ethics, 45(4), 375-187 .
Slemrod, J ., Blumenthal, M ., & Christian, C . (2001) . Taxpayer response to an increased probability of audit: Evidence from a controlled experiment in Minnesota . Journal of Public Economics, 79(3), 455-483 .
Srinivasan, T . N . (1973) . Tax evasion: A model . Journal of Public Economics, 2(4), 339-346 .
Sussman, A . B . & Olivola, C . Y . (2011) Axe the tax: taxes are disliked more than equivalent costs . Journal of Marketing Research, 48, 91-101 .
Taxpayer Advocate Service (2012) . National Taxpayer Advocate Service 2012 Annual Report to Congress, 1, 3-23 .
Taxpayer Advocate Service (2016) . National Taxpayer Advocate Service 2016 Annual Report to Congress, 1, 151-160 .
Torgler, B . (2005) . Tax morale and direct democracy . European Journal of Political Economy, 21(2), 525–531 .
Tyler, T . R . (2006) . Psychological perspectives on legitimacy and legitimation . Annual Review of Psychology, 57, 375-400 .
Tyler, T . R ., Goff, P ., & MacCoun, R . (2015) . The impact of psychological science on policing in the United States: procedural justice, legitimacy, and effective law enforcement . Psychological Science in the Public Interest, 16(3), 75-109 .
Wahlund, R . (1992) . Tax changes and economic behavior . the case of tax evasion . Journal of Economic Psychology, 13(4), 657-677 .
Wenzel, M . (2005) . Motivation or rationalisation? causal relations between ethics, norms and tax compliance . Journal of Economic Psychology, 26, 491-508 .
Wenzel, M . (2007) . The multiplicity of taxpayer identities and their implications for tax ethics . Law and Policy, 29(1), 31-50 .
Welch, M . R ., Xu, Y ., Bjarnason, T ., Petee, T ., O’Donnell, P ., & Magro, P . (2005) . “But everybody does it . . .”: the effects of perceptions, moral pressures, and informal sanctions on tax cheating . Sociological Spectrum, 25(1), 21-52 .
Wilson, J . L . F . & Sheffrin, S . (2005) . Understanding surveys of taxpayer honesty . Finanzarchiv, 61(2), 256-274 .

TAS RESEARCH AND RELATED STUDIES — Taxpayer Attitudes 176
Taxpayer Attitudes
Penalty Study
Settlement Initiatives
Telephone Service
TaxpayerEngagement
Use of IRS Services
OICProgram
EITC Letters
Collection Agencies
APPENDIX A: SURVEY INSTRUMENT
Programming Notes:
All names on the sample list qualify for the survey in one of three groups. Group is indicated in sample and used for skipping throughout:
• Wage Earners (WE) • ID Theft (ID) • Audit Experience (AE)
All questions below have two numbers in two columns. For programming, use the numbers in the left column.
[1] Introduction [ALL RESPONDENTS]]
INTRO1:
Hello, may I speak with [INSERT NAME FROM LIST]?NOTE: YOU MUST SPEAK WITH THE RESPONDENT LISTED ONLYNOTE: IF CORRECT RESPONDENT IS NOT AVAILABLE - SCHEDULE CALLBACK
INTRO2:
Hello.
My name is […]. I am from the [name of company]. We are conducting a survey on how people perceive the tax system and the Internal Revenue Service (IRS). You have been randomly selected from qualified individuals to take part in this survey. This survey might take up to 20 minutes and is part of a research project, conducted by the Taxpayer Advocate Service, which aims to improve the understanding of taxpayer attitudes, perceptions, and behaviors.
The questions are about your views and experiences when dealing with taxes and the IRS, rather than about your specific, personal data. All of your answers are completely anonymous; they will be compiled and added to other responses. We will summarize the findings and share the results with Congress.
Thank you for agreeing to take part in this survey!
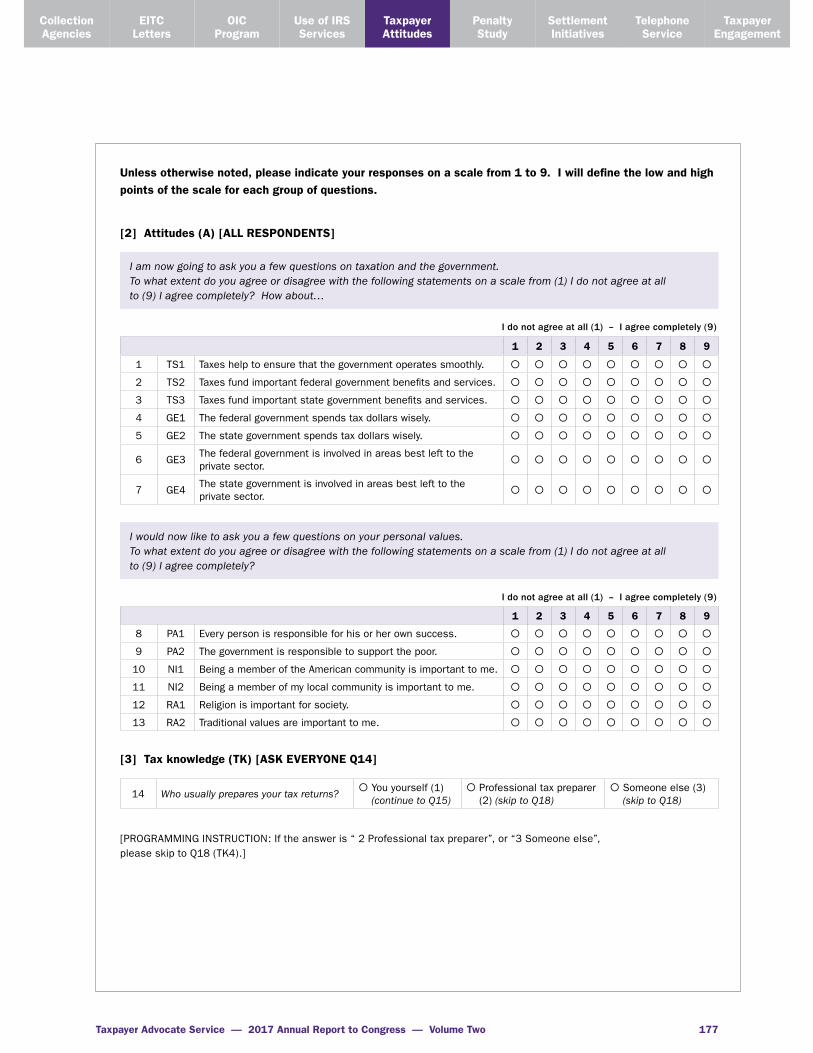
Taxpayer Advocate Service — 2017 Annual Report to Congress — Volume Two 177
EITC Letters
Collection Agencies
OICProgram
Taxpayer Attitudes
Penalty Study
Settlement Initiatives
Telephone Service
TaxpayerEngagement
Use of IRS Services
Unless otherwise noted, please indicate your responses on a scale from 1 to 9. I will define the low and high points of the scale for each group of questions.
[2] Attitudes (A) [ALL RESPONDENTS]
I am now going to ask you a few questions on taxation and the government. To what extent do you agree or disagree with the following statements on a scale from (1) I do not agree at all to (9) I agree completely? How about…
I do not agree at all (1) – I agree completely (9)
1 2 3 4 5 6 7 8 9
1 TS1 Taxes help to ensure that the government operates smoothly. � � � � � � � � �
2 TS2 Taxes fund important federal government benefits and services. � � � � � � � � �
3 TS3 Taxes fund important state government benefits and services. � � � � � � � � �
4 GE1 The federal government spends tax dollars wisely. � � � � � � � � �
5 GE2 The state government spends tax dollars wisely. � � � � � � � � �
6 GE3The federal government is involved in areas best left to the private sector.
� � � � � � � � �
7 GE4The state government is involved in areas best left to the private sector.
� � � � � � � � �
I would now like to ask you a few questions on your personal values. To what extent do you agree or disagree with the following statements on a scale from (1) I do not agree at all to (9) I agree completely?
I do not agree at all (1) – I agree completely (9)
1 2 3 4 5 6 7 8 9
8 PA1 Every person is responsible for his or her own success. � � � � � � � � �
9 PA2 The government is responsible to support the poor. � � � � � � � � �
10 NI1 Being a member of the American community is important to me. � � � � � � � � �
11 NI2 Being a member of my local community is important to me. � � � � � � � � �
12 RA1 Religion is important for society. � � � � � � � � �
13 RA2 Traditional values are important to me. � � � � � � � � �
[3] Tax knowledge (TK) [ASK EVERYONE Q14]
14 Who usually prepares your tax returns?� You yourself (1)
(continue to Q15)� Professional tax preparer
(2) (skip to Q18)� Someone else (3)
(skip to Q18)
[PROGRAMMING INSTRUCTION: If the answer is “ 2 Professional tax preparer”, or “3 Someone else”, please skip to Q18 (TK4).]

TAS RESEARCH AND RELATED STUDIES — Taxpayer Attitudes 178
Taxpayer Attitudes
Penalty Study
Settlement Initiatives
Telephone Service
TaxpayerEngagement
Use of IRS Services
OICProgram
EITC Letters
Collection Agencies
[SELF PREPARED [ONLY ASK Q15-Q17 IF Q14=1]]
When you think about filing your last tax return, to what extent do you agree or disagree with the following statements on a scale from (1) I do not agree at all to (9) I agree completely?
I do not agree at all (1) – I agree completely (9)
1 2 3 4 5 6 7 8 9
15 TK1I had a good understanding of what was expected from me when I filed my tax return.
� � � � � � � � �
16 TK2 I felt competent when doing my taxes. � � � � � � � � �
17 TK3I was confident that the deductions and credits I claimed were correct.
� � � � � � � � �
[IF Q14=1, SKIP to Q21]
[SOMEONE ELSE PREPARED [ONLY ASK IF Q14=2 or 3]]
Suppose you had to prepare your next tax return yourself. To what extent do you agree or disagree with the following questions on a scale from (1) I do not agree at all to (9) I agree completely?
I do not agree at all (1) – I agree completely (9)
1 2 3 4 5 6 7 8 9
18 TK4If you were to prepare your federal tax return, do you think you would have a good understanding of what would be expected from you?
� � � � � � � � �
19 TK5Do you think you would feel competent preparing your own taxes?
� � � � � � � � �
20 TK6Do you think that you would know which deductions and credits you are entitled to?
� � � � � � � � �

Taxpayer Advocate Service — 2017 Annual Report to Congress — Volume Two 179
EITC Letters
Collection Agencies
OICProgram
Taxpayer Attitudes
Penalty Study
Settlement Initiatives
Telephone Service
TaxpayerEngagement
Use of IRS Services
[4] Audit experience (AE) and ID theft (ID) [ONLY ASK IF SAMPLE SAYS AUDIT (AE) or ID THEFT (ID); ELSE (WE) SKIP TO Q21W]]
[EVERYONE EXCEPT WAGE EARNERS]
I would now like to ask you a few questions on how you perceive the IRS and what kind of experiences you have had with the IRS.
21 AE1In the past six years, have you had any contact with the IRS?
� Yes � No (skip to Q24)
� Not sure (skip to Q24)
22 AE2
[ONLY ASK IF Q21=YES]What was the reason for the contact? [READ RESPONSES]
� Audit � Other (please specify) [DO NOT READ: If more than one reason including audit, select “Audit” not “Other”] — (skip to Q24)
23 AE3[ONLY ASK IF Q22=Audit]What was the result of the audit? [READ RESPONSES]
DNR- Did not have an audit
� owe more tax
� no change in tax � owed less tax
24 ID1In the past three years, has someone else unlawfully used your ID to claim a tax refund, or has the IRS contacted you to validate your legitimate refund claim?
� Yes � No � Not sure
[SKIP TO Q25A IF (SAMPLE=AUDIT) AND (Q21=YES) AND (Q22=Audit) AND (Q23 NOT EQUAL to “Did not have audit”)]
[SKIP TO Q25AF IF (SAMPLE=AUDIT) AND ((Q21=No or Not Sure) OR (Q22=Other) OR (Q23=Did not have an audit)]
[SKIP TO Q25I IF (SAMPLE= ID THEFT) AND (Q24=Yes)]
[SKIP TO Q25IF IF (SAMPLE=ID THEFT) AND (Q24=No or Not Sure)]
[WAGE EARNERS [ONLY ASK IF SAMPLE=WAGE EARNERS; ELSE SKIP ACCORDING TO INSTRUCTION ABOVE]
READ: I would now like to ask you a few questions on how you perceive the IRS and what kind of experiences you have had with the IRS
21W AE1In the past six years, have you had any contact with the IRS?
� Yes � No (skip to Q24)
� Not sure (skip to Q24)
22W AE2
What was the reason for the contact? � Audit � Other (please specify) [DO NOT READ: If more than one reason including audit, select “Audit” not “Other”] — (skip to Q24)
23W AE3What was the result of the audit? DNR- Did
not have an audit
� owe more tax
� no change in tax � owed less tax
24W ID1In the past three years, has someone else unlawfully used your ID to claim a tax refund, or has the IRS contacted you to validate your legitimate refund claim?
� Yes � No � Not sure
[SKIP TO Q25A IF (SAMPLE=WAGE) AND (Q21W=Yes) AND (Q22W=Audit) AND (Q23W NOT EQUAL to “Did not have audit”)]
[SKIP TO Q25AF IF (SAMPLE=WAGE) AND ((Q21W=No or Not Sure) AND (Q24W=No or Not Sure) OR (Q23W=Did not have an audit)]
[SKIP TO Q25I IF (SAMPLE= WAGE) AND (Q24W=Yes)]
[SKIP TO Q25AF IF (SAMPLE=WAGE) AND (Q24W=No or Not Sure)]

TAS RESEARCH AND RELATED STUDIES — Taxpayer Attitudes 180
Taxpayer Attitudes
Penalty Study
Settlement Initiatives
Telephone Service
TaxpayerEngagement
Use of IRS Services
OICProgram
EITC Letters
Collection Agencies
[5] Justice perceptions (JP): Procedural justice (PJ), Informational justice (IJ), Interpersonal justice (IP), Distributive justice (DJ)]
[AUDIT]
[PROGRAMMING: Ask the following questions Q25A – Q36A (PJ1 through DJ3) only IF (SAMPLE=AUDIT) AND (Q22=Audit) OR IF (SAMPLE=WAGE) AND (Q22=Audit)]
READ: When you think about your most recent tax audit. To what extent do you agree or disagree with the following statements on a scale from (1) I do not agree at all to (9) I agree completely.
I do not agree at all (1) – I agree completely (9)
1 2 3 4 5 6 7 8 9
25A PJ1 The IRS procedures for handling my audit were free of bias. � � � � � � � � �
26A PJ2 The IRS provided accurate information. � � � � � � � � �
27A PJ3The way my audit was conducted upheld ethical and moral standards.
� � � � � � � � �
28A IJ1 The IRS employees explained their procedures thoroughly. � � � � � � � � �
29A IJ2 The IRS made it clear what was expected of me. � � � � � � � � �
30A IJ3The IRS employees were candid in their communications with me.
� � � � � � � � �
31A IP1 I was treated respectfully throughout the process. � � � � � � � � �
32A IP2 I was given the opportunity to express my side. � � � � � � � � �
33A IP3The IRS employees showed a genuine interest in trying to be fair.
� � � � � � � � �
34A DJ1 The audit outcome was appropriate. � � � � � � � � �
35A DJ2 The audit outcome reflected my previous tax behavior. � � � � � � � � �
36A DJ3 The audit outcome was justified. � � � � � � � � �

Taxpayer Advocate Service — 2017 Annual Report to Congress — Volume Two 181
EITC Letters
Collection Agencies
OICProgram
Taxpayer Attitudes
Penalty Study
Settlement Initiatives
Telephone Service
TaxpayerEngagement
Use of IRS Services
[AUDIT GROUP WHO DID NOT REMEMBER BEING AUDITED]
[PROGRAMMING: Ask the following questions Q25AF – Q36AF (PJ1 through DJ3) only IF (SAMPLE=AUDIT) AND ((Q21=No or Not Sure) OR (Q22=Other)) OR IF(SAMPLE=WAGE) AND (Q21=No or Not Sure) AND (Q24= No or Not Sure) ]
READ: Suppose you were audited by the IRS. Regardless of the end result of the audit, to what extent do you agree or disagree with the following statements on a scale from (1) I do not agree at all (9) I agree completely
I do not agree at all (1) – I agree completely (9)
I think…. 1 2 3 4 5 6 7 8 9
25AF PJ1 The IRS procedures for handling my audit would be free of bias. � � � � � � � � �
26AF PJ2 The IRS would provide accurate information. � � � � � � � � �
27AF PJ3The way my audit would be conducted would uphold ethical and moral standards
� � � � � � � � �
28AF IJ1 The IRS employees would explain their procedures thoroughly. � � � � � � � � �
29AF IJ2 The IRS would make it clear what was expected of me. � � � � � � � � �
30AF IJ3The IRS employees would be candid in their communications with me.
� � � � � � � � �
31AF IP1 I would be treated respectfully throughout the process. � � � � � � � � �
32AF IP2 I would be given the opportunity to express my side. � � � � � � � � �
33AF IP3The IRS employees would show a genuine interest in trying to be fair.
� � � � � � � � �
34AF DJ1 The audit outcome would be appropriate. � � � � � � � � �
35AF DJ2 The audit outcome would reflect my previous tax behavior. � � � � � � � � �
36AF DJ3 The audit outcome would be justified. � � � � � � � � �

TAS RESEARCH AND RELATED STUDIES — Taxpayer Attitudes 182
Taxpayer Attitudes
Penalty Study
Settlement Initiatives
Telephone Service
TaxpayerEngagement
Use of IRS Services
OICProgram
EITC Letters
Collection Agencies
[IDENTITY THEFT]
[PROGRAMMING: Ask the following questions Q25I – Q36I (PJ1 through DJ3) only IF (SAMPLE= ID THEFT) AND (Q24=Yes) OR IF (SAMPLE= WAGE) AND (Q22=Other) AND (Q24=Yes)]
READ: When you think about your identity theft matter, to what extent do you agree or disagree with the following statements on a scale from (1) I do not agree at all to (9) I agree completely.
I do not agree at all (1) – I agree completely (9)
1 2 3 4 5 6 7 8 9
25I PJ1The IRS procedures for handling my identity theft matter were free of bias.
� � � � � � � � �
26I PJ2The IRS provided accurate information related to my identity theft matter.
� � � � � � � � �
27I PJ3The way my identity theft matter was conducted upheld ethical and moral standards.
� � � � � � � � �
28I IJ1The IRS employees thoroughly explained their procedures for dealing with my identity theft matter.
� � � � � � � � �
29I IJ2 The IRS made it clear what was expected of me. � � � � � � � � �
30I IJ3The IRS employees were candid in their communications with me.
� � � � � � � � �
31I IP1 I was treated respectfully throughout the process. � � � � � � � � �
32I IP2 I was given the opportunity to express my side. � � � � � � � � �
33I IP3The IRS employees showed a genuine interest in trying to be fair.
� � � � � � � � �
34I DJ1 My identity theft matter outcome was appropriate. � � � � � � � � �
35I DJ2 My identity theft matter outcome reflected my previous behavior. � � � � � � � � �
36I DJ3 My identity theft matter outcome was justified. � � � � � � � � �
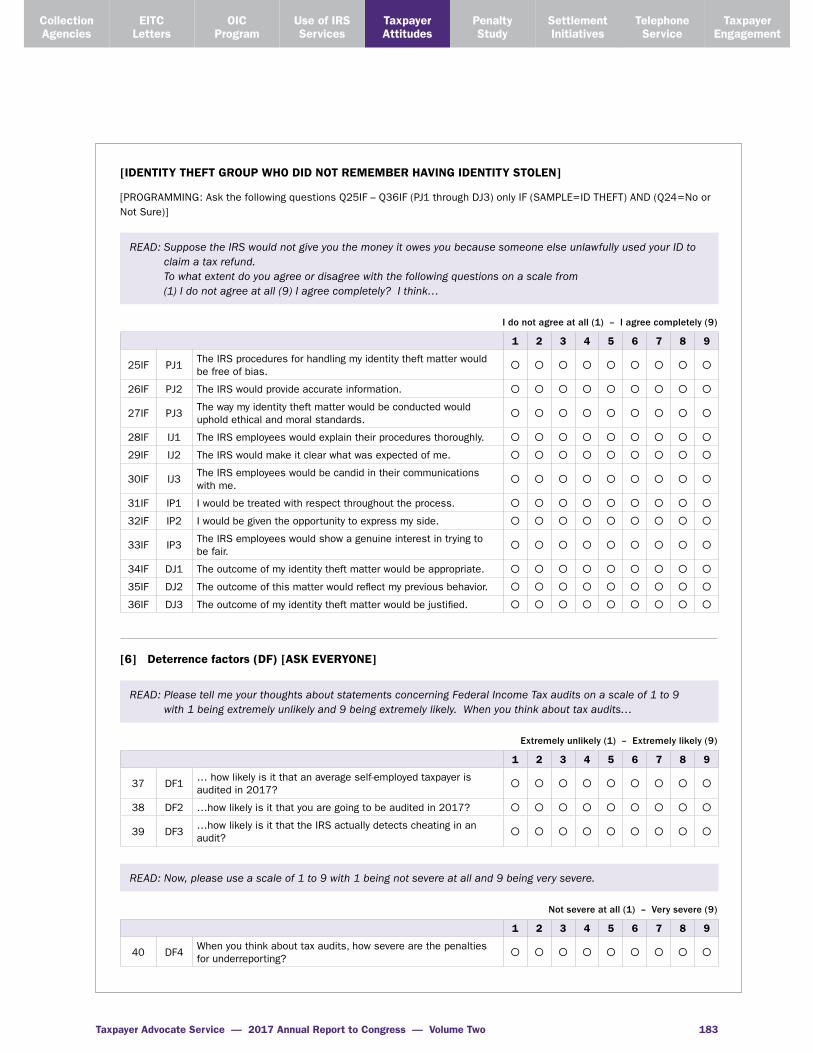
Taxpayer Advocate Service — 2017 Annual Report to Congress — Volume Two 183
EITC Letters
Collection Agencies
OICProgram
Taxpayer Attitudes
Penalty Study
Settlement Initiatives
Telephone Service
TaxpayerEngagement
Use of IRS Services
[IDENTITY THEFT GROUP WHO DID NOT REMEMBER HAVING IDENTITY STOLEN]
[PROGRAMMING: Ask the following questions Q25IF – Q36IF (PJ1 through DJ3) only IF (SAMPLE=ID THEFT) AND (Q24=No or Not Sure)]
READ: Suppose the IRS would not give you the money it owes you because someone else unlawfully used your ID to claim a tax refund. To what extent do you agree or disagree with the following questions on a scale from (1) I do not agree at all (9) I agree completely? I think…
I do not agree at all (1) – I agree completely (9)
1 2 3 4 5 6 7 8 9
25IF PJ1The IRS procedures for handling my identity theft matter would be free of bias.
� � � � � � � � �
26IF PJ2 The IRS would provide accurate information. � � � � � � � � �
27IF PJ3The way my identity theft matter would be conducted would uphold ethical and moral standards.
� � � � � � � � �
28IF IJ1 The IRS employees would explain their procedures thoroughly. � � � � � � � � �
29IF IJ2 The IRS would make it clear what was expected of me. � � � � � � � � �
30IF IJ3The IRS employees would be candid in their communications with me.
� � � � � � � � �
31IF IP1 I would be treated with respect throughout the process. � � � � � � � � �
32IF IP2 I would be given the opportunity to express my side. � � � � � � � � �
33IF IP3The IRS employees would show a genuine interest in trying to be fair.
� � � � � � � � �
34IF DJ1 The outcome of my identity theft matter would be appropriate. � � � � � � � � �
35IF DJ2 The outcome of this matter would reflect my previous behavior. � � � � � � � � �
36IF DJ3 The outcome of my identity theft matter would be justified. � � � � � � � � �
[6] Deterrence factors (DF) [ASK EVERYONE]
READ: Please tell me your thoughts about statements concerning Federal Income Tax audits on a scale of 1 to 9 with 1 being extremely unlikely and 9 being extremely likely. When you think about tax audits…
Extremely unlikely (1) – Extremely likely (9)
1 2 3 4 5 6 7 8 9
37 DF1… how likely is it that an average self-employed taxpayer is audited in 2017?
� � � � � � � � �
38 DF2 …how likely is it that you are going to be audited in 2017? � � � � � � � � �
39 DF3…how likely is it that the IRS actually detects cheating in an audit?
� � � � � � � � �
READ: Now, please use a scale of 1 to 9 with 1 being not severe at all and 9 being very severe.
Not severe at all (1) – Very severe (9)
1 2 3 4 5 6 7 8 9
40 DF4When you think about tax audits, how severe are the penalties for underreporting?
� � � � � � � � �

TAS RESEARCH AND RELATED STUDIES — Taxpayer Attitudes 184
Taxpayer Attitudes
Penalty Study
Settlement Initiatives
Telephone Service
TaxpayerEngagement
Use of IRS Services
OICProgram
EITC Letters
Collection Agencies
[7] Perceived compliance (PC) [ASK EVERYONE]
READ: Please think about the attitude of other taxpayers towards paying taxes. To what extent do you agree or disagree with the following statements about other taxpayers on a scale from (1) I do not agree at all to (9) I agree completely?
I do not agree at all (1) – I agree completely (9)
1 2 3 4 5 6 7 8 9
41 PC1Most taxpayers pay all of the taxes that they are supposed to pay.
� � � � � � � � �
42 PC2Most taxpayers think that they should honestly declare cash earnings on their tax return.
� � � � � � � � �
43 PC3Most taxpayers think that it is ok to overstate tax deductions on their tax return.
� � � � � � � � �
READ: Now please use a scale from (1) I have never thought about cheating to (9) I always think about cheating…
I do not agree at all (1) – I agree completely (9)
1 2 3 4 5 6 7 8 9
44PC4
How often have you yourself thought about cheating on your tax returns?
� � � � � � � � �
[8] Coercive power (CP) [ASK EVERYONE]
READ: Please tell me now to what extent do you agree or disagree with the following statements, which concern the IRS in general. Again, the scale ranges from (1) I do not agree at all to (9) I agree completely. In my opinion…
I do not agree at all (1) – I agree completely (9)
1 2 3 4 5 6 7 8 9
45 CP1 … the IRS enforces compliance with the tax laws � � � � � � � � �
46 CP2 … the IRS has no sympathy for taxpayers. � � � � � � � � �
47 CP3 … the IRS pursues taxpayers. � � � � � � � � �
[9] Legitimate power (LP) [ASK EVERYONE—CONTINUE FROM PREVIOUS GRID]
1 2 3 4 5 6 7 8 9
48 LP1 … the IRS operates professionally. � � � � � � � � �
49 LP2 … IRS employees are experts in their job. � � � � � � � � �
50 LP3 … the IRS has the right to collect taxes. � � � � � � � � �

Taxpayer Advocate Service — 2017 Annual Report to Congress — Volume Two 185
EITC Letters
Collection Agencies
OICProgram
Taxpayer Attitudes
Penalty Study
Settlement Initiatives
Telephone Service
TaxpayerEngagement
Use of IRS Services
[10] Trust (T) [ASK EVERYONE—CONTINUE FROM PREVIOUS GRID]
1 2 3 4 5 6 7 8 9
51 T1 … the IRS is trustworthy. � � � � � � � � �
52 T2 … the IRS is cooperative. � � � � � � � � �
53 T3 … the IRS has good intentions. � � � � � � � � �
54 T4 … IRS employees act in my best interest. � � � � � � � � �
55 T5 … the IRS does not try to fool taxpayers. � � � � � � � � �
56 T6 … the IRS acts on behalf of the American citizens. � � � � � � � � �
57 T7… the IRS will work with you if you have difficulty paying your taxes.
� � � � � � � � �
58 T8… the IRS is more concerned with collecting as much as it can, than with collecting the correct amount of tax.
� � � � � � � � �
[11] Enforced compliance (EC) and voluntary compliance (VC) [ASK EVERYONE]
READ: I would now like to ask you to what extent do you agree or disagree with the following statements on a scale from (1) I do not agree at all to (9) I agree completely. When you pay your taxes, you do so…
I do not agree at all (1) – I agree completely (9)
1 2 3 4 5 6 7 8 9
59 EC1 … because you are afraid of punishment. � � � � � � � � �
60 VC1 … to support your country and your fellow citizens. � � � � � � � � �
61 EC2 … because of the risk of being audited. � � � � � � � � �
62 VC2 … because for you it is the right thing to do. � � � � � � � � �
63 EC3 … because the IRS would detect any misreporting. � � � � � � � � �
64 VC3 … because you regard it as your civic duty. � � � � � � � � �
[12] Motivations to comply (M) [ASK EVERYONE]
READ: When you pay your taxes, do you …
Completely forced to do so (1) – Completely voluntary (9)
1 2 3 4 5 6 7 8 9
65 M1…feel that something is taken away from you or that you contribute to society? Please use a scale from (1) definitely taken away from me to (9) definitely contributing to society.
� � � � � � � � �
We are almost done with the survey.

TAS RESEARCH AND RELATED STUDIES — Taxpayer Attitudes 186
Taxpayer Attitudes
Penalty Study
Settlement Initiatives
Telephone Service
TaxpayerEngagement
Use of IRS Services
OICProgram
EITC Letters
Collection Agencies
[13] Emotions [ASK EVERYONE]
READ: The following statements address your feelings towards the IRS. The answering scale ranges from (1) not at all to (9) very strongly. When you think about the IRS, to what extent do you feel…
Not at all (1) – Very strongly (9)
1 2 3 4 5 6 7 8 9
66 E1 … anxious. [Repeat scale] � � � � � � � � �
67 E2 … desperate. � � � � � � � � �
68 E3 … nervous. � � � � � � � � �
69 E4 … frustrated. � � � � � � � � �
70 E5 … angry. � � � � � � � � �
71 E6 … cautious. � � � � � � � � �
72 E7 … hunted. � � � � � � � � �
73 E8 … threatened. � � � � � � � � �
74 E9 … protected. � � � � � � � � �
75 E10 … secure. O O O O O O O O O
[14] Demographics
Finally, I have a few questions about you.
76 D1For classification purposes only, are you male or female?
� Male � Female � [DNR] Other � Not sure/refused
77 D2 How old are you? Years [Enter number or RF for Refused]
[ONLY ASK Q78 If unwilling to indicate age in Q77, use the question reading the age ranges below:]
78. D2a: Which of the following categories includes your age?
Are you ...
1 Under 18
2 18 to 24 years
3 25 to 34 years
4 35 to 44 years
5 45 to 54 years
6 55 to 59 years
7 60 to 64 years
8 65 to 74 years
9 75 to 84 years
10 85 years and over
11 DO NOT READ Not sure/Refused
79. D3: What is the highest level of education you have completed?
(DO NOT READ LIST - SELECT ONE ANSWER.)
1 Elementary school
2 Some high school
3 High school graduate
4 Some college
5 College graduate
6 Post-Graduate work
7 Vocational school
8 DO NOT READ Not sure/Refused
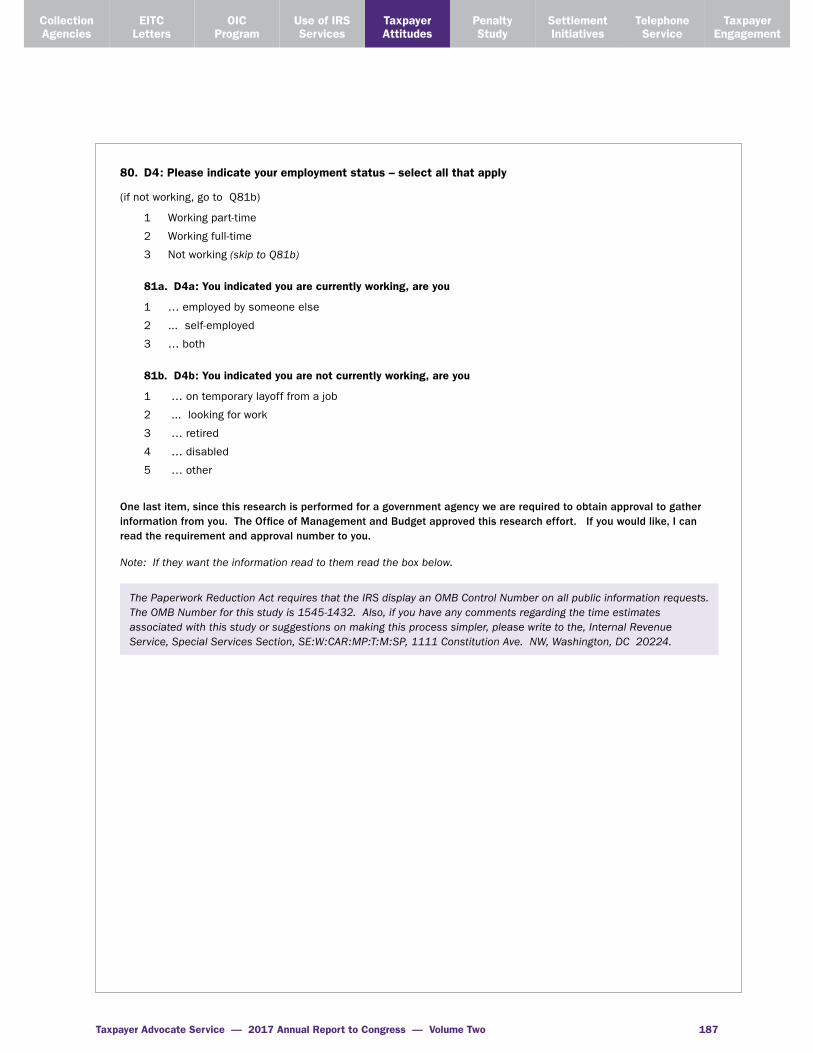
Taxpayer Advocate Service — 2017 Annual Report to Congress — Volume Two 187
EITC Letters
Collection Agencies
OICProgram
Taxpayer Attitudes
Penalty Study
Settlement Initiatives
Telephone Service
TaxpayerEngagement
Use of IRS Services
80. D4: Please indicate your employment status – select all that apply
(if not working, go to Q81b)
1 Working part-time
2 Working full-time
3 Not working (skip to Q81b)
81a. D4a: You indicated you are currently working, are you
1 … employed by someone else
2 ... self-employed
3 … both
81b. D4b: You indicated you are not currently working, are you
1 … on temporary layoff from a job
2 ... looking for work
3 … retired
4 … disabled
5 … other
One last item, since this research is performed for a government agency we are required to obtain approval to gather information from you. The Office of Management and Budget approved this research effort. If you would like, I can read the requirement and approval number to you.
Note: If they want the information read to them read the box below.
The Paperwork Reduction Act requires that the IRS display an OMB Control Number on all public information requests. The OMB Number for this study is 1545-1432. Also, if you have any comments regarding the time estimates associated with this study or suggestions on making this process simpler, please write to the, Internal Revenue Service, Special Services Section, SE:W:CAR:MP:T:M:SP, 1111 Constitution Ave. NW, Washington, DC 20224.
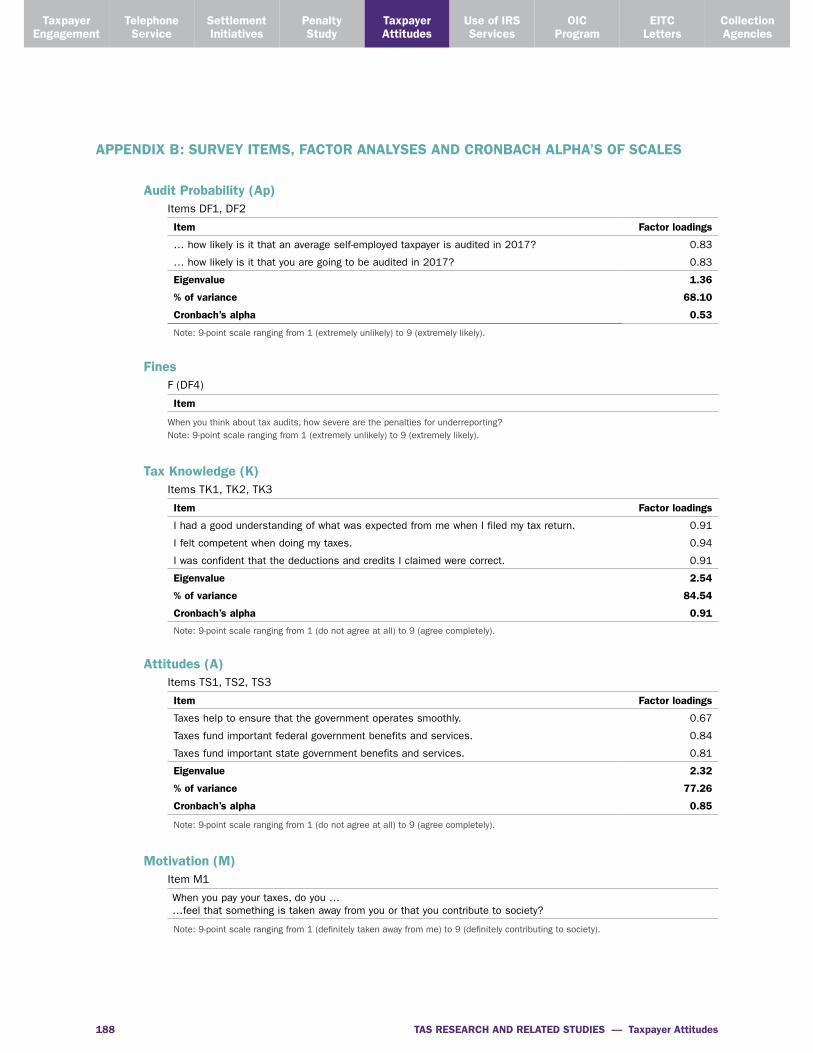
TAS RESEARCH AND RELATED STUDIES — Taxpayer Attitudes 188
Taxpayer Attitudes
Penalty Study
Settlement Initiatives
Telephone Service
TaxpayerEngagement
Use of IRS Services
OICProgram
EITC Letters
Collection Agencies
APPENDIX B: SURVEY ITEMS, FACTOR ANALYSES AND CRONBACH ALPHA’S OF SCALES
Audit Probability (Ap)Items DF1, DF2
Item Factor loadings
… how likely is it that an average self-employed taxpayer is audited in 2017? 0.83
… how likely is it that you are going to be audited in 2017? 0.83
Eigenvalue 1.36
% of variance 68.10
Cronbach’s alpha 0.53
Note: 9-point scale ranging from 1 (extremely unlikely) to 9 (extremely likely).
FinesF (DF4)
Item
When you think about tax audits, how severe are the penalties for underreporting?Note: 9-point scale ranging from 1 (extremely unlikely) to 9 (extremely likely).
Tax Knowledge (K)Items TK1, TK2, TK3
Item Factor loadings
I had a good understanding of what was expected from me when I filed my tax return. 0.91
I felt competent when doing my taxes. 0.94
I was confident that the deductions and credits I claimed were correct. 0.91
Eigenvalue 2.54
% of variance 84.54
Cronbach’s alpha 0.91
Note: 9-point scale ranging from 1 (do not agree at all) to 9 (agree completely).
Attitudes (A)Items TS1, TS2, TS3
Item Factor loadings
Taxes help to ensure that the government operates smoothly. 0.67
Taxes fund important federal government benefits and services. 0.84
Taxes fund important state government benefits and services. 0.81
Eigenvalue 2.32
% of variance 77.26
Cronbach’s alpha 0.85
Note: 9-point scale ranging from 1 (do not agree at all) to 9 (agree completely).
Motivation (M)Item M1
When you pay your taxes, do you ……feel that something is taken away from you or that you contribute to society?
Note: 9-point scale ranging from 1 (definitely taken away from me) to 9 (definitely contributing to society).
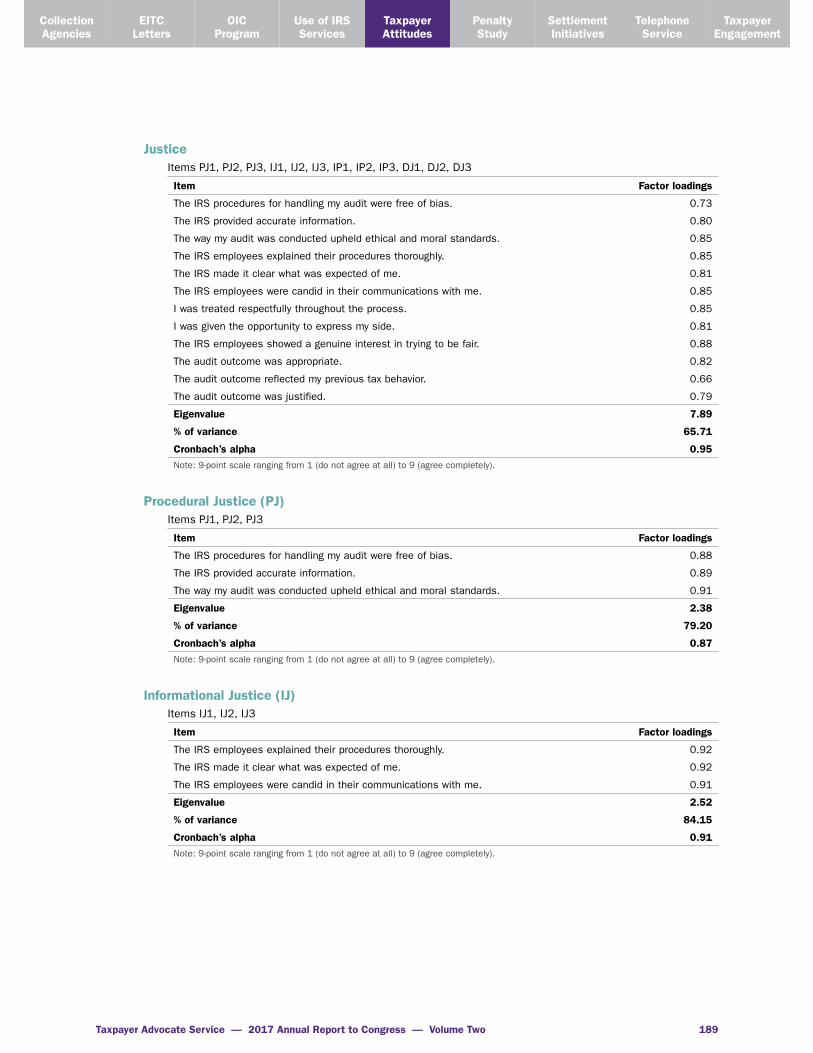
Taxpayer Advocate Service — 2017 Annual Report to Congress — Volume Two 189
EITC Letters
Collection Agencies
OICProgram
Taxpayer Attitudes
Penalty Study
Settlement Initiatives
Telephone Service
TaxpayerEngagement
Use of IRS Services
Justice Items PJ1, PJ2, PJ3, IJ1, IJ2, IJ3, IP1, IP2, IP3, DJ1, DJ2, DJ3
Item Factor loadings
The IRS procedures for handling my audit were free of bias. 0.73
The IRS provided accurate information. 0.80
The way my audit was conducted upheld ethical and moral standards. 0.85
The IRS employees explained their procedures thoroughly. 0.85
The IRS made it clear what was expected of me. 0.81
The IRS employees were candid in their communications with me. 0.85
I was treated respectfully throughout the process. 0.85
I was given the opportunity to express my side. 0.81
The IRS employees showed a genuine interest in trying to be fair. 0.88
The audit outcome was appropriate. 0.82
The audit outcome reflected my previous tax behavior. 0.66
The audit outcome was justified. 0.79
Eigenvalue 7.89
% of variance 65.71
Cronbach’s alpha 0.95Note: 9-point scale ranging from 1 (do not agree at all) to 9 (agree completely).
Procedural Justice (PJ)Items PJ1, PJ2, PJ3
Item Factor loadings
The IRS procedures for handling my audit were free of bias. 0.88
The IRS provided accurate information. 0.89
The way my audit was conducted upheld ethical and moral standards. 0.91
Eigenvalue 2.38
% of variance 79.20
Cronbach’s alpha 0.87Note: 9-point scale ranging from 1 (do not agree at all) to 9 (agree completely).
Informational Justice (IJ)Items IJ1, IJ2, IJ3
Item Factor loadings
The IRS employees explained their procedures thoroughly. 0.92
The IRS made it clear what was expected of me. 0.92
The IRS employees were candid in their communications with me. 0.91
Eigenvalue 2.52
% of variance 84.15
Cronbach’s alpha 0.91Note: 9-point scale ranging from 1 (do not agree at all) to 9 (agree completely).

TAS RESEARCH AND RELATED STUDIES — Taxpayer Attitudes 190
Taxpayer Attitudes
Penalty Study
Settlement Initiatives
Telephone Service
TaxpayerEngagement
Use of IRS Services
OICProgram
EITC Letters
Collection Agencies
Interpersonal Justice (IP)IP1, IP2, IP3
Item Factor loadings
I was treated respectfully throughout the process. 0.92
I was given the opportunity to express my side. 0.90
The IRS employees showed a genuine interest in trying to be fair. 0.92
Eigenvalue 2.51
% of variance 83.63
Cronbach’s alpha 0.90Note: 9-point scale ranging from 1 (do not agree at all) to 9 (agree completely).
Distributive Justice (DJ)Items DJ1, DJ2, DJ3
Item Factor loadings
The audit outcome was appropriate. 0.91
The audit outcome reflected my previous tax behavior. 0.86
The audit outcome was justified. 0.92
Eigenvalue 2.41
% of variance 80.35
Cronbach’s alpha 0.88
Note: 9-point scale ranging from 1 (do not agree at all) to 9 (agree completely).
Social Norms (PC)Items PC1, PC2, PC3_rec
Item Factor loadings
Most taxpayers pay all of the taxes that they are supposed to pay. 0.80
Most taxpayers think that they should honestly declare cash earnings on their tax return. 0.81
Most taxpayers think that it is ok to overstate tax deductions on their tax return. 0.47
Eigenvalue 1.51
% of variance 50.29
Cronbach’s alpha 0.49
Note: 9-point scale ranging from 1 (do not agree at all) to 9 (agree completely).
Coercive Power (CP)Items CP2, CP3
Item Factor loadings
In my opinion the IRS has no sympathy for taxpayers. 0.85
In my opinion the IRS pursues taxpayers. 0.85
Eigenvalue 1.45
% of variance 72.63
Cronbach’s alpha 0.62
Note: 9-point scale ranging from 1 (do not agree at all) to 9 (agree completely).

Taxpayer Advocate Service — 2017 Annual Report to Congress — Volume Two 191
EITC Letters
Collection Agencies
OICProgram
Taxpayer Attitudes
Penalty Study
Settlement Initiatives
Telephone Service
TaxpayerEngagement
Use of IRS Services
Legitimate Power (LP)Items LP1, LP2, LP3
Item Factor loadings
In my opinion…… the IRS operates professionally. 0.87
… IRS employees are experts in their job. 0.86
… the IRS has the right to collect taxes. 0.65
Eigenvalue 1.92
% of variance 63.99
Cronbach’s alpha 0.71
Note: 9-point scale ranging from 1 (do not agree at all) to 9 (agree completely).
Trust (T)ItemsT1, T2, T3, T4, T5, T6, T7, T8_rec
Item Factor loadings
In my opinion…… the IRS is trustworthy. 0.88
… the IRS is cooperative. 0.88
… the IRS has good intentions. 0.90
… IRS employees act in my best interest. 0.83
… the IRS does not try to fool taxpayers. 0.78
… the IRS acts on behalf of the American citizens. 0.84
… the IRS will work with you if you have difficulty paying your taxes. 0.73
… the IRS is more concerned with collecting as much as it can, than with collecting the correct amount of tax.
0.43
Eigenvalue 5.08
% of variance 63.49
Cronbach’s alpha 0.91
Note: 9-point scale ranging from 1 (do not agree at all) to 9 (agree completely).
Fear (Ef)Items E1, E2, E3
Item Factor loadings
When you think about the IRS. To what extent do you feel…… anxious? 0.85
… desperate? 0.85
… nervous? 0.98
Eigenvalue 2.24
% of variance 74.61
Cronbach’s alpha 0.83
Note: 9-point scale ranges from 1 (not at all) to 9 (very strongly).

TAS RESEARCH AND RELATED STUDIES — Taxpayer Attitudes 192
Taxpayer Attitudes
Penalty Study
Settlement Initiatives
Telephone Service
TaxpayerEngagement
Use of IRS Services
OICProgram
EITC Letters
Collection Agencies
Anger (Ea)Items E4, E5
Item Factor loadings
When you think about the IRS. To what extent do you feel…… frustrated?.
0.92
… angry? 0.92
Eigenvalue 1.71
% of variance 85.45
Cronbach’s alpha 0.83
Note: 9-point scale ranges from 1 (not at all) to 9 (very strongly).
Caution (Ec)(Item E6)
When you think about the IRS. To what extent do you feel cautious?
Note: 9-point scale ranges from 1 (not at all) to 9 (very strongly).
Threat (Et)Items E7, E8
Item Factor loadings
When you think about the IRS. To what extent do you feel…… hunted? 0.94
… threatened? 0.94
Eigenvalue 1.77
% of variance 88.55
Cronbach’s alpha 0.87
Note: 9-point scale ranges from 1 (not at all) to 9 (very strongly).
Protection (Ep)Items E9_rec, E10_rec
Item Factor loadings
When you think about the IRS. To what extent do you feel…… protected? 0.93
… secure? 0.93
Eigenvalue 1.7
% of variance 87.10
Cronbach’s alpha 0.85
Note: 9-point scale ranges from 1 (not at all) to 9 (very strongly).
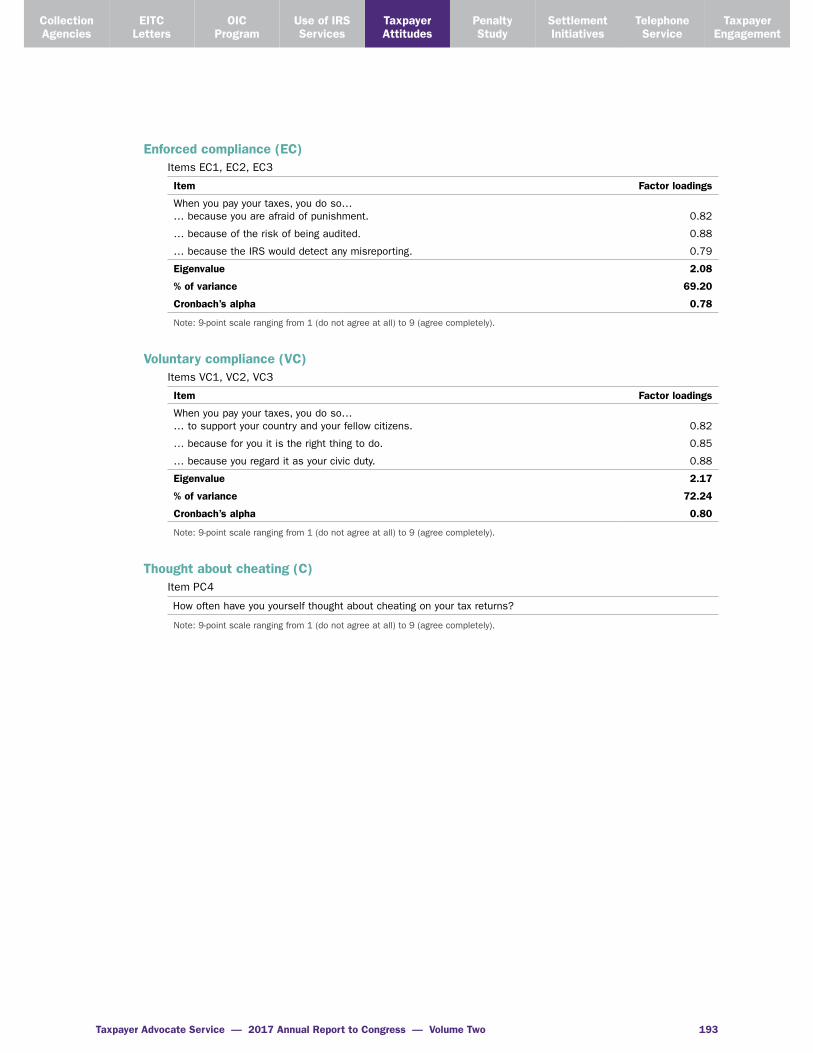
Taxpayer Advocate Service — 2017 Annual Report to Congress — Volume Two 193
EITC Letters
Collection Agencies
OICProgram
Taxpayer Attitudes
Penalty Study
Settlement Initiatives
Telephone Service
TaxpayerEngagement
Use of IRS Services
Enforced compliance (EC)Items EC1, EC2, EC3
Item Factor loadings
When you pay your taxes, you do so…… because you are afraid of punishment. 0.82
… because of the risk of being audited. 0.88
… because the IRS would detect any misreporting. 0.79
Eigenvalue 2.08
% of variance 69.20
Cronbach’s alpha 0.78
Note: 9-point scale ranging from 1 (do not agree at all) to 9 (agree completely).
Voluntary compliance (VC)Items VC1, VC2, VC3
Item Factor loadings
When you pay your taxes, you do so…… to support your country and your fellow citizens. 0.82
… because for you it is the right thing to do. 0.85
… because you regard it as your civic duty. 0.88
Eigenvalue 2.17
% of variance 72.24
Cronbach’s alpha 0.80
Note: 9-point scale ranging from 1 (do not agree at all) to 9 (agree completely).
Thought about cheating (C)Item PC4
How often have you yourself thought about cheating on your tax returns?
Note: 9-point scale ranging from 1 (do not agree at all) to 9 (agree completely).

TAS RESEARCH AND RELATED STUDIES — Taxpayer Attitudes 194
Taxpayer Attitudes
Penalty Study
Settlement Initiatives
Telephone Service
TaxpayerEngagement
Use of IRS Services
OICProgram
EITC Letters
Collection Agencies
This page intentionally left blank.