multi-agent based simulation of the deterrent effects of ...multi-agent based simulation of the...
TRANSCRIPT

Multi-Agent Based Simulation of the Deterrent Effects of Taxpayer
Audits
Kim M. Bloomquist Senior Economist
National Headquarters Office of Research, IRS
Paper presented at the 97th Annual Conference of the National Tax Association
Minneapolis Marriott City Center Minneapolis, MN
November 11-13, 2004 Session: Tax Enforcement
Disclaimer
The views expressed here are those of the author and should not be interpreted as those of the U.S. Internal Revenue Service (IRS).

1
As a tool of enforcement, tax audits are thought to have both direct and deterrent effects on taxpayers. The
direct effect is simply the difference between the tax liability as determined by an examiner and the amount
voluntarily reported by the taxpayer. In fiscal year (FY) 2003, the direct effect of the 849,000 audits performed on
individual income tax returns was a total recommended $4.6 billion in additional tax, or an average of $5,400 per
audited taxpayer (IRS, 2004).1
In contrast, the deterrent effect is an increase in voluntarily reported tax liability due to the existence of a
program of taxpayer audits. Several studies aimed at quantifying the magnitude of deterrent effects have reported
ambiguous results. Panel studies using state-level data by Dubin, Graetz, and Wilde (1990) and Plumley (1996) find
deterrent effects in a range from six to 11 times the direct effect. In contrast, Erard (1992) finds no improvement in
compliance for a group of taxpayers who were audited in one year and, by chance, audited again two years later
when compared to a control group. A field study of Minnesota taxpayers by Blumenthal, Christian, and Slemrod
(1998) found that audits deter evasion by low and middle-income taxpayers but actually increase evasion among
high-income taxpayers. Finally, Tauchen, Witte, and Beron (1989), using random taxpayer audit data from the 1969
Taxpayer Compliance Measurement Program (TCMP), find that raising the audit rate had an impact only on high-
income wage and salary workers.
These conflicting empirical findings suggest the need for more research into the processes and conditions that
promote the diffusion of deterrent effects. However, apart from a smattering of survey and experimental studies in
the 1970s and early 1980s and the previously mentioned study by Erard (1992), the tax profession largely has
avoided this topic.2 A factor contributing to the lack of research on this topic is the theoretical view that taxpayers
behave as if the audit selection process were completely random (Allingham and Sandmo , 1972). With this
assumption, each taxpayer’s evasion decision is reduced to a simple calculation of maximum utility that depends
only on the fraction of taxpayers audited each year and the penalty for evasion.
Alm (1999), strongly objecting to this mechanistic view of taxpayer behavior, states “…it is grossly misleading
to represent a complex system by a single, so-called representative agent, who behaves in some average or typical
way… This lesson is especially apt for tax compliance, [where] people exhibit a remarkable diversity in their
behavior.”
Researchers who study the origins of human behavioral diversity have identified several contributing factors,
such as genetic variation (Jobling, Hurles, and Tyler-Smith, 2004), cultural conditioning (Nisbett, 2003), ecological

2
setting (Winterhalder and Smith, 2000), and mental models (Johnson-Laird, 1983). Concerning the latter, humans
continuously construct mental models of reality, which include their assumptions, beliefs, experiences, and biases
about the world. Since life experiences vary from person to person, even within a culturally homogeneous society,
each individual’s mental model of a particular phenomenon will be unique in some respects . The variation in mental
models among individuals within a population could account for much of the diversity of taxpayer behavior that
Alm refers to.3
An analogy from the domain of traffic enforcement may help to illustrate this point. Assume you are driving in
excess of the speed limit on the interstate when you see a sign stating “Zone Patrolled by Low Flying Aircraft.” How
do you react? If you immediately slow down to the posted speed limit you must be acting on the belief that you
suddenly have come under increased surveillance by crossing an imaginary line on the road. On the other hand, if
you look around and fail to spot any “low flying aircraft” do you assume it is safe to continue speeding? The choice
you make (slow down or continue speeding) depends, in part, on your mental model of the effectiveness of aerial
traffic surveillance as well as other factors such as the behavior of other drivers and, perhaps, whether or not you are
running late for an appointment. In the same way, when the IRS announces it will begin conducting more audits
each taxpayer’s response (assuming they are aware of the new enforcement regime) will reflect their unique
preconception of how the IRS works along with any other information deemed relevant. These different perceptions
will lead some evaders to reduce or halt their evasion while others will continue to evade as before or increase their
evasion. This paper adopts the term induced effect to refer to a change in compliance behavior caused only by the
awareness of a change in enforcement level (e.g., audit rate or penalty rate).
Apart from induced effects, a program of taxpayer audits also may promote voluntary compliance from indirect
effects. Two categories of indirect effects have been identified in the literature: subsequent period effects and group
effects. Subsequent period effects refer to an increase in taxpayer compliance following an audit. Erard (1992)
examined the reporting behavior of taxpayers who were audited by the IRS and, by chance, were selected for audit
again two years later. He hypothesized that taxpayers who were previously audited would exhibit greater
compliance in subsequent time periods, either because the audit process teaches taxpayers how to more accurately
comply or because beliefs about audit probabilities are conditioned on prior audit experience. However, Erard was
unable to confirm the existence of subsequent period effects.

3
Despite these inconclusive findings, Erard’s hypothesis of higher post-audit compliance by taxpayers seems
plausible. Psychological research indicates people perceive a higher likelihood of an event if the experience is vivid
or more easily recalled (Tversky and Kahneman, 1973; Plous, 1993). Continuing with our traffic analogy, motorists
who get ticketed in a “speed trap” are likely to recall the incident for some time and consciously slow down when
passing through the same area on subsequent trips.
The speed trap situation is analogous to third-party reporting of income which taxpayers believe (often
correctly) the IRS relies on to detect underreporting. Evidence from IRS’s TCMP studies shows a positive
correlation between voluntary reporting compliance and the share of income subject to withholding and information
reporting (IRS, 1996). Therefore, subsequent period effects are more likely to occur when taxpayers are convinced
they are under continuous surveillance, such as is apparently the case with information reporting, than when
surveillance is infrequent and unpredictable (e.g., a tax audit).
A second form of indirect effects, referred to here as group effects, results when an individual’s behavior is
influenced by the values and norms of his/her peers. Several survey and experimental studies have linked the
propensity to evade taxes to social norms that are cultural in origin (Alm, Sanchez, and de Juan, 1995), predominant
among certain professional or trade organizations (Geeroms and Wilmots, 1985) or reflect the behavior of one’s
neighbors (Vogel, 1974; Spicer and Lundstedt, 1976, Scott and Grasmick 1981; Grasmick and Scott, 1982).
Completing our analogy with traffic enforcement, we can recall situations when our own driving behavior was
influenced by our fellow motorists. For example, when vehicles are passing you left and right on the interstate do
you sometimes accelerate (beyond the posted speed limit) to match their speed? If you were driving behind a hay
wagon on a two-lane road in a no passing zone, did you pass anyway? These examples and the above cited research
indicate that, at times, what we consider to be acceptable (though illegal) behavior depends on what others around us
are doing.
This brief discussion has touched on three characteristics of taxpayers and tax systems that likely influence how
audits deter evasion. These are: 1) taxpayers’ heterogeneous perceptions of the likelihood of detection and its
attendant consequences ; 2) existing institutional arrangements, such as information reporting and withholding,
which both increase voluntary reporting and reduce the amount of unreported tax that can be detected by examining
tax returns; and 3) social norms and other group influences that act to diffuse behaviors throughout a population.

4
Andreoni, Erard, and Feinstein (1998) note that experts generally agree on the importance of these factors for
understanding taxpayer behavior but disagree on how to incorporate them in existing models of evasion.4
In recent years, several authors have developed tax evasion models using techniques of multi-agent based
simulation (MABS) (Mittone and Patelli, 2000; Davis, Hecht, and Perkins, 2003). This paper takes the view that
computational simulation appears to offer the most promis ing approach to combine the three behavioral and
institutional factors identified above with the core elements of established microeconomic theory. In addition,
MABS models often provide a visualization capability that allows users to compare and contrast a model’s output
with their intuition about a problem. The capability to combine both intuition and formal rules of logic helps to
produce models that are analytically rigorous yet comprehensible by non-technical users.
This paper describes the development of an agent-based computational model of income tax evasion that
assumes individuals behave as utility maximizers but who also exhibit heterogeneous behavior, receive income from
sources with different levels of “visibility,” and whose behavior is subject to peer influences. It should be
emphasized that the model, known as the Tax Compliance Simulator (TCS), does not claim to accurately portray
taxpayer behavior. Rather, TCS combines both theoretical models and known empirical relationships into a decision
support tool that analysts can use to investigate the possible implications of alternative compliance strategies.
The next section contains an overview of agent-based computation and reviews the existing literature on MABS
models of income tax evasion. The third section introduces the TCS model and describes how specific features were
implemented, such as the taxpayer agent’s5 reporting decision, the perception of audit risk, and agent lifecycle
income. The fourth section presents a hypothetical case study that demonstrates how TCS can be used to estimate
the deterrent effects of audits . The last section summarizes main points and describes plans for future development
of TCS.
AGENT-BASED MODELS OF INCOME TAX EVASION6
An agent-based model consists of individual agents (persons, households, firms) that are represented as
software “objects” having multiple characteristics. These characteristics can be constants (e.g., gender), variable
states (e.g., age, weight), or rules of behavior (e.g., utility function, movement). Running such a model proceeds in
two stages: setup (or instantiation) and execution. During the setup stage an agent population is created and
individual agents are assigned their initial values. Also at this time, the simulation parameters, such as number of
iterations to perform and any stopping rules, are defined. As the model executes, agents are allowed to interact and

5
various statistical and graphic routines monitor what happens. Each run of a simulation generates a “solution” to the
problem being modeled. However, it is necessary to rerun the simulation many times in order to check the
robustness of the solutions generated by the model. An excellent introduction to the use of MABS models in the
social sciences is Epstein and Axtell (1996).
Mittone and Patelli (2000) were the first to develop a MABS model of income tax evasion. Building on the
theoretical work of Myles and Naylor (1996), Mittone and Patelli assume the existence of three classes of taxpayers:
honest, imitative and free riders. Each taxpayer category has a unique utility function that describes its behavior.
Honest taxpayers derive additional utility by conforming to the social norm of compliance (with utility being
proportional to the percentage of honest taxpayers in the population). Free riders derive maximum utility from
paying as little in taxes as possible. Imitative taxpayers maximize their utility by paying what other taxpayers pay
(population mean). All three groups also derive utility from public sector goods and services supported by voluntary
and enforced tax contributions. Individual behavior is influenced indirectly by the group via the level of utility
derived from public goods and services.
In each time period during the simulation, taxpayer agents must decide whether to evade more, less or the same
as in the preceding period. The decision is stochastic, but the choice probabilities depend on whether calculated
utility decreased, increased or was unchanged from last time. Decision probabilities are updated each time period
based on the change in total utility associated with the previous round’s compliance decision.
The authors use their model to examine how aggregate evasion behavior varies with different starting mixes of
taxpayers. They find that even when all taxpayers are initially honest, the absence of audits causes revenues
eventually to fall to zero (except for the occasional random tax payment). This outcome results as random dips in tax
payments induce otherwise compliant taxpayers to reduce their support for public goods, thus, producing a self-
reinforcing negative feedback cycle that discourages voluntary tax payments.
When audits are introduced, the additional enforcement revenue increases the quantity of public goods and
taxpayers’ utility. The tax agency also informs taxpayers about the average amount of tax paid and the proportion of
“honest” (fully compliant) taxpayers so that imitative and honest agents can correctly calculate their utility. The
authors test two different audit strategies: uniform and tail auditing. Uniform auditing implies a fixed random
probability of selection. Tail auditing means audits are performed only on taxpayers who report the least amount of

6
tax (although the article does not specify the cutoff point used). As one might expect, tail auditing is found to have a
weaker deterrent effect than uniform auditing.
Mittone and Patelli programmed their model using SWARM, one of several publicly-available freeware
packages designed to promote the development of agent-based applications. Others include: RePast, Ascape,
NetLogo and MASON.7
Davis, Hecht, and Perkins (2003) construct a MABS model using Mathematica software to test the hypothesis
that the diffusion of tax evasion exhibits “tipping point” behavior similar to the propagation of a disease epidemic.
Tipping point behavior refers to a population that undergoes a sudden transition from one state or condition to
another for a small change in the environment. In their model, the authors want to identify the audit rate at which a
predominantly honest population starts evading or the reverse case where a group of evaders suddenly begins to
comply.
Davis, Hecht, and Perkins also assume the existence of three classes of taxpayers: honest, susceptible and
evader. First, they develop a representative agent mathematical model and determine its solutions in equilibrium.
They find stable equilibria both at high and low levels of enforcement. However, the transition from one state to the
other is both nonlinear and asymmetric. In other words, when the population is initially honest audit rates must fall
to some extremely low level to trigger widespread evasion. Conversely, if the initial population is comprised of
evaders, the audit rate must be raised to a different (and higher) level before taxpayers suddenly become honest.
Next, the authors develop a MABS approach to determine if the solution derived analytically using a
representative agent model is true for heterogeneous agents as well. In their MABS model, taxpayers start out either
as honest or evading. An evading taxpayer reverts to being honest only if audited. Honest taxpayers become
susceptible if they observe someone in their social network evade without being audited. The authors do not specify
how agents learn about each other’s evasion success, but assume information is transmitted through direct
observation. Once taxpayers become susceptible, they will evade if either the audit rate or the proportion of their
acquaintances that are compliant falls below some pre-determined (random) threshold. Evaders who are audited by
the tax agency revert to being honest until the next time they observe an acquaintance evading.
Davis, Hecht, and Perkins find that their simulation results support the hypothesis that tax evasion exhibits
tipping point behavior. However, this conclusion remains in doubt due to their model’s lack of parallelism with real
world conditions. For example, the authors assume only evaders are audited whereas about one in four audited

7
taxpayers receive a refund or owe no additional tax (IRS, 1996). Also, results from their agent-based simulation
show taxpayers becoming 100 percent compliant for audit rates as low as 0.03. This finding is not supported by IRS
random audit studies that show little variation in the overall noncompliance rate in the last forty years despite audit
rates ranging from less than 0.01 at present to 0.05 during the 1960s (Christian, 1994).
THE TAX COMPLIANCE SIMULATOR (TCS)
Drawing on these pioneering efforts, Bloomquist (2004a) developed a prototype MABS model of taxpayer
compliance behavior known as the Tax Compliance Simulator (TCS). TCS is written in the NetLogo simulation
language (Wilensky, 1999). Compared to other agent-based modeling languages that require previous knowledge of
C++ or Java, NetLogo is relatively easy to learn and, therefore, well-suited for prototyping. A large collection of
sample programs written by an active NetLogo user community also enables new users to learn by example.
TCS allows users to define two distinct taxpayer sub-populations having unique behavioral, income, and tax
enforcement characteristics. This option permits greater parallelism with the naturally occurring world where the
opportunity to evade may vary considerably from one group of taxpayers to another (e.g., wage earners versus sole
proprietors). TCS enables separate estimation of the direct, indirect, and induced effects of taxpayer audits and
provides almost limitless flexibility to perform sensitivity testing. Taxpayers are represented as software agents each
having 29 potentially unique characteristics including income level, fraction of income visible to the tax authority,
age, life span, memory, a static list of acquaintances, perception of enforcement activity, etc.
Taxpayer Reporting Decision
TCS users can declare a percentage of each taxpayer agent’s income to be “visible” to the tax authorities. By
default, the model assumes all such income is fully reported. By declaring some fraction of income to be “visible,”
the user can represent institutional arrangements, like information reporting and withholding, that positively
influence the level of reporting compliance. For example, the 1988 TCMP study found taxpayers report over 99
percent of wage and salary income on their income tax returns versus only 67 percent for sole proprietor income
(IRS, 1996). However, “visible” income need not be restricted to explicit tracking mechanisms, but could also
encompass implicit forms of visibility, such as might be the case for businesses required to obtain a license from
state or local governmental authorities (e.g., health care providers, restaurants, and bars). By having to make their
presence known to government officials, some business owners might feel compelled to report income they might
otherwise not reveal if they operated in complete anonymity. Users can explore the impact of different assumptions

8
concerning transaction visibility by adjusting two parameters, the percentage of visible income (%Visible) and the
standard deviation of visibility (SD%Visible) among taxpayers. The latter parameter determines the level of
variation in income visibility among the taxpayer population.
For income that is not “visible,” TCS assumes taxpayers adopt the approach of standard microeconomic theory
(Allingham and Sandmo, 1972) which says that a risk neutral taxpayer will evade whenever the perceived audit rate
(p) and penalty rate (f) take on values that make the following expression true:
( ) 0where,1
1]1[ ≥
+< f
fp
Bloomquist (2003) argues that taxpayers with high compliance opportunity costs (high discount rate) are more
likely to evade, ceteris paribus, than other taxpayers. In order to account for this behavior, TCS modifies the
taxpayer’s reporting decision by incorporating variables to account for the time lag between an act of evasion and its
detection and the taxpayer’s discount rate. A third variable is included that represents an auditor’s ability to detect
evasion. With these modifications, the taxpayer’s income reporting decision becomes:
( ) ( ) tirdfg
gp )1( where,
11]2[ +×=+
<
In expression 2, t = number of time periods between evasion and detection, d = auditor detection rate (0 = d = 1.0),
and ri = discount rate for taxpayer i (ri ~ N(r, s), ri = 0, with r and s determined by the user). Expression 2 implies
that the present value cost of evasion is inversely related as an exponent to the length of time between an act of
evasion and its detection. Finally, internal IRS studies find that auditors detect only one of every three dollars of
unreported income not covered by information reporting (IRS, 1996). TCS enables a user to vary the auditor’s
ability to detect evasion (d) to determine how this parameter influences taxpayer behavior.
How much tax is voluntarily reported by the taxpayer is calculated using equation 3 which takes into account
reporting of both visible and non-visible income components.
( ) ( )
+
≥=+=
otherwise01
1if1
where,]3[ gp
? ? YYtT nvvr
In equation 3, Tr is the reported tax amount, Yv is “visible” income, Ynv is non-visible income, and t is the tax rate.
The current version of TCS assumes a single, flat tax rate for all reported income. It is anticipated that a future
version of TCS will incorporate actual tax rate schedules.

9
Audit Risk Perception
Andreoni, Erard, and Feinstein (1998), among others, have pointed out that the observed level of compliance is
far higher than predicted by expected utility (EU) theory. Given the low audit and penalty rates in most countries,
theory suggests virtually all taxpayers should evade the maximum amount. One explanation for higher than expected
levels of compliance is the tendency of people to overweight low probability events (Neilson, 2003). Bernasconi
(1998) shows that if audit probabilities are transformed using an empirically-derived weighting function based on
rank dependent expected utility (RDEU) theory one obtains predicted compliance close to observed levels .
In TCS, users may select either unweighted (EU) or weighted (RDEU) audit probabilities. In the latter case,
default values are calculated using a single parameter RDEU transformation function with a shape parameter that is
the mean of three independently estimated values for an identically-specified function (Tversky and Kahneman,
1992; Camerer and Ho, 1994; and Wu and Gonzalez, 1999). Figure 1 displays for comparison the default RDEU
weighting function used in TCS (solid line), the three weighting functions from which it is derived, and the EU
(linear) probability function.
Figure 1. Relationship of EU and RDEU Weighting Functions for Audit Probability
0.0
0.1
0.2
0.3
0.4
0.5
0.6
0.7
0.8
0.9
1.0
0.0 0.1 0.2 0.3 0.4 0.5 0.6 0.7 0.8 0.9 1.0
Audit Probability
Perc
eive
d A
udit
Prob
abili
ty
Actual Probability Camerer and Ho (1994) ?=0.56Tversky and Kahneman (1992) ?=0.61 Wu and Gonzalez (1999) ?=0.71TCS Default Weighting ?=0.63
In addition to weighting of audit probabilities, taxpayer agents are allowed to perceive a mean audit rate that is
higher or lower than the actual audit rate. This might be an appropriate assumption if it is thought that taxpayers tend
(EU)

10
to overestimate the true audit probability (Harris, 1988). Whether the actual or a perceived audit rate is assumed,
users can specify that all agents base their evasion decisions using the same rate (i.e., “representative” agents) or
audit rates drawn from a probability distribution (i.e., “heterogeneous” agents). If heterogeneous agents are used,
perceived audit rates are drawn from a normal distribution with a mean of the actual (or perceived) audit rate with a
fixed standard deviation (default value = 0.03).
Indirect Effects and Social Networks
TCS has an option to turn indirect effects on or off. When activated, users must specify the range of values that
indicate how much audit risk perception increases when an agent is audited or when they learn that someone in their
social network has been audited. Two options are available: +Random0-20 and +Random0-N. The first option tells
TCS to add a random value in the range of 0 and 20 percentage points to each taxpayer’s perceived audit rate when
indirect effects are activated. This value is fixed throughout each agent’s life span. Specifying the second option
requires the user to enter a value between 1 and 100 at set-up time to indicate the maximum value for the additional
indirect effect. Two other optional parameters related to indirect effects are the NETWORKSIZE and
TIMEAFFECTED. The NETWORKSIZE slider (a separate slider for each of the two agent population sub-groups) is
used to set the size of each agent’s social network. If a value of zero is selected, only subsequent period effects for
audited agents are modeled. If NETWORKSIZE is set to some positive and even value (say, six), then each agent’s
social network consists of exactly six other taxpayers. When one member of the social network is audited, the other
members are assumed to hear about it and are subject to indirect effects. The TIMEAFFECTED slider (again, one
for each population sub-group) is used to indicate the duration (number of time periods) of indirect effects.
Agent social networks in TCS are configured as toroids containing even-numbered sets of agents . At present,
social network size is static during a simulation but can be set to different values for purposes of sensitivity testing.
Figure 2 displays social networks for agent number 2 and 10 (labeled with an X) that consist of six nearest neighbors
(three on each side and labeled with an n).

11
Figure 2. Two Social Networks in TCS
nXnnnnn10
nnnnXnn2
11109876543210Agent
nXnnnnn10
nnnnXnn2
11109876543210Agent
Taxpayer Agent Age and Income Characteristics
The two MABS models of income tax evasion reviewed above used highly simplified taxpayer agents
compared to their real-world counterparts . Both Mittone and Patelli (2000) and Davis, Hecht, and Perkins (2003)
assume taxpayer agents live forever and have constant incomes. In contrast, taxpayer agents in TCS have finite
lifespans with a minimum age of 16 and maximum age of 100. When an agent dies (a randomly determined event
occurring after age 65) another agent having characteristics drawn from the same population sub-group as the
deceased agent replaces it . In addition, TCS agents’ incomes follow a typical earnings lifecycle with a peak
occurring between ages 45 and 55. An agent’s maximum lifetime earnings are determined by a random draw from a
triangular distribution with maximum and mode specified by the user. For every time period, each agent’s income is
calculated as a percentage of lifetime maximum annual earnings based on the agent’s current age. The relationship
between an agent’s age and maximum lifetime earnings is derived from data compiled by the U.S. Bureau of the
Census.8
Running a Simulation and Agent Visualization
The TCS user interface screen (Figure 3) enables users to modify key model parameters using sliders, switches
and choice buttons. Simulations can be run in interactive mode with full graphics display or in “batch” mode using a
NetLogo option called BehaviorSpace. At first, users may want to run the model in interactive mode with a limited
number of agents to set up and validate a simulation then switch to batch mode and a larger number of agents to
perform the actual analysis. Users can set a target voluntary compliance rate (VCR) and gradually increment both
the audit and penalty rates to identify threshold values that achieve the desired level of compliance (given the
model’s assumptions about taxpayer behavior). An option is available to seed the random number generator with a
system-supplied value or a value supplied by the user. The latter capability is useful to examine output for possible
anomalous behavior and to ensure consistency when porting the model to a new computing environment.

12
Figure 3. TCS User Interface Screen
By default, agents are displayed as black or white dots (if two population sub-groups are used). Agents subject
to indirect effects change shape to an arrow but retain their original color. When audited, agents temporarily change
color to yellow.
During an interactive session, agents move from left to right in the graphic display area (the grey region in the
center of the screen) as they approach middle age and earn more income and from right to left as they exit their peak
earning years. The rightward distance traveled by each agent depends on its pre-assigned maximum annual income,
with the highest earning agents moving farthest to the right-hand side of the graphics display area. Also located on
the user interface screen is a histogram of the agents’ income that is updated each time step.
The vertical dimension (y-axis) of the graphic display area represents voluntary compliance level. The display
area has three sections: the bottom section is a zone of zero percent compliance and the top section is a zone of 100
percent compliance. Within these two zones, each agent’s y-coordinate is randomly assigned, but relative income

13
positions (x-coordinates) are maintained. Only in the middle zone does an agent’s vertical position indicate its level
of voluntary compliance relative to other agents with higher positions denoting greater compliance.
SIMULATING THE DETERRENT EFFECTS OF TAXPAYER AUDITS USING TCS
This section presents a hypothetical example using TCS to estimate the deterrent effects of taxpayer audits. The
first set of simulations illustrates how different assumptions for audit rate perception (representative agents versus
heterogeneous agents) influence the simulation output. This is followed by an analysis of the deterrent effects for
taxpayers with different proportions of “visible” income. A third group of simulations explores the relationship
between social network size and deterrence. Finally, all three of these influences are combined to assess the relative
magnitude of deterrence from induced versus indirect effects.
Representative vs. Heterogeneous Agents
In this first example, TCS simulates the compliance behavior for a population of 300 taxpayers over 300 time
periods for audit rates from 0.01 to 0.10. In one set of simulations, all agents are assumed to perceive the exact same
audit rate and base their compliance decisions accordingly. A second set of simulations uses the same parameters
settings as the first, but allows agents to perceive audit rates differently according to their mental models of IRS
enforcement activity. In both cases , agents overweight the perceived audit rate using the default RDEU
transformation. Other assumptions include: a penalty rate three times the amount of taxes evaded and no “visible”
income.9 Figure 4 displays the output from both simulations.
Figure 4 shows that voluntary reporting compliance for representative taxpayer agents is zero for audit rates
ranging from 0.01 to 0.08, but leaps to 100 percent for audit rates of 0.09 or higher. This conclusion is supported by
Bernasconi (1998) who derives similar analytical results for taxpayers under RDEU axiomatics.10 The sudden
transformation from one state of compliance to another is symptomatic of “tipping point” behavior which is the
focus of the paper by Davis, Hecht, and Perkins (2003). However, such an abrupt transition from zero to 100 percent
compliance does not correspond to observed taxpayer behavior.
When heterogeneous agents are used, voluntary compliance is seen to rise with each increment in the audit rate
although the marginal impact is greatest for audit rates between 0.06 and 0.09. This outcome is intuitively more
appealing than the off/on compliance behavior of the representative agent model. Note that while the representative
agent model predicts 100 percent compliance when the audit rate equals 0.10, the heterogeneous agent model

14
predicts that taxpayers will only report $.70 of each $1 of tax due. This “tax gap” reflects taxpayers’ different mental
models of audit risk.
Figure 4. Voluntary Compliance Rate (VCR) by Audit Rate and Agent Type
0 0 0 0 0 0 0 0
100 100
1 2 37
13
22
33
44
58
69
0
20
40
60
80
100
1 2 3 4 5 6 7 8 9 10
Audit Rate (%)
VCR
(%)
Representative Agent ModelHeterogeneous Agent Model
Simulation parameters: RDEU transformation of audit probabilities (overweighting),3x penalty rate, no visible income, 300 agents, and 300 time periods.
Income Visibility
The second group of simulations illustrates the deterrent effect of audits when different proportions of income
are visible to the tax authority. As previously stated, TCS assumes all “visible” income is fully reported to the tax
agency similar to the observed reporting compliance behavior for wage and salary income. Therefore, increasing the
percentage of visible income will shift the voluntary compliance rate upward by a constant amount.
Five groups of simulations were run for audit rates ranging from 0.01 to 0.10. In Figure 5 and Table 1, the
simulation labeled “0/0” is identical to the previous simulation using heterogeneous agents. In this case, “0/0” refers
to zero percent visible income and a standard deviation of zero percentage points. The simulations labeled “50/0”
and “90/0” assume all taxpayer agents have exactly 50 percent and 90 percent of their income visible to the tax
authorities. The two simulations labeled “50/20” and “90/20” denote where the proportion of visible income
assigned to taxpayers is drawn from a normal distribution with mean 0.50 (or 0.90) and a standard deviation of 0.20.
This option is included to improve parallelism with real world conditions where the proportion of income subject to
information reporting varies from taxpayer to taxpayer.
Table 1 and Figure 5 show that increasing the audit rate improves compliance for all taxpayers but has a much
greater marginal impact on taxpayers with no visible income and the smallest impact on taxpayers with 90 percent
visible income. For this hypothetical case study, Table 1 shows that raising the audit rate from 0.01 to 0.05 increases

15
Figure 5. Voluntary Compliance Rate by Audit Rate and Percent Visible Income
1 2 3 4 5 6 7 8 9 10
0/050/0
50/2090/0
90/200
10
20
30
40
50
60
70
80
90
100
VCR
(%)
Audit Rate% Visible/
Stddev
Simulation parameters: RDEU transformation of audit probabilities (overweighting),3x penalty rate, heterogeneous agents, 300 agents, and 300 time periods.
1 2 3 4 5 6 7 8 9 100/0 1 2 3 7 13 22 33 44 58 69
50/0 50 51 52 53 56 60 63 72 78 8550/20 51 50 52 54 57 61 65 72 78 8590/0 90 90 90 91 91 92 93 94 96 97
90/20 87 86 87 87 88 89 91 92 93 95Source: Calculated by author using TCS.
Audit Rate% Visible/Stddev
Table 1. Voluntary Compliance Rates by Income Visibility and Audit Rate: Simulation Results
voluntary compliance by 12 percentage points for taxpayers with no visible income but only one point for those with
90 percent visible income. The data in Table 1 also reveal an apparent anomaly where the VCR is seen to fall below
the mean visible income level when agent values are drawn from a probability distribution. This phenomenon is
evident in the lower audit rates for the simulation labeled “90/20” and is due to the fact that income visibility cannot
exceed 100 percent but can be as low as three (or more) standard deviations from the mean in the opposite direction.
In this example, an agent three standard deviations from a mean value of 90 would have 30 percent of income
visible to tax authorities. Therefore, the disparity between the calculated VCR and mean visible income level will
widen with higher levels of visible income.
Social Network Size
The next simulations look at the impact of social network size on voluntary reporting compliance. In order to
perform this analysis in TCS it is necessary to first flip the IndirectEffects? switch to the “on” position. This
16
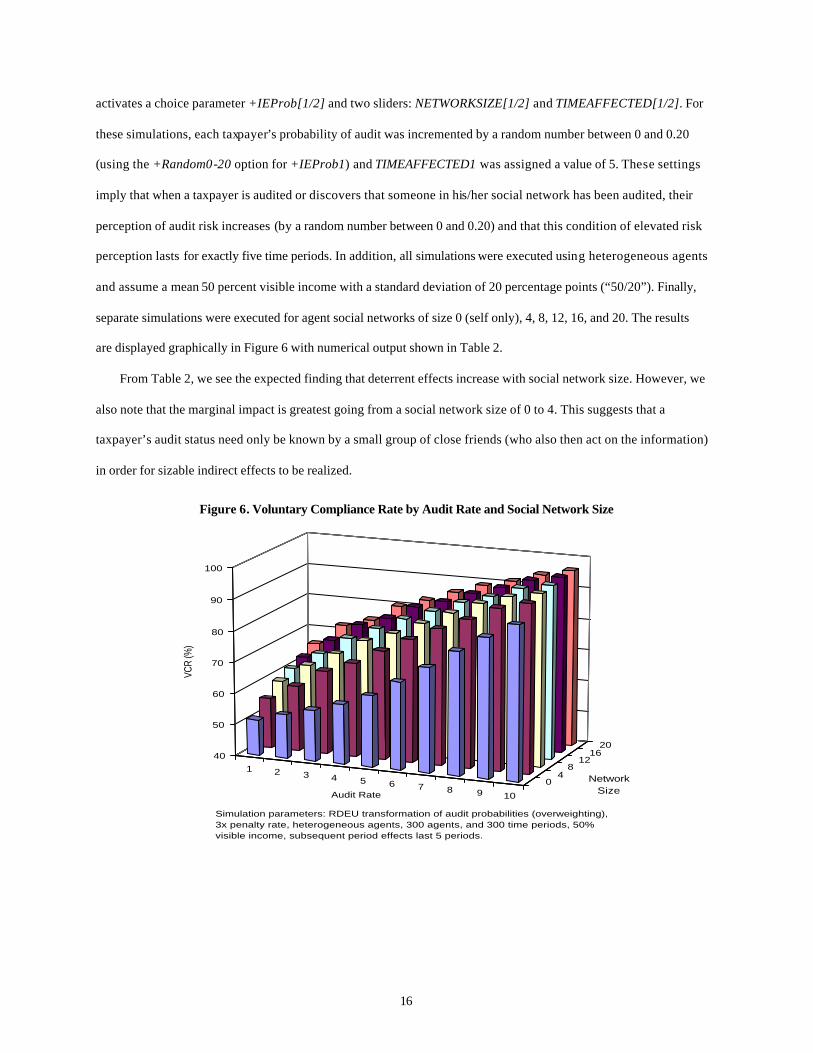
activates a choice parameter +IEProb[1/2] and two sliders: NETWORKSIZE[1/2] and TIMEAFFECTED[1/2]. For
these simulations, each taxpayer’s probability of audit was incremented by a random number between 0 and 0.20
(using the +Random0-20 option for +IEProb1) and TIMEAFFECTED1 was assigned a value of 5. These settings
imply that when a taxpayer is audited or discovers that someone in his/her social network has been audited, their
perception of audit risk increases (by a random number between 0 and 0.20) and that this condition of elevated risk
perception lasts for exactly five time periods. In addition, all simulations were executed using heterogeneous agents
and assume a mean 50 percent visible income with a standard deviation of 20 percentage points (“50/20”). Finally,
separate simulations were executed for agent social networks of size 0 (self only), 4, 8, 12, 16, and 20. The results
are displayed graphically in Figure 6 with numerical output shown in Table 2.
From Table 2, we see the expected finding that deterrent effects increase with social network size. However, we
also note that the marginal impact is greatest going from a social network size of 0 to 4. This suggests that a
taxpayer’s audit status need only be known by a small group of close friends (who also then act on the information)
in order for sizable indirect effects to be realized.
Figure 6. Voluntary Compliance Rate by Audit Rate and Social Network Size
1 2 3 4 5 6 7 8 9 10
04
812
1620
40
50
60
70
80
90
100
VCR
(%)
Audit Rate
Network Size
Simulation parameters: RDEU transformation of audit probabilities (overweighting),3x penalty rate, heterogeneous agents, 300 agents, and 300 time periods, 50% visible income, subsequent period effects last 5 periods.

17
1 2 3 4 5 6 7 8 9 10Self Only 51 54 56 59 63 68 73 80 85 90
4 56 61 67 70 75 80 84 87 92 94 8 59 66 70 75 79 83 87 91 93 95
12 61 67 73 77 81 84 88 91 94 96 16 63 70 76 78 83 85 89 91 95 96 20 66 72 75 80 83 86 89 92 94 96
Source: Calculated by author using TCS.
Audit RateSocial Network Size
Table 2. Voluntary Compliance Rates by Social Network Size and Audit Rate: Simulation Results
Summary
What does this hypothetical example tell us about the relative contributions of induced and indirect effects on
compliance behavior? Recall that induced effects are defined as a change in voluntary compliance due to awareness
of a change in the population audit rate. Indirect effects include both subsequent period and group effects on
individual compliance behavior. In order to obtain a more precise estimate of these impacts, a final group of
simulations were run each using 1,000 agents for 1,000 time periods.11 Table 3 displays the results for audit rates
from one to five percent.
1 2 3 4 5Induced N/A 50 51 52 53 56
Self Only 51 54 56 59 634 56 61 66 70 758 59 65 70 75 7912 62 68 73 77 8116 64 70 75 79 8220 65 71 76 79 83
Source: Calculated by author using TCS.N/A - not applicable.
Induced and
Indirect
Audit RateSource of Deterrence
Table 3. Voluntary Compliance Rates by Source of Deterrence
Social Network
The induced effects are shown in the top line of Table 3. Starting with a base VCR of 50 percent due to the
reporting of visible income, each one point increase in the audit rate raises voluntary compliance by one point for
audit rates up to 0.04 and an additional 3 percentage points going from an audit rate of 0.04 to 0.05. If only induced
effects are considered, an increase in the audit rate say, from 0.01 to 0.03, would raise compliance by only two
percentage points. On the other hand, an equivalent change in the audit rate would produce a ten percentage point
increase in the VCR (from 56 to 66) when both induced and indirect effects for four-person social networks are
considered. The difference is even greater if the audit rate is raised from 0.01 to 0.05; in this case the VCR increases

18
by six percentage points considering only induced effects but 19 percentage points for the combined induced and
indirect effects. These hypothetical results suggest tax officials might wish to devote more attention to
understanding group influences on compliance behavior. This observation is supported by preliminary findings
reported in Alm, Jackson, and McKee (2004) who find that communication among experimental subjects is
positively correlated with tax compliance.
SUMMARY AND FUTURE RESEARCH
This paper had two main goals . The first was to show how multi-agent based simulation (MABS) models
provide a way to incorporate several important characteristics of taxpayers and tax systems typically excluded from
analytical models of tax evasion. Such issues as taxpayer behavioral heterogeneity, variation in the visibility of
income from multiple sources, and group influences on individuals can be handled easily using tools of agent-based
simulation. This paper reviewed two previous MABS models of income tax evasion and provided links to web sites
where interested readers can freely download software packages to develop their own MABS applications.
The second goal of the paper was to describe the development of the Tax Compliance Simulator (TCS), a
prototype MABS model developed by IRS to estimate the deterrent effects of tax compliance alternatives. Key
features of TCS were described including the taxpayer’s reporting decision, audit risk perception, social networks,
and taxpayer agent age and income characteristics. A hypothetical case study was presented that demonstrated the
model’s capability to estimate deterrence resulting from different assumptions concerning taxpayers’ perceptions of
audit probability, the proportion of income visible to tax authorities, and social network size. The simulation results
suggest a significant portion of audit-based deterrence could come from group influences on compliance behavior.
This finding is supported by the recent experimental work of Alm, Jackson, and McKee (2004).
Future enhancements of TCS will focus on incorporating tax year 2001 random audit data on approximately
46,000 taxpayers from the National Research Program (NRP). The NRP data will be used to define TCS agent
characteristics and compliance behavior and will enable IRS researchers to model a variety of compliance scenarios
using the latest data available on taxpayer behavior. However, even with this new source of information, we will still
lack critical knowledge about the cause and effect relationship between enforcement activity and taxpayer behavior.
For the foreseeable future, tax administrators will continue to rely on the scientific tools of research such as field
studies and laboratory experiments, and now agent-based computer simulation, to inform their thinking on ways to
improve taxpayer compliance.

19
Notes 1How much of this recommended amount eventually is paid depends on appeals, audit reconsiderations, and other factors. For example, there were 20,399 returns with $955 million in unagreed additional tax in FY 2003 (IRS, 2004). However, by convention the direct effect is defined as the examiner-recommended additional tax amount.
2A recent exception is Alm, Jackson, and McKee (2004) who examine the role of communication in framing compliance decisions.
3Alm, Sanchez, and de Juan (1995) find a correlation between tax evasion behavior and culture. However, I believe the concept of mental models provides a more useful theoretical construct to explain observed variation in evasion behavior among individuals within a society.
4Rhoades (1999) develops a mathematical model of tax evasion with multi-component sources of income each with potentially different detection probabilities. However, she does not incorporate heterogeneous taxpayers or group effects in her model.
5In the context of MABS modeling, the terms “taxpayer,” “taxpayer agent,” and “agent” are used interchangeably throughout the remainder of the paper.
6The material in this section draws heavily on Bloomquist (2004b). 7Links to sites for these and many other software packages for agent-based modeling can be found here: http://wiki.swarm.org/wiki/Tools_for_Agent-Based_Modelling.
8See http://www.census.gov/statab/www/. 9The following additional assumptions also apply for all simulations: maximum possible lifetime annual earnings of $300,000 and modal lifetime annual earnings of $100,000.
10Bernasconi (1998) finds 100 percent compliance occurs for a penalty rate of 2.10 and an audit rate equal to 0.09. However, he uses an RDEU transformation function with a shape parameter of 0.56 from Camerer and Ho (1994) unlike TCS which uses a shape parameter value of 0.63 that is the mean of three independent estimates (see text). The larger shape parameter value in TCS necessitates a higher penalty before full compliance is reached.
11Executing one simulation with 1,000 agents for 1,000 time periods requires approximately 48 seconds on a Pentium 4 PC with 1 Gb RAM running under Windows XP.
References Allingham, M. G. and A. Sandmo. Income Tax Evasion: A Theoretical Analysis . Journal of Public Economics 1
(November 1972): 323-338. Alm, J. Tax Compliance and Tax Administration. In W. B. Hildreth and J. A. Richardson (eds.): Handbook on
Taxation. New York, NY: Marcel Dekker, Inc., (1999): 741-768. Alm, J., B. R. Jackson, and M. McKee. Audit Information Dissemination, Taxpayer Communication, and
Compliance: An Experimental Approach. Paper prepared for the 2004 IRS Research Conference, Washington, D.C., June 2004.
Alm, J., I. Sanchez, and A. de Juan. Economic and Noneconomic Factors in Tax Compliance. Kyklos 48 (1995) 3–18.
Andreoni, J., B. Erard and J. Feinstein. Tax Compliance. Journal of Economic Literature 36 (June 1998): 818-860. Bernasconi, M. Tax Evasion and Orders of Risk Aversion. Journal of Public Economics, 67 (1998): 123-134. Bloomquist, K. M. Trends as Changes in Variance: The Case of Tax Noncompliance. Paper presented at the IRS
Research Conference, June 2003. http://www.irs.gov/pub/irs-soi/bloomquist.pdf. Bloomquist, K. M. Modeling Taxpayers’ Response to Compliance Improvement Alternatives. Extended abstract and
presentation at the Conference of the North American Association for Computational Social and Organizational Science, June 27-29, 2004a.
Bloomquist, K. M. A Comparison of Agent-Based Models of Income Tax Evasion. Paper presented at the 2nd Annual Conference of the European Social Simulation Association and Model-to-Model Workshop, Valladolid, Spain, September 16-19, 2004b.
Blumental, M., C. Christian, and J. Slemrod. The Determinants of Income Tax Compliance: Evidence From a Controlled Experiment in Minnesota. National Bureau of Economic Research Working Paper No. 6575, 1998.
Camerer, C.F. and Ho, T. H. Violations of the Betweenness Axiom and Nonlinearity in Probability. Journal of Risk and Uncertainty 8 (1994): 167–196.
Christian, C. Voluntary Compliance With The Individual Income Tax: Results From the 1988 TCMP Study. The IRS Research Bulletin, IRS Publication 1500 (Rev.9–94), (1993/1994): 35–42.

20
Davis, J. S., G. Hecht and J. D. Perkins. Social Behaviors, Enforcement and Tax Compliance Dynamics. The Accounting Review 78 No. 1 (2003): 39-69.
Dubin, J. A., M. J. Graetz, and L. L. Wilde. The Effect of Audit Rates on the Federal Individual Income Tax, 1977-1986. National Tax Journal 43 No. 4 (1990): 395-409.
Epstein, Joshua and Robert Axtell. Growing Artificial Societies: Social Science from the Bottom Up . Cambridge, MA: MIT Press, 1996.
Erard, B. The Influence of Tax Audits on Reporting Behavior. In Slemrod, J. (ed.): Why People Pay Taxes: Tax Compliance and Enforcement. Ann Arbor, University of Michigan Press (1992): 95–114.
Geeroms, H. and H. Wilmots. An Empirical Model of Tax Evasion and Tax Avoidance. Public Finance/Finances Publiques 40 No. 2 (1985): 190-209.
Grasmick, H. and W. Scott. Tax Evasion and Mechanisms of Social Control: A Comparison with Grand and Petty Theft. Journal of Economic Psychology 2(3): 213-230.
Harris, Louis and Associates, Inc. Taxpayer Opinion Survey. Internal Revenue Service Document 7292 (1-88), 1988.
Internal Revenue Service. Federal Tax Compliance Research: Individual Income Tax Gap Estimates for 1985, 1988, and 1992. IRS Publication 1415 (Rev. 4-96), Washington, D.C., 1996.
Internal Revenue Service, Data Book 2003, Publication 55B, Washington, D.C., 2004. http://www.irs.gov/pub/irs-soi/03databk.pdf.
Jobling, M.A., M.E. Hurles, and C. Tyler-Smith. Human Evolutionary Genetics. New York: Garland Science, 2004.
Johnson-Laird, P.N. Mental Models: Towards a Cognitive Science of Language, Inference, and Consciousness. Cambridge: Cambridge University Press; Cambridge, MA: Harvard University Press, 1983.
Mittone, L. and P. Patelli. Imitative Behaviour in Tax Evasion. In Stefansson B. and Luna, F. (eds.): Economic Modelling with Swarm. Amsterdam, Kluwer, 2000.
Myles, G. D. and R.A. Naylor. A Model of Tax Evasion with Group Conformity and Social Customs. European Journal of Political Economy 12 (1996): 49–66.
Neilson, W. S. Probability Transformations in the Study of Behavior Toward Risk. Synthese 135 (2003): 171–192.
Nisbett, R. E. The Geography of Thought: How Asians and Westerners Think Differently…and Why. New York: Free Press, 2003.
Plous, S. The Psychology of Judgment and Decision Making. New York: McGraw-Hill, 1993. Plumley, A. H.. The Determinants of Individual Income Tax Compliance: Estimating the Impacts of Tax Policy,
Enforcement, and IRS Responsiveness. Internal Revenue Service Publication 1916 (Rev. 11-96), Washington, D.C., 1996.
Rhoades, S. C. The Impact of Multiple Component Reporting on Tax Compliance and Audit Strategies. The Accounting Review 74 No. 1 (1999): 63-85.
Scott, W. and H. Grasmick. Deterrence and Income Tax Cheating. Journal of Applied Behavioral Science 17 No. 3 (1981): 395-408.
Spicer, M. W. and S. B. Lundstedt. Understanding Tax Evasion. Public Finance/Finances Publiques 31 No. 2 (1976): 295-305.
Tauchen, H. V., A. D. Witte, and K. J. Beron. Tax Compliance: An Investigation Using Individual TCMP Data. National Bureau of Economic Research Working Paper No. 3078, 1989.
Tversky, A. and D. Kahneman. Availability: A Heuristic for Judging Frequency and Probability. Cognitive Psychology, 5 (1973): 207-232.
Tversky, A. and D. Kahneman. Advances in Prospect Theory: Cumulative Representation of Uncertainty. Journal of Risk and Uncertainty 5 (1992): 297–323.
Vogel, J. Taxation and Public Opinion in Sweden: An Interpretation of Recent Survey Data. National Tax Journal 27 (1974): 499–513.
Wilensky, U. NetLogo. http://ccl.northwestern.edu/netlogo/. Center for Connected Learning and Computer-Based Modeling, Northwestern University. Evanston, IL. 1999.
Winterhalder, B., and E. A. Smith. Analyzing Adaptive Strategies: Human Behavioral Ecology at Twenty-Five. Evolutionary Anthropology 9 (2000): 51-72.
Wu, G. and R. Gonzalez. Curvature of the Probability Weighting Function. Management Science 42 (1996): 1676–1690.