audited annual financial statements 2015 · arcelormittal south africa audited annual financial...
TRANSCRIPT

Audited Annual Financial Statements 2015
15

Contents
1 Directors’ responsibility and approval of the consolidated and company annual financial statements
1 Certificate by company secretary2 Directors’ report4 Audit and risk committee report5 Report of the independent auditor6 Group and company statements of comprehensive income7 Group and company statements of financial position8 Group and company statements of cash flows9 Group and company statements of changes in equity
11 Notes to the group and company annual financial statementsFinAnciAl rePortS And oPinionS

ArcelorMittal South Africa Audited Annual Financial Statements 2015
Page 1
Directors‘ responsibility and approval of the consolidated and company annual financial statements
Certificate by company secretary
To the shareholders of ArcelorMittal South Africa LtdThe board of directors (directors) are required to maintain adequate accounting records and are responsible for the content and integrity of the consolidated and company annual financial statements and related financial information included in this report. It is their responsibility to ensure that the annual financial statements, comprising the statements of financial position as at 31 December 2015, and the statements of comprehensive income, cash flows, changes in equity for the year then ended, and the notes to the financial statements, which include a summary of significant accounting policies and other explanatory notes, are prepared in accordance with International Financial Reporting Standards, and the requirements of the Companies Act No 71 of 2008 (Companies Act). In addition, the directors are responsible for preparing the directors’ report. The financial statements and directors' report have been prepared by the finance staff of ArcelorMittal South Africa Ltd, headed and supervised by D Subramanian, the group’s chief financial officer.
In order for the directors to discharge their responsibilities, management has developed and continues to maintain a system of internal control aimed at reducing the risk of error or loss in a cost-effective manner. The directors, primarily through the audit and risk committee, which consists of independent non-executive directors, meet periodically with the external and internal auditors, as well as executive management to evaluate matters concerning accounting policies, internal control, auditing and financial reporting. The group’s internal auditors independently evaluate the internal controls. The external auditors are responsible for reporting on the financial statements. The external and internal auditors have unrestricted access to all records, property and personnel as well as to the audit and risk committee. The directors are not aware of any material breakdown in the functioning of these controls and systems during the period under review.
The directors are of the opinion, based on the information and explanations given by management and the internal auditors, that the system of internal control provides reasonable assurance that the financial records may be relied on for the preparation of the consolidated and company annual financial statements. However, any system of internal financial control can provide only reasonable and not absolute assurance against material misstatement or loss.
The directors have reviewed the group and company’s financial budgets for the year to 31 December 2016. In light of their review of the current financial position and existing borrowing facilities, they consider it appropriate that the consolidated and company annual financial statements continue to be prepared on the going concern basis. Refer to note 37 for further details.
The annual financial statements for the year ended 31 December 2015 have been audited by Deloitte & Touche, the company’s independent external auditors, whose report can be found on page 5.
The directors of the company accept responsibility for the consolidated and company annual financial statements which were approved by the board of directors on 3 February 2016 and are signed on its behalf by:
PS O'Flaherty D SubramanianChief executive officer Chief financial officer
In terms of section 88(2)(e) of the Companies Act, I certify that, to the best of my knowledge and belief, the company has, in respect of the financial year reported upon, lodged with the Companies Intellectual Property Commission all returns and notices required of a public company and that all such returns are true, correct and up to date.
Nomonde BamCompany secretary3 February 2016

ArcelorMittal South Africa Audited Annual Financial Statements 2015
Page 2
Directors‘ report
The directors have pleasure in submitting their report together with ArcelorMittal South Africa Ltd’s consolidated and company’s annual financial statements for the year ended 31 December 2015.
Nature of businessArcelorMittal South Africa Ltd and its subsidiaries (together, the group) manufacture and sell long and flat steel products and beneficiated by-products. The group’s operations are primarily concentrated in South Africa with a sales focus domestically and internationally, with specific emphasis on sub-Saharan Africa.
The company is a public company incorporated and domiciled in South Africa. The address of the registered office is detailed on the inside of the back cover of this report.
The company is listed on the main board of the Johannesburg Stock Exchange Ltd in South Africa, and is a subsidiary of ArcelorMittal Holdings AG, which is part of the ArcelorMittal group. The functional and reporting currency is the South African rand (ZAR). Financial results and activitiesThe contents of the annual financial statements adequately address the financial performance of the group for the financial year ended 31 December 2015.
Further detailed reports on the activities and performance of the group and the various segments of the group are contained in the integrated annual report.
At 31 December 2015 the group had a net asset value per share of 3 358 cents (2014: 5 165 cents). The net asset value per share was calculated using a net asset value of R13 472 million (2014: R20 722 million). Refer to note 10 of the annual financial statements for information on loss and headline loss per share.
DividendsConsistent with the group's dividend policy, no dividends were declared for the 2015 and 2014 financial years.
Property, plant and equipmentDetails of capital expenditure are provided in note 28 and in the statements of cash flows.
Authorised and issued share capitalDetails of the authorised and issued share capital are set out in note 21 of the annual financial statements. ShareholdersArcelorMittal Holdings AG, as controlling shareholder, had an effective shareholding of 52.02% at 31 December 2015 prior to the rights issue in January 2016. Details of the registered and beneficial shareholders of the company are set out in the integrated annual report. Details of beneficial shareholders in excess of 5% are disclosed in note 21.
Directors’ interestsThe details of the beneficial direct and indirect interests of executive directors, in the shares of the company are set out in note 33 of these annual financial statements.
Details of the direct and indirect interest of non-executive directors in the shares of the company are set out below:
2015 2014Director Direct Indirect Total Direct Indirect Total
DCG Murray – 5 557 5 557 – 1 557 1 557 JRD Modise 5 025 – 5 025 5 025 – 5 025
Total 5 025 5 557 10 582 5 025 1 557 6 582
No other director holds any direct or indirect beneficial interest in the share capital of the company. Since the end of the financial year ended 31 December 2015 and the date of this report. DCG Murrays indirect shareholding is 14 667 shares after the rights issue. Investments in joint ventures, associates and subsidiariesThe financial information in respect of interests in jointly controlled entities, associates and subsidiaries of the company is disclosed in notes 14 and 15 of the annual financial statements. Borrowing powers In terms of clause 34 of the Memorandum of Incorporation, the borrowing powers of the company and its subsidiaries are subject to any limitations imposed by the directors on the borrowing powers of the company. Directorate The names of the directors who presently hold office and served on the various committees of the board are set out in the integrated annual report. The following changes in directorate have taken place: ◆◆ Following D Subramanian’s appointment as chief financial officer (CFO) on 1 August 2015. GJ van Zyl, who was appointed as interim CFO on 1 July
2015, was relieved from the position as interim CFO on 1 August 2015. ◆◆ MJ Wellhausen resigned as CFO and executive director on 15 March 2015.◆◆ S Maheshwari resigned as non-executive director on 31 March 2015. ◆◆ G Urquijo resigned as non-executive director on 8 June 2015. ◆◆ MAM Vereecke was appointed as a non-executive director on 11 June 2015. ◆◆ R Kothari was appointed as a non-executive director on 11 June 2015.

ArcelorMittal South Africa Audited Annual Financial Statements 2015
Page 3
Directors‘ report continued
◆◆ F du Plessis resigned as independent non-executive director on 22 July 2015. ◆◆ NF Nicolau was appointed as an independent non-executive director on 10 September 2015. ◆◆ LC Cele was appointed as an independent non-executive director on 4 January 2016. ◆◆ In December 2015, PS O’Flaherty announced his resignation as Chief Executive Officer (CEO). It is proposed that PS O’Flaherty will be appointed as
a non-executive director with effect from 1 March 2016.◆◆ The recruitment process for a new CEO is well advanced. D Subramanian has been appointed as acting CEO until the new CEO is appointed and
takes office. GJ van Zyl will act as CFO until D Subramanian resumes his position as CFO. Retirement by rotation In terms of clause 27 of the Memorandum of Incorporation, the following directors are required to retire by rotation, and being eligible, offer themselves for re-election at the forthcoming annual general meeting (AGM): ◆◆ PM Makwana; ◆◆ JRD Modise; ◆◆ NP Mnxasana; and ◆◆ LP Mondi.
Shareholders will be requested to confirm the following directors’ appointment as directors at the forthcoming annual general meeting:◆◆ D Subramanian; ◆◆ NF Nicolau; ◆◆ LC Cele (appointed from 4 January 2016);◆◆ MAM Vereecke;◆◆ R Kothari; and◆◆ PS O’Flaherty.
Going concern As at 31 December 2015, the current liabilities of group and company exceeded its current assets by R838 million for the group and R848 million for the company. However, following the rights offer on 15 January 2016, R3 200 million of borrowings, which were included in current liabilities were converted into equity, reversing this position.
The group’s funding plan for the next 12 months takes into account improved sales volumes due to a decrease in imports as a result of the imposition of required import tariffs in quarter two of 2016 and the current weak rand:US dollar exchange rate, continued efforts in cost reduction, the cut-back of non-essential capital expenditure, the sale of redundant assets, the continuation of the current facilities in place and the continued support from ArcelorMittal group as and when required.
The group’s funding plan includes the successful rights offer concluded on 15 January 2016, which resulted in a net R1 300 million cash injection into the group. In addition, the group is well advanced in introducing black economic ownership at the equity level which should ensure further capital injection.
The group is also intending to convert its short-term borrowing facilities to medium-term debt and is looking at a number of options in this regard with the full support of the ArcelorMittal group.
Based on the above plans and initiatives, the board believes that the group and company is a going concern over the next 12 months as its expected working capital resources, by way of cash generated from operations together with current facilities as well as specific cash initiatives outlined above, are sufficient to meet the group and company’s present working capital and capital expenditure needs during that period.
Shareholders are cautioned that, due to material uncertainty around timing relating to import tariffs, fair pricing and steel localisation, the steel industry and ArcelorMittal South Africa Ltd would need to undertake significant structural changes should these government interventions not materialise in the next 12 months.
Independent auditors Deloitte & Touche continued in office as auditors of the group. At the forthcoming annual general meeting to be held on Wednesday 25 May 2016, shareholders will be requested to reappoint Deloitte & Touche as the independent auditors of the group and the appointment of M Mantyi as the individual designated auditor who will undertake the audit of the company for the ensuing year, terminating at the conclusion of the next annual general meeting of the company. Litigation Details on litigation and claims are set out in note 34 of the annual financial statements. Company secretary N Bam was appointed as the company secretary on 1 August 2015. On 17 April 2015 the services of Premium Corporate Consulting Services Proprietary Ltd were terminated and M Adam was appointed as the acting company secretary until the appointment of N Bam. Subsequent events Rights issueA successful rights offer for R4 500 million was concluded on 15 January 2016. ArcelorMittal group has underwritten the rights issue in its entirety, through repayment of an outstanding intra-group loan of R3 200 million and made an additional cash injection of approximately R460 million. The intra-group loan is being repaid in two tranches; the first has been repaid and the second will be paid in quarter two of 2016.
B-BBEE transactionAs part of ArcelorMittal South Africa’s Ltd initiatives in transforming the company, it is proposed that the B-BBEE transaction is undertaken to achieve a sustainable black ownership in the company in order for the company to maximise its score under the B-BBEE Codes of Good Practice. ArcelorMittal South Africa Ltd has now finalised the selection of a potential B-BBEE partner/s with whom to commence negotiations to conclude the transaction for an equity interest in the company.
No further events have come to the attention of management that warrant disclosure as of the day of this report.
ArcelorMittal South Africa Audited Annual Financial Statements 2015
Page 4
Audit and risk committee report
The audit and risk committee (the committee) has pleasure in submitting its report to the shareholders as required in terms of section 94 (7) of the Companies Act No 71 of 2008. Membership of the committee The committee comprised of the following members at the date of this report:◆◆ DCG Murray;◆◆ JRD Modise; and◆◆ NP Mnxasana.
Each member is an independent non-executive director and has the adequate relevant knowledge, the financial expertise and experience to equip the committee to properly execute its duties and responsibilities. The experience and qualifications of the members are set out in the integrated annual report.
The board notes the retirement of the chairman of the committee, DCG Murray, with effect from the date of the AGM. LC Cele will be elected as the replacement member of the committee. Shareholders will be required, at the AGM, to authorise the audit committee members to elect a chairperson from amongst the members. Functions of the committee During the year under review, five meetings were held. Details of the attendance are set out in the corporate governance section of the integrated annual report. The committee reports that it has adopted appropriate formal terms of reference as its mandate, and has regulated its affairs in compliance with this mandate, and has discharged all of the responsibilities set out therein. During the financial year under review, the committee reviewed the following matters: ◆◆ the quarterly and half-yearly financial reports, the integrated annual report, the annual financial statements and accounting policies for the company
and all subsidiaries; ◆◆ the effectiveness of the combined assurance model; ◆◆ the reports of the internal audit function on the state of internal control including its forensic reports regarding fraud prevention and detection; ◆◆ the effectiveness of the internal audit function; ◆◆ the auditor’s findings and recommendations; ◆◆ statements on ethical standards for the company and considered how they are promoted and enforced; ◆◆ significant cases of unethical activity by employees or by the company itself; and ◆◆ reports on the risk management process in the company and assessed the company’s exposure to the following risks:
• top strategic risks (including credit and market risks, human resources risks and compliance risks); • operational risks; and • information technology risks.
Independence of auditor The committee reviewed a presentation by the external auditors and after conducting its own review, is satisfied with the independence and objectivity of Deloitte & Touche as external auditors and M Mantyi, as the designated auditor. The committee further approved the fees to be paid to Deloitte & Touche and their terms of engagement and pre-approving the proposed contract with Deloitte & Touche for the provision of non-audit services to the company. Statutory reporting The committee has evaluated the annual financial statements of ArcelorMittal South Africa Ltd and the group for the year ended 31 December 2015 and based on the information provided to the committee, considers that the company and group comply, in all material respects, with the requirements of the Companies Act of South Africa, the International Financial Reporting Standards (IFRS), the SAICA Financial Reporting Guides as issued by the Accounting Practices Committee, and applicable legislation and financial pronouncements as issued by the Financial Reporting Standards Council. Internal financial controls The committee agendas provide for confidential meetings between committee members and both the internal and independent external auditors. The committee has oversight of the group’s financial statements and reporting process, including the system of internal financial control. It is responsible for ensuring the group’s internal audit function is independent and has the necessary resources, standing and authority in the organisation to discharge its duties. The committee oversees cooperation between internal and external auditors, and serves as a link between the board of directors and these functions. The head of internal audit reports administratively to the chief executive officer and functionally to the chairman of the committee and head of group internal audit of the holding company ArcelorMittal Holdings AG. The committee is of the opinion, after having considered the assurance provided by the internal audit function, that the group’s system of internal financial controls in all material aspects is effective and provides reasonable assurance that the financial records may be relied upon for the preparation of the annual financial statements. This is based on the information and explanations given by management and the group internal audit function. Expertise and experience of the chief financial officer and the finance function The committee has satisfied itself that the newly appointed chief financial officer, D Subramanian, has the appropriate expertise and experience. The committee has assessed the competency, skills and resourcing of the group’s finance function, and is satisfied as to the overall adequacy and appropriateness of the finance function. Expertise and experience of the company secretary The committee has satisfied itself that the company secretary has the appropriate competence and experience and has maintained an arm’s-length relationship with directors. Recommendation of the annual financial statements and integrated annual report The committee, having fulfilled the oversight role regarding the reporting process for both the annual financial statements and the integrated annual report and having regard to material factors that may impact on the integrity of these reports, recommends the integrated annual report and the consolidated and company annual financial statements for approval by the board of directors.
DCG Murray Chairman 3 February 2016

ArcelorMittal South Africa Audited Annual Financial Statements 2015
Page 5
Report of the independent auditor
To the shareholders of ArcelorMittal South Africa Ltd We have audited the consolidated and separate financial statements of ArcelorMittal South Africa Ltd set out on pages 6 to 65, which comprise the statements of financial position as at 31 December 2015, and the statements of comprehensive income, statements of changes in equity and statements of cash flows for the year then ended, and the notes, comprising a summary of significant accounting policies and other explanatory information.
Directors’ responsibility for the consolidated financial statementsThe company’s directors are responsible for the preparation and fair presentation of these consolidated and separate financial statements in accordance with International Financial Reporting Standards and the requirements of the Companies Act of South Africa, and for such internal control as the directors determine is necessary to enable the preparation of consolidated and separate financial statements that are free from material misstatement, whether due to fraud or error.
Auditor’s responsibilityOur responsibility is to express an opinion on these consolidated and separate financial statements based on our audit. We conducted our audit in accordance with International Standards on Auditing. Those standards require that we comply with ethical requirements and plan and perform the audit to obtain reasonable assurance about whether the consolidated and separate financial statements are free from material misstatement.
An audit involves performing procedures to obtain audit evidence about the amounts and disclosures in the financial statements. The procedures selected depend on the auditor’s judgement, including the assessment of the risks of material misstatement of the financial statements, whether due to fraud or error. In making those risk assessments, the auditor considers internal control relevant to the entity’s preparation and fair presentation of the financial statements in order to design audit procedures that are appropriate in the circumstances, but not for the purpose of expressing an opinion on the effectiveness of the entity’s internal control. An audit also includes evaluating the appropriateness of accounting policies used and the reasonableness of accounting estimates made by management, as well as evaluating the overall presentation of the financial statements.
We believe that the audit evidence we have obtained is sufficient and appropriate to provide a basis for our audit opinion.
OpinionIn our opinion, the consolidated and separate financial statements present fairly, in all material respects, the consolidated and separate financial position of ArcelorMittal South Africa Ltd as at 31 December 2015, and its consolidated and separate financial performance and its consolidated and separate cash flows for the year then ended in accordance with International Financial Reporting Standards and the requirements of the Companies Act of South Africa.
Emphasis of matter Without qualifying our opinion, we draw attention to note 37 to the consolidated and separate financial statements which sets out the directors’ plans and initiatives along with other matters, which, should they not materialise, indicate the existence of a material uncertainty which may cast significant doubt on the company’s and group’s ability to continue as a going concern.
Other reports required by the Companies Act As part of our audit of the consolidated and separate financial statements for the year ended 31 December 2015, we have read the directors’ report, the audit and risk committee’s report and the company secretary’s certificate for the purpose of identifying whether there are material inconsistencies between these reports and the audited consolidated and separate financial statements.
These reports are the responsibility of the respective preparers. Based on reading these reports we have not identified material inconsistencies between these reports and the audited consolidated and separate financial statements. However, we have not audited these reports and accordingly do not express an opinion on these reports.
Report on other legal and regulatory requirements In terms of the Independent Regulatory Board for Auditors (IRBA) Rule published in Government Gazette Number 39475 dated 4 December 2015, we report that Deloitte & Touche has been the auditor of ArcelorMittal South Africa Ltd for 11 years. We are independent of the group in accordance with the IRBA Code of Professional Conduct for Registered Auditors (IRBA Code) and other independence requirements applicable to performing audits of financial statements in South Africa. We have fulfilled our other ethical responsibilities in accordance with the IRBA Code and in accordance with other ethical requirements applicable to performing audits in South Africa. The IRBA Code is consistent with the International Ethics Standards Board for Accountants Code of Ethics for Professional Accountants (Parts A and B).
Deloitte and ToucheRegistered AuditorPer: Mandisi MantyiPartner4 February 2016
National executive: *LL Bam Chief Executive, *AE Swiegers Chief Operating Officer, *GM Pinnock Audit, DL Kennedy Risk Advisory, *NB Kader Tax, TP Pillay Consulting, *K Black Clients & Industries , *JK Mazzocco Talent & Transformation, *MJ Jarvis Finance, *M Jordan Strategy, S Gwala Managed Services, * TJ Brown Chairman of the Board, *MJ Comber Deputy Chairman of the Board* Partner and registered auditor.
A full list of partners and directors is available on request.
B-BBEE rating: Level 2 contributor in terms of The Chartered Accountancy Profession Sector Code
Member of Deloitte Touche Tohmatsu Limited
ArcelorMittal South Africa Audited Annual Financial Statements 2015
Page 6
Group and company statements of comprehensive incomefor the year ended 31 December 2015
Group Company
Notes2015
Rm2014
Rm2015
Rm2014
Rm
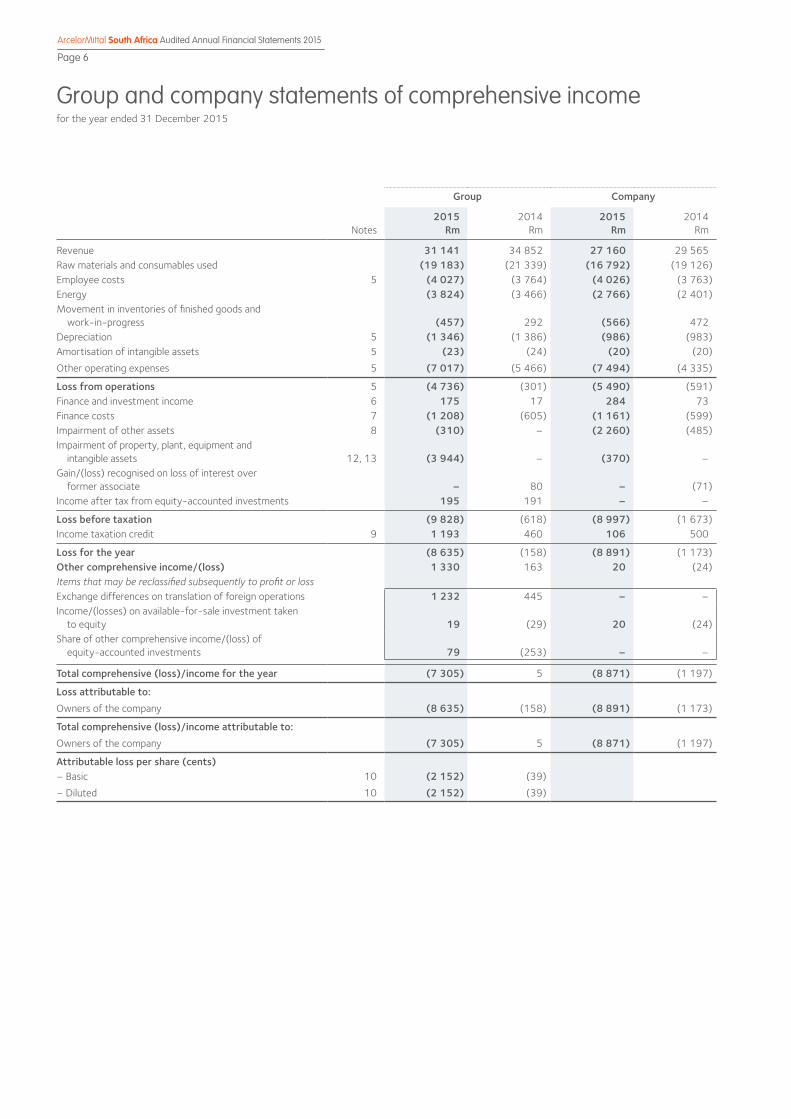
Revenue 31 141 34 852 27 160 29 565 Raw materials and consumables used (19 183) (21 339) (16 792) (19 126)Employee costs 5 (4 027) (3 764) (4 026) (3 763)Energy (3 824) (3 466) (2 766) (2 401)Movement in inventories of finished goods and work-in-progress (457) 292 (566) 472 Depreciation 5 (1 346) (1 386) (986) (983)Amortisation of intangible assets 5 (23) (24) (20) (20)
Other operating expenses 5 (7 017) (5 466) (7 494) (4 335)
Loss from operations 5 (4 736) (301) (5 490) (591)Finance and investment income 6 175 17 284 73 Finance costs 7 (1 208) (605) (1 161) (599)Impairment of other assets 8 (310) – (2 260) (485)Impairment of property, plant, equipment and intangible assets 12, 13 (3 944) – (370) –Gain/(loss) recognised on loss of interest over former associate – 80 – (71)Income after tax from equity-accounted investments 195 191 – –
Loss before taxation (9 828) (618) (8 997) (1 673)Income taxation credit 9 1 193 460 106 500
Loss for the year (8 635) (158) (8 891) (1 173)Other comprehensive income/(loss) 1 330 163 20 (24)Items that may be reclassified subsequently to profit or lossExchange differences on translation of foreign operations 1 232 445 – –Income/(losses) on available-for-sale investment taken to equity 19 (29) 20 (24)Share of other comprehensive income/(loss) of equity-accounted investments 79 (253) – –
Total comprehensive (loss)/income for the year (7 305) 5 (8 871) (1 197)
Loss attributable to:Owners of the company (8 635) (158) (8 891) (1 173)
Total comprehensive (loss)/income attributable to:Owners of the company (7 305) 5 (8 871) (1 197)
Attributable loss per share (cents)– Basic 10 (2 152) (39)
– Diluted 10 (2 152) (39)

ArcelorMittal South Africa Audited Annual Financial Statements 2015
Page 7
Group and company statements of financial positionas at 31 December 2015
Group Company
Notes2015
Rm2014
Rm2015
Rm2014
Rm
AssetsNon-current assetsProperty, plant and equipment 12 11 859 16 001 11 269 11 640 Intangible assets 13 112 135 108 120 Equity-accounted investments 14 5 090 4 031 169 167 Investments in subsidiaries 15 – – 1 096 4 701 Other financial assets 16 573 58 564 48
17 634 20 225 13 206 16 676 Current assetsInventories 17 9 385 10 684 8 503 9 905 Trade and other receivables 18 1 666 1 562 1 342 1 016 Taxation 75 64 64 64 Other financial assets 16 38 37 32 35 Cash and bank balances 19 2 164 454 2 150 285
13 328 12 801 12 091 11 305
Total assets 30 962 33 026 25 297 27 981
Equity and liabilitiesEquityStated capital 21 37 37 37 37 Reserves 175 (1 294) 58 (17)Retained income 13 260 21 979 9 052 17 943
13 472 20 722 9 147 17 963 Non-current liabilitiesFinance lease obligations 22 193 256 109 156 Provisions 23 2 895 1 720 2 865 1 694 Deferred income tax liability 24 – 1 204 – 108 Other payables 25 236 261 236 261
3 324 3 441 3 210 2 219 Current liabilitiesTrade payables 7 761 6 402 6 587 5 385 Taxation – 18 – – Other financial liabilities 27 14 11 14 7 Borrowings 26 5 029 1 000 5 029 1 000 Finance lease obligations 22 63 92 47 79 Provisions 23 541 571 515 563 Other payables 25 758 769 748 765
14 166 8 863 12 940 7 799
Total equity and liabilities 30 962 33 026 25 297 27 981
ArcelorMittal South Africa Audited Annual Financial Statements 2015
Page 8
Group and company statements of cash flowsfor the year ended 31 December 2015
Group Company
Notes2015
Rm2014
Rm2015
Rm2014
Rm
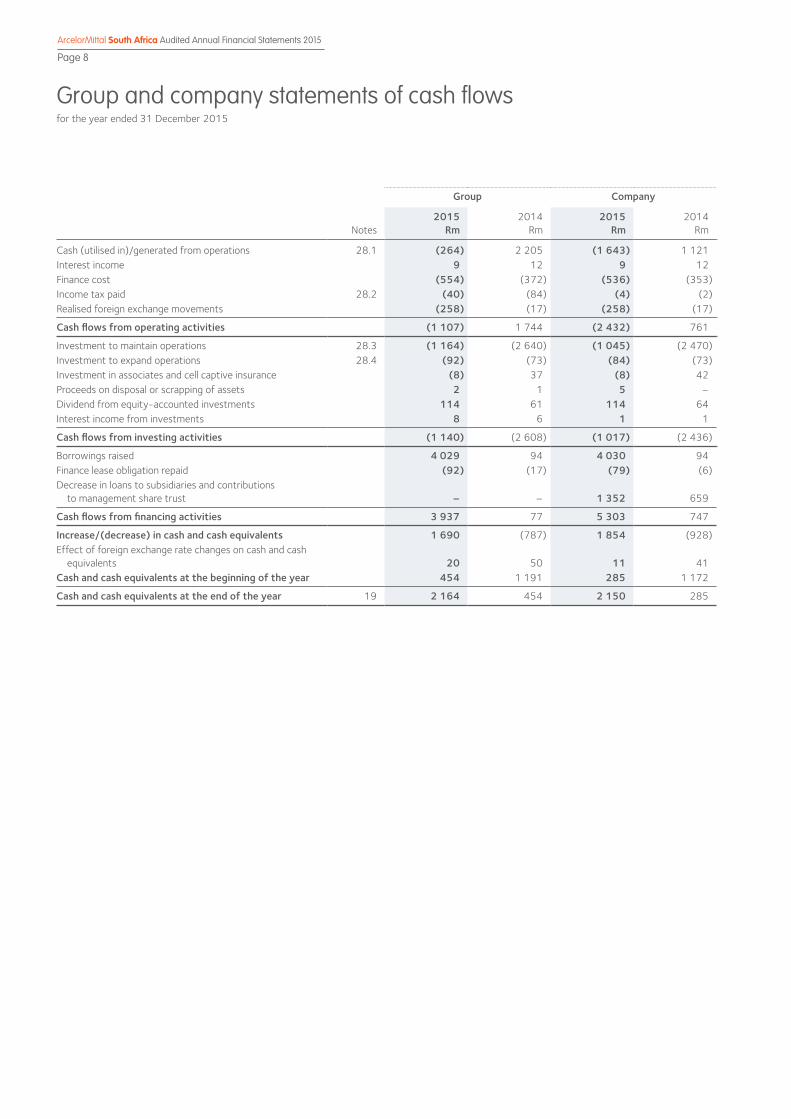
Cash (utilised in)/generated from operations 28.1 (264) 2 205 (1 643) 1 121 Interest income 9 12 9 12 Finance cost (554) (372) (536) (353)Income tax paid 28.2 (40) (84) (4) (2)Realised foreign exchange movements (258) (17) (258) (17)
Cash flows from operating activities (1 107) 1 744 (2 432) 761
Investment to maintain operations 28.3 (1 164) (2 640) (1 045) (2 470)Investment to expand operations 28.4 (92) (73) (84) (73)Investment in associates and cell captive insurance (8) 37 (8) 42 Proceeds on disposal or scrapping of assets 2 1 5 – Dividend from equity-accounted investments 114 61 114 64 Interest income from investments 8 6 1 1
Cash flows from investing activities (1 140) (2 608) (1 017) (2 436)
Borrowings raised 4 029 94 4 030 94 Finance lease obligation repaid (92) (17) (79) (6)Decrease in loans to subsidiaries and contributions to management share trust – – 1 352 659
Cash flows from financing activities 3 937 77 5 303 747
Increase/(decrease) in cash and cash equivalents 1 690 (787) 1 854 (928)Effect of foreign exchange rate changes on cash and cash equivalents 20 50 11 41 Cash and cash equivalents at the beginning of the year 454 1 191 285 1 172
Cash and cash equivalents at the end of the year 19 2 164 454 2 150 285

ArcelorMittal South Africa Audited Annual Financial Statements 2015
Page 9
Group and company statement of changes in equityfor the year ended 31 December 2015
Reserves
Group
Stated capital
Rm
Retainedincome
Rm
Treasury share
equity reserve1
Rm
Management Share Trust
reserve2
Rm
Share-based
payment reserve3
Rm
Attributablereserves
of equity-accounted
investmentsRm
Otherreserves4
Rm
Total equity
Rm
Balance at 1 January 2014 37 22 271 (3 918) (285) 246 1 370 973 20 694 Total comprehensive (loss)/income for the year – (158) – – – (253) 416 5 Share-based payment expense – – – – 23 – – 23
Transfer between reserves – (134) – – – 134 – –
Balance at 31 December 2014 37 21 979 (3 918) (285) 269 1 251 1 389 20 722 Total comprehensive (loss)/ income for the year – (8 635) – – – 79 1 251 (7 305)Share-based payment expense – – – – 55 – – 55 Transfer between reserves – (84) – – – 84 – –
Balance at 31 December 2015 37 13 260 (3 918) (285) 324 1 414 2 640 13 472
Reserves
Company
Stated capital
Rm
Retainedincome
Rm
Treasury share
equity reserve1
Rm
Management Share Trust
reserve2
Rm
Share-based
payment reserve3
Rm
Attributablereserves
of equity-accounted
investmentsRm
Otherreserves4
Rm
Total equity
Rm
Balance at 1 January 2014 37 19 116 – (285) 246 – 23 19 137 Total comprehensive loss for the year – (1 173) – – – – (24) (1 197)Share-based payment expense – – – – 23 – – 23
Balance at 31 December 2014 37 17 943 – (285) 269 – (1) 17 963 Total comprehensive (loss)/ income for year – (8 891) – – – – 20 (8 871)Share-based payment expense – – – – 55 – – 55
Balance at 31 December 2015 37 9 052 – (285) 324 – 19 9 147
Refer to notes 1 to 4 on page 10.
Dividends per share (cents)2015: Rnil2014: Rnil

ArcelorMittal South Africa Audited Annual Financial Statements 2015
Page 10
Group and company statement of changes in equity continuedfor the year ended 31 December 2015
In the context of the statement of changes in equity, the following equity reserves are of relevance:
1. Treasury share equity reserveIn 2009 the company implemented a share buy-back arrangement and acquired 9.995% of the shareholding of each shareholder. In the current year the Ikageng Broad Based Employee Share Trust was created, to hold in trust the shares for the Employee Share Ownership Plan, and purchased 4.7% of ArcelorMittal South Africa Ltd shareholding from Vicva Investments and Trading Nine (Pty) Ltd, through a contribution from the company. The trust is controlled by the company and therefore the trust is consolidated in accordance with IFRS 10 Consolidated Financial Statements. The shares will continue to remain in issue as treasury shares.
2. Management Share Trust reserve The Management Share Trust reserve represents the net outflow from the purchase of treasury shares in order to meet obligations in terms of the ArcelorMittal South Africa equity-settled share option plan housed in the Management Share Trust. The trust is consolidated as a consolidated structured entity in compliance with IFRS 10 Consolidated Financial Statements.
3. Share-based payment reserve The share-based payment reserve represents the accumulated charge for share options and long-term incentive plan units in terms of IFRS 2 Share-based Payments, which are all equity-settled.
4. Other reserves Other reserves consist of the following:
Capital redemption reserve of R23 million (2014: R23 million) for the group and company. The capital redemption reserve was created in terms of the South African Companies Act No 61 of 1973, following the redemption of shares during the year ended 30 June 2000, out of profits that would otherwise be available for distribution to ordinary shareholders. Available-for-sale investment reserve of R1 million debit (2014: R20 million debit) for the group. The available-for-sale reserve relates to the unrealised fair value gains/(losses) relating to the group’s investment in Hwange Colliery Company Ltd and Coal of Africa Ltd.
Translation of foreign operation reserve of R2 618 million (2014: R1 386 million) for the group. The translation of foreign operation reserve consists of:◆◆ reserves relating to equity-accounted investments of R2 276 million (2014: R1 175 million); and ◆◆ other group-related translation reserves of R342 million (2014: R211 million).
ArcelorMittal South Africa Audited Annual Financial Statements 2015
Page 11
Notes to the group and company annual financial statementsfor the year ended 31 December 2015
1. General information ArcelorMittal South Africa Ltd (the company) and its subsidiaries are consolidated in these annual financial statements to reflect “the group”
annual financial statements. ArcelorMittal South Africa Ltd is one of the largest steel producers on the African continent. The company is domiciled in South Africa and it is a public company listed on the Johannesburg Stock Exchange.
2. Standards and interpretations in issue at 31 December 2015 and not yet effective for periods ended 31 December 2015
A number of new standards, amendments to standards and interpretations are effective for annual periods beginning on or after 1 January 2016, and have not been applied in preparing these annual financial statements. Those which may be relevant to the group and company are set out below. The group and company do not plan to adopt these standards early. These will be adopted in the period that they become mandatory unless otherwise indicated:
Effective for the financial year commencing 1 January 2016 Disclosure Initiative (Amendments to IAS 1) The amendments provide additional guidance on the application of materiality and aggregation when preparing financial statements. The
amendments also clarify presentation principles applicable to the order of notes, other comprehensive income of equity accounted investees and subtotals presented in the statement of financial position and statement of profit or loss and other comprehensive income.
The amendments apply for annual periods beginning on or after 1 January 2016 and early application is permitted.
Effective for the financial year commencing 1 January 2018 IFRS 15 Revenue from Contracts with Customers This standard replaces IAS 11 Construction Contracts, IAS 18 Revenue, IFRIC 13 Customer Loyalty Programmes, IFRIC 15 Agreements for the
Construction of Real Estate, IFRIC 18 Transfer of Assets from Customers and SIC-31 Revenue – Barter of Transactions Involving Advertising Services. The standard contains a single model that applies to contracts with customers and two approaches to recognising revenue: at a point in time or over time. The model features a contract-based five-step analysis of transactions to determine whether, how much and when revenue is recognised. This new standard will most likely have an impact on the group, which will include a possible change in the timing of when revenue is recognised and the amount of revenue recognised. The group is currently in the process of performing a more detailed assessment of the impact of this standard on the group.
The standard is effective for annual periods beginning on or after 1 January 2018, with early adoption permitted under IFRS.
IFRS 9 Financial Instruments On 24 July 2014, the IASB issued the final IFRS 9 Financial Instruments Standard, which replaces earlier versions of IFRS 9 and completes the
IASB’s project to replace IAS 39 Financial Instruments: Recognition and Measurement.
This standard will have an impact on the group, which will include changes in the measurement bases of the group’s financial assets to amortised cost, fair value through other comprehensive income or fair value through profit or loss. Even though these measurement categories are similar to IAS 39, the criteria for classification into these categories are significantly different. In addition, the IFRS 9 impairment model has been changed from an “incurred loss” model from IAS 39 to an “expected credit loss” model, which could increase the provision for bad debts recognised in the group.
The standard is effective for annual periods beginning on or after 1 January 2018 with retrospective application, early adoption is permitted.
3. Significant accounting policies The principal accounting policies applied in the preparation of the group and company financial statements are set out below. These policies have
been consistently applied from the comparative year presented.
3.1 Statement of compliance The group and company financial statements are prepared in compliance with International Financial Reporting Standards (IFRS) and
SAICA Financial Reporting Guides as issued by the Accounting Practices Committee relevant to its operations and effective for annual reporting periods beginning on or after 1 January 2015.
3.2 Basis of preparation The group and company financial statements have been prepared under the historical cost convention, as modified by the revaluation of:
◆◆ investments in equity instruments classified as available-for-sale.
3.3 Investments in subsidiaries, joint ventures and associates by the company The company accounts for all investments in subsidiaries, jointly controlled entities and associates at cost.
Dividends received from subsidiaries, jointly controlled entities and associates are recognised in profit or loss when the company has the right to receive the dividend.

Notes to the group and company annual financial statements continuedfor the year ended 31 December 2015
ArcelorMittal South Africa Audited Annual Financial Statements 2015
Page 12
3. Significant accounting policies continued 3.4 Basis of consolidation – subsidiaries The group annual financial statements incorporate financial statements of the company and its subsidiaries.
Subsidiaries are all investees (including structured entities) over which the group has control. The group controls an investee when it is exposed to or has rights to variable returns from its involvement with the investee and has the ability to affect those returns through its power over the investee.
Subsidiaries are fully consolidated from the date on which control is transferred to the group. They are deconsolidated from the date that control ceases.
Inter-company transactions, balances and unrealised gains and losses on transactions between group companies are eliminated.
Accounting policies of subsidiaries have been changed where necessary to ensure consistency with the policies adopted by the group.
3.5 Interests in joint ventures A joint venture is a contractual arrangement whereby the parties that have joint control over the arrangement have rights to the net
assets of the joint arrangement. Joint control is the contractually agreed sharing of control of an arrangement which exists only when the decision about the relevant activities require the unanimous consent of the parties sharing control.
Joint venture arrangements that involve the establishment of a separate entity in which each venturer has an interest are referred to as jointly controlled entities.
The assets and liabilities of jointly controlled entities are incorporated in the group’s annual financial statements using the equity method of accounting, except when the investment is classified as held-for-sale, in which case it is accounted for in accordance with IFRS 5 Non-current Assets Held for Sale and Discontinued Operations.
Under the equity method, investments in joint ventures are carried in the consolidated statement of financial position at cost and adjusted for post-acquisition changes in the group’s share of the net assets of the joint venture, less any impairment in the value of individual investments.
The group’s share of its jointly controlled entities’ post-acquisition profits or losses and other comprehensive income is recognised in the statement of comprehensive income and its share of post-acquisition movements in reserves is recognised as reserves of the group. The cumulative post-acquisition movements are adjusted against the carrying amounts of the investment.
Losses of a jointly controlled entity in excess of the group’s interest in that entity (which includes any long-term interests that, in substance, form part of the group’s net investment in the jointly controlled entity) are recognised only to the extent that the group has incurred legal or constructive obligations or made payments on behalf of the jointly controlled entity.
Where a group entity transacts with a jointly controlled entity of the group, profits and losses are eliminated to the extent of the group’s interest in the relevant jointly controlled entity.
3.6 Investments in associates An associate is an entity over which the group has significant influence and that is neither a subsidiary nor an interest in a joint venture.
Significant influence is the power to participate in the financial and operating policy decisions of the investee, but is not control nor joint control over those policies.
The results and assets and liabilities of associates are incorporated in the annual financial statements using the equity method of accounting, except when the investment is classified as held-for-sale, in which case it is accounted for in accordance with IFRS 5 Non-current Assets Held for Sale and Discontinued Operations.
Under the equity method, investments in associates are carried in the consolidated statement of financial position at cost and adjusted for post-acquisition changes in the group’s share of the net assets of the associate, less any impairment in the value of individual investments.
The group’s share of its associates’ post-acquisition profits or losses is recognised in the statement of comprehensive income and its share of post-acquisition movements in reserves is recognised as reserves of the group. The cumulative post-acquisition movements are adjusted against the carrying amount of the investment.
ArcelorMittal South Africa Audited Annual Financial Statements 2015
Page 13
Notes to the group and company annual financial statements continuedfor the year ended 31 December 2015
3. Significant accounting policies continued 3.6 Investments in associates continued Losses of an associate in excess of the group’s interest in that associate (which includes any long-term interests that, in substance, form
part of the group’s net investment in the associate) are recognised only to the extent that the group has incurred legal or constructive obligations or made payments on behalf of the associate.
Where a group entity transacts with an associate of the group, profits and losses are eliminated to the extent of the group’s interest in the relevant associate.
3.7 Segment reporting Operating segments are reported in a manner consistent with the internal reporting provided to the chief operating decision-maker. The
chief operating decision-maker, who is responsible for allocating resources and assessing performance of the operating segments, has been identified as the executive committee of the group.
3.8 Foreign currency translation Functional and presentation currency Items included in the annual financial statements of each of the group’s entities are measured using the currency of the primary economic
environment in which the entity operates (its functional currency). The group’s financial statements are presented in South African rand, which is the company’s functional and presentation currency.
Transactions and balances Foreign currency transactions are translated into the functional currency using the exchange rates prevailing at the dates of the
transactions. Foreign exchange gains and losses resulting from the settlement of such transactions and from the translation at year-end exchange rates of monetary assets and liabilities denominated in foreign currencies are recognised as gains or losses in the statement of comprehensive income, except when deferred in equity as qualifying cash flow hedges.
For available-for-sale financial assets, changes in the fair value of such monetary securities denominated in foreign currency are analysed between translation differences resulting from changes in the amortised cost of the security, and other changes in the carrying amount of the security. Translation differences are recognised in the statement of comprehensive income. Changes in carrying amounts on non-monetary securities are recognised in equity.
Group companies The results and financial position of all the group entities that have a functional currency different from the presentation currency are
translated into the presentation currency of the group as follows:◆◆ Assets and liabilities for each reporting date presented are translated at the closing rate at the date of the statement of financial
position;◆◆ Income and expenses for each reporting period are translated at average exchange rates for the reporting period; and ◆◆ All resulting exchange differences are recognised as a separate component of equity, within the translation of foreign operations
reserve.
On consolidation, exchange differences arising from the translation of the net investment in foreign operations are recognised in the statement of comprehensive income and are taken to shareholders’ equity.
3.9 Property, plant and equipment Property, plant and equipment are recorded at cost less accumulated depreciation and impairment. Cost includes professional fees and,
for assets constructed by the group and company, any related works to the extent that these are directly attributable to the acquisition or construction of the asset. Property, plant and equipment, except land, are depreciated using the straight-line method over the useful lives of the related assets.
Major improvements, which are expected to generate future economic benefits over more than one reporting period, are capitalised, while repairs and maintenance are charged as an expense when incurred. Where a tangible fixed asset comprises major components having different useful lives, these components are accounted for as separate items.
Property, plant and equipment under construction are recorded as assets under construction until they are ready for their intended use; thereafter they are transferred to the related category of property, plant and equipment and depreciated over their estimated useful lives. Qualifying borrowing costs incurred during construction are capitalised. Gains and losses on retirement or disposal of assets are reflected in the statement of comprehensive income.
Notes to the group and company annual financial statements continuedfor the year ended 31 December 2015
ArcelorMittal South Africa Audited Annual Financial Statements 2015
Page 14
3. Significant accounting policies continued 3.10 Accounting for finance leases as lessee Finance lease arrangements consist of those transactions that are:
◆◆ leases in both economic substance and legal form; and ◆◆ those that arise out of commercial arrangements that in economic substance represent leases, though not in legal form.
The group and company lease certain property, plant and equipment. Leases of property, plant and equipment where the group and company have substantially all the risks and rewards of ownership are classified as finance leases. Finance leases are capitalised at the lower of the fair value of the leased property, plant and equipment and the present value of the future minimum lease payments of the lease.
Each lease payment is allocated between the liability and finance charges so as to achieve a constant rate on the capital balance outstanding, using the effective interest rate method. The corresponding rental obligations, net of finance charges, are shown as finance lease obligations. The interest element of the finance cost is charged to the statement of comprehensive income over the lease period. The property, plant and equipment acquired under finance leases are depreciated over the shorter of the useful life of the asset and the lease term.
Finance lease obligations with settlement tenures greater than 12 months after the statement of financial position date, are classified as non-current finance lease obligations, whilst those to be settled within 12 months of the statement of financial position date are classified as current finance lease obligations.
3.11 Intangible assets Internally generated intangible assets - research and development Research expenditure is recognised as an expense when incurred. Costs incurred on development projects (relating to the design and
testing of new or improved products) are recognised as intangible assets when the criteria of IAS 38, Intangible Assets are met.
Other development expenditures that do not meet these criteria are recognised as an expense when incurred.
Development assets are tested for impairment annually, in accordance with IAS 36, Impairment of Assets.
Purchased intangible assets other than goodwill “Right-of-use” operating licences The cost of acquisition of operating licences, other than those obtained from the government authorities, are capitalised at their historical
cost as intangible assets, and amortised over the right-of-use period. This period is reviewed at least annually.
Non-integrated computer software Acquired computer software licences are capitalised on the basis of the costs incurred to acquire and bring into use the specific software.
These costs are amortised over their estimated useful lives.
Computer software development costs recognised as assets are amortised over their estimated useful lives, typically not exceeding seven years.
3.12 Impairment of tangible and intangible assets excluding goodwill At each statement of financial position date, the group and company review the carrying amounts of tangible and intangible assets
to determine whether there is any indication that those assets have suffered an impairment loss. If any such indication exists, the recoverable amount of the asset is estimated in order to determine the extent of the impairment loss (if any). In order to ensure completeness of the impairment assessment of individual assets, all tangible assets and intangible assets are allocated to the cash-generating unit to which they belong. An impairment assessment is then undertaken on the individual cash-generating units.
“Recoverable amount” is defined as the higher of fair value less costs-to-sell and value-in-use. In assessing value-in-use, the estimated future cash flows are discounted to their present value using a post-tax discount rate that reflects the weighted average cost of capital (Wacc) of the company.
Where an impairment loss subsequently reverses, the carrying amount of the asset (cash-generating unit) is increased to the revised estimate of its recoverable amount, but so that the increased carrying amount does not exceed the carrying amount that would have been determined had no impairment loss been recognised for the asset (cash-generating unit) in prior years. A reversal of an impairment loss is recognised immediately in the statement of comprehensive income.

ArcelorMittal South Africa Audited Annual Financial Statements 2015
Page 15
Notes to the group and company annual financial statements continuedfor the year ended 31 December 2015
3. Significant accounting policies continued 3.13 Financial assets Financial assets are recognised and derecognised on the trade date where the purchase or sale of the asset is under a contract whose
terms require delivery within the timeframe established by the market concerned. These assets are initially measured at fair value, net of transaction costs except for those financial assets classified as fair value through profit or loss (FVTPL), which are initially measured at fair value.
Financial assets are classified into the following specified categories: ◆◆ Financial assets at fair value through profit or loss (FVTPL);◆◆ Available-for-sale (AFS) financial assets; and ◆◆ Loans and receivables.
Financial assets at FVTPL Financial assets at FVTPL are stated at fair value, with any resultant gain or loss recognised in the statement of comprehensive income.
AFS financial assets Listed shares and similar securities held by the group and company that are traded in an active market are classified as being AFS and are
stated at fair value.
Loans and receivables Trade receivables, loans and other receivables that have fixed or determinable payments that are not quoted in an active market are
classified as loans and receivables.
Loans and receivables are measured at amortised cost using the effective interest method less any impairment.
Impairment of financial assets A financial asset is considered to be impaired if there is objective evidence that one or more events have had a negative effect on the
estimated future cash flows of that asset.
Estimated future cash flows are determined using various assumptions and techniques, including comparisons with published prices in an active market, comparative price-earnings multiples and discounted cash flow projections using projected growth rates, weighted average cost of capital and inflation rates.
In the case of available-for-sale listed equity instruments, a significant or prolonged decline in the fair value of the security below its cost is considered an indicator that the securities are impaired. If any such evidence exists for these financial assets, the cumulative loss measured as the difference between the acquisition cost and the current fair value less any impairment loss on that financial asset previously recognised in the statement of comprehensive income, is removed from equity and recognised in the statement of comprehensive income.
If objective evidence indicates that cost-method investments need to be tested for impairment, calculations are based on information derived from business plans and other information available for estimating their value-in-use. Any impairment loss is charged to the statement of comprehensive income.
An impairment loss related to financial assets is reversed if and to the extent that there has been a change in the estimates used to determine the recoverable amount. The loss is reversed only to the extent that the asset’s carrying amount does not exceed the carrying amount that would have been determined if no impairment loss had been recognised. Reversals of impairment are recognised in the statement of comprehensive income except for reversals of impairment of available-for-sale equity securities, which are recognised in equity.
3.14 Financial liabilities and equity instruments issued by the group and company Classification as debt or equity Debt and equity instruments are classified as either financial liabilities or as equity in accordance with the substance of the contractual
arrangement.
Equity instruments An equity instrument is any contract that evidences a residual interest in the assets of an entity after deducting all of its liabilities. Equity
instruments are recorded at the proceeds received, net of direct issue costs.
Notes to the group and company annual financial statements continuedfor the year ended 31 December 2015
ArcelorMittal South Africa Audited Annual Financial Statements 2015
Page 16
3. Significant accounting policies continued 3.14 Financial liabilities and equity instruments issued by the group and company continued Financial liabilities Financial liabilities are classified as either financial liabilities at FVTPL or other financial liabilities.
Financial liabilities at FVTPL are stated at fair value, with any resultant gain or loss recognised in profit or loss. The net gain or loss recognised in profit or loss incorporates any interest paid on the financial liability.
Other financial liabilities Other financial liabilities, including borrowings and finance lease obligations, are initially measured at fair value, net of transaction costs.
Subsequently these are measured at amortised cost using the effective interest method, with interest expense recognised on an effective yield basis.
3.15 Derivative financial instruments Derivatives are initially recognised at fair value at the date a derivative contract is entered into and are subsequently remeasured to their
fair value at each statement of financial position date. The resulting gain or loss is recognised in profit or loss immediately unless the derivative is designated and effective as a hedging instrument, in which event the timing of the recognition in profit or loss depends on the nature of the hedge relationship.
The group and company designate certain derivatives as either hedges of the fair value of recognised assets, liabilities or firm commitments (fair value hedges), or hedges of highly probable forecast transactions or hedges of foreign currency risk of firm commitments (cash flow hedges). Hedges are accounted for as prescribed in IAS 39 Financial Instruments: Recognition and Measurement.
3.16 Inventories Inventories are carried at the lower of cost and net realisable value. Cost is determined using the first-in, first-out (FIFO) method or
weighted average cost method. Work-in-progress and finished goods include the purchase costs of raw materials and conversion costs such as direct labour and an allocation of fixed and variable production overheads. Raw materials, qualifying spare parts and consumables are valued at cost inclusive of freight, shipping and handling costs.
Net realisable value represents the estimated selling price at which the inventories can be realised in the normal course of business after allowing for the cost of conversion from their existing state to a finished condition and for the cost of marketing, selling and distribution.
Costs incurred when production levels are abnormally low are partially capitalised as inventories and partially recorded as a component of cost of sales in the statement of comprehensive income.
3.17 Cash and cash equivalents Cash and cash equivalents includes cash on hand, deposits held on call with banks, and other short-term highly liquid investments with
original maturities of three months or less, which are subject to an insignificant risk of changes in value, less any bank overdrafts.
3.18 Stated capital Equity instruments issued by the company and group are classified according to the substance of the contractual arrangements entered
into and the definition of an equity instrument. An equity instrument is any contract that evidences a residual interest in the assets of the company and group after deducting all liabilities.
Ordinary shares are classified as equity.
Incremental costs directly attributable to the issue of new shares or options are shown in equity as a deduction, net of tax effects, from the proceeds.
Where any group company purchases the company’s equity share capital (treasury shares), the consideration paid, including any directly attributable incremental costs (net of income taxes), is recognised in an equity reserve attributable to the company’s equity holders until the shares are cancelled or reissued. Where such shares are subsequently reissued, any consideration received (net of any directly attributable incremental transaction costs and the related income tax effects) is included in equity attributable to the company’s equity holders.
Capital distributions to shareholders through capital reduction programmes are debited against stated capital.
Income tax consequences of such and similar transactions are charged to profit or loss and not stated capital.

ArcelorMittal South Africa Audited Annual Financial Statements 2015
Page 17
Notes to the group and company annual financial statements continuedfor the year ended 31 December 2015
3. Significant accounting policies continued 3.19 Borrowings Borrowings are recognised initially at cost, which typically reflects the fair value of the funding transaction. Borrowings are subsequently
measured at amortised cost.
Borrowings are classified as current liabilities unless the group and company have an unconditional right to defer settlement of the liability for at least 12 months after the statement of financial position date.
3.20 Deferred income tax Deferred income tax is provided for in full, using the liability method, on temporary differences arising between the tax bases of assets
and liabilities and their carrying amounts in the group and company annual financial statements. Deductible temporary differences are therefore recognised to the extent that taxable temporary differences exist or it is probable that taxable economic benefits will flow to the entity.
Deferred income tax assets are recognised to the extent that it is probable that future taxable profit will be available against which the temporary differences can be utilised.
3.21 Employee benefits Short-term employee benefits Services rendered by employees during a reporting period, are recognised as the undiscounted amount of short-term employee benefits
expected to be paid in exchange for that service as a liability, after deducting any amount already paid; and as an expense, unless included in the cost of inventory or property, plant and equipment. The cost of all short-term employee benefits, such as salaries, bonuses, housing allowances, medical and other contributions is recognised during the period in which the employee renders the related service.
Short-term compensated absences (leave pay benefits) The expected cost of short-term employee benefits in the form of compensated absences are recognised (i) in the case of accumulating
compensated absences, when the employees render services that increases their entitlement to future compensated absences; and (ii) in the case of non-accumulating compensated absences, when the absences occur. The leave pay benefits of the group and company are cumulative in nature and entail automatic encashment of the benefits once the entitlements reach an accumulation limit.
Retirement benefits Defined contribution plans are plans where fixed contributions to pension funds for certain categories of employees are paid.
Contributions are paid in return for services rendered by the employees during the period. Such payments are expensed as they are incurred in line with the treatment of short-term employee benefits. No provisions are established in respect of defined contribution plans, as they do not generate future commitments.
Defined benefit plans are those plans that provide guaranteed benefits to certain categories of employees, by way of contractual obligations. The group's net obligation in respect of defined benefit plans is calculated separately for each plan by estimating the amount of future benefit that employees have earned in the current and prior periods, discounting that amount and deducting the fair value of any plan assets.
The calculation of significant defined benefit obligations is performed annually by a qualified actuary using the projected unit credit method. When the calculation results in a potential asset for the group, the recognised asset is limited to the present value of economic benefits available in the form of any future refunds from the plan or reductions in future contributions to the plan. To calculate the present value of economic benefits, consideration is given to any applicable minimum funding requirements.
Remeasurements of the net defined benefit liability, which comprise actuarial gains and losses, the return on plan assets (excluding interest) and the effect of the asset ceiling are recognised immediately in other comprehensive income. The group determines the net interest expense (income) on the net defined benefit liability (asset) for the period by applying the discount rate used to measure the defined benefit obligation at the beginning of the annual period to the net defined benefit liability (asset) during the period as a result of contributions and benefit payments. Net interest expense and other expenses related to defined benefit plans are recognised in other comprehensive income.
When the benefits of a plan are changed or when a plan is curtailed, the resulting change in benefit that relates to past service or the gain or loss on curtailment is recognised immediately in other comprehensive income. The group recognises gains and losses on the settlement of a defined benefit plan when the settlement occurs.

Notes to the group and company annual financial statements continuedfor the year ended 31 December 2015
ArcelorMittal South Africa Audited Annual Financial Statements 2015
Page 18
3. Significant accounting policies continued 3.21 Employee benefits continued Medical benefits No contributions are made to the medical aid of retired employees, except for a closed group of early retirees in respect of whom
contributions are made. The present value of the post-retirement medical aid obligation for such early retirements is actuarially determined annually on the projected unit credit method and any deficit or surplus is immediately recognised in profit or loss.
Termination benefits Termination benefits are payable whenever an employee’s employment is terminated before the normal retirement date or whenever an
employee accepts voluntary redundancy in exchange for these benefits.
The group and company recognise termination benefits when demonstrably committed to either: ◆◆ terminate the employment of current employees according to a detailed formal plan without possibility of withdrawal; or◆◆ provide termination benefits as a result of an accepted offer made to encourage voluntary redundancy in exchange for these benefits.
3.22 Provisions and contingent liabilities Provisions Provisions for asset retirement obligations, environmental remediation obligations, onerous contracts, restructuring costs, legal claims and
similar obligations are recognised when:◆◆ a present legal or constructive obligation exists as a result of past events; ◆◆ it is probable that an outflow of resources will be required to settle the obligation; and ◆◆ the amount has been reliably estimated.
Provisions are measured at the present value of the expenditures expected to be required to settle the obligation using a pre-tax discount rate that reflects current market assessments of the time value of money and the risks specific to the obligation.
The increase in provisions due to the passage of time is recognised as accretion expenses within finance charges. Changes in the discount rate are recognised as finance charges, except for asset retirement obligations which are capitalised to property, plant and equipment.
Contingent liabilities Legal claims are assessed to determine whether a present obligation exists and whether the obligations are measurable.
A present obligation, classified as a provision, is recognised as probable and is measured at the estimated loss of the outcome if it is more than 50% likely to occur.
For claims that are reasonably possible, being between 20% and 50% likely, the facts and circumstances of the possible loss and an estimate of the amount, if determinable, are disclosed.
Remote claims, being less than 20% likely, are not disclosed or provided for; however, voluntary disclosure may be made if the matter is significant.
3.23 Revenue recognition Sale of goods Revenue comprises the fair value of the consideration received or receivable for the sale of goods in the ordinary course of the group and
company’s activities. Revenue is shown net of value added tax, returns, rebates, discounts and in the case of the group accounts, after eliminating sales within the group.
All amounts invoiced to a customer in a sale transaction related to distribution and handling costs are classified as revenue, with the costs related thereto shown as distribution and handling costs within other operating expenses.
The group and company recognise revenue when the amount of revenue can be reliably measured, when it is probable that future economic benefits will flow to the entity and when specific criteria have been met for each of the group and company’s activities as described below.
The amount of revenue is not considered to be reliably measurable until all contingencies relating to the sale have been resolved. The group and company base such estimates on historical results, taking into consideration the type of customer, the type of transaction and the specifics of each arrangement.
Sales of goods are recognised based on the relevant delivery terms at which point the risks of obsolescence and loss have been transferred to the customer and either the customer has accepted the products in accordance with the sales contract or the group and company have objective evidence that all criteria for acceptance have been satisfied.
ArcelorMittal South Africa Audited Annual Financial Statements 2015
Page 19
Notes to the group and company annual financial statements continuedfor the year ended 31 December 2015
3. Significant accounting policies continued 3.24 Operating leases Operating lease payments are recognised as an expense on a straight-line basis over the lease term, except where another systematic
basis is more representative of the time pattern in which economic benefits from the leased asset are consumed. Contingent rentals arising under operating leases are recognised as an expense in the period in which they are incurred and are not straight-lined.
3.25 Borrowing costs Qualifying borrowing costs calculated in accordance with the effective interest rate method and directly attributable to the acquisition,
construction or production of qualifying assets, for those assets that necessarily take a substantial period of time to get ready for their intended use or sale, are added to the cost of those assets, until such time as the assets are substantially ready for their intended use or sale.
All other borrowing costs are recognised in the statement of comprehensive income in the period incurred.
3.26 Share-based payments Equity-settled share-based payments Equity-settled share-based payments to employees and others providing similar services are measured at the fair value of the equity
instruments at the grant date.
Fair value determination of equity-settled share-based transactions is measured using the share price as reference point.
The fair value determined at the grant date of the equity-settled share-based payments is expensed on a straight-line basis over the vesting period, based on the group’s and company’s estimate of the number of equity instruments that will eventually vest. At each statement of financial position date, the group and company revise their estimate of the number of equity instruments expected to vest. The impact of the revision of the original estimates, if any, is recognised in profit or loss over the remaining vesting period, with a corresponding adjustment to the equity-settled employee benefits reserve.
Cash-settled share-based payments For cash-settled share-based payments, a liability equal to the portion of goods or services received is recognised as the current fair
value at each date of the statement of financial position.
Vesting conditions Vesting conditions are service conditions and performance conditions only. Other features of a share-based payment are not vesting
conditions. Features of a share-based payment that are not vesting conditions are included in the grant date fair value of the share-based payment. The fair value also includes market-related vesting conditions.
3.27 Taxation Income tax expense represents the sum of the current tax and deferred tax. Normal tax The current tax is based on taxable income or loss for the year. Taxable income or loss differs from income or loss as reported in the
statement of comprehensive income because it excludes items of income or expense that are taxable or deductible in other years and it further excludes items that are never taxable or deductible (deferred tax). The liability for current tax is calculated using tax rates that have been enacted or substantively enacted by the date of the statement of financial position.
Withholding tax on dividends Dividends received subject to withholding tax are shown inclusive of any withholding tax. The withholding tax amount is included in the
tax charge for the reporting period.
3.28 Dividend distribution Dividend distribution to the company’s shareholders is recognised as a liability in the period in which the dividends are approved by the
company’s board of directors.
3.29 Offset Where a legally enforceable right to offset exists for recognised financial assets and financial liabilities, and there is an intention to settle
the liability and realise the asset simultaneously or to settle on a net basis, all related financial effects are offset.

Notes to the group and company annual financial statements continuedfor the year ended 31 December 2015
ArcelorMittal South Africa Audited Annual Financial Statements 2015
Page 20
4. Segment report Segment information is presented only at group level, where it is most meaningful. Operating segments are identified on the basis of internal
reports about components of the group that are regularly reviewed by the chief operating decision-maker (the executive committee) in order to allocate resources to the segment and to assess its performance.
The group’s reportable segments are as follows:◆◆ Flat steel products consisting of the Vanderbijlpark Works, Saldanha Works and ArcelorMittal South Africa Distribution.◆◆ Long steel products consisting of the Newcastle Works, Vereeniging Works and the decommissioned Maputo Works.◆◆ Coke and Chemicals undertaking the processing and marketing of by-products and the production and marketing of commercial-grade
coking coal.◆◆ Corporate and Other, consisting of sales and marketing functions, procurement and logistics activities, shared services, centres of excellence,
the decommissioned Pretoria Works site, available-for-sale investments and the results of the non-trading consolidated subsidiaries and consolidated structured entities.
Segment profit/(loss) from operations represents the profit/(loss) earned/(incurred) by each segment without the allocation of after-tax profits of equity-accounted investments, net interest income, income from investments and income tax expenses.
All assets and liabilities are allocated to the operating segments, other than for the following items that are exclusively allocated to the Corporate and Other segment, reflecting the manner in which resource allocation is measured:
Assets not allocated to operating segments:◆◆ Results of consolidated subsidiaries and consolidated structured entities, other than for Saldanha Works which is a subsidiary allocated to the
Flat steel products segment; ◆◆ Investments in equity-accounted entities; ◆◆ Available-for-sale investments; ◆◆ Cash and cash equivalents; and ◆◆ Income tax, capital gains tax and value added tax related assets, as applicable.
Liabilities not allocated to operating segments are income tax, capital gains tax and value-added tax-related liabilities, as applicable.

ArcelorMittal South Africa Audited Annual Financial Statements 2015
Page 21
Notes to the group and company annual financial statements continuedfor the year ended 31 December 2015
4. Segment report continuedFor the year ended 2015
Flat Steel Products
Rm
Long SteelProducts
Rm
Coke andChemicals
Rm
Corporate and Other
Rm
Adjustments and
eliminations Rm
Total reconciling
to theconsolidated
amountsRm
Revenue– External customers 19 483 9 949 1 709 – – 31 141 – Intersegment customers 424 923 90 – (1 437) –
Total revenue 19 907 10 872 1 799 – (1 437) 31 141
Revenue to external customers distributed as:Local 14 797 7 763 1 709 – – 24 269 Export 4 686 2 186 – – – 6 872 – Africa 4 386 1 503 – – – 5 889 – Asia 247 390 – – – 637 – Other 53 293 – – – 346
Total 19 483 9 949 1 709 – – 31 141
ResultsEarnings before interest, tax, depreciation and amortisation (1 269) (348) 427 (1 131) 1 512 (809)Depreciation and amortisation (973) (391) (35) (20) 50 (1 369)Thabazimbi mine closure costs (429) (253) – – – (682)Provision for Tshikondeni mine closure costs – – – 23 – 23 Vereeniging closure costs – (86) – – – (86)Competition Commission settlement – – – (1 245) – (1 245)Payment in advance (420) (148) – – – (568)
(Loss)/profit from operations (3 091) (1 226) 392 (2 373) 1 562 (4 736)Impairment (3 574) (370) – (2 570) 2 260 (4 254)Finance and investment income 2 1 – 172 – 175 Finance costs (117) (38) (2) (1 051) – (1 208)Profit after tax from equity-accounted investments – – – 195 – 195
(Loss)/profit before taxation (6 780) (1 633) 390 (5 627) 3 822 (9 828)Income taxation credit – – – 1 193 – 1 193
(Loss)/profit for the year (6 780) (1 633) 390 (4 434) 3 822 (8 635)
Segment assets (excluding investments in equity-accounted investments) 14 414 8 236 960 3 262 (1 000) 25 872 Investments in equity-accounted entities – – – 5 090 – 5 090 Segment liabilities 4 877 2 647 186 9 782 (2) 17 490Cash (utilised in)/generated from operations (1 270) 140 554 312 – (264)Capital expenditure 601 625 57 (27) – 1 256 Number of employees at the end of the year 5 570 3 104 254 598 – 9 526
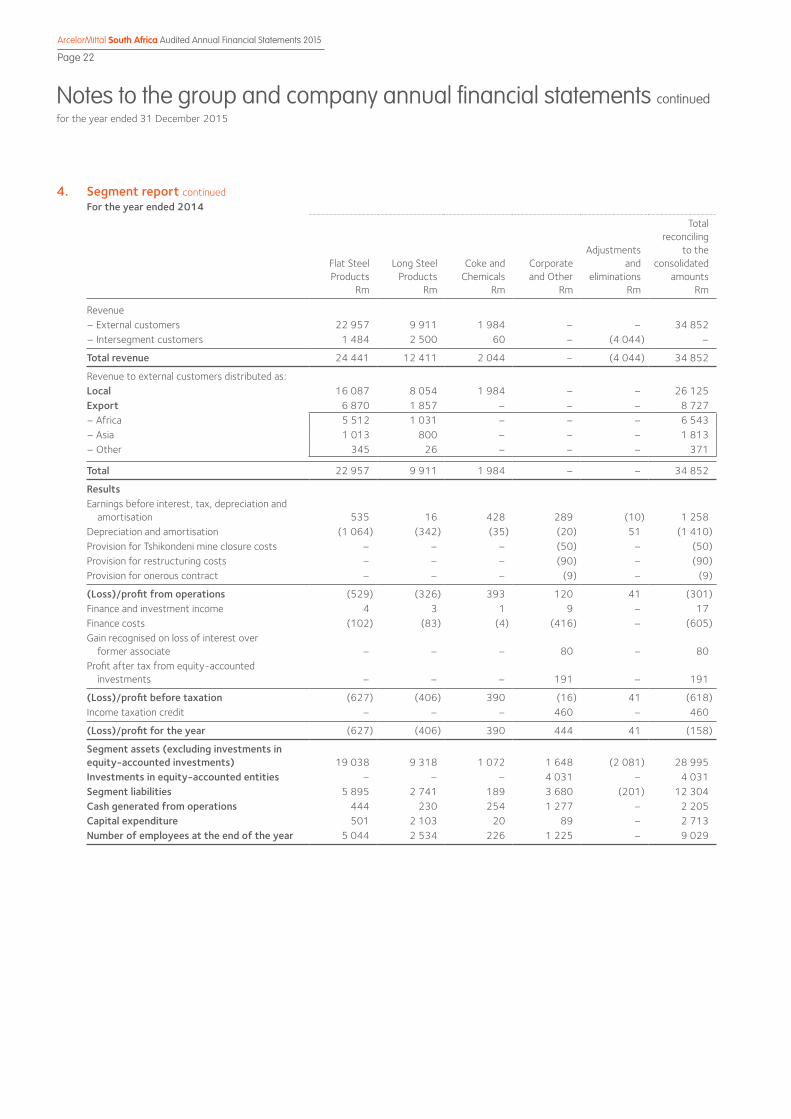
Notes to the group and company annual financial statements continuedfor the year ended 31 December 2015
ArcelorMittal South Africa Audited Annual Financial Statements 2015
Page 22
4. Segment report continuedFor the year ended 2014
Flat Steel Products
Rm
Long SteelProducts
Rm
Coke andChemicals
Rm
Corporate and Other
Rm
Adjustments and
eliminations Rm
Total reconciling
to theconsolidated
amountsRm
Revenue– External customers 22 957 9 911 1 984 – – 34 852 – Intersegment customers 1 484 2 500 60 – (4 044) –
Total revenue 24 441 12 411 2 044 – (4 044) 34 852
Revenue to external customers distributed as:Local 16 087 8 054 1 984 – – 26 125 Export 6 870 1 857 – – – 8 727 – Africa 5 512 1 031 – – – 6 543 – Asia 1 013 800 – – – 1 813 – Other 345 26 – – – 371
Total 22 957 9 911 1 984 – – 34 852
ResultsEarnings before interest, tax, depreciation and amortisation 535 16 428 289 (10) 1 258 Depreciation and amortisation (1 064) (342) (35) (20) 51 (1 410)Provision for Tshikondeni mine closure costs – – – (50) – (50)Provision for restructuring costs – – – (90) – (90)Provision for onerous contract – – – (9) – (9)
(Loss)/profit from operations (529) (326) 393 120 41 (301)Finance and investment income 4 3 1 9 – 17 Finance costs (102) (83) (4) (416) – (605)Gain recognised on loss of interest over former associate – – – 80 – 80 Profit after tax from equity-accounted investments – – – 191 – 191
(Loss)/profit before taxation (627) (406) 390 (16) 41 (618)Income taxation credit – – – 460 – 460
(Loss)/profit for the year (627) (406) 390 444 41 (158)
Segment assets (excluding investments in equity-accounted investments) 19 038 9 318 1 072 1 648 (2 081) 28 995 Investments in equity-accounted entities – – – 4 031 – 4 031 Segment liabilities 5 895 2 741 189 3 680 (201) 12 304 Cash generated from operations 444 230 254 1 277 – 2 205 Capital expenditure 501 2 103 20 89 – 2 713 Number of employees at the end of the year 5 044 2 534 226 1 225 – 9 029

ArcelorMittal South Africa Audited Annual Financial Statements 2015
Page 23
Notes to the group and company annual financial statements continuedfor the year ended 31 December 2015
4. Segment report continued
2015 Rm
2014Rm
4.1 Revenue from major products and servicesThe group’s revenue from its major products sold to external customers was as follows:Flat Steel Products 19 483 22 957 – Plate 985 1 101 – Hot-rolled coil 10 266 13 276 – Cold-rolled coil 1 475 1 835 – Galvanised sheet 3 618 3 114 – Coated sheet 1 132 1 149 – Tin plate 1 411 1 704 – Other 596 778
Long Steel Products 9 949 9 911 – Billets and blooms 282 42 – Bars and rebars 2 486 2 496 – Wire rod 3 024 2 926 – Sections 2 524 2 504 – Rails 62 35 – Seamless tubular products 503 1 004 – Forged 1 043 890 – Other 25 14
Coke and Chemicals 1 709 1 984 – Coke 1 129 1 211 – Tar 398 439 – Other 182 334
Total consolidated revenue 31 141 34 852
4.2 Geographical informationThe group operates principally in South Africa. Export sales are primarily sold into sub-Saharan Africa and Asia.
4.3 Information about major customersSegmentation of the group’s top three customers, as measured on total revenue, is as follows:Flat Steel products 8 737 7 151 Long Steel Products 3 021 2 881
Total revenue attributable to top three customers 11 758 10 032 Expressed as a % of total consolidated revenue (%) 38 29 Of these top three customers, one customer contributes more than 10% to total revenue 4 902 5 234 Expressed as a % of total consolidated revenue (%) 16 15
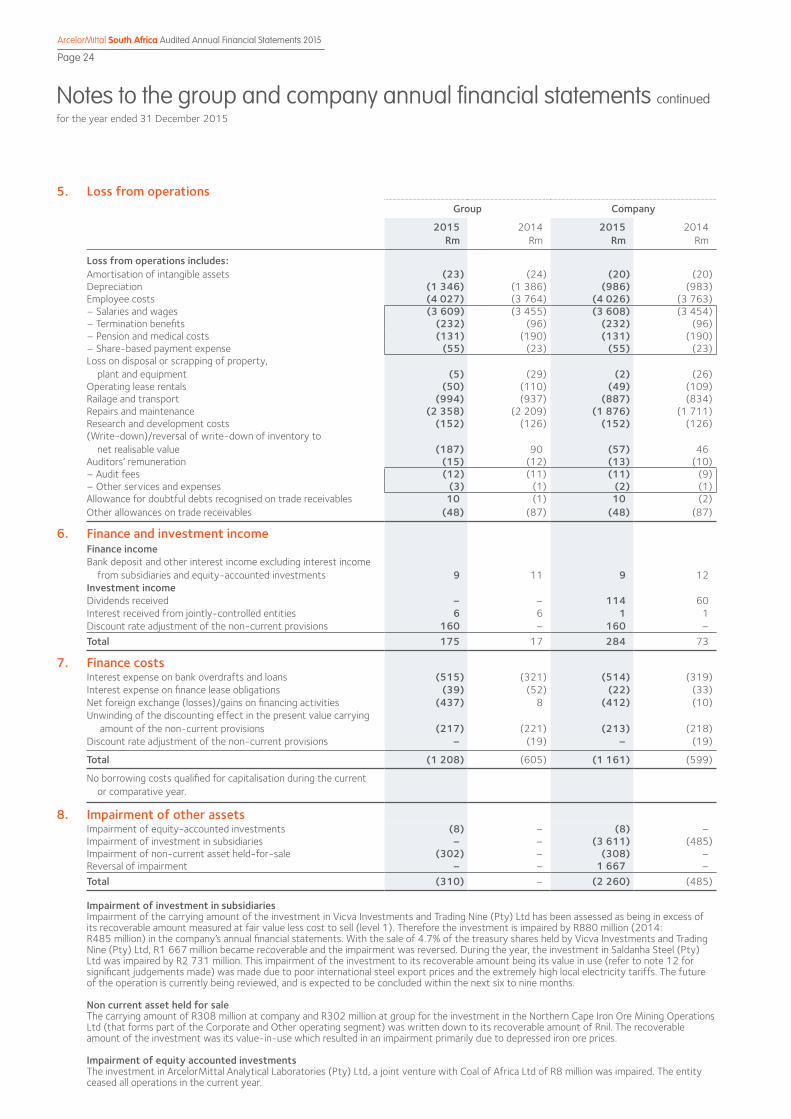
Notes to the group and company annual financial statements continuedfor the year ended 31 December 2015
ArcelorMittal South Africa Audited Annual Financial Statements 2015
Page 24
5. Loss from operationsGroup Company
2015Rm
2014Rm
2015Rm
2014Rm
Loss from operations includes:Amortisation of intangible assets (23) (24) (20) (20)Depreciation (1 346) (1 386) (986) (983)Employee costs (4 027) (3 764) (4 026) (3 763)– Salaries and wages (3 609) (3 455) (3 608) (3 454)– Termination benefits (232) (96) (232) (96)– Pension and medical costs (131) (190) (131) (190)– Share-based payment expense (55) (23) (55) (23)Loss on disposal or scrapping of property, plant and equipment (5) (29) (2) (26)Operating lease rentals (50) (110) (49) (109)Railage and transport (994) (937) (887) (834)Repairs and maintenance (2 358) (2 209) (1 876) (1 711)Research and development costs (152) (126) (152) (126)(Write-down)/reversal of write-down of inventory to net realisable value (187) 90 (57) 46 Auditors’ remuneration (15) (12) (13) (10)– Audit fees (12) (11) (11) (9)– Other services and expenses (3) (1) (2) (1)Allowance for doubtful debts recognised on trade receivables 10 (1) 10 (2)Other allowances on trade receivables (48) (87) (48) (87)
6. Finance and investment incomeFinance incomeBank deposit and other interest income excluding interest income from subsidiaries and equity-accounted investments 9 11 9 12 Investment incomeDividends received – – 114 60 Interest received from jointly-controlled entities 6 6 1 1 Discount rate adjustment of the non-current provisions 160 – 160 –Total 175 17 284 73
7. Finance costsInterest expense on bank overdrafts and loans (515) (321) (514) (319)Interest expense on finance lease obligations (39) (52) (22) (33)Net foreign exchange (losses)/gains on financing activities (437) 8 (412) (10)Unwinding of the discounting effect in the present value carrying amount of the non-current provisions (217) (221) (213) (218)Discount rate adjustment of the non-current provisions – (19) – (19)
Total (1 208) (605) (1 161) (599)
No borrowing costs qualified for capitalisation during the current or comparative year.
8. Impairment of other assetsImpairment of equity-accounted investments (8) – (8) –Impairment of investment in subsidiaries – – (3 611) (485)Impairment of non-current asset held-for-sale (302) – (308) –Reversal of impairment – – 1 667 –Total (310) – (2 260) (485)
Impairment of investment in subsidiariesImpairment of the carrying amount of the investment in Vicva Investments and Trading Nine (Pty) Ltd has been assessed as being in excess of its recoverable amount measured at fair value less cost to sell (level 1). Therefore the investment is impaired by R880 million (2014: R485 million) in the company’s annual financial statements. With the sale of 4.7% of the treasury shares held by Vicva Investments and Trading Nine (Pty) Ltd, R1 667 million became recoverable and the impairment was reversed. During the year, the investment in Saldanha Steel (Pty) Ltd was impaired by R2 731 million. This impairment of the investment to its recoverable amount being its value in use (refer to note 12 for significant judgements made) was made due to poor international steel export prices and the extremely high local electricity tariffs. The future of the operation is currently being reviewed, and is expected to be concluded within the next six to nine months.
Non current asset held for saleThe carrying amount of R308 million at company and R302 million at group for the investment in the Northern Cape Iron Ore Mining Operations Ltd (that forms part of the Corporate and Other operating segment) was written down to its recoverable amount of Rnil. The recoverable amount of the investment was its value-in-use which resulted in an impairment primarily due to depressed iron ore prices.
Impairment of equity accounted investmentsThe investment in ArcelorMittal Analytical Laboratories (Pty) Ltd, a joint venture with Coal of Africa Ltd of R8 million was impaired. The entity ceased all operations in the current year.
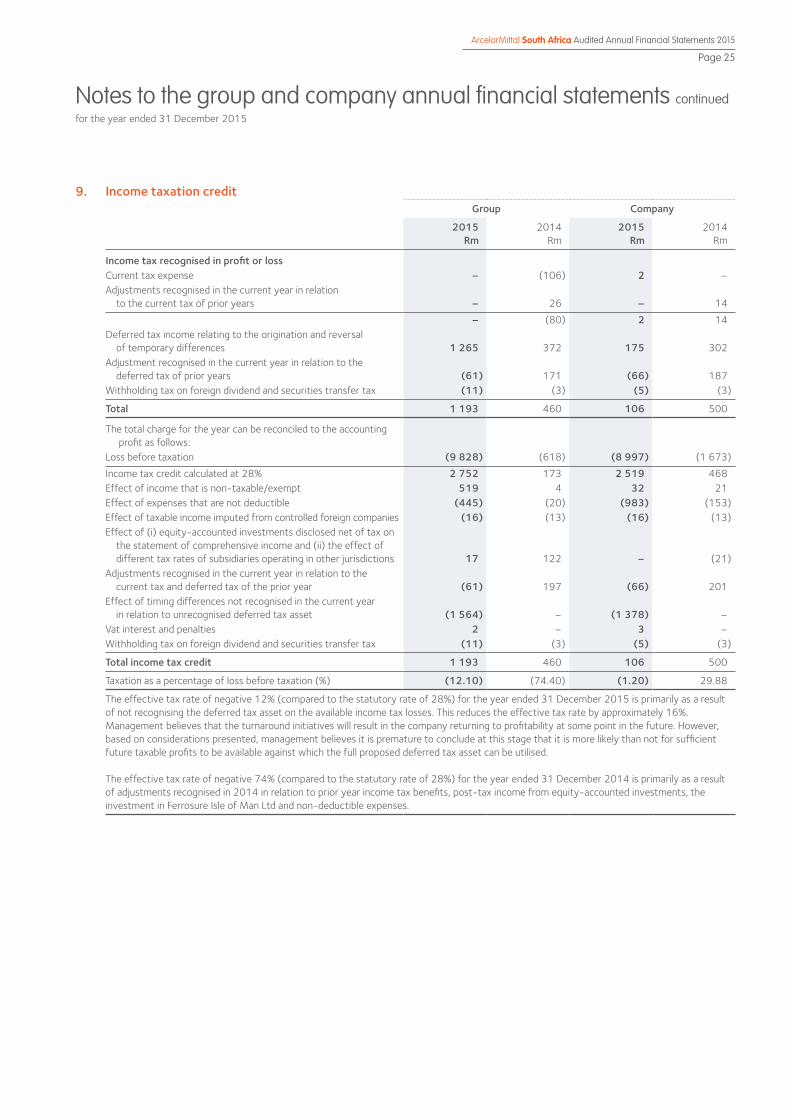
ArcelorMittal South Africa Audited Annual Financial Statements 2015
Page 25
Notes to the group and company annual financial statements continuedfor the year ended 31 December 2015
9. Income taxation creditGroup Company
2015Rm
2014Rm
2015Rm
2014Rm
Income tax recognised in profit or lossCurrent tax expense – (106) 2 –Adjustments recognised in the current year in relation to the current tax of prior years – 26 – 14
– (80) 2 14 Deferred tax income relating to the origination and reversal of temporary differences 1 265 372 175 302 Adjustment recognised in the current year in relation to the deferred tax of prior years (61) 171 (66) 187 Withholding tax on foreign dividend and securities transfer tax (11) (3) (5) (3)
Total 1 193 460 106 500
The total charge for the year can be reconciled to the accounting profit as follows:Loss before taxation (9 828) (618) (8 997) (1 673)
Income tax credit calculated at 28% 2 752 173 2 519 468 Effect of income that is non-taxable/exempt 519 4 32 21 Effect of expenses that are not deductible (445) (20) (983) (153)Effect of taxable income imputed from controlled foreign companies (16) (13) (16) (13)Effect of (i) equity-accounted investments disclosed net of tax on the statement of comprehensive income and (ii) the effect of different tax rates of subsidiaries operating in other jurisdictions 17 122 – (21)Adjustments recognised in the current year in relation to the current tax and deferred tax of the prior year (61) 197 (66) 201 Effect of timing differences not recognised in the current year in relation to unrecognised deferred tax asset (1 564) – (1 378) –Vat interest and penalties 2 – 3 –Withholding tax on foreign dividend and securities transfer tax (11) (3) (5) (3)
Total income tax credit 1 193 460 106 500
Taxation as a percentage of loss before taxation (%) (12.10) (74.40) (1.20) 29.88
The effective tax rate of negative 12% (compared to the statutory rate of 28%) for the year ended 31 December 2015 is primarily as a result of not recognising the deferred tax asset on the available income tax losses. This reduces the effective tax rate by approximately 16%. Management believes that the turnaround initiatives will result in the company returning to profitability at some point in the future. However, based on considerations presented, management believes it is premature to conclude at this stage that it is more likely than not for sufficient future taxable profits to be available against which the full proposed deferred tax asset can be utilised.
The effective tax rate of negative 74% (compared to the statutory rate of 28%) for the year ended 31 December 2014 is primarily as a result of adjustments recognised in 2014 in relation to prior year income tax benefits, post-tax income from equity-accounted investments, the investment in Ferrosure Isle of Man Ltd and non-deductible expenses.
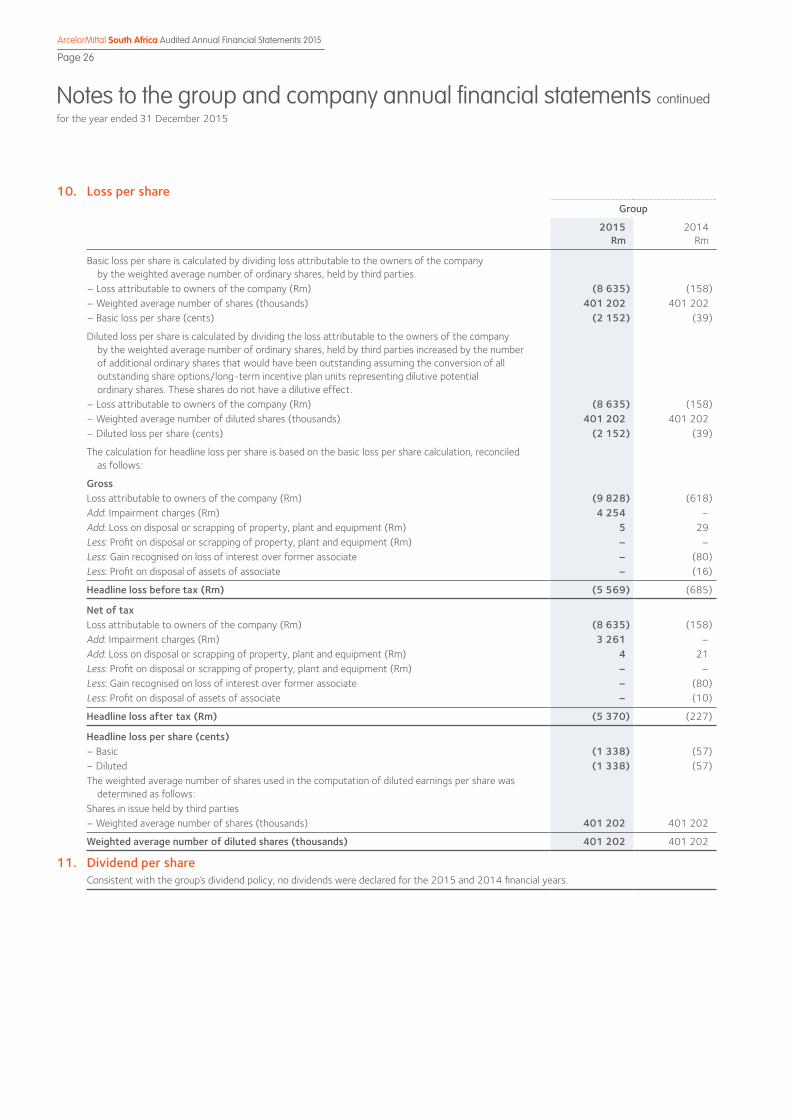
Notes to the group and company annual financial statements continuedfor the year ended 31 December 2015
ArcelorMittal South Africa Audited Annual Financial Statements 2015
Page 26
10. Loss per shareGroup
2015Rm
2014Rm
Basic loss per share is calculated by dividing loss attributable to the owners of the company by the weighted average number of ordinary shares, held by third parties. – Loss attributable to owners of the company (Rm) (8 635) (158)– Weighted average number of shares (thousands) 401 202 401 202 – Basic loss per share (cents) (2 152) (39)
Diluted loss per share is calculated by dividing the loss attributable to the owners of the company by the weighted average number of ordinary shares, held by third parties increased by the number of additional ordinary shares that would have been outstanding assuming the conversion of all outstanding share options/long-term incentive plan units representing dilutive potential ordinary shares. These shares do not have a dilutive effect.– Loss attributable to owners of the company (Rm) (8 635) (158)– Weighted average number of diluted shares (thousands) 401 202 401 202 – Diluted loss per share (cents) (2 152) (39)
The calculation for headline loss per share is based on the basic loss per share calculation, reconciled as follows:
GrossLoss attributable to owners of the company (Rm) (9 828) (618)Add: Impairment charges (Rm) 4 254 –Add: Loss on disposal or scrapping of property, plant and equipment (Rm) 5 29 Less: Profit on disposal or scrapping of property, plant and equipment (Rm) – –Less: Gain recognised on loss of interest over former associate – (80)Less: Profit on disposal of assets of associate – (16)
Headline loss before tax (Rm) (5 569) (685)
Net of taxLoss attributable to owners of the company (Rm) (8 635) (158)Add: Impairment charges (Rm) 3 261 –Add: Loss on disposal or scrapping of property, plant and equipment (Rm) 4 21 Less: Profit on disposal or scrapping of property, plant and equipment (Rm) – –Less: Gain recognised on loss of interest over former associate – (80)Less: Profit on disposal of assets of associate – (10)
Headline loss after tax (Rm) (5 370) (227)
Headline loss per share (cents)– Basic (1 338) (57)– Diluted (1 338) (57)The weighted average number of shares used in the computation of diluted earnings per share was determined as follows:Shares in issue held by third parties– Weighted average number of shares (thousands) 401 202 401 202
Weighted average number of diluted shares (thousands) 401 202 401 202
11. Dividend per shareConsistent with the group’s dividend policy, no dividends were declared for the 2015 and 2014 financial years.

ArcelorMittal South Africa Audited Annual Financial Statements 2015
Page 27
Notes to the group and company annual financial statements continuedfor the year ended 31 December 2015
12. Property, plant and equipment
Group
Land and buildings
Rm
Buildings and infra-structure
Rm
Machinery plant and
equipmentRm
Site preparation
Rm
Asset retirement obligation
Rm
Leased assets
Rm
Con-struction
in progress Rm
TotalRm
For the year ended 31 December 2015Carrying amount at the beginning of the year 75 937 14 033 22 2 245 687 16 001 Additions – 34 813 – – – 304 1 151 Disposals – – (12) – – – – (12)Depreciation – (76) (1 210) (2) (1) (57) – (1 346)Impairment (1) (177) (3 752) – – – (5) (3 935)Other movements – 20 166 – 7 – (193) –
Carrying amount at the end of the year 74 738 10 038 20 8 188 793 11 859
At 31 December 2015Cost 77 2 455 31 534 102 210 5 048 798 40 224 Accumulated depreciation and impairment (3) (1 717) (21 496) (82) (202) (4 860) (5) (28 365)
Net carrying amount 74 738 10 038 20 8 188 793 11 859
For the year ended 31 December 2014Carrying amount at beginning of year 75 960 11 912 24 2 418 1 311 14 702 Additions – 2 2 447 – – – 336 2 785 Disposals – – (32) – – – – (32)Depreciation – (60) (1 214) (2) (5) (105) – (1 386)Other movements – 35 920 – 5 (68) (960) (68)
Carrying amount at the end of the year 75 937 14 033 22 2 245 687 16 001
At 31 December 2014Cost 77 2 401 31 066 102 203 5 048 687 39 584 Accumulated depreciation and impairment (2) (1 464) (17 033) (80) (201) (4 803) – (23 583)
Net carrying amount 75 937 14 033 22 2 245 687 16 001

Notes to the group and company annual financial statements continuedfor the year ended 31 December 2015
ArcelorMittal South Africa Audited Annual Financial Statements 2015
Page 28
12. Property, plant and equipment continued
Company
Land and buildings
Rm
Buildings and infra-structure
Rm
Machinery plant and
equipmentRm
Site preparation
Rm
Asset retirement obligation
Rm
Leased assets
Rm
Con-struction
in progress Rm
TotalRm
For the year ended 31 December 2015Carrying amount at the beginning of the year 61 714 10 040 24 – 196 605 11 640 Additions – 34 753 – – – 209 996 Disposals – – (11) – – – – (11)Depreciation – (73) (861) (2) – (50) – (986)Impairment – (22) (343) – – – (5) (370)Other movements – 14 113 – – – (127) –
Carrying amount at the end of the year 61 667 9 691 22 – 146 682 11 269
At 31 December 2015Cost 61 2 021 21 235 102 198 4 838 687 29 142 Accumulated depreciation and impairment – (1 354) (11 544) (80) (198) (4 692) (5) (17 873)
Net carrying amount 61 667 9 691 22 – 146 682 11 269
For the year ended 31 December 2014Carrying amount at the beginning of the year 61 730 7 635 26 – 360 1 222 10 034 Additions – 2 2 402 – – – 285 2 689 Disposals – – (32) – – – – (32)Depreciation – (54) (827) (2) (4) (96) – (983)Impairment – – – – – – – –Other movements – 36 862 – 4 (68) (902) (68)
Carrying amount at the end of the year 61 714 10 040 24 – 196 605 11 640
At 31 December 2014Cost 61 1 985 20 924 102 198 4 838 605 28 713 Accumulated depreciation and impairment – (1 271) (10 884) (78) (198) (4 642) – (17 073)
Net carrying amount 61 714 10 040 24 – 196 605 11 640
Land register and asset pledgesA register of land is available for inspection at the registered office of the company.
The group and company have not pledged property, plant and equipment to secure banking facilities granted.
Critical judgements and estimatesUseful lives and residual values of property, plant and equipment and intangible assets
The estimates of depreciation and amortisation rates and the residual lives of the assets are reviewed annually taking cognisance of:◆◆ forecasted commercial and economic realities; and◆◆ benchmarking within the greater ArcelorMittal group.

ArcelorMittal South Africa Audited Annual Financial Statements 2015
Page 29
Notes to the group and company annual financial statements continuedfor the year ended 31 December 2015
12. Property, plant and equipment continued
In 2014 the useful lives of certain items of property, plant and equipment were reassessed and revised to reflect the current estimated life over which the group has the ability and intention to use such assets. The effect of these changes on the actual depreciation expense for the year ended 31 December 2015 is Rnil and for December 2014 a reduction of approximately R109 million.
Useful life rangeLand Not depreciatedBuildings 10 to 50 yearsSteel plant equipment 15 to 30 yearsOther facilities 15 to 30 yearsVehicles and general equipment 5 to 20 yearsNon-integrated software 1 to 50 yearsPatents 20 years
These useful lives represent management’s current best estimates.
Impairment of assetsImpairment losses relating to property plant and equipment included in profit and loss is R3 935 million (2014: Rnil) for group and R370 million for company. This relates to the impairment of the Saldanha cash generating unit of R3 574 million, allocated to property plant and equipment of R3 565 million and intangible assets of R9 million (refer to note 13). A further impairment of R370 million at group and company relate to the redundant assets from the Vaal Meltshop and certain areas of the Forge at Vereeniging Works being placed under care and maintenance.
An impairment indicator assessment was performed on all cash generating units of the group. Following this assessment, an impairment test was performed on all cash generating units. In accordance with IAS 36 Impairment of Assets, an asset is impaired if the carrying amount of the asset is greater than the recoverable amount of the asset. The recoverable amount of the unit was determined using a discounted cash flow model and an explicit forecast period for five years. These cash flows are US dollar based. Cash flows assume price protection and the carbon tax has not been taken into account when determining the recoverable amount. To determine the terminal value, the Gordon growth model was used, year five was taken into perpetuity while in 2014 a normalised steel cycle was used. The outcome of the impairment test was that the Saldanha cash generating unit was impaired by 84% and the Vanderbijlpark cash generating unit was sensitive to exchange rates.
The other major assumptions in arriving at the present value of future cash flows are as follows:
Saldanha VanderbijlparkMajor assumptions 2015 2014 2015 2014
Wacc/discount rate (% USD-based) 11 10 11 10Growth rate (%) 2 2 2 2Exchange rate range (ZAR/USD)* 13.50 – 18.44 11.58 – 13.37 13.50 – 18.44 11.58 – 13.37Iron ore prices – average (USD)/t* 42.50 – 48.10 60 – 68 42.50 – 48.10 60 – 68 Electricity increase (%) 12 8 12 8 Steel sales price range (average – USD/t)* 404 – 454 579 – 645 563 – 689 704 – 755Sales volume range (kt)* 548 – 1 080 1 066 – 1 322 2 320 – 2 455 2 390 – 2 535Capex accumulated (5 year forecast) USDm 167 173 439 425 *Average over the initial period of 2016 to 2020 (2014: 2015 to 2019).
SaldanhaSaldanha is impaired primarily due to the poor international steel export prices and the extremely high local electricity tariffs. Consequently the future of the operation is currently being reviewed.
2015
Vanderbijlpark – SensitivitiesCoverage*
%
Impact on coverage
%
Coverage on the base-basket pricing 219 n/a
Impact on coverage – % change from the base model
5% stronger exchange rate per annum from 2017 166 (53)
10% decrease in forecast sales volumes 162 (57)
5% reduction in basket pricing 146 (73)*Coverage represents the recoverable amount as a % over the carrying amount.
Vereeniging WorksDue to the Vaal Meltshop and certain areas of the Forge being placed under care and maintenance, property, plant and equipment to the value of R370 million was impaired to a recoverable amount of Rnil. These are mainly consumable stock that cannot be utilised any further.
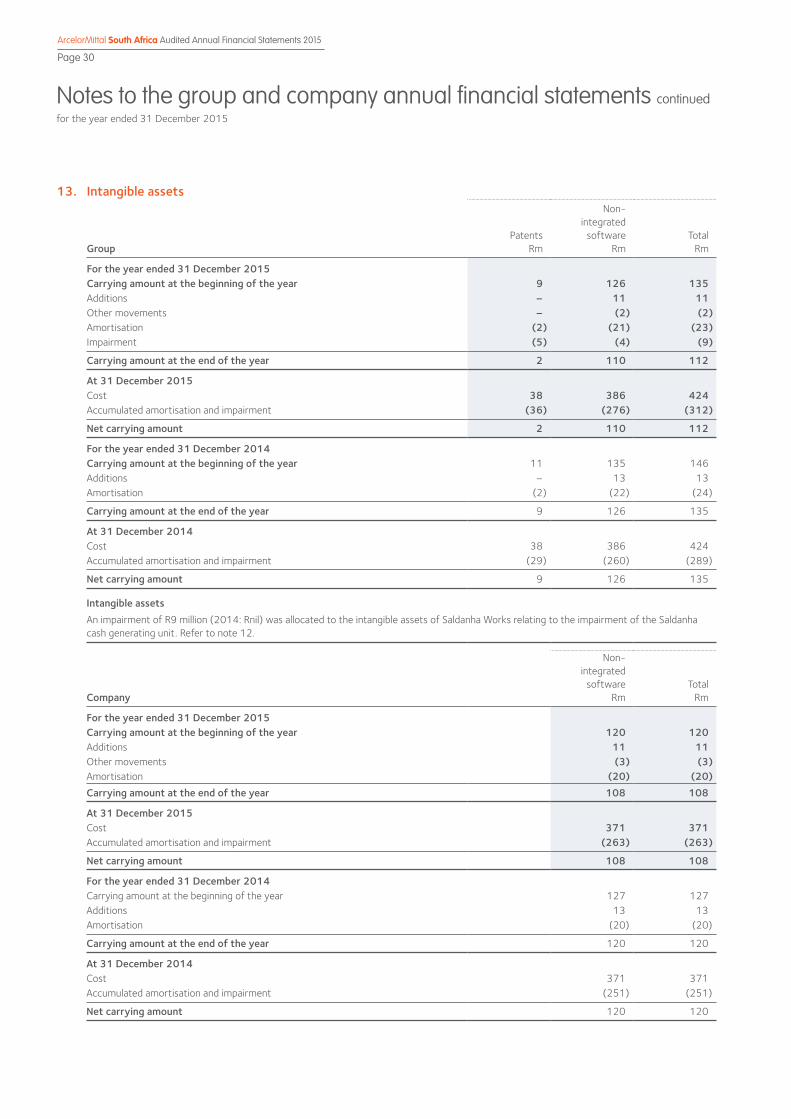
Notes to the group and company annual financial statements continuedfor the year ended 31 December 2015
ArcelorMittal South Africa Audited Annual Financial Statements 2015
Page 30
13. Intangible assets
GroupPatents
Rm
Non-integrated
softwareRm
TotalRm
For the year ended 31 December 2015Carrying amount at the beginning of the year 9 126 135 Additions – 11 11 Other movements – (2) (2)Amortisation (2) (21) (23)Impairment (5) (4) (9)
Carrying amount at the end of the year 2 110 112
At 31 December 2015Cost 38 386 424 Accumulated amortisation and impairment (36) (276) (312)
Net carrying amount 2 110 112
For the year ended 31 December 2014Carrying amount at the beginning of the year 11 135 146 Additions – 13 13 Amortisation (2) (22) (24)
Carrying amount at the end of the year 9 126 135
At 31 December 2014Cost 38 386 424 Accumulated amortisation and impairment (29) (260) (289)
Net carrying amount 9 126 135
Intangible assetsAn impairment of R9 million (2014: Rnil) was allocated to the intangible assets of Saldanha Works relating to the impairment of the Saldanha cash generating unit. Refer to note 12.
Company
Non-integrated
softwareRm
TotalRm
For the year ended 31 December 2015Carrying amount at the beginning of the year 120 120 Additions 11 11 Other movements (3) (3)Amortisation (20) (20)Carrying amount at the end of the year 108 108
At 31 December 2015Cost 371 371 Accumulated amortisation and impairment (263) (263)
Net carrying amount 108 108
For the year ended 31 December 2014Carrying amount at the beginning of the year 127 127 Additions 13 13 Amortisation (20) (20)
Carrying amount at the end of the year 120 120
At 31 December 2014Cost 371 371 Accumulated amortisation and impairment (251) (251)
Net carrying amount 120 120
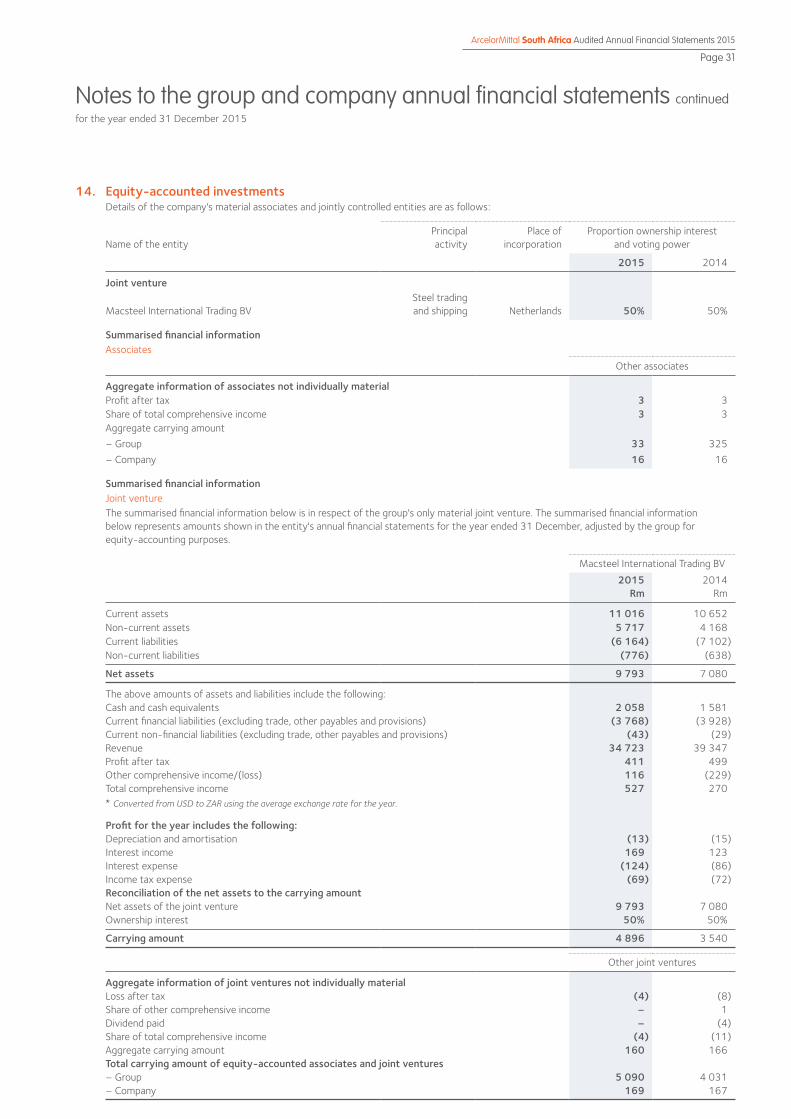
ArcelorMittal South Africa Audited Annual Financial Statements 2015
Page 31
Notes to the group and company annual financial statements continuedfor the year ended 31 December 2015
14. Equity-accounted investmentsDetails of the company's material associates and jointly controlled entities are as follows:
Name of the entityPrincipal activity
Place of incorporation
Proportion ownership interest and voting power
2015 2014
Joint venture
Macsteel International Trading BVSteel trading and shipping Netherlands 50% 50%
Summarised financial informationAssociates
Other associates
Aggregate information of associates not individually materialProfit after tax 3 3 Share of total comprehensive income 3 3 Aggregate carrying amount
– Group 33 325
– Company 16 16
Summarised financial informationJoint ventureThe summarised financial information below is in respect of the group's only material joint venture. The summarised financial information below represents amounts shown in the entity's annual financial statements for the year ended 31 December, adjusted by the group for equity-accounting purposes.
Macsteel International Trading BV
2015Rm
2014Rm
Current assets 11 016 10 652 Non-current assets 5 717 4 168 Current liabilities (6 164) (7 102)Non-current liabilities (776) (638)
Net assets 9 793 7 080
The above amounts of assets and liabilities include the following:Cash and cash equivalents 2 058 1 581 Current financial liabilities (excluding trade, other payables and provisions) (3 768) (3 928)Current non-financial liabilities (excluding trade, other payables and provisions) (43) (29)Revenue 34 723 39 347 Profit after tax 411 499 Other comprehensive income/(loss) 116 (229)Total comprehensive income 527 270 * Converted from USD to ZAR using the average exchange rate for the year.
Profit for the year includes the following:Depreciation and amortisation (13) (15)Interest income 169 123 Interest expense (124) (86)Income tax expense (69) (72)Reconciliation of the net assets to the carrying amountNet assets of the joint venture 9 793 7 080 Ownership interest 50% 50%
Carrying amount 4 896 3 540
Other joint ventures
Aggregate information of joint ventures not individually materialLoss after tax (4) (8)Share of other comprehensive income – 1 Dividend paid – (4)Share of total comprehensive income (4) (11)Aggregate carrying amount 160 166 Total carrying amount of equity-accounted associates and joint ventures– Group 5 090 4 031 – Company 169 167
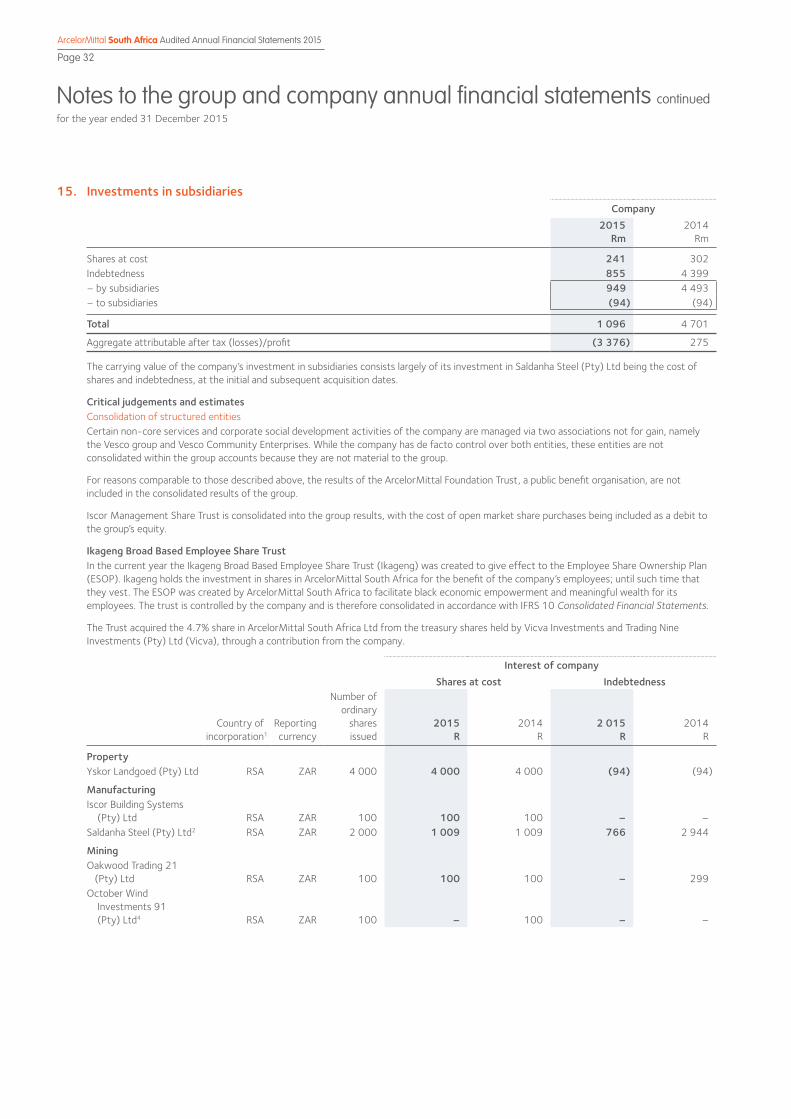
Notes to the group and company annual financial statements continuedfor the year ended 31 December 2015
ArcelorMittal South Africa Audited Annual Financial Statements 2015
Page 32
15. Investments in subsidiariesCompany
2015Rm
2014Rm
Shares at cost 241 302 Indebtedness 855 4 399 – by subsidiaries 949 4 493 – to subsidiaries (94) (94)
Total 1 096 4 701
Aggregate attributable after tax (losses)/profit (3 376) 275
The carrying value of the company’s investment in subsidiaries consists largely of its investment in Saldanha Steel (Pty) Ltd being the cost of shares and indebtedness, at the initial and subsequent acquisition dates.
Critical judgements and estimatesConsolidation of structured entitiesCertain non-core services and corporate social development activities of the company are managed via two associations not for gain, namely the Vesco group and Vesco Community Enterprises. While the company has de facto control over both entities, these entities are not consolidated within the group accounts because they are not material to the group.
For reasons comparable to those described above, the results of the ArcelorMittal Foundation Trust, a public benefit organisation, are not included in the consolidated results of the group.
Iscor Management Share Trust is consolidated into the group results, with the cost of open market share purchases being included as a debit to the group’s equity.
Ikageng Broad Based Employee Share TrustIn the current year the Ikageng Broad Based Employee Share Trust (Ikageng) was created to give effect to the Employee Share Ownership Plan (ESOP). Ikageng holds the investment in shares in ArcelorMittal South Africa for the benefit of the company’s employees; until such time that they vest. The ESOP was created by ArcelorMittal South Africa to facilitate black economic empowerment and meaningful wealth for its employees. The trust is controlled by the company and is therefore consolidated in accordance with IFRS 10 Consolidated Financial Statements.
The Trust acquired the 4.7% share in ArcelorMittal South Africa Ltd from the treasury shares held by Vicva Investments and Trading Nine Investments (Pty) Ltd (Vicva), through a contribution from the company.
Interest of company Shares at cost Indebtedness
Country of incorporation1
Reporting currency
Number of ordinary
shares issued
2015R
2014R
2 015R
2014R
PropertyYskor Landgoed (Pty) Ltd RSA ZAR 4 000 4 000 4 000 (94) (94)
ManufacturingIscor Building Systems (Pty) Ltd RSA ZAR 100 100 100 – –Saldanha Steel (Pty) Ltd2 RSA ZAR 2 000 1 009 1 009 766 2 944
MiningOakwood Trading 21 (Pty) Ltd RSA ZAR 100 100 100 – 299 October Wind Investments 91 (Pty) Ltd4 RSA ZAR 100 – 100 – –
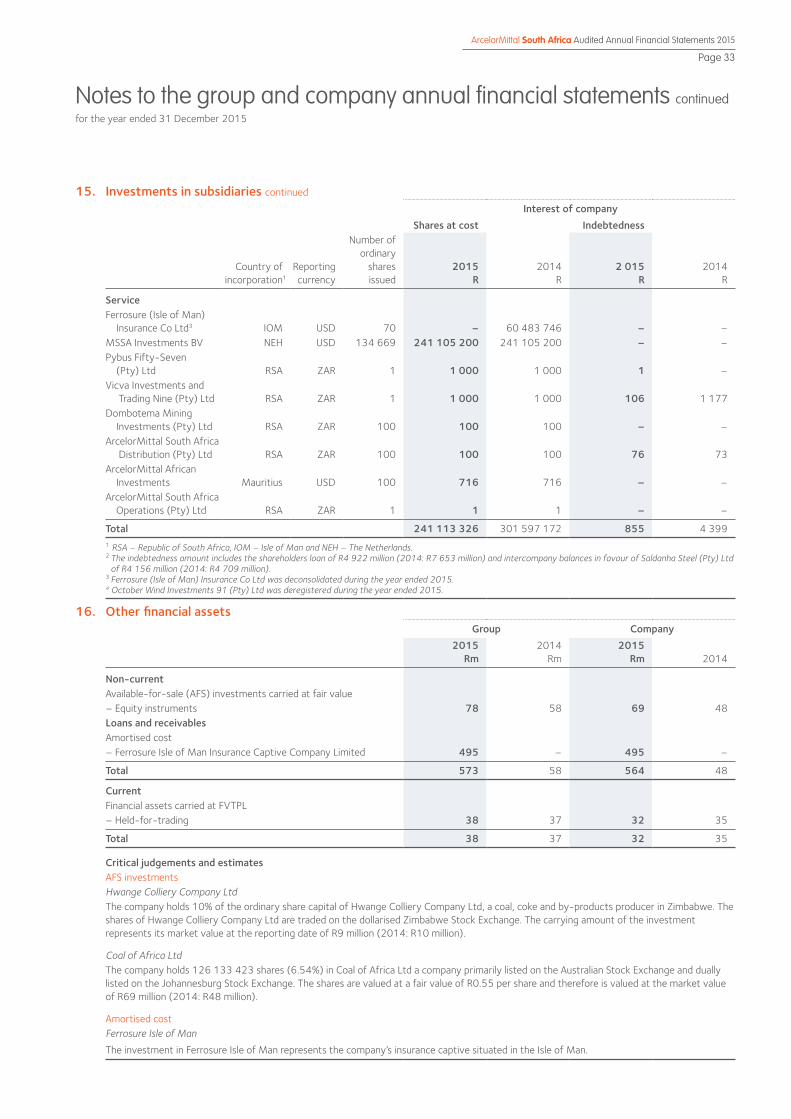
ArcelorMittal South Africa Audited Annual Financial Statements 2015
Page 33
Notes to the group and company annual financial statements continuedfor the year ended 31 December 2015
15. Investments in subsidiaries continued
Interest of company Shares at cost Indebtedness
Country of incorporation1
Reporting currency
Number of ordinary
shares issued
2015R
2014R
2 015R
2014R
ServiceFerrosure (Isle of Man) Insurance Co Ltd3 IOM USD 70 – 60 483 746 – –MSSA Investments BV NEH USD 134 669 241 105 200 241 105 200 – –Pybus Fifty-Seven (Pty) Ltd RSA ZAR 1 1 000 1 000 1 –Vicva Investments and Trading Nine (Pty) Ltd RSA ZAR 1 1 000 1 000 106 1 177 Dombotema Mining Investments (Pty) Ltd RSA ZAR 100 100 100 – –ArcelorMittal South Africa Distribution (Pty) Ltd RSA ZAR 100 100 100 76 73 ArcelorMittal African Investments Mauritius USD 100 716 716 – –ArcelorMittal South Africa Operations (Pty) Ltd RSA ZAR 1 1 1 – –
Total 241 113 326 301 597 172 855 4 399 1 RSA – Republic of South Africa, IOM – Isle of Man and NEH – The Netherlands.2 The indebtedness amount includes the shareholders loan of R4 922 million (2014: R7 653 million) and intercompany balances in favour of Saldanha Steel (Pty) Ltd
of R4 156 million (2014: R4 709 million).3 Ferrosure (Isle of Man) Insurance Co Ltd was deconsolidated during the year ended 2015.4 October Wind Investments 91 (Pty) Ltd was deregistered during the year ended 2015.
16. Other financial assetsGroup Company
2015Rm
2014Rm
2015 Rm 2014
Non-currentAvailable-for-sale (AFS) investments carried at fair value– Equity instruments 78 58 69 48 Loans and receivablesAmortised cost– Ferrosure Isle of Man Insurance Captive Company Limited 495 – 495 –
Total 573 58 564 48
CurrentFinancial assets carried at FVTPL– Held-for-trading 38 37 32 35
Total 38 37 32 35
Critical judgements and estimatesAFS investmentsHwange Colliery Company LtdThe company holds 10% of the ordinary share capital of Hwange Colliery Company Ltd, a coal, coke and by-products producer in Zimbabwe. The shares of Hwange Colliery Company Ltd are traded on the dollarised Zimbabwe Stock Exchange. The carrying amount of the investment represents its market value at the reporting date of R9 million (2014: R10 million).
Coal of Africa LtdThe company holds 126 133 423 shares (6.54%) in Coal of Africa Ltd a company primarily listed on the Australian Stock Exchange and dually listed on the Johannesburg Stock Exchange. The shares are valued at a fair value of R0.55 per share and therefore is valued at the market value of R69 million (2014: R48 million).
Amortised costFerrosure Isle of Man
The investment in Ferrosure Isle of Man represents the company’s insurance captive situated in the Isle of Man.
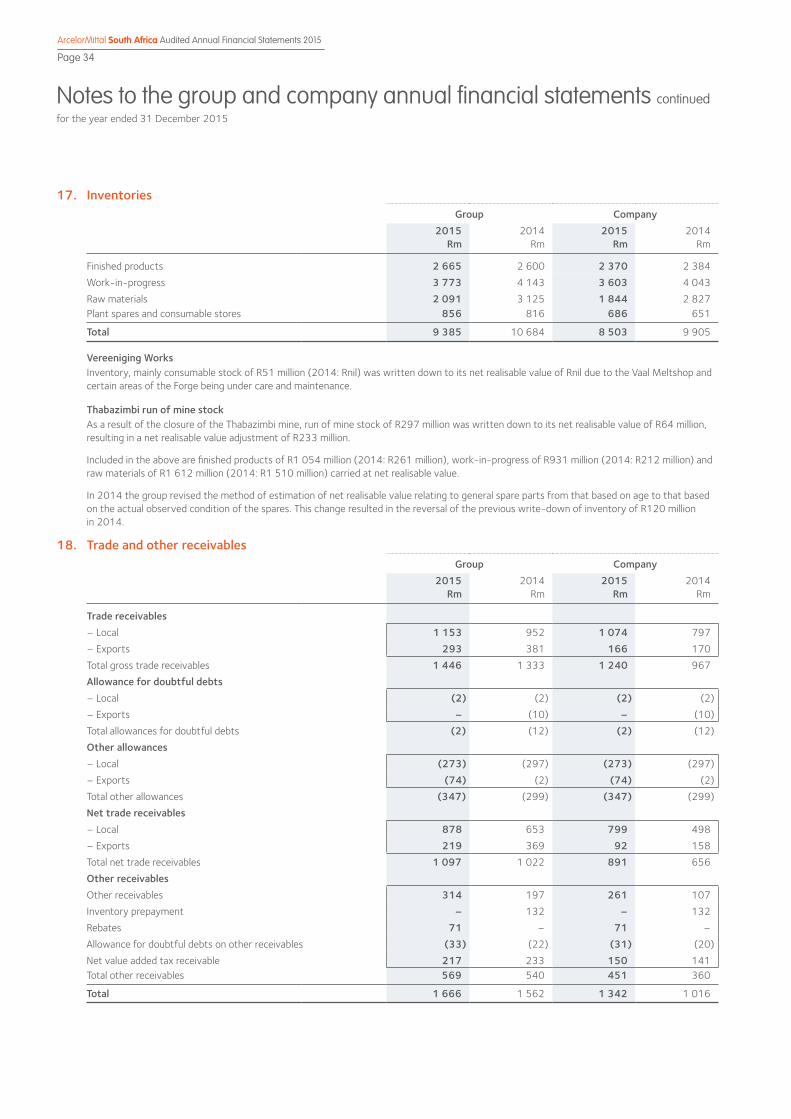
Notes to the group and company annual financial statements continuedfor the year ended 31 December 2015
ArcelorMittal South Africa Audited Annual Financial Statements 2015
Page 34
17. InventoriesGroup Company
2015Rm
2014Rm
2015 Rm
2014Rm
Finished products 2 665 2 600 2 370 2 384
Work-in-progress 3 773 4 143 3 603 4 043
Raw materials 2 091 3 125 1 844 2 827 Plant spares and consumable stores 856 816 686 651
Total 9 385 10 684 8 503 9 905
Vereeniging WorksInventory, mainly consumable stock of R51 million (2014: Rnil) was written down to its net realisable value of Rnil due to the Vaal Meltshop and certain areas of the Forge being under care and maintenance.
Thabazimbi run of mine stock As a result of the closure of the Thabazimbi mine, run of mine stock of R297 million was written down to its net realisable value of R64 million, resulting in a net realisable value adjustment of R233 million.
Included in the above are finished products of R1 054 million (2014: R261 million), work-in-progress of R931 million (2014: R212 million) and raw materials of R1 612 million (2014: R1 510 million) carried at net realisable value.
In 2014 the group revised the method of estimation of net realisable value relating to general spare parts from that based on age to that based on the actual observed condition of the spares. This change resulted in the reversal of the previous write-down of inventory of R120 million in 2014.
18. Trade and other receivables Group Company
2015Rm
2014Rm
2015 Rm
2014Rm
Trade receivables – Local 1 153 952 1 074 797
– Exports 293 381 166 170
Total gross trade receivables 1 446 1 333 1 240 967
Allowance for doubtful debts– Local (2) (2) (2) (2)
– Exports – (10) – (10)
Total allowances for doubtful debts (2) (12) (2) (12)
Other allowances– Local (273) (297) (273) (297)
– Exports (74) (2) (74) (2)
Total other allowances (347) (299) (347) (299)
Net trade receivables – Local 878 653 799 498
– Exports 219 369 92 158
Total net trade receivables 1 097 1 022 891 656
Other receivablesOther receivables 314 197 261 107
Inventory prepayment – 132 – 132
Rebates 71 – 71 –
Allowance for doubtful debts on other receivables (33) (22) (31) (20)
Net value added tax receivable 217 233 150 141 Total other receivables 569 540 451 360
Total 1 666 1 562 1 342 1 016
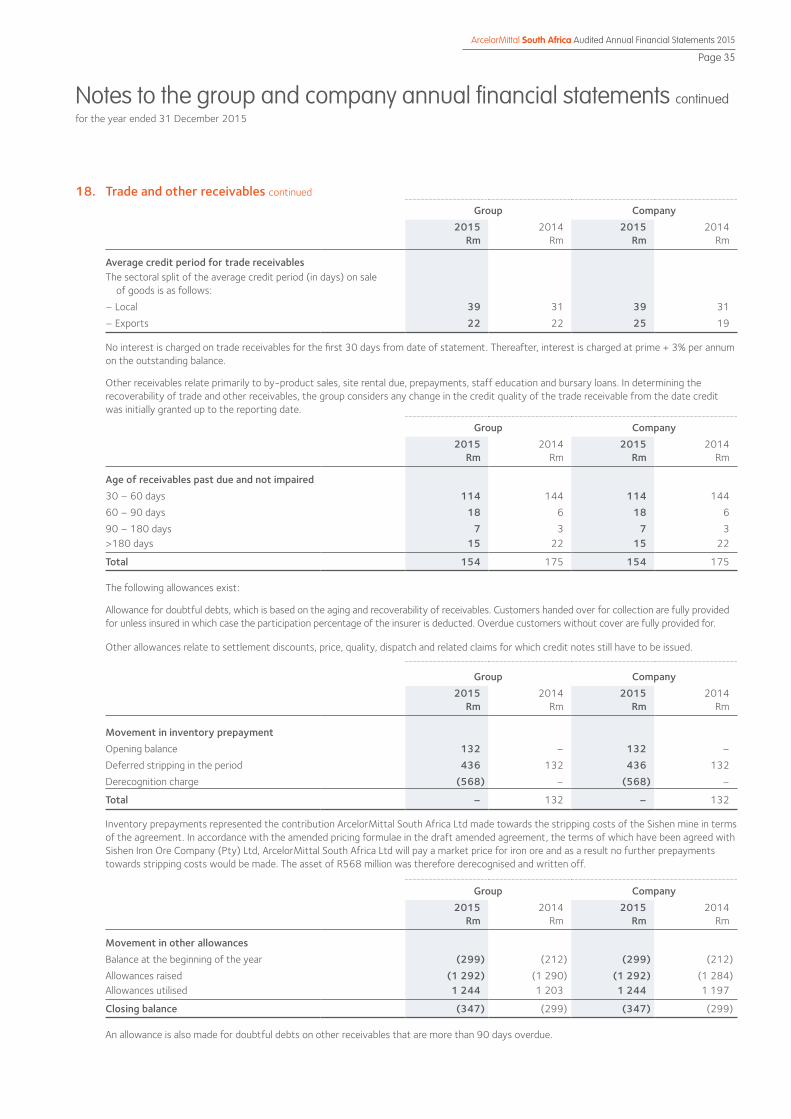
ArcelorMittal South Africa Audited Annual Financial Statements 2015
Page 35
Notes to the group and company annual financial statements continuedfor the year ended 31 December 2015
18. Trade and other receivables continued
Group Company2015
Rm2014
Rm 2015
Rm2014
Rm
Average credit period for trade receivables The sectoral split of the average credit period (in days) on sale of goods is as follows:
– Local 39 31 39 31
– Exports 22 22 25 19
No interest is charged on trade receivables for the first 30 days from date of statement. Thereafter, interest is charged at prime + 3% per annum on the outstanding balance.
Other receivables relate primarily to by-product sales, site rental due, prepayments, staff education and bursary loans. In determining the recoverability of trade and other receivables, the group considers any change in the credit quality of the trade receivable from the date credit was initially granted up to the reporting date.
Group Company2015
Rm2014
Rm 2015
Rm2014
Rm
Age of receivables past due and not impaired30 – 60 days 114 144 114 144
60 – 90 days 18 6 18 6
90 – 180 days 7 3 7 3 >180 days 15 22 15 22
Total 154 175 154 175
The following allowances exist:
Allowance for doubtful debts, which is based on the aging and recoverability of receivables. Customers handed over for collection are fully provided for unless insured in which case the participation percentage of the insurer is deducted. Overdue customers without cover are fully provided for.
Other allowances relate to settlement discounts, price, quality, dispatch and related claims for which credit notes still have to be issued.
Group Company2015
Rm2014
Rm 2015
Rm2014
Rm
Movement in inventory prepaymentOpening balance 132 – 132 –
Deferred stripping in the period 436 132 436 132
Derecognition charge (568) – (568) –
Total – 132 – 132
Inventory prepayments represented the contribution ArcelorMittal South Africa Ltd made towards the stripping costs of the Sishen mine in terms of the agreement. In accordance with the amended pricing formulae in the draft amended agreement, the terms of which have been agreed with Sishen Iron Ore Company (Pty) Ltd, ArcelorMittal South Africa Ltd will pay a market price for iron ore and as a result no further prepayments towards stripping costs would be made. The asset of R568 million was therefore derecognised and written off.
Group Company2015
Rm2014
Rm 2015
Rm2014
Rm
Movement in other allowancesBalance at the beginning of the year (299) (212) (299) (212)
Allowances raised (1 292) (1 290) (1 292) (1 284)Allowances utilised 1 244 1 203 1 244 1 197
Closing balance (347) (299) (347) (299)
An allowance is also made for doubtful debts on other receivables that are more than 90 days overdue.
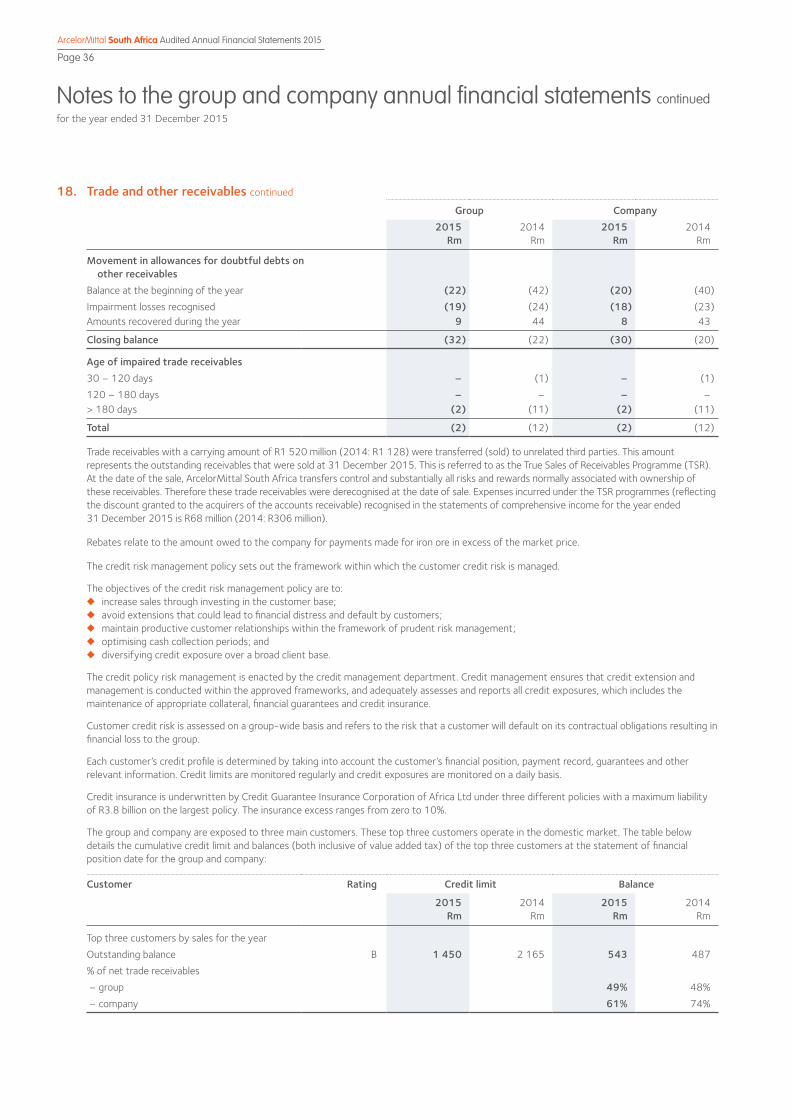
Notes to the group and company annual financial statements continuedfor the year ended 31 December 2015
ArcelorMittal South Africa Audited Annual Financial Statements 2015
Page 36
18. Trade and other receivables continued
Group Company2015
Rm2014
Rm 2015
Rm2014
Rm
Movement in allowances for doubtful debts on other receivablesBalance at the beginning of the year (22) (42) (20) (40)
Impairment losses recognised (19) (24) (18) (23)Amounts recovered during the year 9 44 8 43
Closing balance (32) (22) (30) (20)
Age of impaired trade receivables30 – 120 days – (1) – (1)
120 – 180 days – – – –> 180 days (2) (11) (2) (11)
Total (2) (12) (2) (12)
Trade receivables with a carrying amount of R1 520 million (2014: R1 128) were transferred (sold) to unrelated third parties. This amount represents the outstanding receivables that were sold at 31 December 2015. This is referred to as the True Sales of Receivables Programme (TSR). At the date of the sale, ArcelorMittal South Africa transfers control and substantially all risks and rewards normally associated with ownership of these receivables. Therefore these trade receivables were derecognised at the date of sale. Expenses incurred under the TSR programmes (reflecting the discount granted to the acquirers of the accounts receivable) recognised in the statements of comprehensive income for the year ended 31 December 2015 is R68 million (2014: R306 million).
Rebates relate to the amount owed to the company for payments made for iron ore in excess of the market price.
The credit risk management policy sets out the framework within which the customer credit risk is managed.
The objectives of the credit risk management policy are to:◆◆ increase sales through investing in the customer base;◆◆ avoid extensions that could lead to financial distress and default by customers;◆◆ maintain productive customer relationships within the framework of prudent risk management;◆◆ optimising cash collection periods; and◆◆ diversifying credit exposure over a broad client base.
The credit policy risk management is enacted by the credit management department. Credit management ensures that credit extension and management is conducted within the approved frameworks, and adequately assesses and reports all credit exposures, which includes the maintenance of appropriate collateral, financial guarantees and credit insurance.
Customer credit risk is assessed on a group-wide basis and refers to the risk that a customer will default on its contractual obligations resulting in financial loss to the group.
Each customer’s credit profile is determined by taking into account the customer’s financial position, payment record, guarantees and other relevant information. Credit limits are monitored regularly and credit exposures are monitored on a daily basis.
Credit insurance is underwritten by Credit Guarantee Insurance Corporation of Africa Ltd under three different policies with a maximum liability of R3.8 billion on the largest policy. The insurance excess ranges from zero to 10%.
The group and company are exposed to three main customers. These top three customers operate in the domestic market. The table below details the cumulative credit limit and balances (both inclusive of value added tax) of the top three customers at the statement of financial position date for the group and company:
Customer Rating Credit limit Balance
2015Rm
2014Rm
2015Rm
2014Rm
Top three customers by sales for the year Outstanding balance B 1 450 2 165 543 487
% of net trade receivables
– group 49% 48%
– company 61% 74%

ArcelorMittal South Africa Audited Annual Financial Statements 2015
Page 37
Notes to the group and company annual financial statements continuedfor the year ended 31 December 2015
18. Trade and other receivables continued
Group Company2015
%2014
% 2015
%2014
%
Credit risk exposures by class for the group and company is as follows:
– Local 80 64 90 76
– Exports 20 36 10 24
Total 100 100 100 100
19. Cash and cash equivalentsGroup Company
2015Rm
2014Rm
2015 Rm
2014Rm
Cash and bank balances 2 164 454 2 150 285
Total 2 164 454 2 150 285
For the purposes of the statements of cash flows, cash and cash equivalents include cash on hand and in banks, net of outstanding overdrafts.
No cash restrictions apply to the group or company in 2015 as Ferrosure Isle of Man Insurance Company Ltd was deconsolidated in 2015. In 2014 cash to the value of R154 million was restricted to meet the solvency requirements of Ferrosure Isle of Man Insurance Company Ltd.
20. Non-current assets held-for-saleGroup Company
2015Rm
2014Rm
2015 Rm
2014Rm
Opening balance – – – –
Reclassification 302 – 308 –Impairment losses (Refer to note 8) (302) – (308) –
Total – – – –
The investment in the Northern Cape Iron Ore Mining Operations (that form part of the corporate and other operating segment) previously disclosed as an investment in equity-accounted investments was reclassified to a non-current asset held-for-sale in the current year. The investment of R302 million at group and R308 million in company was impaired in full due to the current iron ore prices. Despite management remaining committed to the sale of the investment, the sale is unlikely to be completed within one year. Therefore, the investment ceased to be classified as a non-current asset held-for-sale and at 31 December 2015, the investment was reclassified to investments in equity-accounted investments.
21. Stated capitalGroup Company
2015Rm
2014Rm
2015 Rm
2014Rm
AuthorisedOrdinary shares at no par value 1 200 000 000 (2014: 1 200 000 000)“C” redeemable preference shares @ R10 each 2 357 584 (2014: 2 357 584)
IssuedOrdinary shares at no par value 445 752 132 (2014: 445 752 132) 37 37 37 37
Total 37 37 37 37
The unissued ordinary shares are not under the control of the directors. Of the issued shares 5.2% is held by Vicva Investments and Trading Nine (Pty) Ltd and the Ikageng Broad Based Employee Share Trust (Ikageng) holds 4.7%. Ikageng holds the shares in the company for the benefit of the employees until such time they vest. Vicva Investments and Trading Nine (Pty) Ltd and Ikageng Broad Based Employee Share Trust are subsidiaries of the company and the shares are treated as treasury shares.
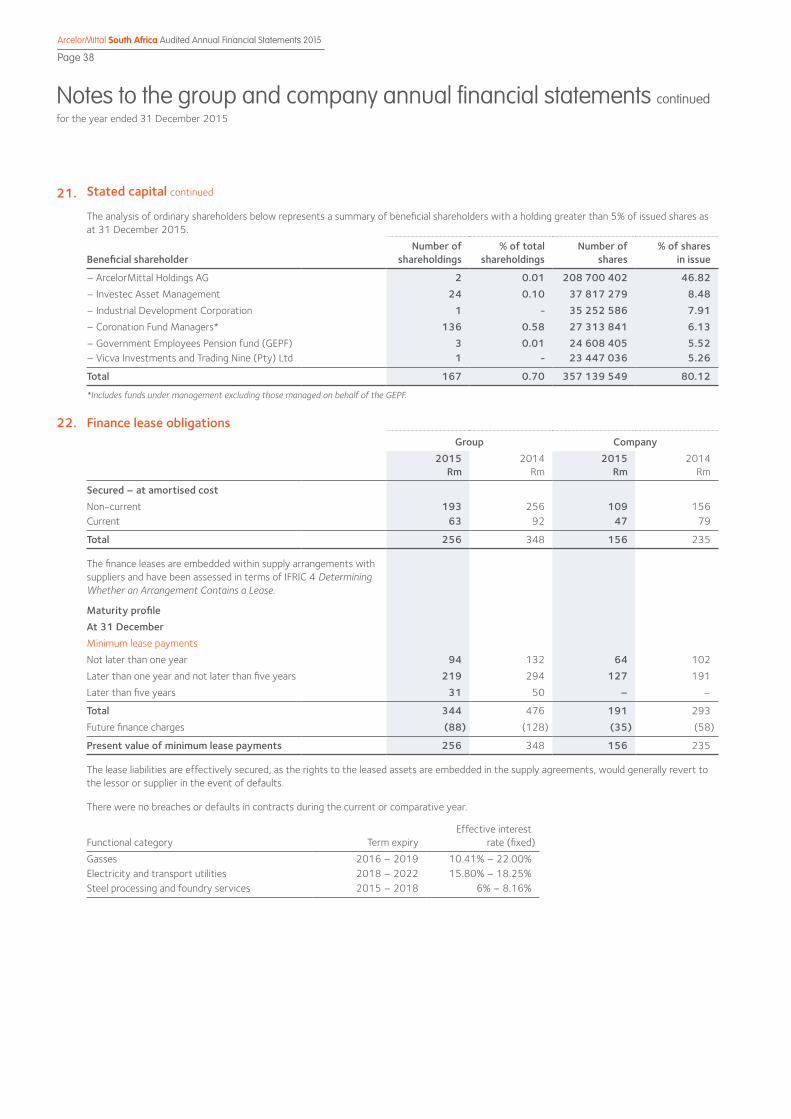
Notes to the group and company annual financial statements continuedfor the year ended 31 December 2015
ArcelorMittal South Africa Audited Annual Financial Statements 2015
Page 38
21. Stated capital continued
The analysis of ordinary shareholders below represents a summary of beneficial shareholders with a holding greater than 5% of issued shares as at 31 December 2015.
Beneficial shareholderNumber of
shareholdings% of total
shareholdingsNumber of
shares% of shares
in issue
– ArcelorMittal Holdings AG 2 0.01 208 700 402 46.82 – Investec Asset Management 24 0.10 37 817 279 8.48 – Industrial Development Corporation 1 - 35 252 586 7.91 – Coronation Fund Managers* 136 0.58 27 313 841 6.13 – Government Employees Pension fund (GEPF) 3 0.01 24 608 405 5.52 – Vicva Investments and Trading Nine (Pty) Ltd 1 - 23 447 036 5.26
Total 167 0.70 357 139 549 80.12
*Includes funds under management excluding those managed on behalf of the GEPF.
22. Finance lease obligationsGroup Company
2015Rm
2014Rm
2015 Rm
2014Rm
Secured – at amortised costNon-current 193 256 109 156 Current 63 92 47 79
Total 256 348 156 235
The finance leases are embedded within supply arrangements with suppliers and have been assessed in terms of IFRIC 4 Determining Whether an Arrangement Contains a Lease.
Maturity profileAt 31 DecemberMinimum lease payments
Not later than one year 94 132 64 102
Later than one year and not later than five years 219 294 127 191
Later than five years 31 50 – –
Total 344 476 191 293
Future finance charges (88) (128) (35) (58)
Present value of minimum lease payments 256 348 156 235
The lease liabilities are effectively secured, as the rights to the leased assets are embedded in the supply agreements, would generally revert to the lessor or supplier in the event of defaults.
There were no breaches or defaults in contracts during the current or comparative year.
Functional category Term expiryEffective interest
rate (fixed)
Gasses 2016 – 2019 10.41% – 22.00%Electricity and transport utilities 2018 – 2022 15.80% – 18.25%Steel processing and foundry services 2015 – 2018 6% – 8.16%
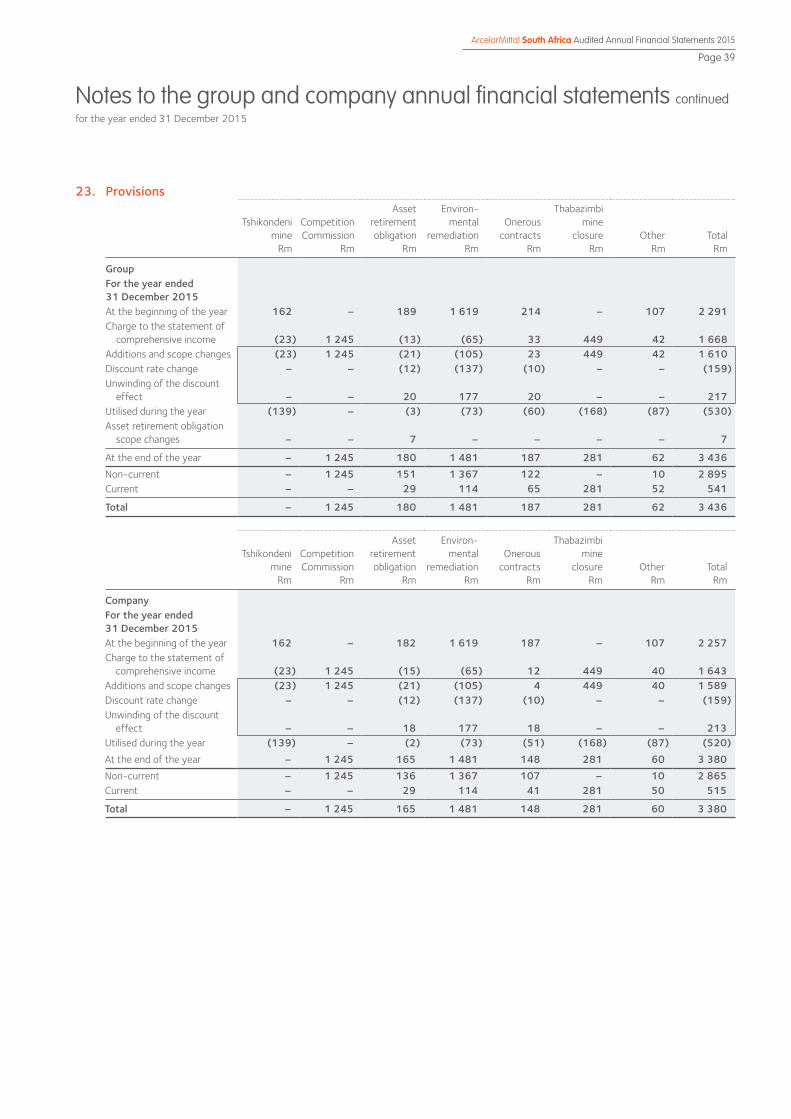
ArcelorMittal South Africa Audited Annual Financial Statements 2015
Page 39
Notes to the group and company annual financial statements continuedfor the year ended 31 December 2015
23. Provisions
Tshikondeni mine
Rm
Competition Commission
Rm
Asset retirement obligation
Rm
Environ-mental
remediationRm
Onerous contracts
Rm
Thabazimbi mine
closureRm
Other Rm
Total Rm
GroupFor the year ended 31 December 2015At the beginning of the year 162 – 189 1 619 214 – 107 2 291 Charge to the statement of comprehensive income (23) 1 245 (13) (65) 33 449 42 1 668 Additions and scope changes (23) 1 245 (21) (105) 23 449 42 1 610 Discount rate change – – (12) (137) (10) – – (159)Unwinding of the discount effect – – 20 177 20 – – 217 Utilised during the year (139) – (3) (73) (60) (168) (87) (530)Asset retirement obligation scope changes – – 7 – – – – 7
At the end of the year – 1 245 180 1 481 187 281 62 3 436 Non-current – 1 245 151 1 367 122 – 10 2 895 Current – – 29 114 65 281 52 541
Total – 1 245 180 1 481 187 281 62 3 436
Tshikondeni mine
Rm
Competition Commission
Rm
Asset retirement obligation
Rm
Environ-mental
remediationRm
Onerous contracts
Rm
Thabazimbi mine
closureRm
Other Rm
Total Rm
CompanyFor the year ended 31 December 2015At the beginning of the year 162 – 182 1 619 187 – 107 2 257 Charge to the statement of comprehensive income (23) 1 245 (15) (65) 12 449 40 1 643 Additions and scope changes (23) 1 245 (21) (105) 4 449 40 1 589 Discount rate change – – (12) (137) (10) – – (159)Unwinding of the discount effect – – 18 177 18 – – 213 Utilised during the year (139) – (2) (73) (51) (168) (87) (520)At the end of the year – 1 245 165 1 481 148 281 60 3 380 Non-current – 1 245 136 1 367 107 – 10 2 865 Current – – 29 114 41 281 50 515
Total – 1 245 165 1 481 148 281 60 3 380
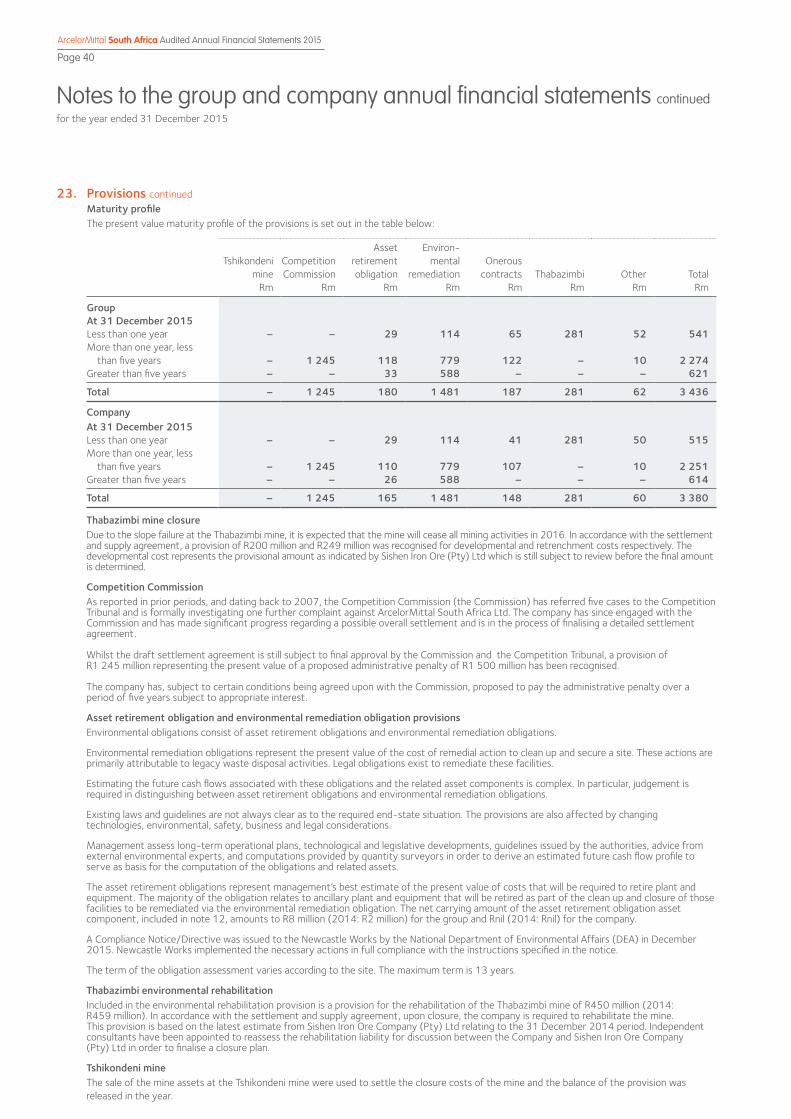
Notes to the group and company annual financial statements continuedfor the year ended 31 December 2015
ArcelorMittal South Africa Audited Annual Financial Statements 2015
Page 40
23. Provisions continuedMaturity profileThe present value maturity profile of the provisions is set out in the table below:
Tshikondeni mine
Rm
Competition Commission
Rm
Asset retirement obligation
Rm
Environ-mental
remediationRm
Onerous contracts
Rm Thabazimbi
Rm Other
Rm Total
Rm
GroupAt 31 December 2015Less than one year – – 29 114 65 281 52 541 More than one year, less than five years – 1 245 118 779 122 – 10 2 274 Greater than five years – – 33 588 – – – 621
Total – 1 245 180 1 481 187 281 62 3 436
CompanyAt 31 December 2015Less than one year – – 29 114 41 281 50 515 More than one year, less than five years – 1 245 110 779 107 – 10 2 251 Greater than five years – – 26 588 – – – 614
Total – 1 245 165 1 481 148 281 60 3 380
Thabazimbi mine closureDue to the slope failure at the Thabazimbi mine, it is expected that the mine will cease all mining activities in 2016. In accordance with the settlement and supply agreement, a provision of R200 million and R249 million was recognised for developmental and retrenchment costs respectively. The developmental cost represents the provisional amount as indicated by Sishen Iron Ore (Pty) Ltd which is still subject to review before the final amount is determined.
Competition CommissionAs reported in prior periods, and dating back to 2007, the Competition Commission (the Commission) has referred five cases to the Competition Tribunal and is formally investigating one further complaint against ArcelorMittal South Africa Ltd. The company has since engaged with the Commission and has made significant progress regarding a possible overall settlement and is in the process of finalising a detailed settlement agreement.
Whilst the draft settlement agreement is still subject to final approval by the Commission and the Competition Tribunal, a provision of R1 245 million representing the present value of a proposed administrative penalty of R1 500 million has been recognised.
The company has, subject to certain conditions being agreed upon with the Commission, proposed to pay the administrative penalty over a period of five years subject to appropriate interest.
Asset retirement obligation and environmental remediation obligation provisionsEnvironmental obligations consist of asset retirement obligations and environmental remediation obligations.
Environmental remediation obligations represent the present value of the cost of remedial action to clean up and secure a site. These actions are primarily attributable to legacy waste disposal activities. Legal obligations exist to remediate these facilities.
Estimating the future cash flows associated with these obligations and the related asset components is complex. In particular, judgement is required in distinguishing between asset retirement obligations and environmental remediation obligations.
Existing laws and guidelines are not always clear as to the required end-state situation. The provisions are also affected by changing technologies, environmental, safety, business and legal considerations.
Management assess long-term operational plans, technological and legislative developments, guidelines issued by the authorities, advice from external environmental experts, and computations provided by quantity surveyors in order to derive an estimated future cash flow profile to serve as basis for the computation of the obligations and related assets.
The asset retirement obligations represent management’s best estimate of the present value of costs that will be required to retire plant and equipment. The majority of the obligation relates to ancillary plant and equipment that will be retired as part of the clean up and closure of those facilities to be remediated via the environmental remediation obligation. The net carrying amount of the asset retirement obligation asset component, included in note 12, amounts to R8 million (2014: R2 million) for the group and Rnil (2014: Rnil) for the company.
A Compliance Notice/Directive was issued to the Newcastle Works by the National Department of Environmental Affairs (DEA) in December 2015. Newcastle Works implemented the necessary actions in full compliance with the instructions specified in the notice.
The term of the obligation assessment varies according to the site. The maximum term is 13 years.
Thabazimbi environmental rehabilitation Included in the environmental rehabilitation provision is a provision for the rehabilitation of the Thabazimbi mine of R450 million (2014: R459 million). In accordance with the settlement and supply agreement, upon closure, the company is required to rehabilitate the mine. This provision is based on the latest estimate from Sishen Iron Ore Company (Pty) Ltd relating to the 31 December 2014 period. Independent consultants have been appointed to reassess the rehabilitation liability for discussion between the Company and Sishen Iron Ore Company (Pty) Ltd in order to finalise a closure plan.
Tshikondeni mineThe sale of the mine assets at the Tshikondeni mine were used to settle the closure costs of the mine and the balance of the provision was released in the year.

ArcelorMittal South Africa Audited Annual Financial Statements 2015
Page 41
Notes to the group and company annual financial statements continuedfor the year ended 31 December 2015
23. Provisions continued
2015%
2014%
Average discount ratesAsset retirement obligation 12.72 11.39 Environmental remediation obligation 13.36 11.73
Onerous contracts 11.82 9.59
The average escalation factor applied to the current cash flow estimates is 6.8% (2014: 6.8%).
Onerous contract provisionThe provision includes the following:
An onerous operating lease contract embedded in a long-term, take-or-pay gas supply contract with Afrox. The unavoidability of the cost arose upon the 1997 decommissioning of steel-making facilities at Pretoria Works. The carrying amount at 31 December 2015 equalled R146 million (2014: R179 million). The unexpired term of the contract is five years.
An onerous take-or-pay contract for burnt dolomite and coal fines sourced from PPC Ltd. The take-or-pay obligation arose historically due to lower off-take on account of efficiency improvements and method changes. The carrying amount at 31 December 2015 equalled R40 million (2014: R26 million).
OtherVereeniging closure costs In the current year, the Vaal Meltshop and parts of the Forge plants at Vereeniging Works were placed under care and maintenance. As a result, a provision for voluntary severance packages of R35 million was recognised.
Other provisions decreased mainly due to the utilisation of the provision raised in 2014 for corporate restructure costs.
The sensitivity of the carrying amount of the obligations at 31 December 2015 in response to changes in key inputs is as follows:
Asset retirement obligations
RmIncrease/(decrease)
Environmentalremediation obligations
RmIncrease/(decrease)
Onerous contracts
RmIncrease/(decrease)
Carrying amount at 31 December 2015% change in all cash flows+10% 18 158 17 -10% (18) (158) (17)
% change in cash flows in first five years+10% 15 98 17 -10% (15) (98) (17)
Basis point change in discount rate+100 bps (6) (55) (5)-100 bps 6 55 5
Basis point change in discount rate in first five years+100 bps (4) (16) (6)-100 bps 4 16 6
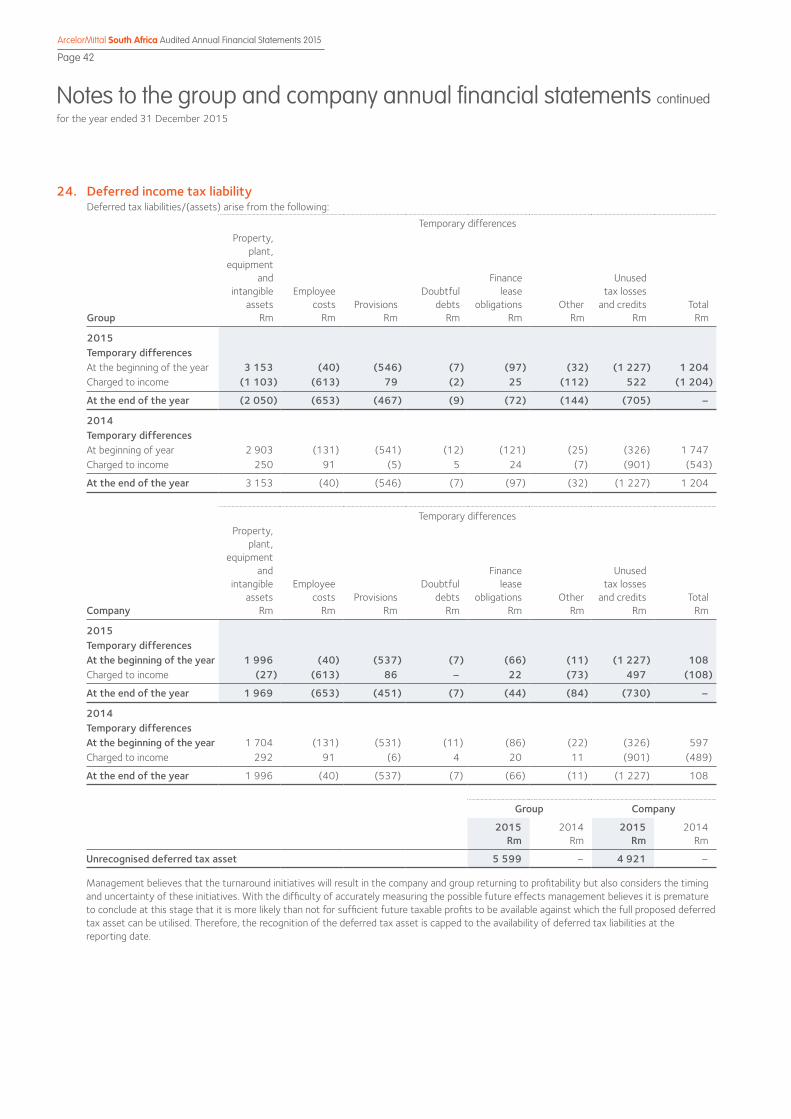
Notes to the group and company annual financial statements continuedfor the year ended 31 December 2015
ArcelorMittal South Africa Audited Annual Financial Statements 2015
Page 42
24. Deferred income tax liabilityDeferred tax liabilities/(assets) arise from the following:
Temporary differences
Group
Property, plant,
equipment and
intangible assets
Rm
Employee costs
RmProvisions
Rm
Doubtfuldebts
Rm
Finance lease
obligations Rm
Other Rm
Unused tax losses
and creditsRm
Total Rm
2015Temporary differencesAt the beginning of the year 3 153 (40) (546) (7) (97) (32) (1 227) 1 204 Charged to income (1 103) (613) 79 (2) 25 (112) 522 (1 204)
At the end of the year (2 050) (653) (467) (9) (72) (144) (705) –
2014Temporary differencesAt beginning of year 2 903 (131) (541) (12) (121) (25) (326) 1 747 Charged to income 250 91 (5) 5 24 (7) (901) (543)
At the end of the year 3 153 (40) (546) (7) (97) (32) (1 227) 1 204
Temporary differences
Company
Property, plant,
equipment and
intangible assets
Rm
Employee costs
RmProvisions
Rm
Doubtfuldebts
Rm
Finance lease
obligations Rm
Other Rm
Unused tax losses
and creditsRm
Total Rm
2015Temporary differencesAt the beginning of the year 1 996 (40) (537) (7) (66) (11) (1 227) 108 Charged to income (27) (613) 86 – 22 (73) 497 (108)
At the end of the year 1 969 (653) (451) (7) (44) (84) (730) –
2014Temporary differencesAt the beginning of the year 1 704 (131) (531) (11) (86) (22) (326) 597 Charged to income 292 91 (6) 4 20 11 (901) (489)
At the end of the year 1 996 (40) (537) (7) (66) (11) (1 227) 108
Group Company
2015Rm
2014Rm
2015Rm
2014Rm
Unrecognised deferred tax asset 5 599 – 4 921 –
Management believes that the turnaround initiatives will result in the company and group returning to profitability but also considers the timing and uncertainty of these initiatives. With the difficulty of accurately measuring the possible future effects management believes it is premature to conclude at this stage that it is more likely than not for sufficient future taxable profits to be available against which the full proposed deferred tax asset can be utilised. Therefore, the recognition of the deferred tax asset is capped to the availability of deferred tax liabilities at the reporting date.
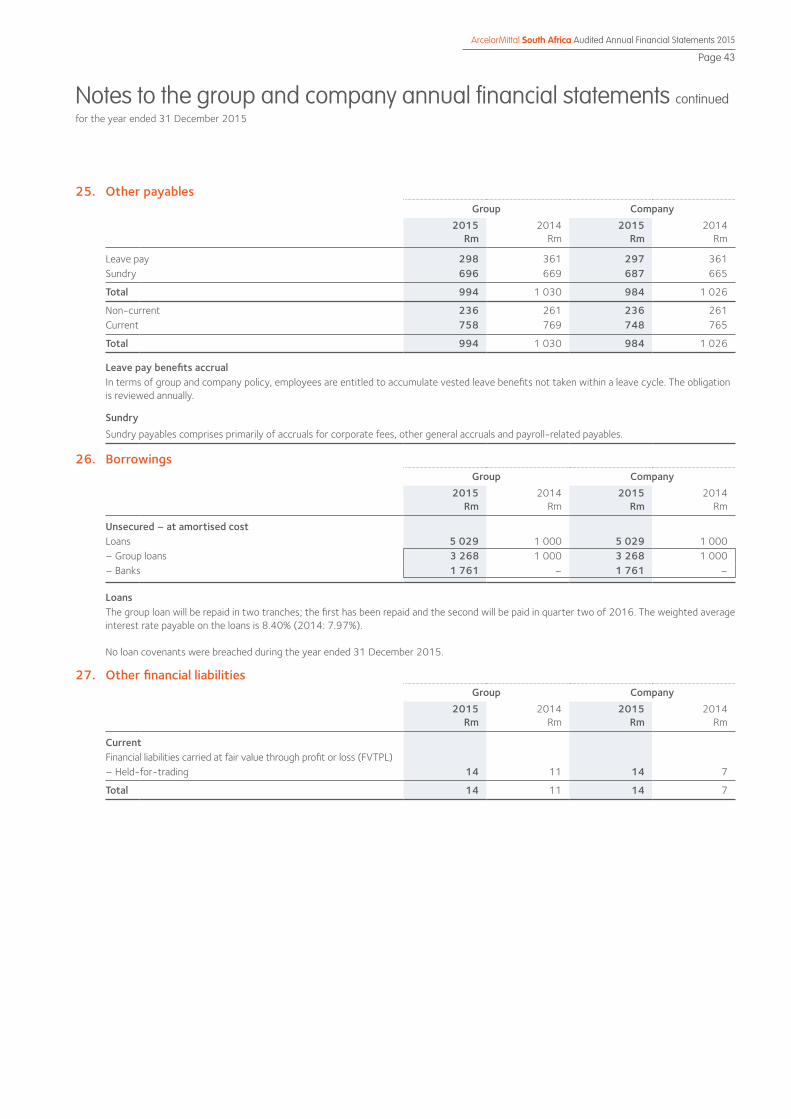
ArcelorMittal South Africa Audited Annual Financial Statements 2015
Page 43
Notes to the group and company annual financial statements continuedfor the year ended 31 December 2015
25. Other payablesGroup Company
2015Rm
2014Rm
2015Rm
2014Rm
Leave pay 298 361 297 361 Sundry 696 669 687 665
Total 994 1 030 984 1 026
Non-current 236 261 236 261 Current 758 769 748 765
Total 994 1 030 984 1 026
Leave pay benefits accrualIn terms of group and company policy, employees are entitled to accumulate vested leave benefits not taken within a leave cycle. The obligation is reviewed annually.
SundrySundry payables comprises primarily of accruals for corporate fees, other general accruals and payroll-related payables.
26. Borrowings Group Company
2015Rm
2014Rm
2015Rm
2014Rm
Unsecured – at amortised costLoans 5 029 1 000 5 029 1 000– Group loans 3 268 1 000 3 268 1 000 – Banks 1 761 – 1 761 –
LoansThe group loan will be repaid in two tranches; the first has been repaid and the second will be paid in quarter two of 2016. The weighted average interest rate payable on the loans is 8.40% (2014: 7.97%).
No loan covenants were breached during the year ended 31 December 2015.
27. Other financial liabilitiesGroup Company
2015Rm
2014Rm
2015Rm
2014Rm
CurrentFinancial liabilities carried at fair value through profit or loss (FVTPL)– Held-for-trading 14 11 14 7
Total 14 11 14 7
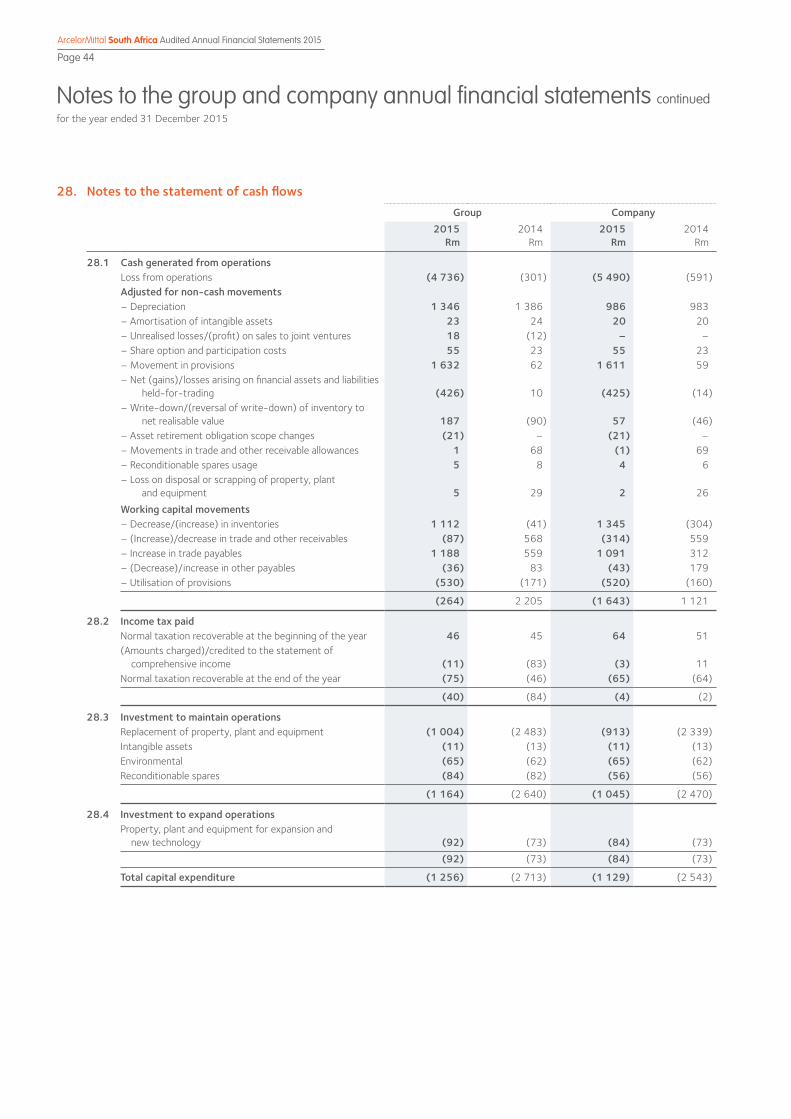
Notes to the group and company annual financial statements continuedfor the year ended 31 December 2015
ArcelorMittal South Africa Audited Annual Financial Statements 2015
Page 44
28. Notes to the statement of cash flowsGroup Company
2015Rm
2014Rm
2015Rm
2014Rm
28.1 Cash generated from operationsLoss from operations (4 736) (301) (5 490) (591)Adjusted for non-cash movements– Depreciation 1 346 1 386 986 983 – Amortisation of intangible assets 23 24 20 20 – Unrealised losses/(profit) on sales to joint ventures 18 (12) – –– Share option and participation costs 55 23 55 23 – Movement in provisions 1 632 62 1 611 59 – Net (gains)/losses arising on financial assets and liabilities held-for-trading (426) 10 (425) (14)– Write-down/(reversal of write-down) of inventory to net realisable value 187 (90) 57 (46)– Asset retirement obligation scope changes (21) – (21) –– Movements in trade and other receivable allowances 1 68 (1) 69 – Reconditionable spares usage 5 8 4 6 – Loss on disposal or scrapping of property, plant and equipment 5 29 2 26
Working capital movements– Decrease/(increase) in inventories 1 112 (41) 1 345 (304)– (Increase)/decrease in trade and other receivables (87) 568 (314) 559 – Increase in trade payables 1 188 559 1 091 312 – (Decrease)/increase in other payables (36) 83 (43) 179 – Utilisation of provisions (530) (171) (520) (160)
(264) 2 205 (1 643) 1 121
28.2 Income tax paidNormal taxation recoverable at the beginning of the year 46 45 64 51 (Amounts charged)/credited to the statement of comprehensive income (11) (83) (3) 11 Normal taxation recoverable at the end of the year (75) (46) (65) (64)
(40) (84) (4) (2)
28.3 Investment to maintain operationsReplacement of property, plant and equipment (1 004) (2 483) (913) (2 339)Intangible assets (11) (13) (11) (13)Environmental (65) (62) (65) (62)Reconditionable spares (84) (82) (56) (56)
(1 164) (2 640) (1 045) (2 470)
28.4 Investment to expand operationsProperty, plant and equipment for expansion and new technology (92) (73) (84) (73)
(92) (73) (84) (73)
Total capital expenditure (1 256) (2 713) (1 129) (2 543)
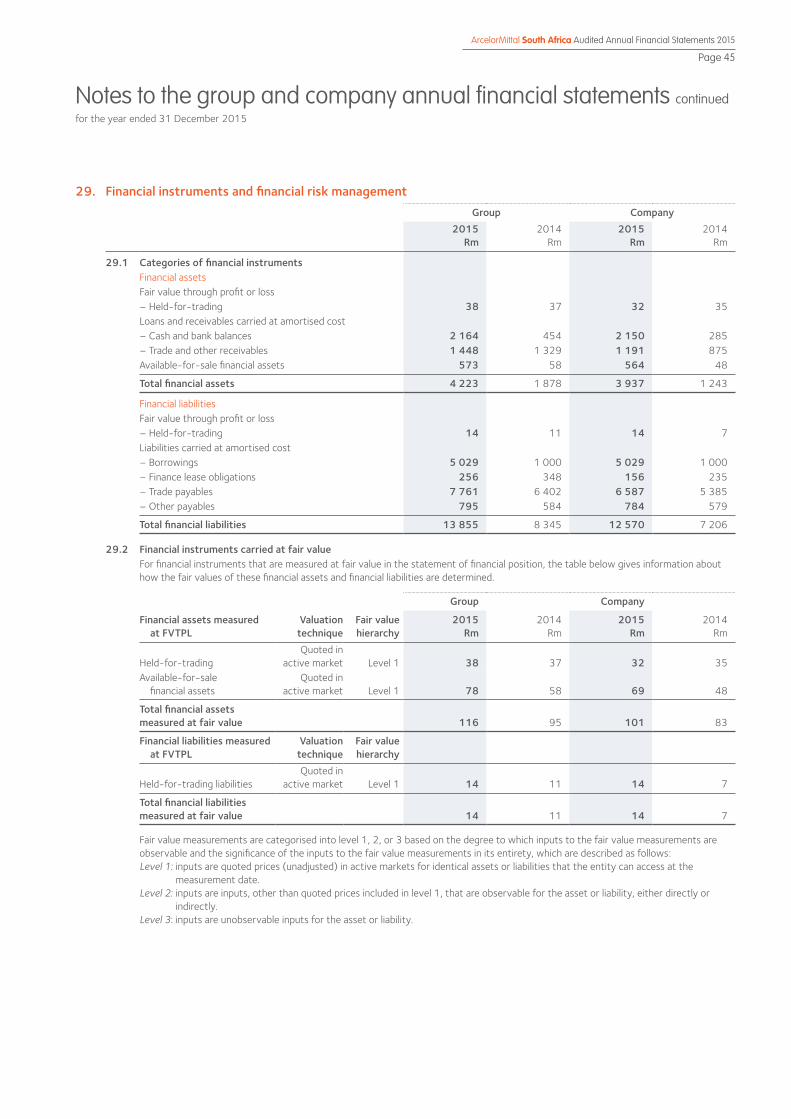
ArcelorMittal South Africa Audited Annual Financial Statements 2015
Page 45
Notes to the group and company annual financial statements continuedfor the year ended 31 December 2015
29. Financial instruments and financial risk managementGroup Company
2015Rm
2014Rm
2015Rm
2014Rm
29.1 Categories of financial instrumentsFinancial assetsFair value through profit or loss – Held-for-trading 38 37 32 35 Loans and receivables carried at amortised cost– Cash and bank balances 2 164 454 2 150 285 – Trade and other receivables 1 448 1 329 1 191 875 Available-for-sale financial assets 573 58 564 48
Total financial assets 4 223 1 878 3 937 1 243
Financial liabilitiesFair value through profit or loss– Held-for-trading 14 11 14 7 Liabilities carried at amortised cost– Borrowings 5 029 1 000 5 029 1 000 – Finance lease obligations 256 348 156 235 – Trade payables 7 761 6 402 6 587 5 385 – Other payables 795 584 784 579
Total financial liabilities 13 855 8 345 12 570 7 206
29.2 Financial instruments carried at fair valueFor financial instruments that are measured at fair value in the statement of financial position, the table below gives information about how the fair values of these financial assets and financial liabilities are determined.
Group Company
Financial assets measured at FVTPL
Valuation technique
Fair value hierarchy
2015Rm
2014Rm
2015Rm
2014Rm
Held-for-tradingQuoted in
active market Level 1 38 37 32 35 Available-for-sale financial assets
Quoted in active market Level 1 78 58 69 48
Total financial assets measured at fair value 116 95 101 83
Financial liabilities measured at FVTPL
Valuation technique
Fair value hierarchy
Held-for-trading liabilitiesQuoted in
active market Level 1 14 11 14 7
Total financial liabilities measured at fair value 14 11 14 7
Fair value measurements are categorised into level 1, 2, or 3 based on the degree to which inputs to the fair value measurements are observable and the significance of the inputs to the fair value measurements in its entirety, which are described as follows:Level 1: inputs are quoted prices (unadjusted) in active markets for identical assets or liabilities that the entity can access at the
measurement date.Level 2: inputs are inputs, other than quoted prices included in level 1, that are observable for the asset or liability, either directly or
indirectly.Level 3: inputs are unobservable inputs for the asset or liability.
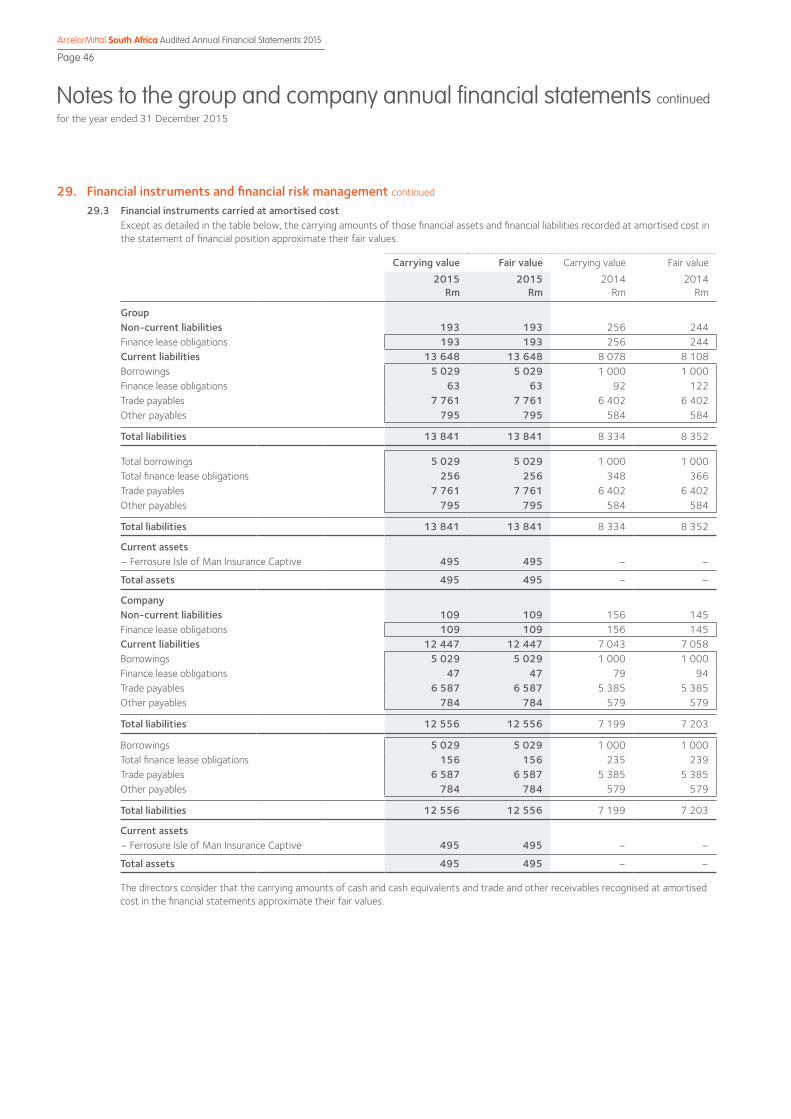
Notes to the group and company annual financial statements continuedfor the year ended 31 December 2015
ArcelorMittal South Africa Audited Annual Financial Statements 2015
Page 46
29. Financial instruments and financial risk management continued
29.3 Financial instruments carried at amortised costExcept as detailed in the table below, the carrying amounts of those financial assets and financial liabilities recorded at amortised cost in the statement of financial position approximate their fair values.
Carrying value Fair value Carrying value Fair value
2015Rm
2015Rm
2014Rm
2014Rm
GroupNon-current liabilities 193 193 256 244 Finance lease obligations 193 193 256 244 Current liabilities 13 648 13 648 8 078 8 108 Borrowings 5 029 5 029 1 000 1 000 Finance lease obligations 63 63 92 122 Trade payables 7 761 7 761 6 402 6 402 Other payables 795 795 584 584
Total liabilities 13 841 13 841 8 334 8 352
Total borrowings 5 029 5 029 1 000 1 000 Total finance lease obligations 256 256 348 366 Trade payables 7 761 7 761 6 402 6 402 Other payables 795 795 584 584
Total liabilities 13 841 13 841 8 334 8 352
Current assets– Ferrosure Isle of Man Insurance Captive 495 495 – –
Total assets 495 495 – –
CompanyNon-current liabilities 109 109 156 145 Finance lease obligations 109 109 156 145 Current liabilities 12 447 12 447 7 043 7 058 Borrowings 5 029 5 029 1 000 1 000 Finance lease obligations 47 47 79 94 Trade payables 6 587 6 587 5 385 5 385 Other payables 784 784 579 579
Total liabilities 12 556 12 556 7 199 7 203
Borrowings 5 029 5 029 1 000 1 000 Total finance lease obligations 156 156 235 239 Trade payables 6 587 6 587 5 385 5 385 Other payables 784 784 579 579
Total liabilities 12 556 12 556 7 199 7 203
Current assets– Ferrosure Isle of Man Insurance Captive 495 495 – –
Total assets 495 495 – –
The directors consider that the carrying amounts of cash and cash equivalents and trade and other receivables recognised at amortised cost in the financial statements approximate their fair values.
ArcelorMittal South Africa Audited Annual Financial Statements 2015
Page 47
Notes to the group and company annual financial statements continuedfor the year ended 31 December 2015
29. Financial instruments and financial risk management continued
29.4 Financial risk management overview and objectivesThe group’s financial risk management programme focuses on the unpredictability of financial markets and seeks to minimise potential adverse effects on financial performance.
Financial risks to which the group and company are exposed consist of:◆◆ Financial market risk, consisting of:
• foreign currency risk; • commodity price risks; • interest rate risk; and • liquidity risk, being
– cash flow volatility; and– fair value and cash flow interest rate risk.
◆◆ Capital management and gearing risk.◆◆ Customer credit risk as detailed in note 18.
The treasury and financial risk management policy (treasury policy) details the framework within which financial risk (other than customer credit risk) of the group is managed. The policy is approved by the board of directors and is reviewed annually.
The treasury policy addresses market, liquidity, capital management and gearing risk through the direction of the following activities:◆◆ Financing facilities.◆◆ Financial guarantees and letters of credit.◆◆ Market risk management through:
• foreign currency risk management; • commodity risk management; and • interest rate management.
◆◆ Cash management through liquidity management.
The treasury policy is enacted by the treasury department (treasury). Treasury identifies, evaluates and mitigates financial risks in close co-operation with the group and company’s operating units. Board-approved written policies cover the specific activities noted above and address risk limits, the use of derivative and non-derivative financial instruments to hedge certain exposures, and the approval framework governing transaction levels.
29.5 Financial market riskThrough its activities, the group is exposed primarily to the financial risks of changes in commodity prices, foreign currency exchange rates, interest rates and potential liquidity constraints.
The group manages currency risk through economic hedging of foreign exchange rates primarily relating to capital procurement, trade imports and exports exposures. Due to the limited scope of the programme, the forward contract derivatives were not designated within hedge accounting relationships.
Regarding other exposures, markets continue to be monitored in order to determine the most opportune time to commence hedging.
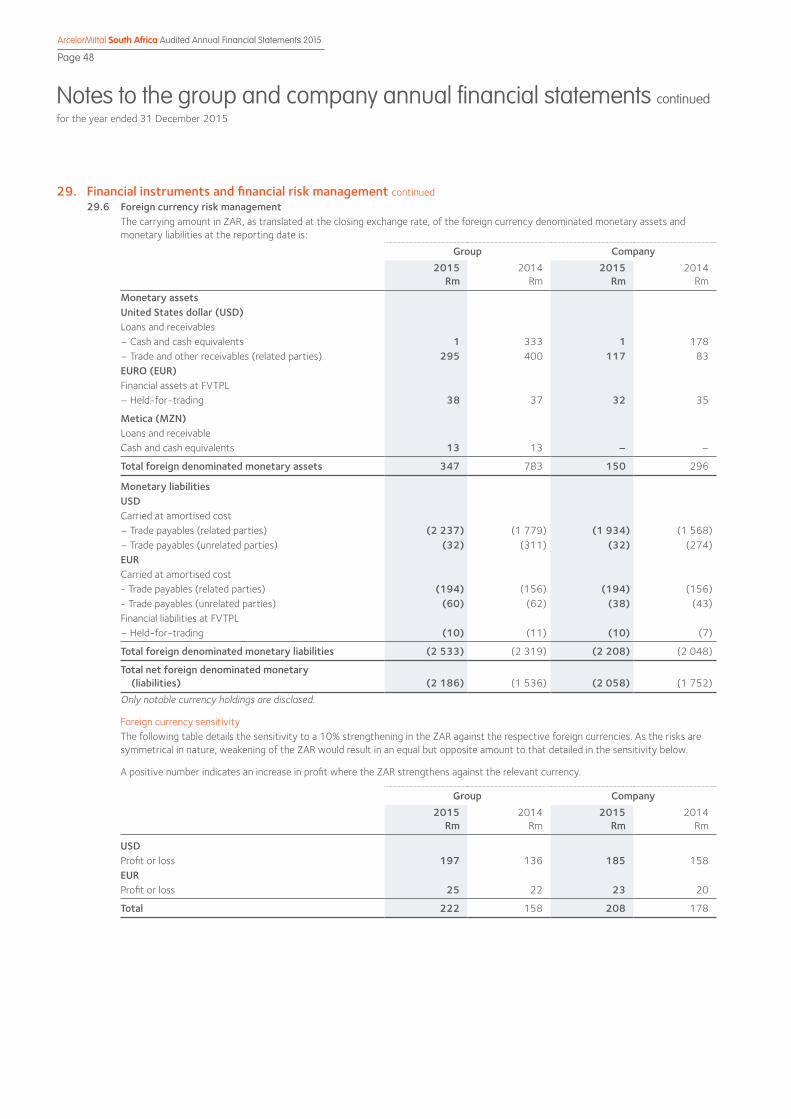
Notes to the group and company annual financial statements continuedfor the year ended 31 December 2015
ArcelorMittal South Africa Audited Annual Financial Statements 2015
Page 48
29. Financial instruments and financial risk management continued29.6 Foreign currency risk management
The carrying amount in ZAR, as translated at the closing exchange rate, of the foreign currency denominated monetary assets and monetary liabilities at the reporting date is:
Group Company2015
Rm2014
Rm 2015
Rm 2014
Rm
Monetary assetsUnited States dollar (USD)Loans and receivables– Cash and cash equivalents 1 333 1 178 – Trade and other receivables (related parties) 295 400 117 83 EURO (EUR)Financial assets at FVTPL– Held-for-trading 38 37 32 35
Metica (MZN)Loans and receivableCash and cash equivalents 13 13 – –
Total foreign denominated monetary assets 347 783 150 296
Monetary liabilitiesUSDCarried at amortised cost– Trade payables (related parties) (2 237) (1 779) (1 934) (1 568)– Trade payables (unrelated parties) (32) (311) (32) (274)EURCarried at amortised cost- Trade payables (related parties) (194) (156) (194) (156)- Trade payables (unrelated parties) (60) (62) (38) (43)Financial liabilities at FVTPL– Held-for-trading (10) (11) (10) (7)
Total foreign denominated monetary liabilities (2 533) (2 319) (2 208) (2 048)
Total net foreign denominated monetary (liabilities) (2 186) (1 536) (2 058) (1 752)
Only notable currency holdings are disclosed.
Foreign currency sensitivityThe following table details the sensitivity to a 10% strengthening in the ZAR against the respective foreign currencies. As the risks are symmetrical in nature, weakening of the ZAR would result in an equal but opposite amount to that detailed in the sensitivity below.
A positive number indicates an increase in profit where the ZAR strengthens against the relevant currency.
Group Company2015
Rm2014
Rm 2015
Rm 2014
Rm
USDProfit or loss 197 136 185 158 EURProfit or loss 25 22 23 20
Total 222 158 208 178
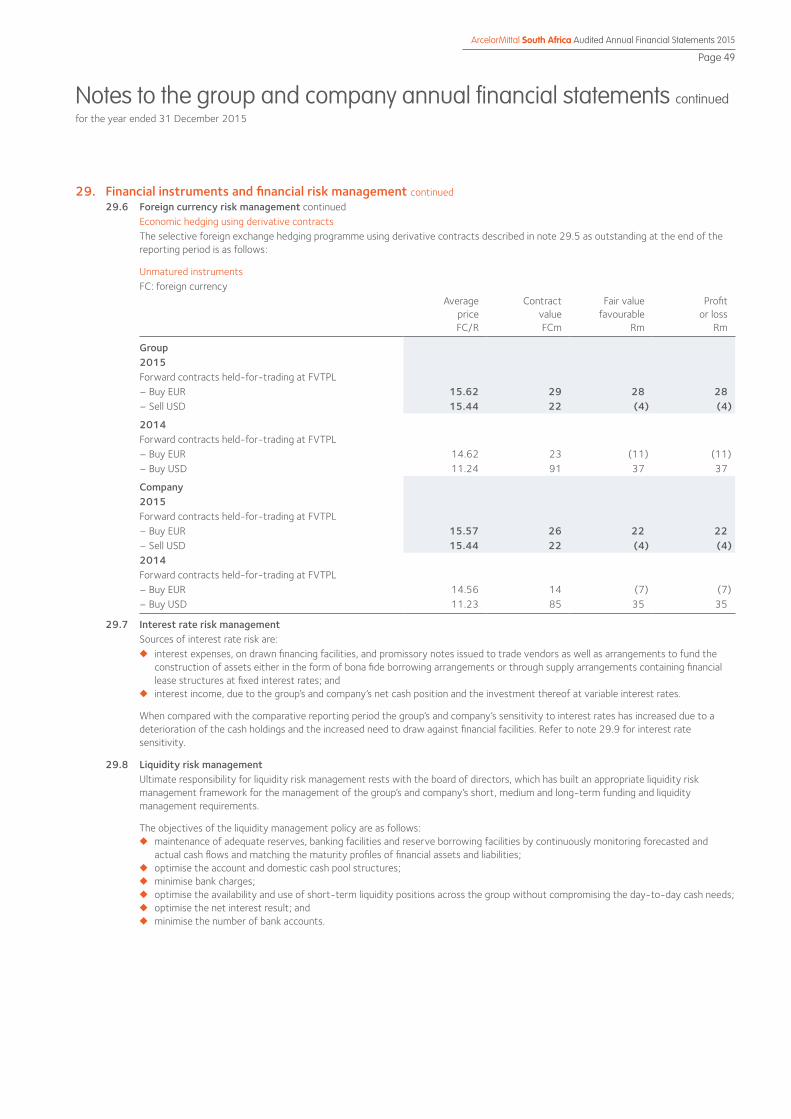
ArcelorMittal South Africa Audited Annual Financial Statements 2015
Page 49
Notes to the group and company annual financial statements continuedfor the year ended 31 December 2015
29. Financial instruments and financial risk management continued29.6 Foreign currency risk management continued
Economic hedging using derivative contractsThe selective foreign exchange hedging programme using derivative contracts described in note 29.5 as outstanding at the end of the reporting period is as follows:
Unmatured instrumentsFC: foreign currency
Average priceFC/R
Contract value FCm
Fair value favourable
Rm
Profit or loss
Rm
Group2015Forward contracts held-for-trading at FVTPL – Buy EUR 15.62 29 28 28 – Sell USD 15.44 22 (4) (4)
2014Forward contracts held-for-trading at FVTPL – Buy EUR 14.62 23 (11) (11)– Buy USD 11.24 91 37 37
Company2015Forward contracts held-for-trading at FVTPL – Buy EUR 15.57 26 22 22 – Sell USD 15.44 22 (4) (4)2014Forward contracts held-for-trading at FVTPL – Buy EUR 14.56 14 (7) (7)– Buy USD 11.23 85 35 35
29.7 Interest rate risk managementSources of interest rate risk are:◆◆ interest expenses, on drawn financing facilities, and promissory notes issued to trade vendors as well as arrangements to fund the
construction of assets either in the form of bona fide borrowing arrangements or through supply arrangements containing financial lease structures at fixed interest rates; and
◆◆ interest income, due to the group’s and company’s net cash position and the investment thereof at variable interest rates.
When compared with the comparative reporting period the group’s and company’s sensitivity to interest rates has increased due to a deterioration of the cash holdings and the increased need to draw against financial facilities. Refer to note 29.9 for interest rate sensitivity.
29.8 Liquidity risk managementUltimate responsibility for liquidity risk management rests with the board of directors, which has built an appropriate liquidity risk management framework for the management of the group’s and company’s short, medium and long-term funding and liquidity management requirements.
The objectives of the liquidity management policy are as follows:◆◆ maintenance of adequate reserves, banking facilities and reserve borrowing facilities by continuously monitoring forecasted and
actual cash flows and matching the maturity profiles of financial assets and liabilities;◆◆ optimise the account and domestic cash pool structures;◆◆ minimise bank charges;◆◆ optimise the availability and use of short-term liquidity positions across the group without compromising the day-to-day cash needs;◆◆ optimise the net interest result; and◆◆ minimise the number of bank accounts.
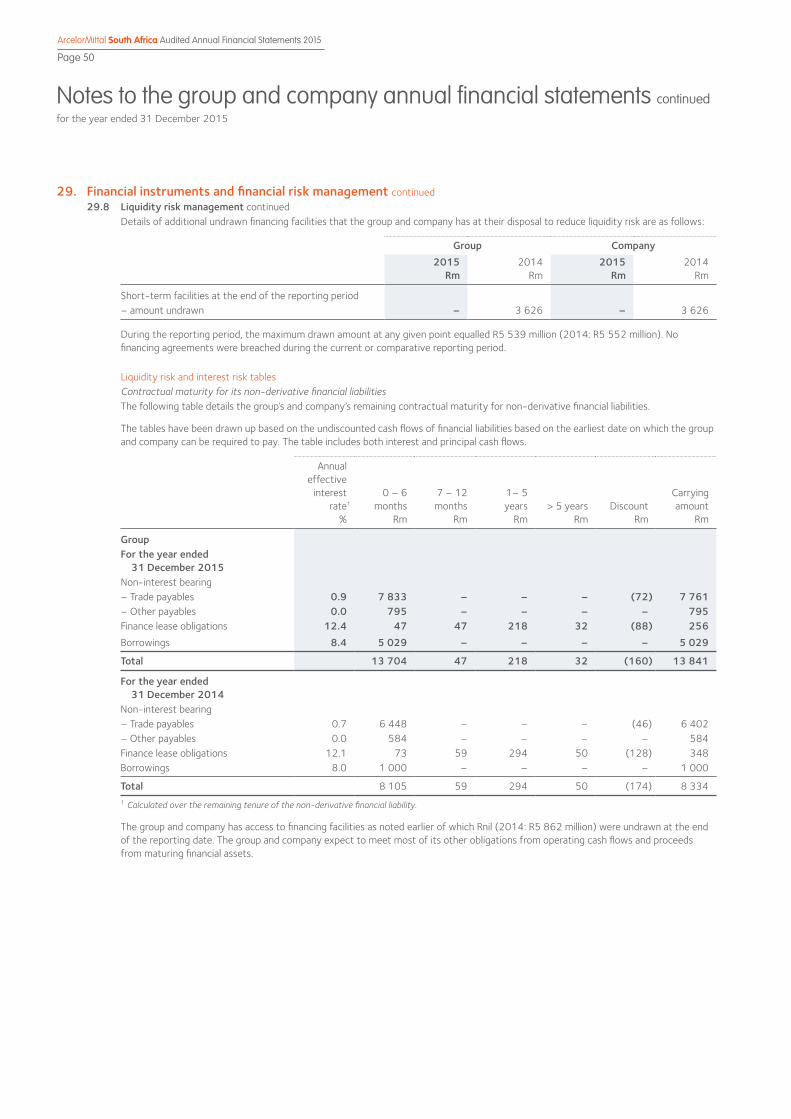
Notes to the group and company annual financial statements continuedfor the year ended 31 December 2015
ArcelorMittal South Africa Audited Annual Financial Statements 2015
Page 50
29. Financial instruments and financial risk management continued29.8 Liquidity risk management continued
Details of additional undrawn financing facilities that the group and company has at their disposal to reduce liquidity risk are as follows:
Group Company2015
Rm2014
Rm 2015
Rm 2014
Rm
Short-term facilities at the end of the reporting period– amount undrawn – 3 626 – 3 626
During the reporting period, the maximum drawn amount at any given point equalled R5 539 million (2014: R5 552 million). No financing agreements were breached during the current or comparative reporting period.
Liquidity risk and interest risk tablesContractual maturity for its non-derivative financial liabilitiesThe following table details the group’s and company’s remaining contractual maturity for non-derivative financial liabilities.
The tables have been drawn up based on the undiscounted cash flows of financial liabilities based on the earliest date on which the group and company can be required to pay. The table includes both interest and principal cash flows.
Annual effective
interest rate1
%
0 – 6 months
Rm
7 – 12 months
Rm
1– 5 years
Rm > 5 years
Rm Discount
Rm
Carrying amount
Rm
GroupFor the year ended 31 December 2015Non-interest bearing– Trade payables 0.9 7 833 – – – (72) 7 761– Other payables 0.0 795 – – – – 795 Finance lease obligations 12.4 47 47 218 32 (88) 256 Borrowings 8.4 5 029 – – – – 5 029
Total 13 704 47 218 32 (160) 13 841
For the year ended 31 December 2014Non-interest bearing– Trade payables 0.7 6 448 – – – (46) 6 402 – Other payables 0.0 584 – – – – 584 Finance lease obligations 12.1 73 59 294 50 (128) 348 Borrowings 8.0 1 000 – – – – 1 000
Total 8 105 59 294 50 (174) 8 334 1 Calculated over the remaining tenure of the non-derivative financial liability.
The group and company has access to financing facilities as noted earlier of which Rnil (2014: R5 862 million) were undrawn at the end of the reporting date. The group and company expect to meet most of its other obligations from operating cash flows and proceeds from maturing financial assets.

ArcelorMittal South Africa Audited Annual Financial Statements 2015
Page 51
Notes to the group and company annual financial statements continuedfor the year ended 31 December 2015
29. Financial instruments and financial risk management continued29.8 Liquidity risk management continued
Liquidity risk and interest risk tables continuedContractual maturity for its non-derivative financial liabilities continued
Annual effective
interest rate1
%
0 – 6 months
Rm
7 – 12 months
Rm
1– 5 years
Rm > 5 years
Rm Discount
Rm
Carrying amount
Rm
CompanyFor the year ended 31 December 2015Non-interest bearing– Trade payables 1.1 6 659 – – – (72) 6 587– Other payables 0.0 784 – – – – 784Finance lease obligations 10.7 32 32 127 – (35) 156 Borrowings 8.4 5 029 – – – – 5 029
Total 12 504 32 127 – (107) 12 556
For the year ended 31 December 2014Non-interest bearing– Trade payables 0.9 5 431 – – – (46) 5 385 – Other payables 0.0 579 – – – - 579 Finance lease obligations 10.2 58 44 191 – (58) 235 Borrowings 8.0 1 000 – – – – 1 000
Total 7 068 44 191 – (104) 7 199 1 Calculated over the remaining tenure of the non-derivative financial liability.
Liquidity risk and interest risk tablesExpected maturity of non-derivative financial assetsThe following table details the group and company’s expected maturity for non-derivative financial assets.
The tables below have been drawn up based on the undiscounted contractual maturities of the financial assets including interest that will be earned on those assets.
Annual effective
interest rate1
%
0 – 6 months
Rm
7 – 12 months
Rm
1– 5 years
Rm > 5 years
Rm Discount
Rm
Carrying amount
Rm
GroupFor the year ended 31 December 2015Non-interest bearing– Trade and other receivables2 0.5 1 455 – – – (7) 1 448Fixed and variable interest rate cash holdings
– Cash and bank balances3 0.4 2 164 – – – – 2 164
Total 3 619 – – – (7) 3 612
For the year ended 31 December 2014Non-interest bearing– Trade and other receivables2 0.7 1 338 – – – (9) 1 329 Fixed and variable interest rate cash holdings
– Cash and bank balances3 1.3 454 – – – – 454
Total 1 792 – – – (9) 1 783 1 Calculated over the remaining tenure of the non-derivative financial asset.2 Fixed-rate interest applicable on overdue accounts.3 Fixed and variable rates applicable to call and short-term deposit holdings. Maturity profile reflects the synthesised availability of the cash bank balances
on hand at the end of the reporting period, and the expected annual interest income to be earned thereon.

Notes to the group and company annual financial statements continuedfor the year ended 31 December 2015
ArcelorMittal South Africa Audited Annual Financial Statements 2015
Page 52
29. Financial instruments and financial risk management continued29.8 Liquidity risk management continued
Liquidity risk and interest risk tables continuedExpected maturity of non-derivative financial assets continued
Annual effective
interest rate1
%
0 – 6 months
Rm
7 – 12 months
Rm
1– 5 years
Rm > 5 years
Rm Discount
Rm
Carrying amount
Rm
CompanyFor the year ended 31 December 2015Non-interest bearing– Trade and other receivables2 0.6 1 198 – – – (7) 1 191 Fixed and variable interest rate cash holdings– Cash and bank balances3 0.4 2 150 – – – – 2 150
Total 3 348 – – – (7) 3 341
For the year ended 31 December 2014Non-interest bearing– Trade and other receivables2 1.0 884 – – – (9) 875 Fixed and variable interest rate cash holdings– Cash and bank balances3 1.3 285 – – – – 285
Total 1 169 – – – (9) 1 160 1 Calculated over the remaining tenure of the non-derivative financial asset.2 Fixed-rate interest applicable on overdue accounts.3 Fixed and variable rates applicable to call and short-term deposit holdings. Maturity profile reflects the synthesised availability of the cash bank balances
on hand at the end of the reporting period, and the expected annual interest income to be earned thereon.
Derivative financial instrumentsThe following table details the liquidity analysis for derivative financial instruments.
The table has been drawn up based on the undiscounted net cash inflows/(outflows) on the derivative instruments that settle on a net cash-settled basis. When the amount payable or receivable is not fixed, the amount disclosed has been determined by reference to the projected interest rate and foreign currency forward curves existing at the reporting date.
0 – 6 months
Rm
7 – 12 months
Rm
1– 5 years
Rm > 5 years
Rm Discount
Rm
Carrying amount
Rm
Financial assetsGroupFor the year ended 31 December 2015Net cash-settled foreign currency derivatives 20 18 – – – 38
Total 20 18 – – – 38
For the year ended 31 December 2014Net cash-settled foreign currency derivatives 37 – – – – 37
Total 37 – – – – 37
CompanyFor the year ended 31 December 2015Net cash-settled foreign currency derivatives 13 19 – – – 32
Total 13 19 – – – 32
For the year ended 31 December 2014Net cash-settled foreign currency derivatives 35 – – – – 35
Total 35 – – – – 35

ArcelorMittal South Africa Audited Annual Financial Statements 2015
Page 53
Notes to the group and company annual financial statements continuedfor the year ended 31 December 2015
29. Financial instruments and financial risk management continued29.8 Liquidity risk management continued
Liquidity risk and interest risk tables continuedDerivative financial instruments continued
0 – 6 months
Rm
7 – 12 months
Rm
1– 5 years
Rm > 5 years
Rm Discount
Rm
Carrying amount
Rm
Financial liabilitiesGroupFor the year ended 31 December 2015Net cash-settled foreign currency derivatives 5 9 – – – 14
Total 5 9 – – – 14
For the year ended 31 December 2014Net cash-settled foreign currency derivatives 9 2 – – – 11
Total 9 2 – – – 11
CompanyFor the year ended 31 December 2015Net cash-settled foreign currency derivatives 5 9 – – – 14
Total 5 9 – – – 14
For the year ended 31 December 2014Net cash-settled foreign currency derivatives 7 – – – – 7
Total 7 – – – – 7
29.9 Capital risk managementThe group and company objectives when managing capital are: ◆◆ to safeguard the ability to continue as a going concern, so as to be able to continue to provide returns for shareholders and benefits
for other stakeholders; and◆◆ to provide an adequate return to shareholders by pricing products and services commensurate with the level of risk.
The amount of capital is set in proportion to risk. The capital structure is managed and adjusted in light of changes in economic conditions within the domestic and global steel industry and the risk characteristics of the underlying assets.
The group and company overall strategy remained unchanged in 2015.
Consistent with others in the industry, the group and company monitor capital on a debt-to-total shareholders’ equity basis.
Net debt is total interest-bearing borrowings including finance lease obligations less cash and cash equivalents. Total shareholders’ equity is as per the statement of financial position.
Group Company2015
Rm2014
Rm 2015
Rm 2014
Rm
Cash and bank balances 2 164 454 2 150 285 Interest-bearing borrowings, bank overdraft and finance lease obligations (5 285) (1 348) (5 185) (1 235)Net debt (3 121) (894) (3 035) (950)Total shareholders’ equity 13 472 20 722 9 147 17 963 Gearing ratio (%) 23.17 4.31 33.18 5.29
Estimated impact on profit and loss based on a 100 basis point change in interest rate
– 100 basis point increase (31.21) (8.94) (30.35) (9.5)
– 100 basis point decrease 31.21 8.94 30.35 9.5
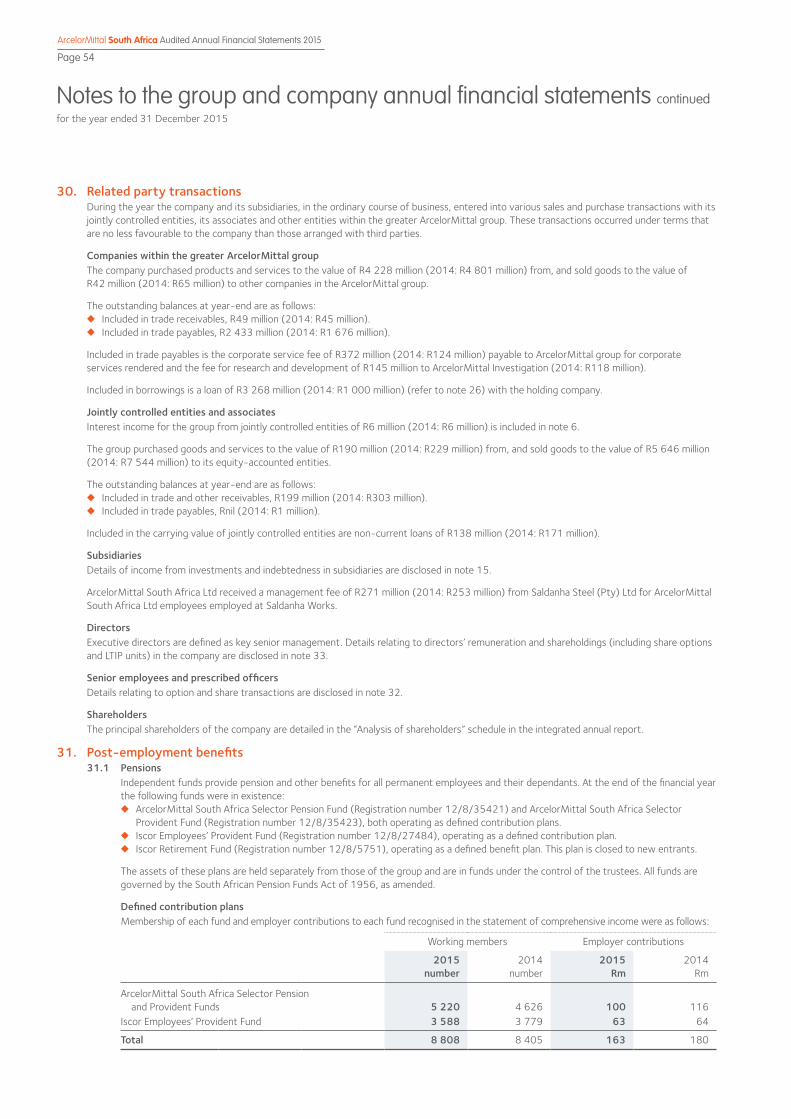
Notes to the group and company annual financial statements continuedfor the year ended 31 December 2015
ArcelorMittal South Africa Audited Annual Financial Statements 2015
Page 54
30. Related party transactions During the year the company and its subsidiaries, in the ordinary course of business, entered into various sales and purchase transactions with its jointly controlled entities, its associates and other entities within the greater ArcelorMittal group. These transactions occurred under terms that are no less favourable to the company than those arranged with third parties.
Companies within the greater ArcelorMittal groupThe company purchased products and services to the value of R4 228 million (2014: R4 801 million) from, and sold goods to the value of R42 million (2014: R65 million) to other companies in the ArcelorMittal group.
The outstanding balances at year-end are as follows: ◆◆ Included in trade receivables, R49 million (2014: R45 million).◆◆ Included in trade payables, R2 433 million (2014: R1 676 million).
Included in trade payables is the corporate service fee of R372 million (2014: R124 million) payable to ArcelorMittal group for corporate services rendered and the fee for research and development of R145 million to ArcelorMittal Investigation (2014: R118 million).
Included in borrowings is a loan of R3 268 million (2014: R1 000 million) (refer to note 26) with the holding company.
Jointly controlled entities and associatesInterest income for the group from jointly controlled entities of R6 million (2014: R6 million) is included in note 6.
The group purchased goods and services to the value of R190 million (2014: R229 million) from, and sold goods to the value of R5 646 million (2014: R7 544 million) to its equity-accounted entities.
The outstanding balances at year-end are as follows:◆◆ Included in trade and other receivables, R199 million (2014: R303 million).◆◆ Included in trade payables, Rnil (2014: R1 million).
Included in the carrying value of jointly controlled entities are non-current loans of R138 million (2014: R171 million).
SubsidiariesDetails of income from investments and indebtedness in subsidiaries are disclosed in note 15.
ArcelorMittal South Africa Ltd received a management fee of R271 million (2014: R253 million) from Saldanha Steel (Pty) Ltd for ArcelorMittal South Africa Ltd employees employed at Saldanha Works.
DirectorsExecutive directors are defined as key senior management. Details relating to directors’ remuneration and shareholdings (including share options and LTIP units) in the company are disclosed in note 33.
Senior employees and prescribed officersDetails relating to option and share transactions are disclosed in note 32.
ShareholdersThe principal shareholders of the company are detailed in the “Analysis of shareholders” schedule in the integrated annual report.
31. Post-employment benefits31.1 Pensions
Independent funds provide pension and other benefits for all permanent employees and their dependants. At the end of the financial year the following funds were in existence:◆◆ ArcelorMittal South Africa Selector Pension Fund (Registration number 12/8/35421) and ArcelorMittal South Africa Selector
Provident Fund (Registration number 12/8/35423), both operating as defined contribution plans.◆◆ Iscor Employees’ Provident Fund (Registration number 12/8/27484), operating as a defined contribution plan.◆◆ Iscor Retirement Fund (Registration number 12/8/5751), operating as a defined benefit plan. This plan is closed to new entrants.
The assets of these plans are held separately from those of the group and are in funds under the control of the trustees. All funds are governed by the South African Pension Funds Act of 1956, as amended.
Defined contribution plansMembership of each fund and employer contributions to each fund recognised in the statement of comprehensive income were as follows:
Working members Employer contributions
2015number
2014number
2015Rm
2014Rm
ArcelorMittal South Africa Selector Pension and Provident Funds 5 220 4 626 100 116 Iscor Employees’ Provident Fund 3 588 3 779 63 64
Total 8 808 8 405 163 180
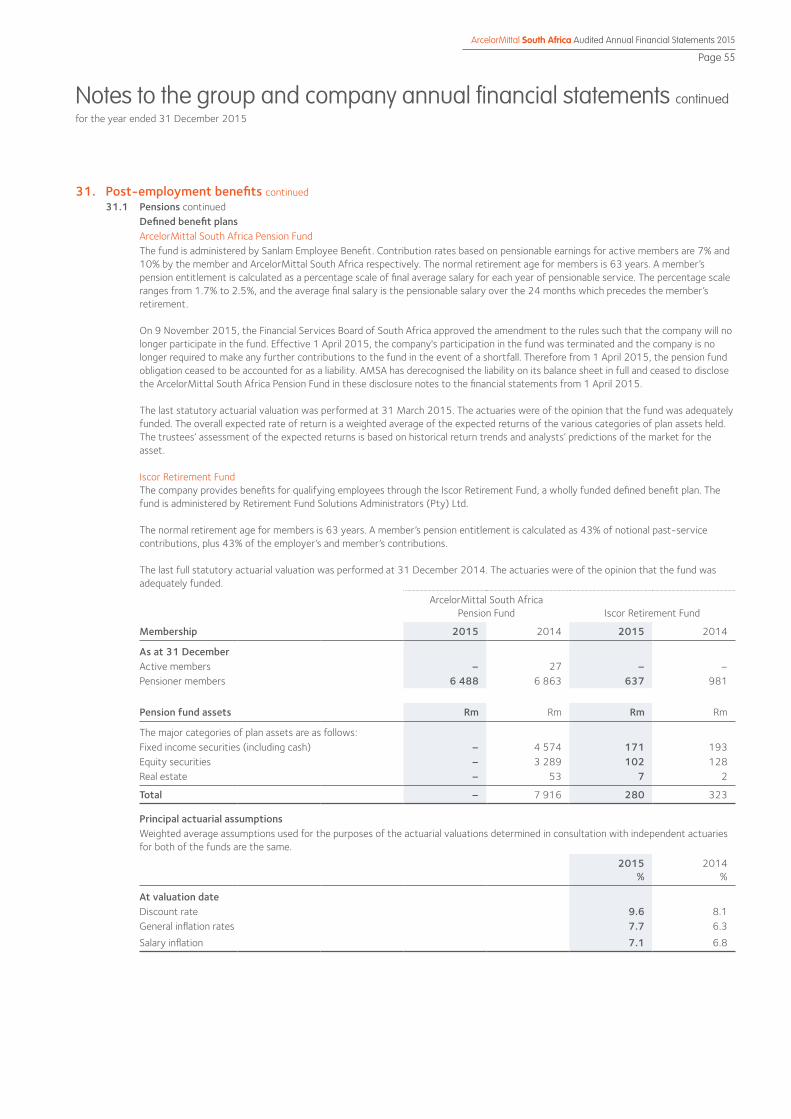
ArcelorMittal South Africa Audited Annual Financial Statements 2015
Page 55
Notes to the group and company annual financial statements continuedfor the year ended 31 December 2015
31. Post-employment benefits continued31.1 Pensions continued
Defined benefit plansArcelorMittal South Africa Pension FundThe fund is administered by Sanlam Employee Benefit. Contribution rates based on pensionable earnings for active members are 7% and 10% by the member and ArcelorMittal South Africa respectively. The normal retirement age for members is 63 years. A member’s pension entitlement is calculated as a percentage scale of final average salary for each year of pensionable service. The percentage scale ranges from 1.7% to 2.5%, and the average final salary is the pensionable salary over the 24 months which precedes the member’s retirement.
On 9 November 2015, the Financial Services Board of South Africa approved the amendment to the rules such that the company will no longer participate in the fund. Effective 1 April 2015, the company's participation in the fund was terminated and the company is no longer required to make any further contributions to the fund in the event of a shortfall. Therefore from 1 April 2015, the pension fund obligation ceased to be accounted for as a liability. AMSA has derecognised the liability on its balance sheet in full and ceased to disclose the ArcelorMittal South Africa Pension Fund in these disclosure notes to the financial statements from 1 April 2015.
The last statutory actuarial valuation was performed at 31 March 2015. The actuaries were of the opinion that the fund was adequately funded. The overall expected rate of return is a weighted average of the expected returns of the various categories of plan assets held. The trustees’ assessment of the expected returns is based on historical return trends and analysts’ predictions of the market for the asset.
Iscor Retirement Fund The company provides benefits for qualifying employees through the Iscor Retirement Fund, a wholly funded defined benefit plan. The fund is administered by Retirement Fund Solutions Administrators (Pty) Ltd.
The normal retirement age for members is 63 years. A member’s pension entitlement is calculated as 43% of notional past-service contributions, plus 43% of the employer’s and member’s contributions.
The last full statutory actuarial valuation was performed at 31 December 2014. The actuaries were of the opinion that the fund was adequately funded.
ArcelorMittal South Africa Pension Fund Iscor Retirement Fund
Membership 2015 2014 2015 2014
As at 31 DecemberActive members – 27 – –Pensioner members 6 488 6 863 637 981
Pension fund assets Rm Rm Rm Rm
The major categories of plan assets are as follows:Fixed income securities (including cash) – 4 574 171 193 Equity securities – 3 289 102 128 Real estate – 53 7 2
Total – 7 916 280 323
Principal actuarial assumptionsWeighted average assumptions used for the purposes of the actuarial valuations determined in consultation with independent actuaries for both of the funds are the same.
2015 %
2014%
At valuation dateDiscount rate 9.6 8.1 General inflation rates 7.7 6.3
Salary inflation 7.1 6.8
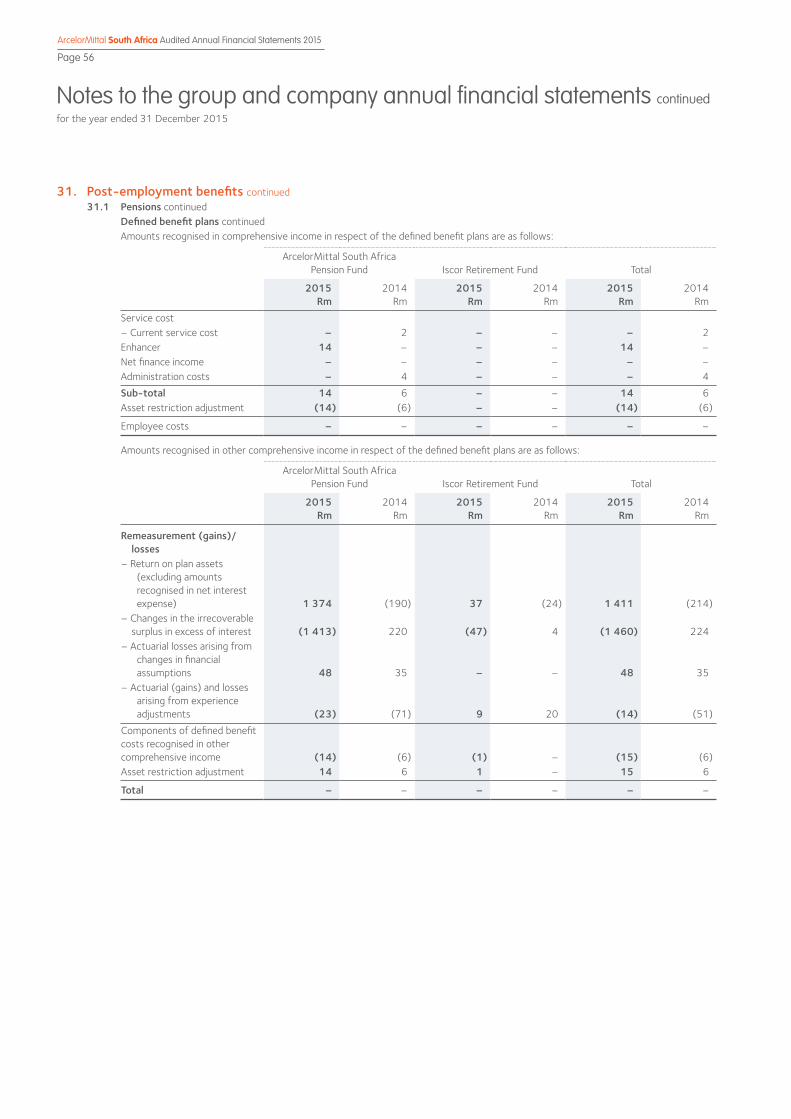
Notes to the group and company annual financial statements continuedfor the year ended 31 December 2015
ArcelorMittal South Africa Audited Annual Financial Statements 2015
Page 56
31. Post-employment benefits continued31.1 Pensions continued
Defined benefit plans continuedAmounts recognised in comprehensive income in respect of the defined benefit plans are as follows:
ArcelorMittal South Africa Pension Fund Iscor Retirement Fund Total
2015Rm
2014Rm
2015Rm
2014Rm
2015Rm
2014Rm
Service cost– Current service cost – 2 – – – 2 Enhancer 14 – – – 14 –Net finance income – – – – – –Administration costs – 4 – – – 4
Sub-total 14 6 – – 14 6 Asset restriction adjustment (14) (6) – – (14) (6)
Employee costs – – – – – –
Amounts recognised in other comprehensive income in respect of the defined benefit plans are as follows:
ArcelorMittal South Africa Pension Fund Iscor Retirement Fund Total
2015Rm
2014Rm
2015Rm
2014Rm
2015 Rm
2014Rm
Remeasurement (gains)/ losses– Return on plan assets (excluding amounts recognised in net interest expense) 1 374 (190) 37 (24) 1 411 (214)– Changes in the irrecoverable surplus in excess of interest (1 413) 220 (47) 4 (1 460) 224 – Actuarial losses arising from changes in financial assumptions 48 35 – – 48 35 – Actuarial (gains) and losses arising from experience adjustments (23) (71) 9 20 (14) (51)
Components of defined benefit costs recognised in other comprehensive income (14) (6) (1) – (15) (6)Asset restriction adjustment 14 6 1 – 15 6
Total – – – – – –

ArcelorMittal South Africa Audited Annual Financial Statements 2015
Page 57
Notes to the group and company annual financial statements continuedfor the year ended 31 December 2015
31. Post-employment benefits continued31.1 Pensions continued
Defined benefit plans continuedReconciliation of the funded status to amounts recognised in the statement of financial position
ArcelorMittal South Africa Pension Fund Iscor Retirement Fund Total
2015Rm
2014Rm
2015Rm
2014Rm
2015Rm
2014Rm
For the year ended 31 DecemberProjected benefit obligation – 6 532 233 251 233 6 783 Fair value of plan assets – (7 916) (280) (337) (280) (8 253)
Surplus – (1 384) (47) (86) (47) (1 470)Asset restriction adjustment1 – 1 384 47 86 47 1 470
Net (asset)/liability recognised – – – – – –1 Fund rules do not give the employer an unconditional right to the surplus in the fund.
Movement in present value of benefit obligation
ArcelorMittal South Africa Pension Fund Iscor Retirement Fund Total
2015Rm
2014Rm
2015Rm
2014Rm
2015Rm
2014Rm
For the year ended 31 DecemberProjected benefit obligation at the beginning of the year 6 532 6 784 251 252 6 783 7 036 Interest cost 124 535 19 20 143 555 Current service cost – 2 – – – 2 Benefits paid (189) (753) (46) (41) (235) (794)Enhancer 14 – – – 14 –Derecognition of fund (6 506) – – – (6 506) –Remeasurement (gains)/losses– Actuarial losses arising from changes in financial assumptions 48 35 – – 48 35 – Actuarial (gains) and losses arising from experience adjustments (23) (71) 9 20 (14) (51)
Projected benefit obligation at the end of the year – 6 532 233 251 233 6 783

Notes to the group and company annual financial statements continuedfor the year ended 31 December 2015
ArcelorMittal South Africa Audited Annual Financial Statements 2015
Page 58
31. Post-employment benefits continued31.1 Pensions continued
Defined benefit plans continuedMovement in present value of plan assets
ArcelorMittal South Africa Pension Fund Iscor Retirement Fund Total
2015Rm
2014Rm
2015Rm
2014Rm
2015Rm
2014Rm
For the year ended 31 DecemberFair value of plan assets at the beginning of the year 7 916 7 857 337 328 8 253 8 185 Interest income on plan assets 153 625 26 26 179 651 Expected return (1 418) 190 (41) 24 (1 459) 214 Contributions – employer – 1 – – – 1 Administration cost of plan assets – (4) – – – (4)Benefits paid (189) (753) (46) (41) (235) (794)Derecognition of fund (6 506) – – – (6 506) –Actuarial gains 44 – 4 – 48 –
Fair value of plan assets at the end of the year – 7 916 280 337 280 8 253
The plan assets of the ArcelorMittal South Africa Pension Fund include ordinary shares of ArcelorMittal South Africa with a fair value of Rnil (2014: Rnil). The Iscor Retirement Fund has no direct shareholding in ArcelorMittal South Africa Ltd.
ContributionsFunding is based on the actuarially determined contributions. The expected pension contributions for the 2015 financial year are Rnil (2014: R1 million) to the ArcelorMittal South Africa Pension Fund and Rnil (2014: Rnil) to the Iscor Retirement Fund.
Sensitivity analysis2015ArcelorMittal South Africa Pension Fund
Expected longevity
Salary inflation
Salary inflation
Discount rate
Discount rate
Percentage increase/(decrease) (%) 1 (1) 1 (1)Increase by number of years 1
Ending net surplus – – – – –
Iscor Retirement Fund Expected longevity
Discount rate
Discount rate
Percentage increase/(decrease) (%) (1) 1 Increase by number of years 1
Ending net surplus/(deficit) 1 (1) 1
31.2 Medical benefitsThe company contributes to medical aid schemes for the benefit of retired employees and their dependants, where those qualifying retirees accepted early retirement in 1994. At 31 December 2015 there were 27 qualifying retirees (2014: 27).
On the basis of current practice, which is reviewed annually, the group provides for the actuarially determined present value of post-retirement medical aid obligations. These obligations are unfunded. The group has no further post-retirement medical aid obligations for current or retired employees.

ArcelorMittal South Africa Audited Annual Financial Statements 2015
Page 59
Notes to the group and company annual financial statements continuedfor the year ended 31 December 2015
32. Share-based paymentsEquity-settled share plan – local employeesLong-term incentive plan The long-term incentive plan (LTIP) was adopted for the first time in 2012. The LTIP scheme was designed to replace the existing equity-settled share option plan. An LTIP is a conditional award of company shares offered to eligible senior employees. The shares only vest after a predetermined period over which certain grant conditions must be met. The extent to which these grant conditions are met, governs the number of shares that vest.
The number of LTIP shares granted is calculated in accordance with the employees grading within the group and is approved by the board, remuneration, social and ethics committee.
Designated members of the executive committee and senior management are eligible for participation in the scheme. LTIP shares granted to senior management will vest after three years. LTIP to the executive committee members only vest after three years provided that the prescribed performance conditions are met. Senior management receive shares subject to ongoing employment and individual performance. New grants to senior management since 2015 will also vest depending on ongoing employment, prescribed performance conditions and individual performance conditions. Proportionate awards will be made in the event of change of effective control of the company, retrenchment, retirement or death.
Upon vesting of the award, the company shall deliver the number of shares that have vested to the participating employee. The unvested units carry neither rights to dividends nor voting rights until the date of vesting.
The fair value of each equity-settled unit is determined using the market value at measurement date.
ArcelorMittal South Africa Share Option PlanThe group and company operate the Management Share Trust, consisting of an option share plan for the benefit of the group’s and company’s senior management including executive directors.
This scheme was effective from 12 December 2005 to 2014. Share options are offered at market prices on the grant date and are released in three annual tranches of 33.3%, 33.3% and 33.4% respectively, commencing on the first anniversary of the offer date and expiring after 10 years. This is an open plan.
The option plans are equity-settled as each share option converts into one ordinary share of ArcelorMittal South Africa Ltd on exercise. The options carry neither rights to dividends nor voting rights. Options may be exercised at any time from the date of vesting to the date of their expiry.
The number of options granted is calculated in accordance with employees’ role grading within the company and group as approved by the remuneration committee of ArcelorMittal South Africa and as incorporated within the trust deed of the Management Share Trust. Upon resignation, the share options lapse immediately. Upon death, the options lapse within six months.
There were no share option grants made in 2015 or 2014 and as at 31 December 2015, all share options had vested.
Employee share ownership plan (ESOP)On 1 October 2015 the employee share ownership plan (ESOP) became effective. 21 million shares were granted to qualifying employees that will vest after five years of continued service in the company. However 3 114 001 shares remain outstanding and have not yet become effective. All permanent employees who do not qualify for the company's LTIP programme, qualify to participate in the ESOP.
The employee share ownership plan is equity-settled. The relevant employees will, during the life span of the scheme, benefit proportionately in the dividends earned from the ArcelorMittal shares that will be the subject of the scheme.
There are no performance targets for vesting and qualifying employees are not required to pay any consideration to participate in the scheme. The only vesting requirement is five years continued employment in the company.
The administration of participant transactions of both the share option and the long-term incentive plans are outsourced to EOH Human Capital Solutions (Pty) Ltd, and the ESOP to Computershare Investor Services (Pty) Ltd.
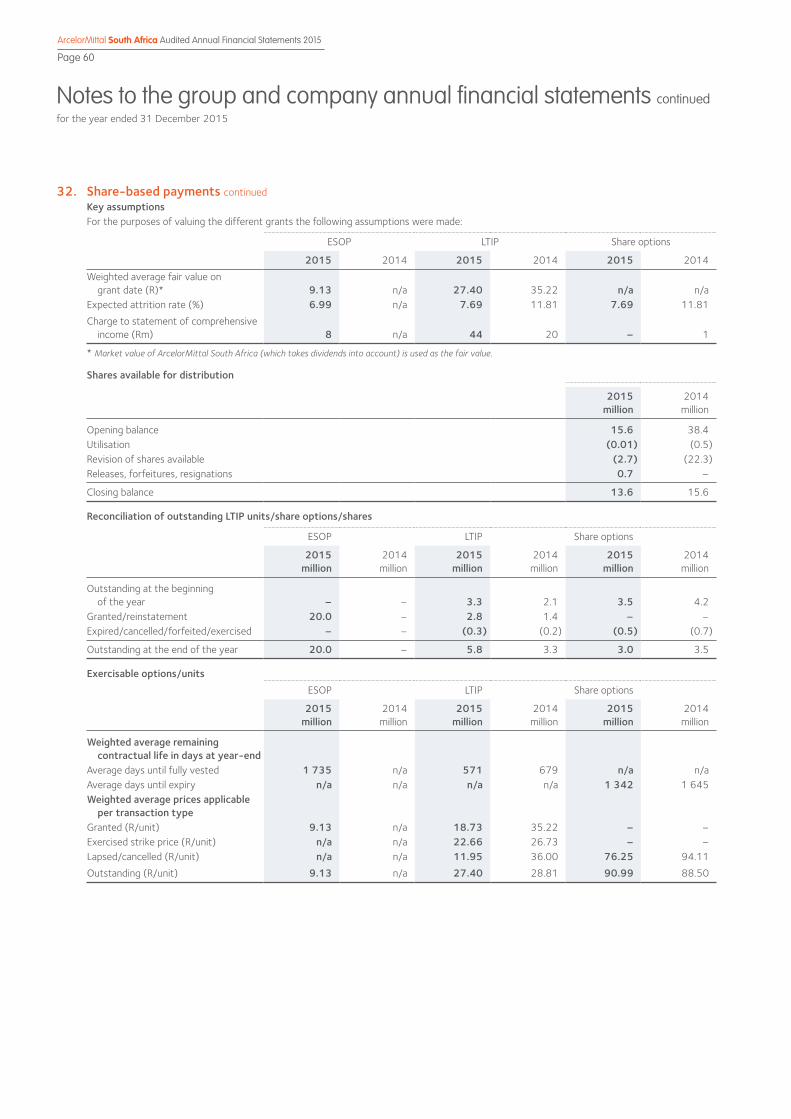
Notes to the group and company annual financial statements continuedfor the year ended 31 December 2015
ArcelorMittal South Africa Audited Annual Financial Statements 2015
Page 60
32. Share-based payments continuedKey assumptionsFor the purposes of valuing the different grants the following assumptions were made:
ESOP LTIP Share options
2015 2014 2015 2014 2015 2014
Weighted average fair value on grant date (R)* 9.13 n/a 27.40 35.22 n/a n/aExpected attrition rate (%) 6.99 n/a 7.69 11.81 7.69 11.81
Charge to statement of comprehensive income (Rm) 8 n/a 44 20 – 1
* Market value of ArcelorMittal South Africa (which takes dividends into account) is used as the fair value.
Shares available for distribution
2015million
2014million
Opening balance 15.6 38.4 Utilisation (0.01) (0.5)Revision of shares available (2.7) (22.3)Releases, forfeitures, resignations 0.7 –
Closing balance 13.6 15.6
Reconciliation of outstanding LTIP units/share options/shares
ESOP LTIP Share options
2015million
2014million
2015million
2014million
2015 million
2014million
Outstanding at the beginning of the year – – 3.3 2.1 3.5 4.2Granted/reinstatement 20.0 – 2.8 1.4 – –Expired/cancelled/forfeited/exercised – – (0.3) (0.2) (0.5) (0.7)
Outstanding at the end of the year 20.0 – 5.8 3.3 3.0 3.5
Exercisable options/unitsESOP LTIP Share options
2015million
2014million
2015million
2014million
2015 million
2014million
Weighted average remaining contractual life in days at year-end Average days until fully vested 1 735 n/a 571 679 n/a n/a Average days until expiry n/a n/a n/a n/a 1 342 1 645 Weighted average prices applicable per transaction typeGranted (R/unit) 9.13 n/a 18.73 35.22 – –Exercised strike price (R/unit) n/a n/a 22.66 26.73 – –Lapsed/cancelled (R/unit) n/a n/a 11.95 36.00 76.25 94.11
Outstanding (R/unit) 9.13 n/a 27.40 28.81 90.99 88.50

ArcelorMittal South Africa Audited Annual Financial Statements 2015
Page 61
Notes to the group and company annual financial statements continuedfor the year ended 31 December 2015
32. Share-based payments continuedDetails of outstanding options/LTIP units as at 31 December are as follows:
ESOP LTIP Share options
2015million
2014million
2015million
2014million
2015 million
2014million
Latest expiry date n/a n/a n/a n/a 2021 2021Exercise price range (R) n/a n/a n/a n/a 53.38 – 250 53.38 – 250 Number of outstanding units/options 19 661 883 n/a 5 757 312 3 253 100 2 987 965 3 500 415 Total proceeds to employees if exercised immediately (Rm)* 88 n/a 19 86 – –Total intrinsic value of out-of-the-money options (Rm)** n/a n/a – – (258) (217)
ArcelorMittal South Africa closing price at 31 December (R) 4.50 26.41 4.50 26.41 4.50 26.41
* Proceeds to employees should all options vest on 31 December.** Hypothetically, if all options were to vest on 31 December, all options are out of the money.
Terms of the options outstanding at the reporting date are as follows:
Options
Exercise price range
Outstanding numbers
Exercise price range
Outstanding numbers
2015R
2015Units
2014 R
2014Units
For year ended 31 DecemberExpiry date details2015 n/a n/a 53.38 224 3452016 54.19 – 83.88 387 218 54.19 – 83.88 422 8132017 62 – 140 479 466 97.72 – 140 453 3462018 73.75 – 250 423 968 73.75 – 250 488 9682019 95.5 – 121.50 416 490 95.5 – 121.50 477 0802020 77.88 – 85.1 23 300 76.88 – 85.1 28 6402021 59 – 87.20 1 257 523 59 – 87.20 1 405 223
Total 2 987 965 3 500 415
Restricted/performance stock unit planThe ArcelorMittal group commenced with the restricted/performance stock unit plan in 2011. The stock units are issued for the benefit of senior executives of the group. The restricted stock unit entitles the holder of the unit to receive one ArcelorMittal group share on or after the vesting date of the restricted stock unit, subject to the vesting conditions being met. Restricted stock units vest after three years of continued employment within the group. Performance stock units vest upon continued employment as well as specific performance conditions being met. This plan replaces the Executive International Mobility Share Option Plan. The charge to the group and company for the year amounted to R3 million (2014: R1.6 million).
Group and company 2015 2014
Latest vesting date18 December
201827 December
2016Number of units outstanding 58 850 51 525 Units fully vested 9 125 9 125 Weighted average fair value at grant date (USD) 11.17 12.42Average days until fully vested 539 842
Reconciliation of outstanding restricted stock units
Units Units
Outstanding at the beginning of the year 51 525 35 250 Granted 8 000 24 000 Transfers 31 250 (600)Exercised – (7 125)Expired/cancelled/forfeited (31 925) –
Outstanding at the end of the year 58 850 51 525

Notes to the group and company annual financial statements continuedfor the year ended 31 December 2015
ArcelorMittal South Africa Audited Annual Financial Statements 2015
Page 62
33. Remuneration of directors and prescribed officersThis is a summary of directors’ remuneration, prescribed officers and the highest paid senior employees (who are not directors) for services rendered to ArcelorMittal South Africa Ltd.
NotesSalary1
R
Retirement funding
R
Short-termincentives2
R
Equity incentives3
ROther4
R
Total remuneration
2015 R
Total remuneration
2014R
Executive directorsPS O'Flaherty 5 4 289 851 356 063 489 635 1 583 972 38 931 6 758 452 1 998 733 D Subramanian 6 892 598 78 237 – – 72 946 1 043 781 – MJ Wellhausen 7 570 084 – 313 000 89 467 225 096 1 197 647 5 711 060
Sub-total 5 752 533 434 300 802 635 1 673 439 336 973 8 999 880 7 709 793
Prescribed officers and highest paid employeesWA Nel 2 263 463 187 870 191 500 1 764 526 50 169 4 457 528 4 260 222 M Adam 8 2 385 391 197 990 – 290 663 1 685 832 4 559 876 – TG Nkosi 2 162 316 195 212 171 000 1 405 005 109 393 4 042 926 3 214 690 RH Torlage 2 111 644 179 177 135 500 891 478 158 417 3 476 216 3 721 679 KS Kumar 9 2 144 562 – 31 500 306 744 89 874 2 572 680 3 084 995 W Venter 10 1 555 184 129 082 3 000 433 519 110 849 2 231 634 – HL Rosenstock 11 917 082 – 27 300 153 372 285 902 1 383 656 3 921 492
Sub-total 13 539 642 889 331 559 800 5 245 307 2 490 436 22 724 516 18 203 078
Total 19 292 175 1 323 631 1 362 435 6 918 746 2 827 409 31 724 396 25 912 871
Directors’fees
R
Committeefees
ROther4
R
Total remuneration
2015R
Total remuneration
2014R
Non-executive directorsPM Makwana 1 262 800 – 10 295 1 273 095 1 190 610 DCG Murray 158 016 472 047 13 463 643 526 487 907 LP Mondi 158 016 172 381 – 330 397 269 346 NP Mnxasana 158 016 256 287 – 414 303 312 488 JRD Modise 158 016 413 650 4 289 575 955 387 112 FA du Plessis 12 87 630 147 196 59 680 294 506 479 949 NF Nicolau 13 49 665 80 034 1 431 131 130 –
Total 2 032 159 1 541 595 89 158 3 662 912 3 127 412
Directors’ remuneration is not paid to the non-executive directors in the employment of the ArcelorMittal group and have therefore not been disclosed in this note.
1 Salary represents cash salary earned by directors and prescribed officers. 2 The short-term incentives relate to benefits for the December 2014 financial year, paid in April 2015. 3 Further detail on the equity incentives can be found under directors’ unexercised share options and LTIPs in the table that follows. 4 Other includes separation payments, leave encashment, business travel claims and allowance, settlement allowance, housing benefits, international mobility
allowance, medical benefits, hardship allowance and sign-on incentives. 5 In December 2015, PS O'Flaherty announced his resignation as chief executive officer (CEO). It is proposed that PS O'Flaherty will be appointed as a non-executive
director with effect from 1 March 2016. A replacement will be announced once finalised. 6 D Subramanian was appointed on 1 August 2015 as chief financial officer. 7 MJ Wellhausen resigned as CFO and executive director effective on 15 March 2015. 8 M Adam was appointed on 16 February 2015 as general council and regulatory affairs. 9 KS Kumar resigned as chief marketing officer with effect from 1 March 2016.10 W Venter was appointed as chief technology officer on 1 July 2015.11 Dr HL Rosenstock resigned as chief operations officer on 30 June 2015.12 FA du Plessis resigned on 22 July 2015 as non-executive director.13 NF Nicolau was appointed as independent non-executive director on 10 September 2015.

ArcelorMittal South Africa Audited Annual Financial Statements 2015
Page 63
Notes to the group and company annual financial statements continuedfor the year ended 31 December 2015
33. Remuneration of directors and prescribed officers continued33.1 ArcelorMittal South Africa equity-settled share option and long-term incentive plans
The following table reflects unvested LTIPs held by executive directors, prescribed officers and the highest paid senior employees as at 31 December 2015:
Names of executives Award
type Award
date
Number ofallocations
at the start of
the year
Number ofallocations
made during
the year
Number ofallocations at the end
of the year
Number ofallocations
vested at theend of
the year
Issue price
(R)
Present value of
unvested share units
at the end of
the year (R)
PS O’Flaherty LTIP 05/08/2014 53 473 – 53 473 – 35.80 240 629 18/05/2015 – 330 801 330 801 – 18.73 1 488 605
53 473 330 801 384 274 – 1 729 233
WA Nel LTIP 14/11/2013 94 096 – 94 096 – 40.47 423 432 27/05/2014 81 263 – 81 263 – 34.89 365 684 18/05/2015 – 104 733 104 733 – 18.73 471 299
175 359 104 733 280 092 – 1 260 414
TG Nkosi LTIP 14/11/2013 84 728 – 84 728 – 40.47 381 276 27/05/2014 52 131 – 52 131 – 34.89 234 590 18/05/2015 – 79 857 79 857 – 18.73 359 357
136 859 79 857 216 716 – 975 222
RH Torlage LTIP 14/11/2013 21 304 – 21 304 – 40.47 95 86827/05/2014 51 669 – 51 669 – 34.89 232 511 18/05/2015 – 99 887 99 887 – 18.73 449 492
72 973 99 887 172 860 – 777 870
M Adam LTIP 18/05/2015 – 147 387 147 387 – 18.73 663 242
– 147 387 147 387 – 663 242
W Venter LTIP 10/12/2012 16 330 – 16 330 16 330 29.01 73 485 14/11/2013 12 770 – 12 770 – 40.47 57 465 27/05/2014 13 222 – 13 222 – 34.89 59 499 18/05/2015 – 20 255 20 255 – 18.73 91 148
42 322 20 255 62 577 16 330 281 597
Notes:Long-term incentive plan shares vest within three years.
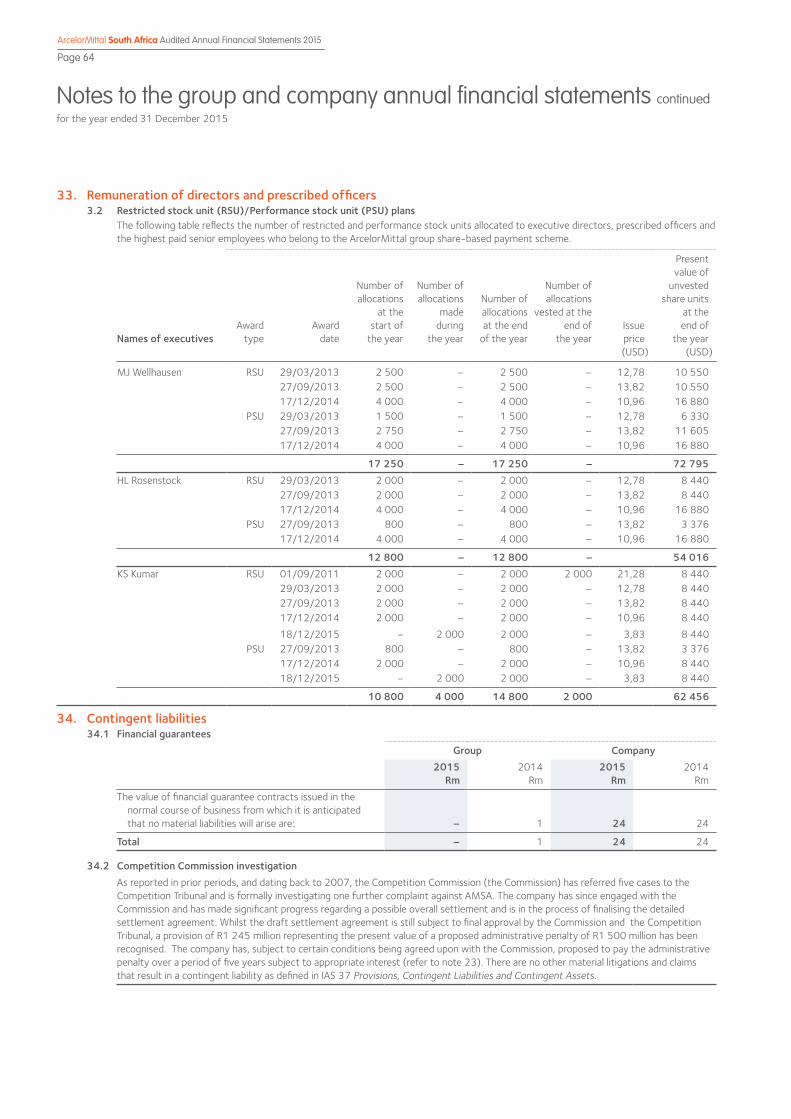
Notes to the group and company annual financial statements continuedfor the year ended 31 December 2015
ArcelorMittal South Africa Audited Annual Financial Statements 2015
Page 64
33. Remuneration of directors and prescribed officers3.2 Restricted stock unit (RSU)/Performance stock unit (PSU) plans
The following table reflects the number of restricted and performance stock units allocated to executive directors, prescribed officers and the highest paid senior employees who belong to the ArcelorMittal group share-based payment scheme.
Names of executives Award
type
Award date
Number ofallocations
at the start of
the year
Number ofallocations
made during
the year
Number ofallocations at the end
of the year
Number ofallocations
vested at theend of
the year
Issue price (USD)
Present value of
unvested share units
at the end of
the year (USD)
MJ Wellhausen RSU 29/03/2013 2 500 – 2 500 – 12,78 10 550 27/09/2013 2 500 – 2 500 – 13,82 10 550 17/12/2014 4 000 – 4 000 – 10,96 16 880
PSU 29/03/2013 1 500 – 1 500 – 12,78 6 330 27/09/2013 2 750 – 2 750 – 13,82 11 605 17/12/2014 4 000 – 4 000 – 10,96 16 880
17 250 – 17 250 – 72 795 HL Rosenstock RSU 29/03/2013 2 000 – 2 000 – 12,78 8 440
27/09/2013 2 000 – 2 000 – 13,82 8 440 17/12/2014 4 000 – 4 000 – 10,96 16 880
PSU 27/09/2013 800 – 800 – 13,82 3 376 17/12/2014 4 000 – 4 000 – 10,96 16 880
12 800 – 12 800 – 54 016 KS Kumar RSU 01/09/2011 2 000 – 2 000 2 000 21,28 8 440
29/03/2013 2 000 – 2 000 – 12,78 8 440 27/09/2013 2 000 – 2 000 – 13,82 8 440 17/12/2014 2 000 – 2 000 – 10,96 8 440
18/12/2015 – 2 000 2 000 – 3,83 8 440 PSU 27/09/2013 800 – 800 – 13,82 3 376
17/12/2014 2 000 – 2 000 – 10,96 8 440 18/12/2015 – 2 000 2 000 – 3,83 8 440
10 800 4 000 14 800 2 000 62 456
34. Contingent liabilities34.1 Financial guarantees
Group Company2015
Rm2014
Rm 2015
Rm 2014
Rm
The value of financial guarantee contracts issued in the normal course of business from which it is anticipated that no material liabilities will arise are: – 1 24 24
Total – 1 24 24
34.2 Competition Commission investigationAs reported in prior periods, and dating back to 2007, the Competition Commission (the Commission) has referred five cases to the Competition Tribunal and is formally investigating one further complaint against AMSA. The company has since engaged with the Commission and has made significant progress regarding a possible overall settlement and is in the process of finalising the detailed settlement agreement. Whilst the draft settlement agreement is still subject to final approval by the Commission and the Competition Tribunal, a provision of R1 245 million representing the present value of a proposed administrative penalty of R1 500 million has been recognised. The company has, subject to certain conditions being agreed upon with the Commission, proposed to pay the administrative penalty over a period of five years subject to appropriate interest (refer to note 23). There are no other material litigations and claims that result in a contingent liability as defined in IAS 37 Provisions, Contingent Liabilities and Contingent Assets.
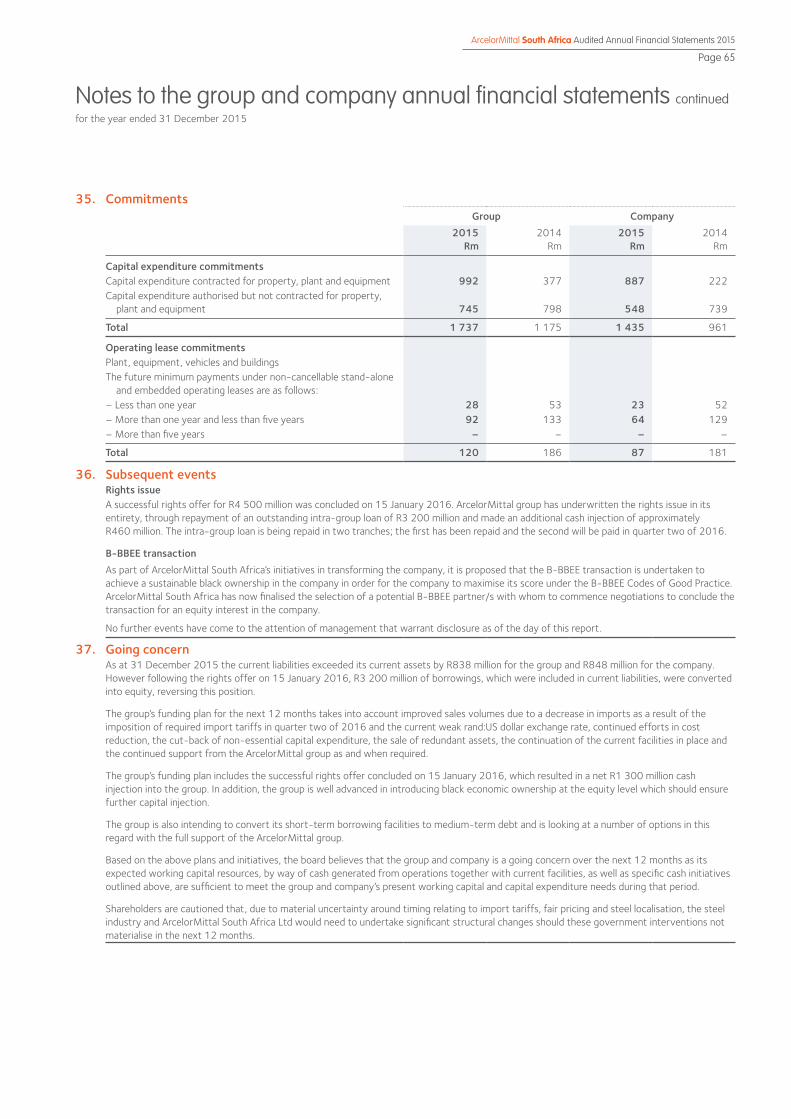
ArcelorMittal South Africa Audited Annual Financial Statements 2015
Page 65
Notes to the group and company annual financial statements continuedfor the year ended 31 December 2015
35. CommitmentsGroup Company
2015Rm
2014Rm
2015Rm
2014Rm
Capital expenditure commitmentsCapital expenditure contracted for property, plant and equipment 992 377 887 222 Capital expenditure authorised but not contracted for property, plant and equipment 745 798 548 739
Total 1 737 1 175 1 435 961
Operating lease commitmentsPlant, equipment, vehicles and buildingsThe future minimum payments under non-cancellable stand-alone and embedded operating leases are as follows:– Less than one year 28 53 23 52 – More than one year and less than five years 92 133 64 129 – More than five years – – – –
Total 120 186 87 181
36. Subsequent eventsRights issueA successful rights offer for R4 500 million was concluded on 15 January 2016. ArcelorMittal group has underwritten the rights issue in its entirety, through repayment of an outstanding intra-group loan of R3 200 million and made an additional cash injection of approximately R460 million. The intra-group loan is being repaid in two tranches; the first has been repaid and the second will be paid in quarter two of 2016.
B-BBEE transactionAs part of ArcelorMittal South Africa’s initiatives in transforming the company, it is proposed that the B-BBEE transaction is undertaken to achieve a sustainable black ownership in the company in order for the company to maximise its score under the B-BBEE Codes of Good Practice. ArcelorMittal South Africa has now finalised the selection of a potential B-BBEE partner/s with whom to commence negotiations to conclude the transaction for an equity interest in the company.
No further events have come to the attention of management that warrant disclosure as of the day of this report.
37. Going concernAs at 31 December 2015 the current liabilities exceeded its current assets by R838 million for the group and R848 million for the company. However following the rights offer on 15 January 2016, R3 200 million of borrowings, which were included in current liabilities, were converted into equity, reversing this position.
The group’s funding plan for the next 12 months takes into account improved sales volumes due to a decrease in imports as a result of the imposition of required import tariffs in quarter two of 2016 and the current weak rand:US dollar exchange rate, continued efforts in cost reduction, the cut-back of non-essential capital expenditure, the sale of redundant assets, the continuation of the current facilities in place and the continued support from the ArcelorMittal group as and when required.
The group’s funding plan includes the successful rights offer concluded on 15 January 2016, which resulted in a net R1 300 million cash injection into the group. In addition, the group is well advanced in introducing black economic ownership at the equity level which should ensure further capital injection.
The group is also intending to convert its short-term borrowing facilities to medium-term debt and is looking at a number of options in this regard with the full support of the ArcelorMittal group.
Based on the above plans and initiatives, the board believes that the group and company is a going concern over the next 12 months as its expected working capital resources, by way of cash generated from operations together with current facilities, as well as specific cash initiatives outlined above, are sufficient to meet the group and company’s present working capital and capital expenditure needs during that period.
Shareholders are cautioned that, due to material uncertainty around timing relating to import tariffs, fair pricing and steel localisation, the steel industry and ArcelorMittal South Africa Ltd would need to undertake significant structural changes should these government interventions not materialise in the next 12 months.

ArcelorMittal South Africa Audited Annual Financial Statements 2015
Page 66
Corporate information
Company registrationArcelorMittal South Africa LtdRegistration number 1989/002164/06Share code: ACLISIN: ZAE000134961
Registered officeVanderbijlpark WorksRoom N3-5, Main BuildingDelfos BoulevardVanderbijlpark
Postal addressPO Box 2Vanderbijlpark, 1900Telephone: +27 (0) 16 889 9111Facsimile: +27 (0) 16 889 2079
Internet addresshttp://southafrica.arcelormittal.com/
Company secretaryMs NB BamTelephone: +27 (0) 16 889 4195Facsimile: +27 (0) 16 889 2517Email: [email protected]
Date published: 12 February 2016
SponsorJP Morgan Equities South Africa Proprietary Ltd1 Fricker Road, Illovo, Johannesburg, 2196Private Bag X9936, Sandton, 2146Telephone: +27 (0) 11 507 0300Facsimile: +27 (0) 11 507 0502
AuditorsDeloitte & ToucheDeloitte Place, Building 1, The Woodlands20 Woodlands Drive, Woodmead, 2052, South AfricaTelephone: +27 (0) 11 806 5000Facsimile: +27 (0) 11 806 5118
Transfer secretariesComputershare Investor Services (Pty) Ltd70 Marshall Street, JohannesburgPO Box 61051, Marshalltown, 2107Telephone: +27 0861 100 950Facsimile: +27 (0) 11 688 5217Email: [email protected]
United States ADR depositaryThe Bank of New York MellonADR Department101 Barclay Street, 22nd Floor, New York, NY 10286United States of AmericaInternet: www.bnymellon.com

BASTION GRAPHICS

ArcelorMittal South Africa Corporate OfficeDelfos BoulevardVanderbijlpark
Phone: +27 (0) 16 889 9111Fax: +27 (0) 16 889 4318
GPS coordinates: E 27° 48’ 19.6” S 26° 40’ 22.3”
www.arcelormittalsa.com
www.arcelormittalsa.com/annualfinancialstatements2015 for the online version