audit effort and earnings management - usc marshall school ... · finally, we test whether the...
TRANSCRIPT
ARTICLE IN PRESS
0165-4101/$ - se
doi:10.1016/j.ja
$We are ind
helpful comme
Pittman, Peter
Nanyang Univ
Public Accoun
valuable assista
statement data.�Correspond
Hong Kong. T
E-mail addr
Journal of Accounting and Economics 45 (2008) 116–138
www.elsevier.com/locate/jae
Audit effort and earnings management$
Constantinos Caramanisa, Clive Lennoxb,�
aAthens University of Economics and Business, Athens, GreecebHong Kong University of Science & Technology, Hong Kong
Received 1 June 2006; received in revised form 21 May 2007; accepted 24 May 2007
Available online 4 June 2007
Abstract
We test the effect of audit effort on earnings management using a unique database of hours worked by auditors on 9,738
audits in Greece between 1994 and 2002. When audit hours are lower, (1) abnormal accruals are more often positive than
negative, (2) positive abnormal accruals are larger, and (3) companies are more likely to manage earnings upwards in order
to meet or beat the zero earnings benchmark. These results persist after we control for endogeneity between audit hours
and earnings management. We conclude that low audit effort increases the extent to which managers are able to report
aggressively high earnings.
r 2007 Elsevier B.V. All rights reserved.
JEL classification: M49
Keywords: Auditing; Hours; Effort; Earnings management
1. Introduction
Audit quality is defined as the joint probability that an existing material error is detected and reported by anauditor (DeAngelo, 1981). Audit effort affects the probability that the auditor detects an existing problem,whereas auditor independence affects the probability that the auditor reports a detected problem. Prior studiesprimarily investigate whether earnings management is related to factors that could impair auditorindependence. Such factors include fees from audit and non-audit services, client importance and auditfirm tenure (Frankel et al., 2002; Reynolds and Francis, 2000; Myers et al., 2003). However, there is no
e front matter r 2007 Elsevier B.V. All rights reserved.
cceco.2007.05.002
ebted to the editor, Ross Watts, and the referee, Stephen Hillegeist, for their valuable insights. We also appreciate the
nts of Chih-Ying Chen, Elisabeth Dedman, Jere Francis, Kai Wai Hui, Gilles Hilary, Ping-Sheng Koh, Chul Park, Jeff
Pope, Wayne Thomas, Guochang Zhang and seminar participants at Hong Kong University of Science & Technology,
ersity and National University of Singapore. We especially thank the Supervisory Council of the Institute of Certified
tants of Greece for giving us access to their proprietary data on audit hours and Thanasis Androutsos for providing
nce with the data. We are also grateful to business information provider ICAP S.A., Greece, for providing financial
ing author. Department of Accounting, Hong Kong University of Science & Technology, Clear Water Bay, Kowloon,
el.: 852 23587571; fax: 852 23581693.
ess: [email protected] (C. Lennox).

ARTICLE IN PRESSC. Caramanis, C. Lennox / Journal of Accounting and Economics 45 (2008) 116–138 117
evidence regarding the effect of audit effort on earnings management. In analytical research, hard-workingauditors are more likely to detect that earnings are overstated (e.g., Dye, 1993, 1995; Hillegeist, 1999), sotheory leads us to predict that audit effort has a negative impact on income-increasing earnings management.
The paucity of evidence on audit effort is mainly attributable to the unavailability of large datasets of audithours. In Greece, however, audit firms are required to disclose hours to the professional accounting institute,SOEL (SOEL is the translated acronym for the Institute of Certified Auditors-Accountants of Greece), whichhas provided the data to us for the purpose of academic research. Greece is a good case study, not onlybecause of the availability of data on audit hours, but also because earnings management is rampant there(Leuz et al., 2003). As explained later, earnings management may be widespread in Greece because auditorshave low incentives to exert effort.
Auditors jeopardize their reputations (and risk litigation) if their clients are found to have overstatedearnings, but there is generally no ‘‘penalty’’ when companies understate earnings (St. Pierre and Anderson,1984; Kellogg, 1984). Consistent with auditors facing asymmetric loss functions, auditors and clients tend todisagree about accounting choices that are income-increasing rather than income-decreasing and auditorsgenerally require their clients to adjust earnings downwards (DeFond and Jiambalvo, 1993; Kinney andMartin, 1994; Nelson et al., 2002). Thus, we focus on the association between audit effort and income-
increasing earnings management, although we also report results for income-decreasing earnings management.Another reason for focusing on the direction of earnings management is that unsigned measures of abnormalaccruals heighten the threat of correlated omitted variable problems (Hribar and Nichols, 2006).
We measure earnings management by estimating abnormal accruals using the model of Jones (1991). Weexpect greater audit effort to reduce the extent to which managers report aggressively high earnings. Thus, wepredict that (1) abnormal accruals are more likely to be positive when audit hours are lower and (2) themagnitude of positive abnormal accruals is greater when audit hours are lower. We make no prediction aboutthe association between audit hours and the magnitude of negative abnormal accruals. Our tests use audithours data from 9,738 engagements performed between 1994 and 2002.
Audit hours are endogenous and, a priori, it is unclear in which direction endogeneity might bias the results(Hansen and Watts, 1997). On the one hand, auditors might work harder if they believe that clients areattempting to manage earnings. In this case, endogeneity would induce a spurious positive relation betweenaudit hours and earnings management. On the other hand, clients that wish to manage earnings can anticipatethat hard-working auditors are more likely to thwart their earnings management attempts and might thereforecontract with their auditors to exert less effort. In this case, endogeneity would induce a negative relationbetween audit hours and earnings management. This is consistent with our argument that audit effort reducesearnings management because, if audit effort did not reduce earnings management, then clients that intend tomanage earnings would not have incentives to contract for lower audit effort in the first place.
To address the endogeneity issue, we use two-stage instrumental variables (IV) estimation. In the first stage,we estimate a model of audit hours and we use the estimated coefficients to obtain predicted hours. We findthat audit hours are strongly related to client size and auditors work significantly more hours in initial auditengagements, consistent with the existence of set-up costs in the first year. We also demonstrate that the BigFive audit firms (Arthur Andersen, Deloitte & Touche, Ernst & Young, KPMG, and PricewaterhouseCoo-pers) work more hours than do non-Big Five firms, which corroborates the view that the Big Five supplyhigher-quality audits (Becker et al., 1998). These findings provide some assurance that audit hours are areasonable proxy for audit effort.
In the second stage, the predicted hours from the first stage become an independent variable in our earningsmanagement models. While IV estimation is the standard textbook solution to endogeneity, it is only reliableif (1) there is an instrumental variable that is strongly correlated with audit hours and (2) the instrumentalvariable is uncorrelated with the error term in the earnings management model (Larcker and Rusticus, 2005).Both conditions are met by an hours variable that is lagged by one year. Audit hours are highly persistent overtime, making the previous year’s hours a powerful predictor of the current year’s hours. In addition, our testsfail to reject the null hypothesis that the predicted hours variable is exogenous. That is, lagged hours can bethought of as pre-determined with respect to earnings management in the current year.
Our first main finding is that abnormal accruals are more likely to be positive when audit hours are lower.Our second finding is that the magnitude of income-increasing abnormal accruals is greater when audit hours

ARTICLE IN PRESSC. Caramanis, C. Lennox / Journal of Accounting and Economics 45 (2008) 116–138118
are lower. Together, these results suggest that low audit effort is associated with income-increasing earningsmanagement. In contrast, we find weak or insignificant associations between audit hours and income-decreasing earnings management, a finding that is consistent with auditors having asymmetric loss functions.
Since abnormal accruals are simply the residuals from the Jones model, approximately 50% of companiesare estimated to have positive abnormal accruals. This frequency likely overstates the proportion ofcompanies that actually manage earnings upwards, even in a country like Greece that has poor accountingquality. Degeorge et al. (1999) argue that managers overstate earnings in order to avoid reporting losses, andthey find a significant discontinuity around zero in the earnings distribution. We document that this earningsdiscontinuity is much more pronounced in Greece than in the US, consistent with earnings management beingmore widespread in Greece. Therefore, we combine the abnormal accruals variable with an indicator forwhether or not the company just meets or beats the zero earnings benchmark.
We identify companies as managing earnings upwards if (1) reported earnings are small and positive,(2) abnormal accruals are positive, and (3) reported earnings would have been negative if abnormal accrualshad been zero. Within our sample, 633 (6.5%) companies meet these conditions, so this is a much narrowermeasure of income-increasing earnings management than are positive abnormal accruals. Results using thisalternative measure remain consistent with the abnormal accrual models. Specifically, we find that low audithours are associated with companies managing earnings upwards in order to avoid reporting losses.
Finally, we test whether the association between audit effort and earnings management is different betweenBig Five and non-Big Five firms. On the one hand, it could be argued that the impact of additional audit efforton earnings management is greater for Big Five firms because they supply higher-quality audits. On the otherhand, we document that Big Five firms work more hours than non-Big Five firms (after controlling for clientcharacteristics) and that there are diminishing returns to audit effort. Diminishing returns imply that themarginal impact of an additional audit hour could be smaller for Big Five firms because they work longerhours.
Our tests reveal a significantly stronger negative relation between audit hours and income-increasingearnings management for Big Five firms. Thus, not only do the Big Five firms work longer hours, but also, theper unit impact of an additional audit hour on earnings management is greater for Big Five firms.
Our study makes a unique contribution to the literature by using data on audit engagement hours toexamine the impact of audit effort on earnings management. In a related study, Hansen and Watts (1997)examine the strategic interaction between the costs of audit testing and earnings management. Consistent withtheir game theoretic model, they find that managers are less likely to manage earnings when the costs of audittesting are lower. However, audit hours data are unavailable in their empirical setting and they do not attemptto measure audit effort.
Section 2 provides institutional detail about auditing in Greece and explains the research design. Section 3describes the sample and provides descriptive statistics. Section 4 reports the main results and Section 5concludes.
2. Institutional background and research design
2.1. Auditing in Greece
Corporate auditing in Greece began in 1955 with the establishment of a state auditing body, the Body ofSworn-In Accountants (BSA), which enjoyed a legal monopoly over statutory audit engagements. In 1979, theinternational accounting firms established a rival organization, the Society of Certified Accountants-Auditors(SCAA), which lobbied for the termination of BSA’s monopoly. After a political struggle between the twoorganizations, the government abolished BSA in 1992, a reform that became effective for most companies infiscal year 1993.
As part of the reform package, the government created a new accounting body, SOEL, to self-regulate theaudit profession. After the audit market was liberalized, many of BSA’s former employees joined together toform one very large Greek audit firm, SOL SA. At the same time, several smaller Greek audit firms wereformed and the Big Five firms and two smaller international firms (Grant Thornton and Moore Stephens)began to supply statutory audit services in Greece.

ARTICLE IN PRESSC. Caramanis, C. Lennox / Journal of Accounting and Economics 45 (2008) 116–138 119
Every engagement partner is required to report to SOEL the aggregate hours worked on an audit. To traceany engagements with missing hours, SOEL matches the name of each company’s auditor (as listed in theGovernment Gazette) with its own database. SOEL sends reminders to any partner who fails to report hours,and partners are not permitted to retire unless they submit data for all their audit engagements. SOEL alsoperforms reasonableness tests to identify data inaccuracies (e.g., they compare reported hours with thecompany’s size). The requirement for partners to disclose hours is mandated both in Greek law (Article 16 ofPresidential Decree 226/1992, Law 2231, Article 18, Paras. 5 & 6) and in guidelines issued by SOEL. There arelegal penalties for non-reporting and inaccurate reporting although SOEL have informed us that, to date, ithas not been necessary for them to take legal action. Despite that partners are required to disclose audit hoursto SOEL the information is not publicly available.
In contrast to the US, annual audits are mandatory in Greece both for public companies and for privatecompanies that exceed two of the following size criteria for two consecutive years: (1) h1.47 million in totalassets, (2) h2.93 million in sales, and (3) 50 employees. Moreover, earnings management is widespread in bothpublic and private companies (Burgstahler et al., 2006; Caramanis and Spathis, 2006). In fact, Leuz et al.(2003) rank Greece as having the most earnings management in an international study of 31 countries (Greeceis tied for highest with Austria).
Caramanis and Spathis (2006) report that 87.6% of public Greek companies received qualified auditopinions in 2001 and many opinions are qualified because the companies fail to comply with GAAP (see alsoBaralexis, 2004; Sougiannis et al. 2008).1 In comparison, Butler et al. (2004) find that only 0.5% of public UScompanies received qualified audit opinions between 1994 and 1999. Greek audit opinions are qualified due tocapitalized expenses, inadequate provisions for taxes, bad debts and depreciation, and other accountingproblems (Caramanis and Spathis, 2006). In a survey of auditors in Greece, Baralexis (2004) reports that 68%believe earnings overstatements are more common than earnings understatements while 18% believe thatunderstatements are more common (the remaining 14% express no view). Baralexis (2004) also finds that bankfinance is the most important motive for companies to overstate profits, which is unsurprising since the Athensstock market is not well developed.
Audit liability in Greece is capped at five times the salary of the Supreme Court President, for a total cap ofh315,000 in 2002, so the litigation threat is small and auditors have little incentive to exert effort. Even incountries that have low litigation risk, however, auditing is in great demand. For example, litigation againstauditors was very rare in the US prior to 1966 (Lys and Watts, 1994), yet auditors were presumably providinga useful attestation service and exerting effort. We argue that auditors exert some degree of effort as long asprofessional standards and regulatory bodies help to monitor auditors’ actions. This is certainly the case inGreece, where professional auditing standards are enforced by the Supervisory Council of SOEL, whichhandled 100 disciplinary cases between 1993 and 2003.
Reputation concerns may also motivate auditors to exert some effort (DeAngelo, 1981). In Greece, auditscandals have featured prominently in both the daily press and specialist publications, and auditors haveincentives to avoid being associated with such scandals.2 To summarize, auditors in Greece have someincentive to exert effort although these incentives are much weaker than in the US, where auditors face highlitigation and reputation risk.
2.2. The earnings management models
We measure total accruals using the balance sheet approach rather than the cash flow statement approachof Collins and Hribar (2002), because most Greek companies do not provide cash flow statements. Totalaccruals (ACCRUALSit) are the change in non-cash current assets minus the change in non-debt currentliabilities minus depreciation, scaled by lagged total assets. Abnormal accruals (DAit) are the residuals from
1The audit opinions in these studies are collected by hand because audit opinion data are not available from public databases in Greece.2In one scandal, an accountant employed by the Bank of Crete misappropriated most of the bank’s funds, which he then used to acquire
the bank itself, a leading soccer club, two newspapers, a magazine, and a radio station. Several politicians and government officials were
associated with the scandal and the negative publicity played a significant role in causing a change of government. The auditor who signed
the Bank of Crete’s financial statements was expelled from the profession and subsequently received a long prison sentence.

ARTICLE IN PRESSC. Caramanis, C. Lennox / Journal of Accounting and Economics 45 (2008) 116–138120
the Jones (1991) model:
ACCRUALSit ¼ a0jt þ a1jtð1=ASSETit�1Þ þ a2jtDSALESit þ a3jtPPEit þ �it, (1)
where ASSETit�1 is the lagged total assets, DSALESit the change in sales scaled by lagged assets, and PPEit
the net property, plant and equipment scaled by lagged assets. The j subscript denotes the company’s industryat the two-digit level. We estimate Eq. (1) for each industry-year that has at least 30 observations. We includean industry-year intercept (a0jt) to reduce the impact of heteroscedasticity and omitted scale effects (Kothari etal., 2005).
Since our main arguments concern income-increasing earnings management, we distinguish betweenpositive and negative abnormal accruals. The first earnings management variable is Sign_DAit, which equalsone if abnormal accruals are income-increasing (DAit 4 0) and zero otherwise. The second variable (DAit
+)captures the magnitude of income-increasing abnormal accruals (DAit
+ equals DAit if DAit 4 0). The thirdvariable (DAit
�) captures the magnitude of income-decreasing abnormal accruals (DAit� equals DAit if
DAito0). We expect that audit effort is negatively associated with Sign_DAit and DAit+, but we do not predict
the sign of the association between audit effort and DAit�.
We estimate three earnings management models:
Sign_DAit ¼ l0 þ l1LAHit þ CONTROLS þ uit, (2)
DAþit ¼ b0 þ b1LAHit þ CONTROLS þ uit, (3)
DA�it ¼ d0 þ d1LAHit þ CONTROLS þ uit, (4)
LAHit equals the log of audit hours for company i in year t. We take logs to reduce the skewness in thedistribution of audit hours. CONTROLS is a vector of independent variables that affect earnings managementas discussed below. When audit hours are lower, we expect positive abnormal accruals more often thannegative (l1o0), and we expect positive abnormal accruals to be larger (b1o0). We do not predict the sign ofthe association between audit hours and the magnitude of negative abnormal accruals (d1).
Since Sign_DAit is a dummy variable, we estimate Eq. (2) using logistic regression. By construction, theDAit
+ (DAit�) variable is left-truncated (right-truncated) at zero, implying that ordinary least squares (OLS)
coefficients would be biased. To avoid this truncation bias, we estimate Eqs. (3) and (4) using truncatedregression (Maddala, 1983).
2.3. Endogeneity in audit hours (LAHit)
We address the endogeneity issue using IV estimation and we investigate whether LAHit is affected byendogeneity bias using a Hausman test. In the first stage, we estimate a model of audit hours:
LAHit ¼ Z0 þ Z1LAHit�1 þ CONTROLS þ vit, (5)
where LAHit�1 equals the log of audit hours in the previous year’s audit and CONTROLS is a vector ofindependent variables that affect audit hours.
We obtain the instrumented (predicted) log of audit hours (ILAHit) using the coefficient estimates in Eq. (5)and, in the second stage, we replace LAHit with ILAHit in Eqs. (2) to (4):
Sign_DAit ¼ l0 þ l1ILAHit þ CONTROLS þ uit, (2a)
DAþit ¼ b0 þ b1ILAHit þ CONTROLS þ uit, (3a)
DA�it ¼ d0 þ d1ILAHit þ CONTROLS þ uit. (4a)
Auditors often plan the audit hours for year t using their working papers from year t�1. Therefore, we expectstrong persistence in audit hours such that lagged audit hours (LAHit�1) is a powerful predictor of LAHit. Inaddition to being a powerful instrument, LAHit�1 should be uncorrelated with uit (i.e., LAHit�1 should beexogenous) in order for IV estimation to be valid. In a Sargan test, LAHit�1 is likely to be a valid instrument ifa Hausman test provides no evidence of endogeneity bias for LAHit; that is, LAHit�1 may be uncorrelated

ARTICLE IN PRESSC. Caramanis, C. Lennox / Journal of Accounting and Economics 45 (2008) 116–138 121
with uit if LAHit is uncorrelated with uit. Even if the Hausman test provides evidence of bias, LAHit�1 can be avalid instrument if uit is not serially correlated. That is, even if LAHit�1 is contemporaneously correlated withuit�1, LAHit�1 may be uncorrelated with uit if uit�1 is uncorrelated with uit. This is not unlikely since Jonesmodel abnormal accruals have low levels of persistence (Kothari et al., 2005).
In Eq. (5), we do not attempt to model the impact of earnings management on audit hours. To incorporatesuch a feedback effect, we would need to obtain powerful and exogenous instrumental variables for each of theearnings management variables. Unfortunately, theory does not provide guidance as to how to find goodinstruments for earnings management.3 While this limits the scope of our study, it does not affect ourinferences regarding the effect of audit hours on earnings management, since we provide evidence that IVestimation is both powerful and valid.
2.4. The control variables
The control variables reflect a number of earlier findings. Because Big Five firms are associated with lessearnings management than are non-Big Five firms (Becker et al., 1998; Van Caneghem, 2005), we include a BigFive dummy variable (BIGit). We also include a dummy variable (INTERNATIONALit) for the internationalnon-Big Five firms (Grant Thornton and Moore Stephens). Finally, we include a dummy variable for SOL SA(SOLit), which is the largest Greek audit firm.
O’Keefe et al. (1994) show that client size is the most important determinant of audit hours, so we includethe log of assets (LASSETit) as a control variable. Since debt finance is relatively important for Greek firms,we control for LEVERAGEit which equals total liabilities minus cash holdings scaled by total assets. Butler etal. (2004) find a positive association between abnormal accruals and liquidity, which we address with the ratioof current assets to current liabilities (CURRENTit).
Myers et al. (2003) find a negative relation between abnormal accruals and audit firm tenure. OurTENUREit variable equals the number of consecutive years that the client appoints the same audit firm. Sincethe market for audit services was not open to non-governmental auditors until 1992-93, the average audit firmtenure is relatively short (four years) and we are able to measure it accurately. We also include an auditorchange variable, SWITCHit, which equals one if the audit in year t is performed by an incoming audit firm(zero otherwise). If a client changes its auditor, the incoming audit firm likely works more hours because it haslots of start-up costs such as assessing the strength of internal controls.
We include a public company dummy variable (PUBLICit) to control for differences between public andprivate companies, although it is unclear whether public or private companies are more likely to manageearnings (see Burgstahler et al., 2006). Private companies often have a single controlling shareholder who is ina better position than dispersed shareholders to coordinate activities that expropriate other stakeholders (Anget al., 2000; Bennedsen and Wolfenzon, 2000). For example, private companies might be more likely thanpublic companies to manage earnings upwards in order to secure access to debt finance (see Graham et al.,2005; Blackwell et al., 1994). Similarly, private companies might manage earnings downwards for tax reasons(Ball and Shivakumar, 2005; Coppens and Peek, 2005), although auditors may not prevent this because theirprimary incentive is to prevent earnings from being overstated (Kinney and Martin, 1994; Nelson et al., 2002).
Public companies might be less inclined to manage earnings because equity markets demand high-qualityearnings and the listing process may screen out companies that are more likely to manage earnings. However,the opposite prediction may hold if equity markets exacerbate managers’ incentives to manage earnings (Teohet al., 1998; Erickson and Wang, 1999; Burgstahler et al., 2006).
The extant evidence is mixed as to whether public or private companies are more likely to manage earnings.Beatty et al. (2002) find that public banks engage in more earnings management than do private banks,whereas Burgstahler et al. (2006) report that private companies are more likely to manage earnings in 12 out of13 European countries (the exception being Greece).
In addition to the public company dummy variable, we control for the effect of going public. Teoh et al.(1998) find evidence of earnings management around initial public offerings, so we include an IPOit dummy
3As shown by Larcker and Rusticus (2005), it is better to use single equation estimation rather than IV estimation if the chosen
instruments are weak or invalid.

ARTICLE IN PRESSC. Caramanis, C. Lennox / Journal of Accounting and Economics 45 (2008) 116–138122
variable that equals one if company i goes public in year t (zero otherwise). Finally, we include dummyvariables for each sample year and for each two-digit industry sector that has at least 100 observations.
3. The sample and descriptive statistics
3.1. The sample
SOEL’s database identifies the client’s name, the audit firm’s name, and the number of audit hours in 28,022annual audits between 1993 and 2002. In 2,665 audits, financial statement data are unavailable as the auditedentities do not publish their accounts publicly (these are mostly public sector organizations such as socialsecurity funds, universities and hospitals). We obtain financial statement data for the remaining 25,357 auditsfrom ICAP, which is the largest provider of business information in Greece.4 We require that each industry-year combination has at least 30 observations because we estimate the Jones model by industry-year.
After imposing the requirement that data are available for all variables, the final sample consists of 9,738audits between 1994 and 2002 (we lose the year 1993 because we require a lagged audit hours variable). Sincethe sample is pooled across company-year observations, the annual observations of a given company mightnot be drawn independently and, to correct this statistical problem, we adjust the coefficients’ standard errorsby ‘‘clustering’’ on each company (Rogers, 1993; Petersen, 2007).
3.2. Descriptive statistics
Table 1 reports the audit market shares of Big Five firms, the international non-Big Five firms, the largestGreek firm (SOL SA), and the other Greek firms. SOL SA was formed by employees of the state auditingbody, which had a monopoly over audits until 1992. SOL SA enjoys a dominant share of the audit market(47.3%) because the former employees of the state auditing body took most of their clients with them to SOLSA in 1992. Nevertheless, the market share of SOL SA has declined throughout the sample period, from58.1% in 1994 to 41.7% in 2002. At the same time, the combined market share of the Big Five firms has beenincreasing, from 21.1% in 1994 to 34.5% in 2002. The Big Five market share remained high in 2002 eventhough Arthur Andersen exited the Greek market shortly after the Enron scandal. All the results continue tohold if we drop the 181 audits performed by Arthur Andersen and if we exclude the auditor changes involvingArthur Andersen in 2001–02 (these constitute only 4.6% of the auditor changes in the sample).
Table 2 reports descriptive statistics and a correlation matrix for the independent variables. We winsorize allthe continuous variables at the top 1% and bottom 99% percentiles in order to avoid outlier problems. Meanand median audit hours, AHit, are 233 and 186, respectively, indicating skewness in the audit hoursdistribution. The mean and median of the log of audit hours (LAHit) are 5.24 and 5.23, respectively, becausetaking logs causes the distribution to become almost symmetric. Although audit firm changes are relativelyrare (6% of the sample) average audit firm tenure is only 4 years because there were no private audit firmsprior to 1992 and our sample period ends in 2002. The stock market is not very well developed in Greece andso there are only 678 (7.0%) public company observations in the sample.
The correlation matrix indicates that audit hours are positively associated with client size (LASSETit) andaudit firm size (BIGit). The other correlations also make sense. For example, larger companies are more likelyto be publicly traded, involved in IPOs, and audited by Big Five firms.
4. The multivariate results
4.1. The determinants of audit hours
Table 3 reports the results for three models of audit hours. Consistent with O’Keefe et al. (1994), companysize (LASSETit) is a very important determinant of audit hours. Audit firm size is also important. Thecoefficients are positive and statistically significant for the BIGit, INTERNATIONALit, and SOLit variables.
4For further information, see www.icap.gr/services/business_info/index_uk.asp.

ARTICLE IN PRESS
Table 1
Market shares of the audit firms in Greece (1994–2002)
Big Five audit firms
(%)
International non-
Big Five (%)
Largest Greek firm
(SOL SA) (%)
Small Greek audit
firms (%)
1994-02 30.1 5.0 47.3 17.6
1994 21.1 2.3 58.1 18.5
1995 21.1 3.5 53.9 21.5
1996 23.1 3.0 51.9 22.0
1997 26.7 4.5 52.0 16.8
1998 30.6 5.3 48.1 16.0
1999 29.3 5.4 47.7 17.5
2000 31.2 6.6 46.6 15.6
2001 32.2 5.9 46.3 15.6
2002 34.5 4.2 41.7 19.6
Prior to 1992, audits in Greece were performed by a state auditing body. Following market liberalization, SOL SA was formed by the
former employees of the state auditing body. The employees generally took their clients with them, which is why SOL SA has a dominant
share of the audit market. Market liberalization also resulted in the formation of 27 smaller Greek audit firms. The Big Five audit firms are
Arthur Andersen, Deloitte & Touche, Ernst & Young, KPMG, and PricewaterhouseCoopers. Arthur Andersen ceased supplying audits in
2002 following the Enron scandal. The international non-Big Five audit firms are Grant Thornton and Moore Stephens.
The market share of audit firm k in year t equalsPI
i¼1ASSETikt=PK
k¼1
PIi¼1ASSETikt.
ASSETikt equals the total assets of company i audited by audit firm k in year t. I equals the total number of companies audited by audit
firm k in year t. K equals the total number of audit firms in year t.
C. Caramanis, C. Lennox / Journal of Accounting and Economics 45 (2008) 116–138 123
Therefore, compared to the small Greek audit firms, hours are significantly higher for the Big Five, theinternational non-Big Five, and SOL SA.
In untabulated tests, the BIGit coefficients are significantly larger than the INTERNATIONALit and SOLit
coefficients. Therefore, audit hours are significantly higher for Big Five firms than for non-Big Five firms. Toassess the economic significance of the BIGit coefficient, we use Model 1 to predict the hours that would beworked by Big Five and non-Big Five firms on each engagement in the sample. We predict that meanengagement hours would be 276 if all audits were performed by Big Five firms compared to 176 if all auditswere undertaken by non-Big Five firms. Thus, the BIGit coefficient is economically as well as statisticallysignificant.
In Model 2, we replace BIGit with dummy variables for each of the Big Five firms (AAit, DTit, EYit, KPMGit,and PWCit). The five coefficients are all positive and statistically significant, ranging from 0.343 for ArthurAndersen to 0.507 for Ernst & Young. Each Big Five coefficient is significantly larger than the SOLit andINTERNATIONALit coefficients (0.125 and 0.049, respectively), implying that each Big Five firm works morehours than do the non-Big Five firms.
In Models 1 and 2, the CURRENTit variable has significant negative coefficients, which implies that audithours are higher when clients have lower liquidity. There are significant positive coefficients for SWITCHit,indicating that newly appointed auditors work more hours than do retained incumbent auditors. This makessense given the set-up costs associated with the first year’s engagement. However, we do not find evidence oflearning-by-doing in the form of lower audit hours as tenure increases beyond the first year. Similarly, O’Keefeet al. (1994) find no evidence of learning-by-doing in their US study of audit hours.
In Model 3, we include the log of the previous year’s audit hours (LAHit�1) as an independent variable inorder to control for persistence in audit hours. We also add dummy variables for each audit firm that has atleast 100 observations in order to control for audit firm heterogeneities. The LAHit�1 coefficient is positive andhighly significant (t-statistic ¼ 36.24), which implies that there is very strong persistence in audit hours.5
5In untabulated regressions, we examine whether audit hours are affected by changes in client size. We add to Model 3 either the change
in assets or the change in sales and, consistent with our treatment of the other continuous variables, we winsorize the change in assets and
change in sales variables in order to avoid outlier problems. The asset growth coefficient is found to be negative and weakly significant (t
¼ �1.99) in the hours model whereas the change in sales coefficient is positive and insignificant (t ¼ 1.48). Given the mixed signs and the
low levels of insignificance, we do not include these variables in the tabulated results.

ARTICLE IN PRESS
Table 2
Descriptive statistics and correlation matrix
Mean Median Std. dev. 5% percentile 95%
percentile
AHit 233.49 186.00 177.10 50.00 554.00
LAHit 5.24 5.23 0.65 3.91 6.32
LASSETit 15.72 15.73 1.35 12.79 17.86
BIGit 0.15 0.00 0.36 0.00 1.00
INTERNATIONALit 0.08 0.00 0.27 0.00 1.00
SOLit 0.58 1.00 0.49 0.00 1.00
CURRENTit 2.33 1.21 5.09 0.48 5.86
LEVERAGEit 0.48 0.55 0.37 �0.22 0.90
PUBLICit 0.07 0.00 0.25 0.00 1.00
IPOit 0.01 0.00 0.08 0.00 0.00
SWITCHit 0.06 0.00 0.24 0.00 1.00
TENUREit 4.21 4.00 2.33 1.00 9.00
1. 2. 3. 4. 5. 6. 7. 8. 9. 10.
1. LAHit 1.00
2. LASSETit 0.76* 1.00
3. BIGit 0.34* 0.22* 1.00
4. INTERNATIONALit �0.12* �0.09* �0.12* 1.00
5. SOLit �0.11* �0.13* �0.50* �0.35* 1.00
6. CURRENTit �0.26* �0.25* �0.04* 0.04* 0.04* 1.00
7. LEVERAGEit 0.29* 0.30* 0.09* �0.04* �0.05* �0.54* 1.00
8. PUBLICit 0.16* 0.21* �0.04* �0.01 �0.01 0.04* �0.11* 1.00
9. IPOit 0.04* 0.06* �0.01 0.00* �0.01 0.00 �0.02 0.29* 1.00
10. SWITCHit 0.03* 0.01 0.13* 0.01 �0.17* �0.00 0.01 0.01 0.02 1.00
11. TENUREit 0.21* 0.26* �0.05* �0.04 0.14* �0.07* 0.04* �0.01 �0.01 �0.35*
The continuous variables are winsorized at the top 1% and bottom 99% percentiles. * ¼ Statistically significant at the 1% level (two-
tailed).
AHit ¼ Audit hours for company i in year t. LAHit ¼ Log of audit hours for company i in year t. LASSETit ¼ Log of total assets of
company i in year t. BIGit ¼ one if the audit is performed by one of the Big Five audit firms; zero otherwise. AAit ¼ one if the audit is
performed by Arthur Andersen; zero otherwise. DTit ¼ one if the audit is performed by Deloitte & Touche; zero otherwise. EYit ¼ one if
the audit is performed by Ernst & Young; zero otherwise. KPMGit ¼ one if the audit is performed by KPMG; zero otherwise.
PWCit ¼ one if the audit is performed by PricewaterhouseCoopers (Price Waterhouse or Coopers & Lybrand prior to the 1998 merger);
zero otherwise. INTERNATIONALit ¼ one if the audit is performed by an international non-Big Five firm (i.e., Grant Thornton or
Moore Stephens); zero otherwise. SOLit ¼ one if the audit is performed by the largest Greek audit firm (i.e., SOL SA); zero otherwise.
CURRENTit ¼ current assets/current liabilities. LEVERAGEit ¼ (total liabilities – cash)/total assets. PUBLICit ¼ one if the company is
publicly traded on the Athens stock exchange; zero otherwise. IPOit ¼ one in the first year that the company is publicly traded on the
Athens stock exchange; zero otherwise. CHANGE_OLDit ¼ one if the audit is performed by an outgoing audit firm; zero otherwise.
SWITCHit ¼ one if the audit is performed by an incoming audit firm; zero otherwise. TENUREit ¼ the number of consecutive years that
the company is audited by the same audit firm.
C. Caramanis, C. Lennox / Journal of Accounting and Economics 45 (2008) 116–138124
We use the coefficient estimates in Model 3 to obtain the instrumented log of audit hours (ILAHit). SinceLAHit�1 is a strong predictor of LAHit, we can be confident that ILAHit is a powerful instrument. We testwhether ILAHit is a valid (i.e., exogenous) instrument when we estimate the earnings management models.
4.2. The univariate association between abnormal accruals and audit hours
Table 4 provides descriptive statistics for abnormal accruals (Panel A) and compares the mean values ofaudit hours between positive and negative abnormal accruals (Panel B). The means of both hours variables,LAHit and ILAHit, are significantly lower when abnormal accruals are income-increasing compared to whenabnormal accruals are income-decreasing (t-statistics ¼ �2.55 and �2.53, respectively). Therefore, income-increasing earnings management is associated with lower audit effort.

ARTICLE IN PRESS
Table 3
The determinants of audit hours (the dependent variable is the log of audit hours, LAHit)
Model 1 Model 2 Model 3
Coefft. t-stat. Coefft. t-stat. Coefft. t-stat.
LASSETit 0.295 35.17*** 0.294 35.39*** 0.118 16.70***
BIGit 0.453 16.17***
AAit 0.343 7.01*** 0.102 3.99***
DTit 0.393 7.17*** 0.122 4.42***
EYit 0.507 8.10*** 0.175 5.97***
KPMGit 0.422 7.05*** 0.107 4.09***
PWCit 0.498 13.76*** 0.166 7.56***
INTERNATIONALit 0.049 1.73* 0.049 1.73*
SOLit 0.126 6.59*** 0.125 6.57*** 0.024 1.71*
CURRENTit �0.005 �3.35*** �0.005 �3.35*** �0.002 �3.27***
LEVERAGEit 0.030 1.06 0.031 1.09 0.006 0.48
SWITCHit 0.108 5.69*** 0.106 5.57*** 0.036 2.42**
TENUREit 0.032 9.98*** 0.032 9.98*** 0.008 4.22***
PUBLICit 0.017 0.53 0.016 0.51 0.091 4.26***
IPOit 0.029 0.42 0.021 0.45 �0.022 �0.60
LAHit�1 0.681 36.24***
Intercept 0.810 5.98*** 0.818 6.08*** �0.094 �1.44
Year dummies? Yes Yes Yes
Industry dummies? Yes Yes Yes
Additional audit firm dummies? No No Yes
# observations 9738 9738 9738
Adj. R2 67.7% 67.9% 87.7%
***Statistically significant at the 1% level (two-tailed).
**Statistically significant at the 5% level (two-tailed).
*Statistically significant at the 10% level (two-tailed).
We include year dummy variables for each sample year and 16 industry dummy variables for each two-digit industry that has at least 100
observations. Model 3 includes 12 audit firm dummy variables (the Big Five firms, the two international Non-Big Five firms, and five
Greek firms that have at least 100 observations). The models are estimated using ordinary least squares regression. We adjust the
coefficients’ standard errors for the effects of non-independence by clustering on each company (Rogers, 1993; Petersen, 2007).
LAHit ¼ Log of audit hours for company i in year t. LASSETit ¼ Log of total assets of company i in year t. BIGit ¼ one if the audit is
performed by one of the Big Five audit firms; zero otherwise. AAit ¼ one if the audit is performed by Arthur Andersen; zero otherwise.
DTit ¼ one if the audit is performed by Deloitte & Touche; zero otherwise. EYit ¼ one if the audit is performed by Ernst & Young; zero
otherwise. KPMGit ¼ one if the audit is performed by KPMG; zero otherwise. PWCit ¼ one if the audit is performed by
PricewaterhouseCoopers (Price Waterhouse or Coopers & Lybrand prior to the 1998 merger); zero otherwise. INTERNATIONALit ¼ one
if the audit is performed by an international non-Big Five firm (i.e., Grant Thornton or Moore Stephens); zero otherwise. SOLit ¼ one if
the audit is performed by the largest Greek audit firm, SOL SA; zero otherwise. CURRENTit ¼ current assets/current liabilities.
LEVERAGEit ¼ (total liabilities – cash)/total assets. SWITCHit ¼ one if the audit is performed by an incoming audit firm; zero otherwise.
TENUREit ¼ the number of consecutive years that the company is audited by the same audit firm. PUBLICit ¼ one if the company is
publicly traded on the Athens stock exchange; zero otherwise. IPOit ¼ one in the first year that the company is publicly traded on the
Athens stock exchange; zero otherwise.
C. Caramanis, C. Lennox / Journal of Accounting and Economics 45 (2008) 116–138 125
Panel C compares the mean values of audit hours between large and small values of positive abnormalaccruals. We partition the positive abnormal accruals into large and small groups using the median value ofDAit
+. For both hours variables (LAHit and ILAHit), we find significant negative associations with themagnitude of positive abnormal accruals (t-statistics ¼ �3.93 and �4.16, respectively). Thus, income-increasing abnormal accruals are significantly larger when hours are lower.
Panel D compares the mean values of audit hours between large and small values of negative abnormalaccruals (again, we partition using the median value of DAit
�). We find no significant association betweenhours and the magnitude of negative abnormal accruals (t-statistics ¼ �1.37 and �1.52, respectively). Thus,hours are not significantly associated with income-decreasing abnormal accruals, a finding that contrasts withthe significant association between hours and income-increasing abnormal accruals. These results are

ARTICLE IN PRESS
Table 4
Abnormal accruals and audit hours
Panel A: Descriptive statistics for abnormal accruals
Obs. Mean Median 5% percentile 95% percentile
Abnormal accruals (DAit) 9738 �0.005 �0.005 �0.278 0.271
Positive abnormal accruals
(DAit 40)
4694 0.120 0.079 0.007 0.373
Negative abnormal accruals
(DAito0)
5044 �0.121 �0.084 �0.371 �0.007
Panel B: Mean values of the log of audit hours (LAHit) and the instrumented log of audit hours (ILAHit), after partitioning the sample by the
sign of abnormal accruals
Positive abnormal
accruals (DAit 4 0)
Negative abnormal
accruals (DAito0)
t-statistics for the
differences in
hours
Mean of LAHit 5.223 5.257 �2.55**
Mean of ILAHit 5.224 5.256 �2.53**
Panel C: Mean values of the log of audit hours (LAHit) and the instrumented log of audit hours (ILAHit), after partitioning the sample by
median positive abnormal accruals
Large positive
abnormal accruals
(DAit 4 0.074)
Small positive abnormal
accruals (0 oDAito0.074)
t-statistics for the
differences in
hours
Mean of LAHit 5.186 5.260 �3.93***
Mean of ILAHit 5.188 5.261 �4.16***
Panel D: Mean values of the log of audit hours (LAHit) and the instrumented log of audit hours (ILAHit), after partitioning the sample by
median negative abnormal accruals
Large negative
abnormal accruals
(DAito�0.088)
Small negative abnormal
accruals
(04DAit4�0.088)
t-statistics for the
differences in
hours
Mean of LAHit 5.244 5.269 �1.37
Mean of ILAHit 5.243 5.269 �1.52
***Statistically significant at the 1% level (two-tailed).
**Statistically significant at the 5% level (two-tailed).
DAit ¼ the residual from estimating the cross-sectional Jones model. LAHit ¼ Log of audit hours for company i in year t.
ILAHit ¼ Instrumented log of audit hours for company i in year t. We instrument for audit hours using the predicted value of the log
of hours from model 3 of Table 3.
C. Caramanis, C. Lennox / Journal of Accounting and Economics 45 (2008) 116–138126
consistent with auditors having asymmetric incentives with regard to income-increasing and income-decreasing earnings management.
4.3. The earnings management models
Next, we estimate the earnings management models in Eqs. (2)–(4). To recap, the dependent variablesindicate whether abnormal accruals are positive or negative (Sign_DAit) as well as the magnitude of positiveabnormal accruals (DAit
+) and negative abnormal accruals (DAit�). In each model, the experimental variables
are the log of audit hours (LAHit) and the instrumented log of hours (ILAHit).We first use a Hausman test to investigate whether there is any endogeneity bias for the LAHit variable. We
find insignificant evidence of an endogeneity bias at the 5% level (w2 ¼ 3.80), which has two importantimplications. First, we should obtain similar results using either single-equation estimation (the LAHit
variable) or IV estimation (the ILAHit variable). This is important because Larcker and Rusticus (2005) raise

ARTICLE IN PRESSC. Caramanis, C. Lennox / Journal of Accounting and Economics 45 (2008) 116–138 127
important concerns about the robustness of IV estimation compared to single-equation modeling.6 Second,the ILAHit variable is likely to be a valid instrument because the LAHit variable passes the Hausman test. Thatis, LAHit�1 is unlikely to be correlated with uit because LAHit is uncorrelated with uit. Confirming thisexpectation, we find that the ILAHit variable passes the Sargan test for instrument validity at the 5% level(Sargan statistic ¼ 3.56).7 Thus, we have good reason to believe that ILAHit is a valid instrument for audithours.
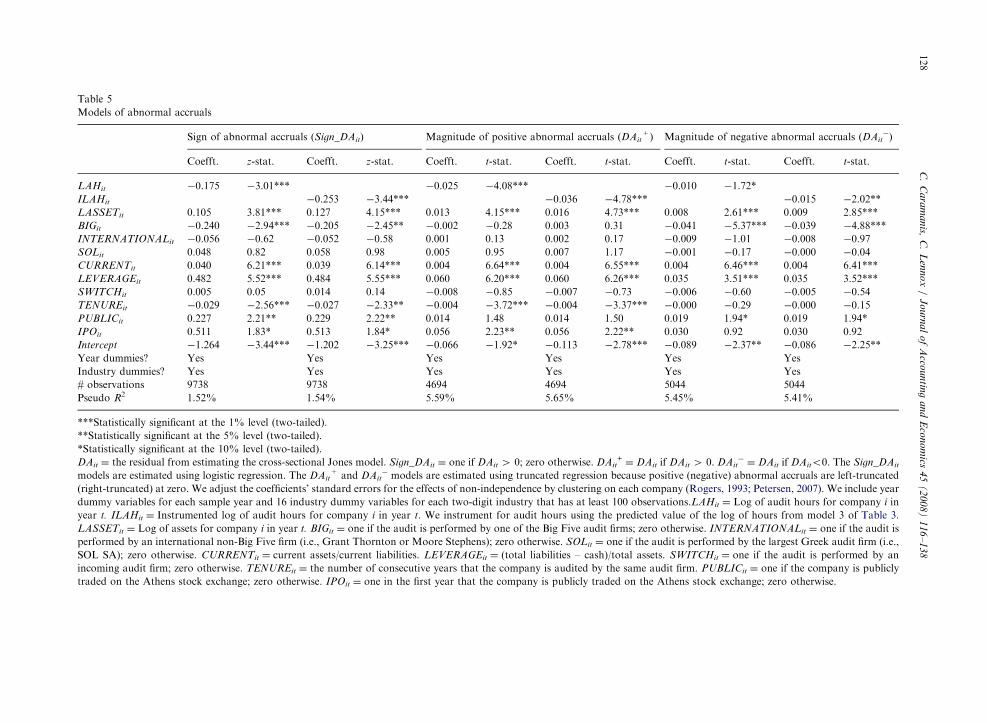
Table 5 shows that the hours coefficients are significantly negative in the Sign_DAit models (z-statistics ¼ �3.01 and �3.44, respectively). Therefore, abnormal accruals are more likely to be income-increasing than income-decreasing when audit hours are lower. The hours coefficients are also significantlynegative in the DAit
+ models (t-statistics ¼ �4.08 and �4.78, respectively), indicating that income-increasingabnormal accruals are significantly larger when audit hours are lower. The hours coefficients are also negativein the DAit
� models, but they are relatively small in magnitude and they are only marginally significant (t-statistics ¼ �1.72 and �2.02, respectively). Overall, these multivariate results are consistent with theunivariate results reported in Table 4.
To assess the economic magnitude of the association between audit hours and income-increasing abnormalaccruals, we examine the effect of a one standard deviation increase in audit hours. The economic magnitudesare calculated using the ILAHit coefficients in Models 2 and 4 of Table 5 with the control variables evaluatedat their means. The mean and standard deviation of the log of hours are 5.24 and 0.65, respectively (see Table2), so we examine the effect of an increase in the log of hours from 4.91 ( ¼ 5.24�(0.65C2)) to 5.56( ¼ 5.24+(0.65C2)). In unlogged terms, this is equivalent to an increase in audit hours from 136 to 261. Thedependent variables in Models 2 and 4 of Table 5 are Sign_DAit and DAit
+, so we examine how the change inhours affects the predicted probability that abnormal accruals are positive (Sign_DAit ¼ 1) and the predictedmagnitude of positive abnormal accruals (DAit
+).The results are shown in Fig. 1. The predicted probability that abnormal accruals are positive falls from
51.5% to 45.0% as hours increase from 136 to 261. Over the same range, the predicted magnitude of income-increasing abnormal accruals falls from 0.132 to 0.108, a drop of 18.2%. Thus, the negative associationbetween audit hours and income-increasing abnormal accruals is economically significant as well asstatistically significant.
The coefficients on the control variables in Table 5 are broadly consistent with extant research. The BIGit
coefficients are significantly negative in the Sign_DAit and DAit�models but they are insignificant in the DAit
+
model. These results confirm that Big Five firms are negatively associated with signed abnormal accruals(Becker et al., 1998). The LASSETit coefficients are significantly positive, indicating that large companies aremore likely to manage earnings upwards. One explanation is that larger companies have more outsideownership, which increases the agency problem between managers and shareholders. The positiveCURRENTit coefficients indicate that signed abnormal accruals are positively associated with liquidity(Butler et al., 2004). Similarly, the LEVERAGEit coefficients are positive, which means that abnormal accrualsare more likely to be income-increasing when leverage is high, and the magnitude of income-increasing(income-decreasing) earnings management is positively (negatively) related to leverage. This is consistent withearnings management studies that use leverage as a proxy for closeness to debt constraints.
We find that abnormal accruals are not significantly different during the first audit by an incoming auditfirm (SWITCHit). However, abnormal accruals are less likely to be income-increasing when audit firm tenure(TENUREit) is long, and the magnitude of income-increasing abnormal accruals is negatively related to tenure(see Myers et al., 2003). Consistent with equity market incentives being important (e.g., Teoh et al., 1998),abnormal accruals tend to be income-increasing if companies are publicly quoted (PUBLICit) or theyundertake initial public offerings (IPOit).
6Larcker and Rusticus (2005) point out that IV estimation is unlikely to be robust when instrumental variables lack power. We expect IV
to be robust in our setting because, as revealed in Table 3, the lagged hours variable (LAHit�1) is a very powerful predictor of hours in the
current year (LAHit).7The Sargan test requires that the instrumented variable (ILAHit) is over-identified. This requirement is met by our test because lagged
audit hours (LAHit-1) and the individual audit firm dummy variables are included in the audit effort model (Col. 3 of Table 3) but they are
excluded from the earnings management models.
ARTIC
LEIN
PRES
S
Table 5
Models of abnormal accruals
Sign of abnormal accruals (Sign_DAit) Magnitude of positive abnormal accruals (DAit+) Magnitude of negative abnormal accruals (DAit
�)
Coefft. z-stat. Coefft. z-stat. Coefft. t-stat. Coefft. t-stat. Coefft. t-stat. Coefft. t-stat.
LAHit �0.175 �3.01*** �0.025 �4.08*** �0.010 �1.72*
ILAHit �0.253 �3.44*** �0.036 �4.78*** �0.015 �2.02**
LASSETit 0.105 3.81*** 0.127 4.15*** 0.013 4.15*** 0.016 4.73*** 0.008 2.61*** 0.009 2.85***
BIGit �0.240 �2.94*** �0.205 �2.45** �0.002 �0.28 0.003 0.31 �0.041 �5.37*** �0.039 �4.88***
INTERNATIONALit �0.056 �0.62 �0.052 �0.58 0.001 0.13 0.002 0.17 �0.009 �1.01 �0.008 �0.97
SOLit 0.048 0.82 0.058 0.98 0.005 0.95 0.007 1.17 �0.001 �0.17 �0.000 �0.04
CURRENTit 0.040 6.21*** 0.039 6.14*** 0.004 6.64*** 0.004 6.55*** 0.004 6.46*** 0.004 6.41***
LEVERAGEit 0.482 5.52*** 0.484 5.55*** 0.060 6.20*** 0.060 6.26*** 0.035 3.51*** 0.035 3.52***
SWITCHit 0.005 0.05 0.014 0.14 �0.008 �0.85 �0.007 �0.73 �0.006 �0.60 �0.005 �0.54
TENUREit �0.029 �2.56*** �0.027 �2.33** �0.004 �3.72*** �0.004 �3.37*** �0.000 �0.29 �0.000 �0.15
PUBLICit 0.227 2.21** 0.229 2.22** 0.014 1.48 0.014 1.50 0.019 1.94* 0.019 1.94*
IPOit 0.511 1.83* 0.513 1.84* 0.056 2.23** 0.056 2.22** 0.030 0.92 0.030 0.92
Intercept �1.264 �3.44*** �1.202 �3.25*** �0.066 �1.92* �0.113 �2.78*** �0.089 �2.37** �0.086 �2.25**
Year dummies? Yes Yes Yes Yes Yes Yes
Industry dummies? Yes Yes Yes Yes Yes Yes
# observations 9738 9738 4694 4694 5044 5044
Pseudo R2 1.52% 1.54% 5.59% 5.65% 5.45% 5.41%
***Statistically significant at the 1% level (two-tailed).
**Statistically significant at the 5% level (two-tailed).
*Statistically significant at the 10% level (two-tailed).
DAit ¼ the residual from estimating the cross-sectional Jones model. Sign_DAit ¼ one if DAit 4 0; zero otherwise. DAit+¼ DAit if DAit 4 0. DAit
�¼ DAit if DAito0. The Sign_DAit
models are estimated using logistic regression. The DAit+ and DAit
� models are estimated using truncated regression because positive (negative) abnormal accruals are left-truncated
(right-truncated) at zero. We adjust the coefficients’ standard errors for the effects of non-independence by clustering on each company (Rogers, 1993; Petersen, 2007). We include year
dummy variables for each sample year and 16 industry dummy variables for each two-digit industry that has at least 100 observations.LAHit ¼ Log of audit hours for company i in
year t. ILAHit ¼ Instrumented log of audit hours for company i in year t. We instrument for audit hours using the predicted value of the log of hours from model 3 of Table 3.
LASSETit ¼ Log of assets for company i in year t. BIGit ¼ one if the audit is performed by one of the Big Five audit firms; zero otherwise. INTERNATIONALit ¼ one if the audit is
performed by an international non-Big Five firm (i.e., Grant Thornton or Moore Stephens); zero otherwise. SOLit ¼ one if the audit is performed by the largest Greek audit firm (i.e.,
SOL SA); zero otherwise. CURRENTit ¼ current assets/current liabilities. LEVERAGEit ¼ (total liabilities – cash)/total assets. SWITCHit ¼ one if the audit is performed by an
incoming audit firm; zero otherwise. TENUREit ¼ the number of consecutive years that the company is audited by the same audit firm. PUBLICit ¼ one if the company is publicly
traded on the Athens stock exchange; zero otherwise. IPOit ¼ one in the first year that the company is publicly traded on the Athens stock exchange; zero otherwise.
C.
Ca
ram
an
is,C
.L
enn
ox
/J
ou
rna
lo
fA
ccou
ntin
ga
nd
Eco
no
mics
45
(2
00
8)
11
6–
13
8128

ARTICLE IN PRESS
0.45
0.47
0.49
0.51
^P
r(Sig
n_D
Ait =
1)
136 161 186 211 236 261
Audit hours
0.105
0.115
0.125
0.135
^D
A+ it
136 161 186 211 236 261
Audit hours
Fig. 1. The associations between audit hours and positive abnormal accruals. The associations are calculated using the ILAHit coefficients
in Models 2 and 4 of Table 5, with the control variables evaluated at their means. The vertical axes show the predicted probability that
abnormal accruals are positive (Sign_DAit ¼ 1) and the predicted magnitude of positive abnormal accruals (DAit+). The mean and
standard deviation of the log of audit hours are 5.24 and 0.65, respectively (see Table 2). We calculate the effect of a one standard deviation
change in the log of audit hours around the mean (i.e., 5.247(0.65C2)). This implies that the unlogged values for audit hours range from
136 to 261 on the horizontal axes.
C. Caramanis, C. Lennox / Journal of Accounting and Economics 45 (2008) 116–138 129
4.4. Income-increasing earnings management to avoid reporting losses
Burgstahler and Dichev (1997) and Degeorge et al. (1999) document that the frequency of small profits isunusually high compared with the earnings distribution as a whole. They suggest that companies manageearnings upwards to report small profits if unmanaged earnings would otherwise be negative.
Degeorge et al. (1999) argue that the incentive to report positive profits is attributable to the psychologicallyimportant distinction between positive and negative earnings numbers. However, there are also importanteconomic reasons why firms may wish to avoid reporting losses. In a survey of firm managers, Graham et al.(2005) note that the occurrence of a loss can trip covenants or otherwise affect relationships with creditors andbanks. Begley and Freedman (2004) provide archival evidence that profits and losses are not treated equally indebt covenants. They find that typically 50% of net profits are available for paying dividends, while the abilityto pay dividends is reduced by 100% of net losses. Begley and Freedman (2004) speculate that such covenantrestrictions may explain why companies are reluctant to report losses.
Consistent with losses being penalized more heavily than profits are rewarded, the association betweenreported earnings and companies’ credit ratings has been found to be asymmetric. For example, Ashbaugh-Skaife et al. (2006) document a significant negative association between a loss dummy and credit ratings, evenafter including a continuous control variable for the return on assets. Moreover, debt covenants are set more

ARTICLE IN PRESS
0
200
400
600
800
1000
1200
1400
Fre
quen
cy
-0.2 -0.1 0 0.1 0.2 0.3
Return on assets
Fig. 2. The distribution of the return on assets (net income divided by total assets). The distribution range is from �20% to +30% and
the interval widths are 1%. The curve is fitted using kernel density estimation, where the frequency for each interval is estimated using the
adjacent four bins.
C. Caramanis, C. Lennox / Journal of Accounting and Economics 45 (2008) 116–138130
tightly in private lending agreements than in public covenants because it is less costly to renegotiate withprivate lenders such as banks (Smith and Warner, 1979; Dichev and Skinner, 2002). Since the majority ofcompanies in our sample are private, it is likely that they have significant incentives to avoid reporting losses.
Some researchers have challenged the premise that the discontinuity in the earnings distribution is a goodindicator of earnings management. Dechow et al. (2003) estimate what the frequency of small profits would bein the absence of a discontinuity in the earnings distribution (i.e., in the absence of earnings management) andthey find that the observed frequency of US companies reporting small profits is only 10–15% higher than itwould be if companies did not manage earnings. Thus, they conclude that small reported profits captureincome-increasing earnings management with significant noise.
Fig. 2 shows the distribution of the return on assets, ROA, in Greece. If companies manage earnings upwardto avoid reporting losses, we expect a discontinuity in the earnings distribution around zero. Fig. 2 reveals thatsmall positive earnings occur much more frequently than would be expected given the smoothness of theremainder of the earnings distribution. In particular, there are 1,249 ROA observations between 0% and+1% compared to only 311 ROA observations between 0% and �1%.
Following Dechow et al. (2003), we estimate what the frequency of each earnings interval would be in theabsence of a discontinuity in the earnings distribution. In Fig. 2, we fit a curve to the earnings distributionusing kernel density estimation, where the frequency of each earnings interval is estimated using the adjacentfour intervals (Silverman, 1986). The curve indicates that approximately 620 observations would lie between0% and +1% in the absence of a discontinuity. Thus, the frequency of Greek companies reporting smallprofits is approximately double what would be expected given the smoothness of the remainder of the earningsdistribution. This finding is consistent with earnings management being very common in Greece and, moreimportantly, it means that the incidence of small reported profits is a relatively powerful indicator of income-increasing earnings management.8
In light of Fig. 2, we expect that Greek companies manage reported earnings upwards in order to avoidreporting losses.9 To reflect this, we create two alternative earnings management variables by combining theabnormal accruals measure with the incidence of small reported profits. The first variable (SMALL1it) equalsone if ROA is in the range [0, +0.01] and abnormal accruals are positive and the unmanaged ROA is negative(zero otherwise). Within the sample of 9,738 audits, there are 633 (6.5%) observations where SMALL1it
8Recent studies provide evidence that earnings management is responsible for the discontinuity in the US earnings distribution (Jacob
and Jorgensen, 2007; Kerstein and Rai, 2007).9We do not use the meet/beat analyst forecast benchmark because there is little analyst following of Greek companies. We do not use the
zero earnings change benchmark because we find no discontinuity in the earnings change distribution. Moreover, we find an insignificant
multivariate association between the audit effort variables (ILAHit and LAHit) and earnings changes (t-statistics ¼ �0.40, �1.58).
ARTICLE IN PRESSC. Caramanis, C. Lennox / Journal of Accounting and Economics 45 (2008) 116–138 131
equals one. Thus, the SMALL1it variable measures income-increasing earnings management much morenarrowly than does the incidence of positive abnormal accruals (N ¼ 4,694) or the incidence of small positiveprofits (N ¼ 1,249). Reassuringly, the 633 observations where SMALL1it equals one is almost exactly equal tothe excess number of small positive ROA observations based on Fig. 2 (i.e., 629 ¼ 1,249�620).
There are 9,105 ( ¼ 9,738�633) observations where SMALL1it equals zero (i.e., no income-increasingearnings management) and, in some cases, audit effort may not explain the absence of income-increasingearnings management. For example, companies that earn large profits would not need to manage earningsupwards to avoid reporting losses. Also, companies with large losses may be unable to manage earningsupwards sufficiently to report small profits. We therefore create a second variable where observations aredropped if ROA is less than -0.01 or greater than +0.01. Specifically, SMALL2it equals one if ROA is in therange [0, +0.01] and abnormal accruals are positive and the unmanaged ROA is negative; SMALL2it equalszero if ROA is in the range [�0.01, 0).
Both the SMALL1it and SMALL2it variables have 633 observations equal to one (i.e., income-increasingearnings management). However, there are 9,105 observations where SMALL1it equals zero compared to only311 observations where SMALL2it equals zero (i.e., no income-increasing earnings management). Comparedto SMALL1it, the SMALL2it variable has the advantage that the absence of income-increasing earningsmanagement is more likely to be due to high audit effort, although it has the disadvantage of a much smallersample (N ¼ 633+311).
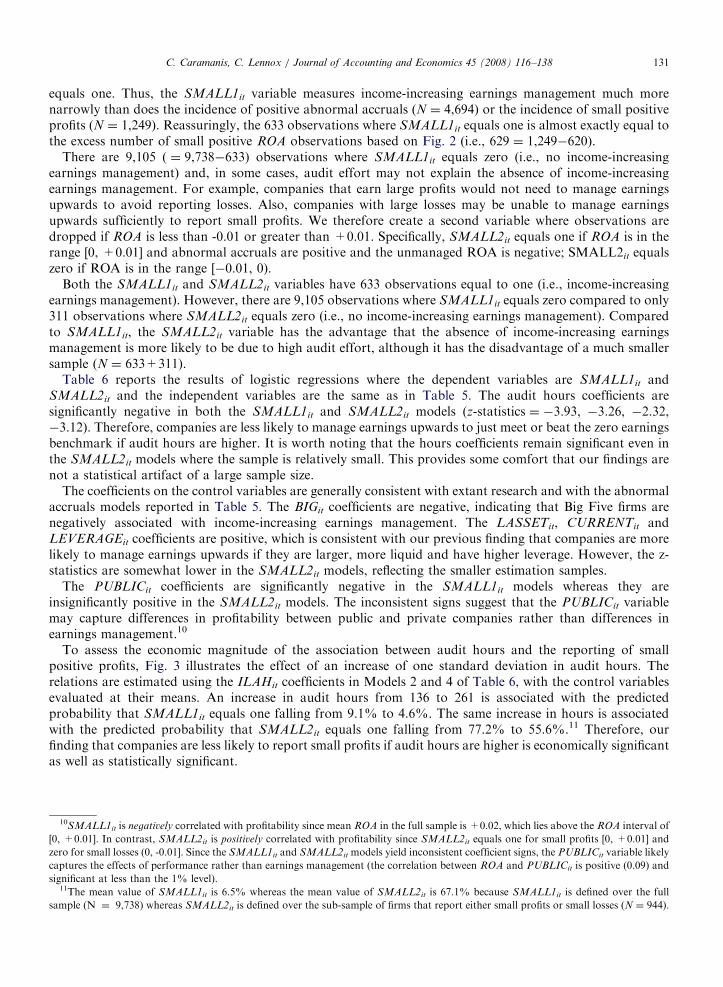
Table 6 reports the results of logistic regressions where the dependent variables are SMALL1it andSMALL2it and the independent variables are the same as in Table 5. The audit hours coefficients aresignificantly negative in both the SMALL1it and SMALL2it models (z-statistics ¼ �3.93, �3.26, �2.32,�3.12). Therefore, companies are less likely to manage earnings upwards to just meet or beat the zero earningsbenchmark if audit hours are higher. It is worth noting that the hours coefficients remain significant even inthe SMALL2it models where the sample is relatively small. This provides some comfort that our findings arenot a statistical artifact of a large sample size.
The coefficients on the control variables are generally consistent with extant research and with the abnormalaccruals models reported in Table 5. The BIGit coefficients are negative, indicating that Big Five firms arenegatively associated with income-increasing earnings management. The LASSETit, CURRENTit andLEVERAGEit coefficients are positive, which is consistent with our previous finding that companies are morelikely to manage earnings upwards if they are larger, more liquid and have higher leverage. However, the z-statistics are somewhat lower in the SMALL2it models, reflecting the smaller estimation samples.
The PUBLICit coefficients are significantly negative in the SMALL1it models whereas they areinsignificantly positive in the SMALL2it models. The inconsistent signs suggest that the PUBLICit variablemay capture differences in profitability between public and private companies rather than differences inearnings management.10
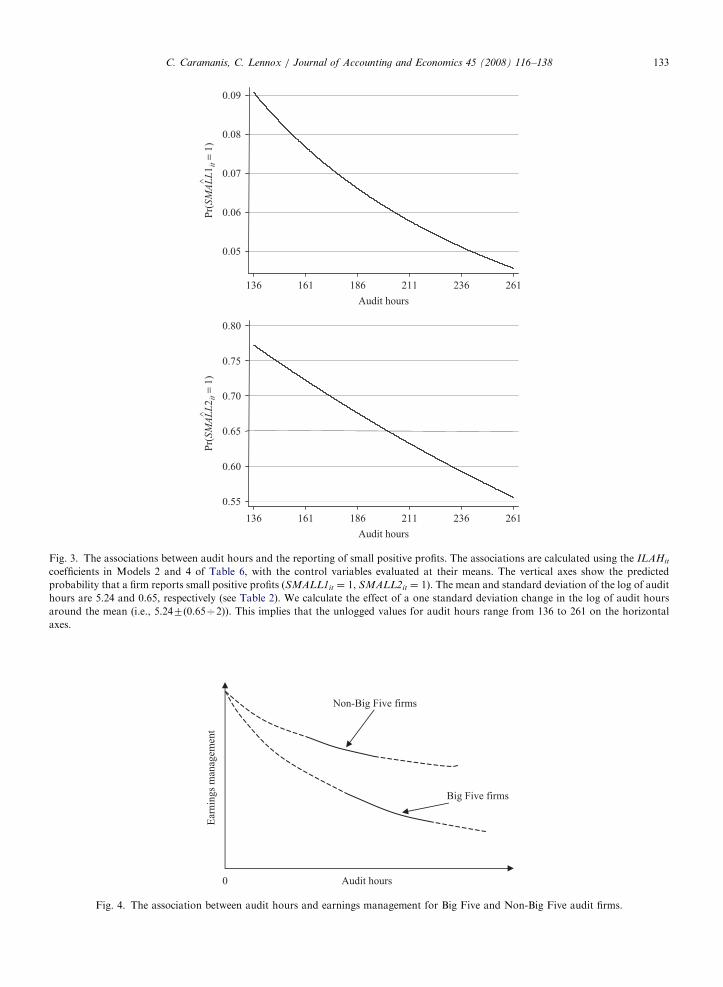
To assess the economic magnitude of the association between audit hours and the reporting of smallpositive profits, Fig. 3 illustrates the effect of an increase of one standard deviation in audit hours. Therelations are estimated using the ILAHit coefficients in Models 2 and 4 of Table 6, with the control variablesevaluated at their means. An increase in audit hours from 136 to 261 is associated with the predictedprobability that SMALL1it equals one falling from 9.1% to 4.6%. The same increase in hours is associatedwith the predicted probability that SMALL2it equals one falling from 77.2% to 55.6%.11 Therefore, ourfinding that companies are less likely to report small profits if audit hours are higher is economically significantas well as statistically significant.
10SMALL1it is negatively correlated with profitability since mean ROA in the full sample is +0.02, which lies above the ROA interval of
[0, +0.01]. In contrast, SMALL2it is positively correlated with profitability since SMALL2it equals one for small profits [0, +0.01] and
zero for small losses (0, -0.01]. Since the SMALL1it and SMALL2it models yield inconsistent coefficient signs, the PUBLICit variable likely
captures the effects of performance rather than earnings management (the correlation between ROA and PUBLICit is positive (0.09) and
significant at less than the 1% level).11The mean value of SMALL1it is 6.5% whereas the mean value of SMALL2it is 67.1% because SMALL1it is defined over the full
sample (N ¼ 9,738) whereas SMALL2it is defined over the sub-sample of firms that report either small profits or small losses (N ¼ 944).
ARTICLE IN PRESS
Table 6
Income-increasing earnings management to report small positive profits
Dependent variable ¼ SMALL1it Dependent variable ¼ SMALL2itv
Coefft. z-stat. Coefft. z-stat. Coefft. z-stat. Coefft. z-stat.
LAHit �0.542 �3.93*** �0.531 �2.32**
ILAHit �0.540 �3.26*** �0.930 �3.12***
LASSETit 0.415 5.70*** 0.413 5.22*** 0.401 3.80*** 0.513 4.34***
BIGit �0.478 �2.25** �0.472 �2.16** �0.676 �2.33** �0.494 �1.64
INTERNATIONALit 0.204 0.95 0.202 0.94 �0.244 �0.79 �0.208 �0.67
SOLit 0.171 1.28 0.170 1.27 0.097 0.47 0.142 0.69
CURRENTit 0.057 5.92*** 0.058 5.99*** 0.015 0.75 0.011 0.56
LEVERAGEit 1.215 6.59*** 1.205 6.48*** 0.406 1.06 0.390 1.01
SWITCHit �0.164 �0.87 �0.160 �0.84 �0.003 �0.01 0.100 0.25
TENUREit �0.035 �1.45 �0.035 �1.43 �0.036 �0.91 �0.022 �0.54
PUBLICit �0.878 �3.08*** �0.905 �3.14*** 0.162 0.38 0.300 0.74
IPOit 0.147 0.19 0.182 0.23 �0.653 �0.59 �0.552 �0.51
Intercept �7.080 �7.83*** �7.051 �7.90*** �2.987 �1.89* �2.448 �1.52
Year dummies? Yes Yes Yes Yes
Industry dummies? Yes Yes Yes Yes
# observations 9738 9738 944 944
Pseudo R2 6.12% 6.31% 8.24% 8.65%
***Statistically significant at the 1% level (two-tailed).
**Statistically significant at the 5% level (two-tailed).
*Statistically significant at the 10% level (two-tailed).
The models are estimated using logistic regression. We adjust the coefficients’ standard errors for the effects of non-independence by
clustering on each company (Rogers, 1993; Petersen, 2007). We include year dummy variables for each sample year and 16 industry
dummy variables for each two-digit industry that has at least 100 observations.
SMALL1it ¼ one if the return on assets is in the range [0, 0.01] and abnormal accruals are positive and the unmanaged return on assets is
negative; zero otherwise.
SMALL2it ¼ one if the return on assets is in the range [0, 0.01] and abnormal accruals are positive and the unmanaged return on assets is
negative; zero if the return on assets is in the range (0, �0.01].
LAHit ¼ Log of audit hours for company i in year t. ILAHit ¼ Instrumented log of audit hours for company i in year t. We instrument for
audit hours using the predicted value of the log of hours from model 3 of Table 3. LASSETit ¼ Log of assets for company i in year t.
BIGit ¼ one if the audit is performed by one of the Big Five audit firms; zero otherwise. INTERNATIONALit ¼ one if the audit is
performed by an international non-Big Five firm (i.e., Grant Thornton or Moore Stephens); zero otherwise. SOLit ¼ one if the audit is
performed by the largest Greek audit firm (i.e., SOL SA); zero otherwise. CURRENTit ¼ current assets/current liabilities.
LEVERAGEit ¼ (total liabilities�cash)/total assets. SWITCHit ¼ one if the audit is performed by an incoming audit firm; zero
otherwise. TENUREit ¼ the number of consecutive years that the company is audited by the same audit firm. PUBLICit ¼ one if the
company is publicly traded on the Athens stock exchange; zero otherwise. IPOit ¼ one in the first year that the company is publicly traded
on the Athens stock exchange; zero otherwise.
C. Caramanis, C. Lennox / Journal of Accounting and Economics 45 (2008) 116–138132
4.5. The interaction between audit effort and audit firm size
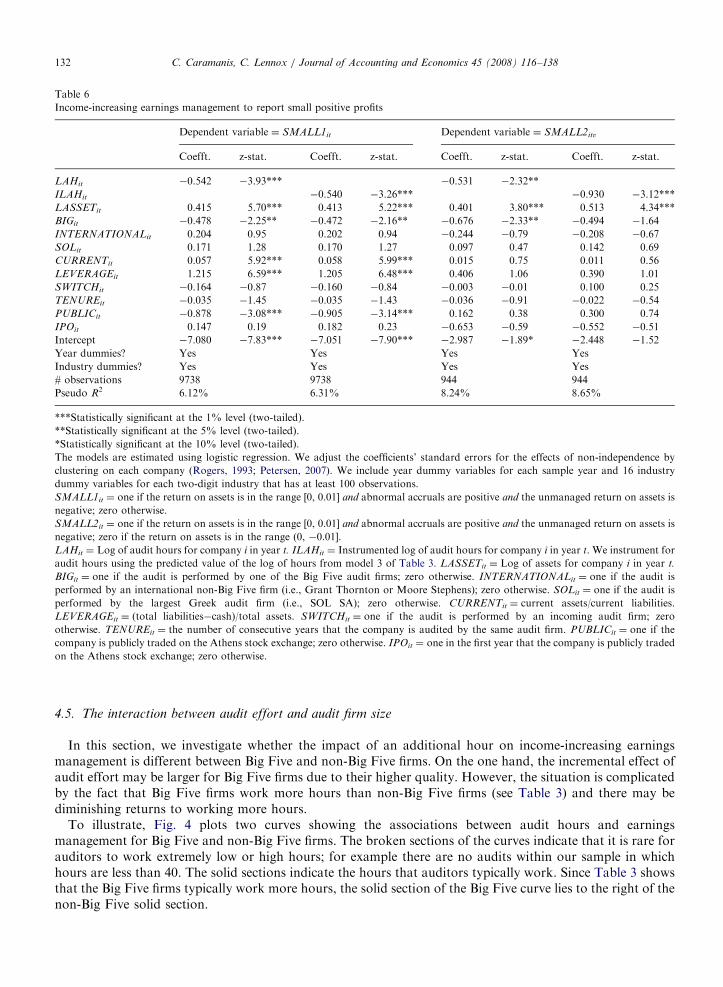
In this section, we investigate whether the impact of an additional hour on income-increasing earningsmanagement is different between Big Five and non-Big Five firms. On the one hand, the incremental effect ofaudit effort may be larger for Big Five firms due to their higher quality. However, the situation is complicatedby the fact that Big Five firms work more hours than non-Big Five firms (see Table 3) and there may bediminishing returns to working more hours.
To illustrate, Fig. 4 plots two curves showing the associations between audit hours and earningsmanagement for Big Five and non-Big Five firms. The broken sections of the curves indicate that it is rare forauditors to work extremely low or high hours; for example there are no audits within our sample in whichhours are less than 40. The solid sections indicate the hours that auditors typically work. Since Table 3 showsthat the Big Five firms typically work more hours, the solid section of the Big Five curve lies to the right of thenon-Big Five solid section.
ARTICLE IN PRESS
Ear
nin
gs
man
agem
ent
Non-Big Five firms
Big Five firms
0 Audit hours
Fig. 4. The association between audit hours and earnings management for Big Five and Non-Big Five audit firms.
0.05
0.06
0.07
0.08
0.09
136 161 186 211 236 261
^P
r(SM
AL
L1
it =
1)
0.55
0.60
0.65
0.70
0.75
0.80
^P
r(SM
AL
L2
it =
1)
136 161 186 211 236 261
Audit hours
Audit hours
Fig. 3. The associations between audit hours and the reporting of small positive profits. The associations are calculated using the ILAHit
coefficients in Models 2 and 4 of Table 6, with the control variables evaluated at their means. The vertical axes show the predicted
probability that a firm reports small positive profits (SMALL1it ¼ 1, SMALL2it ¼ 1). The mean and standard deviation of the log of audit
hours are 5.24 and 0.65, respectively (see Table 2). We calculate the effect of a one standard deviation change in the log of audit hours
around the mean (i.e., 5.247(0.65C2)). This implies that the unlogged values for audit hours range from 136 to 261 on the horizontal
axes.
C. Caramanis, C. Lennox / Journal of Accounting and Economics 45 (2008) 116–138 133

ARTICLE IN PRESSC. Caramanis, C. Lennox / Journal of Accounting and Economics 45 (2008) 116–138134
Both functions are assumed to be downward sloping because we expect that companies are less likely tomanage earnings upwards if auditors work harder. The relations are convex to the origin because the marginalimpact of an additional audit hour on earnings management may diminish as hours increase (see also Figs. 1and 2). In the estimated regressions, this non-linearity is captured using a logarithmic transformation for audithours.
Crucially, it is unclear whether the negative slopes are expected to be steeper for Big Five or non-Big Fivefirms along the solid sections of their curves. On the one hand, the marginal effect of an additional hour maybe greater for Big Five firms if they supply higher quality audits for any given number of hours. In contrast,the marginal effect of an additional hour may be larger for non-Big Five firms due to the diminishing returnsthat Big Five firms experience by working more hours.
We investigate this open empirical question by interacting audit hours and audit firm size (ILAHit*BIGit).The interaction coefficient may be negative if an additional Big Five hour has a bigger negative impact onincome-increasing earnings management than does an additional non-Big Five hour. On the other hand, theremay be a positive coefficient for the ILAHit*BIGit variable if the return to working harder diminishessufficiently quickly.
The results are reported in Table 7. The ILAHit*BIGit coefficients are negative and statistically significant,indicating that greater effort by Big Five firms has a bigger impact on earnings management than does greatereffort by non-Big Five firms. The ILAHit coefficients are also negative and statistically significant, whichindicates that audit effort by non-Big Five firms also reduces income-increasing earnings management.Overall, these results indicate that the solid sections of both curves are downward-sloping (consistent withFig. 4) and that the Big Five solid section is steeper. Therefore, it seems that an additional Big Five hour has abigger negative impact on income-increasing earnings management than does an additional non-Big Five hour(i.e., diminishing returns are not sufficiently strong to give the opposite result).
In untabulated tests we use actual hours (LAHit) rather than instrumented hours (ILAHit) in the models ofTable 7. The LAHit and LAHit*BIGit coefficients are found to be negative in all four models and they aremostly significant. Specifically, the t- and z-statistics for the LAHit coefficients are �2.15, �3.26, �3.22 and�1.21 in Models (1) to (4). The t- and z-statistics for LAHit*BIGit are �2.12, �1.56, �2.46 and �2.82,respectively. Therefore, the results in Table 7 largely hold whether we measure audit effort using actual hours(LAHit) or instrumented hours (ILAHit).
It is worth noting that the BIGit coefficients are positive in Table 7 although they are not all statisticallysignificant. To evaluate the net effect of audit firm size on earnings management, it is necessary to account forboth the positive coefficients on BIGit and the negative coefficients on the interaction term (ILAHit*BIGit).For example, the BIG coefficient is 0.952 and the ILAHit*BIGit coefficient is �0.205 in Model 1, which impliesthat the net effect of audit firm size on earnings management is given by 0.952–0.205*ILAHit. Since the meanvalue of ILAHit is 5.24 (Table 2), the net effect of having a Big Five auditor is negative for the averagecompany (-0.122 ¼ 0.952–0.205*5.24).
12 Similarly, we verify that the net effects of audit firm size are negativewhen we use the coefficient estimates for BIGit and ILAHit*BIGit in Models (2), (3) and (4) of Table 7. Thatthe net effects are negative is consistent with the negative coefficients for BIGit in Tables 5 and 6.
4.6. Untabulated sensitivity tests
We have treated the company’s choice of audit firm as pre-determined whereas, in reality, the company canchoose which audit firm to hire. This raises another endogeneity issue because a company may hire a lower-quality audit firm if it intends to manage earnings. We argue that endogeneity is more likely to be a problem ifaudit firm tenure is short. For example, suppose that two companies intend to manage earnings in 2001 andboth companies are audited by the same low-quality audit firm. Suppose also that company A initially hiredits audit firm in 1997 whereas company B initially hired the same audit firm in 2001. We argue that company Bis more likely to have hired the low-quality firm because it intends to manage its 2001 earnings. Endogeneity is
12We acknowledge that the net effect is estimated to be positive at very low levels of audit hours, for example the net effect is 0.952 when
ILAHit equals zero. However, it is difficult to estimate the slope of the curve precisely when audit hours are very low or very high because
there are relatively few observations in these regions.

ARTICLE IN PRESS
Table 7
The interaction between audit hours and audit firm size
The dependent variable is:
Sign_DAit DAit+ SMALL1it SMALL2it
Coefft. z-stat. Coefft. t-stat. Coefft. z-stat. Coefft. z-stat.
ILAHit �0.213 �2.81*** �0.031 �3.91*** �0.473 �2.77*** �0.678 �2.18**
ILAHit*BIGit �0.205 �1.80* -0.024 �1.97** -0.451 �2.02** �1.745 �3.16***
LASSETit 0.128 4.15*** 0.016 4.72*** 0.413 5.26*** 0.522 4.36***
BIGit 0.952 1.46 0.140 1.99** 2.084 1.66* 9.492 2.95***
INTERNATIONALit �0.051 �0.57 0.002 0.18 0.204 0.95 �0.203 �0.66
SOLit 0.053 0.91 0.006 1.08 0.162 1.21 0.123 0.60
CURRENTit 0.040 6.19*** 0.004 6.58*** 0.059 6.00*** 0.015 0.75
LEVERAGEit 0.481 5.51*** 0.060 6.20*** 1.206 6.45*** 0.404 1.11
SWITCHit 0.004 0.04 �0.008 �0.84 �0.177 �0.93 0.078 0.20
TENUREit �0.028 �2.44** �0.004 �3.50*** �0.037 �1.53 �0.037 �0.88
PUBLICit 0.223 2.17** 0.013 1.44 �0.908 �3.17*** 0.268 0.66
IPOit 0.504 1.80* 0.055 2.16** 0.156 0.20 �0.536 �0.53
Intercept �1.420 �3.63*** �0.138 �3.23*** �7.408 �8.04*** �3.942 �2.36**
Year dummies? Yes Yes Yes Yes
Industry dummies? Yes Yes Yes Yes
# observations 9,738 4,694 9,738 944
Pseudo R2 1.57% 5.68% 6.18% 9.59%
***Statistically significant at the 1% level (two-tailed).
**Statistically significant at the 5% level (two-tailed).
*Statistically significant at the 10% level (two-tailed).
DAit ¼ the residual from estimating the cross-sectional Jones model. Sign_DAit ¼ one if DAit 4 0; zero otherwise. DAit+¼ DAit if DAit 4
0. SMALL1it ¼ one if the return on assets is in the range [0, 0.01] and abnormal accruals are positive and the unmanaged return on assets is
negative; zero otherwise. SMALL2it ¼ one if the return on assets is in the range [0, 0.01] and abnormal accruals are positive and the
unmanaged return on assets is negative; zero if the return on assets is in the range (0, �0.01].
The Sign_DAit model is estimated using logistic regression. The DAit+ model is estimated using truncated regression because positive
abnormal accruals are left-truncated at zero. The SMALL1it and SMALL2it models are estimated using logistic regression. We adjust the
coefficients’ standard errors for the effects of non-independence by clustering on each company (Rogers, 1993; Petersen, 2007). We include
year dummy variables for each sample year and 16 industry dummy variables for each two-digit industry that has at least 100 observations.
ILAHit ¼ Instrumented log of audit hours for company i in year t. We instrument for audit hours using the predicted value of the log of
hours from model 3 of Table 3. LASSETit ¼ Log of assets for company i in year t. BIGit ¼ one if the audit is performed by one of the Big
Five audit firms; zero otherwise. INTERNATIONALit ¼ one if the audit is performed by an international non-Big Five firm (i.e., Grant
Thornton or Moore Stephens); zero otherwise. SOLit ¼ one if the audit is performed by the largest Greek audit firm (i.e., SOL SA); zero
otherwise. CURRENTit ¼ current assets/current liabilities. LEVERAGEit ¼ (total liabilities – cash)/total assets. SWITCHit ¼ one if the
audit is performed by an incoming audit firm; zero otherwise. TENUREit ¼ the number of consecutive years that the company is audited
by the same audit firm. PUBLICit ¼ one if the company is publicly traded on the Athens stock exchange; zero otherwise. IPOit ¼ one in
the first year that the company is publicly traded on the Athens stock exchange; zero otherwise.
C. Caramanis, C. Lennox / Journal of Accounting and Economics 45 (2008) 116–138 135
less likely to be an issue for company A because there is a longer lag between the auditor hiring choice and theearnings management decision. Thus, it is reasonable to treat auditor choice as pre-determined when auditfirm tenure is long (Myers et al., 2003).
If the negative associations between audit hours and earnings management are somehow driven by theendogeneity of audit firm choice, we expect the results to disappear (or be much weaker) in a long-tenuresample where audit firm choice is essentially pre-determined. With this in mind, we estimate the earningsmanagement models after partitioning the sample by the median of audit firm tenure (i.e., 4 years).
For the Sign_DAit model, the ILAHit coefficient is �0.188 (z-statistic ¼ �1.91) in the long-tenure sampleand �0.319 (z-statistic ¼ �2.90) in the short-tenure sample. For the DAit
+ model, the ILAHit coefficient is�0.024 (t-statistic ¼ �2.48) in the long-tenure sample and �0.048 (t-statistic ¼ �4.17) in the short-tenuresample. For the SMALL1it model, the ILAHit coefficient is �0.656 (z-statistic ¼ -3.36) in the long-tenuresample and �0.313 (z-statistic ¼ �1.20) in the short-tenure sample. Finally, for the SMALL2it model, the

ARTICLE IN PRESSC. Caramanis, C. Lennox / Journal of Accounting and Economics 45 (2008) 116–138136
ILAHit coefficient is �0.823 (z-statistic ¼ �2.11) in the long-tenure sample and -1.020 (z-statistic ¼ �2.29) inthe short-tenure sample. We obtain similar results in the long and short tenure samples if we measure auditeffort using LAHit instead of ILAHit. Using both LAHit and ILAHit, we find that the hours coefficients are notstatistically different between long and short tenure in the Sign_DAit, SMALL1it and SMALL2it models. Inthe DAit
+ model, the LAHit coefficients are not significantly different between long and short tenure althoughwe do find a significant difference for the ILAHit coefficients (t-statistic ¼ 2.16). Thus, in seven out of eightregressions, the negative associations between audit hours and earnings management are not significantlyassociated with audit firm tenure. Overall, we conclude that the negative associations between audit hours andearnings management do not appear to be driven by the endogeneity of audit firm choice.
Second, Table 3 shows that client size is a very important determinant of audit hours and we assume a log-linear relation between hours and size (LASSETit) when estimating the hours model. If the size effect ismisspecified, it could drive a spurious association between audit hours and earnings management, since clientsize is also a significant variable in the earnings management models. We relax the assumption of a log-linearrelation by sorting companies into ten size deciles and constructing a dummy variable for each size decile. Wereestimate the audit hours model replacing LASSETit with the ten size dummies and, using the coefficientestimates, we predict an alternative instrument for the log of audit hours. Next, we reestimate the models inTables 5, 6, and 7 using the alternative instrument for hours. In every model, we continue to find significantnegative associations between audit hours and earnings management. Moreover, we continue to find that thehours coefficients are significantly more negative for Big Five firms than for non-Big Five firms.
Third, we examine whether the association between audit effort and earnings management is differentbetween the public and private companies. As the Athens stock market is relatively small, there are only 678public company observations and, of these, the SMALL1it and SMALL2it variables equal one in only 21cases. Therefore, there are insufficient public company observations to estimate the small profit modelsreliably. Instead, we estimate the Sign_DAit and DAit
+ models for the public and private company subsamples.In the Sign_DAit models, the hours coefficients are �0.264 (z-statistic ¼ �1.28) for public companies and�0.321 (z-statistic ¼ �4.14) for private companies. In the DAit
+ models, the hours coefficients are �0.045(t-statistic ¼ �2.38) for public companies and �0.041 (t-statistic ¼ �5.26) for private companies. Thedifferences in the hours coefficients between the public and private companies are statistically insignificant.
Fourth, we include the residuals from the audit hours model (Model 3, Table 3) as an additionalindependent variable in the earnings management models. Since the hours model includes a lagged dependentvariable, the residuals capture the unexpected adjustment of audit hours from year t�1 to year t. Thecoefficients for the hours residuals are found to be statistically insignificant in the Sign_DAit, DAit
+, DAit� and
SMALL2it models but significantly negative in the SMALL1it model. Given these mixed results, we are unableto conclude that earnings management is associated with the unexpected adjustment of audit hours from theprevious year.
Finally, we examine whether the results are robust to an alternative measure of loss avoidance. In the casewhere ROA is small and positive but abnormal accruals are income-decreasing, SMALL1it takes the value ofzero; in contrast, these observations are excluded from the SMALL2it model. To determine whether thisresearch design choice affects the results, we construct a third variable (SMALL3it) which equals zero if: (1)the return on assets is in the range (0, -0.01], or (2) the return on assets is in the range [0, 0.01] and abnormalaccruals are negative. Just as with the SMALL1it and SMALL2it variables, SMALL3it is set to one if the ROA
is in the range [0, 0.01] and abnormal accruals are positive and the unmanaged return on assets is negative. TheSMALL3it variable has 1,534 observations and we re-estimate the models in Table 6 using SMALL3it as thedependent variable. We find that the LAHit and ILAHit coefficients remain negative and statisticallysignificant (z-statistics ¼ �2.44, �1.93) and results for the other variables are similar to those tabulated.
5. Conclusions
In analytical models, audit effort reduces the extent to which managers report aggressively high earnings.However, there is no empirical evidence regarding the impact of audit effort on earnings management, withprior studies focusing instead on the impact of auditor independence. To address this gap in the literature, wemeasure audit effort using a unique large database of hours worked by Greek audit firms. We measure

ARTICLE IN PRESSC. Caramanis, C. Lennox / Journal of Accounting and Economics 45 (2008) 116–138 137
earnings management using abnormal accruals and the incidence of small profits. To control for potentialendogeneity between audit hours and earnings management, we use instrumental variable estimation inaddition to single-equation estimation.
There are three main findings, each of which is robust to controlling for endogeneity in audit hours. First,companies are more likely to report income-increasing abnormal accruals than income-decreasing abnormalaccruals, when audit hours are lower. Second, the magnitude of income-increasing abnormal accruals isnegatively related to audit hours. Third, companies are more likely to manage earnings upwards to just meetor beat the zero earnings benchmark, when auditors work fewer hours. These results are consistent withmanagers reporting aggressively high earnings when audit effort is low. Nonetheless, like many previousstudies of earnings management, the explanatory power of our abnormal accruals models is low and thus it isimportant to emphasize that the results should be treated with caution.
We also find weak or insignificant associations between audit hours and the magnitude of negativeabnormal accruals. Consistent with prior research, this suggests that auditors have relatively weak incentivesto prevent income-decreasing earnings management.
References
Ang, J.R., Cole, R., Lin, J., 2000. Agency costs and ownership structure. Journal of Finance 55, 81–106.
Ashbaugh-Skaife, H., Collins, D.W., LaFond, R., 2006. The effects of corporate governance on firms’ credit ratings. Journal of
Accounting and Economics 42, 203–243.
Ball, R., Shivakumar, L., 2005. Earnings quality in UK private firms: comparative loss recognition timeliness. Journal of Accounting and
Economics 39, 83–128.
Baralexis, S., 2004. Creative accounting in small advancing countries: the Greek case. Managerial Auditing Journal 19, 440–461.
Beatty, A., Ke, B., Petroni, K., 2002. Earnings management to avoid earnings declines across publicly and privately held banks. The
Accounting Review 77, 547–570.
Becker, C., Defond, M., Jiambalvo, J., Subramanyam, K., 1998. The effect of audit quality on earnings management. Contemporary
Accounting Research 15, 1–24.
Begley, J., Freedman, R., 2004. The changing role of accounting numbers in public lending agreements. Accounting Horizons 18, 81–96.
Bennedsen, M., Wolfenzon, D., 2000. The balance of power in closely held corporations. Journal of Financial Economics 58, 113–139.
Blackwell, D., Brickley, J., Weisbach, M., 1994. Accounting information and internal performance evaluation: evidence from Texas banks.
Journal of Accounting and Economics 17, 331–358.
Burgstahler, D., Dichev, I., 1997. Earnings management to avoid earnings decreases and losses. Journal of Accounting and Economics 24,
99–129.
Burgstahler, D., Hail, L., Leuz, C., 2006. The importance of reporting incentives: earnings management in European private and public
firms. The Accounting Review 81, 983–1016.
Butler, M., Leone, A., Willenborg, M., 2004. An empirical analysis of auditor reporting and its association with abnormal accruals.
Journal of Accounting and Economics 37, 139–165.
Caramanis, C., Spathis, C., 2006. Auditee and audit firm characteristics as determinants of audit qualifications: evidence from the Athens
stock exchange. Managerial Auditing Journal 21, 905–920.
Collins, D., Hribar, P., 2002. Errors in estimating accruals: implications for empirical research. Journal of Accounting Research 40,
105–135.
Coppens, L., Peek, E., 2005. An analysis of earnings management by European private firms. Journal of International Accounting
Auditing and Taxation 14, 1–17.
DeAngelo, L., 1981. Auditor size and audit quality. Journal of Accounting and Economics 3, 183–199.
Dechow, P.M., Richardson, S.A., Tuna, I., 2003. Why are earnings kinky? An examination of the earnings management explanation.
Review of Accounting Studies 8, 355–384.
DeFond, M.L., Jiambalvo, J., 1993. Factors related to auditor–client disagreements over income-increasing accounting methods.
Contempoary Accounting Research 9, 415–431.
Degeorge, F., Patel, J., Zeckhauser, R., 1999. Earnings manipulation to exceed thresholds. Journal of Business 72, 1–33.
Dichev, I.D., Skinner, D.J., 2002. Large-sample evidence on the debt covenant hypothesis. Journal of Accounting Research 40, 1091–1123.
Dye, R.A., 1993. Auditing standards, legal liability, and auditor wealth. Journal of Political Economy 101, 887–914.
Dye, R.A., 1995. Incorporation and the audit market. Journal of Accounting and Economics 19, 75–114.
Erickson, M., Wang, S.W., 1999. Earnings management by acquiring firms in stock for stock mergers. Journal of Accounting and
Economics 27, 149–176.
Frankel, R., Johnson, M., Nelson, K., 2002. The relation between auditors’ fees for nonaudit services and earnings management. The
Accounting Review 77, 71–105.
Graham, T.R., Harvey, C.R., Rajgopal, S., 2005. The economic implications of corporate financial reporting. Journal of Accounting and
Economics 40, 3–73.

ARTICLE IN PRESSC. Caramanis, C. Lennox / Journal of Accounting and Economics 45 (2008) 116–138138
Hansen, S.C., Watts, J.S., 1997. Two models of the auditor–client interaction: Tests with United Kingdom data. Contemporary
Accounting Research 14, 23–50.
Hillegeist, S.A., 1999. Financial reporting and auditing under alternative damage apportionment rules. The Accounting Review 74,
347–369.
Hribar, P., Nichols, D.C., 2006. The use of unsigned earnings quality measures in tests of earnings management. Working paper, Cornell
University.
Jacob, J., Jorgensen, B.N., 2007. Earnings management and accounting income aggregation. Journal of Accounting and Economics 43,
369–390.
Jones, J., 1991. Earnings management during import relief investigations. Journal of Accounting Research 29, 193–228.
Kellogg, R.L., 1984. Accounting activities, securities prices and class action lawsuits. Journal of Accounting and Economics 6, 185–204.
Kerstein, J., Rai, A., 2007. Intra-year shifts in the earnings distribution and their implications for earnings management. Journal of
Accounting and Economics, in press, doi:10.1016/j.jacceco.2007.04.004.
Kinney Jr., W.R., Martin, R.D., 1994. Does auditing reduce bias in financial reporting? A review of audit-related adjustment studies.
Auditing: A Journal of Practice and Theory 13, 151–156.
Kothari, S.P., Leone, A.J., Wasley, C.E., 2005. Performance matched discretionary accrual measures. Journal of Accounting and
Economics 39, 163–197.
Larcker, D., Rusticus, T., 2005. On the use of instrumental variables in accounting research. SSRN working paper.
Leuz, C., Nanda, D., Wysocki, P.D., 2003. Earnings management and investor protection: an international comparison. Journal of
Financial Economics 69, 505–527.
Lys, T., Watts, R.L., 1994. Lawsuits against auditors. Journal of Accounting Research 32, 65–93.
Maddala, G.S., 1983. Limited-dependent and qualitative variables in econometrics. Econometric Society Monographs. Cambridge
University Press, Cambridge.
Myers, J.N., Myers, L.A., Omer, T.C., 2003. Exploring the term of the auditor–client relationship and the quality of earnings: a case for
mandatory auditor rotation? The Accounting Review 78, 779–799.
Nelson, M., Elliott, J., Tarpley, R., 2002. Evidence from auditors about managers’ and auditors’ earnings management decisions. The
Accounting Review 77 (Supplement), 175–202.
O’Keefe, T.B., Simunic, D.A., Stein, M.T., 1994. The production of audit services: evidence from a major public accounting firm. Journal
of Accounting Research 32, 241–261.
Petersen, M.A., 2007. Estimating standard errors in finance panel data sets: comparing approaches. National Bureau of Economic
Research, Working Paper 11280
Reynolds, J.K., Francis, J., 2000. Does size matter. The influence of large clients on office-level auditor reporting decisions. Journal of
Accounting and Economics 30, 375–400.
Rogers, W.H., 1993. Regression standard errors in clustered samples. Stata Technical Bulletin 3, 88–94.
Silverman, B.W., 1986. Density estimation for statistics and data analysis. Chapman & Hall, London.
Smith, C.W., Warner, J.B., 1979. On financial contracting: an analysis of bond covenants. Journal of Financial Economics 7, 117–161.
Sougiannis, T., Papadaki, A., Siougle, G., 2008. The relevance of quantifiable audit qualifications in the valuation of IPOSs. Review of
Accounting Studies, forthcoming.
St. Pierre, K., Anderson, J., 1984. An analysis of the factors associated with lawsuits against public accountants. The Accounting Review
59, 242–263.
Teoh, S., Welch, I., Wong, T.J., 1998. Earnings management and the long-run market performance of initial public offerings. Journal of
Finance 53, 1935–1974.
Van Caneghem, T., 2005. Audit quality, materiality, and threshold-induced earnings management. Working paper, University of Antwerp.