attracting retailers and sme’s to our regions
TRANSCRIPT

Attracting Retailers and SME’s to regions
Greg Davis taktics4.com.au
Retail Drives Behaviour
1. Isolation from family and friends
2. Reduced access to retail facilities and services
3. Reduced education for kids

Retail Drives Behaviour
Attract skilled
labourforce
Shops/Cafes
Services
I want more
I need more
Retain existing
community
Youth employment
Second incomes
Part time
employment
Heart
Sense of place
Vitality
Vibrancy
Confidence
Economic prosperity

Retail Spending
Regional residents
spend less on retail
Less need?
Less deserving?
Less income?
Less opportunity?
Less Impulse (60%)
Food and non-alcoholic beverages -17%
Tobacco products 7%
Clothing and footwear -30%
Household furnishings and equipment 3%
Household services and operation -10%
Medicines, pharmaceutical 35%
Recreational and educational equipment -15%
Animal expenses 19%
Personal care -20%
Miscellaneous goods and services -25%
TOTAL RETAIL EXPENDITURE -15%Household expenditure (ABS 2009/10) Retail Sales (ABS)
Difference in retail spending – Region v Urban

Retail and Income
Highest incomes earn 7
times more than lowest
incomes
Lowest incomes
40% smaller
2.6 to 1.6 people
Number of mouths
Household expenditure (ABS 2009/10)
Difference in retail spending – lowest to highest incomes

Retail Employment
Retail dominates regional
employment
Less employees/hhld
Less second and third jobs
Less disposable income
20% fewer retailers per
capita in regions
Less efficient employment
Difference in job reliance - Urban v Region
Census (ABS 2006)

Retail Targets
Majors
• Supermarkets
• Discount Department Stores
Brands
Chains
Franchises
Selling Out?
1 M customers p.a.
20,000 p.w.
3,000 p.d.
60% impulse

Supermarkets
70% of all food/grocery spending
Coles 740
Woolworths 820
Total 1,560
Adding 20 stores p.a.
Average Sales $30M p.a.

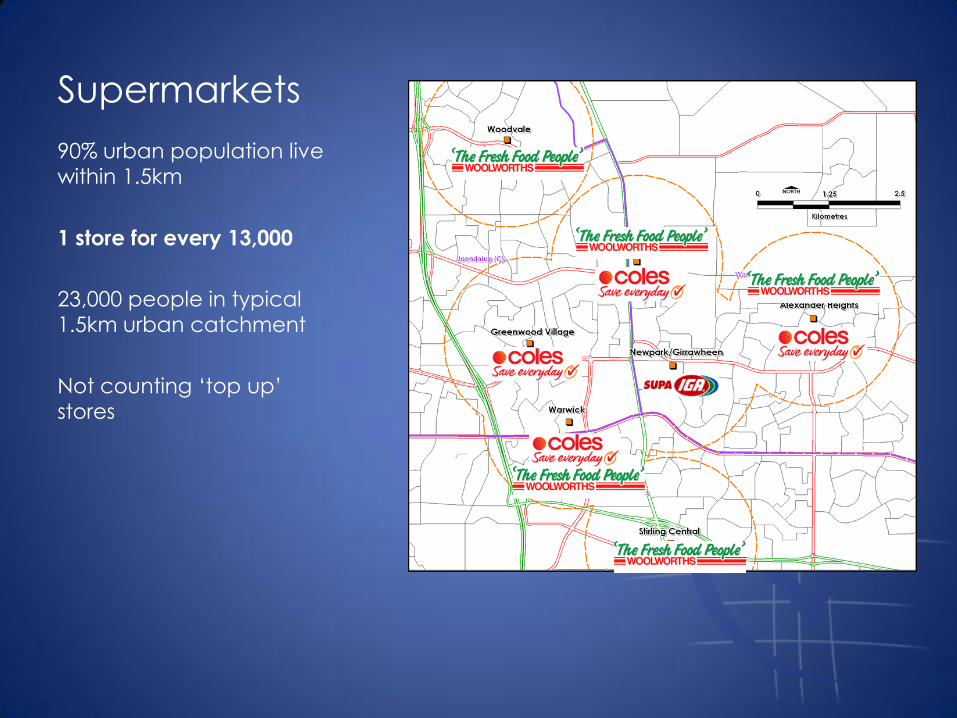
Supermarkets
90% urban population live
within 1.5km
1 store for every 13,000
people
23,000 people in typical
1.5km urban catchment
Not counting ‘top up’
stores
Supermarkets
90% urban population live
within 1.5km
1 store for every 13,000
23,000 people in typical
1.5km urban catchment
Not counting ‘top up’
stores

Department Stores
Big W 160
Kmart 170
Target 290
Country 120
Target 170
All 620
Average Sales $25M p.a.
Adding 20 stores p.a.

Department Stores
90% urban population live within
3.5km
1 store for every 33,000 people
3 stores in same catchment
100,000 people in typical 3.5km
urban catchment

Brands/Franchises/Chains
1,200 opportunities
Guaranteed Success
Leaders/Support
Will follow majors
Exploit

A Major’s Reasons for Smaller Regions
Growth Targets
Urban Saturation
Try New formats
Complete a supply chain
Blocking competitors
Protect sister businesses

A Major’s Reasons for Regions
Not palms trees in roundabouts

Three Part Attraction Plan
Political
Opportunity
Spatial
In parallel

Political
Agree on a vision
Community desire
Willingness to make it happen
Robust plan
Economical development
One crack!
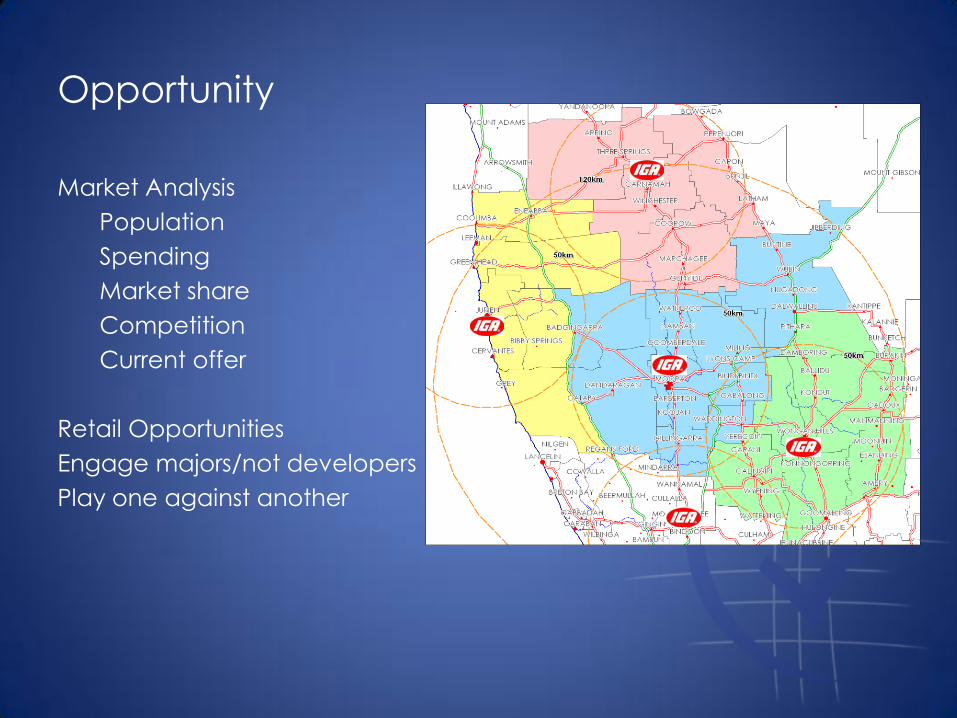
Opportunity
Market Analysis
Population
Spending
Market share
Competition
Current offer
Retail Opportunities
Engage majors/not developers
Play one against another

Spatial Plan
Land Compilation
Right site for right uses
Flexibility/Plan B
Adjacent does not mean integrated
Car parking/infrastructure
Understand movement patterns
Design with majors
Staging and Timing

Summary
Regions are generally under shopped
Retail underpins attraction and retention of communities
Major retailers drive retail behaviour
Need a three part plan
Shared political and community vision
Economic driven not planning driven
Work the plan
No palm trees

Attracting Retailers and SME’s to regions
Greg Davis taktics4.com.au