attitudes towards sustainability - diva portal430152/fulltext01.pdf · businesses and investors...
TRANSCRIPT

Attitudes Towards Sustainability: A Quantitative Study of Sustainable Ålidhem
Authors: Alice Watling Emma Zhou
Supervisor: Malin Näsholm
Student Umeå School of Business Spring semester 2011 Bachelor thesis, 15 hp

I
Abstract The aim of our study is to find out whether people have positive or negative attitudes towards sustainability and how knowledge levels affect people’s attitudes. We will test nine hypotheses based on theory that will investigate the relationship between different attitudes and knowledge levels towards the project Sustainable Ålidhem, which is part of the project Hållbart Byggande I Kalla Klimat at Ålidhem in Umeå, Sweden; towards each dimension of Sustainability and towards Sustainability as a whole. Other variables we will use to test the relationship between attitudes and knowledge will include income, belief, age, and gender. We found many sources that discuss the negative and positive attitudes by authorities, businesses and investors towards Sustainability on a macro-level. However, there is little information about the development of attitudes towards Sustainability on a micro-level. Micro-level Sustainability is influenced by Macro-level Sustainability by the many inter-related subjects of business cycles, employment/ unemployment, climate change and Corporate Social Responsibility; and authorities, businesses and organisations have been working with local communities to develop more sustainable lifestyles for citizens. Micro-level Sustainability subjects include sustainable construction, energy consumption, waste management, transportation, community development and management, which are all included in the project Sustainable Ålidhem. We have argued for the incorporation of all four dimensions of Sustainability and their interlinking subjects, as explained by J.H. Spangenberg (2002) of the Wuppertal Institute, to explain and investigate attitudes and knowledge levels towards Sustainability. We have also used the theory of the Contingent Valuation Method (CVM) and the theory of Bounded Rationality, which is used to establish the nine hypotheses. Our methodological approach includes the ontological view of objectivism, the epistemological view of positivism; we will use the deductive approach to theory and collect data by a quantitative survey questionnaire. The questionnaire has been designed to test for Bounded Rationality, and uses different question formats of multiple choice, true or false questions and Lickert scale rankings. We made a statistical analysis by using the software program SPSS, and used the Pearson Correlation Coefficient and one-way between-groups analysis of variance (ANOVA) tests to investigate our hypotheses. Our empirical data is presented by using pie charts and bar graphs and the descriptive statistics that explain each question’s results. Our analysis of each hypothesis concluded that education and knowledge about Sustainability plays an important role in developing positive attitudes towards Sustainability, and that even in highly educated individuals there is evidence of Bounded Rationality. We have also discovered that belief in a higher power; gender and age do not play a role towards having a positive attitude towards Sustainability. Our data sample was unable to investigate the variable Income, which is discussed in the analysis.

II
TABLE OF CONTENTS
1.1: SUSTIANABILITY 1
CHAPTER 1: INTRODUCTION 1
1.2: CONCEPTS OF FOUR DIMENSIONS 1 1.3: PROBLEM BACKGROUND 3 1.4: PROBLEM STATEMENT 4 1.5: PURPOSE 5 1.6: LIMITATIONS 5
2.1: HÅLLBART BYGGANDE I KALLA KLIMAT (SUSTIANBLE BUILDING IN COLD CLIMATES) 6
CHAPTER 2: PROJECT BACKGROUND 6
3.1: INTRODUCTION 7
CHAPTER 3: THEORETICAL FRAMEWORK 7
3.2: BACKGROUND TO SUSTAINABILTY 7 3.3: CONTINGENT VALUATION METHOD 10 3.4: BOUNDED RATIONALITY 10 3.5: ATTITUDES AND KNOWLEDGE 12 3.6: ATTITUDES AND CONSUMPTION BEHAVIOUR 13 3.7: ATTITUDES AND INCOME 15 3.8: ATTITUDES AND BELIEF 15 3.9: GENDER AND AGE 16 3.10: THE PRISM OF SUSTAINABILITY 17 3.11: CONCLUSION OF THEORETICAL FRAMEWORK 18
4.1: CHOICE OF SUBJECT 19
CHAPTER 4: METHODOLOGY 19
4.2: PRECONCEPTIONS 19 4.3: METHODOLOGICAL ASSUMPTIONS 19 4.4: RESEARCH ASSUMPTIONS 20 4.5: CONDUCTING RESEARCH 20 4.6: SECONDARY SOURCES 20 4.7: CRITICISMS OF SOURCES 21
5.1 : PRIMARY DATA AND RESEARCH DESIGN 22
CHAPTER 5 : DATA COLLECTION 22
5.2 : SAMPLE 22

III
5.3 : SURVEY DESIGN 22 5.4 : CHOICE OF QUESTIONS 24 5.5 : QUANTIFY OUR DATA COLLECTION 25 5.6: ANALYSIS 25 5.7: ACCESS 26 5.8: ETHICAL CONSIDERATIONS 27 5.9: CRITICISMS OF PRIMARY DATA 27
6.1 : INTRODUCTION 28
CHAPTER 6 : EMPIRICAL DATA 28
6.2 : PART 1: DEMOHRAPHICS 28 6.3 : PART 2: KNOWLEDGE 30 6.4 : PART 3: ATTITUDES 33 6.5 : CONCLUSION OF EMPIRICAL DATA 36
7.1 : INTRODUCTION 37
CHAPTER 7: ANALYSIS 37
7.2 : HYPOTHESIS A 37 7.3 : HYPOTHESIS B 38 7.4 : HYPOTHESIS C 39 7.5 : HYPOTHESIS D 40 7.6: HYPOTHESIS E 40 7.7: HYPOTHESIS F 41 5.8: HYPOTHESIS G 42 5.9: HYPOTHESIS H 43 5.10: HYPOTHESIS I 44
IMPLICATIONS FOR BOSTADEN AB 48
CHAPTER 8 : CONCLUSION/DISCUSSION 45
RECOMMENDATIONS FOR FURTHER RESEARCH 48
RELIABILITY 49
CHAPTER 9 : RESEARCH CRITERIA 49
REPLICATION 49 VALIDITY 49 RFERENCES 50 APPENDIX: QUESTIONNAIRE 54

IV
LIST OF FIGURES FIGURE 1: ADAPTION OF SPANGENBERG’S PRISM OF SUSTAINABILITY, THE UN’S CSD INDICATORS AND OTHER MACRO- AND MICRO-ISSUES 3
FIGURE 2: MODEL OF SUSTAINABILITY (SOURCE: UNEP, 2011, P. 506) 8
FIGURE 3: J. SPANGENBERG’S PRISM OF SUSTAINABILITY (2002) 8
FIGURE 4 : SATISFICING SET (SOURCE: DYNER & FRANCO, 2004, P.375) 11
FIGURE 5: ADAPTION OF SPANGENBERG’S (2002) PRISM OF SUSTAINABILITY 17
FIGURE 6: GENDER 28
FIGURE 7: AGE 28
FIGURE 8: INCOME/YEAR 29
FIGURE 9: EDUCATION 29
FIGURE 10: BELIEF IN A HIGHER POWER 29
FIGURE 11: FIVE POINTS OF FOCUS 30
FIGURE 12: CONSTRUCTION PLANNED 30
FIGURE 13: ENERGY PRODUCTION 31
FIGURE 14: WINTER GARDEN 31
FIGURE 15: GREEN CITIZEN 31
FIGURE 16: WASTE MANAGMNET 32
FIGURE 17: FOUR DIMENSIONS 32
FIGURE 18: INTERLINKING SUBJECTS OF SUSTAINABILITY 33
FIGURE 19: WELL-BEING OF ECONOMY 33
FIGURE 20: WELL-BEING OF SOCIETY 34
FIGURE 21: WELL-BEING OF ENVIRONMENT 34
FIGURE 22: WELL-BEING OF INSTITUTIONS 34
FIGURE 23: WELL-BEING OF THE COMMUNITY 35
FIGURE 24: WELL-BEING OF THE INDIVIDUAL 35
FIGURE 25: WILLINGNESS TO PAY (WTP) 36
FIGURE 26: WILLINGNESS TO ACCEPT (WTA) 36

1
Chapter 1: Introduction
1.1 Sustainability
We have chosen to study the subject of Sustainability which involves four dimensions of Economic, Social, Environmental and Institutional Sustainability. Previous research has described or defined the subject of Sustainability with a slight variation; therefore we will choose a definition which we will follow in this study. We will also explain the concepts of the four dimensions that we will focus on in our research, because the concepts involved within the subject of Sustainability have also varied.
1. Sustainability was defined by the World Commission on Environment and Development in 1987, as “development that meets the needs of the present without compromising the ability of future generations to meet their own needs”, which is influenced by the economic and social perspective (Langhelle, 1999, p.132; UNEP, 2011, p. 16).
2. In 1991 the World Wide Fund for Nature, the International Union for
Conservation of Nature and the United Nations Environment Program (UNEP) defined Sustainability as “improving the quality of human life within the carrying capacity of supporting ecosystems”, which is influenced by the social and environmental perspective (UNEP, 2011, p.17).
3. Sustainability has also been described as involving “Planet, People, Profit”
known as the 3 Ps, which is influenced by the economic and financial perspective (Sheth et al. 2011, p. 24; Financial Times, 2011).
We will follow the second definition, because we believe it describes how current thought patterns behind Sustainability research has developed to understand the possibilities, “improve the quality of human life”, and limitations, “the carrying capacity of supporting ecosystems”, of Sustainability. UNEP explain the term Ecosystems to mean all Capital assets (UNEP, 2011, p.17). Capital asset is a term that describes types of resources including Man-Made capital, Human capital, Natural capital and Social capital. Each capital asset has been used to describe the type of recourse that is used by each dimension of Sustainability, which is explained in our concepts of the four dimensions below. 1.2 Concepts of Four Dimensions Economic Sustainability Economic well being is a dimension of Sustainability that investigates the problems and possibilities of managing Man-Made Capital at a sustainable level (Foy, 1990, p.771; Spangenberg, 2002, p.104). Examples of man-made capital include money, machines and automobiles. Economic well being also includes the individual’s concerns of debt accumulation, earning pressures and work-life balance (Sheth et al. 2011, p. 24). The economic dimension has been measured by the GDP growth/ capita, economic structure and development, consumption and production patterns, trade etc (UN: CSD, 2001).

2
Social Sustainability Social well being is a dimension of Sustainability that investigates the problems and possibilities of managing Human Capital at a sustainable level (Spangenberg, 2002, p.104). Spangenberg defines human capital as the “intra-personal qualities of human beings” (2002, p.104). Examples of human capital include labour, education and welfare. Therefore, social well being describes the quality of life factor (Sheth et al. 2011, p. 24). The social dimension has been measured by the unemployment rate, education, housing, crime rate etc (UN: CSD, 2001). Environmental Sustainability Environmental well-being is a dimension of Sustainability that investigates the problems and possibilities of managing Natural Capital at a sustainable level (Spangenberg, 2002, p.104). Spangenberg defines environmental capital as “the sum of all bio-geological processes and the elements involved in them” (2002, p.104). Examples of natural capital include animals, vegetation and water. Therefore, environmental well being describes the effect of environmental change on human life and other life forms (Sheth et al. 2011, p. 24). The environment dimension has been measured by standards of freshwater, agriculture, urban development, fisheries, biodiversity etc (UN: CSD, 2001). Institutional Sustainability The institutional dimension of Sustainability is a subject that investigates the problems and possibilities of managing Social Capital at a sustainable level (Spangenberg, 2002, p.104). Spangenberg defines social capital as “interpersonal processes, such as communication and cooperation” (2004, p. 104). Examples of social capital include information, governance and regulations. The institution dimension has been measured by integrated decision-making, science and technology, public awareness and information, disaster preparedness etc. (UN: CSD, 2001). The Commission on Sustainable Development (CSD), The World Bank, and the Organisation for Economic Co-operation and Development (OECD) have recognised Institutional Sustainability as a fourth dimension that can be used as an indicator for measuring Sustainability (Spangenberg, 2002, p. 103). J.H. Spangenberg (2002) of the Wuppertal Institute created a model called The Prism of Sustainability that shows the four dimensions at each corner of the prism. However, his representation of all the interlinking relationships between each dimension has not been exemplified fully in his model. Therefore, we have taken Spangenberg’s model and used some of the indicators listed by the United Nation’s Commission for Sustainable Development (see figure 1 below) to explain the interlinking relationships that we will focus on in our thesis (UN’s CSD, 2001). We have also added some macro- and micro-level subjects that we will focus on in this thesis, for example, personal finance and business cycles, which have interlinking relationships between all four dimensions of Sustainability. Figure 1 (below) shows, for example, how the relationship between social and economic sustainability involves subjects such as consumption and production, transportation, employment and housing; it also shows, for example, how the relationship between environmental and economic sustainability involves subjects such as climate change and waste management.

3
(Figure 1: Adaption of Spangenberg’s prism of sustainability, the UN’s CSD indicators and other macro- and micro-issues) Each dimension has a connection with the other through many different macro- and micro-level subjects that cannot be discussed by only focusing on one dimension, without leaving out vital information or understanding about the attitudes of people towards these issues. Therefore, we have decided to include all dimensions in our research study, but we will focus on some of the micro-level subjects instead of the macro level subjects. 1.3 Problem Background While investigating current literature on the subject of Sustainability we recognised that there is a lot of research made on Sustainability at the Macro-level. Macro level Economic Sustainability subjects include business cycles and country financial stability, for example economic booms and recessions. Macro-level Social Sustainability subjects include employment/ unemployment levels and income distribution between a country’s population or on a global scale. Macro-level Environmental Sustainability subjects include issues of climate change and the effect of carbon emissions on the earth’s environment. Macro-level Institutional Sustainability subjects include Corporate Social Responsibility (CSR) and other conceptual tools that have been used to measure Sustainability by institutions, for example Carbon Foot-Printing (CFP), Life-Cycle Assessment (LCA) and the Triple-Bottom Line (TBL). On a Micro-level, authorities have begun to get involved with businesses and organisations to help fund and plan local initiatives. For example, in Sweden the town of Umeå commune’s project called Hållbart Byggande I Kalla Klimat (Umea, 2011), which means Sustainable Building in Cold Climates, is planning a community development project in sustainable construction and management (see chapter 2 for more information). As concern increases for the level of health of the environment and social communities, and attitudes towards Sustainability in business and institutional practices begin to adjust, the management of people’s attitudes about Sustainability needs to be directed at all stakeholders for an efficient transition into sustainable lifestyles (P. Lacy, J. Arnott & E. Lowitt, 2009, p. 486).
KEY
Other Macro & Micro subjects
UN’s CSD Social measurments
UN’s CSD Economic measurements
UN’s CSD Environment measurements
UN’s CSD Institution measurements

4
In our literature review, we found little information about the development of attitudes towards Sustainability on a micro-level. Many of the researchers we have reviewed state that there is a great need for further studies in people’s attitudes towards micro-level Sustainability (Van den Berg, 2010, p.2051; Seyfang, 2007, p. 132; Dyner & Franco, 2004, p. 385; McComb, 2002, p.246). These authors have mentioned many subjects that are involved in micro-level Sustainability, which include the subjects such as personal finance management, community development, sustainable construction and local production initiatives that we will be focusing on in our study. The micro-project called Hållbart Ålidhem (Sustainable Ålidhem) is a community development project lead by the housing company called Bostaden AB (Bostaden, 2011) in Umeå, Sweden. The five environmental focus points that Bostaden AB are working towards involves sustainable construction, sustainable energy consumption, waste management, environmentally-friendly transportation and machinery, and community participation and knowledge (Bostaden, 2011). These five focus points involve many different stakeholders including a network of 52 companies, organisations and authorities who are working towards the development of sustainable buildings and management in Umeå, Sweden (Hållbarahus, 2011). The goals of these 52 stakeholders (mentioned above) reveal that there is a growing positive attitude towards micro-level Sustainability stemming from an economic and institutional influence in Sweden. However, for an efficient change in community lifestyles all stakeholders need to have positive attitudes towards sustainability goals, which means that the customers/ residents of Ålidhem need to understand the project that aims to make Ålidhem Sustainable. Community participation and knowledge is an important part of the process of creating efficient community development projects. Bostaden AB have recognised this importance and state that they are regularly informing and creating opportunities for participating meetings and other activities for all their residents (Bostaden, 2011). The customer is a consumer that has many stakeholder identities; a citizen, a parent, an employee or a member of the community locally and globally; and because the relationship between customers and other stakeholders is intertwined what effects customers negatively also affects other stakeholders negatively (Sheth et al. 2011, p. 23). Therefore, a business practice with a focus on all stakeholders would create better efficiency and effectiveness of micro-level Sustainability projects. Profitability is a major focus of business, but creating customer value should be the defining purpose of business (Sheth et al. 2011, p. 32). 1.4 Problem Statement Customer’s attitudes towards business practices have been changing, partly due to an increase in unemployment and a consequential decrease in trust towards business practices and their economic-social Sustainability (Lacy et al. 2009, p. 487). It is our understanding that as Sweden takes part in the newly enforced carbon emission reductions (Glaas et al. 2010; EC, 2011) and starts the process of transition into a low-carbon economy, managing this process could be hindered by resistance from its citizens. According to Dyner & Franco (2004, p.375) market inefficiencies can be partly explained by knowledge levels of stakeholders and that contributing to customers’ knowledge levels can encourage efficient customer attitudes towards business projects and authority policies. Therefore, micro-level sustainable project management needs to

5
incorporate a marketing strategy to encourage positive attitudes towards more sustainable lifestyles and better understanding of sustainability issues, which would help businesses gain trust from all stakeholders. There has been some variation in the emphasis put on information about specific issues, such as climate change, CSR, financial crises, human and animal rights; or community development, low-energy consumption, local transportation and waste management. Much of the information on these macro and micro-level subjects that is available for the public has been quite sensational, due to journalistic media. The lack of understanding about the subject of Sustainability is detrimental to the cause. Our understanding of the terms knowledge and attitudes are; Knowledge is associated with facts, information, concepts and principles acquired through experience, education or investigation (Oxford Dictionaries, 2011). Attitudes can be explained as manner of thinking or feeling about something (Dictionary, 2011). We would like to contribute to the subject of micro-level Sustainability an the project of Sustainable Ålidhem in the town of Umeå, Sweden by finding out what the attitudes of our respondents are and what level of knowledge the respondents have. Therefore, our main research question is: What are customers’ attitudes towards sustainability and how do their knowledge levels influence these attitudes? 1.5 Purpose The aim of our study is to find out whether customers of Bostaden AB have positive or negative attitudes towards sustainability and how knowledge levels affect their attitudes. To do this we will focus on the residents of Ålidhem in Umeå, Sweden, where the project Hållbart Byggande I Kalla Klimat is developing a Sustainable Ålidhem (Bostaden, 2011). We will test nine hypotheses based on theory (see chapter 3, below) that will investigate the relationship between different attitudes and knowledge levels towards the project at Ålidhem, each dimension of Sustainability and Sustainability as a whole. Other variables we will use include income and belief, which can affect knowledge levels and can be influenced by knowledge (Dyner & C.J. Franco, 2004, p. 375); and also age and gender, which can affect the variation in responses (Bryman & Bell, 2007, p.361; p.183). We agree with previous research (Van den Berg, 2010, p.2051; Seyfang, 2007, p. 132; Dyner & Franco, 2004, p. 385; McComb, 2002, p.246) that states that the subject of customer attitudes and knowledge levels towards Sustainability is important for consideration, because this information can help to develop more effective and efficient sustainable projects. Therefore, we hope to contribute to the project Hållbart Byggande I Kalla Klimat which includes Bostaden AB’s project Sustainable Ålidhem, and to other similar projects. 1.6 Limitations Our study of the project at Ålidhem in Umeå has its limitations, because many residents are students and therefore we may have a majority of relatively well educated young people in our sample with low income levels. The relatively small sample for collecting data limits the generalisation of our findings, but should still be representative of small community projects of a similar nature. Other limitations of this study will include the inability to generalise our findings to countries with significantly different cultures, institutional policies, economic stability and environmental challenges.

6
Chapter 2: Project Background
In this chapter we will explain the project Sustainable Ålidhem by Bostaden AB to further inform the reader about the project and its involvement with the larger project of Hållbart Byggande I Kalla Klimat. 2.1: Hållbart Byggande I Kalla Klimat (Sustainable Building in Cold Climates) On December 25th in 2008 an unfortunate fire broke out in one of the housing blocks of the Ålidhem estate. It took three days for the fireman to put out the fire, because the insulation method of a special type of sawdust material used in the construction of these 1970s houses kept igniting from sparks and the heat of the fire. The fire spread around the whole U-shaped block and rendered the building unusable (Aftonbladet, 2008). This event caused major concern for the residents and companies that own all the other buildings built in the same way, which exist in Umeå and elsewhere in Sweden. One factor of Corporate Social Responsibility for the company that owns the buildings in Ålidhem, called Bostaden AB, is to make sure that all their residents are safe in their homes. This means that it became apparent that it was Bostaden AB’s responsibility to either renovate all the existing buildings or demolish them and build new houses. Bostaden AB got the support they needed from the ‘Delegationen för hållbara städer’, which is a group appointed by the government, to work with the development of sustainability in towns nationwide (Hållbarastäder, 2011). The funds will build new houses and convert existing houses of 530 apartments in the Ålidhem estate, which will include the installation of wind power, solar panels and heat-powered machinery to reduce the consumption of energy by half (Hållbarahus, 2011). A network of 52 companies, organisations and authorities who are working towards the development of sustainable buildings and management in Umeå, Sweden are in collaboration with Bostaden AB to work on a project to produce sustainable buildings in cold climates (Hållbarahus, 2011). Umeå is the biggest town in the north of Sweden and has been awarded the European Capital of Culture for 2014. Therefore many development targets have been set and many key stakeholders are interested in how well Umeå achieves these targets. Some of the targets mentioned by the Umeå Commune include exchanging knowledge, encouraging individual as well as joint ventures to stimulate the business market and further developing the town of Umeå into a progressive sustainable place to live (Hållbarahus, 2011). The links in the network chain are formed by groups within the areas of Education and Research, Business Market, Planning, Design, Construction, Management and Regulation. Their purpose and goals are to create a market for sustainable construction and management and to contribute to a more rapid shift to new technologies in the construction and management chain. The members in the network together raise awareness of sustainable construction and management in cold climates, which can be achieved through the tools of education, evaluation and communication; such as cross-border pilot projects, training, research and evaluation projects, seminars and information activities. (Hållbarahus, 2011)

7
Chapter 3: Theoretical Framework 3.1 Introduction We have reviewed literature about macro- and micro-level Sustainability, which has helped us to explain the subject in our Introduction chapter and assist us in the formulation of our data collection questions. We have also reviewed the literature available on the more specific subject of people’s attitudes towards each dimension of Sustainability and Sustainability as a whole, which will be our main focus for data collection. In our literature review we found the Contingent Valuation Method (CVM) to be most useful for our analysis of attitudes and the theory of Bounded Rationality is most suited for our study of the relationship between attitudes and knowledge, due to the successful application of these theories to similar fields in previous studies; including I. Dyner & C.F. Franco’s (2004) study of Consumers’ Bounded Rationality: The case of competitive energy markets and G. McComb’s (2002) A Contingent Valuation study of Winnipeg municipal water using Bounded Rationality. According to Dyner & Franco (2004, p.375) market inefficiencies can be partly explained by knowledge levels of stakeholders and that the theory of Bounded Rationality can explain knowledge levels and how this effects the attitudes in customers’ decision making. They also point out that contributing to customers’ knowledge levels can encourage efficient customer attitudes towards business projects and authority policies (Dyner & Franco, 2004, p. 375). Therefore a business project such as Bostaden AB’s Sustainable Ålidhem can benefit from understanding their customers’ attitudes and how the customers’ knowledge levels affect these attitudes. The concepts of Satisficing, Preference Reversals and Embedding that are found within the theory of Bounded Rationality will help us to analyse the data that we collect from the residents of Ålidhem in Umeå. 3.2 Background to Sustainability In our review of the literature we found that there is a varying emphasis on the importance of each dimension of sustainability. The argument for economic sustainability reveals the importance of investments in environmental and socially responsible instruments that can aid in the development of what UNEP call a global Green Economy (Mercer, 2011; UNEP, 2011). The emphasis on the environment argues for the rights of all life forms and the problems of irreversible depletion of natural resources as the most important factor of sustainability, which indicates that in some contexts sustainability is not possible (Foy, 1990; Goodland, 1995). J. Pope, D. Annandale & A. Morrison-Saunders (2004) recognise the importance of social sustainability and question whether or not sustainability is possible in each context, which leads them to believe that an objectives approach that creates a set of principles to follow is the best method to measure sustainability. Some research recently produced does not include all four dimensions, for example, UNEP’s report discusses these four dimensions but leaves out the dimension of Institutional Sustainability in their model called the T21 (2011, p. 506), see figure 2 below. Although UNEP does argue for the interlinking connections between the dimensions of Sustainability in their model, they do not argue for why they leave out the fourth dimension, Institutions.
8
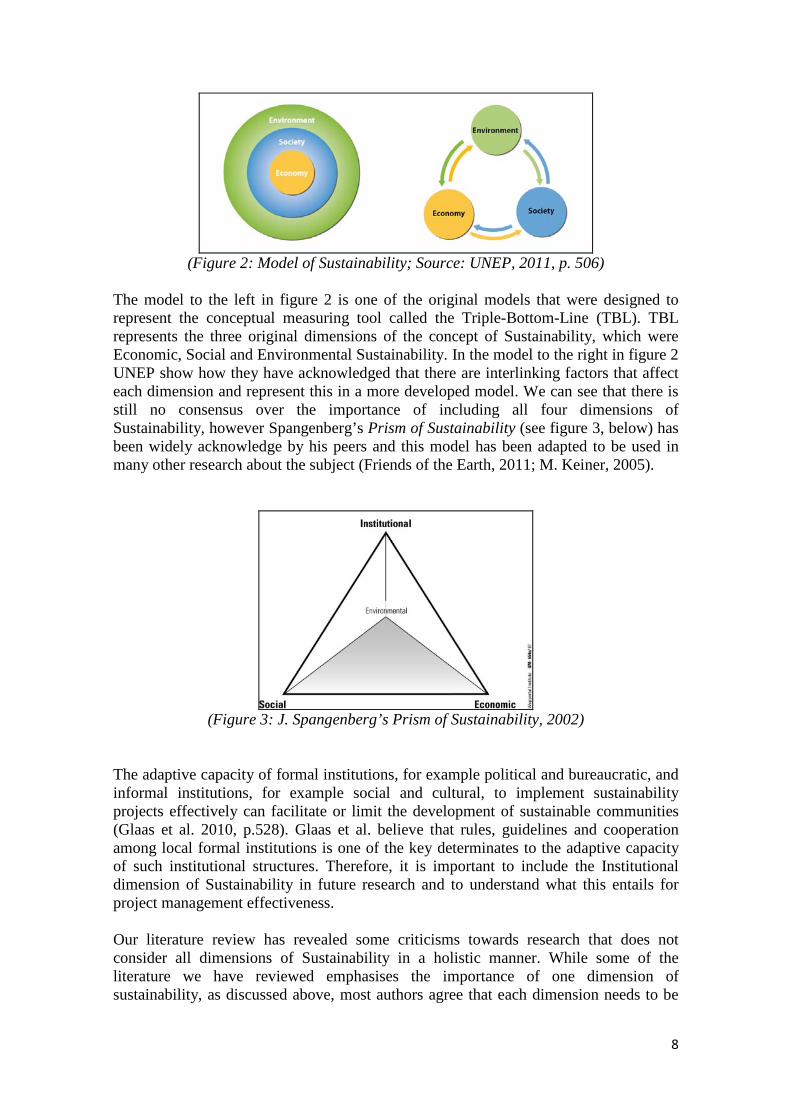
(Figure 2: Model of Sustainability; Source: UNEP, 2011, p. 506)
The model to the left in figure 2 is one of the original models that were designed to represent the conceptual measuring tool called the Triple-Bottom-Line (TBL). TBL represents the three original dimensions of the concept of Sustainability, which were Economic, Social and Environmental Sustainability. In the model to the right in figure 2 UNEP show how they have acknowledged that there are interlinking factors that affect each dimension and represent this in a more developed model. We can see that there is still no consensus over the importance of including all four dimensions of Sustainability, however Spangenberg’s Prism of Sustainability (see figure 3, below) has been widely acknowledge by his peers and this model has been adapted to be used in many other research about the subject (Friends of the Earth, 2011; M. Keiner, 2005).
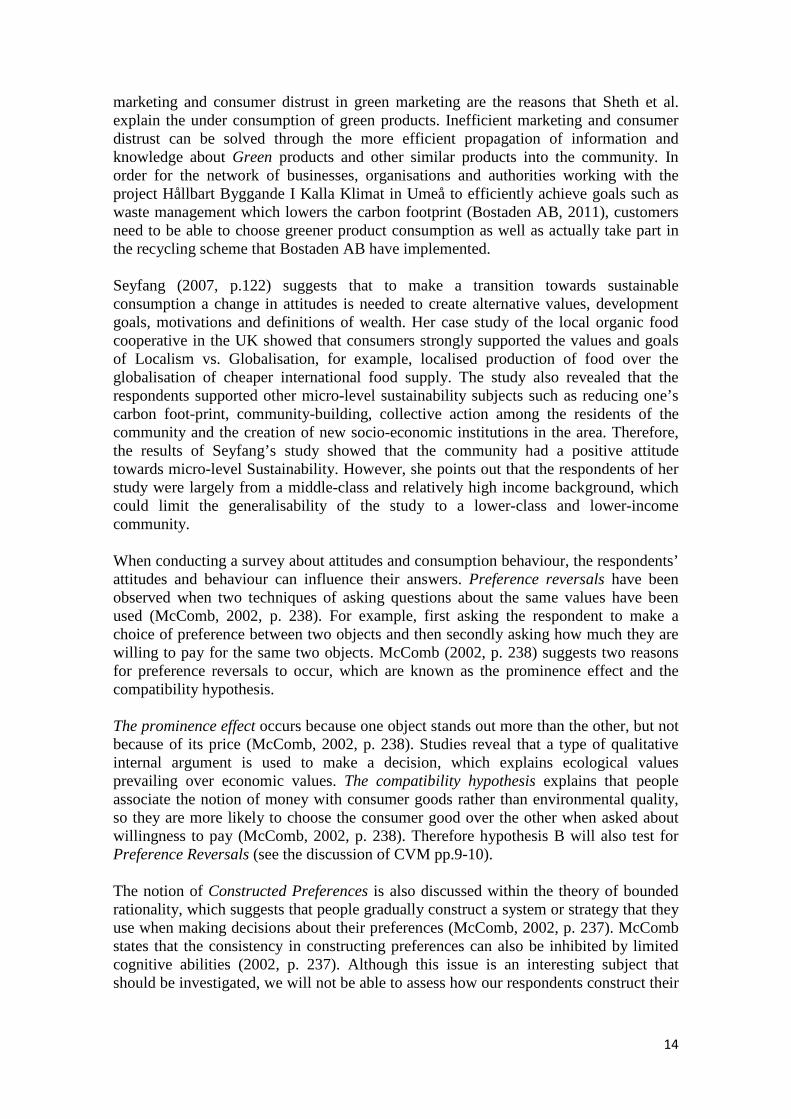
(Figure 3: J. Spangenberg’s Prism of Sustainability, 2002)
The adaptive capacity of formal institutions, for example political and bureaucratic, and informal institutions, for example social and cultural, to implement sustainability projects effectively can facilitate or limit the development of sustainable communities (Glaas et al. 2010, p.528). Glaas et al. believe that rules, guidelines and cooperation among local formal institutions is one of the key determinates to the adaptive capacity of such institutional structures. Therefore, it is important to include the Institutional dimension of Sustainability in future research and to understand what this entails for project management effectiveness. Our literature review has revealed some criticisms towards research that does not consider all dimensions of Sustainability in a holistic manner. While some of the literature we have reviewed emphasises the importance of one dimension of sustainability, as discussed above, most authors agree that each dimension needs to be

9
considered when approaching research on the subject of Sustainability (Goodland, 1995; Spangenberg, 2002; Pope et al. 2004; van den Berg, 2010; UNEP, 2011). Sheth et al. (2011, p. 24) explain the connections between Sustainability and attitudes towards consumption choices stating that the impact of consumption choices relates to economic well being, social well being and environmental well being at a micro-level (leaving the concept of institutional sustainability out of the discussion). Micro-level economic well being is explained as dealing with issues such as debt-burdens, earning pressures and work-life balance. Institutions that create opportunities for community development projects such as eco-efficient housing will help people to decrease their energy consumption and therefore decrease their debts. Micro-level social well being is associated with quality of life, which is also gained through community development projects that provide sustainable community activity centres and other amenities in the community. Environmental well being concerns the effects of environmental change for humans and other life forms, which are harmed by the waste and pollutants that over consumption creates. The varying emphasis on each dimension of sustainability by researchers and the criticisms of previous sustainability research findings reveal the researchers’ attitudes towards sustainability. Researchers’ attitudes can influence the readers’ attitudes through the prominent effect, which is a notion that suggests that when something stands out more than others in a paradigm, people choose the most prominent unit over the other units (McComb, 2002, p. 238). Therefore, the attitudes of researchers influence institutions’ attitudes, which in turn influence the attitudes of consumers in a chain of knowledge and information dissemination. Previous research has stated that even though there has been progression in the development of institutions and policy to deliver increasingly sustainable global economies, societies and environment, many goals set by these institutions have yet to be achieved (Goodland, 1995; Langhelle, 1999; Grafton et al. 2004; UNEP, 2011). According to Sheth, Sethia & Srinivas (2011, p. 22) a study of 2000 companies by Mckinsey Global Survey in 2010 revealed that managing sustainability in a proactive manner is yet to be achieved and attempts at managing sustainability have not entered standard business practices. To create a balance between the two perspectives of profit maximising and sustainability it is very important that profit making stakeholders, for example businesses like Bostaden AB, are encouraged to become receptive towards Sustainability. Also, to enable a community project such as Bostaden AB’s Sustainable Ålidhem to efficiently and effectively function in a truly sustainable manner all stakeholders, including the employees of Bostaden AB and the customers/ residents of Ålidhem, need to have positive attitudes towards Sustainability. Therefore, it is also important that all stakeholders have the knowledge to be able to understand what the project is about and why it is important for everybody to work towards a sustainable community. We predict that if information is distributed in a holistic manner, then attitudes towards sustainability will be positive. Therefore our first hypothesis is; Hypothesis A0 = the mean value of attitudes towards sustainability is positive, when
the mean value of knowledge levels towards sustainability is high. Hypothesis A1 = the mean value of attitudes towards sustainability is not positive, when
the mean value of knowledge levels towards sustainability is high.

10
3.3 Contingent Valuation Method The Contingent Valuation Method (CVM) reveals the points at which people are willing to pay (WTP) for something and the points at which they are willing to accept (WTA) something (Kozo Mayumi, 2001, pp.11-12). This can help to reveal the respondents attitudes towards macro- and micro-level Sustainability. Responses to WTP and WTA can vary, for example, someone may be willing to pay but not willing to accept and vice versa. Also, someone who is not willing to pay extra for environmental protection can also not be willing to accept environmental damage or receive compensation for giving up a unit of natural capital. Kozo Mayumi (2001) recognises that some researchers have criticised CVM, because the response depended on the context on which the surveys were delivered, resulting in a lack of reality. In contrast, Mayumi points out that some researchers have found that it is not the responses of CVM that are not real, but that respondents may not act accordingly to the assumptions of utility theory (Mayumi, 2001, p.12). Traditional utility theory assumes that people are fully rational maximisers of subjective utility, whereas the theory of Bounded Rationality believes that people find a satisfactory level of utility rather than a maximising level of utility (Dyner & Franco, 2004, p. 375). We predict that bounded rationality exists in our respondents and therefore some respondents will not be willing to accept unsustainability and also not willing to pay more for sustainable products and services. Contradictory behaviour, such as WTP and WTA differences, that can occur in Bostaden AB’s customers could hinder the efficiency and effectiveness of the project Sustainable Ålidhem. This is because, for example, although some customers may be willing to accept the idea of changing their housing to become more energy efficient and having community centres and waste management services that increase the social welfare and quality of the environment of the community, the customers may not be willing to pay more for the newly constructed housing or technology installations that are needed to supply new sources of household energy. It is therefore important for Bostaden AB to understand the different variety of attitudes that could be evident in their customers, so the company can approach the customers’ needs in an efficient and effective manner. Therefore our second hypothesis is; Hypothesis B0 = the mean attitude towards willingness to pay more for
sustainable products and services is positive, when the mean attitude towards willing to accept unsustainability is positive.
Hypothesis B1 = the mean attitude towards willingness to pay more for
sustainable products and services is not positive, when the mean attitude towards willing to accept unsustainability is positive.
3.4 Bounded Rationality The theory of bounded rationality is based on the understanding that people have limited cognitive abilities. Research on this subject has revealed that the large amount of information available for the individual from external sources, combined with the limits from internal constraints of the individual to interpret this information, results in a limitation to their knowledge capacity and analysing abilities (McComb, 2002, p. 235).

11
Herbert Simon (McComb, 2002, p. 236; Dyner & Franco, 2004, p. 375) developed the theory of bounded rationality and the notion Satisficing, which explains how people are driven by varying aspirations and usually stop searching once they are satisfied. This is because people’s behaviour is influenced by their limited cognitive abilities. Therefore, people tend to achieve the intermediate goal before reaching the long-term goal. This notion is opposed to the idea of optimised utilisation that is assumed in the theory Rationality. Dyner & C.J. Franco (2004, p. 375) developed a model that combines Simon’s (1979, cited in Dyner & Franco, 2004, p.375) idea of Satisficing with Elster’s (1989, cited in Dyner & Franco, 2004, p.375) view of decision-making. Decisions are made when sets of Desires, Beliefs and Evidences coincide, which Dyner & Franco call the Satisficing set (see figure 4, below). According to Dyner & Franco, Elster described decision-making as being dependent on desires and beliefs, which are both influenced by evidences. Evidences are explained as influences from knowledge, and can therefore be seen as a synonym of knowledge. The model in figure 4, below, suggests that desires, beliefs and knowledge all influence each other, but the theory of bounded rationality suggests that knowledge is the most influential of the three variables.
(Figure 4; Satisficing Set Source: Dyner & Franco, 2004, p.375)
Dyner & Franco do not define the terms of desires, beliefs and evidences in their model, but they explain the concepts as influences of decision making (2004, p. 375). Our understanding and application of the model uses definitions that explain these concepts as close to the implication that Dyner & Franco have used in their research. Desires can be explained as “a longing or wishing for something” (Bryman & Bell, 2007, 229), which can be associated with the attitude towards consumption behaviour. Beliefs can be explained as an understanding of someone or something as being true or false (Bryman & Bell, 2007, p.264), which can define a person’s view on the world. Attitudes can be explained as manner of thinking or feeling about something (Dictionary, 2011). Thoughts and feelings are influenced by our desires, our beliefs and evidences or our knowledge levels, among other things. This indicates that Desires, Beliefs and Evidences affect attitudes and that when decisions are made based on these three factors it reveals the Satisficing Set of a person. An example of a Satisficing Set towards sustainability could be having a positive attitude towards not willing to accept the destruction of the environment, but not willing to pay more for environmentally friendly products and services. This type of Satisficing set could be explained by the person’s level of knowledge about the value and costs of green products and services. Due to a possible variation in the different capabilities for Bostaden AB’s customers to understand the project Sustainable Ålidhem, information may be needed to be delivered in a variety of ways to suit the customers’ needs.

12
3.5 Attitudes and Knowledge Knowledge is associated with facts, information, concepts and principles acquired through experience, education or investigation (Oxford Dictionaries, 2011). The adaptive capacity of a community project, such as the Sustainable Ålidhem project by Bostaden AB (Bostaden, 2011), as part of the network of companies, organisations and authorities that is working together to implement the project Hållbart Byggande I Kalla Klimat (Hållbarahus, 2011), is affected by the way that knowledge is produced, managed and distributed by such formal institutions like the local network in Umeå. Therefore our third hypothesis is; Hypothesis C0 = the mean total attitude towards sustainability is positive, when
the mean total knowledge levels about sustainability and the project at Ålidhem is high.
Hypothesis C1 = the mean total attitude towards sustainability is not positive,
when the mean total knowledge levels about sustainability and the project at Ålidhem is high.
Glaas et al. (2010, p 529) suggest that increased knowledge levels within organisations help to increase the “flexibility and diversity of managing systems” and that “constructing and communicating knowledge” will add to the adaptive capacity of all stakeholders. In Glaas et al.’s (2010, pp.534-535) study of Climate Adaption in Gothenburg Municipality, they found that respondents thought that civil society perspectives were not included in assessments or decision making of projects in the region and therefore left out the values and knowledge of the civil society when planning and implementing local projects. They conclude that this will lead to a decrease in trust from the civil society towards institutions. Businesses from different industries, and situated in developed as well as developing countries, that have performed well on the Sustainability indexes and constantly outperformed their peers, have also been recognised for having installed strong positive attitudes and high knowledge levels towards Sustainability goals (Lacy et al, 2009, 488). It has been recognised that to gain positive attitudes people need to learn and understand the subject at hand. Lacy et al. (2009, p.489) suggest that formal and informal learning opportunities help to increase people’s knowledge levels about Sustainability. Formal learning opportunities include education at school or university and career development lectures that are sometimes provided by employers. Informal learning opportunities include the distribution of information by authorities, businesses and organisations through leaflets, magazines, news articles and commercials. Bostaden AB (Bostaden, 2011) say they have delivered information through leaflets and community meetings where residents are encouraged to share their ideas and participate in other ways, including getting involved in the development of the community winter garden that is part of the development project. When people participate and engage in a project they begin to identify positively with the project, they communicate and become proactive to achieve the projects goals (Lacy et al. 2009, p.491). Knowledge levels can therefore influence attitudes towards Sustainability because the level of what people can understand and interpret contributes to their desires to participate and their beliefs or trust in something. We believe that as knowledge levels increase positive attitudes

13
increase, therefore authorities, businesses and organisations need to focus on investing in increasing knowledge levels of all stakeholders. Therefore are fourth hypothesis is; Hypothesis D0 = the mean total attitude towards sustainability is positive, when
the mean educational level is high. Hypothesis D1 = the mean total attitude towards sustainability is not positive,
when the mean educational level is high. Some cognitive limitations that people may have include Embedding, which occurs when an individual is unable to differentiate between a choice of two objects when one object is surrounded or set into the other object (McComb, 2002, p. 237). For example, asking a respondent what they know about social responsibility or environmental protection and then asking them what they know about Sustainability as a whole. Research has shown that choices that invoke moral satisfaction or symbolism have not followed this notion of embedding. Embedding has also been disproved when there has been a level of familiarisation of the object, so the respondent has been able to construct their preferences (McComb, 2002, p. 237). Therefore our fifth hypothesis is; Hypothesis E0 = the mean knowledge level of the interlinking subjects is high
when the mean knowledge level of the dimensions of sustainability is high. Hypothesis E1 = the mean knowledge level of the interlinking subjects is not
high when the mean knowledge level of the dimensions of sustainability. Assuming cognitive limitations exist in our respondents; reducing information to a manageable level will help us to obtain sufficient information. It has been acknowledged that it is not the quantity of choices that can hinder the individuals choice, but the complexity of the choices available (McComb, 2002, p. 236). Also, framing and reference points are a consideration when designing a CVM survey, because it can influence the way respondents answer the survey (McComb, 2002, p.240). 3.6 Attitudes and Consumption Behaviour Attitudes can be influenced by consumption choice behaviour, for example people’s desires may be stronger than their beliefs and therefore have a negative attitude towards sustainability while still believing in sustainability as a cause. Many western countries have followed the trend of over-consumption patterns (Kjellberg, 2008, p. 151), which have installed a sense of overconsumption of unnecessary products, for example, fashionable items such as clothes and mobile phones or other accessories. One example of choosing to be more mindful when consuming is to choose so called Green products rather than other products when we shop for groceries or household goods. Green products are products that have less detrimental effect on the environment throughout the whole life-cycle of the product (Sheth et al. 2011, p. 26). Life-Cycle Analysis is the conceptual tool that measures the effects of products and services throughout the whole chain of events that the product or service interacts with (W.R. Sheate, 2010, p. 182). Green products, such as organic food, household cleaners and hybrid cars, are still an insignificant percentage of consumption sales when comparing them to other products (Sheth et al. 2011, p. 26). Performance quality, availability, high prices, inefficient
14
marketing and consumer distrust in green marketing are the reasons that Sheth et al. explain the under consumption of green products. Inefficient marketing and consumer distrust can be solved through the more efficient propagation of information and knowledge about Green products and other similar products into the community. In order for the network of businesses, organisations and authorities working with the project Hållbart Byggande I Kalla Klimat in Umeå to efficiently achieve goals such as waste management which lowers the carbon footprint (Bostaden AB, 2011), customers need to be able to choose greener product consumption as well as actually take part in the recycling scheme that Bostaden AB have implemented. Seyfang (2007, p.122) suggests that to make a transition towards sustainable consumption a change in attitudes is needed to create alternative values, development goals, motivations and definitions of wealth. Her case study of the local organic food cooperative in the UK showed that consumers strongly supported the values and goals of Localism vs. Globalisation, for example, localised production of food over the globalisation of cheaper international food supply. The study also revealed that the respondents supported other micro-level sustainability subjects such as reducing one’s carbon foot-print, community-building, collective action among the residents of the community and the creation of new socio-economic institutions in the area. Therefore, the results of Seyfang’s study showed that the community had a positive attitude towards micro-level Sustainability. However, she points out that the respondents of her study were largely from a middle-class and relatively high income background, which could limit the generalisability of the study to a lower-class and lower-income community. When conducting a survey about attitudes and consumption behaviour, the respondents’ attitudes and behaviour can influence their answers. Preference reversals have been observed when two techniques of asking questions about the same values have been used (McComb, 2002, p. 238). For example, first asking the respondent to make a choice of preference between two objects and then secondly asking how much they are willing to pay for the same two objects. McComb (2002, p. 238) suggests two reasons for preference reversals to occur, which are known as the prominence effect and the compatibility hypothesis. The prominence effect occurs because one object stands out more than the other, but not because of its price (McComb, 2002, p. 238). Studies reveal that a type of qualitative internal argument is used to make a decision, which explains ecological values prevailing over economic values. The compatibility hypothesis explains that people associate the notion of money with consumer goods rather than environmental quality, so they are more likely to choose the consumer good over the other when asked about willingness to pay (McComb, 2002, p. 238). Therefore hypothesis B will also test for Preference Reversals (see the discussion of CVM pp.9-10). The notion of Constructed Preferences is also discussed within the theory of bounded rationality, which suggests that people gradually construct a system or strategy that they use when making decisions about their preferences (McComb, 2002, p. 237). McComb states that the consistency in constructing preferences can also be inhibited by limited cognitive abilities (2002, p. 237). Although this issue is an interesting subject that should be investigated, we will not be able to assess how our respondents construct their

15
preferences. However, a future research study that concentrates more on consumption behaviour would benefit from analysing the respondents’ constructed preferences. 3.7 Attitudes and Income Sheth et al. (2011, p. 30) suggest that there has been a positive change in mindsets and behaviour towards caring for the self and community, which is related to a change in consumption patterns since the latest economic recession. However, this does not suggest that consumption patterns have changed due to consumers’ positive attitudes towards sustainability as a whole, but more a concern for personal financial stability. Therefore, in this case attitudes towards sustainability as a whole have revealed to be negative during recession periods in a business cycle but the micro-level sustainability subject of personal financial stability increases the customers’ concern for over consumption and for high cost and necessary services such as energy consumption. Knowledge about how to reduce energy consumption should help the customers of Bostaden AB at Ålidhem to comply with the goal of reducing the carbon footprint in the area, with the incentive of having lower energy costs for the customers at the same time. Over and under consumption can also be linked to levels of income, for example, in countries where there is under consumption income is at a poverty level and countries that over consume have high disposable income, which leads to over spending and high financial stress. Debt accumulation is an increasing problem for moderate-high income households and it has a negative impact on the economic well being of communities (Sheth et al. 2011, p. 25). Therefore, we will investigate if there is a relationship between income levels and negative or positive sustainability attitudes. Stern (1997, pp.203-204) points out that when income is below a minimum level, wildlife will not be preferred to income, and vice versa. It is also suggested that more income is always preferred to less given a certain level of wildlife and that more wildlife is always preferred to less given a certain level of income. These findings by Stern suggest that income levels play a big role in the customers’ choice for the willingness to pay for sustainable goods or the willingness to accept unsustainability. Therefore our sixth hypothesis is; Hypothesis F0 = the mean total attitude towards Sustainability is positive, when
the mean income level is high. Hypothesis F1 = the mean total attitude towards Sustainability is not positive,
when the mean income level is high. 3.8 Attitudes and Beliefs Natural interests and divine interests are two ways to analyse how people perceive what is most important in life. Stern (1997, p. 203) recognises Edwards’ point of view that when people believe in the divine, property rights belong to a God and therefore limits substitutes for production and consumption. Natural interest can be interpreted as the interest in science and therefore all living things (Stern, 1997, p. 203). Beliefs can influence attitudes and therefore can hinder or assimilate community projects that are working towards Sustainability, due to the positive or negative preconceptions that a belief can carry towards the subject of Sustainability.
16
The European Commission (2005, p.11) published a report about a survey that investigated Sweden’s population beliefs and attitudes towards science and technology. Their results showed that 55% of those who declared a belief in a God also believe that decisions made on science and technology should be concerned with moral and ethical issues, whereas 47% of those who did not declare a belief in a God were inclined to believe that a risk-benefit analysis is preferable when making decisions about science and technology. This leads us to believe that there may be a difference between those who believe in a higher power and those who do not and whether each group has a positive or negative attitude towards sustainability. Therefore our seventh hypothesis is; Hypothesis G0 = the mean total attitude towards sustainability differs between
group responses to belief in a higher power. Hypothesis G1 = the mean total attitude towards sustainability does not differ
between group responses to belief in a higher power.
The issue of a moral understanding of sustainability versus income and costs of sustainable development can influence the customers’ choice to comply with the goals of a community project, such as Bostaden AB’s Sustainable Ålidhem. It is important for the company to understand how the customers respond to the project goals in order to enable an efficient development of these sustainability goals. Substitutes for certain products or services, for example energy consumption, can be developed through the use of innovative technologies. The development of innovative technologies, especially in the energy sector, is a rapidly growing industry, which is expected to develop significant economic growth internationally within the next twenty years (Mercer, 2011, p.1). Projects like Hållbart Byggande I Kalla Klimat and Sustainable Ålidhem could benefit greatly from their use of alternative energy sources and therefore need to consider how well the new technologies actually function for the consumer. To ensure that the development of these new sources of energy works efficiently and effectively and can progress in a sustainable manner in the future, as these technologies progress and develop, feedback from the consumers can be of great use for the business. Innovative technologies play an important role in the sustainable construction industry, because innovative ways to produce energy not based on fossil fuels and innovative methods to insulate buildings so that they are more energy efficient are some of the most progressive movements towards sustainable consumption of energy. Innovations in new energy production methods include, wind power, solar power and heat power; Bostaden AB are developing solar and heat power energy sources to be used in their project Sustainable Ålidhem (Bostaden, 2011). Support for the development of such innovative technologies is paramount to the cause of sustainable construction, which means that attitudes need to align to the belief that moral and ethical issues are important when making decisions about science and technology. 3.9 Gender and Age Bryman & Bell (2007, p.361; p.183) have noted that previous research in a variety of fields has revealed differences in their results due to differences between gender and age groups. Therefore we will test our total attitude variable with the gender and age variables with two separate hypotheses to investigate if this occurs with our respondents;

17
Hypothesis H0 = the mean total attitude towards sustainability differs between
genders. Hypothesis H1 = the mean total attitude towards sustainability does not differ
between genders. Hypothesis I0 = the mean total attitude towards sustainability differs between
age. Hypothesis I1 = the mean total attitude towards sustainability does not differ
between age groups. 3.10 The Prism of Sustainability To explain how we understand the connection between the theories that we have discussed in our theoretical framework above and our study of attitudes and knowledge levels of the four dimensions of Sustainability and Sustainability as a whole, we have developed the model below (see figure 5).
(Figure 5; Source: Adaption of Spangenberg’s (2002) Prism of Sustainability with the
theories we will use in this study) We have placed the theory of CVM at the centre of the prism, because it is the attitudes towards all four dimensions of Sustainability that we will be assessing. Our study will focus on the people of a Social community, which have many identities that have an interlinking relationship between all dimensions of Sustainability. However, we have placed the terms Attitudes and WTP/ WTA between the Social and Economic dimensions because we will assess the relationship between income and attitudes of our respondents from a specific Social community. The relationship between Attitudes and Knowledge of our respondents will also be assessed; therefore we have also placed Knowledge close to the Social dimension. One of the roles of Institutions is to inform and educate the society to help develop a sustainable society, therefore both Knowledge and the theory of Bounded Rationality is placed between the Social and Institution dimensions of Sustainability. Knowledge will be analysed through the theory of Bounded Rationality, therefore they are placed next to each other.
18
The focus of our study will be on the residents of a community development project that has been supported by a network of companies, organisations and authorities; therefore we have placed our subject of community development next to the Institution dimension of Sustainability. Different macro- and micro-level subjects will be used to assess the attitudes of our respondents towards different types of Institutional and Economic activities. We have placed the subject of social collective institutions above the Institution dimension of Sustainability, because we will assess the attitudes towards alternative institutional structures for the efficient development of Micro-level Sustainability projects. The subjects of Localism and Globalisation (as discussed in Attitudes and Behaviour, p. 15), and the subject of Investments (as discussed in the project background, Chapter 2) have been placed between the Institution and Economic dimension of Sustainability, because we will be assessing the attitudes of our respondents to consumption choices and investments that institutions and companies have been putting into Sustainable projects, such as the Hållbart Byggande I Kalla Klimat project (Hållbarahus, 2011). 3.11 Conclusion of Theoretical Framework To conclude, we have found a lot of information that describes the importance of each dimension of sustainability. The attitudes of this research has played a role in influencing the institutions involved with reporting on Sustainability goals and producing policies and guidelines for a transition towards a Green Economy (UNEP, 2011). In turn, these attitudes and influences towards consumption patterns, income and beliefs have begun to influence the way people think and behave towards Sustainability in a positive manner, through the quality of information that is delivered to the general public. However, people can have contradictory attitudes and behaviour patterns that hinder sustainable development and a move towards more sustainable lives as a whole. Contradictory attitudes and behaviour patterns of Bostaden AB’s residents of Ålidhem could prevent their project Sustainable Ålidhem from progressing efficiently and effectively and affect the larger project of Hållbart Byggande I Kalla Klimat in a negative way. This contradictory characteristic in people is an endogenous process that needs to be addressed in order to create a more efficient sustainable global community. In our literature review we have found nine points of interest that have been discovered in previous research and other literature theory, which we will test in our study by producing a statistical analysis of the nine hypotheses (as stated throughout the theoretical framework chapter). The information that we find could help Bostaden AB and all the other stakeholders to develop their project in a progressive and sustainable manner.

19
Chapter 4: Methodology 4.1 Choice of subject We chose to study the subject of Sustainability due to personal interests in the field and personal experience working with environmental conservation organisations. Our literature review is based on the critical points of current knowledge and substantive findings of other researcher’s work that has been based on a similar subject matter to ours (Bryman & Bell, 2007, p.95). We decided to do a literature review to gain theoretical and methodological knowledge on our topic Sustainability, and develop arguments to try to answer some unanswered questions that we and other researchers have had. Our research has been influenced by the lack of information that we found about microeconomic factors of sustainability while making a literary review. 4.2 Preconceptions Preconceptions are influenced by previous knowledge, skills and experience that researchers have gained (Bryman & Bell, 2007, p.30). Therefore, knowledge can be divided into two parts: the theoretical and practical understanding of a subject. The theoretical knowledge contains educational background and previous learning, studies and other literature inputs. The practical skills explain work related and other forms of experience, for example personal experiences, such as social activities.
The authors are two female students that are currently studying International Business at Umeå University. Both have studied three years and will finish at undergraduate level in June 2011. During these years, they have acquired knowledge in business administration, economics and statistics, with an emphasis on management and finance in the third year. These studies have influenced their knowledge of the theoretical background that they will use in their research. Both authors have also studied different languages and lived in different countries in Europe and South-East Asia, which has taught them about different cultures and how this influences people’s attitudes and knowledge levels. The authors have also grown up in communities that have installed values of social responsibility and equality. Alice Watling grew up in London, England, and has previously attained a BA Honors in English Studies and a diploma in Teaching English as a Foreign/Second Language (TEFL). While working as a teacher of English in Czech Republic, Taiwan and Sweden for six years, Alice gained experience in a wide variety of societies and cultures, which has influenced her interest in community development. When she studied and worked as a Scuba Dive Master in Thailand she gained experience in the Dive Resort business and worked with environmental conservation organisations, which influenced her interests in environmental protection and alternative business practices. Emma Zhou grew up in Skellefteå, a small city in North of Sweden, but she has also lived in big cities, such as Paris and Hong Kong. Her multilingual skills and her knowledge about culture differences led to work opportunities such as interpreter and communications officer. Through this work experience she gained knowledge and skills about social responsibility and working with different cultures in the community. 4.3 Methodological assumptions Social science methodological approaches include the ontological views of Objectivism and Constructivism and the epistemological views of Positivism and Interpretivism

20
(Bryman & Bell, 2007, pp.16-18; pp. 22-23). We will take the ontological view of objectivism and the epistemological view of Positivism, which is called the naturalist approach. We would like to be as objective as possible because we believe that “science must be conducted in a way that is value free” (Bryman & Bell, 2007, p.16). We also believe that the application of natural sciences to the study of social reality through relying on the knowledge that can be “confirmed by the senses” (Bryman & Bell, 2007, p.16) is the most realistic approach for our study and how we understand what knowledge entails. Therefore, our study has been conducted with the view of a positivist/ objective researcher, which means we have tried to be neutral to the objectives of our study and use scientific knowledge to retrieve information about our subject of Sustainability, attitudes towards Sustainability and knowledge levels of Sustainability (Bryman & Bell, 2007, p. 16). As objectivists our research aims to reveal attitudes and knowledge levels towards sustainability. This does not set out to make any judgments, but may create suggestions for improvement. 4.4 Research assumptions Several different approaches can be used for the research of social science, including inductive and deductive approaches. We have chosen the deductive approach where the observations and findings are the outcome of a theory. We have chosen this approach because we found we needed to read and learn more about the subject ourselves before arriving at a particular method and applying what we have learnt to our study. The deductive approach represents the most common view of the nature of the relationship between theory and research (Bryman & Bell, 2007, pp.11-15). Our deductive approach starts with already existing theories about Sustainability, attitudes towards sustainability dimensions and knowledge. The theory of Bounded Rationality will be applied to the analysis of knowledge levels. 4.5 Conducting Research Research can be conducted in a quantitative, qualitative or a quantitative and qualitative manner. We chose the quantitative approach for the collection of empirical data because we had decided to do a deductive study, with a positivist approach that requires enough evidence to prove our hypotheses. Also, our purpose is to find out about people’s attitudes and knowledge, which requires a large enough sample to be able to generalise our findings and gather enough evidence to conduct a credible analysis. The main features in a quantitative study are larger population samples, the data collection is done with numbers or percentage calculations, and it can be used to generalise to other populations (Bryman & Bell, 2007, p.155). 4.6 Secondary Sources Primary and secondary sources can be used in research studies (Bryman & Bell, 2007, p.325; p.554). Primary sources are the data that a researcher collects for their own empirical study. The data is usually more costly and time consuming compared with secondary sources. Secondary sources are sources that researchers get from previous research or other studies. Literature reviews are made up of secondary sources. Secondary sources are assembled before primary sources, when a researcher needs to know what is already known about a subject before they start their own investigation. The secondary sources that we gathered included journal articles, literature, webpages,

21
news sources and magazines which provided us with the necessary information and a wider perspective of the macro and micro-level subjects of Sustainability. With the help of the databases from Umeå University Library’s website, we assembled articles mainly from a database called Business Source Premier. Another search engine that we used to find scholarly literature is the Goggle scholar. The articles and e-books that we found via Google Scholar were sources that had been citied in other articles we had found via the database at Umeå University Library, but did not exist on the database. The Google Scholar index contains online journals of Europe and American’s largest scholarly publisher (Google, 2011). When we used the databases from Umeå university library and the Google Scholar to search for the articles about sustainability, we utilised the key words sustainability, sustainable consumption and sustainable management. These key words have helped us generate several articles from which we gathered further knowledge. Our search provided us with a wide selection of information, which we read and chose to eliminate sources that did not fit our purpose. This included articles on the subjects of macro-level sustainability and the effects of institutional influence on production and business practices. We also eliminated sources that focused on consumption behaviour, because although this has a strong connection with people’s attitudes it is also a large enough subject for a thesis all of its own. 4.7 Criticism of Sources Primary sources should be considered before secondary sources, because primary data can be used by researchers to find the data they need to suit their purpose. When using secondary sources in a literary review, the original source is always preferred when developing an argument for a research study. Bryman and Bell (2007, p.109) state three issues that cause sources to be reliable or unreliable: authenticity of the author, independency of the work and the date the work was produced and published. Authenticity describes whether or not the secondary sources are credible and only credible sources should be used as a reference (Bryman & Bell, 2007, p.109). Our secondary sources have been widely acknowledge and criticised by their peers in a variety of other sources, including journal articles, news web sites and institutional webpages. This indicated to us that their research is authentic, independent and relevant to the present time and the subject of our research study. Independence describes the origin of the sources used for the research; it can either be primary or secondary (Bryman & Bell, 2007, p.109). Most of our secondary sources are primary case studies, however Kozo Mayumi’s (2001) discussion about CVM studies and Van den Bergh’s (2010) article Externality or sustainability economics?, is a literature review. The date a secondary source was produced or published is also important because this reveals how relevant the information is to present readers and to the subject of the study (Bryman & Bell, 2007, p.109). The sources that we have chosen are a variety of both primary and secondary sources, dating from a variety of times from 1990 to 2011 (see reference list). The information found in the older sources that we have used, for example Foy’s (1990) article Economic Sustainability and the Preservation of Environmental Assets and Stern’s (1997) article Limits to Substitution and Irreversibility in Production and Consumption: A Neoclassical Interpretation of Ecological Economics, have been supported by their peers of today (Van den Berg, 2010) and therefore still hold relevance in our study.

22
5. Data Collection 5.1 Primary Data and Research Design Our research study has been designed to collect primary data on the subject of people’s attitudes and knowledge levels towards each dimension of Sustainability and Sustainability as a whole. While conducting our literature review we found many supporting recommendations from researchers who believe that there is a need for further micro-level Sustainability research on the subject of people’s attitudes and knowledge levels towards subjects of Sustainability (Van den Berg, 2010, p.2051; Seyfang, 2007, p. 132; Dyner & Franco, 2004, p. 385; McComb, 2002, p.246). In order to collect the primary data we have chosen to conduct a survey by using a self-completed questionnaire to gather the necessary data required for this study, which is what a survey research quantitative questionnaire is designed to achieve (Bryman & Bell, 2007, p.56). 5.2 Sample In 2010 Ålidhem contained 3857 apartments (Bostaden, 2010). While both authors have lived at Ålidhem they have experienced that the Ålidhem residents have a wide variety of age, gender, employment and nationality; therefore the sample had the possibility to obtain a good range of different respondents. A sample size of 1000 respondents at random from a given population should be considered to obtain more precise results and to be able to generalise the results to other populations (Bryman & Bell, 2007, p.195). However, our short time limitation and very small budget for this research study restricted our study and so our sample size was halved to 500 respondents. We used a systematic sample (Bryman & Bell, 2007, p.187) where we selected residents of Ålidhem to participate in the research by writing the names of each block in the Ålidhem estate on an individual piece of paper, for example, Matematikgränd or Geografigränd, and then picked one ‘out of the hat’ to begin knocking on doors. We chose a systematic sample to make sure we had respondents that actually live in Ålidhem. We visited every other stairwell in the chosen block and knocked on every other door in that stairwell. Once we had collected data from a whole block we randomly picked another block, and continued this until we had knocked on 500 apartment doors that were situated in three of the blocks at Ålidhem. We asked only one person per apartment to take part in our survey because we believe that one person per household would be able to represent a wider sample of responses. 5.3 Survey Design We will collect data from the sample members by distributing a self-completion questionnaire. This will help give us the opportunity to process data from a large number of respondents and the possibility to generalise the results to other populations, which survey research is designed to achieve (Bryman & Bell, 2007, p.56). To remain as objective and positive as possible while designing the questionnaire, we have used generalised and more specific facts and attitudes to be assessed so that there will be easy and more complicated questions asked. We have investigated previous literature that have studied people’s attitudes and knowledge levels and have found that

23
previous researchers have used Likert rating scales (Zipfel, B. & Badenhorst, G. 2002; Spizzichino, L. et al. 2007), WTP/WTA scales (Georgantzis, N. & Navarro-Martinez, D. 2010; Ebert, U. 2008), True/False questions (Wakabyashi, T. & Guskin, K. 2010; Orth, W. et al. 2011) and multiple choice questions (Ventouras, E. et al. 2008) with some successful results. We have chosen to use all these methods of assessing knowledge and attitudes to eliminate errors that can occur, including answering correctly by chance and problems of embedding (as explained in theoretical framework, above). We have place a short introduction at the top of the questionnaire that explains our study and what we will use the results for, which points out that their answers will be held completely anonymous. The questionnaire has been divided into three parts, the first part is demographic, the second part is testing knowledge levels and the third part is testing attitudes. We have designed the questionnaire to start with demographic questions that are easy to answer and as the questionnaire progresses the questions become more detailed. This approach should help the respondents to oblige in continuing to answer the questionnaire if they feel that the questions are easy to answer. To avoid any bias problems we have tried to use language that does not discriminate against people who may not be acquainted with particular words that are special to the subject of Sustainability. The questionnaire has been written in English and in Swedish, because there are many residents from other countries that may not be able to speak Swedish, and there may be some Swedish residents that do not speak English. Attitudes and knowledge can also influence the way that respondents answer questions to surveys. Knowledge levels about all subjects can influence the respondents’ attitudes towards answering questionnaire surveys, not just the knowledge levels of the project and the subject of Sustainability. Our short time limit to do this study has also influenced our choice of using closed-end questions as a preference over open-end questions, because open-end questions can take a longer time to analyse and interpret into quantitative data. We have also placed each question and their possible answers in a clear, orderly and symmetric manner so that one answer does not stand out from the rest to avoid the prominent effect (as explained in the theoretical framework, above). We have high-lighted every question in Bold so that the respondent can clearly recognise what questions are being asked and what answers are displayed. The questionnaire has been designed to conduct a quantitative analysis of our results, therefore we will use the software program SPSS to calculate statistical values and produce graphs and pie charts to present our findings. We tested our first draft of the questionnaire on twenty people to investigate if there are any problems while answering the questions. There was only one suggestion of adding a Do not know option to question five in part one, which is Do you believe in a higher power (for example, a God)? Otherwise, the first draft questionnaire had some positive feedback and was answered in full by every test respondent. 5.4 Choice of questions There are many subjects that could be used to investigate people’s knowledge and attitudes towards Sustainability, but we have limited the questions to two or three

24
questions for each dimension of Sustainability and their interlinking subjects. We have limited the amount of questions because in our experience, while handing out surveys or participating in other peoples’ surveys, the longer the questionnaire is the least likely people are to answer the questionnaire in full or take part at all. However, we found it quite difficult to eliminate some subjects when there are so many important possibilities to investigate. This has resulted in a total of eighteen questions in our questionnaire; five questions in part one, eight questions in part two and five questions in part three, which fits on five A4 pages. Attitudes Part three of our questionnaire has five questions that assess attitudes by using a Lickert scale. We will test to see if there is a relationship between levels of knowledge and attitudes towards Sustainability. The first question assess attitudes towards the well-being of economy, society, environment, institutions, individual and community by ranking out of five from unimportant, which means they have a negative attitude, to very important, which means they have a positive attitude. There is also an option of having no opinion included. The second question assesses attitudes towards interlinking subjects between three of the dimensions, Economic, Social and Environment, which ranks out of five to what extent they agree; from strongly disagree, which means they have a negative attitude, to strongly agree, which means they have a positive attitude. An option of having no opinion is included. The third question has the same format, but includes the fourth dimension Institutions. We will investigate to see if our respondents’ attitudes differ towards the three dimensions in question two and all four dimension in question three, and therefore if our respondents consider Institutions to be an important subject of its own when discussing issues of Sustainability. We will also be able to see if the effect of Embedding (McComb, 2002, 237) occurs with the attitudes of our respondents. Question four and five in part three investigates the respondents’ willingness to pay (WTP) for Green products and services and willingness to accept (WTA) negative effects on the environment, respectively. We will use these questions to test for Preferential Reversals and Compatibility Hypothesis (McComb, 2002, p. 236). Both questions also use a Lickert scale ranking out of five from not at all to definitely, including an option of having no opinion. We will investigate if there is a correlation between positive attitudes to Sustainability and positive attitudes towards willingness to pay more for sustainable products and services. Knowledge We will test the relationship between the highest education attained and the respondents’ level of knowledge about the project and the subject of Sustainability. Part two of the questionnaire includes six questions about the Sustainable Ålidhem project that Bostaden AB promote on their website (Bostaden, 2011), five of which are multiple choice questions that can be right or wrong and can have more than one right answer; with options to tick all of above, none of the above and do not know. One question is based on true or false statements, which can be used to test whether a respondent is guessing. We have decided to use different types of questions to investigate the reliability of our respondents’ answers, therefore assessing if the respondents get a right answer by chance or if they have a consistent level of knowledge.

25
There is also one multiple choice question to test knowledge of each dimension of Sustainability and one multiple choice question that tests knowledge about some interlinking subjects of each dimension of Sustainability, with options to tick all of above, none of the above and do not know. This will be able to test if the effect of Embedding occurs with the knowledge levels of our respondents. Other Variables Part one includes five questions about gender, age, income, education and beliefs. We will use these variables to test the relationship between positive or negative attitudes and previous research findings, as discussed in our theoretical framework chapter (above). Therefore, we will test whether our respondents have a positive attitude to the protection of wildlife and have a high income level, and we will investigate if there is a relationship between positive attitudes and a belief in a higher power (Stern, 1997). We will also investigate if there is a relationship between attitudes and age or gender. The income intervals are based on the individual income tax bracket used by the Swedish tax authority (Capital Consulting, 2011), but we have also included smaller intervals because we know that many students live in Ålidhem who do not have very high income levels. 5.5 Quantifying our data collection Our multiple choice questions and Lickert scales give the values of 1-5, with 6 as the option of do not know/wrong or no opinion. The knowledge levels are calculated by adding the value each respondent gets from answering questions right, for example, one right answer in the available choices equals the value 1, two right answers equals the value 2 and so on. If a respondents gets no questions right or chooses to tick the I do not know option, then the value 6 is assigned. The value 1 means that the respondent has a very low level of knowledge or a very negative attitude; the value 2 means that the respondent has a low level of knowledge or a negative attitude; the value 3 means the respondent has a medium level of knowledge or a neutral attitude; the value 4 means that the respondent has a high level of knowledge or a positive attitude; and the value 5 means that the respondent has a very high level of knowledge or a very positive attitude. We will use these values to quantify our results and apply the values to a statistical analysis. 5.6 Analysis Our analysis will be based on a quantifiable collection of data that will be statistically analysed by using the software program SPSS. We will be able to use this method to test the hypotheses (see theoretical framework chapter), by investigating the relationship between the different variables that our questions represent. The variables that represent knowledge and attitudes are all continuous variables, which will be tested by using the Pearson Correlation Coefficient test (Pallant, 2007, p. 111). We will also be testing categorical variables with continuous variables, which require the one-way between-groups analysis of variance (ANOVA) test (Pallant, 2007, pp.113-115). The Pearson Correlation test allows us to investigate the strength of the relationship between two continuous variables and tells us if there is a positive or negative linear relationship. A strong positive relationship means that as one variable increases the other variable increases with it, and a strong negative relationship means that as one

26
variable decreases the other variable decreases too. The relationships can be described as strong or large if the correlation is between 0.50 and 01.0, a medium strength is between 0.30 and 0.49 and a small strength is between 0.10 and 0.29 (Pallant, 2007, p.132). From the results of the correlation coefficient we can calculate the coefficient of determination, which explains how much of the variance in one variable is explained because of the other variable, by using percentage value (Pallant, 2007, p.132). We will check for the normality of how each variable is distributed and homoscedasticity of how much each variable is spread from the trend line, by making a Normal Q-Q plot, a Skewness and Kurtosis test and producing a histogram or a scatter plot for each test, as well as the descriptive statistics (Pallant, 2007, p.124). The Pearson Correlation and the ANOVA tests give the significance level, which tells us how much confidence we should have in the results we have gathered. Therefore we will be able to investigate if our hypotheses are correct by looking at the significance level of our tests (Pallant, 2007, p.133). The significant level in the ANOVA test reveal if there is a difference of variance between groups of the categorical variables. If the value is less than or equal to 0.05 then there is a difference in one of the continuous variables between groups, but if the significance level is larger than 0.05 then there is no statistically significant difference between the groups (Pallant, 2007, p.246; p.287). 5.7 Access Non response can be a problem when using questionnaires to collect data and if the amount of non response prevents a study from collecting sufficient amount of data, the research will not be able to be used to generalise to other populations (Bryman & Bell, 2007, p.182-183). Overall, our questionnaire was successful when concerning the possible non response problem of respondents not answering every question. This could be due to the options No Opinion or Do not know in the possible answers we gave to our questions in the questionnaire. However, in our sample size of 500 respondents we received 129 (25, 8%) responses that took part and had 37 responses that did not want to take part in the survey. These 37 non-response plus 334 respondents that did not answer their doors are our total non-response group, which is 74, 2%. We noticed that the non response problem of people not answering their doors was worse in the mornings, so we began to only collect data in the afternoons and evenings. We also went back on the weekend to knock on doors that did not answer the first time, which helped us collect 20 more responses. We believe that many of the respondents either work or study during the day and this is why they were not home, which is a problem for studies that use the method of knocking on doors rather than asking passersby. This is one of the reasons we considered sending out emails for those who preferred this option. After the first day of data collection we began to suggest that those who were too busy could answer by email, which was a suggestion made by a respondent on the first day. The reason we did not plan on sending out emails at first is because in previous experience of using this technique the non-response rate has been very high. However, the email response rate was 28 responses out of 55 respondents who said they preferred to send an email when they had the time. We also did not plan on using email for responses because we wanted to be present while the respondents were answering the

27
questionnaire, in case the respondents wanted to know more about the study or needed any other information. For example, one respondent did not want to answer the questionnaire because they did not understand why we asked about belief in a higher power. When we explained the theory behind the question the respondent was still not happy to fill in the questionnaire, even though it was acknowledged that the answers are held anonymously, which revealed that this question is quite sensitive for some people. Including our test pilot collection, we collected our data for 6 days in total. Our respondents were predominantly students or recently graduated ex-students of Umeå University and therefore quite familiar with the format of answering questionnaires and having students asking to contribute to undergraduate thesis studies. Along with our short introduction that explained our survey, the familiarity of answering questionnaires could also be a reason why our questionnaires were answered in full. 5.8 Ethical considerations Bryman & Bell (2007, pp. 132-142) recognise four main ethical principles that business researchers should consider when collecting data for a study, which include bringing no harm to the participants, having informed consent, not invading the privacy of the participant and not deceiving the participant. We chose not to use any members of a household that are under the age of 18 to ensure every respondent is of an age that can take responsibility for choosing to take part. We did not pressurise any of our respondents to take part in our survey so as not to be of any inconvenience to the respondents. When a respondent said they did not have the time, the respondent suggested that we sent them an email with the questionnaire, and it was returned to us quite promptly. We took this as a positive sign and suggested to other respondents to do the same when they were also pressed for time. This system worked very well and we received fully answered questionnaires from those who had chosen to send an email instead of filling in the paper questionnaire. We were also honest and open to discuss any concerns the respondents may have in taking part in our survey. We informed them that their responses were completely anonymous and that each questionnaire would be coded by number, therefore their answers will be confidential and held private. There was not much resistance; however some respondents wondered why we were asking about beliefs in a higher power, so we explained what we were investigating with this variable. We also let people know that our analysis was to find out the average response rate and anomalies, and that there would not be a detailed investigation into individual responses. 5.9 Criticisms of Primary Data Our questionnaire was quite long, although this did not appear to give us any problems when collecting the data. The questions we have chosen applied variables that we discussed in our theoretical framework, but each part were not of equal proportions with five questions in part one and three, and eight questions in part two. We decided to offer more questions on Knowledge in part two, because we wanted to find out what the respondents knew about the project at Ålidhem and the subject of Sustainability. We would have preferred to have asked more than two questions about the subject of Sustainability, but decided that the questionnaire was already quite long. Therefore, we believe that further studies with more detailed questions that investigate knowledge levels of a population may achieve some interesting insights into people’s attitudes towards Sustainability.

28
Chapter 6: Empirical Data 6.1 Introduction We have presented our results in this chapter by using descriptive statistics to explore our data collection. Part one of our questionnaire includes five demographic questions that will be used to investigate our data on knowledge levels from part two of our questionnaire, and to investigate our data on attitudes from part three of our questionnaire. 6.2 PART 1: Demographics Gender Our data shows that 58.9% of our respondents are female and 41.1 % of our respondents are male (see figure 6).
(Figure 6: Gender) Age Our data revealed that most of the respondents who took part in our survey are
relatively young, with the youngest aged 19 and the eldest aged 34. The mean value of age is 24.6 with a standard deviation of 3.523. The range of age data is 15, therefore we decided to group the age of our respondents in intervals of 5 to present our data (See figure 7). Group one is aged 19-23 with 45% of our respondents, group two is aged 24-28 with 39.5% of our respondents and group three is aged 29-34 with 15.5% of our respondents. Therefore our data is collected by respondents who are mainly between the ages of 19-23 and 24-28.
(Figure 7: Age) When sample sizes are below 200 cases Skewness can affect the analysis and Kurtosis can give an underestimate of the variance (Julie Pallant, 2007, p.56). We tested our data on age for symmetry of normality by using the Skewness test, which revealed 0.816 Skewness. A positive skewness indicates that our range is largely clustered towards group one of our age data. We also tested for any peaks in normality by using the Kurtosis test, which revealed a 0.046 Kurtosis. A positive Kurtosis indicates a cluster of peaks in the centre of the data; however our positive Kurtosis is also very close to zero, which shows our data range has relatively minimal peaks.

29
Income Our data results revealed that 84.5 % of our respondents have an income within the bracket of up to SEK 100,000. We expected that a large majority of our respondents would be in this group, because the community of Ålidhem has many students or recently graduated students living in the estate. However, some of our respondents had higher income levels, which included 10.9 % who have an income in the bracket of SEK 101,000-200,000, also 3.9 % have an income in the bracket of SEK 201,000-372,100 and 0.8 % (just one respondent) has an income in the tax bracket of more than SEK 532, 700 (see figure 8). Therefore, we can expect that income level may have some effect on our analysis and could underestimate the variance, because the Skewness test gave a positive value of 3, 477 and the Kurtosis test gave a value of 15,065.
(Figure 8: Income/year) Education Our data revealed that 57 respondents (44.2%) have an Undergraduate degree, (see figure 9). Also, 41 respondents (31.8%) have a high school (gymnasium) certificate. These are the two largest groups from our respondents. Due to the young age groups
that the majority of our respondents belong to (see data results in figure 7); these two education levels are expected because the education systems in many countries usually accept students into university at age 18 or 19 at the youngest. Other groups included 23 respondents (17.8%) who have a university Masters degree; 6 respondents (4.7%) who have a university postgraduate degree; 1 respondent (0.8%) only has a secondary school certificate and 1 respondent ticked the option other. Our education level data has a mean value of 3.1,
which indicates the coded value for a University Undergraduate degree. (Figure 9: Education) Belief Our data revealed (see figure 10) that 55 respondents (42.6 %) ticked no; 54 respondents (41.9 %) ticked yes; and 20 respondents (15.5 %) ticked the option I do not know.
(Figure 10: Belief higher power)

30
6.3 PART 2: Knowledge Questions one to six in part two of the questionnaires ask the respondents about what they know about the project that Bostaden AB has started in the Ålidhem estate. The results from the data collected revealed that the majority of respondents were honest in replying that they did not know the answer to questions one to five (see figures 11-15). Our multiple choice questions give the values of 1-5, with 6 as the option of do not know/wrong. The knowledge levels are calculated by adding the value each respondent gets from answering questions right, for example, one right answer in the available choices equals the value 1, two right answers equals the value 2 and so on. If a respondent gets no questions right or chooses to tick the I do not know option, then the value 6 is assigned. The value 1 means that the respondent has a very low level of knowledge; the value 2 means that the respondent has a low level of knowledge; the value 3 means the respondent has a medium level of knowledge; the value 4 means that the respondent has a high level of knowledge; and the value 5 means that the respondent has a very high level of knowledge. We will use these values to quantify our results and apply the values to a statistical analysis. Bostaden AB’s Five Points of Focus Our data revealed that 75 respondents (58.1%) do not know what Bostaden AB’s five main points of focus are for their project, (see figure 11). However, 29 respondents
(22.5%) had a high level of knowledge; and 12 respondents (9.3%) had a very high level of knowledge. In total, we can see that 31.8% of our respondents have a good level of knowledge towards this question. Furthermore, 10 respondents (7.8%) have a low level of knowledge, and 3 respondents (2.3%) have a very low level. In total, 68.2% of our respondents had a low level to no knowledge towards this question.
(Figure 11: Five points of focus) Bostaden AB’s construction plans Our data revealed that 60 respondents (46.5%) do not know about the types of construction that Bostaden AB is planning, (see figure 12). However, 29 respondents (22.5%) have a high level of knowledge; and 5 respondents (3.9%) have a very high level of knowledge. In total, 26.4% of our respondents have a good level of knowledge towards this question. Furthermore, 14 respondents (10.9%) have a low level of knowledge and 13 respondents (10.1%) have a very low level of knowledge. Also, 8 respondents (6.2%) got this question wrong. In total, 73.7% of our respondents have a low level to no knowledge towards this question. (Figure 12: Construction planned)

31
Bostaden AB’s Energy Production Plans Our data revealed that 70 respondents (54.3%) do not know what Bostaden AB’s energy production plans, (see figure 13). Furthermore, 32 respondents (24.8%) had a low level of knowledge; and 15 respondents (11.6%) got the question wrong. In total, 90.7% of
our respondents have a low level to no knowledge towards Bostaden AB’s energy production plans, which is a really high figure. Only 1 respondent (0.8%) has a high level of knowledge; and 11 respondents (8.5%) have a medium level of knowledge. In total, we can see that only 9.3% of our respondents have a good level of knowledge towards this question, which is a really low figure. (Figure 13: Energy production)
Bostaden AB’s Winter Garden Our data revealed that 57 respondents do not know what Bostaden AB’s winter garden project is all about, which is 44.2% of our respondents (See figure 14). Furthermore, 26 respondents have a low level of knowledge, which is 20.2% of our respondents. In total, 64.4% of our respondents have a low level to no knowledge towards this question. However, 30 respondents had a high level of knowledge, which is 23.3% of our respondents; and 16 respondents had a medium level of knowledge, which is 12.4% of our respondents. In total, we can see that 35.7% of our respondents have a good level of knowledge of Bostaden AB’s winter garden project. (Figure 14: Winter Garden) Bostaden AB’s Concept of Green Citizen Our data revealed that 48 respondents do not know what Bostaden AB’s Green Citizen means, which is 37.2% of our respondents (See figure 15). Furthermore, 36 respondents had a very low level of knowledge, which is 27.9% of our respondents; 20 respondents have a low level of knowledge, which is 15.5% of our respondents; and 1 respondent got the question wrong, which is 0.8% of our respondents. In total, 81.4% of our
respondents had a low level to no knowledge towards this question, which is a relatively high figure. However, 22 respondents have a high level of knowledge, which is 17.1% of our respondents; and 2 respondents have a very high level of knowledge, which is 1.6% of our respondents. In total, we can see that only 18.7% of our respondents have a good level of knowledge towards this question. (Figure 15: Green Citizen)

32
Bostaden AB’s Waste Management Question six showed a high level of knowledge in the majority of our respondents which contradicts the first five questions (See figure 16, below). This contradiction could be the result of using a True/False question format, because people may get a question right by chance or may be more willing to guess the answer. Therefore, our respondents show evidence for Bounded Rationality to occur in their responses. The previous five questions have revealed that our respondents were more willing to admit that they do not know, however the multiple choice question format used in questions 1-5 is disproportionate to the true/false question format in question 6, and therefore may bias the results. However, question 6 gave six different statements about waste management, which is one of the five focus points that Bostaden AB are working towards achieving. It may be that because the residents have had more contact with the waste management system at the Ålidhem estate, that they have a better knowledge level of this subject.
(Figure 16: Waste Management) The Four Dimensions of Sustainability (Question 7) Our data revealed that 67 respondents (51.9%) chose all four dimensions when asked
about what dimensions are involved in Sustainability, (see figure 17). Furthermore, 34 respondents (26.4%) chose three dimensions. In total, 78.3% of our respondents have a high level of knowledge towards the four dimensions of sustainability. However, 18 respondents (14%) chose two dimensions and 5 respondents (3.9%) chose one dimension. The data also shows that 5 respondents (3.9%) said they did not know. In total, we can see that 21.8% of our respondents have a low level to no knowledge towards this question.
(Figure 17: Four Dimensions) The Interlinking Subjects of Sustainability (Question 8) The interlinking subjects of sustainability are the subjects that link each dimension of Sustainability, for example the Economic-Social subject of housing, the Economic-Environment subject of waste management or the Economic-Institution subject of sustainable project funding. Our data revealed that 46 respondents (35.7%) have a very high level of knowledge about the interlinking subjects of Sustainability, (See figure 18, below). Furthermore, 15 respondents (11.6%) have a high level of knowledge; and 24 respondents (18.6%) have a medium level of knowledge. In total, 65.9% of our respondents have a good level of knowledge about the interlinking subjects of Sustainability. However, 26 respondents (20.2%) have a low level of knowledge; 5 respondents (3.9%) have a very low level of knowledge; and 13 respondents (10.1%) said they do not know. In total, we can see that 34.2% of our respondents have a low level to no knowledge towards this question.

33
The last two questions, about the four dimensions of Sustainability and the interlinking subjects between the dimensions of Sustainability, will be used to investigate whether the embedding effect occurs in our respondents’ answers. Embedding occurs when an individual is unable to differentiate between a choice of two objects, when one object is surrounded or set into the other object (McComb, 2002, p.273). For example, asking a respondent what they know about social responsibility or environmental protection and then asking them what they know about Sustainability as a whole.
(Figure 18: Interlinking subjects of Sustainability)
6.4 PART 3: Attitudes Questions 1-5 use a Likert scale to ask about the respondent’s attitude towards different aspects of Sustainability. Our Lickert scales give the values of 1-5, with 6 as the option of no opinion. The value 1 means that the respondent has a very negative attitude; the value 2 means that the respondent has a negative attitude; the value 3 means the respondent has a neutral attitude; the value 4 means that the respondent has a positive attitude; and the value 5 means that the respondent has a very positive attitude. We will use these values to quantify our results and apply the values to a statistical analysis. Our data results revealed that the average respondent has a positive attitude towards question 1, 3 and 5 and a neutral to positive attitude to question 2 and 4. Therefore, our initial investigation into our data results reveal that overall our respondents have a positive attitude towards each dimension of Sustainability and Sustainability as a whole. Attitudes towards the well-being of the Economy Our data revealed that 52 respondents (40.3%) have a very positive attitude towards the well being of the economy; 44 respondents (34.1%) have a positive attitude; 29 respondents (22.5%) are neutral; and 4 respondents (3.1%) have a negative attitude. In total, 74.4% of our respondents have a positive attitude towards the well-being of the economy (See figure 19).
How important is the well being of the Economy?
(Figure 19: Well-being of Economy)

34
Attitudes towards the well-being of Society Our data revealed that 71 respondents (55%) have a very positive attitude towards the well being of society; 51 respondents (39.5%) have a positive attitude; and 7 respondents (5.4%) are neutral. In total, 94.5% of our respondents have a positive attitude towards the well being of society, which is a large majority. (See figure 20)
How important is the well being of Society? (Figure 20: Well-being of Society) Attitudes towards the well-being of the Environment Our data revealed that 89 respondents (69%) have a very positive attitude towards the well being of the environment; 27 respondents (20.9%) have a positive attitude; and 13 respondents (10.1%) are neutral. In total, 89.9% of our respondents have a positive attitude towards the well being of the environment, which is a large majority. (See figure 21)
How important is the well being of the Environment? (Figure 21: Well-being of Environment)
Attitudes towards the well-being of Institutions
Our data revealed that 27 respondents (20.9%) have a very positive attitude towards the well being of institutions; 52 respondents (40.3%) have a positive attitude; 40 respondents (31%) are neutral; and 4 respondents (3.1%) have a negative attitude. Also, 6 respondents (4.7%) had no opinion. In total, 61.2% of our respondents have a positive attitude towards the well being of institutions, which is lower than the three dimensions of Economy, Social and Environment well-being. (See figure 22)
How important is the well being of Institutions? (Figure 22: Well-being of institutions)

35
Attitudes towards the well-being of the Community Our data revealed that 41 respondents (31.8%) have a very positive attitude towards the well being of the community; 65 respondents (50.4%) have a positive attitude; 17 respondents (13.2%) are neutral; and 6 respondents (4.7%) have a negative attitude. In total, 82.2% of our respondents have a positive attitude towards the well-being of the community, which is a relatively large majority. (See figure 23)
How important is the well being of the Community? (Figure 23: Well-being of the Community)
Attitudes towards the well-being of the Individual Our data revealed that 63 respondents (48.8%) have a very positive attitude towards the well being of the community; 44 respondents (34.1%) have a positive attitude; 17 respondents (13.2%) are neutral; and 5 respondents (3.9%) have a negative attitude. In total, 82.9% of our respondents have a positive attitude towards the well-being of the individual, which is a relatively large majority. (See figure 24)
How important is the well being of the individual? (Figure 24: Well-being of the individual) Attitudes towards Economic, Social and Environment Dimensions To investigate if there is an effect of embedding, we chose to ask a question to assess the attitudes towards the individual dimensions (as discussed above) and then two more questions that measure attitudes of the interlinking subjects between the dimensions. The respondents attitudes towards different interlinking subjects between three of the dimensions of Sustainability; Economic, Social and Environment Sustainability, were asked in question 2. The seven statements in question 2 were assessed by using a 5 point Lickert scale of strongly disagree to strongly agree, with the option of no opinion as a sixth point on the scale. Our data revealed a mean value of 3 which indicates an overall neutral attitude towards the three dimensions. Attitudes towards Economic, Social, Environment and Institution Dimensions Question 3 assed the respondents’ attitudes towards different interlinking subjects between all four of the dimensions of Sustainability. The six statements revealed a mean value of 4 which indicates an overall positive attitude towards all four dimensions. Therefore, attitudes have strengthened when we added the subjects about Institutional Sustainability, which indicates the importance of Institutional Sustainability in the minds of the residents at the Ålidhem estate in Umeå. This result contradicts the lower average result of 3=neutral attitude from question 2 above, and from asking about the institution dimension separately in question 1 above. This suggests that there is some evidence of embedding in our results, which we will investigate further in our analysis.

36
Willing To Pay (WTP) Our data revealed that 5 respondents (3.9%) have a very positive attitude towards WTP; 51 respondents (39.5%) have a positive attitude; 48 respondents (37.2%) are neutral; 19 respondents (14.7%) have a negative attitude; and 6 respondents (4.7%) have a very negative attitude. In total, 43.4% of our respondents have a positive attitude towards willing to pay more for Green products and services, which is a figure that is not significantly different to the 37.2% who have a neutral attitude. (See figure 25, below) (Figure 25: WTP) Willing To Accept (WTA)
Our data revealed that 18 respondents (14%) have a very positive attitude towards WTA; 64 respondents (49.6%) have a positive attitude; 30 respondents (23.3%) are neutral; 13 respondents (10.1%) have a negative attitude; and 3 respondents (2.3%) have a very negative attitude. Also, one respondent (0.8%) had no opinion. In total, 63.6% of our respondents have a positive attitude towards willing to accept the effects of unsustainability.
(Figure 26: WTA) The two questions, WTP and WTA, will be used to investigate if there is any preferential reversal effect in the answers that our respondents have given. Preference reversals have been observed when two techniques of asking questions about the same values have been used. For example, first asking the respondent to grade their attitude on a scale of five between two or more objects and then secondly asking how much they are willing to pay for the same objects. These questions are therefore part of our Contingent Valuation Method. 6.5 Conclusion of Empirical Data Overall, our initial investigation into our data results reveals that the respondents have a positive attitude towards each dimension of Sustainability and Sustainability as a whole. However, their attitude towards paying more for sustainable products and services is lower. They also reveal to have quite a high knowledge about some of the interlinking subjects of sustainability, but they have a low level of knowledge towards Bostaden AB’s project to create a Sustainable Ålidhem. We will investigate these findings to test our nine hypotheses (see theoretical framework chapter) and to reveal whether there is any difference in the relationship between the attitude and knowledge levels and the attitude and education levels, income, beliefs gender or age of our respondents.

37
Chapter 7: Analysis Introduction The purpose of our study is to investigate customers’ attitudes towards Sustainability and how knowledge levels influence their attitudes, as well as to investigate other variables such as Education, Income, Belief, Age and Gender which can all influence knowledge and attitudes. In this chapter we will investigate the data results to test our nine hypotheses by using the SPSS software program and the Pearson Correlation Coefficient test, which will reveal the relationship between our variables of Attitudes and Knowledge levels. The coefficient of determination will be calculated to investigate how much variance in the dependent variable is explained by the independent variable. A one-way between-groups analysis of variance (ANOVA) will be used to investigate attitudes and the categorical variables Education, Income, Belief, Gender and Age. The partial Eta Squared effect size statistics indicates how much variance in the dependent variable is explained by the independent variable in the ANOVA test (Pallant, 2007, p. 208). We have proposed nine hypotheses that have been based on previous theoretical research and can investigate attitudes and knowledge levels, plus other factors such as education, income belief, gender and age that can affect attitudes. To do this we will investigate the wider variables of Total Attitudes and Total Knowledge, but also the more narrow variables of Knowledge about the Ålidhem project, Knowledge about Sustainability, Attitudes towards Sustainability Dimensions, Attitudes towards the interlinking subjects of Sustainability, Attitudes towards Willingness to Pay and Willingness to Accept; plus how education, income, belief, gender and age effect attitudes. We performed a preliminary analysis for all of our variables to ensure that there was no violation of the assumption of normality, linearity and homoscedasticity as explained in the data collection chapter. 7.2 Hypothesis A This hypothesis has been tested by calculating the mean value of attitudes towards sustainability by using the results from question one in part three of our questionnaire. We have also calculated the mean value of knowledge levels towards Sustainability, by calculating the responses to questions seven and eight in part two of our questionnaire. The attitudes and knowledge variables are continuous variables, which can test hypothesis A by using the Pearson Correlation Coefficient test. Hypothesis A is; Hypothesis A0 = the mean value of attitudes towards sustainability is positive, when
the mean value of knowledge levels towards sustainability is high.
Hypothesis A1 = the mean value of attitudes towards sustainability is not positive, when the mean value of knowledge levels towards sustainability is high.
The results of our Pearson Correlation Coefficient test revealed that the relationship between attitudes and knowledge towards Sustainability is positive with a strength of 0.265, which means there is a small strength level between these two variables (Pallant, 2007, p. 132). However, there is evidence to suggest that as knowledge levels towards Sustainability increase; attitudes become more positive towards Sustainability. The coefficient of determination is 0.0702, which means that knowledge about

38
Sustainability helps to explain 7.02% of the variance in the respondents’ attitudes towards Sustainability. Therefore, further investigation is needed. The significance level for this test is 0.01 and the significance results between the two variables is 0.003, which means that there is a significant statistical difference between respondents who have scored high on knowledge levels and respondents who have positive attitudes (Pallant, 2007, p. 246). This reveals that there is very strong evidence that the alternative hypothesis is true, which is that the mean value of attitudes towards sustainability is not positive when the mean value of knowledge levels towards sustainability is high. Although there is a small relationship between attitudes and knowledge levels, and our initial presentation of the data revealed that statistically our respondents have a positive attitude towards sustainability and a high level of knowledge about sustainability, further analysis has revealed that respondents who scored high on knowledge levels towards sustainability were not the same respondents who scored positive for attitudes towards sustainability. This indicates that more factors than knowledge levels of sustainability contribute to positive attitudes towards sustainability and so further analysis is needed. However, this result does show that Bostaden AB’s project Sustainable Ålidhem may need to consider other approaches than just knowledge dissemination to be able to gain positive attitudes of its residents at Ålidhem towards the project. 7.3 Hypothesis B This hypothesis has been tested by calculating the mean value of attitudes towards willingness to pay (WTP) more for sustainable products and services by using the results from question four in part three of our questionnaire. We have also calculated the mean value of attitudes towards willingness to accept (WTA) unsustainability, by using the results from question five in part two of our questionnaire. The WTP and WTA variables are continuous variables, which can test hypothesis B by using the Pearson Correlation Coefficient test. Hypothesis B is; Hypothesis B0 = the mean attitude towards willingness to pay more for
sustainable products and services is positive, when the mean attitude towards willing to accept unsustainability is positive.
Hypothesis B1 = the mean attitude towards willingness to pay more for
sustainable products and services is not positive, when the mean attitude towards willing to accept unsustainability is positive.
The results of our Pearson Correlation Coefficient test revealed that the relationship between WTP and WTA is negative with a strength of -0.203, which means there is a small strength level between these two variables (Pallant, 2007, p. 132). The negative relationship means that there is evidence to suggest that as attitudes towards the WTP more for sustainable products and services decreases, attitudes towards the WTA unsustainability are more positive. Therefore, average respondent has shown that when they have had positive attitudes towards not accepting unsustainable practices, they have also revealed to have negative attitudes towards being willing to pay more for sustainable products or services. This result indicates that our respondents do show signs of Bounded Rationality and the Preferential Reversal effect (McComb, 2002, p.

39
238), so although the respondents may have positive attitudes towards the Sustainable Ålidhem project they may not be willing to pay more for the new housing that will be constructed as part of the Sustainable Ålidhem project. The coefficient of determination of our results is 0.0412, which means that attitudes towards WTP help to explain 4.12% of the variance in the respondents’ attitudes towards WTA. Therefore, further investigation is needed. The significance level for this test is 0.05 and the significance results between the two variables is 0.021, which means that there is a significant statistical difference between respondents who have negative attitudes towards WTP more for sustainable products and services and respondents who have positive attitudes towards WTA unsustainability (Pallant, 2007, p. 246). Therefore, there is strong evidence that the alternative hypothesis is true, which is that the mean value of attitudes towards WTP more for sustainable products and services is not positive when the mean value of WTA unsustainability is positive. This confirms the preferential reversal effect has occurred which suggests that the residents at Ålidhem have a Satisficing set that is based on a bounded rationality influence of preferential reversals that cost is more important than unsustainable community development. This can be interpreted further to suggest that Bostaden AB should work towards reducing the higher prices, which are normally connected with sustainable products and services and that we assume will come with the newly constructed sustainable housing in Ålidhem, in order to satisfy their customers. 7.4 Hypothesis C This hypothesis has been tested by calculating the mean value of Total Attitudes towards sustainability by using the results from all the questions in part three of our questionnaire. We have also calculated the mean value of Total Knowledge levels towards Sustainability and the Sustainable Ålidhem project by Bostaden AB, by calculating all the responses to all the questions in part two of our questionnaire. The Total Attitudes and Total Knowledge variables are continuous variables, which can test hypothesis C by using the Pearson Correlation Coefficient test. Hypothesis C is; Hypothesis C0 = the mean total attitude towards sustainability is positive, when
the mean total knowledge levels about sustainability and the project at Ålidhem is high.
Hypothesis C1 = the mean total attitude towards sustainability is not positive, when the mean total knowledge levels about sustainability and the project at Ålidhem is high.
The results of our Pearson Correlation Coefficient test revealed that the relationship between Total Attitudes and Total Knowledge is positive with a strength of 0.29, which means there is a small strength level between these two variables (Pallant, 2007, p. 132). However, there is evidence to suggest that as knowledge levels towards Sustainability increase; attitudes become more positive towards Sustainability. The coefficient of determination is 0.0841, which means that Total Knowledge helps to explain 8.41% of the variance in the respondents Total Attitudes. Therefore, further investigation is needed. The significance level for this test is 0.01 and the significance results between the two variables is 0.001, which means that there is a significant statistical difference between

40
respondents who have scored high on knowledge levels and respondents who have positive attitudes (Pallant, 2007, p. 246). Therefore, there is very strong evidence that the alternative hypothesis is true, which is that the mean value of total attitudes towards Sustainability is not positive when the mean value of total knowledge levels towards Sustainability is high. There has not been any change in the attitude/knowledge relationship when all variables of attitudes and knowledge have been calculated into the equation. This also indicates that more factors than knowledge contribute to positive attitudes towards Sustainability and further investigation is required. 7.5 Hypothesis D This hypothesis has been tested by calculating the mean value of Total Attitudes towards sustainability by using the results from all the questions in part three of our questionnaire. We have also calculated the mean value of Educational levels by using question four in part one of our questionnaire. The Total Attitudes variable is a continuous variable and the Educational variable is a categorical variable, therefore we used the one-way between-groups analysis of variance to test hypothesis D. Hypothesis D is; Hypothesis D0 = the mean total attitude towards sustainability is positive, when
the mean educational level is high.
Hypothesis D1 = the mean total attitude towards sustainability is not positive, when the mean educational level is high.
The respondents’ educational levels had six groups (Group 1: Secondary school; Group 2: High school; Group 3: Undergraduate; Group 4: Post-graduate; Group 5: Masters; Group 6: Other). There was a 0.932 significance level in our results, which is larger than 0.05 and therefore indicates that there is not a statistically significant difference between educational groups and the mean value of attitudes towards sustainability. We can see this in the mean values between groups where the difference is very small (3.44, 3.15, 3.22, 3.18, 3.22 and 3.22). The Eta Squared between total attitudes towards sustainability and the educational levels of our respondents is 0.01, which means there is a small effect size between the two variables so that there is not much explanation in the variance of attitudes from the different educational groups (Pallant, 2007, p. 208). Our results reveal that there is no evidence that the alternative hypothesis is true; therefore the mean total attitude towards sustainability is positive, when the mean educational level is high. Therefore, education about sustainability should be considered an important part of sustainable development in a community and be supported by institutions and all who are involved with educating their communities. Bostaden AB’s customers/residents at Ålidhem are mostly students at Umeå University, so their customers have a relatively high educational level and therefore should have positive attitudes towards sustainability. This should help Bostaden AB gain the cooperation of their customers to adjust to the new waste management process and reduce their energy consumption, which in turn will help the project work efficiently and effectively. 7.6 Hypothesis E This hypothesis has been tested by calculating the mean value of knowledge levels towards the interlinking subjects of sustainability and the mean value of knowledge

41
levels towards the Sustainability dimensions by using the results from questions seven and eight in part two of our questionnaire. We have made this test to investigate if the effect of Embedding occurs with our respondents. Embedding occurs when an individual is unable to differentiate between a choice of two objects, when one object is surrounded or set into the other object (McComb, 2002, p.273). For example, asking a respondent what they know about social responsibility or environmental protection and then asking them what they know about Sustainability as a whole. The attitudes and knowledge variables are continuous variables, which can test hypothesis E by using the Pearson Correlation Coefficient test. Hypothesis E is; Hypothesis E0 = the mean knowledge level of the interlinking subjects is high
when the mean knowledge level of the dimensions of sustainability is high.
Hypothesis E1 = the mean knowledge level of the interlinking subjects is not high when the mean knowledge level of the dimensions of sustainability is high.
The results of our Pearson Correlation Coefficient test revealed that the relationship between attitudes and knowledge towards Sustainability is positive with a strength of 0.386, which means there is a medium strength level between these two variables (Pallant, 2007, p. 132). This means that there is evidence to suggest that as knowledge levels towards Sustainability dimensions increase, the knowledge levels towards the interlinking subjects of Sustainability increase. The coefficient of determination is 0.1489, which means that knowledge levels about the interlinking subjects of Sustainability helps to explain 14.89% of the variance in the respondents’ knowledge levels of the Sustainability Dimensions. The significance level for this test is 0.01 and the significance results between the two variables is 0.000, which means that there is a significant statistical difference between respondents who have scored high on knowledge levels towards the interlinking subjects of Sustainability and respondents who have scored high on the knowledge levels towards the Sustainability Dimensions (Pallant, 2007, p. 246). This reveals that there is very strong evidence that the alternative hypothesis is true, which is that the mean knowledge level of the interlinking subjects is not high when the mean knowledge level of the dimensions of sustainability is high. This indicates that the Embedding effect has occurred and that the theory of Bounded Rationality (McComb, 2002, p.273) has been proven to exist in our respondents. Bostaden AB may want to consider that although the residents/customers at Ålidhem may have relatively high educational levels, their capability to fully understand all that is involved in the sustainability subjects such as sustainable construction, waste management, and alternative energy sources is bounded. Therefore, it is recommended that further information about the project and how Sustainable Ålidhem can benefit so many different interlinking subjects of the community’s lifestyle should be delivered, for example methods of decreasing consumption that decreases waste and reduces energy bills; or activities that increases social welfare that increases community cooperation and can lead to a decrease in stress levels. 7.7 Hypothesis F This hypothesis has been tested by calculating the mean value of Total Attitudes towards sustainability by using the results from all the questions in part three of our

42
questionnaire. We have also calculated the mean value of Income levels by using question three in part one of our questionnaire. The Total Attitudes variable is a continuous variable and the Income variable is a categorical variable, therefore we used the one-way between-groups analysis of variance test to test hypothesis F. Hypothesis F is; Hypothesis F0 = the mean total attitude towards Sustainability is positive, when
the mean income level is high.
Hypothesis F1 = the mean total attitude towards Sustainability is not positive, when the mean income level is high.
The respondents Income levels had five groups which include the tax brackets in Sweden (Capital Consulting, 2011) and 3 smaller values in group 1 to 3 to accommodate for lower income households (Group 1: up to SEK 100,000; Group 2: SEK 101,000 – 200,000; Group 3: SEK 201,000- 372,100; Group 4: SEK 372,101- 532,700; Group 5: over SEK 532,700). There was a 0.010 significance level in our results, which is smaller than 0.05 and therefore indicates that there is a statistically significant difference between income groups and the mean value of attitudes towards sustainability. Unfortunately we could not investigate this further because at least one group had a sum of cases that was less than or equal to one and so cannot be calculated. The distribution of income levels between groups in our sample is not wide enough to analyse further, because 109 of our respondents (84.5%) belong to group 1 = up to SEK 100,000; 14 respondents (10.85%) belong to group 2 = SEK 101,000-200,000; 5 respondents (3.87%) belong to group 3 = SEK 201,000-372,100; and one respondent belongs to group 5 = over SEK 532, 700. Therefore we do not have enough respondents from each group to be able to explain the relationship between attitudes towards sustainability and the different income level groups. Our data cannot say whether respondents with high incomes have positive or negative attitudes because there were not enough cases to generalise. However, according to our calculations with SPSS the mean value towards attitudes for group one is 3.23, group 2 is 2.97, group 3 is 3.33 and group 5 is 2.52, therefore the overall mean attitude is closer to 3, which means the respondents have a neutral attitude towards Sustainability whatever their income level. 7.8 Hypothesis G This hypothesis has been tested by calculating the mean value of Total Attitudes towards sustainability by using the results from all the questions in part three of our questionnaire. We have also calculated the mean value of beliefs by using question five in part one of our questionnaire. The Total Attitudes variable is a continuous variable and the Belief variable is a categorical variable, therefore we used the one-way between-groups analysis of variance test to test hypothesis G. Hypothesis G is; Hypothesis G0 = the mean total attitude towards sustainability differs between
group responses to belief in a high power.
Hypothesis G1 = the mean total attitude towards sustainability does not differ between group responses to belief in a higher power.
The respondents Beliefs in a higher power had three groups (Group 1: Yes; Group 2: No; Group 3: I do not know). There was a 0.097 significance level in our results, which

43
is larger than 0.05 and therefore indicates that there is not a statistically significant difference between Belief groups and the mean value of attitudes towards sustainability. This is also revealed in the mean values between groups, which is 3.27, 3.12 and 3.22 so the average mean value in all groups is 3, which is a neutral attitude towards sustainability. The Eta squared test reveal a value of 0.036, which means that there is a small to medium effect size that the variable Belief explains the variance in the total attitudes towards Sustainability (Pallant, 2007, p. 208). Our results show that there is weak evidence that the alternative hypothesis is true; however there is some evidence and therefore the mean total attitude towards sustainability does not differ between group responses to belief in a higher power. The European Commission (2005, p.10) published a report on a survey that investigated beliefs in a God, which revealed 58% of females and 45% of males in Sweden declared a belief in a God. Therefore, our sample of respondents with a similar proportion of females and males and belief pattern (see Gender and figure 6 and Belief with figure 10 in the Empirical Data chapter) may be a good representation of the proportion of people in Sweden who have a belief or not in a higher power and therefore make this variable valid for generalisation to other populations. This result indicates that Bostaden AB may not need to consider the differences between beliefs in a higher power to gain positive attitudes from their customers/residents at Ålidhem towards their project Sustainable Ålidhem. 7.9 Hypothesis H This hypothesis has been tested by calculating the mean value of Total Attitudes towards sustainability by using the results from all the questions in part three of our questionnaire. We have also calculated the distribution of Gender by using question one in part one of our questionnaire. The Total Attitudes variable is a continuous variable and the Gender variable is a dichotomous continuous variable, therefore we used the Pearson Correlation Coefficient to test hypothesis H. Hypothesis H is; Hypothesis H0 = the mean total attitude towards sustainability differs between
genders.
Hypothesis H1 = the mean total attitude towards sustainability does not differ between genders.
The respondents Gender have two groups (Group 1: Male; Group 2: Female). The results of our Pearson Correlation Coefficient test revealed that the relationship between attitudes towards Sustainability is positive with a strength of 0.275, which means there is a small strength level between these two variables (Pallant, 2007, p. 132). The coefficient of determination is 0.0756, which means that Gender helps to explain 7.56% of the variance in the respondents’ attitudes towards Sustainability. The significance level for this test is 0.01 and the significance result between the two variables is 0.002, which means that there is a significant statistical difference between Gender and Attitudes towards Sustainability (Pallant, 2007, p. 246). This reveals that there is very strong evidence that the alternative hypothesis is true, which is that the mean total attitude towards sustainability does not differ between genders. This means that although many studies show different attitude responses between genders on other topics (Bryman & Bell, 2007, p.361; p.183); it does not seem to be apparent in our

44
study of Sustainability and Bostaden AB’s project Sustainable Ålidhem. Therefore, Bostaden AB may not need to consider gender differences when trying to gain positive attitudes of their customers/residents at Ålidhem towards their project. Our data shows that 58.9% of our respondents are female and 41.1 % of our respondents are male (see figure 6). According to the Statistics Sweden webpage, by the end of 2010 50.2% of the population were female and 49.8% were male (Statistics Sweden, 2011). Therefore our data collection is very close to the proportion of females and males in Sweden, which helps to strengthen the generalisability of our data. 7.10 Hypothesis I This hypothesis has been tested by calculating the mean value of Total Attitudes towards sustainability by using the results from all the questions in part three of our questionnaire. We have also calculated the mean value of Ages by using question two in part one of our questionnaire. The Total Attitudes variable is a continuous variable and the Age variable is a categorical variable, therefore we used the one-way between-groups analysis of variance test to test hypothesis I. Hypothesis I is; Hypothesis I0 = the mean total attitude towards sustainability differs between
age. Hypothesis I1 = the mean total attitude towards sustainability does not differ
between age. The respondents Age distribution has been split into three groups (Group 1: 19-23; Group 2: 24-28; Group 3: 29-34). There was a 0.625 significance level in our results, which is larger than 0.1 and therefore indicates that there is not a statistically significant difference between Age groups and the mean value of attitudes towards sustainability. This is also revealed in the mean values between groups, which is 3.22, 3.16 and 3.23 so the average value is 3 which means the respondents have a neutral attitude towards Sustainability. The Eta squared test reveal a value of 0.007, which means that there is a small effect size that the variable Age explains the variance in the total attitudes towards Sustainability (Pallant, 2007, p. 208). However, our results indicate that there is no evidence that the alternative hypothesis is true; therefore the mean total attitude towards sustainability differs between age groups. This contradiction in results could be explained by the distribution of number of cases, since we have 58 cases in group 1 = 19-23 year old, 50 cases in group 2 = 24-28 year old, and only 20 cases in group 3 = 29-34 year old. However, there is no statistical significant difference between groups 1 and 2, which make up the majority of our cases and there is a very small difference in the mean value between these two groups (3.22 and 3.16). We conclude that there must be an error in the calculations due to the sample distribution having too few cases in group 3, and therefore the mean total attitude towards sustainability does not differ between the age groups that have responded in our data collection. Since 19-34 year olds can be seen as one generation Bostaden AB may want to investigate further to see if there is a change in results with the residents at Ålidhem who are older than 34. However, Bostaden AB’s customers/residents at Ålidhem are predominantly young and it is this generation that should be considered as Bostaden’s major target group. Therefore, Bostaden AB may not need to consider age differences between the three groups of 19-34 year olds when trying to gain positive attitudes of their customers/residents at Ålidhem towards their project.

45
Chapter 8: Conclusion/Discussion The purpose of our study is to find out what attitudes, positive or negative, our respondents have towards Sustainability and how knowledge, education, income, belief, gender and age affect these attitudes. Our initial investigation into the descriptive statistics of our data revealed that our respondents have a mean value of 3.20 for total attitudes towards Sustainability, which indicates a neutral attitude towards Sustainability as a whole. At a confidence level of 95%, which tells us how much confidence we have that we are right, we see that our results are very confident with a standard error of just 0.03. Our data also revealed that our respondents have a mean value of 4.78 for total knowledge about Sustainability, which means that the respondents’ average knowledge level towards Sustainability is high to very high. However, when we tested the relationship between total attitudes towards sustainability and total knowledge levels of Sustainability in our hypothesis C, the correlation coefficient revealed a positive but small strength of 0.29 between these two variables (Pallant, 2007, p. 132). Although this does suggest that as knowledge levels towards Sustainability increase; attitudes become more positive towards Sustainability, the significance level of 0.001 tells us that there is very strong evidence that the hypothesis may be wrong. Therefore, we found that the mean value of total attitudes towards Sustainability is not positive when the mean value of total knowledge levels towards Sustainability is high. We also saw similar results when testing attitudes and knowledge about the subject of Sustainability while excluding the project at Ålidhem, in hypothesis A; which revealed the mean value of attitudes towards sustainability is not positive when the mean value of knowledge levels towards sustainability is high. We concluded that other factors than knowledge contributes to our respondents’ attitudes towards Sustainability. This supports the theory that evidences and other factors contribute to a Satisficing Set of our respondents (Dyner & Franco, 2004, p.375), which stems from the theory of Bounded Rationality. This reveals that Bostaden AB need to do more than organise knowledge and participation information and events, which they have stated as part of their five focus points (Bostaden, 2011), to gain positive attitudes from their customers/residents towards the project Sustainable Ålidhem. We suggest that further investigation into consumption behaviour is needed to find out how to gain positive attitudes towards subjects such as decreasing waste, decreasing energy consumption, developing social environments and increasing the use of cleaner transportation. Further investigation into the effect of education levels of our respondents on their attitudes towards Sustainability revealed that there is no evidence that our alternative hypothesis D is true; therefore the mean total attitude towards sustainability is positive, when the mean educational level is high. This result supports the idea that education is an important tool for developing positive attitudes and increasing knowledge levels, as we discussed in out theoretical framework chapter (Lacy et al, 2009, 489). We conclude from this information that although the relationship between high knowledge levels and having a positive attitude may be small, education as a whole definitely supports the development of positive attitudes towards Sustainability. This is a positive sign for Bostaden AB’s project at Ålidhem, due to the predominant amount of Umeå University student residents who live in Ålidhem. The relatively high level of education that Bostaden AB’s customers/residents have should help to facilitate a more efficient and

46
effective development of the Sustainable Ålidhem project, because relatively high levels of education should contribute to the customers abilities to understand the project and consequentially gain positive attitudes towards the project. While testing hypothesis E, to check for the embedding effect in our respondents’ answers to knowledge levels of Sustainability we found that there is very strong evidence to suggest that the alternative hypothesis is true; the mean knowledge level of the interlinking subjects is not high when the mean knowledge level of the dimensions of sustainability is high. Therefore, we concluded that there is evidence to suggest that the embedding effect does occur in our respondents’ answers to knowledge about Sustainability (McComb, 2002, p. 273). Although this indicates that Bounded Rationality has affected our respondents’ ability to answer the questionnaire, our respondents have revealed a high to very high level of knowledge towards Sustainability. This suggests that respondents may have got an answer right by chance, by guessing from the multiple choice questions that we gave. The prominence effect (McComb, 2002, p. 238) could also have occurred, for example, the respondents could associate answers with previous questions and answers, which indicates what the subject is about and reveals what they think they should answer rather than what they know. To investigate the notion of Preferential Reversal (McComb, 2002, p. 238), we conducted a Contingent Valuation Method to test hypothesis B, which asked about our respondents’ willingness to pay (WTP) more for sustainable products and services and then their willingness to accept (WTA) unsustainable products and services. The results showed that there is strong evidence that the alternative hypothesis is true, which is that the mean value of attitudes towards WTP more for sustainable products and services is not positive when the mean value of WTA unsustainability is positive. Therefore, we concluded that there is strong evidence to suggest that the preferential reversal effect does exist in our respondents’ answers and that the respondents have proven the theory of Bounded Rationality does affect the respondents’ ability to understand the subject of Sustainability. Furthermore, this evidence shows that while positive desires towards WTA unsustainability contribute to the Satisficing Set of our respondents, negative desires towards WTP for sustainable products and services also contribute to our respondents’ Satisficing set (Dyner & Franco, 2004, p.375). Therefore, Bostaden AB should consider the cost for their customers/residents of living in housing that uses new technology to produce alternative energy sources, because although the customers/residents of Ålidhem may support the development of sustainable constructed housing and community facilities for social activities they may not be willing to pay more for such housing or other community facilities. If the price of the newly built housing is too high for students, Bostaden AB’s student customers may need to live elsewhere. In turn, dissatisfied customers may choose to live in housing owned by other companies that do not promote sustainable housing construction or other community facilities. This can have a negative effect on other similar projects, for example Hållbart Byggande I Kalla Klimat, if the customers have developed a negative attitude towards sustainable projects like Sustainable Ålidhem. It can also lead to a rise in negative attitudes towards such projects and could result in the failure of future sustainable development projects, including the development of Sustainable Ålidhem.

47
While investigating hypothesis F, we found that we did not have enough cases in each income tax bracket group to be able to make a statistical analysis between groups. However, the mean value of 84.5% of cases that is in the first group with an income of up to SEK 100, 000, revealed to have a neutral attitude towards Sustainability. This result does not support the theory of Stern (1997, pp.203-204), that suggested that there is a preference for sustainability when income levels are satisfied, but our respondents show a mean attitude of having no preference towards Sustainability. Bostaden AB should therefore consider the effect that higher costs of a project like Sustainable Ålidhem would have on their lower income customers/residents, especially if attitudes towards Sustainability and the project Sustainable Ålidhem are not positive. Customers that do not have positive attitudes towards Sustainability or the Sustainable Ålidhem project could hinder the efficiency and effectiveness of the project, for example not complying with the waste management system and not caring for the new community facilities. This result supports our discussion in the theoretical framework chapter (Sheth et al. 2011, p. 25; Kjellberg, 2008, p.151) that education and increasing knowledge levels about the negative effects of unsustainability is needed to increase awareness and understanding of the importance of sustainability and to increase the effectiveness of sustainable practices at a micro and macro-level. The tests for hypothesis G revealed that there is weak evidence that the alternative hypothesis is true; however there is some evidence, so we concluded that the mean total attitude towards sustainability does not differ between group responses to belief in a higher power. This result does not support the discussion in the theoretical framework chapter, that people who have a belief in a higher power are more likely to have a moral or ethical attitude towards development (European Commission, 2005, p.11). Instead the mean value of our respondents revealed that there was quite an even distribution between those who have a belief in a higher power and those who do not, and also have a neutral attitude towards Sustainability. Therefore, our respondents attain a similar level of satisfaction while holding different beliefs, which impacts on their Satisficing Set (Dyner & Franco, 2004, p.375). The test for hypothesis H revealed that there is very strong evidence that the alternative hypothesis is true, which is that the mean total attitude towards sustainability does not differ between genders. Although gender differences do play a role on previous research about attitudes to other subjects (Bryman & Bell, 2007, p.361; p.183) it does not play a role on our respondents’ attitudes towards Sustainability. Also, are test for hypothesis I revealed a contradiction in results between the significance level test and the mean value analysis due to an uneven distribution of cases for each group, which lead us to believe that the mean total attitude towards sustainability does not differ between age groups. To summarise, we have found in our study that education levels and knowledge about Sustainability plays an important role in developing positive attitudes towards Sustainability, and that even in highly educated individuals there is evidence of Bounded Rationality. We have also discovered that belief in a higher power; gender and age do not play a role towards having a positive attitude towards Sustainability. Although we are unable to generalise the relationship between income levels, we can see that further understanding about how income levels affects attitudes and how to improve attitudes could benefit possible future developments of this study.

48
Implications for Bostaden AB Our data has revealed that the average customer/resident at Ålidhem do not have positive attitudes towards Sustainability, when their knowledge level about Sustainability is high. Although Bostaden AB have the positive aspect of relatively highly educated customers that live at Ålidhem, we also found that the residents are not willing to pay more for sustainable products and services which can have a negative effect on Bostaden AB’s project of newly constructed sustainable housing and other community facilities. Therefore, in order for Bostaden AB to develop and manage an efficient and effective Sustainable project we recommend that the company investigates their customers’ consumption behaviour patterns to develop a further understanding of their customers’ Satisficing Set and develop a better understanding of how the customers’ income levels influence consumption choices. Bostaden AB should also continue to deliver knowledge about the many different subjects that are involved in the Sustainable Ålidhem project to increase the customers’ awareness of these issues and in turn develop positive attitudes in their customers towards the project. However, if it is the company’s interest to gain customers in the higher income level groups who can afford the newly sustainable constructed housing; it seems that the goals of Sustainability are not the company’s main ambition. Also, if Bostaden AB are not fully committed to the development of a sustainable community and have instead used the project Sustainable Ålidhem like a management fad that acts like a reaction to the financial problem that they have incurred, due to the need for reconstructing the unsustainable housing, it will not contribute to the cause of Sustainable development. Instead, the assumed increase in rent would increase Bostaden AB’s income from the area of Ålidhem and satisfy the profit maximising stakeholder, but not creating value for all stakeholders. This could have a negative impact on the bigger project of Hållbart Byggande I Kalla Klimat and other sustainable development projects in Sweden, because customer attitudes towards Sustainable projects could remain not positive and distrust in such projects could develop. The grant from the government department will not cover all the cost of developing all of Bostaden AB’s unsustainable housing; therefore it will manage the immediate problem but not deliver any long-term and sustainable solution. Therefore, a long-term plan for reconstructing all these houses owned by Bostaden AB in Umeå is needed. Recommendations for further research Our study could benefit from further development by collecting data from a sample that has a wider distribution of income levels and age groups. A further study at Ålidhem could be made, or even in the area called Tomtebo where sustainable construction houses have already been built and residents have begun to experience what it is like to live in a sustainable community. This survey could also be taken to other areas of Umeå or other towns in Sweden where similar sustainable construction is taking place and have a different sample of educational levels, income levels and age groups. A deeper analysis of income levels and consumption behaviour could also develop this research topic further. Projects such as Bostaden AB’s Sustainable Ålidhem need full participation by residents to make an effective and efficient move into sustainable lifestyles. A study that can identify the factors that impact waste production, over-consumption and the use of energy sources could aid in the development of micro-level projects like Sustainable Ålidhem and Hållbart Byggande I Kalla Klimat.

49
Chapter 9: Research Criteria Bryman & Bell (2007, p.40) suggest that the most important criteria to consider for business research evaluation is reliability, replication and validity. They say that reliability evaluates if the results of a study can be repeated, replication evaluates if the study can be replicable (capable of being copied or reproduced) and validity evaluates the integrity of the conclusions found (Bryman & Bell, 2007, pp. 40-41). Furthermore, there are specific ways to address an evaluation when making a social survey like our quantitative questionnaire method, which include reliability and measurement validity, and internal, external and ecological validity (Bryman & Bell, 2007, p. 58). In this chapter we will evaluate our research study by using these terms. Reliability The results of our research study that are discussed in the Empirical Data chapter and the Analysis chapter, have proven to be representative of Sweden’s population statistics for gender (Statistics Sweden, 2011) and the European Commission’s report (2005, p.10) that included beliefs of the Swedish population. This indicated that the results for these two variables could be repeated. The area in which we gathered our data included a predominant amount of university students, which affects the ability for the results about educational levels to be able to be repeated if the survey was conducted in an area where respondents may not have a university education. However, this difference in educational levels could be an interesting investigation for further research study, to discover if there is a difference in results for knowledge levels and attitudes between those who have a university degree and those who do not. We believe that the reliability and validity of how well our questions actually measured the concepts that were intended (Bryman & Bell, 2007, p. 58) was very good, because we had no problem while conducting the survey or analysing the results by using the software program SPSS. We also believe the theories could be tested by the hypotheses that they support. Replication We believe our results could be copied or reproduced and therefore our results are replicable, because our method for selecting respondents, designing measures of the concepts, administration of the questionnaire and analysis of the data is easily reproduced (Bryman & Bell, 2007, p. 58). As we mentioned above, there may be differences in other populations due to educational levels, but we believe that this would only strengthen the investigation to deliver a deeper understanding of the proven hypotheses in our analysis of the results. Validity Bryman & Bell (2007, p. 41) say that internal validity is whether or not the conclusions made about a causal relationship, for example high knowledge results in positive attitudes, are valid in reality. It is difficult to truly evaluate if this is true in our conclusions, but our conclusions have been supported by theory which leads us to believe that the internal validity is good. External validity concerns whether the results can be generalised in other contexts (Bryman & Bell, 2007, p. 42). We believe that our sample has a good representation of a population, for example, gender and belief distribution and the method in which respondents were selected, which indicates that our results can be generalised to other contexts. The only limit our sample has is that the average respondent represented people of the ages between 19 and 34 and with an income level of up to SEK 100, 000; therefore results could differ in other populations.

50
References Aftonbladet, 2008, ’Svårsläkt Storbrand i Umeå’, Available via: http://www.aftonbladet.se/nyheter/article11601177.ab Retrieved: 14/04/2011 BBC, 2002, ‘Enron Scandal at a glance’, Available via; http://news.bbc.co.uk/2/hi/business/1780075.stm Retrieved 01/04/2011 Bostaden, 2011, ‘Miljöfokus’, Available via: http://www.bostaden.umea.se/om-foretaget/miljoprojekt-2016 Retrieved: 27/04/2011 Bostaden, 2011, ‘kunskap och engagemang’, Available via: http://www.bostaden.umea.se/om-foretaget/miljofokus/kunskap-och-engagemang Retrieved: 27/04/2011 Bostaden AB, 2010, Årsredovisning 2010, [Electronic] Available Via, http://www.bostaden.umea.se/Sve/PDF/Ekonomi/Arsredovisning_2010.pdf Retrieved 03/06/2011 Bryman, A. & Bell, E. 2007, Business research methods, Second edition, England: Oxford university press.
Capital Consulting, 2011, ‘Sweden-tax guide for contractors and expatriates’, Available via: http://www.capitaltaxconsulting.com/international-tax/sweden/swedish-income-tax/ Retrieved: 14/04/2011 Dictionary, 2011, ‘Dictionary: Attitudes’, Available via: http://dictionary.reference.com/browse/attitudes Retrieved: 14/04/2011 Dyner, I. & Franco, C.J., 2004, Consumers' Bounded Rationality: The Case of Competitive Energy Markets, Systems Research and Behavioural Science, Vol. 21, issue 4, pp. 373-389. DOI: 10.1002/sres.644 Ebert, Udo, 2008, Approximating WTP And WTA For Environmental Goods From Marginal Willingness To Pay Functions, Ecological Economics, Vol. 66, Issue 2/3, pp. 270-274. doi:10.1016/j.ecolecon.2008.02.015
European Commission, 2005, Social Values, Science & Technology [Electronic] Available Via : http://ec.europa.eu/public_opinion/archives/ebs/ebs_225_report_en.pdf Retrieved: 10/05/2011 European Commission, 2011, ‘Climate Action’, Available via: http://ec.europa.eu/clima/policies/finance/international_en.htm Retrieved: 01/04/2011 Foy, G. 1990, Economic Sustainability and the Preservation of Environmental Assets, Environmental Management, Vol. 14, No. 6, pp. 771-778. DOI: 10.1007/BF02394171 Friends of the Earth, 2011, ‘The prism of Sustainability’, Available via: http://www.foeeurope.org/sustainability/sustain/t-content-prism.htm 01/04/2011

51
Georgantzis, N. Navarro-Martinez, D. 2010, Understanding the WTA–WTP Gap: Attitudes, Feelings, Uncertainty and Personality, Journal of Economic Psychology, Vol. 31, Issue: Number 6, pp. 895-907. doi:10.1016/j.joep.2010.07.004
Glaas, E. Jonsson, A. Hjerpe, M. & Andersson-Sköld, Y. 2010, Managing climate change vulnerabilities: formal institutions and knowledge use as determinants of adaptive capacity at the local level in Sweden, Local Environment, Vol. 15: 6, pp. 525– 539. DOI: 10.1080/13549839.2010.487525 Goodland, R. 1995, The Concept of Environmental Sustainability, Annual Review Of Ecology and Systematic, Vol. 26, pp. 1-24. DOI: 10.1146/annurev.es.26.110195.000245 Google, 2011, ‘Google Scholar’, Available via: http://scholar.google.com/intl/en/scholar/about.html Retrieved: 30/04/2011 Grafton, R.Q. Jotzob, F. Wasson, M. 2004, Financing Sustainable Development: Country Undertakings and Rights for Environmental Sustainability CURES, Ecological Economics, vol. 51, pp. 65–78. DOI:10.1016/j.ecolecon.2004.04.003 Hållbarahus, 2011, ’Nätverket för Hållbart Byggande och Forvaltande’, Available via: http://www.hallbarahus.se/ 14/04/2011 Hållbarastäder, 2011, ‘delegationen för hållbarastäder’, Available via: http://www.hallbarastader.gov.se/Bazment/hallbarastader/sv/delegationen.aspx Retrieved: 14/04/2011 Keiner, M. 2005. History, Definition(S) and Models of 'Sustainable Development'. Zürich: ETH. Available Via: http://e-collection.library.ethz.ch/eserv/eth:27943/eth-27943-01.pdf Retrieved: 01/04/2011 Kjellberg, H. 2008, Market practices and over-consumption, Consumption Markets & Culture, Vol. 11: 2, pp. 151–167. DOI: 10.1080/10253860802033688 Lacy, P. Arnott, J. & Lowitt, E (2009) "The challenge of integrating sustainability into talent and organization strategies: investing in the knowledge, skills and attitudes to achieve high performance", Corporate Governance, Vol. 9: 4, pp.484 – 494. DOI 10.1108/14720700910985025 Langhelle, O, 1999, Sustainable development: Exploring the ethics of Our Common Future, International Political Science Review, Vol. 20: 2, p. 129-149. DOI: 10.1177/0192512199202002 Mayumi, K. 2001, The Origins of Ecological Economics: The Bio economics of Georgescu-Roegen, [e-book], London: Routledge, Available via: http://books.google.co.uk/books?id=6T400wMVGdoC&printsec=frontcover#v=onepage&q&f=false Retrieved: 08/04/2011

52
McComb, G, 2002, A Contingent Valuation Study of Winnipeg Municipal Water Using Bounded Rationality, International Journal of Environment and Sustainable Development, Vol. 1, No. 3, pp.234-248 (No DOI given!) Mercer, 2011, Climate Change Scenarios- Implications for Strategic Asset Allocation: Public Report [Electronic], Available Via: http://www.mercer.com/climatechange Retrieved: 01/04/2011 Orth,W. Madan, A. Ternovits, C. Tichansky, D. 2011, Effect Of Preoperative Knowledge On Weight Loss After Laparoscopic Gastric Bypass, Obesity Surgery, Vol. 1, pp. 1-4. DOI: 10.1007/s11695-011-0422-1 Oxford Dictionary, 2011, ‘Knowledge’, Available via: http://www.oxforddictionaries.com/definition/knowledge Retrieved: 14/04/2011 Pallant, J. 2007, SPSS Survival manual, third edition, Great Britain: McGraw Hill Pope, J. Annandale, D. Morrison-Saunders, A. 2004, Conceptualising Sustainability Assessment, Environmental Impact Assessment Review, Vol. 24, pp. 595–616 doi:10.1016/j.eiar.2004.03.001 Seyfang, G. 2007, Growing Sustainable Consumption Communities: The Case of Local Organic Food Networks, International Journal of Sociology and Social Policy, Vol. 27, No. 3/4, pp. 120-134. DOI: 10.1108/01443330710741066 Sheate, W.R. 2010, Tools, techniques and approaches for sustainability: Collective writings in environmental assessment policy and management [e-book], Singapore: World Scientific Publishing Co. Plc. Ltd. Available via: http://books.google.co.uk/books?hl=en&lr=&id=m3nCSDxWXUUC&oi=fnd&pg=PA101&dq=Sarre,+R.+%26+Treuren,+G.+2001&ots=T_Hf3JSA6l&sig=DAElLq0xyVeRcjOBNqlNUeUwm88#v=onepage&q=Sarre%2C%20R.%20%26%20Treuren%2C%20G.%202001&f=false Retrieved: 01/04/2011 Sheth, J.N. Sethia, N.K. & Srinivas, S. 2011, Mindful Consumption: A Customer-Centric Approach to Sustainability, Journal of the Academy of Marketing Science, Vol. 39, Issue: Number 1, pp. 21-39. DOI 10.1007/s11747-010-0216-3 Spangenberg, J. H. 2002, Institutional Sustainability Indicators: An Analysis of The Institutions in Agenda 21 and a Draft Set of Indicators for Monitoring Their Effectivity, Sustainable Development, vol. 10, pp. 103–115. DOI: 10.1002/sd.184 Spizzichino L; Pedone G; Gattari P; Luzi AM; Gallo P; Valli R; Rezza G, 2007, The Female Condom: Knowledge, Attitude And Willingness To Use. The First Italian Study, Annali Dell'istituto Superiore Di Sanità , Vol. 43 (4), pp. 419-24. (No DOI available)
Statistics Sweden, 2011, ‘Population Statistics’, Available Via: http://www.scb.se/Pages/TableAndChart____264373.aspx Retrieved: 09/05/2011

53
Stern, D.I. 1997, Limits to Substitution and Irreversibility in Production and Consumption: A Neoclassical Interpretation of Ecological Economics, Ecological Economics, Vol. 21, pp. 197-215. doi:10.1016/S0921-8009(96)00103-6
The Wuppertal Institute, 2011, Available via: http://www.wupperinst.org/en/home/index.html Retrieved: 01/04/2011 Umeå Kommun, 2011, Available via http://www.umea.se/naringsliv/samverkanochutveckling.4.69ffeaab11c04448f8e8000201582.html Retrieved: 01/04/2011 United Nations: Commission on Sustainable Development, 2001, Indicators of Sustainable Development, Available via: http://www.un.org/esa/sustdev/csd/csd9_indi_bp3.pdf Retrieved: 01/04/2011 United Nations Environment Program (UNEP), 2011, Towards a Green Economy: Pathways to Sustainable Development and Poverty Eradication [Electronic] Available via: http://www.unep.org/greeneconomy/GreenEconomyReport/tabid/29846/Default.aspx Retrieved: 01/04/2011 Van den Bergh J. C.J.M. 2010, Externality or sustainability economics? Ecological Economics, Vol.69, pp.2047–2052 doi:10.1016/j.ecolecon.2010.02.009 Ventouras, E. Triantis, D. Tsiakas, P. & Stergiopoulos, C. 2008, Comparison of examination methods based on multiple-choice questions and constructed-response questions using personal computers, Computers & Education; February 2010, Vol. 54: 2 pp. 455-461. doi:10.1016/j.compedu.2009.08.028
Wakabayashi, T. Guskin, K. 2010, The Effect Of An ‘‘Unsure’’ Option On Early Childhood Professionals’ Pre- And Post-Training Knowledge assessments, Journal Of Evaluation, Vol. 31 Issue: Number 4, pp.486-498. DOI 10.1177/1098214010371818
Zipfel B; Badenhorst G, 2002, Attitudes and Knowledge about AIDS among Podiatry Students in South Africa Australasian, Journal Of Podiatric Medicine, Vol. 36(2): pp. 39-44 (No DOI available)

Appendix: Sustainability Questionnaire
We are two students that are in the third year of studies at Umeå University and we are writing a thesis. Our Thesis is about Sustainability and our task is to ask the residents of Ålidhem about Bostaden’s project “Sustainable Ålidhem” and about the subject of Sustainability. We would appreciate it if you could answer some short questions. The questionnaire is only to be used for our thesis and Bostaden AB does not take any part in our study. Your answers will be anonymous and will only be used for our thesis. We thank you for your participation in advanced, Alice Watling and Emma Zhou Part 1 1. What gender are you? 2. How old are you?
Male
Female 3. What is your income/year? (Mark one alternative)
Up to SEK 100,000
SEK 101,000 - 200,000
SEK 201,000 - 372,100
SEK 372,101 - 532,700
Over SEK 532,700
4. What is your highest level of Education obtained? (Mark one alternative) Secondary School (16 years old)
High School (18-19 years old)
University Undergraduate
University Postgraduate
University Masters
University PhD
Other 5. Do you believe in a higher power (for example, a God)?
Yes
No
I do not know

Part 2
1. Bostaden AB claim to be working towards five areas of environmental focus. What are these five areas?
Construction
Energy consumption
Financial support
Community policing
Transportation
Waste management
Knowledge and Participation
Providing the facilities to produce vegetables for the community
I do not know
2. What type of construction development have Bostaden AB planned? (Mark all that apply)
New eco-efficient housing
New educational facilities
Activity centres
Renovations of existing houses
Outdoor children's park
Sporting facilities
Efficient recycling centres
All of the above
None of the above
I do not know.
3. What type of energy production will Bostaden’s construction work include? (Mark all that apply)
Solar power
Wind power
Water power
Heat power (Geothermal energy)
Plant power (Biomass energy)
All of the above
None of the above
I do not know
4. Bostaden AB is planning to create a winter garden. What does this involve?
(Mark all that apply) The winter garden will be a garden for everybody to use in the winter.
The winter garden will have a plot where the community can grow their own herbs and other usable produce.
The winter garden will be an activity centre for the community.
The winter garden will be a social meeting place.
The winter garden will be a place to relax.
All of the above.
None of the above.
I do not know.

5. Bostaden's concept Green Citizen means... (Mark all that apply) to be a person who does not produce too much waste.
to be a person who does not eat meat.
to be a person who cares for all living things.
to be a person who is artistic.
to be a person who does not over consume.
to be person who takes responsibility for positive actions in the community.
All of the above.
None of the above.
I do not know. 6. True or false? True False I do not
know
It is important to recycle properly due to harmful materials in household waste.
If residents do not recycle efficiently Bostaden AB charges a fine.
Bostaden AB pays per kilogram for the collection of waste. Bostaden AB has provided different colour bags to help residents separate their waste.
The waste you generate can be transformed into new energy.
You do not need to separate your waste; Bostaden AB does it for you. 7. Sustainability is about ... (mark all that apply)
the economy
the society
the environment
the institutions
All of the above
None of the above
I do not know
8. Sustainability involves ... (mark all that apply)
the protection of all resources
the protection of all life forms
the social responsibility of individuals, businesses, communities and authorities.
issues surrounding climate change
the consumption and production patterns of businesses and customers
the stability of financial institutions
personal financial management
the right to an education and health care
the regulation and cooperation of international institutions
all of the above
none of the above
I do not know

Part 3
1. How important is ... (Mark one alternative on the scale)
Unimportant
1.
2.
3.
4.
Very Important
5. No opinion
the well being of the economy?
the well being of society?
the well being of the environment?
individual well being?
community well being?
institutional well being?
2. To what extent do you agree? (Mark one alternative on the scale)
Do not agree
1.
2.
3.
4.
Fully agree
5.
No opinion
Reducing my energy bills is more important than reducing my energy consumption.
Auto-mobile transportation is necessary for my everyday life.
It is important that I work for a socially responsible employer.
I think it is important to have control of my financial debts.
I am a Green Citizen.
I try to find substitutes for non-Green products and services.
I am interested in buying bonds in Socially Responsible Investments.
3. To what extent do you agree? (Mark one alternative on the scale)
Do not
agree 1.
2.
3.
4.
Fully agree
5.
No opinion
It is important that the government help fund local businesses to encourage sustainable development and management.
It is good that local companies, organisations and authorities are working together to create a sustainable community.
Many institutional policies state big promises, but do little to combat the reality of issues like climate change.
Changing people’s lifestyles to be more sustainable should be enforced & regulated by authorities.
It is important to vote in elections. I would like to learn more about sustainability and what I can do for my community.

4. To what extent are you willing to pay? (Mark one alternative on the scale)
Not at all 1.
2.
3.
4.
Definitely
5.
No opinion
I am willing to pay more for local produce to support my community.
I am willing to pay more for Green products.
I am willing to pay more to live in an eco-efficient house. I am willing to pay more taxes to contribute to sustainable development in my community.
5. To what extent are you willing to accept? (Mark one alternative on the scale)
Not at all 1.
2.
3.
4.
Definitely
5.
No opinion
I am willing to accept the depletion of global resources in order to gain what I want now. I am willing to accept the possible extinction of a species in order to continue my lifestyle as it is now.
I am willing to accept the effects that over consumption have on the earth in order to not change my lifestyle.
I am willing to accept personal gains from investments in non-socially responsible shares, bonds or funds.
I am willing to accept employment from a non-socially responsible employer.

Umeå School of Business Umeå University SE-901 87 Umeå, Sweden www.usbe.umu.se