attitudes and outcomes - tuc unionlearn | the home … · web viewunion learning: attitudes and...
TRANSCRIPT

Union Learning: attitudes and outcomes - report in a longitudinal study of union representatives and other learners
Anne JamiesonBirkbeck, University of London
Version 25 May 2012
1

Table of Contents
1. Introduction...........................................................................................................61.2 TUC Education and Unionlearn: brief overview........................................................6
1.3 Current study: context and aims...................................................................................71.3.1 Research Context.....................................................................................................................71.3.2 Study aims and methods..........................................................................................................8
1.4 Methodology.............................................................................................................9
1.5 Report structure....................................................................................................10
2. education/Training Courses and events.............................................................112.1 Training or courses attended: TUC Ed and Other, non-TUC Ed courses..............11
2.2 TUC education courses attended in the last three years...........................................12
2.3 Other (non-TUC Ed) courses and training events.....................................................152.3.3 Courses done in the last three years.................................................................................152.3.4 Courses undertaken most recently...................................................................................18
2.4 Key points: Chapter 2...........................................................................................22
3. REASONS AND SUPPORT FOR training.......................................................243.1 Reasons for starting the course............................................................................24
3.2 Help and support in undertaking the course......................................................28
4.3 Key points: Chapter 4...........................................................................................34
4. the learning experience...........................................................................................364.1 The learning process.............................................................................................36
4.2 Obstacles, barriers and problems........................................................................39
4.3 Key points Chapter 4....................................................................................................43
5. impact of learning...................................................................................................445.1 Impact on union work.................................................................................................44
5.2 Overall benefits: work and life...................................................................................47
5.3 Development of skills and attributes..........................................................................49
5.4 Key points: Chapter 5...........................................................................................54
6. unionlearn respondents: SOCIO-ECONOMIC CHARACTERISTCS.................566.1 Gender, age and ethnicity...........................................................................................56
6.2 Marital and household status.....................................................................................57
6.3 Qualification profile..............................................................................................58
6.4 Employment profile...............................................................................................606.4.1 Occupational class.................................................................................................................606.4.2 Supervisory responsibilities, work place size and sector......................................................616.4.3 Working hours and contracts...........................................................................................63
6.5 Union membership and responsibilities....................................................................63
Key points: Chapter 6........................................................................................................66
7. looking ahead..........................................................................................................68
2

7.1. Plans for further training/study.................................................................................68
7.2 Job satisfaction, Quality of life and voluntary activity......................................70
7.3 Quality of life................................................................................................................71
7.4 Involvement in voluntary activities............................................................................73
7.5 Key points: Chapter 7.................................................................................................75
references.....................................................................................................................76
Appendix a. METHODOLOGY..................................................................................781 Questionnaire design.................................................................................................78
2. Sample, fieldwork and response rates.....................................................................79
Appendix b. OCCUPATIONAL CLASSIFICATION................................................82
Appendix C. future learning: Courses........................................................................84
Figure 1 TUC Ed courses: percentage of respondents by type of event (All TUC courses in last three years and most recent course).............13Figure 2 Other (Non-TUC Ed) courses undertaken in the last 3 years. Percentage of respondents ...............................................................................16Figure 3 Other (Non-TUC Ed) courses done most recently. Percentage of those who had done an ‘other’ course most recently........................18Figure 4 Other, non-TUC courses. Length of course by most recent course undertaken................................................................................................20Figure 5 Average number of hours spent studying.....................................21Figure 6: ‘Very strong reason’ for starting the course by type of course (percentages). TUC Ed courses compared with Other courses.......................................................................................................................................25Figure 7 Ways in which union reps helped respondents (percentages)......................................................................................................................................30Figure 8 Who paid for most recent course (percentages)........................31Figure 9: Employer support for work/study. Time off. (percentages). 32Figure 10 Views and experiences of online learning: percentages.......38Figure 11 Problems and barriers experienced during course: percentages.............................................................................................................40Figure 12 The union related outcomes of TUC Ed courses: percentages (all most recent courses)....................................................................................44Figure 13 Reported outcomes: TUC Ed courses compared with other courses. Percentage agreeing strongly with statements.......................48Figure 14 Outcomes from learning by ethnicity: percentages agreeing strongly......................................................................................................................49Figure 15 Skills/knowledge development: percentages all respondents......................................................................................................................................50Figure 16 Skills/knowledge development by type of most recent course: percentages all respondents.............................................................51Figure 17 Age band by gender: percentage of all respondents..............56Figure 18 Marital status by age band: percentage of all respondents.57Figure 19 Four category occupational classification: percentage of all respondents.............................................................................................................61
3

Figure 20 Union roles performed by respondents: percentage of all union members......................................................................................................64Figure 21 Future training plans in the next two years: percentages....68Figure 22 ‘I enjoy learning more’ and association with Plans for further learning in the next two years..........................................................................69Figure 23 Views of current work situation: percentage of all respondents.............................................................................................................71Figure 24 Quality of life: percentages all respondents...............................72
Table 1 Courses attended in last 3 years and most recently..................11Table 2 How TUC Ed courses were undertaken: percentages (of each attending course) (Last three years).............................................................15Table 3 Involvement in other, non-TUC-Ed courses by level of qualification (courses done in last three years).........................................16Table 4 Involvement in other, non-TUC courses by occupational class (Courses done in last three years)..................................................................18Table 5 Courses reported to lead to qualifications. Most recent course......................................................................................................................................19Table 6 Reasons for undertaking most recent course/training event (percentage of respondents).............................................................................24Table 7 ‘Very strong reason’ for starting most recent course (percentages). TUC Education courses.........................................................27Table 8 Gaining a recognised qualification reason to start most recent course/training event (percentage of respondents). Association with age..............................................................................................................................28Table 9 Importance of different people in encouraging respondents to take their most recent course (percentages).............................................28Table 10 Importance of different people in encouraging respondents to take their most recent course (percentages). Respondents taking TUC Ed compared with those taking Other courses. Percentages rating as ‘Very important’..................................................................................29Table 11 Who paid for course by type of course attended most recently. Percentages..........................................................................................31Table 12 Views of the learning experience: percentages all respondents.............................................................................................................36Table 13 Views of the learning experience. Percentage who agreed strongly. TUC Ed and Other compared..........................................................37Table 14 Views of online learning by course type.......................................39Table 15 Percentage who had barriers. Agreed to a large extent or to some extent.............................................................................................................40Table 16 Barriers: Lack of time due to family commitments: percentages all respondents.............................................................................41Table 17 The benefits of TUC Ed courses for each type of course (most recent): percentages............................................................................................46Table 18 Views of the outcome of the learning experience (most recent course): percentages all respondents.............................................47Table 19 Development of skills and knowledge. Percentage agreeing strongly. TUC Ed courses....................................................................................52Table 20 Childcare responsibilities by age group: percentages.............57
4

Table 21 Highest qualification by age group: percentages......................58Table 22 Highest qualification level by region: percentages...................59Table 23 Comparison with other studies: Qualification levels.................60Table 24 Improvements to quality of life: percentages.............................72
5

1. INTRODUCTION
This report sets out the findings of a survey of union learners, in particular union representatives who have received training through the TUC Education service. The survey, completed in early 2012, was funded by City & Guilds, and was carried out by Birkbeck, University of London, in close collaboration with the TUC and Longview, an independent body set up to promote longitudinal research1. Its aim was to explore the backgrounds of the learners, and their motivations, experiences and benefits of the learning experiences. It is a baseline survey, which forms the first part of what is aimed to be a prospective, longitudinal study, exploring longer term outcomes of the union learning.
1.2 TUC Education and Unionlearn: brief overview
The TUC has a long history of providing training for union representatives. Most of this training is provided through TUC Education and delivered in Further Education colleges.
The election of the Labour government in 1997 marked the beginning of a growing role for unions in the provision and encouragement of learning, in partnership with employers and employees. 1998 saw the establishment of the Union Learning Fund (ULF), funded by the then Department for Employment and Skills. The ULF aims to widen participation of any employee in learning, reaching more of those with low levels of qualifications. Its core activities are to encourage and promote learning (through the Union Learning Reps) by working with employees and employers. The aim of TUC Education, continues to be to strengthen the work of union reps through the provision of relevant training for this group irrespective of their existing levels of qualification, although it has always been seen as a way of encouraging those with few or no qualifications into learning.
Within the Unionlearn framework, there are several major activities:1) The longstanding provision by TUC Education, which offers accredited training to union representatives, including health & safety reps and union learning reps and union professionals, through a network of colleges of further education and TUC centres across the UK. There are over 200 different courses of varying duration (3 days to one year)2. Topics include health & safety; equal opportunities; pensions; financial advice.
The core courses, each lasting 10 days (attended on a day release basis), include the following:
Two courses: Union Reps (Stage 1 and Stage 2)1 The Advisory Group consisted of Prof. Claire Callender and Prof Sue Jackson (Birkbeck); Bert Clough (TUC); Prof Tom Schuller (Longview); and Joe Shamash (City & Guilds).2 Unionlearn web site, http://www.unionlearn.org.uk/about/index.cfm?mins=107
6

Two courses: Health & Safety (Stage 1 and Stage 2)
Two courses: Union Learning Reps (Stage 1 and Stage 2)
In 2010, 7,808 individuals attended one of these 10-day courses, and 49,355 attended short courses (typically lasting 3/5 days)3.
2) Regional activities. These are projects that have obtained funding from the European Social Fund (ESF), and which have taken place in certain regions. A wide range of courses are offered, including Skills for Life (sometimes taken at UNet centres). Some, but not all, courses can lead to qualifications, which range across all levels, including level 4 (HE).
3) U-Net is the branded network of Unionlearn-managed learning centres, which deliver learndirect as a core element of their provision. The network receives Skills Funding Agency funding and is inspected by Ofsted. All U-Net centres have fully qualified professional staff who are able to provide one-to-one support to learners as well as e-tutor support. Courses offered are mainly Skills for Life, including ICT, literacy and numeracy. They are accredited, leading to Levels 1 and 2 qualifications, for example Certificate in Adult Literacy. As all courses are online, the duration of courses is flexible, and learners can progress at their own pace.
1.3 Current study: context and aims1.3.1 Research Context
Since the Union Learning Fund was established, research has begun to examine the education and training developed within this framework. Among the most recent of these are Stuart et al 20104 and Ross et al (2011) 5. The latter is a small scale qualitative study of 42 learners on different types of courses. The former is an evaluation of ULF projects and unionlearn as a whole. However, it does not include TUC Education work. Some research has been done on TUC Education learners, most notably
3 TUC Education Service Statistics 2010
4 Stuart, M., Cook, H., Cutter, J. and Winterton, J (2010), Evaluation of the Union Learning Fund and Union learn, Centre for Employment Relations Innovation and Change, Leeds University Business School. http://www.unionlearn.org.uk/files/publications/documents/191.pdf, last accessed 17 pril 2012. A summary has been published by Unionlearn: Unionlearn (2011)Union learning Adding Value: An evaluation of Unionlearn and the Union Learning Fund
5 Ross, C., Kumarrapan, L., Moore, S. and Wood, H. (2011), Learning Journeys. Trade union learners in their own words, Unionlearn with TUC/London Metropolitan University. Unionlearn Research Paper 14.
7

Capizzi (1999) and Gowan (2009)6. Capizzi’s study, undertaken over 10 years ago, included less than 400 cases and focused primarily on the issues around the introduction of accreditation of TUC courses. Gowan’s work consisted of a survey of 1,000 union reps focusing on the impact of their learning on their ability to undertake their union tasks. However, it gives us little information about the learners’ backgrounds and motivations to learn, or of the possible wider outcomes of their learning. It is against this background that this study was commissioned.
1.3.2 Study aims and methods
Our current study differs from those mentioned above, and therefore adds to existing knowledge in several ways: first, it represents the only major survey of all types of union learners. Second, with its particular (though not exclusive) emphasis on TUC Education learners, it provides up-to-date insight into learners’ socio-economic characteristics, their learning activities and attitudes to learning – issues not covered in other studies.
The distinctive feature of the study is its intended prospective longitudinal approach. Thus it seeks to reach a large number of learners and to follow them up two years later.
The first part of the study, reported here, is a baseline survey, which aimed to address the following questions:
Who studies in Unionlearn activities and what are their socio-economic characteristics such as their educational background, occupation, family status, age, gender and ethnicity?
What other (non-Union) learning, if any, do individuals engage in?
What and how do these individuals study? e.g subjects; levels of qualification; mode of delivery
What are the short-term outcomes of the learning experience(s) in relation to: attitudes to and further engagement in learning; employment; and wider social outcomes like family relations and social engagement?
How do these outcomes/benefits vary by the socio-economic characteristics of the learners and the type of learning they undertake?
What are the preferred modes of learning by different kinds of learners (in terms of educational background; learning aims)?
6 Capizzi, E. (1999), Learning that Works. Accrediting the TUC programme, NIACE/TUC. Gowan, D (2009), Making a Difference. The impact of trade union education on Britain’s workplaces. A union reps survey report. Unionlearn
8

What are the perceived barriers to learning? Finally, the aim was to measure attitudes to learning; job
satisfaction and quality of life, with the specific aim of comparing these with attitudes at follow-up
The planned follow-up study aims to throw light on whether the possible benefits reported in this survey are short-lived, whether they are lasting, or whether there are ways in which they have accumulated further, including whether participants have progressed to further learning.
1.4 Methodology
The fieldwork was undertaken between November 2011 and January 2012. Databases of individuals who had attended training/courses under the auspices of the TUC were provided. These came from three different TUC sources: Regional projects; UNet and TUC Ed (see section 1.1 above). Online questionnaires were used where email addresses were available, and postal questionnaires where they were not.
Leaving aside questionnaires sent to addresses that turned out to be invalid, populations and response rate are as follows:
Emailed questionnaires: 10,317; Responses: 2,128 (= 21% response rate)Postal questionnaires: 10,574; Responses: 645 (=6%)
Total responses: 2,777 (=13%)
Valid quest. sent out Responses Response rate
Proportion of respondents
Email Postal total Email Postal
total
Regions
440 2,274 2,710 43 57 100 4% 4%
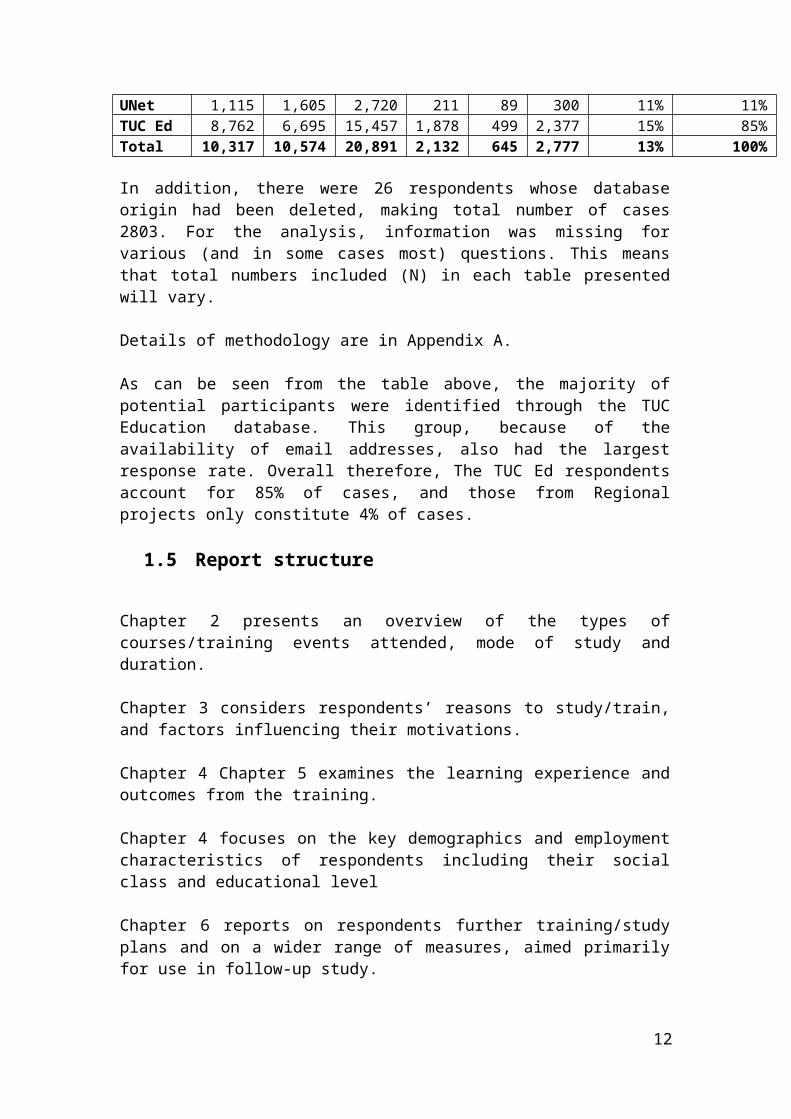
UNet 1,115 1,605 2,720 211 89 300 11% 11%TUC Ed 8,762 6,695 15,457 1,878 499 2,377 15% 85%Total 10,31
710,57
420,89
12,13
2645 2,77
713% 100%
In addition, there were 26 respondents whose database origin had been deleted, making total number of cases 2803. For the analysis, information was missing for various (and in some cases most) questions. This means that total numbers included (N) in each table presented will vary.
9

Details of methodology are in Appendix A.
As can be seen from the table above, the majority of potential participants were identified through the TUC Education database. This group, because of the availability of email addresses, also had the largest response rate. Overall therefore, The TUC Ed respondents account for 85% of cases, and those from Regional projects only constitute 4% of cases.
1.5 Report structure
Chapter 2 presents an overview of the types of courses/training events attended, mode of study and duration. Chapter 3 considers respondents’ reasons to study/train, and factors influencing their motivations.
Chapter 4 Chapter 5 examines the learning experience and outcomes from the training.
Chapter 4 focuses on the key demographics and employment characteristics of respondents including their social class and educational level
Chapter 6 reports on respondents further training/study plans and on a wider range of measures, aimed primarily for use in follow-up study.
Where differences are reported on in the text between one sub group and others, the finding is statistically significant (p<0.05 i.e. we can be 95% certain that the finding is an accurate estimate of the population). Where possible the analysis identifies independent variables most strongly correlated with the main substantive variables.
10

2. EDUCATION/TRAINING COURSES AND EVENTS
Looking at overall education/training course attendance, respondents were asked to indicate first, whether or not in the last three years they had undertaken any TUC Ed courses, and then provide some detail about each of those courses, and secondly, whether or not they had undertaken any other (‘non-TUC’) courses/training events through means other than TUC Ed, and again provide some detail about these courses. The TUC Ed courses are those aimed specifically at union representatives7 . ‘Other, non-TUC Ed’ courses include both courses/events organised through Unionlearn8, and any other course of study individuals may have done, whether at a college, or at work. This chapter focuses on both these types of courses/training events, including the characteristics of who attended them.
In order to be able to link the experience and views about benefits and barriers to a clearly defined learning event, respondents who had attended more than one event were asked to indicate which one they had attended most recently. This most recent course forms the basis for the bulk of the analysis in parts of this chapter and subsequent ones. 2.1 Training or courses attended: TUC Ed and Other, non-TUC Ed courses
Looking at overall course attendance (Table 1), it is evident a majority (67%) had attended at least one TUC Ed course, either solely or in combination with other course(s).
Table 1 Courses attended in last 3 years and most recentlyCourse % attended in last 3
years % attended most recently
TUC courses (either solely or in combination with other courses)
67 62
‘Other’ courses (either solely or in combination with other courses)
40 38
Source: Unionlearn Survey, Birkbeck University of London, 2012 (n=2151)
7 Including for example Union learning Reps; Health & Safety Reps; Equal Opportunities Reps8 Including for example learning; ICT training organised by TUC Regions
11
Forty per cent had attended at least one ‘other’ course, either solely or in combination with TUC course.
More respondents with degree level or higher qualifications said they had done both TUC Ed and other types of course than those with lower level or no qualifications (28% compared to 21% of those with below degree level or no qualifications). Fewer had done TUC Ed courses only (39% compared to 44%). This reflects the national trend on who is most likely to engage in training and study: individuals with higher initial education are more likely to engage in learning throughout their lives (NIACE 2009).Other than this qualification difference between respondents, there was little to differentiate between respondents in terms of their demographic profile or occupational classifications. As would be expected more respondents who had indicated that they were union members (68% compared to 32% of non-union members) and union learning reps (79% compared to 65% of others) said that they had undertaken TUC Ed Courses. Union organised courses are most often open to non-union members (Stuart et al 2009).
Courses done in the last three years and course done most recently
As respondents could have listed several courses done in the last three years, they were asked to indicate which one they had done most recently. As mentioned, this most recent course formed the basis for further questions about course experience, barriers and outcomes. As Table 1 shows, the distribution between TUC Ed and other courses is similar to that for the last three years. While in this chapter we focuses on courses done in the last three years, the ‘most recent’ course forms the basis for analyses in later chapters, unless otherwise specified.
2.2 TUC education courses attended in the last three yearsAs we have shown, overall two thirds of respondents had participated in TUC Ed courses/training events in the last three years. Figure 7 shows the types of TUC courses these respondents had done. The three most frequently mentioned events9 were Union Reps Stage 1 training10; short courses (e.g. employment law, equality training etc.), and health and safety Stage 1.
9 Respondents were able to cite more than one event at this stage. 10 Union rep courses usually last 10 days. Short courses usually last 3-5 days. See p. 7 for a course description.
12

Figure 1 TUC Ed courses: percentage of respondents by type of event (All TUC courses in last three years and most recent course)
Diploma in Occupational Health and Safety short courses (e.g COSHH, Risk Assessment)
Stepping up - advanced course for union reps
Diploma course (ie. employment law, contemporary trade unionism or equalities)
Union Learning Reps - Stage 2
Union Learning Reps - Stage 1
Next steps for safety reps - Stage 2
Other TUC Education courses
Health and safety - Stage 1
Short courses (e.g. Employment Law, Equality Reps.)
Union Reps Stage 1
0 5 10 15 20 25 30 35
8
12
12
12
18
19
24
30
33
34
5
4
8
7
5
9
18
11
21
11
Most recently attended Attended in last 3 years
Source: Unionlearn Survey, Birkbeck University of London, 2012 (n=1696)
One in four mentioned ‘other’ courses, these included:
Other union related learning e.g. negotiation skills, history etc (26% of all others)
9% mentioned IT/Computer skills 7% mentioned workplace issues such as stress bullying
discrimination etc. 7% mentioned courses concerning pension issues 5% detailed equality issues, equal pay and discrimination 4% mentioned discipline and grievance issues 4% cited other health and safety issues 3% occupational health
13

The remaining cases included a variety of other courses (2% or fewer indicating each) including management and business, mental health awareness, disability awareness, legal courses, environmental issues, women’s issues, teaching, assessor training, literacy and numeracy and public speaking.
There was some variation by occupational classification with more respondents in lower supervisory and semi routine and routine occupations (19%) indicating they have done ‘stepping up’ courses than is the case among respondents in professional and managerial (10%) and intermediate occupations (12%). Similarly, 45% of lower supervisory respondents and 43% of those employed in semi routine and routine occupations had done health and safety rep stage 1 training compared to 26% of those in intermediate and professional/managerial occupations. Finally, more respondents in semi routine and routine occupations had done union learning rep stage 1 training (29% compared to 16% of those in other occupational groups.
In addition, there was some variation by level of highest qualification with slightly fewer respondents who had attained degree level qualifications or higher having undertaken:
1) ‘stepping up – advanced courses for union reps’ (9% compared to 15% of those with no degree level qualifications),
2) ‘health and safety stage 1’ where 24% of those with a degree had participated compared to 34% of those with no degree level qualifications,
3) ‘next steps for safety reps’ 24% of those with no degree level qualifications compared to 11% of those with degrees or higher.
On most of the other courses there were small differences by educational level but for short courses and other TUC Ed courses, more degree qualified respondents were involved (35% had been on short courses compared to 30% of respondents with no degree qualification) and 28% of degree qualified respondents had done ‘other courses’ compared to 22% of the non-degree qualified group.
Table 2 shows how respondents attended/undertook the courses. In the main, most completed their courses at colleges with only small numbers, in most cases, doing them online. Diploma courses were most likely to have been undertaken online. Overall, our respondents seem to have taken more courses online than is known to be the case for the total population of TUC Ed courses, of whom about two per cent are known to be taking them online.
14

Table 2 How TUC Ed courses were undertaken: percentages (of each attending course) (Last three years)
College Online Base N=Union Reps Stage 1 89 3 561Stepping up - advanced course for union reps 91 3 206Diploma course (i.e. employment law, contemporary trade unionism or equalities)
80 18 196
Health and safety - Stage 1 91 5 504Next steps for safety reps - Stage 2 89 4 308Diploma in Occupational Health and Safety short courses (e.g. COSHH, Risk Assessment)
82 14 132
Union Learning Reps - Stage 1 89 2 294Union Learning Reps - Stage 2 89 1 196Short courses (e.g. Employment Law, Equality Reps.)
84 7 555
Other TUC Education courses 81 12 386Source: Unionlearn Survey, Birkbeck University of London, 2012
2.3 Other (non-TUC Ed) courses and training events
As already mentioned, respondents were not only asked about their experiences of attending TUC Ed courses, but also about other, non-TUC Ed training activities, whether or not within the Unionlearn framework. As was shown above, two in five respondents had attended other training event/course in the last three years, whether or not it was in addition to a TUC Ed course. A similar proportion indicated that this was their most recent course.
2.3.3Courses done in the last three years
Figure 2 shows that job-related training (29%) and ‘other’ types of other courses (25%) accounted for the largest number of training events attended. Skills for Life courses and ITC accounted for less than 10% of courses respectively. Only a small handful of respondents (11) had attended ESOL courses.
The category of ‘other’ courses, which respondents could specify, ranged widely, but the large majority of them (70%) could be categorised as work, job or career related, and only 5% as purely personal interest related11.
11 The main course groupings were:Teaching (15%); IT/computer skills (8%); Unspecified work related courses (6%); Modern languages (6%); Health and safety courses (6%); The arts (music, theatre, painting, pottery, acting etc.) (5%) First aid/medical (5%); Business studies, finance, accountancy etc. (5%); Management/project management (4%); Humanities courses (3%); Social work (3%); Legal courses (3%)
15

Figure 2 Other (Non-TUC Ed) courses undertaken in the last 3 years. Percentage of respondents 12
Job-related training
Other ICT Skills for life ESOL0
100
200
300
400
500
600
29 25 7 7 1
499
429
118 117
11
%N
Source: Unionlearn Survey, Birkbeck University of London, 2012
Involvement in non-TUC Ed courses was clearly associated with both level of qualification and occupational class (Tables 3 and 4). The higher the level, the more likely was the involvement in other courses.
Table 3 Involvement in other, non-TUC-Ed courses by level of qualification (courses done in last three years)
% within level of qualification N
Postgraduate 44 185Undergraduate 46 316A-level 38 173GCSE 37 172Fewer 33 94No qualifications 32 69
Source: Unionlearn Survey, Birkbeck University of London, 2012
12 Base does not add to 100% as respondents could indicate more than course and therefore more than one place of course delivery.
16

Forty-four per cent of those with a Postgraduate qualification had done other courses, compared to 32% of those with no qualifications. Forty-three per cent of those in Managerial & professional occupations had taken other courses, compared to 33% of those in semi-routine or routine occupations. There was also an association with gender, albeit weaker: 37% of male and 43% of female respondents did other courses. Table 4 Involvement in other, non-TUC courses by occupational class (Courses done in last three years)
% NManagerial and professional 43 601Intermediate 38 167Lower supervisory and technical 35 117Semi-routine and routine 33 81
Source: Unionlearn Survey, Birkbeck University of London, 2012 (N=794)
2.3.4Courses undertaken most recently
More detailed questions about courses were based on the course most recently attended, and this section (2.3.4) refers to respondents’ most recent course.
Figure 3 Other (Non-TUC Ed) courses done most recently. Percentage of those who had done an ‘other’ course most recently
Job related training
Other ICT Skills for life ESOL0
50
100
150
200
250
300
350
400
46 417 5 1
379
335
6045
6
%N
Source: Unionlearn Survey, Birkbeck University of London, 2012
17

As figure 3 shows, the distribution of responses for most recent course is similar to that of courses undertaken in the last three years (Figure 2). The majority of those whose most recent course had been a non-TUC Ed course, had done either a job-related training course (46%) or an ‘other’ course (41%). Seven per cent had taken an ICT course, 5% a Skills for Life course, and only 1% had taken an ESOL course (6 individuals). Further analysis has therefore excluded the ESOL category (only 8 cases), and any detailed analysis of outcomes for those having done Skills for Life (45 cases) and ICT (60 cases) have to be interpreted with caution.
Qualifications obtained.
Overall, half of all non-TUC Ed courses and training events were reported to be leading to a qualification (Table 5). Skills for Life courses were most likely to lead to qualifications (79%), followed by ‘other’ courses. Skills for Life courses are all accredited, leading to Levels 1 or 2 qualifications. The fact that only 79% responded yes to this question could possibly be explained in terms of respondents’ perceptions of what is meant by a qualification. Within the ‘other’ group of courses, 71% of courses identified as job related led to qualifications, compared to 42% of courses that were personal interest and 55% of courses that were both personal interest and work related. Just over six in ten respondents who indicated their most recent course was ICT said it led to a qualification. These qualifications ranged from degree and higher degree level/PGCE and BEd courses, assessor training, NVQ 1-4, adult literacy/numeracy qualification, COSHH, BTec and City&Guilds and various professional qualifications.
Table 5 Courses reported to lead to qualifications. Most recent course
% nSkills for life 79 33Other 66 213ICT 63 36Job related training 31 115ESOL 20 1All 50 398
Source: Unionlearn Survey, Birkbeck University of London, 2012
18

Length of course and time spent on training
Figure 4 Other, non-TUC courses. Length of course by most recent course undertaken Percentages
Skills for life
ICT
Job rel training
Other
All
0 10 20 30 40 50 60 70 80 90 100
2
14
41
7
23
45
24
7
15
14
40
40
13
19
19
12
9
9
43
23
14
31
16
22
One day only or lessSeveral days within one weekSeveral weeksSeveral monthsA year or more
Source: Unionlearn Survey, Birkbeck University of London, 2012 (N=794)
Figure 4 shows the duration of the different courses. The group of ‘other’ courses were most likely to have lasted a year or more (43%). This group included a number that were degree or professional level and other academic qualifications such as A/AS levels etc. Job-related training courses were most likely to last several days within one week or just one day or less.
19

Figure 5 Average number of hours spent studying
Skills for life (literacy or numeracy)
ICT
Job related training
Other, e.g. study for personal interest or for a qualification
All respondents
4.0
6.1
10.2
7.4
8.5
4.6
5.0
5.2
8.5
6.7
Average number of hours per week spent on inde-pendent study (including online)Average number of hours per week spent in class/face to face contact
Source: Unionlearn Survey, Birkbeck University of London, 2012 (N=696)
On average respondents reported spending a total of just over 13 hours per week, i.e. 7.9 hours on face-to-face learning, and 5.5 hours on independent (including online) study (Figure 5). Those in job related training spent relatively more time ‘per week’ and on face-to-face learning, and many of these would be likely to have been short events lasting one or two days. Those doing ‘other’ types of courses, which included degree courses, spent relatively less time overall, and relatively more time on independent study.
20

2.4 Key points: Chapter 2
This chapter considered attendance in the last three years at both TUC Education courses, and any other (‘non-TUC’) courses/training events, and if more than one had been attended, which one had been attended most recently.
At least 25% of respondents had attended more than one course/training event in the last three years – at least one TUC Ed and one other course. Over two thirds (67%) had attended at least one TUC Ed course, either solely (42%) or in combination with other course(s) (25%). Forty per cent had attended at least one ‘other’ course, either solely (15%) or in combination with TUC Ed course (25%). Sixty-two per cent indicated that their most recent event was a TUC Ed course.
Of the TUC Ed courses, the three most frequently mentioned events were Union Reps Stage 1 training; short courses (e.g. employment law, equality training etc.), and health and safety Stage 1. One in four mentioned other TUC Ed courses, which covered topics such as management and branch leadership, legal courses, environmental issues, women’s issues, teaching, assessor training, literacy and numeracy and public speaking.
In terms of mode of studying/training, the majority of courses had been undertaken at college. Diploma courses and non-specific courses were those most likely to have been taken on line.
Two in five respondents had attended other, non-TUC Ed training event/course in the last three years, whether or not it was in addition to a TUC Ed course. A similar proportion indicated that this was their most recent course.
The vast majority of ‘other, non-TUC Ed’ courses were work related, but included a small number of events, such as arts and humanities courses, attended purely for personal interest. Attendance of ‘other, non-TUC Ed’ courses was relatively higher for those with existing higher qualifications and in higher occupational positions. Finally, women were slightly more likely to have attended these non-TUC Ed courses.
Having mapped the overall participation in the last three years, which for a considerable proportion of respondents entailed several and possibly very different events, more detailed questions focused on the course/training event attended most recently. This was a TUC Ed event for 62%,
21

and an ‘other’/non-TUC Ed event for 38% of respondents. Most of our analysis of the learning experience and its outcomes relates to respondents’ most recent course.
Overall, half of all non-TUC Ed courses and training events undertaken most recently were reported to lead to a qualification. These ranged from degree and higher degree level/PGCE and BEd courses, assessor training, NVQ Levels 1-4, adult literacy/numeracy qualification, Control of Substances Hazardous to Health Regulations (COSHH), BTec, City&Guilds, and various professional qualifications. Skills for life courses were most likely to lead to qualifications, and work-related courses were more likely to do so, compared to courses undertaken for personal interest.
Duration of courses/training events spanned anything from less than a day to a year or more. Work-related courses were more likely to have lasted one day only or less (41%), whereas studies for personal interest or qualification were more likely to have lasted a year (43%).
Overall, all respondents spent an average of 13 hours a week studying, of which on average about 60% entailed face-to-face contact and 40% independent study (including online). Predictably, job related training tended to be more face-to-face, whereas personal interest/study for qualification entailed a higher proportion of independent study.
22

3. REASONS AND SUPPORT FOR TRAINING
This chapter focuses on the reasons given for undertaking training and factors influencing their motivation. In an attempt to gauge this, respondents were asked to think back to the time they decided to embark on their most recent course. As will be recalled, 62% indicated that the most recent course they had undertaken was a TUC Ed course, while 38% indicating that it was an ‘other’ course/training event.
3.1 Reasons for starting the course Respondents were asked ‘thinking about this most recent course/training event, what were the main reasons for starting the course?’ Table 6 summarises their answers.
Table 6 Reasons for undertaking most recent course/training event (percentage of respondents)
Very strong reason
Quite a strong reason
Not a very strong reason
Not a reason at all /not applicable
To develop as a person 57 26 4 13Interested in the subject 55 26 5 14To do job better 52 21 7 19To get a recognised qualification
34 15 12 39
To help get onto a future course of learning
20 14 16 50
It was a union requirement 13 12 13 62To change type of work 12 13 14 61It was an employer requirement
8 6 9 78
To get a job with a different employer
6 6 11 77
To get a promotion 5 5 12 79To get a rise in earnings 4 4 12 79
Source: Unionlearn Survey, Birkbeck University of London, 2012 (n=2162)
The strongest reasons given were to personal development (57%); subject interest (55%) and to do the job better (52%). The least important reasons were associated with pay rise (4%), promotion (5%), and changing job (6%). This pattern of response, whereby personal development and subject interest rank most highly, is typical of research on learners13.13 Research on students in Higher Education shows this pattern (e.g. Feinstein et al 2007), as do studies of the general population. For example, an interview survey of a stratified random selection of 1,000 adults, commissioned by Birkbeck (Jamieson 2007) found that subject interest ranked most highly (91% giving that as a reason), followed by personal interest (85% giving this as a reason.
23

Figure 6 shows how the respondents’ reasons varied somewhat by the type of course (TUC Ed or ‘other’). Thus ‘doing the job better’ and ‘union requirement’ were stronger reasons for TUC Ed course attendees, whereas ‘employer requirement’ and ‘subject interest’ were relatively stronger reasons for those doing other courses. This pattern is hardly surprising, given the job/union orientation of the TUC Ed courses, and assuming respondents have interpreted ‘job’ as including their union job14.
Figure 6: ‘Very strong reason’ for starting the course by type of course (percentages). TUC Ed courses compared with Other courses.
Interested in the subject
To develop as a person
To do job better
To get a recognised qualification
To help get onto a future course of learning
It was a union requirement
To change type of work
It was an employer requirement
To get a job with a different employer
To get a promotion
To get a rise in earnings
0% 10% 20% 30% 40% 50% 60% 70%61%
58%
57%
31%
22%
18%
9%
3%
3%
3%
3%
48%
55%
47%
38%
18%
7%
16%
16%
9%
7%
7%
Other course TUC education course
Source: Unionlearn Survey, Birkbeck University of London, 2012 N=1648
Focusing exclusively on respondents who had taken TUC Ed courses, their motivations for studying varied depending on the course they had (Table 7). For example, for those studying Diploma courses, an interest in the subject was a relatively strong reason. These could represent an opportunity for further study by those who had done a short course in these subjects. Even for courses obligatory for union reps, e.g. health&safety or Union learning, subject interest was rated relatively highly as a reason for the
[Benefits of study Working Paper: Birkbeck graduates compared with general population, Birkbeck orking Paper], Callender, C., Hopkin, R., and Wilkinson D. (2010) Futuretrack: part-time students career decision-making and career development of part-time higher education students HECSU, Manchester. 132 pp
14 Whether respondents referred to their union ‘job’ or their paid employment is unclear.
24

training. However, those doing basic union rep training were significantly less motivated by subject interest than most others.
25

Table 7 ‘Very strong reason’ for starting most recent course (percentages). TUC Education courses.
(a) (b) (c) (d) (e) (f) (g) (h) (i) (j)All respondents
To do job better 50 62 68 48 70 69 39* 56 53 58 57It was a union requirement 25 27 6* 33 15 12 27 24 11 13 18To change type of work 5 3* 13 5 5 19 10 7 9 12 9To get a rise in earnings 2 0 0 3 0 1 2 4 3 4 2To get a promotion 2 2 0 3 1 3 2 6 3 4 3To get a job with a different employer 2 0 4 2 3 4 3 1 3 6 3It was an employer requirement 7 2 0 3 3 3 2 4 1 3 3Interested in the subject 43* 53 81 48 61 82 56 66 57 70 61To develop as a person 43* 60 76 53 60 72 53 66 52 60 58To get a recognised qualification 20 40 56 27 38 69 29 25 18* 27 31To help get onto a future course of learning 12* 32 28 22 24 30 19 28 15 22 21
Base N=100% 121 60 106 147 119 67 62 68 239 216 1205
Source: Unionlearn Survey, Birkbeck University of London, 2012
The shaded boxes show the courses where most respondents indicated the factor was a ‘very strong reason’ for starting the course.Those marked with a * are where the lowest proportion of respondents indicated the factor as a very strong reason.
26
a) Union reps Stage 1 f) Diploma in Occupational Health and Safety short coursesb) Stepping Up – advanced course for union reps g) Union learning reps – Stage 1c) Diploma course (i.e. employment law etc.) h) Union learning reps – Stage 2d) Health and safety – stage 1 i) Short courses (e.g. employment law, equality reps)e) Next steps for safety reps j) Other TUC Ed courses

Age was a factor influencing reasons for training, especially in relation to the importance of gaining a qualification. As Table 15 shows, gaining a qualification was, not surprisingly, more important for the younger age cohorts. Also, changing the type of work they did was a much stronger reason for the under 40’s than the over 60’s. For example, among the under 40s, 21% indicated changing the type of work was a ‘very strong reason’, and 34% said it was ‘quite a strong reason’, while the equivalent figures for the over 60s were 6%, 15% respectively (Table 8).
Table 8 Gaining a recognised qualification reason to start most recent course/training event (percentage of respondents). Association with age
Under 40 40-49 50-59 60 plusAll respondents
Very strong reason 39 39 32 23 34Quite a strong reason/not a very strong reason
34 29 26 20 28
Not a reason at all or n/a 26 32 42 57 38Base N= 311 673 833 224 2041
3.2 Help and support in undertaking the course
This section looks at the role and influence of different individuals, employers and trade union reps in encouraging respondents to undertake their courses.
Table 9 shows that for all respondents, irrespective of the type of course they took, ‘other’ union reps (43%) were most likely to have encouraged them to take their most recent course.
Table 9 Importance of different people in encouraging respondents to take their most recent course (percentages)
Very important
Quite important
Not important at all
Implied not important or n/a
Other Union Rep 24 19 41 16Employer/line manager 18 18 52 12Union Learning Rep 16 15 51 18Family/friend/colleague 15 20 46 19Other 10 7 41 42
Source: Unionlearn Survey, Birkbeck University of London, 2012 (n=2140)
Union Learning Reps were also important for just under a third of respondents, but no more so than employers and family/friend/colleagues.
27

Employers and line managers were more often mentioned as a ‘very important’ influence by respondents employed in professional and managerial occupations (20%) compared to 14% of those who were employed in other occupations.
Table 10 Importance of different people in encouraging respondents to take their most recent course (percentages). Respondents taking TUC Ed compared with those taking Other courses. Percentages rating as ‘Very important’
Source: Unionlearn Survey, Birkbeck University of London, 2012 (n=1235)
Respondents who had taken TUC Ed courses were most likely to have been influenced by other union reps (33% indicating these as ‘very important’) or union learning reps (19%)(Table 10). In contrast, for respondents who had taken ‘other’ courses, only 10% had been encouraged to take their course by other union reps and 12% by union learning reps. Far more important for these respondents, was their employer or line manager (27%) while this was the case for 12% taking TUC Ed courses.
These figures may at first sight appear disappointing from a Unionlearn perspective. However, the encouragement of employers may well be a result of Unionlearn measures. As the Leeds evaluation report highlights, a key part of the work of Unionlearn is very much to engage employers in supporting learning, among other things through Learning Agreements’. The evaluation highlights that:
‘that ULF activities have contributed to positive union–employer relations. Over four in five (82 percent) felt that company policy on learning had improved with 70 per cent stating that senior management was more supportive of learning’ (Stuart et al 2010, p.3).
Respondents who had been encouraged to train by union reps were asked to indicate the ways in which they were helped. Information and advice (71%) was by far the most important kind of help received, although other kinds of help such as asking management for training was also important for a sizable minority (Figure 7). Of those who said they received ‘other’ assistance, 38%
28
TUC Ed OtherOther Union Rep 33 10Union Learning Rep 19 12Family/friend/colleague 15 15Employer/line manager 12 27Other 9 11

said they received general encouragement/motivation from their union rep, a further 24% said that they were the union rep so helped themselves and one in four gave a variety of other responses. For example, borrowing lap top, went on course with respondent, time off etc. Five per cent said they received some funding or a bursary or similar.
Figure 7 Ways in which union reps helped respondents (percentages)Source: Unionlearn Survey, Birkbeck University of London, 2012 (n=740)
Enabled me to do a taster course
Provided other assistance
Helped to carry out an assessment of my learning needs
Helped make a request to management for training
Gave information and advice about appropriate courses
0 10 20 30 40 50 60 70 80
14
16
25
41
71
Percentage
Who paid for course and time off?
When asked who paid for the training, just under a half reported that the course was free, a quarter reported that the employers paid for the course. (Figure 8). Of those respondents who indicated that their course had been funded by other means 91% said that their union had paid for the course. These respondents could be said to be in the same group as those who said the course was free. Eight per cent said other people/organisations had paid for it and 2% did not know how the course was paid for.
29

Figure 8 Who paid for most recent course (percentages)
Family/friend paid for it (or some of it)
I paid for it (or some of it)
Other
Employer paid for it (or some of it)
No one, the course was free
0 5 10 15 20 25 30 35 40 45 50
0
7
23
26
47
Percentage
Source: Unionlearn Survey, Birkbeck University of London, 2012 (n=670)
There is little or no difference in response in how courses were funded by type of employer or occupation. However, of those respondents who had attended a TUC Ed course most recently, 48% said the course was free compared with 43% of those whose most recent course was a non-TUC Ed one (Table 11).
Table 11 Who paid for course by type of course attended most recently. Percentages
TUC Ed Other, non-TUC Ed
No-one. Free 48 (n=659) 43 (n=343)
Employer 25 (n=323) 31 (n=251)
Family/friend- -
Other
[Of ‘other’: Union
24 (n=307)
96
21 (n=165)
77]
Source: Unionlearn Survey, Birkbeck University of London, 2012 (n=670)
More non-TUC Ed courses were reported to have been funded by employer (31% compared to 24% for TUC Ed courses). Of ‘other’ funders, the majority of those who specified mentioned unions in various ways, e.g. ‘union branch’. More of the TUC Ed course
30

attendees (96%) mentioned unions. Some commented that the course was free to them, but was probably paid for by union. This suggests that many respondents did not pay for their course and were unsure about who actually did pay and therefore based their replies on assumptions. Indeed, no TUC Ed courses incur a fee, as they are supported through Unionlearn, and those who cited employer as having paid for these, probably just made that assumption.
Financial support with the costs of a course, is just one element of the overall ‘costs’ of training, another is getting time off work to train. The majority of respondents (69%) were given paid time off work to train (Figure 9). Just over a quarter however, did the training in their own time and did not get paid or unpaid time off work to study. Again, there was little to differentiate between respondents by type of work or employer. The only discernible variation was between those who attended TUC Ed courses being more likely to have had paid time off from work (82%) when compared to those who had only been on other courses (53%). This difference is to be expected, since union reps have a statutory right to reasonable time off for training.
Figure 9: Employer support for work/study. Time off. (percentages)
TUC Ed Other All0
10
20
30
40
50
60
70
80
9082
53
71
4 3 4
14
44
26
Paid time offUnpaid time offNo time off
Source: Unionlearn Survey, Birkbeck University of London, 2012 (N=1606)
Those on non-TUC Ed courses who did not get any time off at all (44%), would include people who studied online or at college.
31

4.3 Key points: Chapter 4
This chapter considered the reasons given for undertaking training and factors that could have influenced respondents’ motivation, such as financial support and time off for training. Responses are related to the most recent course undertaken, which in 62% of cases was a TUC Ed course, and 38% were ‘Other, non-TUC Ed’ courses.
Overall, the strongest reasons given were to personal development (57%); subject interest (55%) and to do the job better (52%). The least important reasons were associated with pay rise (4%), promotion (5%), and changing job (6%).
‘Doing the job better’ and ‘union requirement’ were stronger reasons for TUC Ed course attendees, whereas ‘employer requirement’ and ‘subject interest’ were relatively stronger reasons for those doing other courses.
There was some variation within the group of TUC Ed courses, with reasons for taking Diploma courses being more strongly associated with subject interest and personal development.
Gaining a qualification was a stronger reason for the younger age groups.
On the question of who might have encouraged them to undertake their most recent course, ‘other union reps’ (43%) were most likely to have encouraged them. Union Learning Reps were also important for just under a third of respondents (31%), but no more so than employers (36%) and family/friend/colleagues (35%).
Respondents who had taken TUC Ed courses were most likely to have been influenced by other union reps (33% indicating these as ‘very important’) or union learning reps (19%). In contrast, for respondents who had taken ‘other’ courses, only 10% had been encouraged to take their course by other union reps and 12% by union learning reps. Far more important for these respondents, was their employer or line manager (27%) while this was the case for 12% taking TUC Ed courses.
32

When asked who paid for the training, just under a half reported that the course was free, a quarter reported that the employers paid for the course. However, as TUC Ed courses are free for the participants, it is likely that many respondents simply assumed that employers had paid.
Over two thirds (71%) reported having been given time off for their course, TUC Ed courses being more likely to have had paid time off from work (82%) when compared to those who had only been on other courses (53%).
33

4. THE LEARNING EXPERIENCE
This section of the report considers respondents’ learning experiences, any barriers or obstacles experienced in undertaking the learning.
4.1 The learning process
Table 12 focuses on all respondents and shows that the vast majority had very positive learning experiences. Almost all respondents were satisfied with their course (93% agreeing strongly or slightly). Furthermore, 89% ‘agreed’ that the course was well organised and 83% reported that it was useful learning with other union members. Just one in four respondents thought the learning was stressful (25%) but 71% disagreed with this statement. The high level of agreement with these statements means that it is difficult to identify any correlations with demographic or employment related variables in the response. However, it is nonetheless the case that younger respondents were more likely to indicate that the learning was stressful (29% of those aged under 40 agreed with this statement compared to 16% of those aged 60 plus and 25% of those aged 40-59.) Other than this there was little or no difference in responses to this question.
Table 12 Views of the learning experience: percentages all respondents
Agree strongly
Agree slightly
Not sure Disagree slightly
Disagree strongly Base N=
It was enjoyable 69 26 3 2 0 2084Learning with other union members was useful 67 16 10 2 5 1938
Overall I was satisfied with the course 65 28 4 2 1 2079
The course was well organised 59 30 4 4 2 2058
The learning was stressful 6 19 6 27 42 1939Source: Unionlearn Survey, Birkbeck University of London, 2012
Furthermore, there were clear differences between those referring to TUC Ed courses and those referring to other courses. Table 13 shows the pattern of responses in terms of agreeing strongly. Those having completed a TUC Ed course were significantly more positive about all aspects of the learning experience, particularly about learning with other union members (81% agreeing strongly that this was useful, compared to only 43% of those who had done a non-TUC Ed course). This is in part due to the nature of the TUC Ed
34

courses, which by definition are organised for union members. However, they were also more positive about the experience having been enjoyable (74% agreeing strongly compared to 62% of those having done other courses), about the course being well organised (65% compared with 51% of those having done other courses), and about the overall experience, for which 71% agreed strongly that it was satisfactory, compared with 57% of those having done other courses.The particular approach taken in most union learning places emphasis on informal, inclusive and participative learning – all of which is seen to appeal to those with few or no previous qualifications15. Our study suggests that it appeals equally to those already well educated.
Table 13 Views of the learning experience. Percentage who agreed strongly. TUC Ed and Other compared
TUC Ed Other% N % N
It was enjoyable 74 1211 62 758Learning w union members useful 81 1198 43 639Learning was stressful 5 1130 7 707Course was well organised 65 1203 51 744Overall satisfied with course 71 1212 57 753
Source: Unionlearn Survey, Birkbeck University of London, 2012
Views of online learning
As indicated above (see Table 2), only a small minority had taken their courses online. All respondents were asked what they thought about this possibility, irrespective of whether they had previous experience of it. Only one in five said that they ‘have tried online learning and it suits me’ (Figure 10). The largest group (39%) said they ‘have tried online learning but prefer face-to-face learning’. One in five said they have not tried it but would be interested in doing so. Indicating a preference for face-to-face learning does not of course mean that the learning experience was not useful, and studies specifically focusing on this mode of learning show highly positive views16.
15 The study by Ross et al (2011) relates stories of the educational experience and how it appeals to ‘non-traditional’ learners.16 Unionlearn with/TUCEducation (2008) TUC Education Online. The Learners’ Perspective,
35

I've done it and it suits me
18%
I've done it, but prefer face-to-face
learning 39%
I have not tried it, but would be
interested in trying19%
I would not want to do courses
online15%
I am not sure9%
Figure 10 Views and experiences of online learning: percentages
Source: Unionlearn Survey, Birkbeck University of London, 2012 (n=2078)
The UNet learners, whose courses are by definition on line, mostly liked this (Table 14)17. However, 39% would prefer face-to-face learning. In terms of other factors affecting views of online learning, occupation stood out. Thus those employed in managerial and professional occupations were most likely to say they have tried online learning but say they prefer face-to-face learning (47% compared to 38% of other occupations) while more respondents in semi routine and routine occupations (27%) say they would not want to do courses on line.
Table 14 Views of online learning by course type
Regions
TU ed SE
Other TU Ed
regions UNet TotalI've done it and it suits me 20 17 12 54 19
17 Indeed, it is slightly puzzling that some, albeit a small number, of the UNet learners reported not having tried on-line learning
36

I've done it, 38 43 45 39 43but prefer face-to-face learningI've not tried it but 22 22 23 5 21would be interested in tryingI would not want to do courses 20 17 20 3 17onlineTotal n 64 1013 622 192 1891Total % 100 100 100 100 100
4.2 Obstacles, barriers and problems
Respondents were asked to consider any obstacles, barriers and problems they had encountered while undertaking their course. The three most significant barriers/problems were lack of time due to work commitments (49%), lack of time due to family commitments (30%) and lack of support from their employer/manager 27%) (Figure 11). Otherwise the remaining issues listed were mentioned by fewer than 20% as being a problem (to a great extent or some extent). Occupational class was associated with problems experienced due to work commitments. Thus 55% of respondents employed in professional and managerial occupations reported having experienced problems (to a large or to some extent) relating to a lack of time due to work commitments, compared with only 28% of those working in semi routine and routine occupations.
Figure 11 Problems and barriers experienced during course: percentages
37

Other barrier/problem
Lack of tutorial support
The difficulty of the course work
Lack of support from family
Lack of support from employer/manager
Financial pressure
Lack of time due to work commitments
Lack of time due to family commitments
0 10 20 30 40 50 60 70 80 90 100
3
2
2
0
9
4
14
7
5
9
16
5
18
10
35
23
92
89
82
95
73
86
51
70
Yes, to a large extent Yes, to some extent No, this was not a problem
Source: Unionlearn Survey, Birkbeck University of London, 2012 (n=2080)
Not surprisingly, an important factor associated with barriers experienced was course duration. There is an almost linear relation between extent to which each barrier is experienced and length of course. Table 15 compares the views of those who had done the shorted course (a day or less) with those who had attended a course lasting a year or more. Table 15 Percentage who had barriers. Agreed to a large extent or to some extent
Course duration one day or less
Course duration one year or more
Lack of time due to family commitments
19 54
Lack of time due to work commitments
45 70
Financial pressure 11 34Lack of employer support 19 34Lack family support 3 10Difficulty of coursework 8 46Lack of tutorial support 9 21Source: Unionlearn Survey, Birkbeck University of London, 2012 (n=2080)
It shows for example, that 70% of those studying for a year or more agreed that lack of time due to work commitments was a barrier, compared to 45% of those training for a day or less.
38

The proportion agreeing that lack of family support was a barrier was more than twice as high for those doing longer study (54%) than for the short course attendees (19%). The largest difference was in relation to the difficulty of the coursework, with which 46% of ‘long-term students’ agreed, compared to only 8% of those who had attended a short course.
Not unexpectedly, among those reporting lack of time due to family commitments were higher proportions of respondents who were married and who had children. Thirty-three per cent of those married/partnered reported this, compared with 22% of single/never married. Among those with children 43% reported lack of time, compared with 23% of those with no children. In addition to this, age was also a factor (Table 16). However, much of the variation is between those aged 60 plus (where 67% said lack of time due to work commitments was not a problem) and those aged under 60 (49% said this was not a problem). It is likely this will be partly because relatively more in this age group worked part time (25% compared with 12% of all respondents).
Table 16 Barriers: Lack of time due to family commitments: percentages all respondents
Under 40 40-49 50-59 60 plus Base N=
Yes, to a large extent 9 8 6 2 7Yes, to some extent 30 27 21 10 23No, this was not a problem 61 65 73 88 70Base N= 313 661 819 212 2005
Source: Unionlearn Survey, Birkbeck University of London, 2012
Finally, respondents working part time were more likely to indicate having problems with family commitments (36% compared to 29% of those working full time). A small proportion (7%) highlighted other problems/barriers. These could broadly be classified as ‘course issues’ accounting for approximately a third of cases and covering such problems as lack of PCs, complexity of course, examinations, not covering what thought it was going to cover, problems with other learners, facilities etc. One in four responses covered expenses (especially the expense of travel), difficulties in getting to and from venues, and one in five responses covered disability and medical issues in undertaking the course. Seven per cent mentioned lack of motivation, interest and confidence and another seven per cent cited other personal attributes such as language issues. One in ten mentioned a variety of other one off issues.
39

40

4.3 Key points Chapter 4
- Learners attending a TUC Education training event were significantly more positive about all aspects of the learning experience than those participating in other forms of training. For the overall learning experience, 71% strongly agreed that it was satisfactory, compared with 57% of those taking other courses.
- Learning with other union members was useful for the vast majority of TUC Education course attendees, but less so for those undertaking other courses (81% agreed strongly, compared to 43%).
- As regards mode of learning, a strong preference was expressed for face-to- face learning, even among those who had tried online learning. UNet learners (those taking learndirect courses at union learning centres) were the most positive about the experience, with 54% agreeing that it suited them.
- The biggest barrier to learning was a lack of time due to work commitments (49%), especially among those in professional & managerial occupations. Other significant barriers included lack of time due to family commitments (30%) and lack of support from their employer/manager (27%).
- As one might expect, the extent to which barriers were experienced depended on length of course taken. Those who had undertaken a course lasting a year or more were significantly more likely to report barriers, especially a lack of time due to work commitments (70%) than those who had taken short courses lasting a day or less (45%).
41

5. IMPACT OF LEARNING The core of our investigation is around the impact of the learning experience, not only in terms of work, but more widely, in terms of family life, social engagement and further learning. It will be recalled that TUC Education courses are primarily aimed at enhancing the performance of union reps. We start by considering the extent to which this may have happened, and the ways in which improvements are linked to specific TUC Ed courses.
5.1 Impact on union work
As Figure 12 shows responses from those who had attended a TUC Ed course regarding union role outcomes. It shows that the large majority (86%) reported becoming more effective in their union role.
Figure 12 The union related outcomes of TUC Ed courses: percentages (all most recent courses)
Help members about health & safety
Help members about grievance/discipline
Help members about equality or disability issues
Help members get into learning
Negotiate with employer
Strengthen the union at the workplace/branch
Increase union membership
More generally to be effective in union role
0 10 20 30 40 50 60 70 80 90 100
50
56
56
32
67
65
44
86
Source: Unionlearn Survey, Birkbeck University of London, 2012 (N=1591).
Two thirds said that their course had helped in negotiating with their employer and in strengthening the union at the workplace/branch. A half or more also reported that the most recent course had improved their ability to help members with issues about health and safety, grievance and discipline and equality and diversity. These are all areas related to specific course topics, and a more detailed analysis of responses, summarised in Table 17, shows considerable variation depending on course attended.
42

Thus for example, for respondents attending courses for learning reps (stage 1 or stage 2) more than three quarters (80% and 76%) respectively felt the courses had improved their ability to ‘help members get into learning’. Similarly, other responses varied depending upon the content of the most recent course attended. For example, respondents who had undertaken health and safety related courses, were more likely to report improved ability in this area (between 95 and 98%).
Overall therefore, the TUC Ed courses could be said to be achieving their immediate goals of enhancing union rep performance. But, as we shall show in the following, the achievements go beyond those related directly to union roles, with work and life impacts reported in a wide range of ways.
43

Table 17 The benefits of TUC Ed courses for each type of course (most recent): percentages
(a) (b) (c) (d) (e) (f) (g) (h) (i) (j)All respondents
Help members about health & safety 39 36 54 95 96 99 27 32 31 30 50
Help members about grievance/discipline 82 89 85 43 45 47 33 41 65 39 56
Help members about equality or disability issues 63 71 77 43 49 64 36 51 62 47 56
Help members get into learning 25 21 32 11 22 35 80 76 24 36 32
Negotiate with employer 78 83 85 69 74 82 52 61 60 52 67Strengthen the union at the workplace/branch 73 80 75 62 76 73 53 65 59 55 65Increase union membership 62 70 49 32 42 51 45 52 37 36 44More generally to be effective in union role 89 94 92 82 94 93 79 86 86 77 86
Base N=100% 174 70 130 182 144 83 86 111 334 277 1591Source: Unionlearn Survey, Birkbeck University of London, 2012
44
a) Union reps Stage 1 f) Diploma in Occupational Health and Safety short coursesb) Stepping Up – advanced course for union reps g) Union learning reps – Stage 1c) Diploma course (i.e. employment law etc.) h) Union learning reps – Stage 2d) Health and safety – stage 1 i) Short courses (e.g. employment law, equality reps)e) Next steps for safety reps j) Other TUC Ed courses

5.2 Overall benefits: work and lifeTable 18 summarises their responses to a series of statements covering different aspects of work, learning and wider life. The most positive outcomes from respondents’ courses were: their ability to do their job (79% agreed); developing more personal learning interests (76% agreed); and their enjoyment of learning (69% agreeing). More than half of all respondents also indicated that their learning experience had made their job more satisfying (56%).
Table 18 Views of the outcome of the learning experience (most recent course): percentages all respondents
Agree strongly
Agree slightly
Neither Disagree
slightlyDisagree strongly
Base N=
It has improved my ability to do my job
45 34 16 2 3 1865
I have developed more personal learning interests
44 32 20 3 2 1951
I enjoy learning more 39 30 26 2 3 1924It has made my job more satisfying 29 27 34 5 5 1781It has helped me to take on more responsibilities in my current job
22 28 31 7 11 1659
My outlook on life has become more positive
23 27 41 4 5 1836
I have become better able to encourage/help family’s education
20 27 39 5 9 1531
I have become actively involved in voluntary activities outside work
15 17 43 9 15 1505
It has improved my prospects of promotion
10 16 41 10 23 1528
Source: Unionlearn Survey, Birkbeck University of London, 2012
Those who had completed a TUC Education course were no less likely to report wider benefits than those who had completed other courses. Figure 13 shows proportions agreeing strongly with the range of statements. On some dimensions, the benefits were reported were higher for the former group: 33% of those who had attended a TUC Ed course agreed strongly that it had made their job more satisfying, compared to 25% of those who had attended other courses. It is possible that some respondents interpreted ‘job’ in terms of their union responsibilities. Nevertheless, it is encouraging that the TUC Ed courses, which are primarily geared towards enhancing union role, also seem to have a positive impact on the
45

individuals’ work, family and personal learning interests more broadly18. Figure 13 Reported outcomes: TUC Ed courses compared with other courses. Percentage agreeing strongly with statements.
It has improved my ability to do my job
I have developed more personal learning interests
I enjoy learning more
It has made my job more satisfying
My outlook on life has become more positive
It has helped me take on more responsibilities
Better able to help my family's education
More actively involved in voluntary organisations
It has improved my prospects of promotion
0 5 10 15 20 25 30 35 40 45 50
47
43
40
33
23
23
20
16
8
42
45
39
25
23
20
19
15
14
OtherTUC Ed
Source: Unionlearn Survey, Birkbeck University of London, 2012 (N see note 19)
N19
Ethnicity
The main difference between respondents related to their ethnicity and to a lesser extent whether or not they were degree qualified. More BME respondents agreed strongly with each item than was the case among white respondents (Figure 14) and, by and large, more 18 If one adds those ‘agreeing slightly’, the figures for those agreeing, in the case of those who had completed TUC Education courses were as follows: 77% agreed that they had developed more personal learning interests’; 70% agreed that they enjoyed learning more; and 48% agreed that they were better able to help their family’s education. 19 Number of cases for each statement varies, as some items were left blank. Numbers below are listed by statement in the same order as Figure
N TUC N Other872 551
914 571
882 577
845 524
841 435
763 497
732 453
721 435
692 476
46

respondents who were not qualified to degree level or above agreed strongly or agreed slightly. Since BME respondents were relatively better qualified, this underlines the significance of ethnicity in the responses. This is encouraging, particularly in view of the emphasis by unions on equal opportunities, and it raises questions about the underlying reasons for this, and whether there are likely to be any longer term effects. The planned follow-up study will explore these issues.
Figure 14 Outcomes from learning by ethnicity: percentages agreeing strongly
41
44
28
10
21
37
21
14
18
64
52
41
18
28
58
39
24
36
0 10 20 30 40 50 60 70
I have developed more personal learninginterests
It has improved my ability to do my job
It has made my job more satisfying
It has improved my prospects of promotion
It has helped me to take on moreresponsibilities in my current job
I enjoy learning more
My outlook on life has become more positive
I have become more actively involved involuntary activities outside work
I have become better able to encourage/helpmy family’s education
White BME
Source: Unionlearn Survey, Birkbeck University of London, 2012 N ranged from 1294-Q1689 White respondents, and from 178-219 for BME respondents, depending on statement.
5.3 Development of skills and attributes Respondents were given a series of statements to consider the degree to which their learning/course might have developed certain skills and attributes. Figure 15 summarises the findings for all respondents.
47

Courses were most often seen as helping respondents gain specialist knowledge for work to a great extent (47%) or to some extent (35%). Spoken communication skills were developed in 70% of cases (27% to a great extent and 43% to some extent) and team working in 68% of cases was thought to have been developed through the course by two thirds (68%) of respondents. Numeracy skills were most likely to be seen as not developed at all through the learning/course.
Figure 15 Skills/knowledge development: percentages all respondents
Specialist knowledge for work
Working effectively in a team
Managing my own work
Computer skills
Numeracy skills
Spoken communication skills
Written communication skills
20 40 60 80 100
47
25
21
17
10
27
21
35
43
42
31
23
43
43
18
32
36
52
67
30
36
To a great extent To some extent Not at all
Source: Unionlearn Survey, Birkbeck University of London, 2012 (n=1964)
It is notable that the skills outcomes reported (Figure 16) were consistently higher for those who had attended TUC Education courses, except for numeracy and IT/computer skills, which were specific skills addressed on other courses. The largest difference was the proportion indicating that working effectively as a team was developed through the course - 75% of respondents on TUC Ed courses indicated this outcome compared to 59% of respondents on other courses. The scores for spoken and written communication skills were also higher for TUC Ed courses than for other courses.
48

Figure 16 Skills/knowledge development by type of most recent course: percentages all respondents
Written communication skills
Spoken communication skills
Numeracy skills
Computer skills
Managing my own work
Working effectively in a team
Specialist knowledge for work
0 10 20 30 40 50 60 70 80 90
69
76
31
45
64
75
85
58
63
36
53
64
59
79
Other coursesTUC education
Source: Unionlearn Survey, Birkbeck University of London, 2012 (TUC n=1132, Other n=723)
Table 19 summarises the responses for each type of TUC Ed course showing that respondents who attended diploma in Occupational Health and Safety short courses were most likely to give positive responses in relation to the development of the skills listed in the survey.
49

Table 19 Development of skills and knowledge. Percentage agreeing strongly. TUC Ed courses.
(a) (b) (c) (d) (e) (f) (g) (h) (i)Written communication skills 66 75 86 65 82 94 74 73 58
Spoken communication skills 77 85 81 75 83 86 78 79 75
Numeracy skills 25 21 38 25 35 55 44 34 25Computer skills 28 42 66 32 54 80 59 48 31Managing my own work 62 75 76 62 74 86 78 58 51Working effectively in a team 75 85 76 78 83 85 81 74 66Specialist knowledge for work 73 83 92 87 95 97 78 81 85Base N=100% 99 52 104 130 114 65 54 62 213
Source: Unionlearn Survey, Birkbeck University of London, 2012
50
a) Union reps Stage 1 f) Diploma in Occupational Health and Safety short coursesb) Stepping Up – advanced course for union reps g) Union learning reps – Stage 1c) Diploma course (i.e. employment law etc.) h) Union learning reps – Stage 2d) Health and safety – stage 1 i) Short courses (e.g. employment law, equality reps)e) Next steps for safety reps j) Other TUC Ed courses

Apart from the type of course studied, the other significant differences were associated with whether or not respondents were qualified to degree level or not. Not surprisingly, those without a degree or any qualifications were more likely to indicate positive outcomes from the courses than with a degree. In particular, this is the case for written and spoken communication skills and numeracy skills. For written communication skills, 71% of respondents without a degree said this skill had been developed through the course compared to 56% of those qualified to degree level or higher. For numeracy skills the equivalent figures are 40% and 25% and for spoken communication skills 76% and 63%. Interestingly, there was little difference between respondents qualified below degree level in their responses to these questions.
51

5.4 Key points: Chapter 5
This chapter considered the outcomes of the most recent learning experience, including union related benefits; skills developed; and wider benefits.
Views of union related benefits (relating to most recent TUC Ed course undertaken) were extremely positive. Across all TUC Ed courses undertaken, the main course benefit reported was respondents’ improvement in their overall effectiveness in their union role (86%). But responses were high on a number of dimensions, and they clearly related to the topic of the course undertaken. For example:
70% of those who had completed an advanced course for union reps reported that it had increased union membership, while for 83%, their course had improved their ability to negotiate with their employer.
Of those who had completed a course for union learning reps, 78% reported that it had made them better able to help members get into learning.
Of those who had completed a Health & Safety course, over 95% reported an enhanced ability to help members in this area.
In terms of general work and personal benefits of the learning, the most positive outcomes from respondents’ courses were: their ability to do their job (79% agreed strongly or slightly); developing more personal learning interests (76% agreed); and their enjoyment of learning (69% agreeing). More than half of all respondents also indicated that their learning experience had made their job more satisfying (56%).
With the exception of promotion aspects, Those who had completed a TUC Education course were as likely to report high levels of general benefits as those who had done other courses. Indeed, in some cases levels were higher: 33% of those who had attended a TUC Ed course agreed strongly that it had made their job more satisfying, compared to 25% of those who had attended other courses. It is uncertain whether they referred to their union ‘job’ or their employment.
In addition to this, ethnicity was an influencing factor, with BME respondents reported more positively on a range of benefits.
52

As regards the development of specific skills, courses were most often seen as helping respondents gain specialist knowledge for work to a great or some extent (74%). About 70% reported having developed spoken communication skills and team work skills. Numeracy skills were least likely to be seen as developed at all through the learning/course (33%), reflecting the overall small proportion of our respondents who had undertaken basic skills training.
There were differences depending on course type attended. The largest difference was the proportion indicating that working effectively as a team was developed through the course - 75% of respondents on TUC Ed courses indicated this outcome compared to 59% of respondents on other courses. Within the group of TUC Ed courses, respondents who took Diploma in Occupational Health and Safety short courses were most likely to give positive responses in relation to the development of the skills listed in the survey.
53

6. UNIONLEARN RESPONDENTS: SOCIO-ECONOMIC CHARACTERISTCSIn the preceding chapters, the association between socio-economic variables and learning and its outcomes were explored. This chapter briefly describes the key demographic and employment profile of the survey respondents.
6.1 Gender, age and ethnicity
There was a fairly evenly split between men (54%) and women (46%), reflecting the national picture (Achur 2010). This profile is different from that of Capizzi’s 1999 study (65% males), reflecting the growing number of women in the labour market and the decline of manual work. As regards age, Figure 16 shows that there was a concentration of respondents in their 40s (34%) and 50s (41%), with just over half being aged 50 and over. This reflects very much the national picture (51% of union members aged 50+ (Achur 2010). The age profile of men and women were very similar. Figure 17 Age band by gender: percentage of all respondents
14%
17%
15%
34%
33%
34%
41%
41%
41%
11%
9%
10%
0% 20% 40% 60% 80% 100%
Male
Female
All respondents
Under 40 40-49 50-59 60 plusSource: Unionlearn Survey, Birkbeck University of London, 2012 (n=1879)
In terms of ethnicity, overall, 12% of respondents were of BME background. This is higher than reported by Cappizzi (1999), which showed 7% as of BME background. This difference is mainly due to the nature of our population whereby a relatively large proportion of respondents were from TUC South-East region, which had 18% of
54

BME respondents. Overall, there was a higher proportion (13%) of respondents of BME background among those who had completed TUC Education courses, compared to those who had done other courses (10%).
6.2 Marital and household status
Across all respondents 70% were married or living with a partner; 17% were single or never married; and 13% were widowed, separated or divorced. Age is the main variable correlated with this life situation (see Figure 18).
Figure 18 Marital status by age band: percentage of all respondents
31%
18%
14%
7%
17%
65%
70%
71%
74%
70%
4%
12%
15%
19%
13%
0% 20% 40% 60% 80% 100%
Under 40
40-49
50-59
60 plus
All respondents
Single/never married Married/living with partner Widowed/divorced/separatedSource: Unionlearn Survey, Birkbeck University of London, 2012 (n=1859)
There is a similar level of correlation between age and whether or not respondents had children living with them. Across all respondents just over one in three (36%) had children living with them. Table 20 summarises these data, also showing the age of children living with parents/carers by age band.
Table 20 Childcare responsibilities by age group: percentages
Under 40 40-49 50-59 60 plusAll respondents
Children living with you 44 53 28 9 37No children living with you 56 47 72 91 63Base N= 291 627 765 188 1871
55

Of those with children living with them:Children aged under 5 53 15 2 0 185-10 years 41 38 9 0 2911-16 years 30 54 43 24 4517 years plus 8 38 66 82 42Base N= 128 331 212 17 688
Source: Unionlearn Survey, Birkbeck University of London, 2012
6.3 Qualification profile
A key question in the survey asked for level of highest qualification20.
Respondents to the survey were relatively highly qualified. As Table 21 shows, nearly half the respondents were qualified at degree level or above. One in five held at least 2 A levels or equivalent, the same proportion had 5 or more GCSEs at grade A-C or their equivalent. Only five per cent held no qualifications. Younger respondents were more likely to have degree level qualifications and less likely to have no qualifications, and respondents aged 50 plus were more likely to have postgraduate qualifications, but also to have no qualifications.
Table 21 Highest qualification by age group: percentages
Under 40 40-49 50-59 60 plusAll respondents
Postgraduate qualification 16 15 18 21 17First degree qualification 36 32 27 27 302 A levels or more 25 19 18 14 19 5 GCSEs grade A-C 15 21 18 15 18Fewer or lower qualification than above 6 10 12 12 11No qualifications 2 2 7 10 5Base N= 290 622 761 188 1861Source: Unionlearn Survey, Birkbeck University of London, 2012
20 1) Postgraduate qualification (levels 6-7): e.g. Doctorate; Masters; Postgraduate Diploma; Postgraduate Certificate
2) Undergraduate qualification (levels 4-6): e.g. Bachelor degree; Foundation Degree; HNC/HND; DipHE/CertHE;NVQ Level 4; an equivalent
3) 2 A levels or more (level 3): including 4 AS Levels or more; GNVQ Advanced; BTEC National; OND/ONC; NVQ Level 3; Access to HE qualification
4) 5 GCSEs grade A-C (level 2): 5 GCE O Levels; 5 CSEs Grade 1; GNVQ Intermediate; BTEC Intermediate; NVQ Level 2; 1 A Level; 3 or less AS levels
5) Fewer or lower qualification than the above (level 0-1)6) No qualifications
56

There is also some correlation with gender, with more women holding degree (both first and postgraduate) level qualifications (51% compared to 39% of men). In addition to this many more BME respondents have degree and higher degree level qualifications (59%). However, both these figures are related to the age distribution of the respondents.
It should also be noted that the region with the highest qualification levels among respondents was TUC Ed South East, where 52% of all respondents had degree or higher level qualifications compared to 37% of all the other sources of learners. Table 22 highlights the regional differences in qualification levels, in particular between the TUC Ed South East region and the others.
Table 22 Highest qualification level by region: percentages
RegionsTUC Ed South East
Other TUC Ed UNet All respondents
Postgraduate qualification
14 22 12 5 17
First degree qualification 26 32 28 24 302 A levels or more 29 17 21 26 19 5 GCSEs grade A-C 21 16 22 16 18Fewer qualifications than above
10 9 10 22 10
No qualifications
0 4 6 7 5
Base N= 42 1077 629 153 1901Source: Unionlearn Survey, Birkbeck University of London, 2012
Comparing those who completed a TUC Ed course with those completed other courses, a higher proportion of the latter (51%) were qualified at degree level or above, compared to 44% of the TUC Ed attendees.
Taking the demographic variables together and doing some simple multiple regression, suggests that the key factors influencing the likelihood of respondents having degree level qualifications or higher are gender, ethnicity and whether the education took place in the TUC Ed South East region. In summary twice as many BME women who went on TUC Ed South East education courses (62%) were qualified to degree level or above compared to white men in other regions and on other courses (31%).
Table 23 shows comparative figures for different groups composed by Unionlearn (2010). Figures from our current study have been added to this table for comparison. It is evident that our respondents are relatively highly qualified. However, comparing
57

with the national profile of union members, our respondents are similar. About half all union members are qualified to degree level or equivalent, and only four per cent have no qualifications (Achur 2010).
Table 23 Comparison with other studies: Qualification levelsPercentages
Previous qual.
UNet learners*
Our study**
ESF data*
ESF (=Regions)Our study**
ONS learner survey*
UK work force*
Our study
All **Below level 2
70 30 50 14 44 29 17
Level 2 14 22 21 26 26 20 19
Level 3+
16 48 29 61 39 51 64
Sources: Figures in columns marked *are from Table on p. 11, Unionlearn (2010)21
Figures in columns marked ** are from our Birkbeck survey 2012
6.4 Employment profile
6.4.1 Occupational class
The occupational classification used follows the ONS recommended method, see details in Appendix B. As it has been assumed that all respondents are employees rather than self-employed, this has resulted in a four-category classification rather than the five-category one.
Figure 19 shows that nearly six in ten respondents were employed in managerial and professional occupations with a further 18% employed in intermediate occupations. This reflects the national picture whereby union membership is much higher for professional occupations. The main determinant of the occupational classification is, not surprisingly, whether or not respondents held degree level or higher qualifications. Three quarters of all respondents holding degree level qualifications were employed in professional/managerial occupations compared to 42% of respondents whose highest qualification was lower than degree levels. 21 Source of comparative data: Unionlearn (2011), Union learning Adding Value: An evaluation of Unionlearn and the Union Learning Fund, p.11
58

Figure 19 Four category occupational classification: percentage of all respondents
58
18
14
10
Managerial and pro-fessionalIntermediateLower supervisory and technicalSemi routine and routine occupations
Source: Unionlearn Survey, Birkbeck University of London, 2012 (n=1872)
Reflecting the difference in qualification levels, a lower proportion (55%) of those who had completed TUC Education courses were in professional/managerial occupations, compared with 65% of those who had completed other courses.
In addition to this, gender was also strongly correlated with occupational classification so of those holding degree level qualifications 80% of women were in professional and managerial occupations and 15% in intermediate occupations compared to respectively 75% and 11% of men. Similarly, among those qualified below degree level 47% of women were in professional and managerial occupations and 36% in intermediate, compared to 39% and 14% of men.
6.4.2 Supervisory responsibilities, work place size and sector
Nearly four in ten respondents (37%) reported that they supervise other employees, and the only variable (other than occupational classification) that was significantly correlated with response to this question was level of highest qualification. Forty-three per cent of those who held a degree or higher level of qualification said they had supervisory responsibilities compared to 33% of those that did not have degree level or higher qualifications.
59

One in eight respondents worked in organisations with fewer than 25 employees, 30% in organisations with 25-249 employees and 58% for employers with 250 or more employees. Older respondents i.e. those aged 50 plus seem more likely to work in small and medium sized organisations.
Seven in ten (70%) respondents worked in the public sector, one in four (27%) in the private sector and 3% in the voluntary sector22. Gender is strongly correlated with the sector in which respondents were employed, with 78% of women employed in the public sector compared to 63% of men, while 34% of men were employed in the private sector compared to just 18% of women. In addition to this, more of those respondents holding degree level qualifications or higher were working in the public sector (78%) than was the case among other respondents 64%.
TUC Ed South East accounted for much of the public sector employment. Of respondents who attended courses/events in this region 74% worked in the public sector compared to 58% of those who attended regional activities, 65% of those from other TUC Ed regions and 68% of UNet learners. However, there was no difference between those who had completed a TUC Ed course and those who had completed an ‘other’ course.
The relatively large proportion of respondents working in the public sector and in large organisations (which are concentrated in the public sector), does not represent the picture nationally. However, taking into account union membership and involvement in learning, they are somewhat more representative, though public sector workers are still over-represented. (Nationally, 70% of union members work in organisations with 50 or more employees; and public sector employees account for 62% of union members nationally (Achur 201023)).
6.4.3Working hours and contracts
Nine in ten (87%) respondents worked full-time with just 13% working part time. Nationally, 27% of the labour force are part-time workers24, so full-time workers in our population are over-represented. However, when taking union membership into account, our population is slightly more representative (22% of
22 in subsequent analysis due to the small numbers of respondents working in the voluntary sector this group is merged with the public sector.23 Archur, J. (2011), Trade Union Membership 2010, Department for Business, Innovation and Skills.24 ONS (2011), http://www.ons.gov.uk/ons/rel/lms/labour-market-statistics/october-2011/statistical-bulletin.html#tab-Summary-of-labour-market-statistics-published-on-12-October-2011
60

union members work are part-time workers) 25. The Adult Learning Survey by NIACE (2009) found that similar higher proportion of part-time workers as full-time workers (29%) had been engaged in learning (NIACE 2009).
Gender, age, supervisory responsibilities, level of qualification and occupational group are the key variables correlated with working hours. Twice as many women worked part time (19% compared with 8% of men, so of part-time workers, 70% were women). This reflects fairly closely the national profile (75% of part-time workers are women) 26. One in four respondents aged 60 plus worked part-time (25%) compared to 12% of those aged 50-59, 9% of those aged 40-49 and 12% of the under 40s. Slightly more of those with no supervisory responsibilities worked part-time (15%) and slightly more of those with degree level qualifications worked part time too (15%). They are also over-represented if compared with adult learners nationally.
Nine in ten respondents were employed on permanent contracts (93%) with 4% on fixed term contracts lasting 12 months or more, 1% on fixed term lasting less than 12 months and 1% on other types of contracts e.g. temporary, term time only etc. Those working part-time were less likely to be working on permanent contracts (22%); otherwise there was little to differentiate between respondents. For subsequent analysis all non-permanent contracts are grouped together.
6.5 Union membership and responsibilities
Nearly all respondents indicated that they were members of a union (95%). Since the respondents were sampled from TUC records, this high level of membership is as one would expect. More of those on permanent contracts (96%) and working full-time (96%) were members of unions.
A wide range of unions were mentioned. The three largest groups were Unison (mentioned nearly a third of respondents), PCS (Public and Commercial Services union) (12%), and Unite (12%).
Figure 20 Union roles performed by respondents: percentage of all union members 25 ONS (2011), http://www.ons.gov.uk/ons/rel/lms/labour-market-statistics/october-2011/statistical-bulletin.html#tab-Summary-of-labour-market-statistics-published-on-12-October-2011
26 Nationally, 27% of the labour force are part-time workers, and of these, 75% are women. ONS (2011), http://www.ons.gov.uk/ons/rel/lms/labour-market-statistics/october-2011/statistical-bulletin.html#tab-Summary-of-labour-market-statistics-published-on-12-October-2011
61

None, don’t perform any union roles
Other
Green Rep
Disability Rep
Equality Rep
Union Learning Rep
Health & Safety Rep
General union rep
0 10 20 30 40 50 60
20
15
2
3
8
21
36
52
Source: Unionlearn Survey, Birkbeck University of London, 2012 (n=2487)
Figure 20 shows the various union roles performed by respondents. More than half of all respondents indicated that they performed a general union representative role, a third reported being health and safety reps, one in five union learning reps, and some smaller proportion of respondent were equality reps, disability reps or ‘green’ reps. Many held more than one role, 25% two roles and 13% three or more roles. The ‘other’ roles held were predominantly branch roles, including treasurer, secretary, chair etc.
More older respondents indicated holding general union rep roles (54% of those aged 50 plus compared to 46% of the under 50s). In addition, women were more likely to indicate that they held general union rep roles (55% compared to 46% of men) and health and safety rep roles (75% compared to 57% of men). This latter figure is considerably higher than was found in the TUC survey of Health & Safety reps, where only 27% of respondents were women27. Also, three times as many BME respondents held equality rep roles (18%) as did white respondents (6%).
27 Trade union trends survey. TUC biennial survey of safety reps 2010, Organisation and Services department, October 2010
62

Key points: Chapter 6
This chapter presented the demographic and employment profile of our respondents.
Overall, the learners surveyed were predominantly- aged 40 and over, - white, - highly qualified, and- working full time in large organisations, in the public sector:
- Most notable is the small proportion of respondents with low level or no qualifications: Nearly half the respondents were qualified at degree level or above. Only five per cent held no qualifications.
- This is reflected in learners’ occupational class: nearly six in ten respondents were employed in managerial and professional occupations with a further 18% employed in intermediate occupations.
- Compared with the profile of TUC Education learners reported in Capizzi (1999), where 21% had no qualifications and only 21% were from managerial & professional occupations, there has clearly been a major move ‘upwards’. This reflects to a large extent the general socio-economic changes and improved educational levels of the population, which have also changed the profile of the unions.
- The gender profile, with 54% males, was different from that
of Capizzi’s 1999 study (65% males), again reflecting the growing number of women in the labour market and the decline of manual work. The age profile showed a concentration of respondents in their 40s (34%) and 50s (41%). In terms of ethnicity, overall, 12% of respondents were of BME background. This is higher than reported by Cappizzi (7%), and is due to the nature of our population whereby a relatively large proportion of respondents were from TUC South-East region, which had 18% of BME respondents.
- Seven in ten of our respondents (70%) worked in the public sector. Well over half (58%) worked in large organisations with 250 or more employees. Overall, 87% worked full time. In terms of union membership, while, as expected given the source of the population, the majority were members of a union, five per cent were not, confirming that union learning is open to non-union members.
63

64

7. LOOKING AHEAD
The current survey has mapped the characteristics of the learners, the recent learning, and their reported views of the experience and benefits. The longitudinal approach is a key feature of our study. Thus we are interested in the possible longer term outcomes of this learning experience, in terms of learner progression and further training/study, work and family situation, quality of life and engagement in the community. To that end, a number of questions were asked, aimed at measuring current involvement and views against future ones (through a follow-up study, planned to be in two years’ time). In other words, we will be able to compare these measures at two points in time and explore their association with the original learning.
7.1. Plans for further training/studyAs well as asking about the benefits of learning respondents were also asked to indicate their interest in pursuing another course in the next two years. Forty-four per cent said they definitely intended to take another course in next two years and a further 28% said they would probably take another course, 11% would probably not, and just 2% definitely would not be taking another course in following two years (Figure 21).
Figure 21 Future training plans in the next two years: percentages
44
28
11
2
15
Yes, definitelyYes, probablyProbably notDefinitely notDon’t know
Source: Unionlearn Survey, Birkbeck University of London, 2012 (n=2080)
65

As shown earlier, 69% of respondents agreed (strongly or slightly) that they enjoyed learning more as a result of their recent experience. Figure 21 shows that, perhaps not surprisingly, those who reported enjoying learning more were more likely to have definite plans for future study (61% of those who agreed strongly that they enjoyed the learning more reported having definite plans for further learning, compared with only 31% of those who disagreed strongly that they enjoyed the learning experience more), and those who had not enjoyed learning more were more likely to have no study plans or be uncertain (only 8% of these expressed uncertainty, compared to 19% of those who strongly agreed enjoying learning more). Nevertheless, the great majority, including some who had not enjoyed learning more, reported positively on future learning plans. An interesting question in the follow-up study will be whether these plans actually came to fruition.
Figure 22 ‘I enjoy learning more’ and association with Plans for further learning in the next two years
Agree strongly
Agree slightly
Neither Agree or Disagree
Disagree slightly
Disagree strongly
0
10
20
30
40
50
60
70
61
3834
2831
21
3430
3429
8 1014 15 15
1 2 2 4 68
1520 19 19
Yes, definitelyYes, probablyProbably notDefinitely notDon’t know
n=743 n=575 n=488 n=47 n=52Source: Unionlearn Survey, Birkbeck University of London, 2012 (N=1905)
Respondents’ future learning plans varied considerably by their age. Those aged 60 plus were significantly less likely to consider taking another course than those aged under 60. More than half the under 40 age group ‘definitely’ intended to take another course in the next two years (54%) compared to 50% of the 40-49 age group, 42% of the 50-59 age group and 28% of those aged 60 plus.
66

Those who had studied both TUC Ed and other courses were also more likely to say they definitely intended to take another course (53% compared to 42% of those who took TUC Ed courses only, and 45% of those who took ‘other’ courses only). Respondents without a degree were more likely than those with a degree to think they would take another course (47% compared to 41%).
When asked to specify what courses they would plan to take, the most frequently mentioned courses were: health and safety(22%); a union related course of some description (18%); legal courses(15%); IT/computer skills (10%), a non-specific work related course (6%), and an equality/diversity/equal pay course (6%). The full list of responses is provided in Appendix C along with the types of qualifications being considered by respondents.
7.2 Job satisfaction, Quality of life and voluntary activity
Respondents were also asked to give their views of their current work situation. They were provided with a range of options from ‘it is ideal, all or nearly all my needs are met’ to ‘I am not at all satisfied and plan to change as soon as possible’. As Figure 23 shows, across all respondents one in five said their work situation was ideal and met all or nearly all their needs, a further third said it was not ideal, but most of their needs were met, and about one in five indicated lack of satisfaction with their work.
The main variable of interest in separating out respondents to this question was level of qualification. Respondents holding degree level qualifications or higher were more likely to report negatively on their job situation (27% reporting being not at all satisfied or not satisfied, compared to 19% of respondents qualified below degree level). In the follow-up study, we shall explore whether further learning and higher qualifications may lead to greater job satisfaction.
67

Figure 23 Views of current work situation: percentage of all respondents
21
3026
17
5
It is ideal, all or nearly all my needs are metIt is not ideal, but most of my needs are metI am more or less satisfied with the my work situationI am not satisfied and am considering my optionsI am not at all satisfied and plan to change as soon as possible
Source: Unionlearn Survey, Birkbeck University of London, 2012 (n=2408)
7.3 Quality of lifeRespondents were asked to rate their quality of life. As Figure 24 shows, most respondents were more or less satisfied with their quality of life. Just five per cent said their quality of life was ‘bad’ or worse. But there is scope for improvement: only 25% reported their quality of life as ‘very good’, and 30% just ‘all right’.
There is very little correlation with demographic or employment related factors.
68

Figure 24 Quality of life: percentages all respondents
1
25
39
30
4
So good it could not be betterVery goodGoodAlrightBadVery BadSo bad it could not be worse
Source: Unionlearn Survey, Birkbeck University of London, 2012 (TUC n=1132, Other n=723)
Respondents were also asked what would improve their quality of life. Table 24 summarises the themes that emerged from the open comments. The most frequently mentioned of these was more money (in the form of lottery wins etc.) (14%), followed by more money by salary increases etc. (13%). Thirteen per cent wanted a better work life balance and 9% would like a better working environment. Just 4% mentioned, unprompted, improvements stemming from education or training. Reduced stress, better health, fitness etc. were mentioned around 12%.
Table 24 Improvements to quality of life: percentages
Improvement Percent Base N=2 More money – lottery/premium bonds etc 14% 2841 Better salary/pay rise 13% 2639 Work/life balance/more free time/time with family/more hours in the day/ability
to take holiday when want to 13% 253
11 Better work environment/less stress/bullying/harassment/discrimination/recognition/ better managers 9% 174
4 Better job/new job/change of career/a job 8% 15514 Better personal health/health of partner/family/relationships/well being 8% 1643 Less financial stress/less debt 6% 1167 Better working hours/part time/flexible working/remote working 6% 1226 Job security – personal and for rest of family/contract 5% 107
16 Different government/government that cared and was committed/Socialist government/economic situation 4% 77
17 Education and training 4% 8818 General happiness i.e. play prof football/favourite team winning/a
challenge/more confidence/travel/to be happier 4% 73
69

12 Retirement 3% 6313 Better pension/pension security 3% 525 Promotion/career development and progression 2% 398 Reduced travelling 1% 20
10 Less stress – general/not specific 1% 2015 Lose weight/get fit 1% 2520 Housing/available social housing/get a mortgage/move to new area/better house 1% 2721 No change/nothing/not sure 1% 2922 Random comment/not relevant 1% 1519 Better support/help from union 0% 7
Total (respondents could list more than one improvement) 110% 2173Source: Unionlearn Survey, Birkbeck University of London, 2012
Again, it will be interesting to explore whether respondents will report enhanced quality of life in the follow-up study. For example, will more learning lead to a less stressful job and/or better pay: the factors which seem particularly important for individuals?
7.4 Involvement in voluntary activities
Respondents were asked about their involvement in voluntary activities, as a way of gauging their social engagement. The association between learning and volunteering has been widely researched and debated. First, it is argued that volunteering entails learning, and enhances what is sometimes referred to as ‘civic capabilities’ (Schuller & Watson 200928). Secondly, statistics on volunteering show that those with a higher level education are more likely to be involved in volunteering29. Our survey found that one in three respondents (34%) was currently engaged in voluntary activities. The strongest correlation was in relation to range of courses attended in the last three years. Those who had undertaken both TUC Ed and other courses were most likely to say they have been engaged in voluntary activities or unpaid work (44%), compared to 33% of those who have only done TUC Ed courses, 30% of those who had only undertaken other courses. Professional/managerial respondents were more likely than those working in semi routine and routine occupations to have done voluntary work (37% compared with 27%), while older respondents were more likely than younger ones to have engaged in voluntary 28 Schuller, T. And Watson, D. (2009), Learning Through Life, NIACE, Leicester29 35% of those with a degree level qualification are involved as volunteers, compared with only 14% of those with no qualifications. A similar patterns is discernible in terms of occupational class. Drever, E (2010), 2008-09 Citizenship Survey. Volunteering and Charity Giving Topic Report, Department for Communities and Local Governmenthttp://www.communities.gov.uk/documents/statistics/pdf/1547056.pdflast accessed 21 April 2012
70

activity (42% of those aged 60 plus compared to 28% of those aged under 40). Finally, more respondents working part time than full time worked in unpaid/voluntary work (42% compared to 33% of full time employees). On average respondents who were engaged in voluntary activity/unpaid work committed two hours per week. Here there was little variation by respondent.
The pattern that emerged from our study is very similar to the national one, albeit the overall proportion of our respondents involved in volunteering is slightly higher than the national average of 26%30. The association between educational qualifications, occupational status and age found in our study are very much in line with the national trends (Drever 2010). In the follow-up study we will explore any changes in the patterns of volunteering, and their association with learning – an association that can work both ways.
30 Drever (2010). Figures are not entirely comparable, as the national figure refers to any volunteering in the last month, and as it is age dependent. If anything, the comparison would seem to underestimate our respondents’ involvement.
71

7.5 Key points: Chapter 7
The longitudinal approach is a key feature of our study. This chapter focused on a range of dimensions, which, while interesting in themselves, are primarily aimed at obtaining baseline measures that can be explored further at a future point in time.
In response to a question of whether they planned to do any study/training in the next two years, the majority answered in the affirmative. Forty-four per cent said they definitely intended to do so, and a further 28% said they would probably take another course. Only two per cent definitely would not be taking another course in following two years. Those with definite plans were more likely to have reported that they enjoyed learning more as a result of their learning experience.
Work satisfaction: the majority expressed satisfaction with their work situation. Only one in five indicated lack of satisfaction with their work. This proportion was slightly higher for those with degree level qualifications.
When asked to rate their quality of life, most respondents seemed more or less satisfied with their quality of life. Just five per cent said their quality of life was ‘bad’ or worse.
One in three respondents (34%) was engaged in voluntary activities. On average respondents who were engaged in voluntary activity/unpaid work committed two hours per week. The strongest correlation was in relation to range of courses attended in the last three years. Those who had undertaken both TUC Ed and other courses were most likely to say they have been engaged in voluntary activities or unpaid work (44%), compared to 33% of those who have only done TUC Ed courses, 30% of those who had only undertaken other courses. Those in professional & managerial occupations and those aged 60 and over were more likely to have been engaged in voluntary activities.
72

REFERENCESArchur, J. (2011), Trade Union Membership 2010, Department for Business, Innovation and Skills
Callender, C., Hopkin, R., and Wilkinson D. (2010) Futuretrack: part-time students career decision-making and career development of part-time higher education students HECSU, Manchester
Capizzi, E. (1999), Learning that Works. Accrediting the TUC programme, NIACE/TUC
Drever, E (2010), 2008-09 Citizenship Survey. Volunteering and Charity Giving Topic Report, Department for Communities and Local Governmenthttp://www.communities.gov.uk/documents/statistics/pdf/1547056.pdflast accessed 21 April 2012
Feinstein, L, Tashweka M. Anderson, T., Hammond, C, Jamieson, A and Woodley, A (2007, The Social and economic benefits of Part-time, mature Study at Birkbeck College and the Open University, Birkbeck www.bbk.ac.uk/benefits
Gowan, D (2009), Making a Difference. The impact of trade union education on Britain’s workplaces. A union reps survey report, Unionlearn
Jamieson (2007), Benefits of study Working Paper: Birkbeck graduates compared with general population, Birkbeck Working Paper, www.bbk.ac.uk/benefits
ONS (2011), Labour Market Statistics October 2011, http://www.ons.gov.uk/ons/rel/lms/labour-market-statistics/october-2011/statistical-bulletin.html#tab-Summary-of-labour-market-statistics-published-on-12-October-2011
Ross, C., Kumarrapan, L., Moore, S. and Wood, H. (2011), Learning Journeys. Trade union learners in their own words, Unionlearn with TUC/London Metropolitan University. Unionlearn Research Paper 14.
Schuller, T. And Watson, D. (2009), Learning Through Life, NIACE, Leicester
Stuart, M., Cook, H., Cutter, J. and Winterton, J (2010), Evaluation of the Union Learning Fund and Union learn, Centre for Employment Relations Innovation and Change, Leeds University Business School. http://www.unionlearn.org.uk/files/publications/documents/191.pdf, last accessed 17 April 2012. A summary has been published by Unionlearn: Unionlearn (2011) Union learning Adding Value: An evaluation of Unionlearn and the Union Learning Fund
Trade union trends survey. TUC biennial survey of safety reps 2010, Organisation and Services department, October 2010
Unionlearn (2011), Union learning Adding Value: An evaluation of Unionlearn and the Union Learning Fund
Unionlearn with/TUC Education (2008) TUC Education Online. The Learners’ Perspective,
TUC Education Service Statistics 2010
73

APPENDIX A. METHODOLOGY
1 Questionnaire design
The questionnaire was drafted during Summer 2011 by the team at Birkbeck University to address the objectives of the baseline survey. The issues covered included:
Respondents’ current employment and demographic profile details of union courses attended in the last three years, if any, and how
these courses were pursued, the purpose of union based courses details of other (non union based) courses undertaken and whether these
led to qualifications the form then sought information about what was the most recent course
undertaken and looked at reasons for pursuing this course, support and encouragement to pursue it
satisfaction with the course and any problems were explored in a series of attitude statements
how useful the course was perceived to be was then covered in a further series of attitude statements and the degree to which the course developed certain skills and knowledge
future intentions were then covered together with views of online learning.
First attention was given to producing the forms in a paper based format then once this was agreed an online version was developed. The survey was set up to use both methodologies.
The surveys were piloted in late September 2011 using two approaches.
1) An online survey was sent to 200 delegates to gauge the likely response rate and ease of completion. Once the survey was completed respondents were taken to a short feedback form where they were provided with an opportunity to give feedback on the survey. Of the 200 delegates sent the pilot survey 53 email addresses were invalid and we received nine responses representing a response rate of 6%. This response rate was a concern for the team given the reliance on online methodologies the survey required. A number of actions were deemed necessary to improve the response rate. These included:
a) refinements to the questionnaire to ensure it was well designed minimising impact on the respondent
b) use an invitation from the TUC General Secretary Brendan Barber to stress the importance of the survey
c) publicise the survey in the TUC newsletter etc.d) make more use of the paper format to ensure that all media were
used to maximum effect e) use a prize draw of five Kindles to improve incentives to take part.
2) Focus groups were convened at Birkbeck University consisting of trainees who had participated on similar courses … AJ to complete.
74

The project team met on 11th October 2011 to discuss issues that arose as a result of the pilot and made a number of refinements to the questionnaire and survey process.
The final paper based survey consisted of an A4, eight page booklet questionnaire with a front page cover letter from the TUC General Secretary and a reply paid envelope. The online survey enabled routing that took respondents away from questions that were not relevant to them but otherwise contained the same content as the paper based version.
It was also decided that the email and postal elements of the process would be used in conjunction so that some email non-respondents would receive postal follow up to try and maximise opportunities to respond. It was also decided to widen the postal sample using just one mail shot to a larger sample. The precise size of this sample was to be decided after the email survey.
2. Sample, fieldwork and response rates The sample for the survey was provided by TUC database records and consisted of several spreadsheets containing contact details for respondents attending training sessions. Three different populations were identified: TUC Ed learners; learners and learners attending regionally organised events (see below for details about each of these populations).
There were 18,333 email contacts provided in the initial sample but this was reduced to 17,490 once duplicate email addresses had been identified. The online survey was launched on the night of Monday 21st November 2011 so that respondents would receive their first email first thing on Tuesday 22nd November 2011. Two reminders were sent to the sample, the first on Wednesday 30 th
November 2011 and the second on Thursday 8th December 2011.
Table 1.1 summarises the aggregate sample information and details response data for the email element of the survey. Table 1.1 Original sample and email survey response information
Original sample Email survey
Database/activity Postal Email
Email sample
Email disabled
Email failed
Email completions (inc. partial)
Email response rate
Region: NW 1851 0 0 0 0 0 n/aRegion: SW 1273 862 700 21 239 43 10%TUC Ed West 0 883 853 24 106 202 28%TUC Ed York /Humber
1869 395 293 2 73 64 29%
TUC Ed North 1512 508 354 16 123 46 21%
TUC Ed North West 2592 444 412 14 139 75 29%
TUC Ed South East 11513 13921 13565 305 5913 1489 20%
549 1320 1313 29 169 209 19%Total 21159 18333 17490 411 6762 2128 21%Source: Unionlearn Survey, Birkbeck University of London, 2012
75

Of the 17,490 emails sent out 6,762 (39%) bounced as incorrect, incomplete or out of date emails. A further 411 (2%) were rejected by email servers or by the sample as not being appropriate or confused as ‘spam’. There were a total of 2,128 completed questionnaires representing a response rate to this element of the survey of 21%. This response rate is considerably better than was anticipated from the pilot survey and suggests that the amendments made as a result of the pilot process were beneficial31. Contained within the email responses however, are 334 partial completions. These include responses where the individual has not submitted the form but has completed at least one page of the questionnaire. Much of the data within this group is not usable. During the email stage of the survey thought was given as to the most effective second stage. It was decided that we would undertake a larger scale postal survey but without any reminders. Typically in a survey of this nature the response to a reminder is approximately half the original response. It was felt that using a sample twice the size would achieve approximately 25% more returns, and give more delegates the opportunity of taking part.
Table 1.2 Original sample and postal survey response information
Database/ activity
Original postal sample
New postal sample
Left over email sample32
Total postal sample PORs
Postal response
Email response rate
Region: NW 1851 969 0 969 17 35 4%
Region: SW 1273 881 544 1425 103 19 1%
TUC Ed West 0 0 0 0 0 0 n/a
TUC Ed York /Humber
1869 1033 219 1252 35 142 12%
TUC Ed North 1512 967 269 1236 35 79 7%
TUC Ed North West
2592 2017 308 2325 75 174 8%
TUC Ed South East 11513 2146 0 2146 119 95 5%
549 541 1106 1647 42 89 6%Total 21159 8554 2446 11000 426 635 6%Source: Unionlearn Survey, Birkbeck University of London, 2012
Table 1.2 shows the sample structure for the postal stage of the survey. It can be seen from comparing the figures in the first two columns of the table that there was a large volume of incomplete or duplicate records. These were removed from the sample and what remained was added to the email sample where there was also postal contact information33. However, it is likely that the remaining sample contained other inaccuracies and this is borne out by the relatively large number of Post Office Returns (PORs) 426 (4%). In total the postal survey achieved 635
31 It is also the case however, that pilot surveys typically achieve lower response rates than the full survey as individuals see less benefit in their participation in a pilot survey. 32 This column includes email sample that also contained postal contact information. 33 A large number of cases appeared in more than one section of the database it was not possible to eliminate individuals consistently from any one database.
76

completed responses (6% response rate). This figure is disappointing and lower than expected.
It is difficult to provide an aggregate response rate as individuals received different numbers of communications.
77

APPENDIX B. OCCUPATIONAL CLASSIFICATIONRespondents were asked to provide information through a series of questions concerning their employment status. This included a closed occupational classification and free text question about their occupation – the free text response was used to double check the self classification for glaring differences. To help classify respondents into five social groups questions were also included about the number of employees at the work place, the broad sector of the organisation (public/private/voluntary) and supervisory responsibilities. Additional questions addressed the mode of working (full-time/part-time) and the type of contract on which respondents were employed.
Below is a summary of the occupational cross tabs that have been used to generate a four code occupational class variable34.
As can be gleaned from the highest level of qualification above it is clear that respondents to the survey are well qualified. This is reinforced by the occupational classification with high numbers of respondents in professional and managerial occupations. Figure 2.3 shows responses to the eight category occupation35.
Figure 2.3 Occupational classification: percentage of all respondents
4
12
5
9
11
4
24
31
5 10 15 20 25 30 35
Traditional professional occupations
Middle or junior managers
Routine manual and service occupations
Semi-routine manual and serviceoccupations
Technical and craft occupations
Senior managers or administrators
Clerical and intermediate occupations
Modern professional occupations
Percentage
Source: Unionlearn Survey, Birkbeck University of London, 2012 (n=2430)
Using these data and combining with responses to the organisational size and supervisory responsibility responses a four category variable was derived that is the ONS recommended measure of occupational class. This variable is used during the remainder of the analysis.
Table B.1 8 category occupational classification by size of employer and supervisory responsibility: percentages
34 It is a four class variable because everyone in the survey was assumed to be employed i.e. there was no question that separated out the self employed and small business owners from the employed. 35 Respondents were asked to self classify their occupation (or most recent occupation) this was then checked against their self reported job title.
78

Size of employer Supervisory responsibility
1 to 2425 to 249
250 or more
Base N= Yes No
Base N=
Modern professional occupations 14 31 55 754 44 56 753
Clerical and intermediate occupations 11 29 59 579 25 75 578
Senior managers or administrators 14 26 60 100 52 48 99
Technical and craft occupations 9 33 58 254 26 74 253
Semi-routine manual and service occupations 12 34 55 216 29 71 214
Routine manual and service occupations 12 34 54 111 18 82 110
Middle or junior managers 13 28 59 294 61 39 294
Traditional professional occupations 5 21 74 95 46 54 95
All respondents 12 30 58 2403 37 63 2396Source: Unionlearn Survey, Birkbeck University of London, 2012
Table B.2 8 category occupational classification into 4 category: percentages
Managerial and professional Intermediate
Lower supervisory and technical
Semi routine and routine occupations
Base N=
Modern professional occupations 100 0 0 0 763
Clerical and intermediate occupations 25 75 0 0 578
Senior managers or administrators 100 0 0 0 102
Technical and craft occupations 0 0 100 0 253
Semi-routine manual and service occupations 0 0 29 71 214
Routine manual and service occupations 0 0 18 82 110
Middle or junior managers 100 0 0 0 299
Traditional professional occupations 100 0 0 0 96
All respondents 58 18 14 10 2415Source: Unionlearn Survey, Birkbeck University of London, 2012
79

APPENDIX C. FUTURE LEARNING: COURSES Table C.1 Courses being considered by respondents: percentages
Course Percent Base N=1 Health & Safety 22% 295
16 Union related – Learning Reps/Negotiation/History 18% 24313 Legal courses (Law/Employment Law/Legal updates/Sec 15% 20728 IT/Computer Skills 10% 13842 Not sure/anything 6% 8240 A work related course (not specified)/Various courses 6% 76
7 Equality/Diversity/Equal pay 5% 7241 Subject not stated/not clear 5% 6710 Management/Project Management 3% 44
4 Workplace Issues – Stress/Bullying/Discrimination/redundancy/sickness 3% 4133 Modern Languages 2% 2911 Business Studies/Admin/Accountancy/Financial/Economics 2% 2626 Teaching 2% 2538 The Arts – Theatre/Painting/Pottery/Photography/music/acting 2% 2439 Other personal interest 2% 2527 Literacy & Numeracy 2% 23
2 Occupational Health 1% 1817 Pensions 1% 18
9 First Aid/Medical 1% 1634 Humanities (history/geog/psychology/philosophy etc) 1% 16
3 Mental Health Awareness 1% 156 Disability Awareness 1% 15
18 Social Work/Counselling/domestic violence/vulnerable workers 1% 1521 Stepping Up 1% 1331 English 1% 1432 Maths 1% 1323 Environmental issues 1% 1230 Assessor/Training 1% 11
8 Sign Language/Deaf awareness 1% 920 Customer Relations/Care/Service 1% 929 Mentoring/Coaching 1% 1014 Politics/Political History 1% 819 Childcare/Child Protection 1% 812 HR 1% 715 Industrial Relations 1% 7
5 Discipline & Grievance 0% 625 ESOL 0% 636 Architecture/surveying/construction 0% 543 Retired/close to retiring/prevented from courses due to retirement 0% 635 International issues 0% 437 Plumbing/Carpentry/Electrician/Gas/Building – skilled labour areas 0% 422 Skills for Life 0% 324 Caring for Elderly/Age issues including dementia 0% 2
Total (respondents could list more than one course) 124% 1687Source: Unionlearn Survey, Birkbeck University of London, 2012
80

Table C.2 Qualifications being considered by respondents: percentages Qualification Percent Base N=
6 Diploma 26% 1302 Level/Stage 2 (follow up) 19% 965 Refresher/updates/further courses 14% 71
19 Degree/B Ed 11% 544 Advanced 9% 43
20 Masters 6% 3213 NEBOSH/IOSH 6% 31
1 Level/Stage 1 5% 263 Level/Stage 3 5% 25
11 ECDL 3% 1314 PTLLS/CTLLS/DTLLS 2% 10
7 NVQ 1 1% 421 PhD 1% 4
8 NVQ 3 1% 315 PGCE/Cert Ed 1% 312 CIMA/ACA/ACCA 0% 216 TEFL 0% 217 GCSE 0% 2
9 NVQ 4 0% 110 NVQ 5 0% 118 A Level 0% 1
Total (respondents could list more than one course) 112% 555Source: Unionlearn Survey, Birkbeck University of London, 2012
81