attachment 4 chle-008: debris bed preparation and
TRANSCRIPT

NOC-AE-1 4003075
Attachment 4
CHLE-008:
Debris Bed Preparation and Formation Test Results, Revision 4

PROJECT DOCUMENTATION COVER PAGE
Document No: CHLE-008 FRevision: 4 Page 1 of 24
Title: Debris Bed Preparation and Formation Test Results
Project: Corrosion/Head Loss Experiment (CHLE) Program TDate: 2/23/2014
Client: South Texas Project Nuclear Operating Company
Summary/Purpose of Analysis or Calculation:
Fiberglass debris will be added to the head loss modules in the CHLE tests to form a debris bed that willact as a substrate for the capture of corrosion products if they form in the corrosion tank. Capture ofcorrosion products will be manifested as an increase of head loss through the debris bed. This documentdescribes the results of a series of tests that were conducted to determine the procedures to form thedebris beds in the head loss modules.
Rold: Name: Signature: Date:
Prepared: Kerry Howe < signed electronically > 6/3/2012
Reviewed: Janet Leavitt < signed electronically > 6/12/2012
Oversight: Zahra Mohaghegh < signed electronically > 2/12/2014
Approved: Ernie Kee < signed electronically > 2/23/2014
Revision Date Description
1 6/3/2012 Describes results from Debris Tests 1 through 6.
2 6/9/2012 Adds a summary and the results from Tests 7 to 14.
3 6/12/2012 Addresses internal comments, adds TOC, introduction, and summary.4 2/23/2014 Review for NRC submittal
___ I ___ .1. _________________

Title: Debris Bed Preparation and Formation Test Results
Table of Contents
In tro du ction ..................................................................................................................................... 4
Sum m ary of R esults ................................................................................................................ 5
Conclusions and Plans for Debris-Bed Formation for 30-Day Tests ......................................... 7
Test 1: Nukon fiber, silicon carbide particles, RO-treated water .............................................. 7
Test 2: Nukon fiber, silicon carbide particles, water with H3BO3/TSP ..................................... 9
Test 3: Double-shredded Nukon fiber, sodium tetraborate as buffer ........................................ 9
Test 4: Double-shredded Nukon fiber, TSP as buffer .............................................................. 10
Test 5: Nukon fiber, no particles, A1OOH (WCAP) precipitate .................................................. 11
Test 6: Nukon fiber prepared by NEI protocol, WCAP precipitate ........................................ 14
Test 7: Nukon fiber prepared by NEI protocol, WCAP precipitate ........................................ 14
Test 8: Nukon fiber prepared by NEI protocol, WCAP precipitate ........................................ 15
Test 9: N ukon fiber prepared in blender ................................................................................... 15
Test 10: Nukon fiber prepared in blender ................................................................................ 17
Test 11: Nukon fiber prepared by blender, exposed to WCAP precipitates ............................ 19
Test 12: Nukon fiber prepared by blender, exposed to WCAP precipitates ............................ 19
Test 13: Nukon fiber prepared by NEI procedure, exposed to WCAP precipitates at hightemperature from the corrosion tank ....................................................................... 21
Test 14: Nukon fiber prepared by blender, exposed to WCAP precipitates at high temperaturefrom the corrosion tank .......................................................................................... 24
FiguresFigure 1: Head loss at approach velocity of about 0.093 ft/s with RO-treated water as the
circulating fluid .............................................................................................................. 8Figure 2: Head loss at approach velocity of 0.010 ft/s with RO-treated water as the circulating
fl u id ......................................................................................................................................... 8Figure 3: Head loss at approach velocity of about 0.093 ft/s with water containing boric acid and
TSP as the ciculating floid ................................................................................................. 10Figure 4: Head loss at approach velocity of 0.010 ft/s with water containing boric acid and TSP
as the circulating fluid ...................................................................................................... 10Figure 5: Bed thickness at approach velocity of 0.010 ft/s with water containing boric acid and
T SP as the circulating fluid ................................................................................................... 11Figure 6: Head loss at approach velocity of 0.093 ft/s in Test 2 and 0.1 ft/s in Test 5 ............. 13Figure 7: Head loss at approach velocity of 0.01 ft/s in Tests 2 and 5 ..................................... 13Figure 8: Fiber bed thickness at approach velocity of 0.1 ft/s in Tests 2 and 5 ........................ 13Figure 9: Head loss after addition of I g increments of WCAP precipitate (Test 6) ................. 15Figure 10: Head loss after addition of I g increments of WCAP precipitate (Test 8) ............... 16Figure 11: Comparison of head loss after additional of WCAP precipitate in Tests 6 and 8 ....... 16
Document No: CHLE-008, Rev 4 Page 2 of 24

Title: Debris Bed Preparation and Formation Test Results
Figure 12: Photographs of fiber beds with 18g of fiber at 0.1 ft/s approach velocity (a) preparedwith NEI pressure-washer method and (b) prepared in a blender .................................... 17
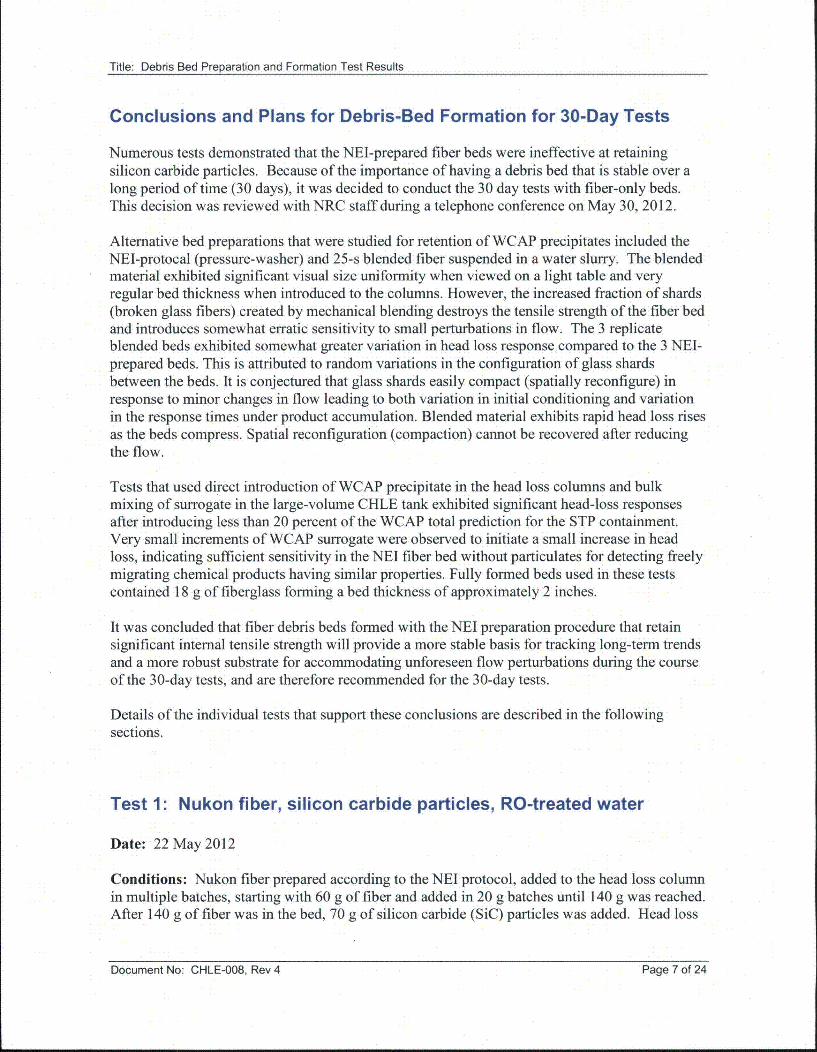
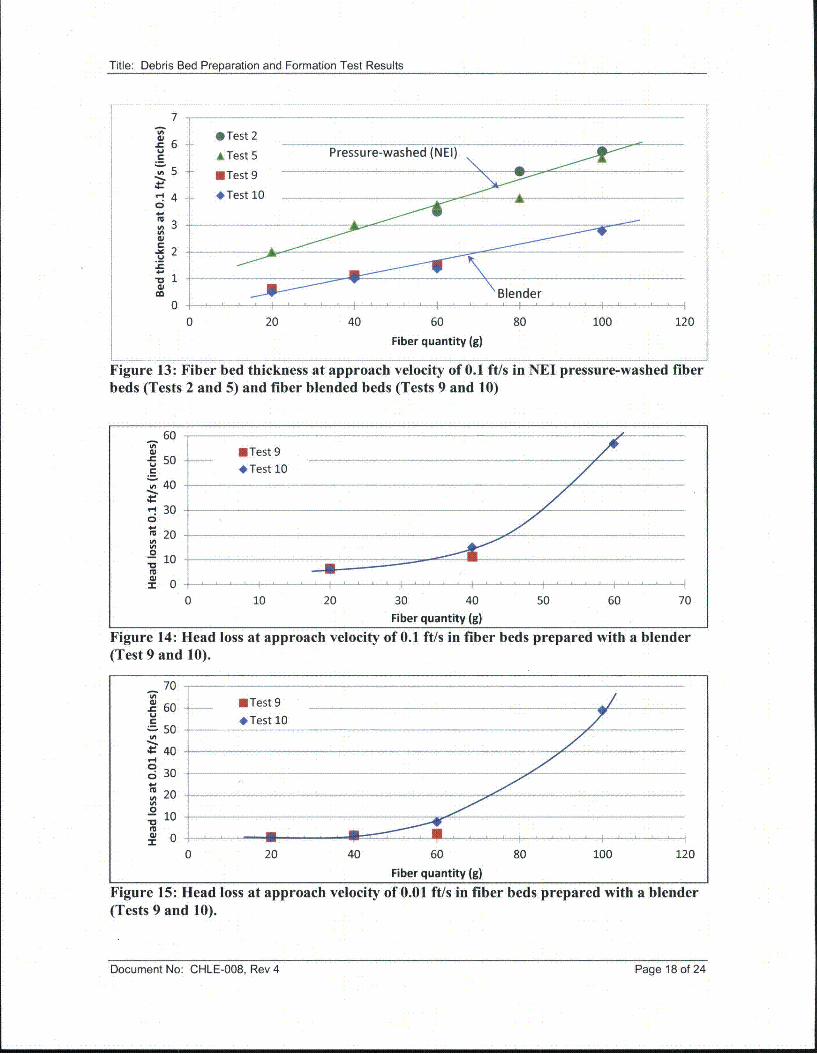
Figure 13: Fiber bed thickness at approach velocity of 0.1 ft/s in NEI pressure-washed fiber beds(Tests 2 and 5) and fiber blended beds (Tests 9 and 10) ................................................... 18
Figure 14: Head loss at approach velocity of 0.1 ft/s in fiber beds prepared with a blender (Test 9an d 10 ) . ................................................................................................................................. 18
Figure 15: Head loss at approach velocity of 0.01 ft/s in fiber beds prepared with a blender (Tests9 an d 10 ) . .............................................................................................................................. 18
Figure 16: Head loss in Test 10 with fiber bed prepared with a blender .................................. 19Figure 17: Head loss in Test 11 with fiber bed prepared with a blender and addition of WCAP
p rec ip ita te .............................................................................................................................. 2 0Figure 18: Head loss in Test 12 with fiber bed prepared with a blender and addition of WCAP
p rec ip ita te .............................................................................................................................. 2 1Figure 19: Head loss in Test 13 and 3 fiber beds prepared with the NEI procedure and WCAP
precipitates added to the CHLE corrosion tank at 174 OF ............................................... 23Figure 20: Turbidity in Test 13 and 3 fiber beds prepared with the NEI procedure and WCAP
precipitates added to the CHLE corrosion tank at 174 OF ..................................... ............. 23Figure 21: Head loss in Test 14 with 3 fiber beds prepared in blender and WCAP precipitates
added to the CHLE corrosion tank at 174 OF ................................................................... 24
TablesTable 1: H ead loss and turbidity in Tests 3 and 4 ......................................................................... 11
Document No: CHLE-008, Rev 4 Page 3 of 24Document No: CHLE-008, Rev 4 Page 3 of 24

Title: Debris Bed Preparation and Formation Test Results
Introduction
One key objective of the 30-day chemical effects testing is to determine whether or not chemicalprecipitates can form or collect on prototypical fiberglass media that are present in the postLOCA environment. Two primary chemical formation mechanisms are postulated that mightaffect the pressure drop across a sump-strainer debris bed: (1) formation and/or agglomeration ofprecipitates in the bulk solution that migrate to the strainer and incur some degree of filtration(by various mechanisms), and (2) direct precipitation of chemical products on fiber surfaces andinterstitial contact points. Formation mechanism 1 could be monitored using commercial waterquality filter media and microscopic examination of periodic grab samples. However, formationmechanism 2 requires the presence of real debris constituents in at least a prototypical physicalconfiguration. Since both mechanisms can lead to measurable pressure drop across a debris bed,it is desirable to monitor pressure at constant flow through a fiber mat for the duration of the 30days as an indicator of possible chemical product formation. If chemically induced pressure dropis observed, a more complete study of debris combinations and bed morphologies will be neededto develop a descriptive (if not predictive) head-loss correlation.
Diagnostic debris beds used in the 30-day CHLE tests should have the following attributes: (1)long-term mechanical stability, (2) reproducible formation and head-loss response to the sameflow and chemical conditions, (3) internal complexity necessary to stimulate and respond to thepresence of the two postulated chemical formation mechanisms. It has long been recognized thatdebris preparation protocol has important effects on fiber bed head-loss behavior includingchanges to characteristics such as compressibility, compaction, filtration efficiency, porosity,specific surface area, etc. The most recent debris formulation advocated by NEI for strainertesting involves baking fiber blankets on one side at 300 'C for 6 to 8 hours, followed bydisaggregation with a commercial pressure-washer. The combination of a relatively new debrispreparation method, a very low approach velocity of 0.01 ft/s across the STP strainers, and high-temperature chemically buffered water justify the time devoted to the short series of preliminarytests described in this report.
The primary objective of this CHLE preliminary test series was to select a bed preparationprotocol suitable for initiating the 30-day baseline performance tests (to be conducted underplant conditions, but without corrosion materials). Careful consideration was given to the bedattributes of mechanical integrity, reproducibility, chemical detection threshold sensitivity, andtime-response sensitivity. A series of preliminary debris generation and head loss tests wereconducted between May 14 and 18 to evaluate procedures for creating reproducible and reliabledebris beds for the CHLE program. These preliminary tests revealed great difficulty filteringsilicon carbide particulates with a nominal diameter of 10 gim using the NEI debris preparationmethod. NEI prepared fiber is only slightly more compact than the manufactured blanket andretains up to 98 percent porosity. After these preliminary results were obtained, a moresystematic testing program was instituted to evaluate trends and patterns associated with debrisbed formation. Test instrumentation included flow meters accurate to 1 percent and differential
Document No: CHLE-008, Rev 4 Page 4 of 24Document No: CHLE-008, Rev 4 Page 4 of 24

Title: Debris Bed Preparation and Formation Test Results
pressure transducers accurate to 0.08 percent. The systematic testing program was conductedfrom 22 May 2012 to 07 June 2012 and included 14 tests that evaluated the following:
* 3 different fiber preparation methods: (1) the NEI pressure-washing method, (2) theAlion double-leaf-shredded and boiled method, and (3) chopping in a blender for 25seconds.
* Incremental additions of quantities of fiber.* 3 different solutions: (1) deionized water, (2) deionized water with boric acid and
trisodium phosphate (TSP), and (3) deionized water with boric acid and sodiumtetraborate.
• 2 approach velocities: (1) 0.1 ft/s and (2) 0.01 ft/s.* 2 temperatures: (1) room temperature, and (2) 174 'F.* With or without silicon carbide particles.* With or without WCAP aluminum-based precipitates (AIOOH).* WCAP precipitates added directly in the head loss columns or added in the CHLE
corrosion tank.
The results of this series of tests are summarized in the next section, and detailed results of thetests are presented after that.
Summary of Results
The following conclusions can be drawn from this test series:
Conclusion BasisThe NEI pressure-washing fiber preparation Test 2 with 140 g of NEI-prepared fiber andmethod is not effective at preparing a debris 70 g of SiC (ri = 0.5) remained turbidbed that will capture silicon carbide (SiC) (turbidity 417 NTU after 10 minutes ofparticles. The double-shredded method is circulation). The results were qualitativelymore effective at doing so but was not similar to multiple tests the previous week.completely effective in these tests. Test 3 (double-shredded) achieved turbidity
of 54 NTU (94 percent removal of turbidity)at q = 1.0 but turbidity increased to 512 NTUat rl = 3.0.
2 Fiber beds appeared to be better at capturing Test 3 (NaTB) achieved turbidity of 54 NTUsilicon carbide particles when sodium at r) = 1.0 and 512 NTU at q = 3.0, whereastetraborate (NaTB) was the buffer instead of Test 4 (TSP) achieved turbidity of 93 NTU atTSP in fiber beds prepared by the double- ri = 1.0 and 901 NTU at ii = 3.0. Allshredded method, possibly because TSP also conditions other than buffer chemical werehas properties that result in it being used as a identical.surfactant and a detergent.
3 Fiber debris beds with Nukon are highly Based on measured bed thickness inporous. Based on the densities of silica and numerous tests.the debris beds, the porosity of fiber debrisbeds ranges from 95 to 98.5 percent.
Document No: CHLE-008, Rev 4 Page 5 of 24

Title: Debris Bed Preparation and Formation Test Results
4 The NEI fiber preparation method results in Fiber was added in increments in Tests 2 andvery consistent debris beds. Incremental 5. Not only did the tests individually displayadditions of fiber result in a linear increase in linear results, but the data matched wellbed thickness and head loss. Repeated tests between tests. See Figures 6, 7, and 8.resulted in similar increases in bed thickness Addition of WCAP precipitates in Tests 6and head loss. and 8 also matched well. See Figure 11.
5 The blender method results in less consistent After a threshold quantity of fiber wasdebris beds. The increase in head loss with introduced into the colunm, the head lossadditions of debris was non-linear. In through the fiber-only bed increased rapidlyaddition, changing the approach velocity and to over 50 inches at both 0.1 and 0.01 ft/s,returning it to the original velocity resulted in see Figures 14 and 15. The increase in headsignificant increases in head loss. loss caused by cycling the velocity low and
high was as much as 80 percent, see Figure16.
6 The NEI and blender fiber preparation See Tests 6 and 8 for WCAP addition to themethods are both highly effective at NEI preparation and Tests 11 and 12 forcapturing WCAP precipitates. The blender WCAP addition to the blender preparation.method generates high head loss with lower The head loss spiked after 4 grams ofquantities of WCAP precipitates when they addition for the NEI preparation, whereas theare introduced directly into the head loss head loss spiked after only 1 gram for thecolumn. blender preparation.
7 The addition of WCAP precipitate in small See Figures 9 and 10.increments results in non-linear head lossbehavior. The first additions, if small, canresult in small increases in head loss. Once athreshold quantity that coats the leadingsurface of the bed is reached, however, headloss increases rapidly until the test must beterminated.
8 The addition of WCAP precipitate into the See Test 13 for WCAP addition to the tankCHLE corrosion tank at high temperature for the NEI preparation and Test 14 forresults in head loss at the head loss columns. WCAP addition to the tank for the blenderRapid head loss increase was observed after preparation. 90 g of WCAP was added to thea threshold amount of WCAP precipitate was NEI prepared tests and 50 g of WCAP waspresent in the tank. The threshold amount added to the blender prepared tests beforewas lower when the blender preparation head loss spiked.method was used than it was when the NEIprocedure was used, but the difference wasless substantial than in the column tests.Furthermore, the behavior of the 3 columnswas more consistent when the NEI debrispreparation was used than when the blendermethod was used.
Document No: CHLE-008, Rev 4 Page 6 of 24
Title: Debris Bed Preparation and Formation Test Results
Conclusions and Plans for Debris-Bed Formation for 30-Day Tests
Numerous tests demonstrated that the NEI-prepared fiber beds were ineffective at retainingsilicon carbide particles. Because of the importance of having a debris bed that is stable over along period of time (30 days), it was decided to conduct the 30 day tests with fiber-only beds.This decision was reviewed with NRC staff during a telephone conference on May 30, 2012.
Alternative bed preparations that were studied for retention of WCAP precipitates included theNEI-protocal (pressure-washer) and 25-s blended fiber suspended in a water slurry. The blendedmaterial exhibited significant visual size uniformity when viewed on a light table and veryregular bed thickness when introduced to the columns. However, the increased fraction of shards(broken glass fibers) created by mechanical blending destroys the tensile strength of the fiber bedand introduces somewhat erratic sensitivity to small perturbations in flow. The 3 replicateblended beds exhibited somewhat greater variation in head loss response compared to the 3 NEI-prepared beds. This is attributed to random variations in the configuration of glass shardsbetween the beds. It is conjectured that glass shards easily compact (spatially reconfigure) inresponse to minor changes in flow leading to both variation in initial conditioning and variationin the response times under product accumulation. Blended material exhibits rapid head loss risesas the beds compress. Spatial reconfiguration (compaction) cannot be recovered after reducingthe flow.
Tests that used direct introduction of WCAP precipitate in the head loss columns and bulkmixing of surrogate in the large-volume CHLE tank exhibited significant head-loss responsesafter introducing less than 20 percent of the WCAP total prediction for the STP containment.Very small increments of WCAP surrogate were observed to initiate a small increase in headloss, indicating sufficient sensitivity in the NEI fiber bed without particulates for detecting freelymigrating chemical products having similar properties. Fully formed beds used in these testscontained 18 g of fiberglass forming a bed thickness of approximately 2 inches.
It was concluded that fiber debris beds formed with the NEI preparation procedure that retainsignificant internal tensile strength will provide a more stable basis for tracking long-term trendsand a more robust substrate for accommodating unforeseen flow perturbations during the courseof the 30-day tests, and are therefore recommended for the 30-day tests.
Details of the individual tests that support these conclusions are described in the followingsections.
Test 1: Nukon fiber, silicon carbide particles, RO-treated water
Date: 22 May 2012
Conditions: Nukon fiber prepared according to the NEI protocol, added to the head loss columnin multiple batches, starting with 60 g of fiber and added in 20 g batches until 140 g was reached.After 140 g of fiber was in the bed, 70 g of silicon carbide (SiC) particles was added. Head loss
Document No: CHLE-008, Rev 4 Page 7 of 24

Title: Debris Bed Preparation and Formation Test Results
was measured at a target approach velocity of 0.1 ft/s (actual about 0.093 ft/s) and at 0.010 ft/s.Recirculating water was deionized by reverse osmosis.
Results: Additions of fiber in 20 g increments led to uniform increases in head loss at both0.093 and 0.01 ft/s, although the intercept did not pass through zero (see Figures 1 and 2 below).Water turbidity declined slightly with each addition of fiber (starting at 2.6 NTU and declining to2.1 NTU after 140 g of fiber were in the column), indicating that the fiber bed was probablyfiltering some particles from the water. After SiC was added and the water was allowed tocirculate for 10 minutes, the turbidity was measured at 162 NTU. After an additional 20minutes, the turbidity was measured at 97 NTU, indicating that the fiber bed was removing someof the SiC carbides, but very slowly. After the SiC was added, the head loss stabilized at 30.5inches, compared to 26.2 inches with fiber only (at a velocity of 0.093 ft/s), an increase in headloss of 16%.
30y = 0.2285x - 5.527
U 25 ---2015-__ __ _ __.
o15
0
Z04
0 20 40 60 80 100 120 140 160
Fiber quantity (g)
Figure 1: Head loss at approach velocity of about 0.093 ft/s with RO-treated water as thecirculating fluid.
2.5
A I
•1.5
S1.0
~y 0.57ý5 - 1.5 _ -87
0.0 -0 20 40 60 80 100 120 140 160
Fiber quantity (g)
Figure 2: Head loss at approach velocity of 0.010 ft/s with RO-treated water as thecirculating fluid.
Document No: CHLE-008, Rev 4 Page 8 of 24

Title: Debris Bed Preparation and Formation Test Results
Test 2: Nukon fiber, silicon carbide particles, water with H3BO3/TSP
Date: 23 May 2012
Conditions: Same experimental procedures as Test 1, except that boric acid = 2,680 mg/L as Band TSP = 3,370 mg/L was added to the RO water. The boric acid and TSP were added directlyto the water in the column.
Results: Additions of fiber in 20 g increments led to uniform increases in head loss at approachvelocities of both 0.093 and 0.01 ft/s, similar to Test 1. Two differences between this test andTest 1, however, were that the overall head loss was lower in this test (with 140 g of fiber, Test 2had 17.3 inches of head loss compared to 26.2 inches in Test 1), and the intercept of theincreasing head loss trend was close to zero (see Figures 3 and 4).
The increase in bed thickness was also relatively linear with additions of fiber, as shown inFigure 5.
The initial turbidity before adding any chemicals to the water was 0.74 NTU. After chemicalswere added and the water circulated for a time, the turbidity was 3.0 NTU. The turbiditydeclined gradually as additional batches of fiber were added, reaching 2.0 NTU after 140 g offiber was added. After SiC was added and the water was allowed to circulate for 10 minutes, theturbidity was measured at 417 NTU.
Test 3: Double-shredded Nukon fiber, sodium tetraborate as buffer
Date: 25 May 2012
Conditions: Nukon fiber and silicon carbide particles from Alion's facility in Warrenville, ILwere used. The fiber was shredded twice with a common leaf shredder by Alion. The fiber wasboiled in RO water in a beaker at UNM, the fiber was allowed to settle and the RO water wasdecanted and replaced with water containing boric acid and sodium tetraborate. 18 g of SiC wasplaced in the column first, followed by 18 g on Nukon fiber (11 = 1). After 40 minutes ofcirculation, 36 g of additional SiC was added (rl = 3). The water circulating in the column wasdeionized by RO with boric acid and sodium tetraborate added.
Results: After 18 g of SiC was added to the column, the turbidity was measured at 845 NTUand no detectible head loss was measured. Shortly after 18 g of Nukon fiber was added, the headloss was 3.27 inches and the turbidity was measured at 179 NTU. After 40 minutes ofcirculation, the head loss had increased to only 3.48 inches, but the solution in the column wasvisibly relatively clear and the turbidity was measured at 54.2 NTU. Shortly after 36 g ofadditional SiC was added, the head loss increased to 3.63 inches and the turbidity increased to
Document No: CHLE-008, Rev 4 Page 9 of 24

Title: Debris Bed Preparation and Formation Test Results
996 NTU. After 45 minutes of additional circulation, the head loss had increased to only 3.75inches and the turbidity was still 512 NTU.
Test 4: Double-shredded Nukon fiber, TSP as buffer
Date: 25 May 2012
Conditions: The same as Test 3 except with TSP instead of sodium tetraborate as the buffer.
30
25
S20 - -____
m 1.2 10 -. . . . . . .. .
M y = 0.1282x- 0.669- R' = 0.9987
0 - - --0
0 20 40 60 80 100 120 140 160
Fiber quantity (g)
Figure 3: Head loss at approach velocity of about 0.093 ft/s with water containing boricacid and TSP as the ciculating floid.
2.5
0r 2.
71.5 4--______ _____---------y = 0.0145x + 0.008
IA R' 0.978&A 1.0
0 .5 ----- ----- ----- ----------
0 20 40 60 80 100 120 140 160
Fiber quantity (g)
Figure 4: Head loss at approach velocity of 0.010 ft/s with water containing boric acid andTSP as the circulating fluid.
Document No: CHLE-008, Rev 4 Page 10of24Document No: CHLE-008, Rev 4 Page 10 of 24

Title: Debris Bed Preparation and Formation Test Results
10
,, y= 0.0475x + 0.9R' 0.9810
0 20 40 60 80 100 120 140 160
Fiber quantity (g)
Figure 5: Bed thickness at approach velocity of 0.010 ft/s with water containing boric acidand TSP as the circulating fluid.
Table 1: Head loss and turbidity in Tests 3 and 4
Head loss (inches) Turbidity (NTU)Test 3 Test 4 Test 3 Test 4
After fiber and 18 g SiC added 3.27 3.37 179 23240 minutes later 3.48 3.41 54 93After 36 g additional SiC added 3.63 3.82 996 107345 minutes later 3.75 5.84 512 901
Results: Overall, the fiber bed did not remove particles as well when TSP was used as a bufferinstead of NaTB. The head loss was nearly the same but the turbidity was higher in Test 4. Acomparison of Tests 3 and 4 is shown in Table 1.
Test 5: Nukon fiber, no particles, AIOOH (WCAP) precipitate
Date: 29 May 2012
Conditions: Nukon fiber was prepared with the NEI protocol. No silicon carbide particles wereadded. Precipitates were prepared according to the instructions for AIOOH in WCAP-16530-NP. The water circulating in the column was deionized by RO with boric acid and TSP added.Fiber was added in 20 g increments until 100 g of fiber was in the column to validate the headloss and bed depth trends from Test 2. During the addition of the fiber, the head loss wasrecorded at approach velocities of 0. 1 and 0. 01 fi/s, and the bed thickness was recorded at anapproach velocity of 0. 1 ft/s.
The amount of A1OOH prepared for this test was 107 g. This amount was based on the totalamount of aluminum precipitates calculated to occur in STP containment (by WCAP-1I6530-NPcalculations) times the ratio of the volume of water the STP containment during a LOCA (71,700
Document No: CHLE-008, Rev 4 Page 11 of 24

Title: Debris Bed Preparation and Formation Test Results
ft3) to the volume of water in the CHLE tank (33.4 fi3), divided by 3 to account for the fact thatthe CHLE system has 3 parallel head loss columns. The WCAP precipitate was added slowlywhile the column was running at an approach velocity of 0.1 fl/s.
Results: The incremental addition of fiber in Test 5 produced head loss and bed thicknessresults very similar to Test 2. At an approach velocity of 0.1 fl/s, the corresponding head loss inTest 2 was about 85 to 90 percent of the corresponding head loss in Test 5, as shown in Figure 6.However, Test 2 was conducted at an approach velocity of about 0.093 ft/s, whereas Test 5 wasconducted at 0.1 ft/s. Considering the difference in approach velocity in the two tests, the resultsare very similar. Nearly identical head loss results were obtained at an approach velocity of 0.01ft/s, as shown in Figure 7. The slope of the linear trend of head loss with fiber addition isvirtually identical in Tests 2 and 5 at 0.01 fl/s, and the intercept varies by only 0.15 inches.Similarly, nearly identical bed thickness results were obtained in the two tests, as shown inFigure 8.
Bed density can be calculated from the Fiber beds with 60 g or more of fiber have a densitynearly identical to that of standard Nukon blankets (2.4 lb/fl3). Bed density is calculated from
PB = - -
BV
where PB = bed density, Ms is the mass of the substrate (fiberglass), and VB is the volume of thebed. Fiber beds in Test 5 with less fiber (20 or 40 g of fiber) had less dense beds (1.35 lb/fl3 forthe 20 g bed and 1.80 lb/fl3 for the 40 g bed), indicating that some head loss was necessary toprovide compression to compress the bed to the thickness comparable to the Nukon blankets.The bed porosity is calculated from
vv1 VSPS=v =1-vs -1 PB,
vB VB Pswhere F = porosity, Vv = void volume, Vs = substrate volume, and ps = substrate density(Ms/Vs). Assuming that Nukon is primarily silica with a substrate density of 165 lb/ft3, a beddensity of 2.4 lb/ft3 corresponds to a porosity of 98.5 percent. A fiber bed with that porositycannot be expected to efficiently remove hard particles like silicon carbide.
The thicker beds in Tests 2 and 5 were observed to expand at the lower approach velocity. Theincrease in bed thickness ranged from 0.25 to 0.75 inches. In addition, when the approachvelocity was returned to the higher value, the bed settled into a more compressed position than itwas before the approach velocity was reduced. It was also observed that the head loss increasedto a greater value when the approach velocity was returned to 0.1 ft/s after being reduced to 0.01ft/s, although the head loss only increased by 3 to 5 percent. This trend was observed in bothTests 2 and 5.
The addition of the WCAP precipitate caused an almost immediate (within one minute) increaseof head loss to greater than 90 inches. As the head loss approached that value, the support screenbent and snapped out of place, dumping the debris bed and all the captured precipitates to thebottom of the column. At the time when the support screen collapsed, only a portion of theWCAP precipitate had been added.
Document No: CHLE-008, Rev 4 Page 12 of 24Document No: CHLE-008, Rev 4 Page 12 of 24

Title: Debris Bed Preparation and Formation Test Results
20ZZ
1Test2 y 0.1427x -0.669
*est5210 - ----- -
0 5-
"a
0 20 40 60 80 100 120 140 160
Fiber quantity (g)
Figure 6: Head loss at approach velocity of 0.093 ft/s in Test 2 and 0.1 ft/s in Test 5.
2.5
ýr 2.0 Aq.O
,M 1Test 2q •#Test 5
V ' R'= 0.970010
*0
0.5 -- ---
0 20 40 60 80 100 120 140 160Fiber quantity (g)
Figure 7: Head loss at approach velocity of 0.01 ft/s in Tests 2 and 5.
1 -0... . . . . . . . .
*Test 2 Y = 0.0475x + 0.9.R R ' 0 .9 8 1 - -MU 1 #Test 5
4E- y5 = 0.04x + 1.25
Ca
0 20 40 60 80 100 120 140 160
Fiber quantity (g)
Figure 8: Fiber bed thickness at approach velocity of 0.1 ft/s in Tests 2 and 5
Document No: CHLE-008, Rev 4 Page 13 of 24

Title: Debris Bed Preparation and Formation Test Results
Test 6: Nukon fiber prepared by NEI protocol, WCAP precipitate
Date: 30 May 2012
Conditions: Because the head loss increased so rapidly and the support screen collapsed withinone minute in Test 5, this test was devised to determine the threshold for head loss with smalleradditions of WCAP precipitate, with a smaller fiber debris bed, and at a lower approach velocity.The fiber debris bed was prepared with 18 g of Nukon fiber prepared with the NEI protocol. Theapproach velocity was set to 0.01 ft/s. The water circulating in the column was deionized by ROwith boric acid and TSP added. The precipitate was prepared with 10 g of WCAP precipitate(prepared according to the instructions for AIOOH in WCAP- 16530-NP) in 1 L of watercontaining boric acid and TSP. The precipitate was added in 0.1 L increments, corresponding toI g of WCAP precipitate in each addition. These 1 g additions each correspond to a loading of0.0112 lb/ft2 (lb of precipitate per ft2 of screen surface area). For comparison, the WCAPcalculations for STP predict 1,510 lbs (685.2 kg) of aluminum-based precipitates (AIOOH andNaAlSi 3O8 ) to be loaded onto 5,450 ft2 of screens (1815.5 ft2 x 3), resulting in a total loading of0.277 lb/ft2 . Thus, each addition of WCAP precipitate in this test is comparable to 1/25th of theprecipitate predicted to load the STP screens by the WCAP calculations, assuming 3 trains inoperation.
Results: Measured head loss increased only slightly after the first 3 additions of WCAPprecipitate. Head loss was more significant after the 4th addition, and the next two additionsconsisted of only 0.5 g of WCAP precipitate each, but head loss increased rapidly after each.The head loss trend during the test is shown in Figure 9.
Test 7: Nukon fiber prepared by NEI protocol, WCAP precipitate
Date: 31 May2012
Conditions: This test is a repeat of the same conditions as Test 6.
Results: The test was terminated after 0.5 g of precipitate was added because the head lossstopped rising. The assumption at the time was that the bed developed a borehole that allowedwater to bypass the bed, but later (Test 9) it was discovered that the differential pressure cell onthe head loss column ceased functioning properly.
Document No: CHLE-008, Rev 4 Page 14 of 24

Title: Debris Bed Preparation and Formation Test Results
100
802~ - -... ......
80
60
U,
. Fiber added at 0.1 ft/s 5 g ppt"• 4 0 + ....... . . .. . ........... . .....
40
x •Velocity changed to 0.01 ft/s
1 g ppt added
20 -- gp - -
3gpp 4gpp 4.5gppt
1:00 PM 1:30 PM 2:00 PM 2:30 PM 3:00 PM 3:30 PM 4:00 PM 4:30 PM 5:00 PM
Time
Figure 9: Head loss after addition of lg increments of WCAP precipitate (Test 6)
Test 8: Nukon fiber prepared by NEI protocol, WCAP precipitate
Date: 31 May2012
Conditions: This test is a repeat of the same conditions as Test 6, but using a different column.
Results: The results were similar to Test 6. Measured head loss increased only slightly after thefirst 3 additions of WCAP precipitate. Head loss started to creep up after the 4th addition, andincreased rapidly after the 5th and 6th additions. The head loss trend during the test is shown inFigure 10 and a comparison of the head loss resulting from each addition in Tests 6 and 8 isshown in Figure 11. The results from Tests 6 and 8 demonstrate reproducibility.
Test 9: Nukon fiber prepared in blender
Date: 01 June 2012
Conditions: Nukon fiber prepared by baking one side on a hot plate (NEI protocol), but insteadof disaggregating with a pressure washer, the fiber was blended in a blender for 25 seconds onthe "chop" setting. Fiber was added to the head loss column in multiple batches, starting with 20g of fiber and added in 20 g batches until 100 g was reached. Head loss was measured at targetapproach velocities of 0.10 ft/s and at 0.010 ft/s. The water circulating in the column wasdeionized by RO with boric acid and TSP added.
Document No: CHLE-008, Rev 4 Page 15 of 24

Title: Debris Bed Preparation and Formation Test Results
100
80
6gl
a,U
InIn0
IIa,=
60 4
40
Fiber added at 0.1 ft/s at 3:11 PM
Velocity changed to 0.01 ft/s
1 g pDt added at 3:39 PM
5
202 3gpp t20 - - --jtl" °
3:00 PM 3:30 PM 4:00 PM 4:30 PM 5:00 PM 5:30 PM 6:00 PM
Time
Figure 10: Head loss after addition of 1g increments of WCAP precipitate (Test 8)
6:30 PM
70
60
50 -
.S 40IA0
- 30
x 20
a- *st- sTest 6
10
0 --4-
0 1 2 3 4 5 6WCAP Precipitate (g)
Figure 11: Comparison of head loss after additional of WCAP precipitate in Tests 6 and 8.
Results: Head loss increased with each batch of fiber added. After 60 g of fiber was addedhowever, the head loss stopped increasing at a value of 12.3 inches. Thus, the test wasterminated and a new test (Test 10) was started. The results of this test are discussed with theresults for Test 10.
Document No: CHLE-008, Rev 4 Page 16of24Document No: CHLE-008, Rev 4 Page 16 of 24

Title: Debris Bed Preparation and Formation Test Results
Test 10: Nukon fiber prepared in blender
Date: 01 June 2012
Conditions: This test is a repeat of the same conditions as Test 9.
Results: The fiber prepared in a blender resulted in debris beds with substantially more headloss than fiber prepared by pressure washing. The pressure-washed fiber beds were much thickerthan the blendered fiber beds, as shown in Figures 12 and 13. The blendered fiber beds were lessreproducible and did not result in a linear relationship between fiber amount and head loss (seeFigures 14 and 15). The head loss increased rapidly as the fiber amount increased, reaching over50 inches of head loss with a 60 g fiber bed at 0.1 ft/s approach velocity, and over 50 inches ofhead loss with a 100 g fiber bed at 0.01 ft/s approach velocity.
The head loss through the beds changed significantly in response to changes in flow. Decreasingthe flow from 0.1 ft/s to 0.01 ft/s, and increasing again to 0.1 ft/s caused substantially more headloss, as reflected in Figure 16. This increasing head loss is probably due to a rearrangement ofthe fibers that decreased bed thickness (a decrease in bed thickness by about 1/8-inch was alsonoted). While an increase in head after changing flow was observed with NEI pressure-washedbeds, the effect was slight compared to blendered beds. The increase in head loss after changingthe flow averaged less than 5 percent in both Test 2 and Test 5, but was dramatic in Test 10.I
(a) (b)Figure 12: Photographs of fiber beds with 18g of fiber at 0.1 ft/s approach velocity (a)prepared with NEI pressure-washer method and (b) prepared in a blender.
Document No: CHLE-008, Rev 4 Page 17 of 24
Title: Debris Bed Preparation and Formation Test Results
7
sA5
a)C
0
0Test 2
A Test 5
ITest 9
*Test 10
Pressure-washed (NEI)
.-A
Blender
20 40 60
Fiber quantity (g)
An 100 120
Figure 13: Fiber bed thickness at approach velocity of 0.1 ft/s in NEI pressure-washed fiberbeds (Tests 2 and 5) and fiber blended beds (Tests 9 and 10)
605 Test 9
.S #Testl10S40
30
m 20 4 -
0~- 10 -- , - - -----x 0
0 10 20 30 40 50 60 70
Fiber quantity (g)
Figure 14: Head loss at approach velocity of 0.1 ft/s in fiber beds prepared with a blender(Test 9 and 10).
70 T6 Test 96 0 .......... ..... .....
C *Testl10
50
4 0
30
M 0 = .... ..... ... ... = ...... ... .. .. ...0 20 40 60 80 100 120
Fiber quantity (g)
Figure 15: Head loss at approach velocity of 0.01 ft/s in fiber(Tests 9 and 10).
beds prepared with a blender
Document No: CHLE-008, Rev 4 Page 18 of 24Document No: CHLE-008, Rev 4 Page 18 of 24

Title: Debris Bed Preparation and Formation Test Results
90
80 __ 60 g fiber after lowering v to 0.01 ft/s -band returning to 0.1 ft/s
70
60 g fiber at 0.1 ft/s~60
U,
(A 40 40 g fiber after lowering v to 0.01 ft/si and returning to 0.1 ft/s
3' 3040 g fiber at 0.1lft/s
Dae:04ue21
10-
3:00 PM 3:30 PM 4:00 PM 4:30 PM 5:00 PM 5:30 PMTime
Figure 16: Head loss in Test 10 with fiber bed prepared with a blender.
Test 11: Nukon fiber prepared by blender, exposed to WCAPprecipitates
Date: 04 June 2012
Conditions: An 18 g fiber bed prepared in a blender was introduced into a head loss column.WCAP precipitate was added in 1 g batches using identical procedures to Test 8. This testprovides a comparison of the NEI and blender fiber preparation methods with WCAP precipitate.
Results: After the first batch (1 g) of WCAP precipitate was added, the head loss rapidlyclimbed above 100 inches and the test was terminated. As the head loss exceeded 80 inches, asudden drop in head loss occurred, indicating bypass of water through the bed (often described asa borehole). The head loss is shown in Figure 17. After the test was terminated and the columndraining was in progress, water was not observed pouring through any perforations in the bed butwas observed running at the wall of the column. Thus, the bypass through the column appears tohave occurred at the interface between the bed and the column wall.
Test 12: Nukon fiber prepared by blender, exposed to WCAPprecipitates
Document No: CHLE-008, Rev 4 Page 19 of 24

Title: Debris Bed Preparation and Formation Test Results
Date: 04 June 2012
Conditions: Test 12 was a repeat of Test 11.
120
100
8o
40
V
20
0 4---10:30 AM
1 g ppt addedWater observed runningdown column wall aftertest was complete.
12:00 PM11:00 AM 11:30 AM
Time
Figure 17: Head loss in Test 11 with fiber bed prepared with a blender and addition ofWCAP precipitate.
Document No: CHLE-008, Rev 4 Page 20 of 24

Title: Debris Bed Preparation and Formation Test Results
120
100 __ __ __ __
a,a
1U
1 60
40
1 g ppt added
20 -- .....
1:30 PM 2:00 PM 2:30 PM 3:00 PM
Time
Figure 18: Head loss in Test 12 with fiber bed prepared with a blender and addition ofWCAP precipitate.
Results: The results were essentially a repetition of Test 11, except that the fiber bed bypass didnot occur. The head loss is shown in Figure 18. The results of Tests 11 and 12 demonstrate thatthe blendered bed is more sensitive to the presence of WCAP precipitates than the NEIpreparation under these conditions.
Test 13: Nukon fiber prepared by NEI procedure, exposed to WCAP
precipitates at high temperature from the corrosion tank
Date: 04 to 05 June 2012
Conditions: An 18 g fiber bed prepared with the NEI protocol was introduced into each of the 3head loss columns. The approach velocity was set to 0.01 ft/s using a gear pump at each column.The flow to each column was recirculated at that velocity and room temperature overnight (about16 hours). The corrosion tank was filled with water deionized by RO with boric acid and TSPadded and heated to 165 'F (74 °C). This temperature was selected because it corresponds to thetemperature at the first possible point of precipitation at the STP plant based on the WCAPcalculations. Since the WCAP is a conservative procedure, it was determined to be the highestpossible temperature at which precipitation can occur. The heated water from the tank was thendirected to the three head loss columns by opening valves. After the heated water was allowed tocirculate through the head loss column for an hour, batches of WCAP precipitate were
Document No: CHLE-008, Rev 4 Page 21 of 24Document No: CHLE-008, Rev 4 Page 21 of 24

Title: Debris Bed Preparation and Formation Test Results
introduced into the corrosion tank and allowed to mix thoroughly into the corrosion tank water.The corrosion tank has a pump that withdraws water, pumps it through external piping, andreintroduces it through a distribution header to keep the liquid in the corrosion tank well mixed.The supply piping for the head loss column is connected to the corrosion tank external piping.The WCAP precipitate was added in 30 g increments. The tank and columns contained 1,030 Lof water, so each addition of WCAP precipitate corresponded to an addition concentration of 29mg/L of precipitate.
Results: Between 7:00 PM on 4 June and 8:00 AM on 5 June (13 hours), the head loss througheach of the 3 debris bed changed by less than 0.2 inches, indicating debris beds that were stableover time. It should be noted, however, that the head loss through an 18-g NEI-prepared fiberbed at 0.01 ft/s approach velocity is virtually zero.
After the hot,'borated, buffered water was introduced into the head loss colunms, the dP signalfor the head loss columns became more variable. One of the dP cells was replaced and the signalbecame more reliable. After that, the high-side pressure line was purged on the other dP cellsand they became more stable. It appears that the introduction of hot water into the columns mayentrap air in the dP cell lines that cause instrument noise, but that purging the lines solves theissue.
WCAP precipitates were introduced in 3 batches, at 10:05 AM, 10:44 AM, and 11:52 AM. Noincrease in head loss was evident after the first two batches. The head loss started increasing inall three columns shortly after the third batch was introduced, as shown in Figure 19. Threebatches of WCAP precipitate corresponds to a concentration of 57 mg/L of A1OOH in the CHLEcorrosion tank, which would form from 25 mg/L of aluminum ions in solution. For comparison,the WCAP calculations for the STP plant predict the formation of 337 mg/L of precipitates(A1OOH and NaAlSi 308 combined). Thus, the NEI bed formation procedure is able to detectWCAP precipitates in the CHLE corrosion tank at concentrations considerably lower than thelevels predicted to occur in the STP plant by the WCAP calculation procedure.
The head loss in the 3 columns followed the same trend in terms of increasing head loss, butcolumn 3 increased earlier than the other two (by about 20 minutes). This difference in responsetime could be because of natural variability in bed formation and capture of precipitates, or itcould be because of minor hydraulic differences in the supply piping. A piping modification isgoing to be implemented to ensure that all three columns receive the same flow. Regardless ofthe slight difference in response time, the similarity in the response by all 3 columnsdemonstrates that the debris beds are reproducible and reliable for detecting WCAP precipitates.
The first batch of WCAP precipitate resulted in a concentration below the solubility limit foraluminum hydroxide at the temperature of the test, so it was not known whether the precipitateswould dissolve upon being added to the hot water. The turbidity was measured periodically andconfirmed that the precipitates did not dissolve after they were fonned within the timeframe ofthe experiment. The turbidity during the test is shown in Figure 20. A separate bench test afterthe experiment also confirmed that the WCAP precipitates do not rapidly (within the time frameof interest in these tests) dissolve in hot water after they are formed.
Document No: CHLE-008, Rev 4 Page 22 of 24

Title: Debris Bed Preparation and Formation Test Results
90
-Column 1 -Column 2 -Column 380 +
70
An
C 50
-240 -
M)
20
dP cell changed
61
30 g ppt
90 g ppt
10, \
0 1ý9:00 AM 10:00 AM 11:00 AM 12:00 PM 1:00 PM 2:00 PM
Time
Figure 19: Head loss in Test 13 and 3 fiber beds prepared with the NEI procedure andWCAP precipitates added to the CHLE corrosion tank at 174 OF.
50
+'3 40Z30
•20
10l
Batch 2 Batch 3
9:57 AM 10:12 AM 10:38 AM 11:18 AM 12:49 PM11:55 AM
Time
Figure 20: Turbidity in Test 13 and 3 fiber beds prepared with the NEI procedure andWCAP precipitates added to the CHLE corrosion tank at 174 IF.
Document No: CHLE-008, Rev 4 Page 23 of 24

Title: Debris Bed Preparation and Formation Test Results
Test 14: Nukon fiber prepared by blender, exposed to WCAPprecipitates at high temperature from the corrosion tank
Date: 06 to 07 June 2012
Conditions: Test 14 was essentially a repeat of Test 13, except that the fiber beds were preparedby blender instead of the NEI protocol. Therefore, Tests 13 and 14 provide a comparison offiber preparation methods for detecting WCAP precipitates in the CHLE corrosion tank.Because of problems with leaking head loss columns, the debris beds were prepared the morningof testing instead of the night before.
Results: Based on the expectation that the WCAP precipitate would cause a more rapid increasein head loss with the blended fiber bed than the NEI fiber bed (see Tests 11 and 12 compared toTests 6 and 8), the WCAP precipitate was added in smaller batches than in Test 13. The first 4batches were added in 7.5 g quantities and no significant increase in head loss was observed.The next batch added 20 g to the CHLE corrosion tank and a rapid increase in head loss wasobserved, as shown in Figure 21. The increase in head loss occurred when 50 g of WCAPprecipitate had been added to the CHLE corrosion tank, which was less than when the NEI fiberpreparation procedure was used, but not as significant as when the WCAP precipitates wereadded directly to the head loss columns at room temperature. In addition, the performance of the3 columns was not as consistent as it was for the NEI fiber beds. In the NEI fiber bed test, thehead loss increased in a very similar fashion in all 3 columns, whereas in this test, one of thecolumns (Column 2) appeared to develop a "bore hole" that cause the head loss to level off atabout 45 inches of head, whereas the head continued to increase in the other two columns.
80 -.. . -----------.. . . . . . .
- Column 1 - Column 2 - Column 370~
60 -__ __-
.50 __
40
"M 50 gppt30 -
230 g ppt20 '10 -4 7.5 t. 15 g ppt 22.5 g ppt _
I 010:00AM 11:00AM 12:00PM 1:00PM 2:00 PM 3:00 PM 4:00 PM 5:00 PM 6:00 PM
Time
Figure 21: Head loss in Test 14 with 3 fiber beds prepared in blender and WCAPprecipitates added to the CHLE corrosion tank at 174 'F.
Document No: CHLE-008, Rev 4 Page 24 of 24