atomics pectroscopy - · pdf filek. hoppstock, j.s. becker, and h.-j. dietze.....180 fast hg...
TRANSCRIPT

In This Issue:
Analysis of Lead (Pb) in Antacids and Calcium Compoundsfor Proposition 65 ComplianceRuth E. Wolf.................................................................................................169
Determination of Low Concentrations of U and Th in Carbonate Rocks Using FI-ICP-MSLudwik Halicz, Miryam Bar-Matthews, Avner Ayalon, and Aharon Kaufman .................................................................................175
Assessment of the Determination of 79Selenium Using Dou-ble-Focusing Sector Field ICP-MS After Hydride GenerationK. Hoppstock, J.S. Becker, and H.-J. Dietze...............................................180
Fast Hg Determination in Biological Samples by ICP-MSUsing Minitube Furnace Catalytic Combustion (MFCC)Norbert Miekeley and Milene Oliveira Amato .........................................186
The Determination of Rare Earth Elements in Plant Foods by ICP-MSHua Zhou and Jianghui Liu ........................................................................192
The Determination of Trace Cadmium by Flow Injection Cold Vapor Generation AASMeiying Liu and Shukun Xu .......................................................................195
ETAAS Determination of Lead with On-line PreconcentrationUsing a Flow-through Electrochemical MicrocellEwa Bulska and Wojciech Jçdral................................................................202
Highlights:
• Accuracy and precisionfor low Pb detectionwith ICP-MS
• FI-ICP-MS determinationof U and Th using Tl asinternal standard
• Ultratrace determinationof Se by hydride genera-tion ICP-MS
• Solid sampling devicefor ICP-MS determina-tion of Hg
• ICP-MS determination of REEs in plant foodsusing microwave ovendigestion
• FI-CVAAS determinationof Cd in biological, soiland tap water samples
• ETAAS determination of Pb in analytical gradereagents using on-lineelectrodeposition
• Announcements
ASPND7 18(6) 169–206 (1997)ISSN 0195-5373
AtomicSpectroscopy
November/December 1997 Volume 18, No. 6
e

EditorAnneliese Lust
Technical EditorsFrank F. Fernandez, AASSusan McIntosh, ICPEric R. Denoyer, ICP-MS
SUBSCRIPTION INFORMATION:Atomic SpectroscopyP.O. Box 557Florham Park, NJ 07932 USAFax: 973-822-9162
1998 Subscription Rates• U.S. $49.00 includes third classmail delivery worldwide.• U.S. $75.00 for foreign subscriberswishing airmail delivery.• Check must be drawn on a U.S.bank in U.S. funds and made out to:
“Atomic Spectroscopy”
Back Issues/Claims• Single back issues are availableat $10.00 each.• Subscriber claims for missingback issues will be honoredat no charge within 90 daysof issue mailing date.
Address Changes to:Atomic SpectroscopyP.O. Box 557Florham Park, NJ 07932 USA
Copyright © 1997The Perkin-Elmer Corporation.All rights reserved.
Microfilm of Atomic Spectroscopy issues are available from:University Microfilms International300 N. Zeeb RoadAnn Arbor, MI 48106 USATel: 800-521-0600 (within the U.S.)or: 313-761-4700
Atomic Spectroscopy serves asa medium for the disseminationof general information togetherwith new applications and ana-lytical data in atomic absorptionspectrophotometry and its relateddisciplines of atomic fluores-cence, atomic emission, andICP-mass spectrometry.
The pages of Atomic Spectro-scopy are open to all workersin the field of atomic spectro-scopy. There is no charge forthe publication.
The journal has around 3500subscribers on a worldwide basis,and its success can be attributedto the excellent contributions ofits authors as well as the technicalguidance of its reviewers and theTechnical Editors.
Please submit manuscriptsto the address below in thefollowing manner:
1. Triplicate, double-spaced.2. Include abstract for articles.3. Number the references
in the order they are citedin the text.
4. Include bibliography.5. Submit original drawings
or glossy photographs andfigure captions.
6. Consult a current copyof Atomic Spectroscopyfor format.
All manuscripts are sentto two reviewers. If there isdisagreement, a third revieweris consulted.
Minor changes in style aremade in-house and submittedto the author for approval.A copyright transfer is sentto the author for signature.
If major changes are requiredbefore publication can be con-sidered, the paper is returnedto the author(s) with the review-ers’ comments.
In the interest of speed ofpublication, galley proofs arenot sent to the author(s). Afterpublication, the senior authorwill receive 50 complimentaryreprints of the article.
Additional reprints can be pur-chased, but the request must bemade at the time the manuscriptis approved for publication.
Anneliese LustEditor, Atomic SpectroscopyThe Perkin-Elmer Corporation761 Main AvenueNorwalk, CT 06859-0219 USA
Guidelines for Authors
Perkin-Elmer and HGA are registered trademarks and
AutoLens and FIAS are trademarks of The Perkin-Elmer
Corporation.
SCIEX and ELAN are registered trademarks of SCIEX, a
division of MDS Health Group Limited.
Amberlite is a registered trademark of Sigma USA.
AnalaR is a registered trademark of BDH Laboratory
Supplies, UK.
ELEMENT is a registered trademark of Finnigan MAT.
Epson is a registerd trademark of Seiko Epson Corporation.
MEINHARD is a registered trademark of J.E. Meinhard
Associates Inc.
MEGA is a registered trademark of Milestone S.r.l.
Milli-Q is a trademark of Millipore Corporation.
The Perkin-Elmer Corporation 761 Main Avenue, Norwalk, CT 06859-0219 USA Tel: 203-761-2532 • Fax: 203-761-2892
Published since 1962
AtomicSpectroscopy is printed in the United States and published six times a year by:
NANOpure is a registered trademark of Barnstead/Thermolyne.
Optima is a registered trademark of Fisher Scientific.
PITTCON is a registered trademark of The Pittsburgh
Conference.
Plexiglas is a registered trademark of Rohm & Haas Co.
Teflon is a registered trademark of E.I. duPont deNemours &
Co., Inc.
Triton is a registered trademark of Union Carbide Chemicals &
Plastics Technology Corporation.
Ryton is a registered trademark of Phillips Petroleum Co.
Windows and Windows NT are registered trademarks of
Microsoft Corporation.
Registered names and trademarks, etc. used in this publication
even without specific indication thereof are not to be consid-
ered unprotected by law.
169SAAtomic SpectroscopyVol. 18(6), November/December 1997
INTRODUCTION
The Safe Drinking Water & ToxicEnforcement Act of 1985, or thelaw more commonly referred to as“California Proposition 65”, appliesto all companies with more than 10 employees doing business in thestate of California (1). Proposition65 is a voter initiative passed toaddress citizen concerns regardingexposure to chemicals which causecancer or reproductive toxicity.Under this law, businesses are pro-hibited from: (a) discharging listedchemicals to potential sources ofdrinking water; and (b) exposingpeople in the state to listed chemi-cals without prior warning.
Lead is one of the elements identified by the State of Californiaas both a cancer-causing agent anda reproductive toxin (2). Under California Proposition 65, the “nosignificant risk level” or NSRL estab-lished by the Office of Environmen-tal Health Hazard Assessment forlead exposure is 0.5 µg/day (3).One of the more common areas of concern is that people who rou-tinely use calcium-containingdietary supplements and antacidsmay exceed this limit. Sinceantacids and dietary supplementsare commonly ingested by peoplein significant amounts on a dailybasis, many manufacturers of sup-plements and the calcium-contain-ing compounds used in them arenow testing these materials for leadcontent. Since the actual dose mayvary due to intake rate, the level oflead present in a material is gener-ally reported in units of µg lead pergram material (µg/g).
Since the NSRL level establishedfor lead is given as a total exposureof 0.5 µg/day, it is necessary todetermine what detection levels are
Analysis of Lead (Pb) in Antacids and Calcium Compounds for Proposition 65 Compliance
Ruth E. WolfThe Perkin-Elmer Corporation
761 Main Avenue, Norwalk, CT 05859-0324 USA
Absorption (GFAA) and InductivelyCoupled Plasma Mass Spectrometry(ICP-MS). Of the two methods,comparison work done by a com-mercial laboratory has shown thatICP-MS has better detection limits,precision, and accuracy than GFAA(4).
This paper will discuss the ICP-MS determination of lead in a variety of calcium sources, includ-ing calcium carbonate, anhydrous dicalcium phosphate, dicalciumphosphate dihydrate, and tricalciumphosphate.
EXPERIMENTAL
Instrumentation
For this work, the Perkin-ElmerSCIEX ELAN® 6000 ICP-MS (Perkin-Elmer SCIEX Instruments, Concord,Ontario, Canada), equipped with aRyton® spray chamber, cross-flownebulizer, and a Perkin-Elmer® AS-91 autosampler, was used to perform the analysis of several cal-cium compounds after dissolutionin nitric acid. The instrument con-ditions used are given in Table I.
For most of the analysesreported in this work, only lead was determined in order toillustrate the applicability of ICP-MSfor this particular analysis and thespeed with which it can beperformed. Additional analytesincluding arsenic, cadmium,chromium, and others may bedetermined simultaneously usingICP-MS and will be the topic of a future publication. The totalacquisition time for each samplewas 18.5 seconds. Including sampleuptake, stabilization, and washouttime, a new sample was analyzedapproximately every 2 minutes. The use of the autosampler andautomated quality control softwareallowed complete unattended
ABSTRACT
Compliance with CaliforniaProposition 65 requirements for the monitoring of lead in cal-cium-containing compounds usedin dietary supplements requiresthe analytical methodology usedto have detection limits below0.05 µg/g in the solid material.The analytical capabilities ofInductively Coupled Plasma MassSpectrometry (ICP-MS) make itone of the techniques of choicefor performing lead analyses atthese low levels. Data are pre-sented showing the accuracy andprecision of analyses performedusing ICP-MS. Interferences thatcan occur during sample analysisand the suitability of simple aciddissolution techniques for variouscalcium-containing matrices are also discussed.
needed for monitoring purposes.For example, the U.S. RDA (Recom-mended Daily Allowance) for cal-cium in the adult diet is 1000 mg. If the entire RDA were to beobtained from a single calcium-containing supplement, the leadconcentration in that supplementmust be less than 0.5 µg/g. In orderto state that a material has a Pb concentration less than 0.5 µg/g,the detection limit of Pb by theselected analytical technique mustbe significantly below 0.5 µg/g toensure reliable and accurate results.Ideally, the Limit of Detection(LOD) should be a minimum of 10 times lower than the requiredquantitation limit. For this example,an analytical detection limit of 0.05µg/g or lower would be necessaryto perform reliable quantitation oflead at the required level. As aresult, suggested methods for analy-sis of lead at these low levelsinclude Graphite Furnace Atomic
170
operation, including monitoring of replicate precision, check stan-dards and internal standards.
Reagents and StandardSolutions
Optima® (Fisher Scientific, Pittsburgh, PA USA) nitric andhydrochloric acids were used toprepare all samples and standards.Reagent water (18 MΩ or better),prepared by mixed-bed ionexchange (Continental Water Sys-tems), was used to prepare all dilu-tions, blanks, and standards. Stockmulti-element standard solutionsincluding PE Pure AS Standardsfrom Perkin-Elmer (Norwalk, CTUSA), High-Purity Standards(Charleston, SC USA), and fromInorganic Ventures (Lakewood, NJUSA) were used to prepare all stan-dards, spikes, and internal standardsolutions. Certified standard refer-ence materials SRM 1400 Bone Ashand SRM 1486 Bone Meal wereobtained from the National Institute
of Standards and Technology (NIST,Gaithersburg, MD USA). All standardswere prepared in pre-cleanedpolypropylene autosampler tubes(Sarstadt, Germany) using pre-rinsed metal-free tips and mechani-cal air displacement pipettes (FisherScientific, Pittsburgh, PA USA).
Sample Preparation
Samples of antacid tablets, calcium carbonate, anhydrous dical-cium phosphate, dicalcium phos-phate dihydrate, and tricalciumphosphate were obtained from various manufacturers for testing.The samples were prepared using a simple acid dissolution procedure.Although some of the samples wereheated gently for 5–10 minutes toaid dissolution, they were not rigor-ously digested for an extendedperiod of time. The samples wereeither obtained in powder form or crushed to produce a fine pow-der. For the antacid A, antacid B,calcium carbonate, tricalcium phos-phate-Lot A, NIST SRM 1400, andNIST SRM 1486 samples, a 0.5-gportion was accurately weighedinto a pre-cleaned, acid-soakedErlenmeyer flask. A second portionof the tricalcium phosphate-Lot A,antacid A, SRM 1400, and SRM 1486samples was weighed out for thepurpose of performing a pre-disso-lution spike. A small amount ofwater was used to rinse the samplesinto the flask and 5 mL of concen-trated nitric acid was added to eachflask. To prepare the spikes, 500 µLof a 10-mg/L stock standard solu-tion was added to the second por-tion of tricalcium phosphate-Lot A,antacid A, SRM 1400, and SRM1486, giving a final spike concen-tration of 10 µg/g. The flasks wereput onto a hot plate and gentlywarmed for 5–10 minutes to aiddissolution. The antacid A, calciumcarbonate, tricalcium phosphate -Lot A, and NIST SRM 1400 dissolvedimmediately. The antacid B samplerequired an additional 5 mL of nitricacid before dissolving and SRM
1486 Bone Meal required both anadditional 5 mL of nitric acid and 5 mL of hydrochloric acid to go into solution. After the sampleswere dissolved, the flasks werecooled and transferred into cleanedpolypropylene 50-mL autosamplervials and diluted to 50 mL. The total dissolved solids content ofthese samples after dissolution was approximately 1%.
The samples of anhydrous dicalcium phosphate, dicalciumphosphate dihydrate (Lots A, B, and C), and tricalcium phosphate-Lot B were obtained in a powderedform from the manufacturer. A 2.5-gportion of each powder was accu-rately weighed and transferred intoa pre-cleaned 50-mL autosamplertube using reagent water to rinsethe powders into the tube. Approx-imately 20 mL of reagent water and10 mL of nitric acid were added to each tube. After the powders dissolved, the samples were takenup to 50 mL using reagent water.The total dissolved solids content of these samples was approximately5%.
Interferences
Two of the significant advantagesof ICP-MS include the sensitivityand selectivity of the technique.Any isobaric spectral overlaps thatoccur when elements have isotopesat the same nominal mass-to-chargeratio are predictable and can gener-ally be avoided by proper isotopeselection or corrected for usinginterference correction equations.
Lead is a naturally occurring element that has four isotopes: 204 Pb (1.4% abundant) 206 Pb (24.1% abundant) 207 Pb (22.1% abundant) 208 Pb (52.4% abundant) The abundance of the Pb isotopesmay vary depending on the sourceof the lead. Isotopes that originatedas part of the formation of thegalaxy are considered “stable” and their isotopic composition has
TABLE IOperating Conditions
ICP RF Power: 1200 W
Cones: Nickel
Nebulizer gas flow: 0.92–0.96 L/min
Analog detector voltage: –2200 V
Pulse stage detector voltage: 1200 V
Lens voltage: AutoLens™
Sample uptake rate: 1 mL/min
Ba++/Ba ratio: <3.0%
CeO/Ce ratio: <3.0%
Isotopes monitored: 159Tb, 165Ho,209Bi, 206Pb, 207Pb, 208Pb
Scanning mode: Peak hopping
Dwell time: 100 ms
Total integration time: 1 s perisotope
Number of replicates: 3
Total analysis time: 18.5 s
171
AtomicSpectroscopy
Vol. 18(6), Nov./Dec. 1997
AtomicSpectroscopy
ples were spiked with 20 µg/L ofBi, In, Tb, and Ho as internal stan-dards. The samples were cappedand shaken well to mix before plac-ing on the autosampler. SRM 1486had some grease residue formationafter cooling. The aliquot takenfrom this sample for dilution wasobtained by inserting the pipettetip well into the autosampler vesseland withdrawing an aliquot awayfrom the surface layer of residue.This aliquot was diluted 1:20 withreagent water.
The instrument was calibratedfor Pb at 0.1, 1, 5, and 10 µg/Lusing calibration standardsprepared in 1% nitric acid. The correlation coefficient obtained for the Pb calibration curve using a linear through zero curve typewas 0.9999. Check standards wererun every 10–15 samples and theinternal standard levels were moni-tored throughout the course of theanalysis by the automated nativeELAN NT quality control software.
RESULTS AND DISCUSSION
Detection Limits
The detection limits were calcu-lated by analyzing 1% nitric acidblanks, tricalcium phosphate(Ca3PO4
2), and calcium carbonate(CaCO3) matrices. The InstrumentDetection Limit (IDL) is a measure-ment of the best achievable detec-tion limit of an instrument and isdefined by IUPAC (InternationalUnion of Pure and AppliedChemists) as the concentration thatproduces a net intensity equivalentto three times the standard devia-tion of the background signal. SinceIDLs are typically measured in cleansolutions, such as nitric acid blanks,they may be unrealistically low formost practical analyses. They may,however, be useful in comparingdifferent techniques and instrumen-tation. The IDL was calculated bythe following:
remained constant throughout geo-logic time (5). The second sourceof lead is radiogenic lead or leadthat results from the radioactivedecay of an unstable parent. Threeof the isotopes of lead, 206Pb, 207Pb,and 208Pb, are radiogenic decayproducts of either uranium or tho-rium. The fourth lead isotope,204Pb, is considered “stable”, but israrely used for quantitation becauseof its low abundance and isobaricoverlap with the 204Hg isotope.208Pb is the most abundant andmost frequently used isotope forquantitation; however, differentsources of lead may have slightlydifferent 206Pb, 207Pb, and 208Pbabundances. In order to avoid prob-lems caused when the isotopeabundances of 206Pb, 207Pb, and208Pb vary due to differing sources,the isotopes of 206Pb, 207Pb, and208Pb were added together usingthe interference equation in TableII to perform the lead calculations.This is a commonly used elementalcorrection and is recommended bythe U.S. EPA in Methods 200.8 and6020 for regulatory analysis of envi-ronmental samples by ICP-MS (6,7).
TABLE IIInterference Equations
Element Interference Equation
Pb 208c = Pb 208u +Pb 207u+Pb 206u
where c = corrected intensity
and u = uncorrected intensity
Another type of interference thatcan occur in ICP-MS includes signalenhancement or suppression due to the presence of matrix species.This type of interference can becorrected for by using internal stan-dards and/or dilution of the samplematrix. One such interference dis-covered in the course of this workwas that the calcium phosphatesample matrix caused a delay inachieving stable analyte and inter-
nal standard signals. It was foundthat even in the diluted samples,the presence of high levels of Caand POx (x=1–4) ions in the samplematrix caused a delay in the stabi-lization of the analyte signal. One ofthe results of this delay, if the ana-lyst is not aware of its occurrence,is that the analyte and internal stan-dard element signals appear to besignificantly suppressed. This canlead to over-correction of theresults by the internal standardresponse and poor reproducibilitybetween individual replicates dur-ing the analysis, because the signalis not at a steady state. Indeed, thiskind of temporal suppression wasobserved due to the calcium matri-ces and the initial indications wereof severe (up to 70%) suppressionof the internal standards. Uponcloser examination, it was shownthat the signal maximum was slowto occur and that the analyticalreadings were taken during the sta-bilization period, leading to lowaverage signal levels and poor repli-cate standard deviations. The solu-tion in this case was a simple one.The read delay time or the waitingtime between the introduction of anew sample and the reading of thesignal level by the ICP-MS wasincreased from 10 seconds to 20seconds. The result of the extraread delay time was excellent preci-sion between replicates and theinternal standard signals were nolonger artificially suppressed. Thecause of this type of matrix-inducedinterference is beyond the scope ofthis work, but has been recentlyresearched and discussed by others(8).
Sample Analysis
A 1:20 dilution was performedon all the dissolved samples usingreagent water as the diluent. Afterthis dilution, the total dissolvedsolids content of the samples was0.1–0.5% depending on the dissolu-tion procedure used. All calibrationblanks, standards, and diluted sam-

172
IDL = 3(σ1% nitric acid Pb concentration )
where σ is the standard devia-tion of a minimum of seven repli-cate measurements.
Since most of the measurementsmade for this application are onsolid samples, it is appropriate todetermine the detection limit in thesolid. The IDL in the solid was cal-culated based upon the analyticaldilution (1:20) used during theanalysis and the sample preparationmethod. In this case, the IDL (µg/g)was calculated as:
IDL in µg/g = (IDL in µg/L)(20)(1L/1000 mL)(50 mL final volume/2.5 g sample)
Since the determination of leadin calcium-containing matrices isthe goal of this study and the detec-tion limits may differ from that in a clean nitric acid solution, theMethod Detection Limits (MDLs)for the calcium phosphate and cal-cium carbonate matrices weredetermined. The Pb concentrationin eight individual aliquots of eachmatrix was measured. The MDLwas calculated as follows:
MDL = 3(σblank matrix Pb concentration )
The MDL in the solid was calcu-lated based upon the 1:20 analyticaldilution used during the analysisand the sample preparationmethod. In this case, the MDL(µg/g) was calculated as:
MDL in µg/g = (MDL in µg/L)(20)(1L/1000 mL)(50mL final volume/2.5 g sample)
Based on the data in Table III,it can be concluded that the detec-tion limits for Pb using ICP-MS arewell below the limit necessary forthe analysis of Pb in calcium matri-ces, assuming the adult dosage of1000 mg/day. In fact, when theratio of the NSRL of 0.5 µg/g to theMDL is calculated, the methoddetection limits are between 60 and250 times below the NSRL.
Method Validation and Accuracy
In order to assess the accuracy of the method, two NIST StandardReference Materials (SRMs) wereprepared and run along with thesamples. SRMs are useful in assess-ing overall method accuracy andevaluating potential method bias,because they are prepared as homo-geneous materials and are certifiedfor element concentrations usingmore than one analytical technique.The two SRMs used for this workwere SRM 1400 Bone Ash and SRM 1486 Bone Meal. The resultsobtained are shown in Table IV.Each result is the mean value ofthree replicate measurements of the prepared sample and the errorlisted is the standard deviation ofthe replicate measurements in con-centration units.
The agreement between the ICP-MS results for SRM 1400 andthe NIST certified value for lead isexcellent, indicating that the disso-lution and analytical methods usedwill give an accurate, non-biasedresult. Since the matrix in SRM1400 is essentially an inorganicmatrix composed primarily of calcium phosphate, it can be con-cluded that the ICP-MS method discussed here will work well forthis type of sample. In addition, thepre-dissolution and post-dissolutionspike recoveries are excellent, indi-
cating that no analyte was lost inthe dissolution procedure and thatno matrix effects have biased theresults.
Although the values obtained for SRM 1486 are not within thestated confidence levels, they arewithin 90% of the stated meanvalue. It is believed that the result is lower than the stated value dueto the sample preparation methodused. It is possible that some of thePb remained in the residue whichwas not sampled when the diges-tate was prepared for analysis.Again, the pre-dissolution and post-dissolution spike recoveries forSRM 1486 are excellent. It can beconcluded from this data that formaterials having some organic components, a more rigorous digestion procedure will have to be employed to obtain more accu-rate results. Further studies areplanned to verify this conclusion.
The results for the nine individ-ual samples are shown in Table V.Each result shown is the average of three measurements. The Rela-tive Standard Deviation (%RSD) isalso given as a measurement of theprecision of the analyses. In allcases, better than 3% RSDs wereobtained for each matrix, indicatingthe excellent precision obtainedusing ICP-MS. Two samples wereselected to have pre-dissolution
TABLE III – Detection Limits for Lead
- Calcium Phosphate Calcium CarbonateMatrix IDL =(3)(σ1% nitric acid) MDL =(3)(σsample matrix) MDL =(3)(σsample matrix)
Solution 0.0008 µg/L 0.005 µg/L 0.008 µg/L
Solid 0.0003 µg/g 0.002 µg/g 0.003 µg/g
TABLE IV – SRM Results
Measured NIST Certified 10 µg/g pre- 0.1 µg/g post-concn value dissolution dissolution(µg/g) (µg/g) spike spike
Sample ID recovery recovery
SRM 1400 9.10 ± 0.11 9.07 ± 0.12 106% 109%
SRM 1486 1.207 ± 0.008 1.335 ± 0.014 101% 99%

173
AtomicSpectroscopy
Vol. 18(6), Nov./Dec. 1997
spikes performed on them. Thesesamples were dissolved with theaddition of acid and mild heating as discussed in the sample prepara-tion section. The spike recoveriesare excellent and are generallywithin ±10% of the spiked value.The post-dissolution spike recover-ies are also excellent and are allwithin ±11% of the spiked value,indicating that the matrix is notaffecting the detection of smallamounts of lead or changes in con-centration to any significant extent.
Long-Term Stability
One of the known limitations of ICP-MS is the ability of the instru-mentation to handle high levels ofdissolved solids for a long period of time. Since the commercialdevelopment of the technique in1984, instrument manufacturershave recommended that users keepthe total dissolved solids content ofthe samples run on ICP-MS below0.1–0.2% total dissolved solids forbest instrument performance andlong-term stability. Because of theuse of interface cones with smallorifices (0.8–1.1 mm) between the
ICP and the entrance to the ionoptic region of the mass spectrome-ter, running samples with high levels of dissolved solids can even-tually cause buildup and blockageof the cone orifices. For this reason,the use of internal standards to correct for instrument drift asthe material slowly builds up on the interface cones is a commonlyused and necessary practice in ICP-MS analysis. For this work,holmium (Ho) was used as theinternal standard for Pb because it is similar in mass to lead and wasnot already present in the samples.Figure 1 shows the Ho signal mea-sured in a 0.1-ppb calibration checksolution as a function of elapsedtime as the calcium samples wereanalyzed. The response in a checkstandard is used for this drift deter-mination because there is no matrixin the check standard that maycause additional suppression of thesignal, giving an indication of thedegree of material present on theinterface cones. The y-axis showsthe Ho signal as a percent of theoriginal signal level measured in the calibration blank. This value isautomatically calculated and moni-tored by the ELAN NT quality con-trol software. The dissolved solidslevels of the samples analyzed inthis study varied between 0.1–0.5%which is at the upper limit of whatcommercial ICP-MS instrumentationis designed to tolerate. A total of123 samples were analyzed duringthe nearly five-hour time periodshown in Figure 1. As illustrated by Figure 1, there was indeed agradual drop in the internal stan-dard signal as material built up onthe interface cones. This decreasein internal standard intensitiesdown to approximately 80% of the original value measured in thecalibration blank is typical for theanalysis of these types of samplesover several hours. Indeed, theinternal standard is still well withinits ability to measure low level concentrations accurately as is illustrated by Figure 2.
Table V – Sample Results
10 µg/g pre- 0.05 µg/g post-dissolution dissolution
Measured spike spikeconcn %RSD recovery recovery
Sample (µg/g) n=3 (%) (%)
Tricalcium Phosphate-A 0.105 0.88 99 99Tricalcium Phosphate-B 0.108 0.60 92Calcium Carbonate 0.315 1.03 90Antacid - A 0.114 2.84 90 93Antacid - B 0.259 1.28 106Anhydrous Dicalcium
Phosphate 0.089 0.62 89Dicalcium Phosphate
Dihydrate-A 0.093 0.70 90Dicalcium Phosphate
Dihydrate-B 0.159 0.89 101Dicalcium Phosphate
Dihydrat -C 0.168 0.75 102
Fig. 1. Internal Standard Response vs Time.
Internal Standard Response
0%
20%
40%
60%
80%
100%
120%
0:00 1:12 2:24 3:36 4:48Elapsed Time (hours:minutes)
Per
cent
of
ori
gin
al v
alue
Ho 165

174
Figure 2 shows the percentrecovery of the 0.1 ppb calibrationcheck standard over the same timeperiod as Figure 1. As illustrated byFigure 2, even though the internalstandard response is only 80% ofthe original value, the measuredconcentration of the checkstandard remains stable at ±10% of the true value for the duration of the analysis. In fact the measuredvalues stay within 99–107% of theactual value of the 0.1 ppb standardfor nearly five hours. The internalstandard response in the samplesvaried during this time period from60–80% of the value measured inthe calibration blank. The additionalsuppression seen during the analy-sis of the samples indicates somesuppression of signal is also occur-ring due to the sample matrix.Although the overall signal intensi-ties dropped over the course of the four hours, the precision of thethree replicate measurements wasnot degraded. Furthermore, theexcellent spike recoveries obtainedin the sample matrices indicate thatthis suppression is being correctlycompensated for by the internalstandards and that the accuracy of the results is not being adverselyaffected by the matrix suppression.
CONCLUSION
It has been shown that the use of ICP-MS can provide accurate andprecise results for the determina-tion of lead in a variety of calciummatrices. Selection of suitable sam-ple uptake and read delay rates wascritical in obtaining reproducibleand accurate data. Compared toclean nitric acid matrices, it was nec-essary to increase read delay times in order to deal with delayed signalresponse times caused by the sam-ple matrix. Even with the use oflong sample uptake and read delaytimes, the total time for each sam-ple analysis was less than two min-utes. Simple acid dissolution with
Fig. 2. Check Standard Recovery vs. Time.
0.1 ppb Calibration Check Recovery
80
90
100
110
120
0:00 1:12 2:24 3:36 4:48
Elapsed time (hours:minutes)
Che
ck S
tand
ard
Rec
ove
ry (%
)
Pb 208
and without heating was shown tobe an effective sample preparationmethod for all matrices except SRM 1486 Bone Meal whichappeared to have significantorganic content present as fats. The detection limits obtained incalcium phosphate and calcium carbonate are suitably low for thedetermination of lead in calciumsupplements below the NSRL of 0.5 µg/day.
REFERENCES
1. “Safe Drinking Water and ToxicEnforcement Act of 1986,” CaliforniaCode of Regulations, Sections25249.5 and 25249.6.
2. “List of Chemicals Known to theState to Cause Cancer or Reproduc-tive Toxicity,” California Code of Regulations, Title 22, Section 12000,August 26, 1997.
3. “Method of Detection Argument inthe Crystal Glassware Case,” Prop 65News 9 (7) (July 1994).
4. “Lead in Calcium Supplements,”Application Note, West Coast Analyti-cal Services Inc., 9840 AlburtisAvenue, Santa Fe Springs, CA 90670USA (1997).
5. Handbook of Inductively CoupledPlasma Mass Spectrometry, K. E.Jarvis, A.L. Gray, and R.S. Houk,Blackie & Son Ltd., London (1992).
6. “Method 200.8, Determination ofTrace Elements in Water and Wastesby Inductively Coupled Plasma MassSpectrometry,” in Methods for theDetermination of Metals in Environ-mental Samples, Supplement I,EPA/600/R-94/111, USEPA Monitor-ing Systems Laboratory, Cincinnati,OH (May 1994).
7. “Method 6020, Inductively CoupledPlasma Mass Splectrometry,” in TestMethods for Evaluating Solid Waste,Physical/Chemical Methods, SW-846,Third Edition, U.S. Government Print-ing Office, Springfield, VA (1994).
8. “Fundamental Investigations ofSteady State and Transient AcidEffects in ICP-AES and ICP-MS,” IanStewart and John W. Olesik, TheOhio State University, Paper No. 662,24th Annual Conference of the Feder-ation of Analytical Chemistry andSpectroscopy Societies (FACSS), Providence, RI (October 1997).

175
*Corresponding author.
SAAtomic SpectroscopyVol. 18(6), November/December 1997
from speleothems taken from theSoreq Cave, Israel, a cave thoroughlystudied and dated (4,6,7).
The analysis of geological sam-ples containing relatively high Uand Th concentrations was previ-ously performed by ICP-MS usingconventional sample introduction(8,9). Uranium and Th were alsodetermined using the same methodfor biological samples (10). It wasfound that the determination of Th by conventional sample intro-duction resulted in serious prob-lems which originate from the Thmemory effect. Thorium is mostprobably retained in the sampleintroduction system and/or in theinterface cones (10). Lorber et al.(11) determined very low concen-trations of U in urine samples usingthe FI-ICP-MS technique. In thistechnique, the signal decreasedslightly due to the matrix effect, butmemory effects were not observed.
INTRODUCTION
Thermal Ionization Mass Spectrometry (TIMS) is a well-established method to obtain accurate and precise 230Th–234Uages of calcite from cave deposits(speleothems) (1–5). The quality of the results depends largely onthe U and Th concentrations. Forprecise age determination, a suit-able concentration of bothelements is necessary. Whereas U is shown to be associated with thecalcite lattice (4), Th is usuallyincluded as "detrital" material (clays and iron oxides) with a high232Th/238U ratio. The presence ofnon-radiogenic Th creates difficul-ties in determining the accurateand precise 230Th–234U age of cal-cite from speleothems (1,4). Thesample preparation and the experi-mental procedure prior to thedetermination of U and Th eitherby alpha spectroscopy or by TIMSis described in Kaufman (4,5). Thismethod is slow and involves disso-lution, spiking, purification, etc.
In the literature, no simple methods have been reported for Uand Th determination. The purposeof the present study is to demon-strate that by analyzing Th and U by Inductively Coupled PlasmaMass Spectrometry (ICP-MS), appro-priate samples for age determina-tion can be chosen quickly (up to~30 samples per hour) and withhigh accuracy. The quality of theresults obtained by ICP-MS werecompared to those obtained byTIMS. The samples studied are oflow Mg calcites (0.5 to 1.0% Mg)
The problems of memory andmatrix effects due to high total dis-solved salts (TDS) contents whenanalyzing Th and U can be resolvedby analyzing natural samples, usingthe FI-ICP-MS technique with thal-lium (Tl) as an internal standard .
SAMPLE PREPARATION ANDEXPERIMENTAL PROCEDURES
Sample Preparation
Uranium and Th were analyzedusing ICP-MS on ten low magnesiumcalcite samples that were previouslyanalyzed for Th and U and dated byTIMS (4). The analyses of U and Thusing TIMS and ICP-MS were per-formed on aliquots of the same sample. A finely ground sample of 100 mg was moistened withwater in 15-mL polypropylenetubes (Sarstedt, Germany) and dis-solved in a minimum volume of 1 N HNO3. Thallium was added asan internal standard resulting in a final Tl concentration of 10 µg/L.The TDS in the samples was about1.7%, which would be too high forextended use of conventional con-tinuous solution aspiration ICP-MS.
Instrumentation
The measurements were per-formed with a PE SCIEX ELAN@
6000 ICP-MS (Perkin-Elmer SCIEXInstruments, Concord, Ontario,Canada). This model was describedin detail by Denoyer (12) and Tanner (13), and is equipped with a standard torch, spray chamber and nebulizer, a FIAS™ 400 flowinjection system and an AS-90autosampler (both models fromPerkin-Elmer, Überlingen, Germany).The operation is fully controlled bya computer with a Windows® NT-
Determination of Low Concentrations of U and Th in Carbonate Rocks Using FI-ICP-MS
*Ludwik Halicza, Miryam Bar-Matthewsa, Avner Ayalona, and Aharon Kaufmanb
a Geological Survey of Israel, 30 Malkhe Israel St., 95501 Jerusalem, Israelb Department of Environmental Sciences and Energy Research, Weizmann Institute of Sciences
Rehovot, 76100 Israel
ABSTRACTThe uranium (U) and thorium
(Th) concentrations in calcitesamples from cave deposits weredetermined using Flow InjectionInductively Coupled Plasma MassSpectrometry (FI-ICP-MS) withthallium (Tl) as an internal stan-dard. The analytical precision incalcite samples containing 200 to650 µg/kg U and 10 to 50 µg/kgTh was 0.5% relative standarddeviation (RSD) and 1.5% (RSD),respectively, with a limit ofdetection of 70 and 90 ng/kg,respectively. The results werecompared with those obtained byThermal Ionization Mass Spec-trometry (TIMS). Very good cor-relation factors of 0.998 for U and0.947 for Th were obtained .
176
driven dedicated software package,which also serves to process thetransient data and to calculate theresults, including automatic replica-tion and automatic sampling. TheICP-MS instrumental operating con-ditions and the mass spectrometeracquisition settings are summarizedin Table I.
The Flow Injection System
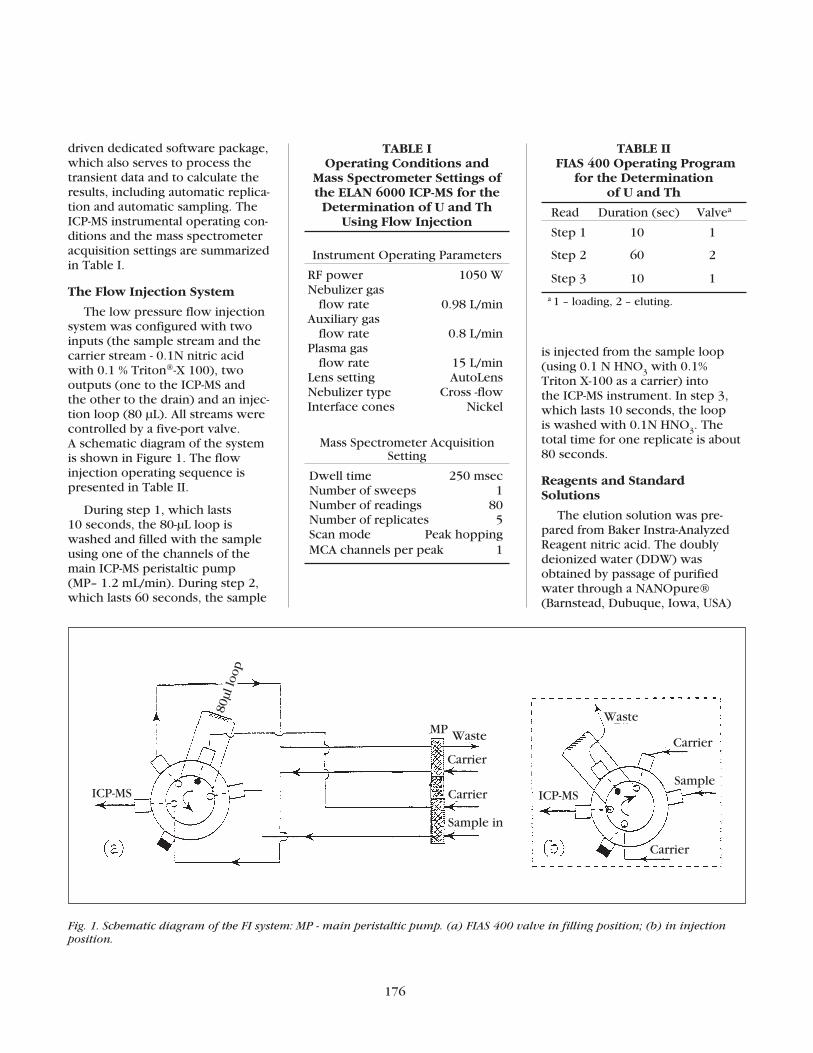
The low pressure flow injectionsystem was configured with twoinputs (the sample stream and thecarrier stream - 0.1N nitric acidwith 0.1 % Triton®-X 100), two outputs (one to the ICP-MS and the other to the drain) and an injec-tion loop (80 µL). All streams werecontrolled by a five-port valve. A schematic diagram of the systemis shown in Figure 1. The flowinjection operating sequence is presented in Table II.
During step 1, which lasts 10 seconds, the 80-µL loop iswashed and filled with the sampleusing one of the channels of themain ICP-MS peristaltic pump (MP– 1.2 mL/min). During step 2,which lasts 60 seconds, the sample
is injected from the sample loop(using 0.1 N HNO3 with 0.1% Triton X-100 as a carrier) into the ICP-MS instrument. In step 3,which lasts 10 seconds, the loop is washed with 0.1N HNO3. Thetotal time for one replicate is about80 seconds.
Reagents and StandardSolutions
The elution solution was pre-pared from Baker Instra-AnalyzedReagent nitric acid. The doublydeionized water (DDW) wasobtained by passage of purifiedwater through a NANOpure®(Barnstead, Dubuque, Iowa, USA)
TABLE I Operating Conditions and
Mass Spectrometer Settings ofthe ELAN 6000 ICP-MS for the
Determination of U and ThUsing Flow Injection
Instrument Operating Parameters
RF power 1050 WNebulizer gas
flow rate 0.98 L/min Auxiliary gas
flow rate 0.8 L/minPlasma gas
flow rate 15 L/minLens setting AutoLensNebulizer type Cross -flowInterface cones Nickel
Mass Spectrometer Acquisition Setting
Dwell time 250 msecNumber of sweeps 1Number of readings 80Number of replicates 5Scan mode Peak hoppingMCA channels per peak 1
TABLE IIFIAS 400 Operating Program
for the Determination of U and Th
Read Duration (sec) Valvea
Step 1 10 1
Step 2 60 2
Step 3 10 1
a 1 – loading, 2 – eluting.
Fig. 1. Schematic diagram of the FI system: MP - main peristaltic pump. (a) FIAS 400 valve in filling position; (b) in injectionposition.
ICP-MS
80µl
loop
MP Waste
Carrier
Carrier
Sample in
Waste
Carrier
ICP-MSSample
Carrier

177
AtomicSpectroscopy
Vol. 18(6), Nov./Dec. 1997
to 20 ng/L for Th. When the samplewas analyzed using the continuousintroduction system under thesame analytical sequence, the memory effect was three timeshigher and reached values of 2 and 60 ng/L for U and Th, respec-tively. Thus, it is clear that the flow
water purification system. The Thstandard solutions were preparedby dissolving thorium nitrate,AnalaR® analytical reagent (BDH,Pool, England) in DDW. The U and Tl stock solutions (Merck, ICPMulti-Element Standard VI) werediluted to 10 µg/L.
RESULTS AND DISCUSSION
Size of Injection Loop
A 20-µL loop resulted in a tran-sient signal with a maximum inten-sity (in cps) corresponding to a 12-fold dilution factor, i.e., about8% of the intensity obtained by continuous measurement of thesample. An 80-µL loop gave only an observed 3-fold dilution factor.Clogging, or any other side effectsassociated with high solids loadingon the instrument, were notobserved.
Blank and Detection Limit
The typical temporal response of the flow injection system of a blank solution, and the multi-element standard solution contain-ing 10 µg/L of U, Th, and Tl areshown in Figures 2 and 3, respec-tively. Using the flow injection procedure outlined above, the calculated limit of detection in the solution is 0.7 ng/L for U and0.9 ng/L for Th. This is equivalentto a limit of detection in the calcitesample of 70 and 90 ng/kg of U and Th, respectively.
Memory Effect
In order to test the memoryeffects using the flow injectionmethod, a blank solution was measured, followed by a stock solution containing 10 µg/L U and Th (i.e., four orders of magni-tude higher than their limit ofdetection). A subsequent analysiswas carried out on the blank solu-tion after washing the system for 2 minutes. The concentration of U and Th in the blank solutionincreased to 0.5 ng/L for U and
Fig. 2. Typical temporal response (cps) of the flow injection system with a blank solution of U, Th, and Tl vs. the time measured in seconds.
Fig. 3. Typical response (cps) of the flow injection system to the calibrationsolution containing 10 µg/L U, Th, and Tl in aqueous solution vs. the timemeasured in seconds.
injection method greatly reducesthe memory effect. Despite sampleintroduction by flow injection, significant memory effects wereobserved for Th. In the calcite sample (4), however, Th concen-trations are very low. Therefore,memory effects are negligible.
178
An alternative approach to flow injection is sampledilution to a level of 0.1% TDS, followed by conventionalcontinuous solution aspiration ICP-MS. Of course, thisapproach may significantly enhance analysis time anddegrade detection power due to the sample dilution. Further, matrix deposition on the interface cones andthus drift effects may be enhanced.
Validation of the Method, Matrix Effects and Internal Standard
A test of the matrix effects on the determination of U and Th in solutions with a relatively high TDS contentof 1.7% was carried out using the flow injection method,together with a matrix dilution experiment, and extrapo-
lation to infinite dilution (14). A recovery of 70–75%in undiluted samples was found. Approximately thesame recovery was achieved for U in a certified reference material (NASS-4 Ocean Water). The certi-fied U concentration in the sample was 2.68 ±0.12µg/L. Our results were in the range of 1.9–2.1 µg/L.This corresponds to a 22–30% matrix-induced signalsuppression. When Tl (10 µg/L) was used as an inter-nal standard, the matrix effects were compensatedand a U concentration of 2.72 ± 0.08 µg/L (n=6) wasobtained in the NAAS-4 Ocean Water sample.
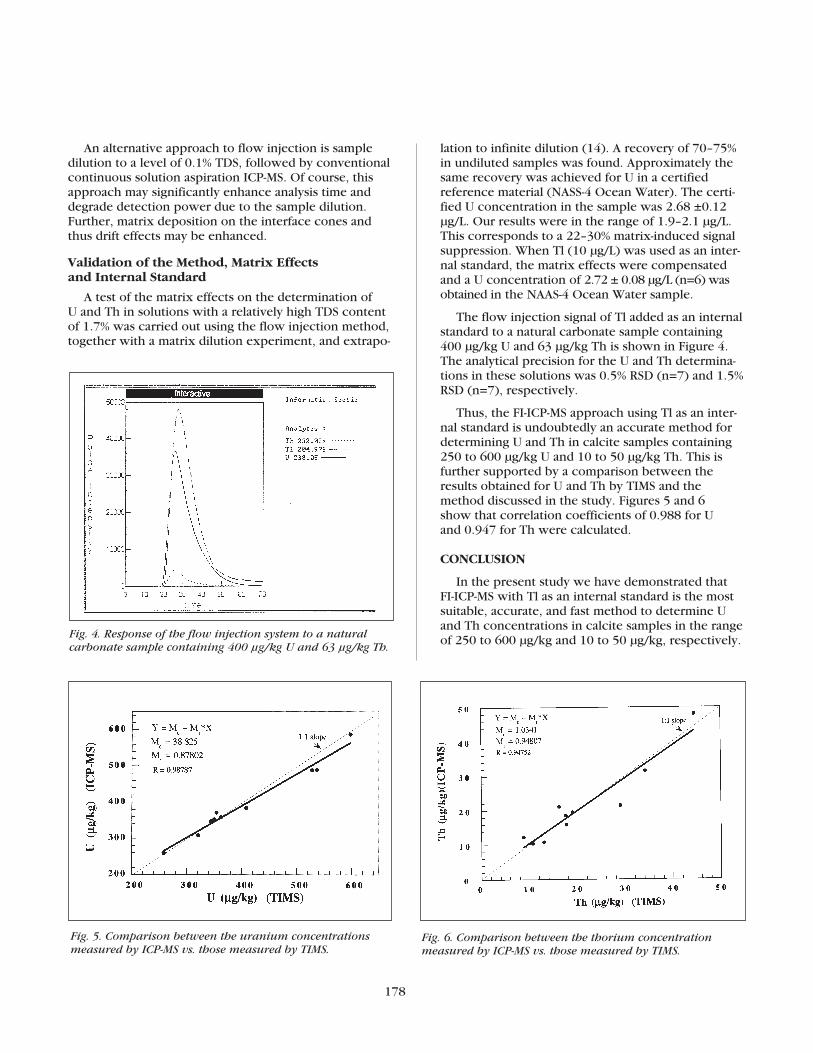
The flow injection signal of Tl added as an internalstandard to a natural carbonate sample containing400 µg/kg U and 63 µg/kg Th is shown in Figure 4.The analytical precision for the U and Th determina-tions in these solutions was 0.5% RSD (n=7) and 1.5%RSD (n=7), respectively.
Thus, the FI-ICP-MS approach using Tl as an inter-nal standard is undoubtedly an accurate method fordetermining U and Th in calcite samples containing250 to 600 µg/kg U and 10 to 50 µg/kg Th. This isfurther supported by a comparison between theresults obtained for U and Th by TIMS and themethod discussed in the study. Figures 5 and 6 show that correlation coefficients of 0.988 for U and 0.947 for Th were calculated.
CONCLUSION
In the present study we have demonstrated that FI-ICP-MS with Tl as an internal standard is the mostsuitable, accurate, and fast method to determine Uand Th concentrations in calcite samples in the rangeof 250 to 600 µg/kg and 10 to 50 µg/kg, respectively.Fig. 4. Response of the flow injection system to a natural
carbonate sample containing 400 µg/kg U and 63 µg/kg Th.
Fig. 5. Comparison between the uranium concentrationsmeasured by ICP-MS vs. those measured by TIMS.
Fig. 6. Comparison between the thorium concentration measured by ICP-MS vs. those measured by TIMS.

179
AtomicSpectroscopy
Vol. 18(6), Nov./Dec. 1997
Applying this approach, we couldovercome serious problems frommatrix and memory effects thatwere observed with conventionalcontinuous aspiration. It was alsofound that there is very good agree-ment between the results obtainedfor U and Th using this method andthose obtained with the methoddescribed by Kaufman et al (4).Although FI-ICP-MS is not as preciseand accurate as TIMS, it is a fasttechnique and sufficiently preciseand accurate to analyze calcite sam-ples. Based on the ICP-MS results,the most appropriate calcite sam-ples from speleothems can beselected for further TIMS datinganalysis.
ACKNOWLEDGMENTS
This research was supported by a grant from the Israel ScienceFoundation. We express our grati-tude to Avi David from the NatureProtection Authority of the SoreqCave for his generous help andassistance with the sampling.
Received September 12, 1997.
REFERENCES
1. H.P. Schwarcz and A.G. Latham,Chem. Geol. 80, 35 (1989).
2. J.A. Dorale, L.A. Gonzalez, M.K. Reagen, D.A. Pickett,M.T.Murrell, and R. G.Baker,Science 258, 1626 (1992).
3. A. Baker, P.L. Smart, and R.L.Edwards, J. of Quat. Sci. 11, 107(1996).
4. A. Kaufman, G.J. Wasserburg, D. Porcelli, M. Bar-Matthews, A. Ayalon, and L. Halicz, Earth and Planet. Sci. Lett. (in press).
5. A. Kaufman, Geochim. Cosmochim.Acta 57, 2303 (1993).
6. M. Bar-Matthews, A. Ayalon, A. Matthews, E. Sass, and L. Halicz,Geochim. Cosmochim. Acta 60,337 (1996).
7. M. Bar-Matthews, A. Ayalon, and A. Kaufman, Quat. Res. 47, 155(1997).
8. I. Jarvis, and K.E. Jarvis, Chem. Geol. 95, 1 (1992).
9. H. P. Longerich, G. A. Jenner, B.J. Fryer, and S.E. Jackson, Chem. Geol. 83, 105 (1990).
10. P. Twiss and R.J. Watling, At. Spectrosc. 15 (1), 36 (1994).
11. A. Lorber, Z. Karpas, and L. Halicz,Anal. Chim. Acta 334, 295 (1996).
12. E.R. Denoyer, Inter. Lab. 8 (1995).
13. S.D. Tanner, J. Anal. At. Spectrom.10, 905 (1995).
14. M. Thompson and M.H. Ramsey, J. Anal. At. Spectrom. 5, 701(1990).
180SAAtomic SpectroscopyVol. 18(6), November/December 1997
INTRODUCTION
79Selenium is a long-lived β-emit-ting radioactive selenium nuclidewith a half-life τ1/2 = 6.5.104 years.According to federal legislation inGermany (1,2) (and in many othercountries), extremely low concen-trations of several long-livedradionuclides (79Se, 107Pd, 129I, etc.)have to be determined in radioac-tive waste samples prior to theirpermanent disposal. Mass spectrom-etry is increasingly being used, par-ticularly for the determination oflong-lived radionuclides (3) whichare often difficult and time-consum-ing to determine using radioanalyti-cal techniques. As indicated inFigure 1, a possible source of 79Se is the beta-decay of 79As, which is a fission product of 235U. Radioana-lytical methods for the determina-tion of 79Se usually require theselenium to be separated fromother radio-nuclides prior to themeasurement, e.g., using low-levelgas flow counters (4). In case of79Se+ determination, several atomicand molecular ions arising from theplasma gas (38Ar40ArH+, 39K40Ar+) orthe sample (matrix) (79Br+, 158Gd2+,158Dy2+, 63Cu16O+) itself can inter-fere with the 79Se+ ions determinedby ICP-MS as indicated in Table I.Using a commercially available double-focusing sector field ICP-mass spectrometer providing amass resolution (m/∆m) of up to 10 000, some of the interfering ions(e.g., doubly charged ions 158Gd2+,
158Dy2+ or molecular ions 63Cu16O+,38Ar40ArH+) can be separated fromthe analyte ion 79Se+ (with a signifi-cant loss in sensitivity) when themass spectrometer is operated atthe required mass resolution. Butthe interference of the molecularion 39K40Ar+ and the isobaric inter-ference of 79Br+ with 79Se+ on mass79 amu (u) (requiring a mass resolution of more than 11 000 and120 000, respectively) cannot beseparated with the double-focusingICP-MS (offering a maximum massresolution of ≈7500). This, there-fore, makes the determination of(ultra)-trace 79Se with conventionalsample introduction (e.g., pneumaticor ultrasonic nebulizer) impossible.
In principle, for elements with nat-ural isotopic abundance, interfer-ences can be corrected for usingcorrection equations. In radioactivesamples (e.g., originating fromnuclear power plants), no naturalisotopic abundance of the elementspresent can be expected and con-sequently no such interference correction for the 79Br+ ion can beapplied. [Even in case of a knownisotopic composition of the
* Presented at the 1996 Winter Conferenceon Plasma Spectrochemistry January 8–13,1996, Fort Lauderdale, Florida, USA
# Present address: Forschungszentrum JülichGmbH, Institut für Angewandte Physikalis-che Chemie (ICG-7), Umweltprobenbank (E-mail: [email protected])
Assessment of the Determination of 79Selenium Using Double-Focusing Sector Field ICP-MS
After Hydride Generation *
K. Hoppstock#, J.S. Becker, and H.-J. DietzeForschungszentrum Jülich GmbH, Zentralabteilung für Chemische Analysen, D-52425 Jülich, Germany
ABSTRACT
In addition to radioanalyticaltechniques, ICP-MS is a powerfulmethod allowing fast and reliabledetermination of (ultra-)trace ele-ments which has found increasedapplications in the determinationof long-lived radionuclides. A method is described for thedetermination of traces of thelong-lived radionuclide 79Se usinga double-focusing sector fieldICP-MS (operated in the low reso-lution mode). For sample intro-duction, hydride generation witha specially designed device wasused. The possible interferencesof the mass spectrometric deter-mination of 79Se such as 79Br+,158Gd2+, 63Cu16O+, 38Ar40ArH+ andthe reduction and elimination ofinterfering ion species are dis-cussed. Based on measurementsof stable Se nuclides, the limit ofdetection (LOD) (without pre-concentration) for 79Se can beestimated to 0.1 µg/L, with a pre-cision better than 10% relativestandard deviation (RSD).
79 As 235 U
79 Se
79 Br
β−
β−
τ1/2 =9 m
in
τ1/2 = 6.5 ∗ 10 4
α = 2.58 ∗10 9 Bq/g
fission0.06%
years
Fig. 1. Possible origin of 79Se. (Bq: Becquerel = decays per second)
TABLE IPossible Interferences in theICP-MS Determination of 79Se
Analyte Mass ion (u)
79Se+ 78.919
RequiredInterfering Mass mass
ion (u) resolution38Ar40ArH+ 78.93294 5 70079Br+ 78.918336 119 00039K40Ar+ 78.926091 11 10063Cu16O+ 78.924513 14 000158Gd2+ 78.96205 1 900158Dy2+ 78.962202 1 900

181
AtomicSpectroscopy
Vol. 18(6), Nov./Dec. 1997
occurring Br this would be ratherdifficult, because the ion of the corresponding stable Br isotope(81Br+) interferes with the argonhydride ion 40Ar2H
+.] Hence,another strategy was necessary to determine 79Se using ICP-MS.
The best way to reduce or elimi-nate the formation of interferingions is to avoid the introduction of the respective atoms into theplasma. To avoid the introductionof interfering ions forming compo-nents into the plasma, we chosehydride generation, which is a well-known sample introductiontechnique for the determination of hydride forming elements (5–7)such as selenium. Compared topneumatic nebulization, hydridegeneration yields a much highertransport efficiency, and simultane-ously separates the analyte from the matrix and minimizes theamount of matrix introduced intothe plasma. In this work, theseinterferences are discussed andmethods for their reduction or elimination are developed anddescribed. Based on these studies,the suitability of using double-focusing sector field ICP-MS as a sensitive and fast method for thedetermination of 79Se is assessed.
EXPERIMENTAL
Instrumentation
A double-focusing sector fieldICP-MS, Model ELEMENT® (Finni-gan MAT, Bremen, Germany), wasused without any hard- or softwaremodifications, except for the sam-ple introduction system as describedlater.
The laboratory-built hydride generation device for the determi-nation of 79Se consisted of threemain parts:
(a) The chemifold (a y-shapedpart made from a 0.5 mm øi x 4 mmøa glass capillary), where the reac-tants (the acidified sample solution
and the alkaline NaBH4 solution)are brought to reaction.
(b) The gas liquid separator.
(c) The ‘wash bottle’ to reducethe introduction of bromine speciesinto the plasma.
Figure 2 is a schematic of theentire setup.
The sample solution and theNaBH4 were pumped at a flow rate of 0.9 mL/min using a Spetecperistaltic pump.
A high pressure asher (HPA)with quartz glass vessels (Kürner, Rosenheim, Germany) was used tomineralize the (certified) standardreference materials (SRM).
Chemicals and Samples
The nitric, hydrochloric, sulfuricand perchloric acids used were ofSuprapure grade (E. Merck, Darm-stadt, Germany).
Sodium borohydride (NaBH4) of analytical grade (E. Merck, Darm-stadt, Germany) was dissolved in0.1% NaOH (analytical grade, E. Merck, Darmstadt, Germany) to a concentration of 1% (wt/v).Single-element standard solutions of Se (with natural isotopic com-position), K, Cu, and Gd wereobtained from the NBS (now NIST,National Institute of Standards andTechnology, Gaithersburg, MD
USA). NaBr (Suprapure grade, E. Merck, Darmstadt, Germany) was used to prepare the Br standardsolution. Ultrapure water wasobtained from a Milli-Q™Plus water purification system(Millipore, Eschborn, Germany) at a resistivity of 18.2 MΩ cm.
Certified biological referencematerial BCR CRM 278 Mussel Tissue BCR (obtained from BCR,Promochem, Wesel, Germany) andNBS SRM 1515 Apple Leaves wereused to verify the method withrespect to the determination of natural selenium. The samples(≈500 mg) were digested in thehigh pressure asher using 3 mL of concentrated HNO3 at a tempera-ture of 280°C for 90 minutes.
The real radioactive samplesmeasured were provided as HNO3containing solutions (nitric acidleachates).
RESULTS AND DISCUSSION
Optimization of the AnalyticalMethod
Mass spectrometry, in particularICP-MS, is a powerful technique for the determination of trace andultra-trace selenium. To achievelow limits of detection (LOD), the experimental parameters of the mass spectrometer and of thehydride generation process have
Waste
Sample
ArTo ICP
Water
NaBH 4
Fig. 2: Experimental setup.

182
taining 20 µg/L of Se in 3% HCl and a 1% NaBH4 solution wereused. As can be seen in Figure 3, the observed 82Se+ ion intensityreaches a maximum with a RFpower of 1600 W and a carrier gas flow rate of about 1 L/min.
The hydride generation is influ-enced by several parameters (typeand concentration of acid and the NaBH4 solution), but only thechoice of mineral acid will be dis-
cussed here. Figure 4 shows that no significant differences areobserved with different acids; thus,we used 3% HCl for our furtherstudies. Higher concentrations of acid and NaBH4 resulted in onlyslightly higher sensitivity but oftenwith rather varying ion intensitiesof selenium. The optimized experi-mental conditions used are summa-rized in Table II.
Nitric acid is commonly used in sample preparation procedures.Therefore, the effect of varying concentrations of nitric acid (in thesample solutions) on the sensitivityof the hydride formation processhas to be studied in order to obtainaccurate analytical results. Figure 5demonstrates that within the preci-sion of the measurements no signifi-cant influence is observed even forvery high nitric acid concentrations.
Investigation of Possible Inter-ferences at the Determinationof 79Se
The determination of 79Se usingICP-MS is difficult due to interfer-ences with atomic and molecularions (such as 79Br+, 38Ar40ArH+,
to be optimized carefully. Unfortu-nately, no 79Se standard was avail-able for our work, so we used Sewith a natural isotopic abundance,because the radioactive seleniumwill show similar chemical behav-ior. Concerning the optimization of the mass spectrometer, only twoparameters will be discussed here:The carrier gas flow rate and the RF power. To study the influence of these parameters, a solution con-
0.0
0.5
1.0
Rel
ativ
e Io
n In
tens
ity
82S
e+
(3%
HC
l = 1
)
HCl HNO3 H2SO4 HClO4
Fig. 3. Influence of nebulizer gas flow and RF power on 82Se+ ion intensity(20 ng/mL Se in 3% HCl, 1% NaBH4).
0.4 0.6 0.7 0.8 0.9 1 1.1 1.2 1.3 1.6
1000
1200
1400
1600
1800
0
100000
200000
300000
400000
500000
600000
700000
800000
900000
82S
e+ Io
n In
tens
ity [c
ps]
Nebulizer gas flow [L/min]
rf-p
ow
er [W
]
Fig. 4. Influence of different acids on the ion intensity of 82Se+(20 ppb Se, 1%NaBH4 (stabilized with 0.1% NaOH).Hatched graph: 2% mineral acid, dotted graph: 3% mineral acid).
TABLE IIOptimized Experimental
Conditions
Hydride Generation
Reducing agent 1% NaBH4(stabilized with 0.1% NaOH)
Acid used 3 % HClAcidified sample
flow rate 0.9 mL/ min NaBH4 solution
flow rate 0.9 mL/ min
ICP-MS
ELEMENT (Finnigan, MAT)Mass resolution 300RF power 1600 WCarrier gas
flow rate 1.1 L/min Argon
Dwell time 500 ms

183
AtomicSpectroscopy
Vol. 18(6), Nov./Dec. 1997
158Gd2+,158Dy2+, 39K40Ar+ and63Cu16O+), and other molecular ionsinterfere with 79Se+. Table I com-piles possible interfering ions onmass 79 u, their exact mass and therequired mass resolution necessaryto separate the analyte ion 79Se+
from the respective interference bymeans of the mass spectrometer.The molecular ions 38Ar40ArH+
formed in an argon plasma wereobserved as an intrinsic backgroundin the mass spectra which is verydifficult to eliminate if argon is used as the plasma gas because that would require the quantitativeexclusion of hydrogen (in the formof moisture and/or H2 or H contain-ing compounds). The use of ahydride generator for sample intro-duction achieves a trace/matrix sep-aration and minimizes the amountof matrix introduced into theplasma.
79Br+ InterferenceBromine (79Br), which causes
the isobaric interference on 79Se+
analyte ions, is omnipresent in traceamounts in the samples and even in high purity acids (8). Figure 6shows the 79Br+ ion intensities as afunction of bromine concentration
for different sample introductionsystems. Using a Meinhard® nebu-lizer, a linear dependence wasobserved. With hydride generation,less bromine was introduced intothe ICP at higher Br concentrationscompared to the Meinhard nebu-lizer. Volatile bromine-containingcompounds (e.g., HBr) are formedwhich are swept with the purge gas(carrier gas) into the plasma and/orthat part of the sample solution inthe form of an aerosol (formed bybursting bubbles in the gas/liquidseparator) finds its way into theplasma. To reduce the Br-relatedspecies on mass 79 u further, a gaswash bottle filled with high puritywater was inserted between thegas/liquid separator and the plasma(Figure 1). A constant ion intensityis observed on mass 79 u which isnot affected by the bromine con-centration present in the samplesolution. The data indicate thatusing the proposed hydride genera-tion system with a wash bottle,bromine impurities in the samplecan be separated quantitatively.
39K40Ar+ InterferenceThe alkali metal potassium
(with a high natural abundance of2.09% in the earth’s crust) is pre-
sent in many sample solutions in reasonably high concentrations.Therefore, the formation of39K40Ar+ in dependence of a K concentration for different sampleintroduction systems was investi-gated. Figure 7 shows that withincreasing concentrations of K, theformation of 39K40Ar+ is nearly con-stant. Using a pneumatic nebulizer,the observed ion intensity on mass79 u for a blank solution is higherthan for a solution containing 100mg/L K. This is probably due to sig-nificantly changed plasma condi-tions by the relatively high amountof the easily ionizable potassiumand the changes in viscosity of the sample solution which affect nebulizer performance. Usinghydride generation either with or without a gas wash bottle, no influence of K on the measured ion intensity at mass 79 u wasobserved. Furthermore, the preci-sion (indicated by the error barsrepresenting the SD of at least three measurements) of the mea-surements at mass 79 u is betterwhen hydride generation is used.
The formation rate of dimermetal argide ions (M – alkali metal)is very low compared to the species
0
10000
20000
30000
40000
50000
60000
70000
80000
90000
0 0.5 1 1.5 2
Br Concentration [µg/mL]
Ion
Inte
nsity
[cp
s]
(Mei
nhar
d N
ebul
izer
)
0
1000
2000
3000
4000
5000
6000
7000
8000
9000
Ion
Inte
nsity
[cp
s]
(Hyd
rid
e G
ener
atio
n)
0.5
1.0
0 3 7 13 20 32 40
Concentration of HNO3 [%]
Rea
tive
Ion
Inte
nsity
Fig. 5. Influence of varying HNO3 concentrations on thehydride formation process shown as varying ion intensitiesfor 82Se+ (20 ng/mL Se, 3% HCl, 1 % NaBH4).
Fig. 6. Dependence of ion intensity of 79Br+ on the Br concen-tration for different sample introduction systems in ICP-MS. v = Meinhard Nebulizer (left axis)n = Hydride generation ¶ = Hydride generation with wash bottle. (both right axis)

184
that contain a transition metal. In(9) a correlation of metal argide ion,intensities and bond dissociationenergies was found. The intensityratio KAr+/Ar+, which was measuredto 10–7, is very low due to low sta-bility (binding energy) of this mole-cular ion.
63Cu16O+ InterferenceAnother possible interference
for the determination of 79Se is theformation of the molecular ion63Cu16O+. When studying the influ-ence of an increasing Cu concentra-tion on the ion intensity measuredon mass 79 u, a steadily increasingintensity is observed using theMeinhard nebulizer. The formationof CuO+ is reduced significantly(because less H2O is introducedinto the plasma) when using thehydride generation system (withand without the wash bottledevice) as can be seen in Figure 8.This indicates that the contributionof an aerosol formation in thegas/liquid separator to the intro-duction of matrix into the plasma(as discussed in case of the 79Brinterference) is only of minorimportance. Again the precision,even in the presence of 100 mg/LCu in the sample solution, is muchbetter when using the hydride generation system.
158Gd2+ and 158Dy2+ InterferenceNot only isobaric interferences
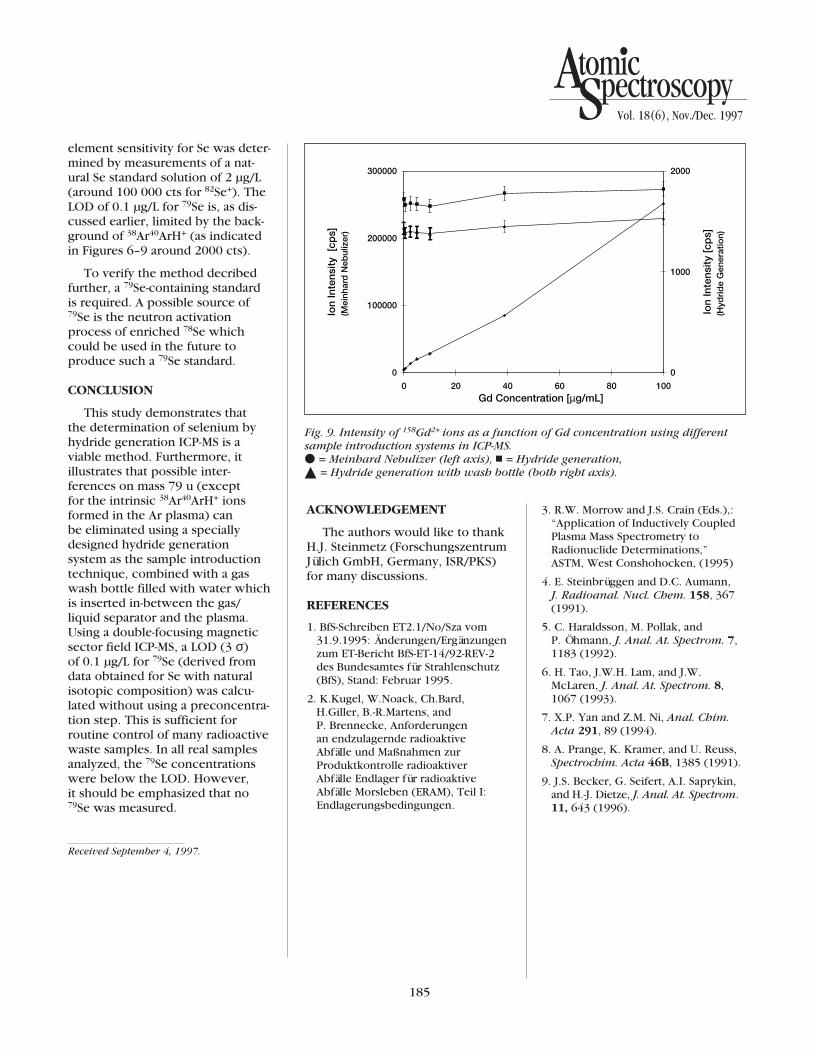
of singly charged atomic and mole-cular ions can interfere with thedetermination of 79Se on mass 79 u,but also doubly charged ions of Gdand Dy. Because the chemical properties of the lanthanide groupelements are rather similar, theintensity of doubly charged ions as a function of their concentrationwas studied using Gd solutions ofnatural abundance. Figure 9 showsthat using a pneumatic nebulizer,very high ion intensities of 158Gd2+
are observed on mass 79 u, whichshow a linear dependence on theGd concentration present in thesample solution. The use of thehydride generator with and withoutthe gas wash bottle in-between thegas/liquid separator and the torchresults in steady signals which arenot influenced by the Gd concen-tration in the sample solution. Thisconfirms the excellent separationcapability of the hydride generationsystem.
Determination of Se in Biological Materials
Unfortunately neither 79Se stan-dards nor materials with a certifiedor known concentration of 79Sewere available to us. The only way
to check the described method is to determine the natural Se concen-tration in (certified) SRMs. We usedcertified reference material BCRCRM 278 Mussel Tissue and NISTSRM 1515 Apple Leaves. The results(obtained via 82Se+) presented inTable III show good agreementwith the certified values, indicatingthat the method is suitable for thedetermination of trace and ultra-trace selenium.
Determination of LOD for 79Se
The LOD (3 σ) for 79Se wasdetermined by seven measurementsof a blank solution acidified to 3%with Suprapure grade HCl. The
Fig. 7. Ion intensity of 39K40Ar+ as a function of K concentra-tion for different sample introduction systems in ICP-MS.v = Meinhard Nebulizer, n = Hydride generation, ¶ = Hydride generation with wash bottle.
0
1000
2000
3000
4000
5000
6000
0 10 20 30 40 50 60 70 80 90 100
K Concentration [µg/mL]
Ion
Inte
nsity
[cp
s]
0
2500
5000
7500
10000
0 10 20 30 40 50 60 70 80 90 100
Cu Concentration [µg/mL]
Ion
Inte
nsity
[cp
s]
Fig. 8. Intensity of 63Cu16O+ ions as a function of Cu concen-tration for different sample introduction systems in ICP-MS. v = Meinhard Nebulizer, n = Hydride generation, ¶ = Hydride generation with wash bottle.
TABLE III.Se Concentrations in
BCR CRM 278 Mussel Tissue and NIST SRM 1515 Apple Leaves
After HPA Digestion with HNO3
CRM 278 SRM 1515Mussel Tissue Apple Leaves
(µg/g) (µg/g)
Standard Addition Calibration 1.67±0.11 0.046±0.016
External Calibration 1.61±0.13 0.046±0.018
Certified Value 1.66±0.04 0.050±0.015
185
AtomicSpectroscopy
Vol. 18(6), Nov./Dec. 1997
element sensitivity for Se was deter-mined by measurements of a nat-ural Se standard solution of 2 µg/L(around 100 000 cts for 82Se+). TheLOD of 0.1 µg/L for 79Se is, as dis-cussed earlier, limited by the back-ground of 38Ar40ArH+ (as indicatedin Figures 6–9 around 2000 cts).
To verify the method decribed further, a 79Se-containing standardis required. A possible source of 79Se is the neutron activationprocess of enriched 78Se whichcould be used in the future to produce such a 79Se standard.
CONCLUSION
This study demonstrates that the determination of selenium byhydride generation ICP-MS is aviable method. Furthermore, it illustrates that possible inter-ferences on mass 79 u (except for the intrinsic 38Ar40ArH+ ionsformed in the Ar plasma) can be eliminated using a speciallydesigned hydride generation system as the sample introductiontechnique, combined with a gaswash bottle filled with water whichis inserted in-between the gas/liquid separator and the plasma. Using a double-focusing magneticsector field ICP-MS, a LOD (3 σ) of 0.1 µg/L for 79Se (derived fromdata obtained for Se with naturalisotopic composition) was calcu-lated without using a preconcentra-tion step. This is sufficient forroutine control of many radioactivewaste samples. In all real samplesanalyzed, the 79Se concentrationswere below the LOD. However, it should be emphasized that no79Se was measured.
Received September 4, 1997.
ACKNOWLEDGEMENT
The authors would like to thankH.J. Steinmetz (ForschungszentrumJülich GmbH, Germany, ISR/PKS)for many discussions.
REFERENCES
1. BfS-Schreiben ET2.1/No/Sza vom31.9.1995: Änderungen/Ergänzungenzum ET-Bericht BfS-ET-14/92-REV-2des Bundesamtes für Strahlenschutz(BfS), Stand: Februar 1995.
2. K.Kugel, W.Noack, Ch.Bard,H.Giller, B.-R.Martens, and P. Brennecke, Anforderungen an endzulagernde radioaktive Abfälle und Maßnahmen zur Produktkontrolle radioaktiver Abfälle Endlager für radioaktiveAbfälle Morsleben (ERAM), Teil I:Endlagerungsbedingungen.
3. R.W. Morrow and J.S. Crain (Eds.),:“Application of Inductively CoupledPlasma Mass Spectrometry toRadionuclide Determinations,” ASTM, West Conshohocken, (1995)
4. E. Steinbrüggen and D.C. Aumann, J. Radioanal. Nucl. Chem. 158, 367(1991).
5. C. Haraldsson, M. Pollak, and P. Öhmann, J. Anal. At. Spectrom. 7,1183 (1992).
6. H. Tao, J.W.H. Lam, and J.W.McLaren, J. Anal. At. Spectrom. 8,1067 (1993).
7. X.P. Yan and Z.M. Ni, Anal. Chim.Acta 291, 89 (1994).
8. A. Prange, K. Kramer, and U. Reuss,Spectrochim. Acta 46B, 1385 (1991).
9. J.S. Becker, G. Seifert, A.I. Saprykin,and H.-J. Dietze, J. Anal. At. Spectrom.11, 643 (1996).
0
100000
200000
300000
0 20 40 60 80 100Gd Concentration [µg/mL]
Ion
Inte
nsity
[cp
s]
(Mei
nhar
d N
ebul
izer
)
0
1000
2000
Ion
Inte
nsity
[cp
s]
(Hyd
rid
e G
ener
atio
n)
Fig. 9. Intensity of 158Gd2+ ions as a function of Gd concentration using differentsample introduction systems in ICP-MS. v = Meinhard Nebulizer (left axis), n = Hydride generation, ¶ = Hydride generation with wash bottle (both right axis).
186SAAtomic SpectroscopyVol. 18(6), November/December 1997
INTRODUCTIONDue to its chemical toxicity and
its large industrial, agricultural, andother applications (gold mining inBrazil), mercury is nowadays one of the elements of major environ-mental concern (1–3). This situa-tion is reflected in the large numberof publications about mercurydetermination in all relevant envi-ronmental and biological matrices.The spectrometric methods mostfrequently proposed include coldvapor (4–6) and graphite furnaceatomic absorption (7), atomic fluo-rescence (8), inductively coupledplasma atomic emission (9), andmass spectrometry (10–12). Withfew exceptions, the proposedmethodologies require an initialsample dissolution step, which isgenerally the limiting factor in sample throughput. Solid samplingwould therefore not only increaseanalytical speed, permitting large-scale surveillance studies for mer-cury, but would also minimizecontamination during chemical procedures. This solid samplingapproach is used in graphitefurnace atomic absorptionspectrometry (GF-AAS) andelectrothermal vaporization induc-tively coupled plasma mass spec-trometry (ETV-ICP-MS) and morerecently, also in laser ablation (LA)ICP-MS. These introduction devicesare, however, not only relativelyexpensive to acquire, maintain, and use routinely, but show the dis-advantage that usually a small mass(≤ 1 mg) is consumed during analy-sis, which may cause problems ofsample reproducibility, especiallywhen dealing with heterogenousenvironmental materials.
In this work, a minitube furnace,commercially available as an acces-
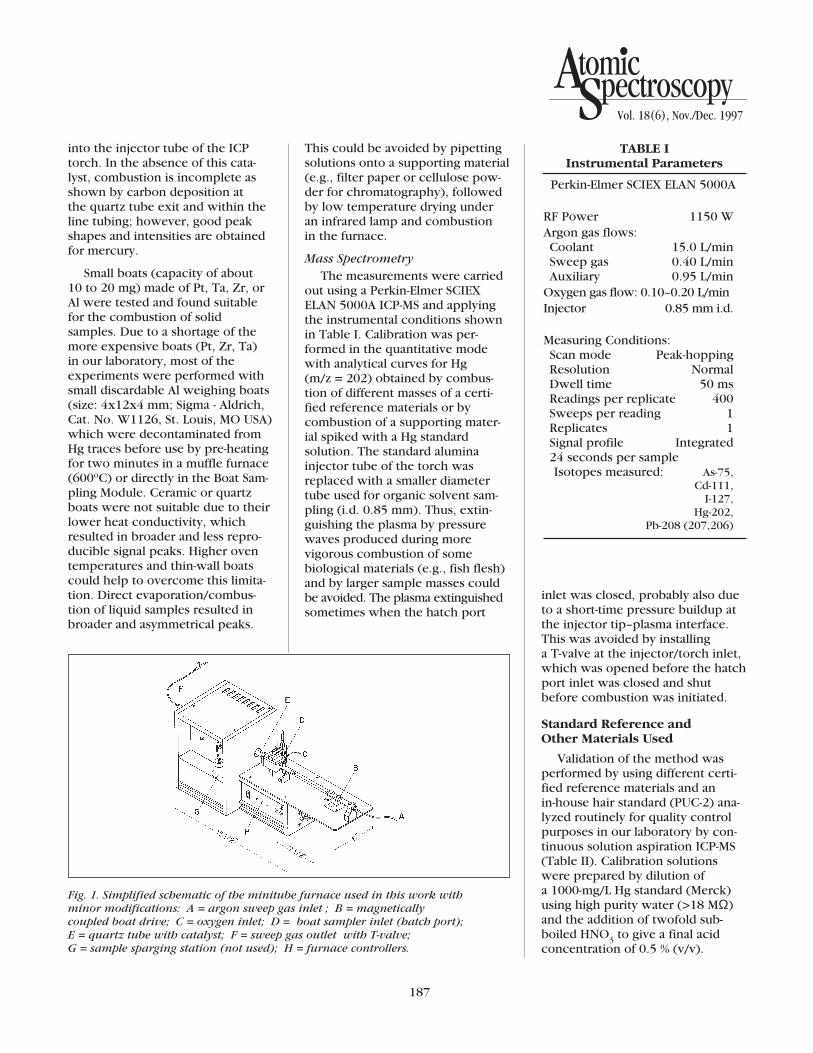
sory for total organic carbon(TOC) determination, wasadapted for solid sampling in ICP-MS. Our experiences with thislow-cost electrothermal introduc-tion device for the determinationof mercury in biological sampleswill be described and some out-look will be given on its more gen-eral use in the determination ofother volatile elements.
EXPERIMENTAL
InstrumentationMinitube Furnace
The furnace used in this workwas the Boat Sampling ModuleModel 183 (Rosemont Analytical,Dohrmann Division, Santa Clara,CA USA) available as an accessoryfor the DC-90 Total Organic Carbon Analyzer. A simplifiedschematic of this furnace is shownin Figure 1. The solid sample (typi-cally 5 to 20 mg) is weighed intoa small aluminum boat and intro-duced into the sample boat driveat the hatch port (D). The boat isthen transported manually andslowly by the magnetically cou-pled boat drive (B) into the electri-cally heated region of the furnace(950oC) where vaporization andcombustion occur. The sweep gas used was a mixture of argon(0.40 L/min) and oxygen (0.10L/min), regulated by the mass-flowcontrollers (nebulizer gas and oxy-gen channel) of the ELAN® 5000AICP-MS (Perkin-Elmer SCIEXInstruments, Concord, Ontario,Canada). The sweep gas carriesthe vaporization and combustionproducts from the first heatedregion into the catalytic combus-tion zone, where complete oxida-tion is promoted by a cobaltoxide–alumina catalyst. The com-bustion products are then sweptfrom the outlet of the quartz tube(F) via a Teflon®-lined tube (1/8”)
Fast Hg Determination in Biological Samples by ICP-MSUsing Minitube Furnace Catalytic Combustion (MFCC)
Norbert Miekeley and Milene Oliveira Amato Pontifical Catholic University, Rua Marquês de São Vicente 225
22453-900 Rio de Janeiro, Brazil
ABSTRACT
The use of a simple electro-thermal introduction system forICP-MS determination of mercuryin biological and other samples isdescribed. The method is basedon the direct combustion/volatilization of the solid or liquidsample in a minitube furnace at950oC by means of an oxygen/argon stream and in the presenceof a cobalt oxide–alumina cata-lyst. The combustion/volatiliza-tion products are carried by thisstream into an inductively cou-pled plasma of a mass spectrome-ter. Typically, 5 to 20 mg of thesolid sample are weighed into a small discardable aluminumboat, which is then manually introduced into the hot zone ofthe furnace. Liquid samples (e.g.,urine, blood) can be pipetteddirectly into the boat or better,onto a combustible supportingmaterial (e.g., filter paper), andthen ashed in the same way. Cali-bration curves are established bycombustion of different masses of an adequate certified referencematerial, or alternatively by solu-tion calibration, and evaluation of the transient signal peaks atm/z = 202. Analytical figures ofmerit of the proposed method,exemplified on the determinationof mercury in hair samples, are(a) 3σ-detection limit: 19 pg or1.9 ng/g (ppb) for a 10-mg ashedsample; (b) repeatability: typically20–30%; (c) accuracy obtainedon the hair reference materialIAEA -086 within the specifiedrange of 0.57 ± 0.15 µg/g; and (d)speed: 3 to 4 minutes per solidsample, including weighing.
Although the minitube fur-nace was tested specifically forHg-determination in biologicalsamples by ICP-MS, its use forother matrices and other volatileelements and detectors (e.g., ICP-AES) is promising.
*Corresponding author.
187
AtomicSpectroscopy
Vol. 18(6), Nov./Dec. 1997
into the injector tube of the ICPtorch. In the absence of this cata-lyst, combustion is incomplete asshown by carbon deposition at the quartz tube exit and within theline tubing; however, good peakshapes and intensities are obtainedfor mercury.
Small boats (capacity of about 10 to 20 mg) made of Pt, Ta, Zr, orAl were tested and found suitablefor the combustion of solidsamples. Due to a shortage of themore expensive boats (Pt, Zr, Ta) in our laboratory, most of theexperiments were performed withsmall discardable Al weighing boats(size: 4x12x4 mm; Sigma - Aldrich,Cat. No. W1126, St. Louis, MO USA)which were decontaminated fromHg traces before use by pre-heatingfor two minutes in a muffle furnace(600oC) or directly in the Boat Sam-pling Module. Ceramic or quartzboats were not suitable due to theirlower heat conductivity, whichresulted in broader and less repro-ducible signal peaks. Higher oventemperatures and thin-wall boatscould help to overcome this limita-tion. Direct evaporation/combus-tion of liquid samples resulted inbroader and asymmetrical peaks.
This could be avoided by pipettingsolutions onto a supporting material(e.g., filter paper or cellulose pow-der for chromatography), followedby low temperature drying underan infrared lamp and combustion in the furnace.
Mass SpectrometryThe measurements were carried
out using a Perkin-Elmer SCIEXELAN 5000A ICP-MS and applyingthe instrumental conditions shownin Table I. Calibration was per-formed in the quantitative modewith analytical curves for Hg (m/z = 202) obtained by combus-tion of different masses of a certi-fied reference materials or bycombustion of a supporting mater-ial spiked with a Hg standard solution. The standard aluminainjector tube of the torch wasreplaced with a smaller diametertube used for organic solvent sam-pling (i.d. 0.85 mm). Thus, extin-guishing the plasma by pressurewaves produced during more vigorous combustion of some biological materials (e.g., fish flesh)and by larger sample masses couldbe avoided. The plasma extinguishedsometimes when the hatch port
inlet was closed, probably also due to a short-time pressure buildup atthe injector tip–plasma interface.This was avoided by installing a T-valve at the injector/torch inlet,which was opened before the hatchport inlet was closed and shutbefore combustion was initiated.
Standard Reference and Other Materials Used
Validation of the method wasperformed by using different certi-fied reference materials and an in-house hair standard (PUC-2) ana-lyzed routinely for quality controlpurposes in our laboratory by con-tinuous solution aspiration ICP-MS(Table II). Calibration solutionswere prepared by dilution of a 1000-mg/L Hg standard (Merck)using high purity water (>18 MΩ)and the addition of twofold sub-boiled HNO3 to give a final acidconcentration of 0.5 % (v/v).
Fig. 1. Simplified schematic of the minitube furnace used in this work with minor modifications: A = argon sweep gas inlet ; B = magnetically coupled boat drive; C = oxygen inlet; D = boat sampler inlet (hatch port); E = quartz tube with catalyst; F = sweep gas outlet with T-valve; G = sample sparging station (not used); H = furnace controllers.
TABLE IInstrumental Parameters
Perkin-Elmer SCIEX ELAN 5000A
RF Power 1150 WArgon gas flows: Coolant 15.0 L/minSweep gas 0.40 L/minAuxiliary 0.95 L/min
Oxygen gas flow: 0.10–0.20 L/minInjector 0.85 mm i.d.
Measuring Conditions:Scan mode Peak-hopping Resolution NormalDwell time 50 msReadings per replicate 400 Sweeps per reading 1Replicates 1Signal profile Integrated24 seconds per sample Isotopes measured: As-75,
Cd-111, I-127,
Hg-202, Pb-208 (207,206)
188
TABLE IIDetection Limits, Repeatabilities, and Accuracies for
Hg Determination by MFCC in Comparison to Results Obtained by Solution Nebulization and Cold Vapor FIAS-ICP-MS
Detection Repeat- ValidationLimits ability CRM Experimental Certified
Method (3 σ) % RSD value* (µg/g) value (µg/g)
MFCC 0.019 ng 1.9 ng/ga 20–30 Human hairSolid IAEA-085 15.9±5.8 22.9±3.4
IAEA-086 0.41±0.04 0.57±0.15
PUC-2 0.64±0.16 0.51±0.19
OthersIAEA-Mussel 0.96±0.33 0.95±0.1
(MA-M-2/TM)
IAEA-Fish 0.40±0.05 0.47±0.02
(MA-A-2/TM)
Sediment 0.137±0.045 0.129±0.012
(BCSS-1)
MFCC 0.066 ng 0.066 12 Human hairliquid ng/mLb GBW-09101 2.14±0.34 2.16±0.21
FIAS 0.0025 0.25 1.7 Human hair(Vapor ng/mLc ng/gd GBW-09101 2.35±0.28 2.16±0.21
generation)
Conven- 0.0082 0.82 2.0 Human hairtional ng/mL ng/ge GBW-09101 1.98±0.05 2.16±0.21nebulization
(Cyclone-Meinhard)
* Mean ± standard deviation, N=3; a = based on combustion of a 10-mg sample;b = based on combustion of a 1-mL sample; c = loop 500 µL; d = loop 500 mL, sample dilution factor of 100; e = sample dilution factor of 100.
however did not release measurabletraces of Hg when submitted to a second heating step. No conden-sation of organic residues withinthe tubing line to the torch or atthe sampler/skimmer interface was observed, indicating efficientoxidation of the volatilized prod-ucts achieved by passage throughthe cobalt oxide-alumina reactionzone.
A very critical parameter is thesweep gas flow which determinesthe residence time of the analyte in the plasma and therefore its ion-ization efficiency. Vigorous com-bustion of highly flamable organicmaterial results in a pressure wave,which not only affects the analyteresidence time but sometimesextinguishes the plasma. Reductionof the sweep gas flow (0.40 L/min)and substitution of a smaller diame-ter injector (i.d. 0.85 mm) for thestandard one helped to overcomethis effect.
Figure 2 exemplifies a transientHg signal profile obtained by com-bustion of 10.8 mg of the CRM sediment sample MESS-1, contain-ing 1.84 ng Hg. Combustion ofother materials (hair, filter paper,mussel homogenate) showed thatpeak shapes are not influenced significantly by the sample matrix.The usual memory effects for Hg inICP-MS have been observed in thesystem (furnace/tubing/mass spec-trometer) when solid samples wereashed/evaporated. Figure 3 showsthe decrease of the Hg-signal withtime after ashing 13.2 mg of thesediment sample MESS-1 (2.25 ng of Hg). Typically, reduction of thepeak maximum intensity to 1–2% is obtained within 10 seconds.
RESULTS AND DISCUSSION
Combustion Conditions
The efficiency of combustion in the minitube furnace depends on oven temperature and oxygenflow rate. The device used in thiswork permitted regulation of thetemperature only to a limited range(700–950oC). Best results in termsof combustion, peak shape, andintensity were obtained at the highest possible temperature. Thecombustion was incomplete below
800oC; between 800 and 950oC thesignal increased by about 30%. Theoxygen flow was adjusted accord-ing to the sample mass which canbe allocated into the boat sampler.For biological material, the upperlimit was about 10 mg, which couldbe ashed in an oxygen flow (com-mercial oxygen ≥99.5%) of 0.10L/min. Argon (0.40 L/min), mixedinto the oxygen flow (Figure 1),was used as a sweep gas. Ashing of biological material sometimesresulted in a small residue, which

189
AtomicSpectroscopy
Vol. 18(6), Nov./Dec. 1997
AtomicSpectroscopy
Calibration and Validation ProceduresAs has already been mentioned earlier, a criti-
cal parameter which affects signal intensity andtherefore precision and detection limit is theplasma geometry, which may be disturbed dur-ing the sample combustion process. The use ofan internal standard would help to overcomesome of these problems. However, since mer-cury is very unique in regard to volatility and ion-ization potential, the choice of such an internalstandard is difficult. For this reason, it is benefi-cial to make calibration for solid sample analysisby combustion of similar solid reference materi-als and use an analogous procedure for liquidsamples. A typical calibration curve for a hairreference material is shown in Figure 4. Linearcalibration plots (r > 0.99) were also obtainedfor other matrices (spiked filter paper, marinesediment). Signal precision of repeated combus-tions/volatilizations was about 12% for liquidsamples. For solid samples, precision underrepeatability conditions was lower (between 20and 30%), which reflects at least in part sampleinhomogeneity due to the still small sample sizeused (5–20 mg). Mass and concentration detec-tion limits obtained from 10 blank readings andthe sensitivity of the analytical curves are sum-marized in Table II together with 3σ detection limits, typical repeatabilities, and accuraciesobtained by MFCC. For comparison, dataachieved by solution nebulization and cold vapor FIAS with the same ICP-MS were includedin Table II (13). The data show that MFCCachieves sample detection limits comparable toconventional nebulization ICP-MS, but higherthan obtained by the FIAS cold vapor technique.Repeatability is clearly poorer for MFCC than for the other methods as a consequence of theless reproducible plasma excitation conditionsand the lower sample mass used.
Validation of the method was performed by using different CRMs. For all samples analyzed, agreement within the recommendedconcentration ranges was obtained (Table II).Furthermore, the same analytical curve obtainedfor hair (Figure 4) was used to determine Hg in other certified biological reference materials(mussel, fish flesh homogenate). Agreement with the certified values indicates that combus-tion/volatilization transports mercury with simi-lar efficiency from different biological matrices.Also calibration by combustion of spiked filterpaper permitted accurate determination of mercury in hair samples (Table II).
Fig.3. Illustration of the memory effect observed after combustion of a 13.2-mg marine sediment sample CRM MESS-1, containing 2.25 ng Hg.
Fig. 4. Calibration curve for Hg established by combustion of a human hair certified reference material (GBW-09101). Plotted intensities represent mean values of three combustions.
Fig. 2. Transient Hg signal peak obtained by MFCC on a 10.8-mg marine sediment sample CRM MESS-1,containing 1.84 ng Hg.

190
signal peaks for Pb, Cd, As, and Iare presented in Figure 5. To obtain these signals, the catalystwas removed from the combustion tube as it has been observed that its presence results in broaderpeaks of lower intensity for theseless volatile elements, indicatingretarded and incomplete transfer of the analyte into the plasma.Although the oxygen flow wasincreased to 0.2 L/min, slight car-bon deposition was visible at thecolder parts of the combustiontube and in the tube linings, whichdid not disturb the analysis duringat least eight hours of workingtime.
Figure 6 shows calibrationcurves for Pb and I obtained byspiked filter paper combustions. By means of the Pb curve it waspossible to determine lead in thehuman hair reference materialGBW-09101 within the certifiedrange of concentration (Pb: 7.2 ±0.7 µg/g).
The usefullness of the proposedcombustion method for the rapiddetermination of Hg in a sedimentand in a spiked urine sample isdemonstrated in Table II. For bothsample types, good conformity with the certified or expected values (urine) was obtained.
Application of the Minitube Furnace for Elements Otherthan Hg
Although the purpose of thispaper was to present a fast methodfor mercury determination in bio-logical samples, some preliminaryresults for other volatile elementswill be shown. In principle, themethod should have prospectivesfor the determination of Pb, Cd, As, Bi, I, and some other volatileelements. When ICP-MS is used as an elemental detector, theknown benefits of a dry plasma,such as lower oxide levels, will be achieved by microfurnace com-bustion. Examples of transient
CONCLUSION
A new, simple, and inexpensivesolid sampling device for the deter-mination of mercury by ICP-MS has been presented. The principleused is that of catalytic combustionin a minitube furnace. Very fast and moderately precise and accu-rate determinations of Hg in differ-ent matrices were demonstrated,suggesting that the proposedmethod is especially attractive for surveillance and screening pur-poses. Improvements in the furnacedesign and operational conditions,e.g., higher ashing temperature,lower dead volume of the wholesystem, sample boats with highersurface/volume ratio, optimizationof the amount of catalyst, will help to increase the performance of MFCC. Work is in progress toevaluate the potential of minitubefurnace combustion as an inexpen-sive introduction device for othervolatile elements using ICP-MS
Fig. 5. Transient signal peaks of other volatile elements obtained by microfurnace combustion ICP-MS of spiked filter samplescontaining each 10 ng of the element.
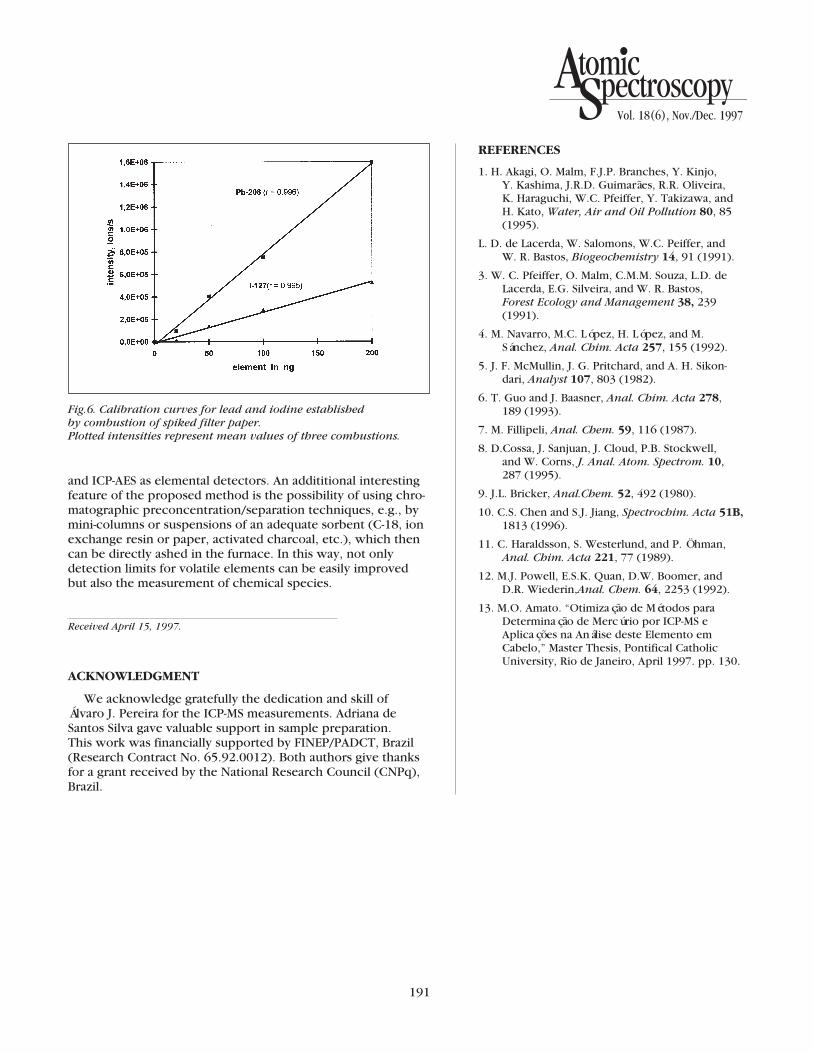
191
AtomicSpectroscopy
Vol. 18(6), Nov./Dec. 1997
Fig.6. Calibration curves for lead and iodine established by combustion of spiked filter paper. Plotted intensities represent mean values of three combustions.
and ICP-AES as elemental detectors. An addititional interestingfeature of the proposed method is the possibility of using chro-matographic preconcentration/separation techniques, e.g., bymini-columns or suspensions of an adequate sorbent (C-18, ionexchange resin or paper, activated charcoal, etc.), which thencan be directly ashed in the furnace. In this way, not onlydetection limits for volatile elements can be easily improvedbut also the measurement of chemical species.
Received April 15, 1997.
ACKNOWLEDGMENT
We acknowledge gratefully the dedication and skill ofÁlvaro J. Pereira for the ICP-MS measurements. Adriana de Santos Silva gave valuable support in sample preparation. This work was financially supported by FINEP/PADCT, Brazil(Research Contract No. 65.92.0012). Both authors give thanksfor a grant received by the National Research Council (CNPq),Brazil.
REFERENCES
1. H. Akagi, O. Malm, F.J.P. Branches, Y. Kinjo, Y. Kashima, J.R.D. Guimarães, R.R. Oliveira, K. Haraguchi, W.C. Pfeiffer, Y. Takizawa, andH. Kato, Water, Air and Oil Pollution 80, 85(1995).
L. D. de Lacerda, W. Salomons, W.C. Peiffer, and W. R. Bastos, Biogeochemistry 14, 91 (1991).
3. W. C. Pfeiffer, O. Malm, C.M.M. Souza, L.D. deLacerda, E.G. Silveira, and W. R. Bastos, Forest Ecology and Management 38, 239(1991).
4. M. Navarro, M.C. López, H. López, and M.Sánchez, Anal. Chim. Acta 257, 155 (1992).
5. J. F. McMullin, J. G. Pritchard, and A. H. Sikon-dari, Analyst 107, 803 (1982).
6. T. Guo and J. Baasner, Anal. Chim. Acta 278, 189 (1993).
7. M. Fillipeli, Anal. Chem. 59, 116 (1987).
8. D.Cossa, J. Sanjuan, J. Cloud, P.B. Stockwell, and W. Corns, J. Anal. Atom. Spectrom. 10,287 (1995).
9. J.L. Bricker, Anal.Chem. 52, 492 (1980).
10. C.S. Chen and S.J. Jiang, Spectrochim. Acta 51B,1813 (1996).
11. C. Haraldsson, S. Westerlund, and P. Öhman,Anal. Chim. Acta 221, 77 (1989).
12. M.J. Powell, E.S.K. Quan, D.W. Boomer, andD.R. Wiederin,Anal. Chem. 64, 2253 (1992).
13. M.O. Amato. “Otimização de Métodos paraDeterminação de Mercúrio por ICP-MS e Aplicações na Análise deste Elemento emCabelo,” Master Thesis, Pontifical Catholic University, Rio de Janeiro, April 1997. pp. 130.
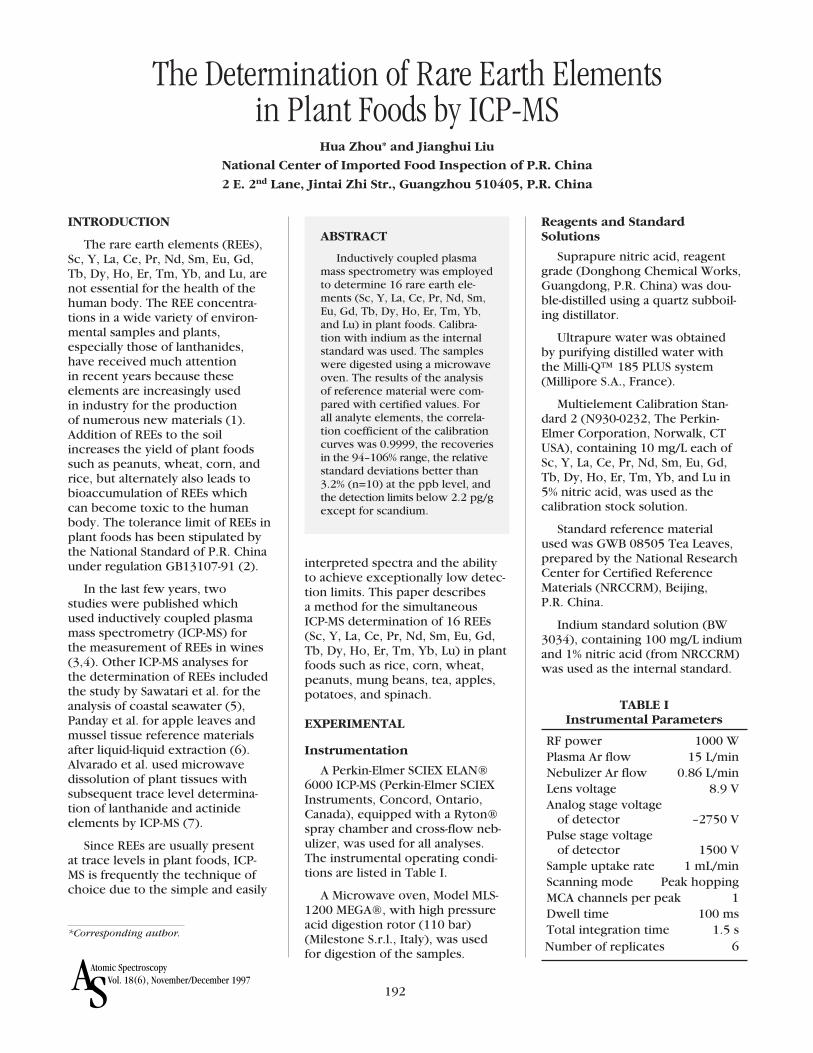
192SAAtomic SpectroscopyVol. 18(6), November/December 1997
INTRODUCTION
The rare earth elements (REEs),Sc, Y, La, Ce, Pr, Nd, Sm, Eu, Gd,Tb, Dy, Ho, Er, Tm, Yb, and Lu, arenot essential for the health of thehuman body. The REE concentra-tions in a wide variety of environ-mental samples and plants,especially those of lanthanides,have received much attention in recent years because these elements are increasingly used in industry for the production of numerous new materials (1).Addition of REEs to the soilincreases the yield of plant foodssuch as peanuts, wheat, corn, andrice, but alternately also leads tobioaccumulation of REEs which can become toxic to the humanbody. The tolerance limit of REEs inplant foods has been stipulated bythe National Standard of P.R. Chinaunder regulation GB13107-91 (2).
In the last few years, two studies were published which used inductively coupled plasmamass spectrometry (ICP-MS) for the measurement of REEs in wines(3,4). Other ICP-MS analyses forthe determination of REEs includedthe study by Sawatari et al. for theanalysis of coastal seawater (5),Panday et al. for apple leaves andmussel tissue reference materialsafter liquid-liquid extraction (6).Alvarado et al. used microwave dissolution of plant tissues withsubsequent trace level determina-tion of lanthanide and actinide elements by ICP-MS (7).
Since REEs are usually present at trace levels in plant foods, ICP-MS is frequently the technique ofchoice due to the simple and easily
interpreted spectra and the abilityto achieve exceptionally low detec-tion limits. This paper describes a method for the simultaneous ICP-MS determination of 16 REEs(Sc, Y, La, Ce, Pr, Nd, Sm, Eu, Gd,Tb, Dy, Ho, Er, Tm, Yb, Lu) in plantfoods such as rice, corn, wheat,peanuts, mung beans, tea, apples,potatoes, and spinach.
EXPERIMENTAL
Instrumentation
A Perkin-Elmer SCIEX ELAN®6000 ICP-MS (Perkin-Elmer SCIEXInstruments, Concord, Ontario,Canada), equipped with a Ryton®spray chamber and cross-flow neb-ulizer, was used for all analyses.The instrumental operating condi-tions are listed in Table I.
A Microwave oven, Model MLS-1200 MEGA®, with high pressureacid digestion rotor (110 bar) (Milestone S.r.l., Italy), was used for digestion of the samples.
Reagents and StandardSolutions
Suprapure nitric acid, reagentgrade (Donghong Chemical Works,Guangdong, P.R. China) was dou-ble-distilled using a quartz subboil-ing distillator.
Ultrapure water was obtained by purifying distilled water with the Milli-Q™ 185 PLUS system (Millipore S.A., France).
Multielement Calibration Stan-dard 2 (N930-0232, The Perkin-Elmer Corporation, Norwalk, CTUSA), containing 10 mg/L each ofSc, Y, La, Ce, Pr, Nd, Sm, Eu, Gd,Tb, Dy, Ho, Er, Tm, Yb, and Lu in5% nitric acid, was used as the calibration stock solution.
Standard reference material used was GWB 08505 Tea Leaves,prepared by the National ResearchCenter for Certified ReferenceMaterials (NRCCRM), Beijing, P.R. China.
Indium standard solution (BW3034), containing 100 mg/L indiumand 1% nitric acid (from NRCCRM)was used as the internal standard.
*Corresponding author.
The Determination of Rare Earth Elements in Plant Foods by ICP-MS
Hua Zhou* and Jianghui Liu
National Center of Imported Food Inspection of P.R. China
2 E. 2nd Lane, Jintai Zhi Str., Guangzhou 510405, P.R. China
ABSTRACT
Inductively coupled plasmamass spectrometry was employedto determine 16 rare earth ele-ments (Sc, Y, La, Ce, Pr, Nd, Sm,Eu, Gd, Tb, Dy, Ho, Er, Tm, Yb,and Lu) in plant foods. Calibra-tion with indium as the internalstandard was used. The sampleswere digested using a microwaveoven. The results of the analysisof reference material were com-pared with certified values. Forall analyte elements, the correla-tion coefficient of the calibrationcurves was 0.9999, the recoveriesin the 94–106% range, the relativestandard deviations better than3.2% (n=10) at the ppb level, andthe detection limits below 2.2 pg/gexcept for scandium.
TABLE IInstrumental Parameters
RF power 1000 WPlasma Ar flow 15 L/minNebulizer Ar flow 0.86 L/minLens voltage 8.9 VAnalog stage voltage
of detector –2750 VPulse stage voltage
of detector 1500 VSample uptake rate 1 mL/minScanning mode Peak hoppingMCA channels per peak 1Dwell time 100 msTotal integration time 1.5 sNumber of replicates 6
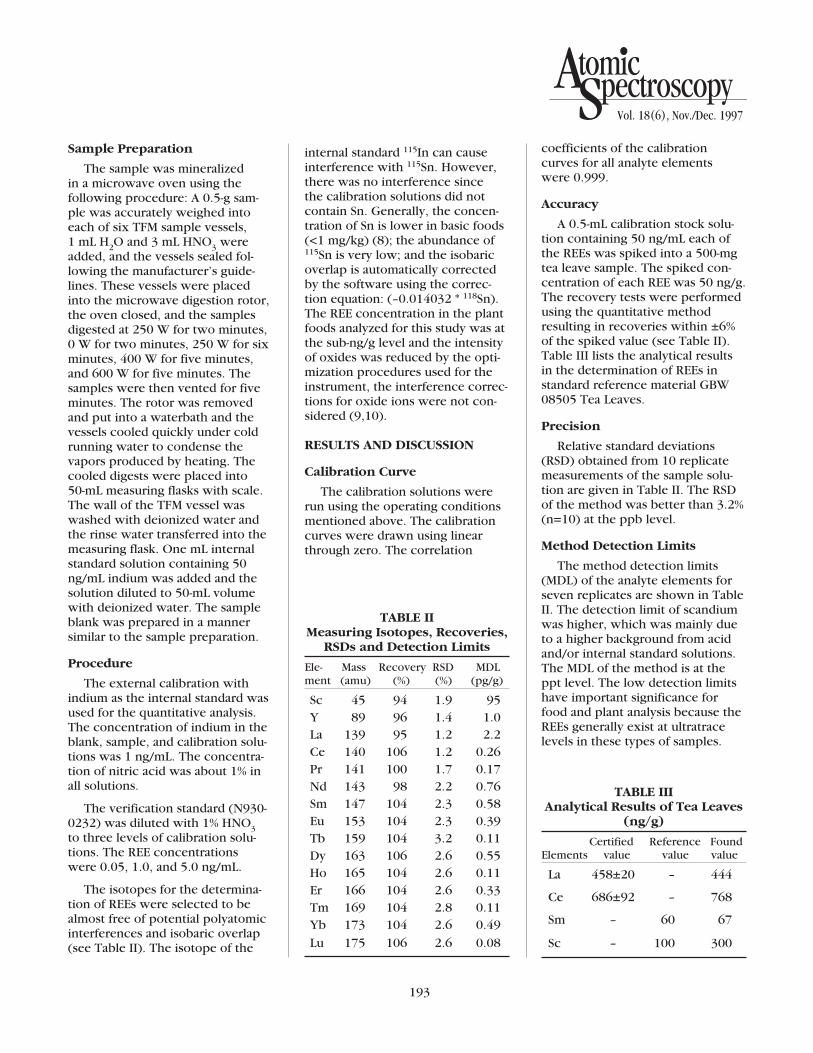
193
AtomicSpectroscopy
Vol. 18(6), Nov./Dec. 1997
Sample Preparation
The sample was mineralized in a microwave oven using the following procedure: A 0.5-g sam-ple was accurately weighed intoeach of six TFM sample vessels, 1 mL H2O and 3 mL HNO3 wereadded, and the vessels sealed fol-lowing the manufacturer’s guide-lines. These vessels were placedinto the microwave digestion rotor,the oven closed, and the samplesdigested at 250 W for two minutes,0 W for two minutes, 250 W for sixminutes, 400 W for five minutes,and 600 W for five minutes. Thesamples were then vented for fiveminutes. The rotor was removedand put into a waterbath and thevessels cooled quickly under coldrunning water to condense thevapors produced by heating. Thecooled digests were placed into 50-mL measuring flasks with scale.The wall of the TFM vessel waswashed with deionized water andthe rinse water transferred into themeasuring flask. One mL internalstandard solution containing 50ng/mL indium was added and thesolution diluted to 50-mL volumewith deionized water. The sampleblank was prepared in a mannersimilar to the sample preparation.
Procedure
The external calibration withindium as the internal standard wasused for the quantitative analysis.The concentration of indium in theblank, sample, and calibration solu-tions was 1 ng/mL. The concentra-tion of nitric acid was about 1% inall solutions.
The verification standard (N930-0232) was diluted with 1% HNO3to three levels of calibration solu-tions. The REE concentrations were 0.05, 1.0, and 5.0 ng/mL.
The isotopes for the determina-tion of REEs were selected to bealmost free of potential polyatomicinterferences and isobaric overlap(see Table II). The isotope of the
internal standard 115In can causeinterference with 115Sn. However,there was no interference since the calibration solutions did notcontain Sn. Generally, the concen-tration of Sn is lower in basic foods(<1 mg/kg) (8); the abundance of115Sn is very low; and the isobaricoverlap is automatically correctedby the software using the correc-tion equation: (–0.014032 * 118Sn).The REE concentration in the plantfoods analyzed for this study was atthe sub-ng/g level and the intensityof oxides was reduced by the opti-mization procedures used for theinstrument, the interference correc-tions for oxide ions were not con-sidered (9,10).
RESULTS AND DISCUSSION
Calibration Curve
The calibration solutions wererun using the operating conditionsmentioned above. The calibrationcurves were drawn using linearthrough zero. The correlation
coefficients of the calibrationcurves for all analyte elements were 0.999.
Accuracy
A 0.5-mL calibration stock solu-tion containing 50 ng/mL each ofthe REEs was spiked into a 500-mgtea leave sample. The spiked con-centration of each REE was 50 ng/g.The recovery tests were performedusing the quantitative methodresulting in recoveries within ±6%of the spiked value (see Table II).Table III lists the analytical resultsin the determination of REEs instandard reference material GBW08505 Tea Leaves.
Precision
Relative standard deviations(RSD) obtained from 10 replicatemeasurements of the sample solu-tion are given in Table II. The RSDof the method was better than 3.2%(n=10) at the ppb level.
Method Detection Limits
The method detection limits(MDL) of the analyte elements forseven replicates are shown in TableII. The detection limit of scandiumwas higher, which was mainly dueto a higher background from acidand/or internal standard solutions.The MDL of the method is at theppt level. The low detection limitshave important significance forfood and plant analysis because theREEs generally exist at ultratracelevels in these types of samples.
TABLE IIMeasuring Isotopes, Recoveries,
RSDs and Detection Limits
Ele- Mass Recovery RSD MDLment (amu) (%) (%) (pg/g)
Sc 45 94 1.9 95Y 89 96 1.4 1.0La 139 95 1.2 2.2Ce 140 106 1.2 0.26Pr 141 100 1.7 0.17Nd 143 98 2.2 0.76Sm 147 104 2.3 0.58Eu 153 104 2.3 0.39Tb 159 104 3.2 0.11Dy 163 106 2.6 0.55Ho 165 104 2.6 0.11Er 166 104 2.6 0.33Tm 169 104 2.8 0.11Yb 173 104 2.6 0.49
Lu 175 106 2.6 0.08
TABLE IIIAnalytical Results of Tea Leaves
(ng/g)
Certified Reference Found Elements value value value
La 458±20 – 444
Ce 686±92 – 768
Sm – 60 67
Sc – 100 300
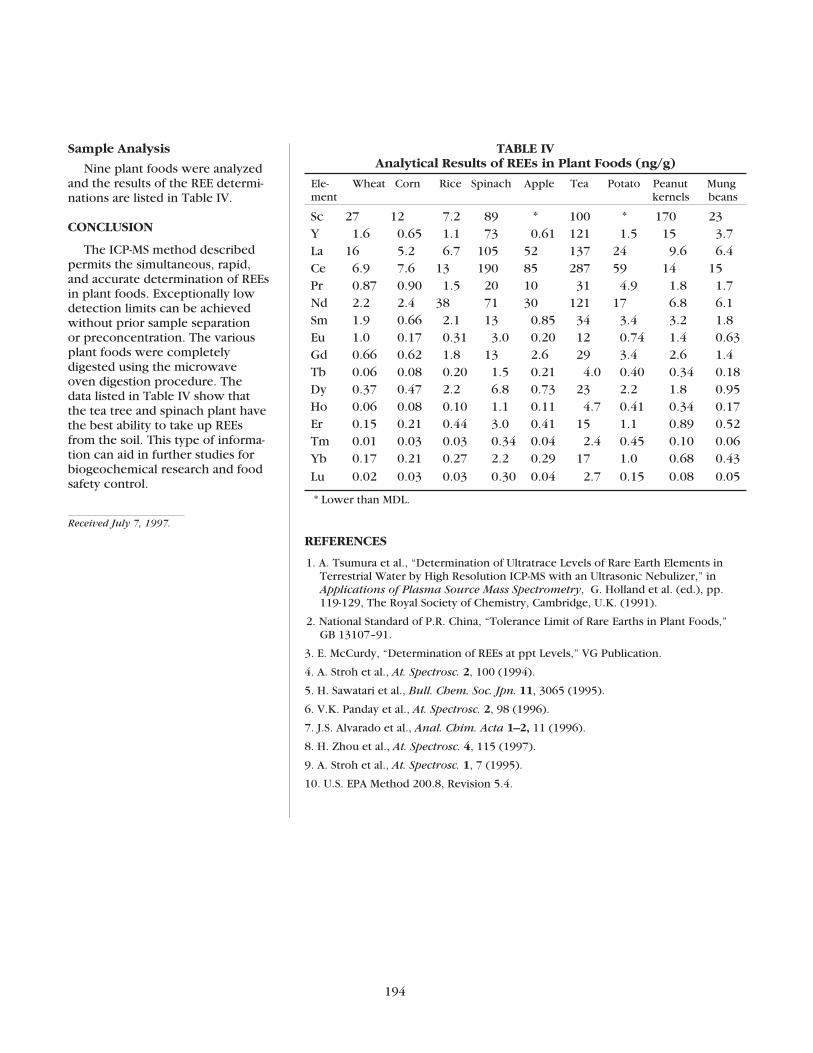
194
Sample Analysis
Nine plant foods were analyzedand the results of the REE determi-nations are listed in Table IV.
CONCLUSION
The ICP-MS method describedpermits the simultaneous, rapid,and accurate determination of REEsin plant foods. Exceptionally lowdetection limits can be achievedwithout prior sample separation or preconcentration. The variousplant foods were completelydigested using the microwave oven digestion procedure. The data listed in Table IV show that the tea tree and spinach plant havethe best ability to take up REEsfrom the soil. This type of informa-tion can aid in further studies forbiogeochemical research and foodsafety control.
Received July 7, 1997.
REFERENCES
1. A. Tsumura et al., “Determination of Ultratrace Levels of Rare Earth Elements inTerrestrial Water by High Resolution ICP-MS with an Ultrasonic Nebulizer,” inApplications of Plasma Source Mass Spectrometry, G. Holland et al. (ed.), pp.119-129, The Royal Society of Chemistry, Cambridge, U.K. (1991).
2. National Standard of P.R. China, “Tolerance Limit of Rare Earths in Plant Foods,” GB 13107–91.
3. E. McCurdy, “Determination of REEs at ppt Levels,” VG Publication.
4. A. Stroh et al., At. Spectrosc. 2, 100 (1994).
5. H. Sawatari et al., Bull. Chem. Soc. Jpn. 11, 3065 (1995).
6. V.K. Panday et al., At. Spectrosc. 2, 98 (1996).
7. J.S. Alvarado et al., Anal. Chim. Acta 1–2, 11 (1996).
8. H. Zhou et al., At. Spectrosc. 4, 115 (1997).
9. A. Stroh et al., At. Spectrosc. 1, 7 (1995).
10. U.S. EPA Method 200.8, Revision 5.4.
TABLE IVAnalytical Results of REEs in Plant Foods (ng/g)
Ele- Wheat Corn Rice Spinach Apple Tea Potato Peanut Mungment kernels beans
Sc 27 12 7.2 89 * 100 * 170 23Y 1.6 0.65 1.1 73 0.61 121 1.5 15 3.7La 16 5.2 6.7 105 52 137 24 9.6 6.4Ce 6.9 7.6 13 190 85 287 59 14 15Pr 0.87 0.90 1.5 20 10 31 4.9 1.8 1.7Nd 2.2 2.4 38 71 30 121 17 6.8 6.1Sm 1.9 0.66 2.1 13 0.85 34 3.4 3.2 1.8Eu 1.0 0.17 0.31 3.0 0.20 12 0.74 1.4 0.63Gd 0.66 0.62 1.8 13 2.6 29 3.4 2.6 1.4Tb 0.06 0.08 0.20 1.5 0.21 4.0 0.40 0.34 0.18Dy 0.37 0.47 2.2 6.8 0.73 23 2.2 1.8 0.95Ho 0.06 0.08 0.10 1.1 0.11 4.7 0.41 0.34 0.17Er 0.15 0.21 0.44 3.0 0.41 15 1.1 0.89 0.52Tm 0.01 0.03 0.03 0.34 0.04 2.4 0.45 0.10 0.06Yb 0.17 0.21 0.27 2.2 0.29 17 1.0 0.68 0.43
Lu 0.02 0.03 0.03 0.30 0.04 2.7 0.15 0.08 0.05
* Lower than MDL.
195SAAtomic SpectroscopyVol. 18(6), November/December 1997
INTRODUCTION
It is well known that cadmiumand its compounds are highly toxiceven at low concentration levelsand results in bioaccumulation.Because the levels of cadmium inenvironmental samples are nowmandated, sensitive analytical tech-niques are required to obtain lowdetection limits. Usually the deter-mination of cadmium in environ-mental and biological materials by atomic absorption spectrometry(AAS) requires the separation andpreconcentration of the analytesfrom matrices due to its low levelsof concentration. Many flow injec-tion (FI) separation and preconcen-tration methods were developed for this purpose (1), including on-line ion exchange (2), on-line solidextraction (3), and on-line copre-cipitation-dissolution (4).
The generation of volatile analytespecies from aqueous solutions is a specialized form of sample intro-duction in atomic spectrometry.Hydride generation atomic absorp-tion spectrometry (HGAAS) is themost widely used vapor generationtechnique and utilizes a reductant,often sodium tetrahydroborate,which acts as a source of nascenthydrogen to form gaseous, covalenthydrides of elements in Group 4–6(e.g., As, Se, Te, Bi, Sb, Pb, Ge, Sn).Some elements can also be atom-ized at ambient temperature. Coldvapor atomic absorption spectrom-etry (CVAAS) has been widely usedfor the determination of mercury.The FI-HGAAS method for thedetermination of hydride formingelements and the FI-CVAAS methodfor the determination of mercurywere developed and successfully
for AFS (Atomic Fluorescence Spec-trometry). Ebdon et al. (8) gener-ated the cadmium species with the same reagent, and obtained a detection limit of 0.02 µg/L forAFS. Valdes et al. (9) determinedcadmium, using NaBH4 as thereductant reagent, for gaseous sam-ple introduction to the ICP-AES inthe presence of didodecyldimethylammonium bromide (DDAB),resulting in a detection limit of 1 µg/L. Guo et al. (10,11), usingthiourea as the organic medium and potassium tetrahydroborate as reductant, obtained a detectionlimit of 8 ng/L for AFS and 0.08µg/L for AAS using a continuous-flow system. Sanz-Medel (12) deter-mined cadmium in the presence of DDAB by AAS in a quartz tube at room temperature and obtained a detection limit of 0.08 µg/L. Inthe works mentioned above, thevapor cadmium species are gener-ated in organic-containing media.Barrera et al. (13) developed a FI-CVG method with preconcentra-tion on coated graphite tubes for the determination of cadmiumin seawater by ETAAS using cobalt,gallium, and silicon as catalysts for cadmium species generation.Compa et al. (14) reviewed theeffects of organic media on the generation of volatile species foratomic spectrometry. The detectionlimit for cadmium in water usingbatch vapor generation is reportedas >103 ng/mL, but decreased to 1–7 ng/mL in the presence ofDDAB, DHDF, TX-100, CTAB, etc.
In this paper, the reactionbetween cadmium and sodiumtetrahydroborate in aqueous,thiourea-, nickel- and thiourea-nickel-containing media were studied. The relation betweenabsorption signals and reaction coil lengths were investigated usingthe FI technique. A FI-CVAAS
Corresponding author.
The Determination of Trace Cadmium by Flow Injection Cold Vapor Generation AAS
Meiying Liu and Shukun Xu*Flow Injection Analysis Research Center, Chemistry Department, Northeastern University
Box 332, 110006 Shenyang, P.R. China
ABSTRACT
A method for the determina-tion of cadmium by FI-CVAAS(flow injection cold vapor genera-tion atomic absorption spectrom-etry) using the reaction withtetrahydroborate in acidic aque-ous solutions was developed. The difference in sensitivities in aqueous, thiourea-, nickel- and thiourea-nickel (cobalt)-containing media using the FItechnique was studied. Thechemical and hydrodynamic para-meters for cadmium cold vaporgeneration were optimized andthe interference of coexistingelements is discussed. The detec-tion limit (3σ) was 30 ng/L with a sampling frequency of 240/h.The precision was 2.5% RSD(n=11) at the 4-µg/L Cd level. The method was applied to theanalysis of water, urine, blood,human hair, geochemical soil and polluted soil standard refer-ence samples. The results are ingood agreement with the certi-fied values of the standard materi-als. The recoveries in thesesample solutions spiked with 4 µg/L Cd are at 96–104%.
used for the analyses of environ-mental and biological materials (5).
In recent years, it was reportedthat cadmium can be determinedby vapor generation. Cacho et al.(6) reported the generation of avolatile cadmium species in N,N'-dimethylformamide using sodiumtetrahydroborate as the reagent.Cadmium was determined by AASin a heated quartz tube, resulting in a detection limit of 9.1 ng.Dulivo et al. (7) demonstrated thatcadmium can be determined inaqueous samples using sodiumtetraethylborate as the ethylatingagent, resulting in a detection limitof 1 mg/L for AAS and 0.2 µg/L

196
method was developed for thedetermination of trace amounts of cadmium in biological and envi-ronmental materials. The detectionlimit (3σ) was 30 ng/L Cd with asampling frequency of 240/h. Theprecision was 2.5% RSD (n=11) at the 4-µg/L level.
EXPERIMENTAL
Instrumentation
A Perkin-Elmer® Model 2100atomic absorption spectrometerwith a deuterium lamp backgroundcorrector was used combined witha Model FIAS™-200 flow injection system. A cadmium hollow cathodelamp was used at a wavelength of228.8 nm with a spectral band passof 2.0 nm, operated at 8 mA. Peakheight was used for evaluating theresults throughout this work. Theanalyte peak heights were recordedon a computer, presented on ahigh-resolution screen, and printedout using an Epson® EX-800 printer.The rotation of the two multichan-nel peristaltic pumps and the actua-tions of the valve were programmedand automatically controlled by thecomputer software. The gas-liquidseparator (GLS) used is similar tothe transparent plastic separatordescribed by Fang (5), except it hasan extra outlet above the G-L outletfor the carrier gas (see Results andDiscussion section).
Reagents and Standard Solution
All reagents were of analyticalgrade and de-ionized water wasused throughout.
Sodium tetrahydroborate (3%,m/v, Merck, Schuchardt, Germany)solution was prepared daily by dis-solving sodium tetrahydroborate in sodium hydroxide (0.3%, m/v)solution.
Analytical reagent gradehydrochloric acid (Anshan Chemi-cal Co., Anshan, China) was puri-fied by isothermal diffusion.
Thiourea ( Hengxin ChemicalCo., Shanghai, China) solution(10%, m/v) was treated by passingan ion exchange column packedwith Amberlite® IRC-718 cationexchange resin (SIGMA, USA).
The acids used were nitric acid(63%, w/v, Jinxi Chemical Co.,Jinxi, China); hydrofluoric acid(35%, m/v Tianjin Eastern ChemicalCo., Tianjin, China), and HClO4(70%, Tianjin Eastern Chemical Co.,Tianjin, China).
The sample solutions were 10 000 mg/L Ni(II) solution innickel chloride (Xincheng Chemi-cals Company, Shenyang) and 10 000 mg/L Co(II) solution incobalt chloride (No. 4 ChemicalsCompany, Shenyang).
Four series of standard solutionscontaining 0, 1, 2, 3, 4, and 5 ng/mLcadmium were prepared for com-parison purposes by stepwise
dilution of a 100-mg/L stock solu-tion [(GBW (E) 08005] (Institute ofChemical Metallurgy, Beijing, P.R.China) with (a) 0.23 mol/L HCl; (b) 0.23 mol/L HCl and 1% thiourea;(c) 0.23 mol/L HCl and 1% thioureawith 10 mg/L Co; and (d) 0.23 mol/LHCl and 1% thiourea with 1.0 mg/LNi, respectively. For the methoddescribed, the matrix containing0.23 mol/L HCl and 1% thiourea and 1.0 mg/L Ni was chosen.
Procedure
The flow injection operating program is given in Table I and theFI manifold used for CVAAS is shownin Figure 1, together with the opti-mized operating parameters.
In the loading step (Figure 1a),the standard or sample solution was filled into the sample loop. Inthe injection step (Figure 1b), end-ing the sampling, the valve rotatedautomatically to injection position.Pump 2 was speeded up (as in Fig.1),
Fig. 1. Flow injection manifold for CVAAS determination of cadmium. (a) Sample loading, (b) Sample injection.P1, P2 = peristaltic pumps; V = injection valve; AAS = atomic absorption spectrometer; GLS = gas-liquid separator; S = sample; R = NaBH4 ; C = Carrier, 0.23 M HCl; W = waste; SL = sampling loop; Ar = argon carrier gas.
TABLE IThe Flow Injection Operating
Program
Time Pump 1 Pump 2 ValveStep (s) (mL/min) (mL/min) position
1. 5 0.8 32 Fill(Reductant) (Waste)1.5 (HCl)
2. 10 2.0 32 Inject(Reductant) (Waste)4.0 (HCl)
A B

197
AtomicSpectroscopy
Vol. 18(6), Nov./Dec. 1997
and the sample or standard solutionstored in the sampling loop was carried out and merged with thereductant. The vapor was separatedin the GLS and then led to thequartz tube (AAS) at room tempera-ture where the Cd was determined.
Sample Pretreatment
Hair and RiceAn exactly weighed 0.3000 g of
human hair or 0.5000 g of rice sam-ple was soaked for 2 h in a beakerwith a 10-mL nitric acid:perchloricacid mixture (3:1, v/v). This mix-ture was gently heated on a hotplate to near-dryness. Then 3.45 mL1 mol/L hydrochloric acid wasadded and the beaker gently heatedon the hot plate until a clear solu-tion was obtained. After cooling,the solution was transferred to a 15-mL PVC tube, then 1 mL 5%Al2(SO4)3 and 1 mL 5% BaCl2 wereadded. After coprecipitation, a thiourea- and nickel-containingsolution was added to achieve a concentration of 1% and 1 mg/L,respectively. The solution was thendiluted to 15 mL with deionizedwater.
Geochemicals and Soil Exactly weighed 0.1000-g sam-
ples were soaked with a 3 mL nitricacid:hydrofluoric acid mixture (7:3,v/v) in PTFE (polytetrafluorothy-lene) crucibles for 2 h, then gentlyheated to near dryness on a hotplate. After cooling, 11.5 mL 1 mol/LHCl was added, and gently heatedon the hot plate until a clear solu-tion was obtained. After cooling,the solution was transferred to a 50-mL volumetric flask, then 1 mL5% Al2(SO4)3 and 1 mL BaCl2 wereadded. After coprecipitation, thethiourea- and nickel-containingsolution was added to achieve a concentration of 1% and 1 mg/L,respectively. The solution was thendiluted to volume with deionizedwater.
Blood and Urine Seven mL nitric acid:perchloric
acid mixture (10:1, v/v) was addedto 1-mL blood or urine in a beaker,gently heated to near dryness on a hot plate. After cooling, 2.3 mL 1 mol/L HCl was added and thebeaker gently heated on the hotplate until a clear solution wasobtained. After cooling, the solu-tion was transferred to a 15-mL PVC tube, then 1 mL 5% Al2(SO4)3and 1 mL BaCl2 were added. Aftercoprecipitation, the thiourea- andnickel-containing solution wasadded to achieve a concentration of 1% and 1 mg/L, respectively. The solution was then diluted to 10 mL with de-ionized water.
The water sample was filteredand acidified to 0.23 mol/L HClwith 1.0 mol/L HCl.
Method Development
Previous works reported thatorganic media are beneficial for the generation of volatile cadmiumspecies (9–12). The behavior ofcadmium volatile species genera-tion in different media was themain aim of this work, especiallythe generation of cadmium vapor in aqueous solution without anorganic medium, which wasreported to be almost impossiblein a previous work (14). The reac-tion of cadmium with sodiumtetrahydroborate in aqueous,thiourea-, nickel-, and thiourea-nickel (cobalt)-containing mediawas studied. The relation betweenabsorption signals and reaction coillengths was investigated using theFI technique. The flow injectionparameters and chemical reactionconditions were optimized using a univariate approach with the vaporgeneration efficiency as the mainfigure of merit, but with simultane-ous consideration on precision andinterferences from co-existing ele-ments. The parameters used in a previous FI vapor generation sys-tem were used as reference for theoptimization studies (5).
RESULTS AND DISCUSSION
Manifold Design
The manifold used in this workis different from the conventionalmanifold (5) in that the carrier gasentrance is at the top. In the con-ventional manifold, the carrier gasand product of the reaction aremixed before going into the gas-liquid separator. However, due tothe high concentration of NaBH4used in this study, which leads to aviolent reaction and large amountsof gas, the carrier gas entrance wasmoved to the top of the reactionproduct entrance. This helps toenhance the efficiency of gas-liquidseparation and is beneficial to thedetection of the cadmium vaporspecies.
Optimization of Conditions forthe Generation of Volatile CdSpecies in Aqueous Solution
Acidity of Sample and CarrierSolution
The efficiency of the volatile cadmium species generation greatlydepends on the acidity at which the reaction is performed. Guo etal. (10,11) and Barrera et al. (14) studied the influence of sampleacidity on the signal in aqueoussolution containing 1% urea, using5% KBH4 as the reductant, and1mg/L Ga, using 3% NaBH4. Theyfound that there is a plateau in therange of 0.22–0.28 mol/L HCl sam-ple solution. We studied the effectsof the sample and carrier acidity on the signal in aqueous solution at 3% NaBH4 and found that it issimilar to their results. There is a plateau in the sample and carriersolution of 0.20–0.25 mol/L HCl for the FI system, which is not diffi-cult to control in practical analysis.Considering the potential error inpreparing solutions, 0.23 mol/L HClwas selected.
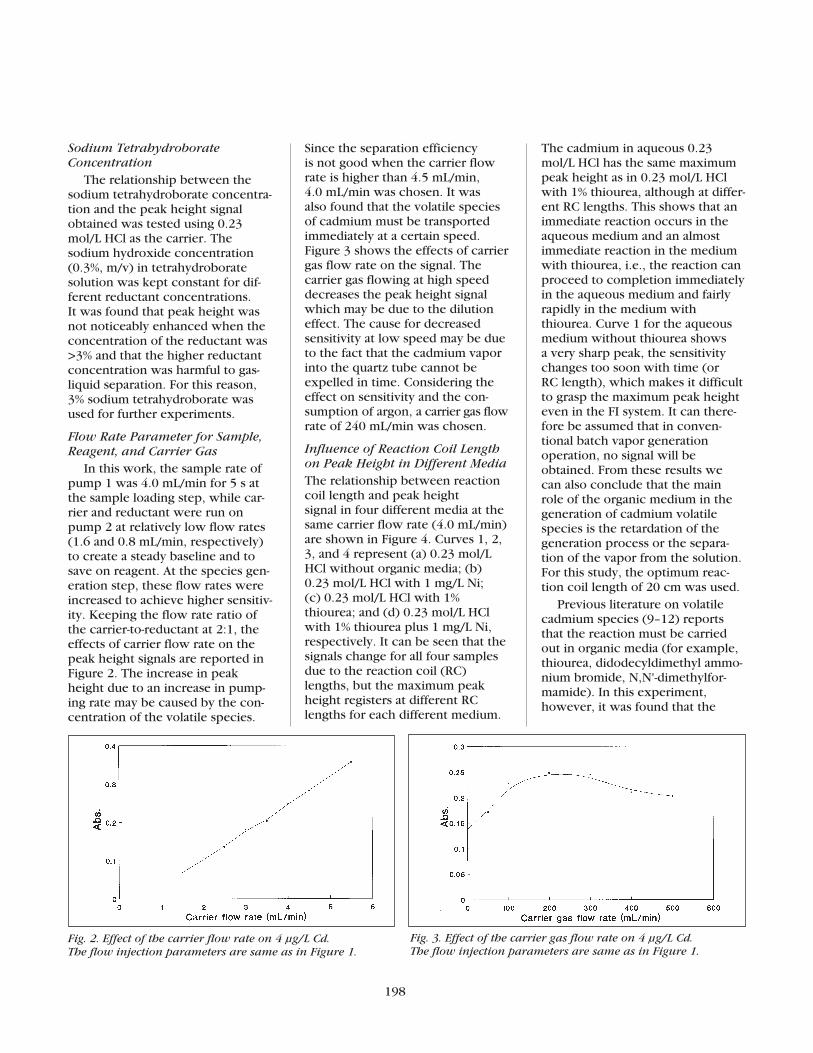
198
Sodium Tetrahydroborate Concentration
The relationship between thesodium tetrahydroborate concentra-tion and the peak height signalobtained was tested using 0.23mol/L HCl as the carrier. Thesodium hydroxide concentration(0.3%, m/v) in tetrahydroboratesolution was kept constant for dif-ferent reductant concentrations. It was found that peak height wasnot noticeably enhanced when theconcentration of the reductant was>3% and that the higher reductantconcentration was harmful to gas-liquid separation. For this reason,3% sodium tetrahydroborate wasused for further experiments.
Flow Rate Parameter for Sample,Reagent, and Carrier Gas
In this work, the sample rate ofpump 1 was 4.0 mL/min for 5 s atthe sample loading step, while car-rier and reductant were run onpump 2 at relatively low flow rates(1.6 and 0.8 mL/min, respectively)to create a steady baseline and tosave on reagent. At the species gen-eration step, these flow rates wereincreased to achieve higher sensitiv-ity. Keeping the flow rate ratio ofthe carrier-to-reductant at 2:1, theeffects of carrier flow rate on thepeak height signals are reported inFigure 2. The increase in peakheight due to an increase in pump-ing rate may be caused by the con-centration of the volatile species.
Since the separation efficiency is not good when the carrier flowrate is higher than 4.5 mL/min, 4.0 mL/min was chosen. It was also found that the volatile speciesof cadmium must be transportedimmediately at a certain speed. Figure 3 shows the effects of carriergas flow rate on the signal. The carrier gas flowing at high speeddecreases the peak height signalwhich may be due to the dilutioneffect. The cause for decreased sensitivity at low speed may be dueto the fact that the cadmium vaporinto the quartz tube cannot beexpelled in time. Considering theeffect on sensitivity and the con-sumption of argon, a carrier gas flowrate of 240 mL/min was chosen.
Influence of Reaction Coil Lengthon Peak Height in Different MediaThe relationship between reactioncoil length and peak height signal in four different media at thesame carrier flow rate (4.0 mL/min)are shown in Figure 4. Curves 1, 2,3, and 4 represent (a) 0.23 mol/LHCl without organic media; (b)0.23 mol/L HCl with 1 mg/L Ni; (c) 0.23 mol/L HCl with 1%thiourea; and (d) 0.23 mol/L HClwith 1% thiourea plus 1 mg/L Ni,respectively. It can be seen that thesignals change for all four samplesdue to the reaction coil (RC)lengths, but the maximum peakheight registers at different RClengths for each different medium.
The cadmium in aqueous 0.23mol/L HCl has the same maximumpeak height as in 0.23 mol/L HClwith 1% thiourea, although at differ-ent RC lengths. This shows that animmediate reaction occurs in theaqueous medium and an almostimmediate reaction in the mediumwith thiourea, i.e., the reaction canproceed to completion immediatelyin the aqueous medium and fairlyrapidly in the medium withthiourea. Curve 1 for the aqueousmedium without thiourea shows a very sharp peak, the sensitivitychanges too soon with time (or RC length), which makes it difficultto grasp the maximum peak heighteven in the FI system. It can there-fore be assumed that in conven-tional batch vapor generationoperation, no signal will beobtained. From these results we can also conclude that the mainrole of the organic medium in thegeneration of cadmium volatilespecies is the retardation of thegeneration process or the separa-tion of the vapor from the solution.For this study, the optimum reac-tion coil length of 20 cm was used.
Previous literature on volatilecadmium species (9–12) reportsthat the reaction must be carriedout in organic media (for example,thiourea, didodecyldimethyl ammo-nium bromide, N,N'-dimethylfor-mamide). In this experiment,however, it was found that the
Fig. 2. Effect of the carrier flow rate on 4 µg/L Cd. The flow injection parameters are same as in Figure 1.
Fig. 3. Effect of the carrier gas flow rate on 4 µg/L Cd. The flow injection parameters are same as in Figure 1.

199
AtomicSpectroscopy
Vol. 18(6), Nov./Dec. 1997
not increase with an increase insample volume >150 µL, 150 µLwas chosen for this study.
Interferences from Co-existing Ions
The results of this study showthat thiourea reduces interference.The effect of 19 different co-exist-ing ions on the generation of cad-mium volatile species in aqueousacidic solution was tested and theresults are listed in Table II. It canclearly be seen that most transitionmetal ions such as cobalt, iron, andnickel accelerate the reaction,while copper has the most seriousrepressing effects. Selectingthiourea as the medium can masksome metal interferences or over-come interferences to a certainextent. The effect of co-existingions on the signals in the presenceof 1% thiourea is listed in Table III.
Since in the presence of thioureaand nickel ions, both the sensitivityand the tolerance to interferencesfrom co-existing ions are increasedgreatly, 1% thiourea (w/v) and 1 mg/L nickel were recommendedfor the final test solution. The addi-tion of thiourea and nickel does not influence the optimum acidityrange described above.
However, interference from copper and lead ions still cannot beeliminated with thiourea. For somecopper matrix samples, such as bio-logical materials (11), potassiumcyanide (0.5%, w/v) was added tothe sodium tetrahydroborate solu-tion, and no interference wasobserved in the presence of 1 mg/Lcopper. The effect of lead can becompletely removed by coprecipita-tion by adding 1 mL 5% Al2(SO4)3and 1 mL BaCl2 solution to the test solution. The determination of cad-mium can be carried out withoutfiltration after diluting to volume.
Performance of the Method
Using the FI manifold in Figure1, the recommended optimizedconditions were as follows:
Sample, in 0.23 mol/L hydro-chloric acid containing 1% thioureaand 1 mg/L nickel.
Carrier, 0.23 mol/L hydrochloricacid.
Reductant, 3% sodium tetrahy-droborate in 0.3% sodium hydrox-ide, adding 0.5% potassium cyanidefor biological digests.
Argon carrier gas, 240 mL/min.
Sample loop volume, 150 µL.
sensitivity of cadmium in acidicsolution with or without an organicmedium is almost the same, but thewater system showed lower toler-ance to interferences. Moreover,the experiments on the interferenceof co-existing ions indicate thatsome transition metal ions such asiron, cobalt, and nickel can increasethe sensitivity in thiourea-contain-ing media (Figure 4, curve 4) inwhich the medium containingthiourea and nickel was used. Guoet al. (10,11) reported using cobaltto enhance sensitivity. After com-paring the effects of cobalt andnickel in the presence of thiourea,it was found that a certain concen-tration of cobalt (5–10 mg/L) andnickel (0.5–1.5 mg/L) can acceler-ate the reaction, with nickel obtain-ing better results. When cobalt was used as the enhancing reagent(10,11), black precipitation wasoften observed on the wall of thereaction coil even at the lower con-centration of 1.0 mg/L, while use of nickel does not show this phe-nomenon. Nickel was subsequentlyused with thiourea for further experiments.
Effect of Sample Volume The effect of sample volume
on peak height signal is shown inFigure 5. Since peak height does
Fig. 4. Effect of reaction coil length on 8 µg/L Cd in (1) aqueous 0.23 mol/L HCl solution, (2) containing 1 mg/L Ni, (3) containing 1% thiourea and (4) containing 1% thiourea and 1 mg/L Ni. The flow injection parameters are the same as in Figure 1.
Fig.5. Effect of sampling volume on 4 µg/L Cd. The flow injection parameters are same as in Figure 1.
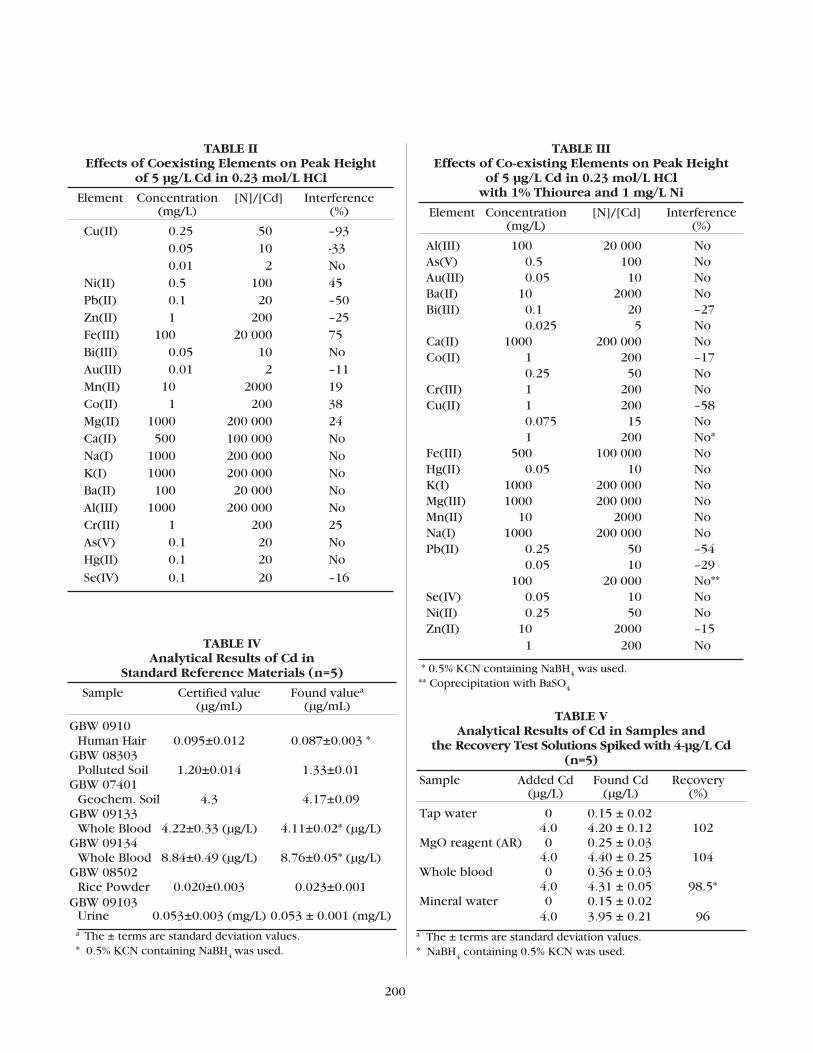
200
TABLE II Effects of Coexisting Elements on Peak Height
of 5 µg/L Cd in 0.23 mol/L HCl
Element Concentration [N]/[Cd] Interference(mg/L) (%)
Cu(II) 0.25 50 –930.05 10 -330.01 2 No
Ni(II) 0.5 100 45Pb(II) 0.1 20 –50Zn(II) 1 200 –25Fe(III) 100 20 000 75Bi(III) 0.05 10 NoAu(III) 0.01 2 –11Mn(II) 10 2000 19Co(II) 1 200 38Mg(II) 1000 200 000 24Ca(II) 500 100 000 NoNa(I) 1000 200 000 NoK(I) 1000 200 000 NoBa(II) 100 20 000 NoAl(III) 1000 200 000 NoCr(III) 1 200 25As(V) 0.1 20 NoHg(II) 0.1 20 No
Se(IV) 0.1 20 –16
TABLE IIIEffects of Co-existing Elements on Peak Height
of 5 µg/L Cd in 0.23 mol/L HCl with 1% Thiourea and 1 mg/L Ni
Element Concentration [N]/[Cd] Interference(mg/L) (%)
Al(III) 100 20 000 NoAs(V) 0.5 100 NoAu(III) 0.05 10 NoBa(II) 10 2000 NoBi(III) 0.1 20 –27
0.025 5 NoCa(II) 1000 200 000 NoCo(II) 1 200 –17
0.25 50 NoCr(III) 1 200 NoCu(II) 1 200 –58
0.075 15 No1 200 No*
Fe(III) 500 100 000 NoHg(II) 0.05 10 NoK(I) 1000 200 000 NoMg(III) 1000 200 000 NoMn(II) 10 2000 NoNa(I) 1000 200 000 NoPb(II) 0.25 50 –54
0.05 10 –29100 20 000 No**
Se(IV) 0.05 10 NoNi(II) 0.25 50 NoZn(II) 10 2000 –15
1 200 No
* 0.5% KCN containing NaBH4 was used.** Coprecipitation with BaSO4
TABLE IV Analytical Results of Cd in
Standard Reference Materials (n=5)
Sample Certified value Found valuea
(µg/mL) (µg/mL)
GBW 0910 Human Hair 0.095±0.012 0.087±0.003 *
GBW 08303 Polluted Soil 1.20±0.014 1.33±0.01
GBW 07401Geochem. Soil 4.3 4.17±0.09
GBW 09133 Whole Blood 4.22±0.33 (µg/L) 4.11±0.02* (µg/L)
GBW 09134 Whole Blood 8.84±0.49 (µg/L) 8.76±0.05* (µg/L)
GBW 08502 Rice Powder 0.020±0.003 0.023±0.001
GBW 09103 Urine 0.053±0.003 (mg/L) 0.053 ± 0.001 (mg/L)a The ± terms are standard deviation values.* 0.5% KCN containing NaBH4 was used.
TABLE VAnalytical Results of Cd in Samples and
the Recovery Test Solutions Spiked with 4-µg/L Cd(n=5)
Sample Added Cd Found Cd Recovery(µg/L) (µg/L) (%)
Tap water 0 0.15 ± 0.024.0 4.20 ± 0.12 102
MgO reagent (AR) 0 0.25 ± 0.034.0 4.40 ± 0.25 104
Whole blood 0 0.36 ± 0.034.0 4.31 ± 0.05 98.5*
Mineral water 0 0.15 ± 0.024.0 3.95 ± 0.21 96
a The ± terms are standard deviation values.* NaBH4 containing 0.5% KCN was used.
201
AtomicSpectroscopy
Vol. 18(6), Nov./Dec. 1997
Using the recommended condi-tions, the characteristic mass was 9.1 pg/0.0044A. A detection limit of 0.03 µg/L Cd (3σ) was obtainedwith a sampling frequency of240/h, and a precision of 2.5% RSDat the 4-µg/L Cd level ( n=11). Thecalibration curve (0–5 µg/L) was: A = 0.083 C+0.014 (r=0.9997, n=3).
Analytical Results
The proposed method wasapplied for the determination oftrace amounts of cadmium in Stan-dard Reference Material of humanhair (GBW 09101), polluted soil(GBW 08303), geochemical mater-ial (GBW 07401), whole blood(GBW 09133 and GBW 09134), rice(GBW 08502), urine (GBW 09103),and tap water. Tetrahydroboratesolution, containing potassiumcyanide, was used for the analysisof human hair and whole bloodsamples. The results obtainedagreed well with the certified val-ues and the recoveries of the tapwater are reasonable for trace met-als analysis. The results are listed in Tables IV and V, respectively.
CONCLUSION
Our study shows that the cadmium ion can react withtetrahydroborate in acidic aqueoussolution to form volatile specieswithout the presence of an organicmedium. Cadmium can subsequentlybe determined by FI-AAS in a quartztube atomizer at room temperature
at very low detection limits andwith good precision. The key fac-tors for performing the reactionare: (a) optimization of the flowinjection conditions and (b) opti-mization of the chemical and instru-mental conditions. The main role of an organic medium in the gener-ation of cadmium volatile species is the retardation of the generationprocesses or the separation of thevapor from the solution. Afteradopting some procedural measures,the method suggested was success-fully applied to the determinationof cadmium in biological samples,soil samples, and tap water. TablesIV and V show that the results arein good agreement with the certi-fied values of the standard materi-als. The recoveries in these samplessolutions spiked with 4-µg/L Cdwere in the 96–104% range.
ACKNOWLEDGMENT
This work was financially sup-ported by the National Natural Science Foundations of China. The authors are grateful to Boden-seewerk Perkin-Elmer GmbH, Germany, for providing the atomicabsorption spectrometer for thisstudy and for their partial financialsupport. The authors also wish toexpress their thanks to ProfessorZhaolun Fang and Lijing Sun forvaluable discussions.
Received June 16, 1997.
REFERENCES
1. Z.-L. Fang, Flow Injection Separationand Preconcentration, VCH,Weinheim (1993).
2. Z.-L. Fang, S.-K. Xu, and S.-C. Zhang,Anal. Chim. Acta 164, 41 (1984).
3. Z.-L. Fang, T.-Z. Guo, and B.Welz,Talanta 38, 613 (1991).
4. B. Welz, S.-K. Xu, and M. Sperling,Appl. Spectrosc. 45, 1433 (1991).
5. Z.-L. Fang, Flow Injection AtomicAbsorption Spectrometry, JohnWiley & Sons, Ltd., England (1995).
6. J. Cacho, I. Beltran, and C. Nerin, J. Anal. At. Spectrom. 4, 661(1989).
7. A. Dulivo and Y.-W. Chen, J. Anal. At.Spectrom. 4, 319 (1989).
8. L. Ebdon, P. Goodall, S. J. Hill, P. B.Stockwell, and K. C. Thompson, J. Anal. At. Spectrom. 8, 723(1993).
9. M. C. Valdes Hevia Y Temprano, M. R. Fernandez de la Campa, andA. Sanz- Medel, J. Anal. At. Spec-trom. 8, 847 (1993).
10. X.-W. Guo and X.-M. Guo, Anal.Chim. Acta 310, 377 (1995).
11. X.-W. Guo and X.-M. Guo, J. Anal.At. Spectrom. 10, 987 (1995).
12. A. Sanz-Medel, M. C. Valdes-Hevia YTempramo, N. B. Garcia, and M.R.Fernandez de la Campa, Anal.Chem. 67, 2216 (1995).
13. P. B. Barrera, J.M.Pineiro, A.M.Pineiro, and A. B. Barrero, J. Anal.At. Spectrom. 11, 1081 (1996).
14. M. R. Fernandez de la Campa, E. S.Garcia, M. C. Valdes-Hevia Y Tem-prano, B. A. Fernandez, J. M.Marchante Gayon, and A. Sanz-Medel, Spectrochim. Acta 50B, 377(1995).
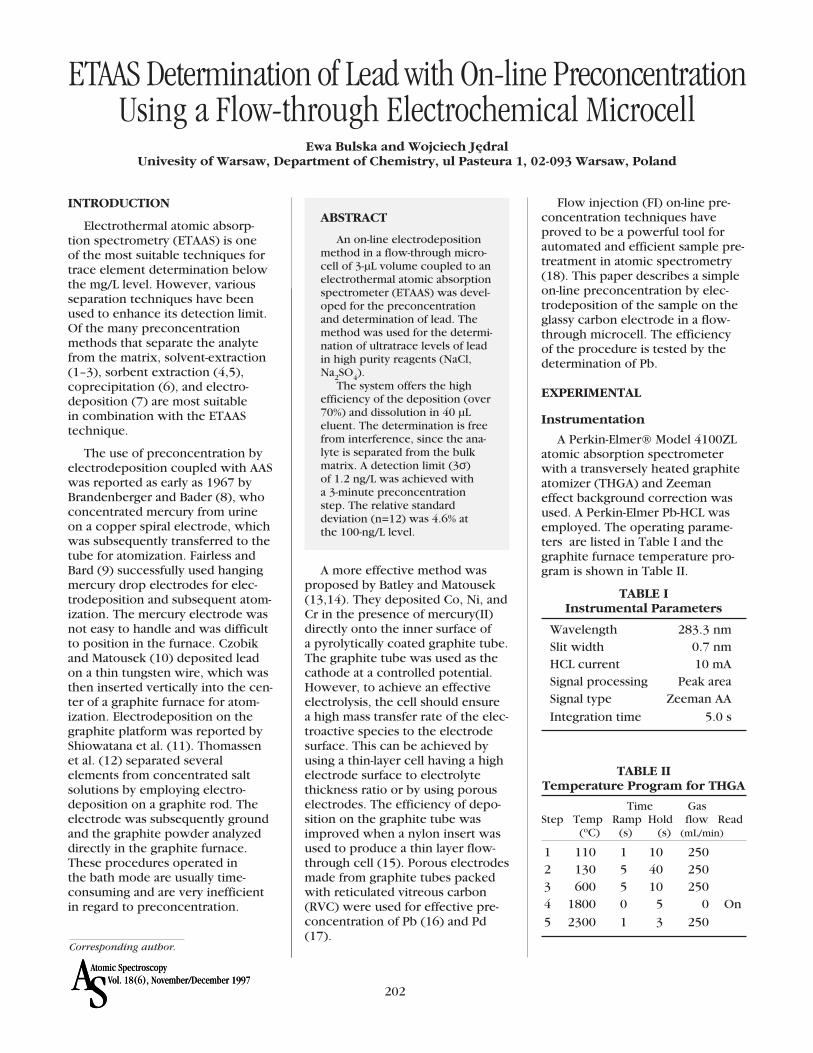
202SAAtomic SpectroscopyVol. 18(6), November/December 1997SAAtomic SpectroscopyVol. 18(6), November/December 1997
INTRODUCTION
Electrothermal atomic absorp-tion spectrometry (ETAAS) is one of the most suitable techniques fortrace element determination belowthe mg/L level. However, variousseparation techniques have beenused to enhance its detection limit.Of the many preconcentrationmethods that separate the analytefrom the matrix, solvent-extraction(1–3), sorbent extraction (4,5),coprecipitation (6), and electro-deposition (7) are most suitable in combination with the ETAAS technique.
The use of preconcentration byelectrodeposition coupled with AASwas reported as early as 1967 byBrandenberger and Bader (8), whoconcentrated mercury from urineon a copper spiral electrode, whichwas subsequently transferred to thetube for atomization. Fairless andBard (9) successfully used hangingmercury drop electrodes for elec-trodeposition and subsequent atom-ization. The mercury electrode wasnot easy to handle and was difficultto position in the furnace. Czobikand Matousek (10) deposited leadon a thin tungsten wire, which wasthen inserted vertically into the cen-ter of a graphite furnace for atom-ization. Electrodeposition on thegraphite platform was reported byShiowatana et al. (11). Thomassenet al. (12) separated severalelements from concentrated saltsolutions by employing electro-deposition on a graphite rod. Theelectrode was subsequently groundand the graphite powder analyzeddirectly in the graphite furnace.These procedures operated in the bath mode are usually time-consuming and are very inefficientin regard to preconcentration.
A more effective method wasproposed by Batley and Matousek(13,14). They deposited Co, Ni, andCr in the presence of mercury(II)directly onto the inner surface of a pyrolytically coated graphite tube.The graphite tube was used as thecathode at a controlled potential.However, to achieve an effectiveelectrolysis, the cell should ensure a high mass transfer rate of the elec-troactive species to the electrodesurface. This can be achieved byusing a thin-layer cell having a highelectrode surface to electrolytethickness ratio or by using porouselectrodes. The efficiency of depo-sition on the graphite tube wasimproved when a nylon insert wasused to produce a thin layer flow-through cell (15). Porous electrodesmade from graphite tubes packedwith reticulated vitreous carbon(RVC) were used for effective pre-concentration of Pb (16) and Pd(17).
Flow injection (FI) on-line pre-concentration techniques haveproved to be a powerful tool forautomated and efficient sample pre-treatment in atomic spectrometry(18). This paper describes a simpleon-line preconcentration by elec-trodeposition of the sample on theglassy carbon electrode in a flow-through microcell. The efficiency of the procedure is tested by thedetermination of Pb.
EXPERIMENTAL
Instrumentation
A Perkin-Elmer® Model 4100ZLatomic absorption spectrometerwith a transversely heated graphiteatomizer (THGA) and Zeemaneffect background correction wasused. A Perkin-Elmer Pb-HCL wasemployed. The operating parame-ters are listed in Table I and thegraphite furnace temperature pro-gram is shown in Table II.
TABLE IInstrumental Parameters
Wavelength 283.3 nmSlit width 0.7 nmHCL current 10 mASignal processing Peak areaSignal type Zeeman AA
Integration time 5.0 s
Corresponding author.
ETAAS Determination of Lead with On-line PreconcentrationUsing a Flow-through Electrochemical Microcell
Ewa Bulska and Wojciech JçdralUnivesity of Warsaw, Department of Chemistry, ul Pasteura 1, 02-093 Warsaw, Poland
ABSTRACT
An on-line electrodepositionmethod in a flow-through micro-cell of 3-µL volume coupled to anelectrothermal atomic absorptionspectrometer (ETAAS) was devel-oped for the preconcentrationand determination of lead. Themethod was used for the determi-nation of ultratrace levels of leadin high purity reagents (NaCl,Na2SO4).
The system offers the highefficiency of the deposition (over70%) and dissolution in 40 µLeluent. The determination is freefrom interference, since the ana-lyte is separated from the bulkmatrix. A detection limit (3σ) of 1.2 ng/L was achieved with a 3-minute preconcentrationstep. The relative standard deviation (n=12) was 4.6% at the 100-ng/L level.
TABLE IITemperature Program for THGA
Time Gas Step Temp Ramp Hold flow Read
(oC) (s) (s) (mL/min)
1 110 1 10 2502 130 5 40 2503 600 5 10 2504 1800 0 5 0 On
5 2300 1 3 250
e
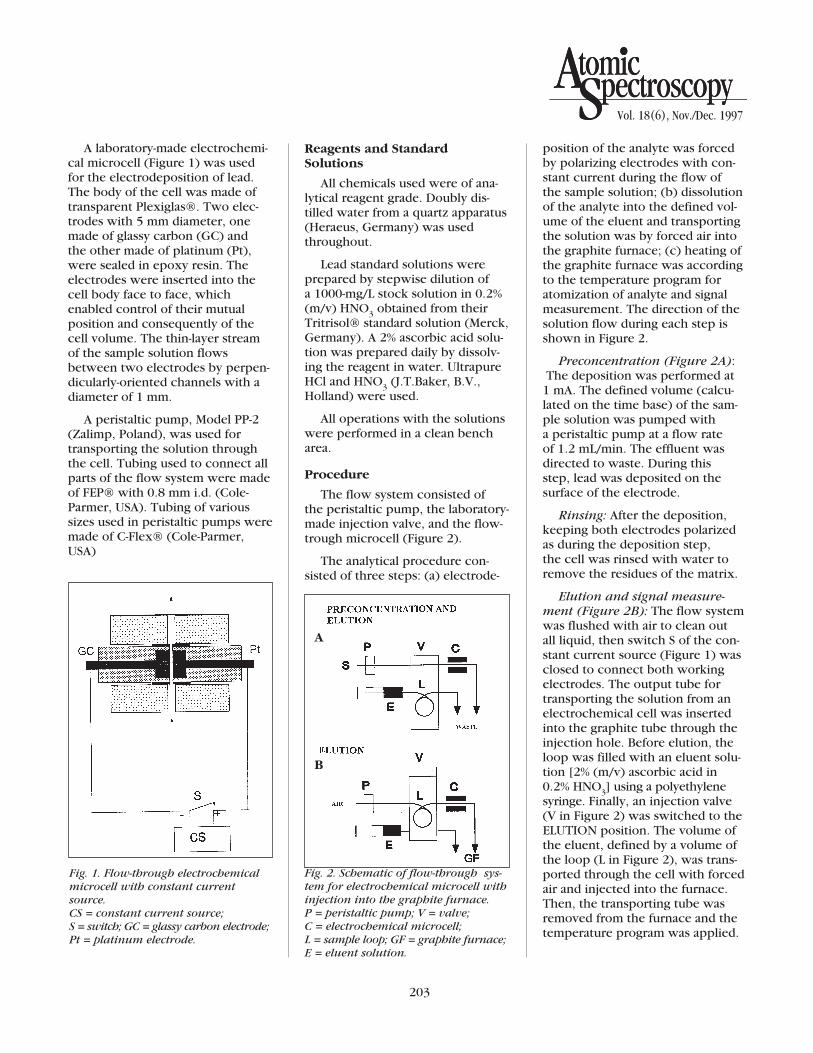
203
AtomicSpectroscopy
Vol. 18(6), Nov./Dec. 1997
AtomicSpectroscopy
Reagents and StandardSolutions
All chemicals used were of ana-lytical reagent grade. Doubly dis-tilled water from a quartz apparatus(Heraeus, Germany) was usedthroughout.
Lead standard solutions wereprepared by stepwise dilution of a 1000-mg/L stock solution in 0.2%(m/v) HNO3 obtained from theirTritrisol® standard solution (Merck,Germany). A 2% ascorbic acid solu-tion was prepared daily by dissolv-ing the reagent in water. UltrapureHCl and HNO3 (J.T.Baker, B.V.,Holland) were used.
All operations with the solutionswere performed in a clean bencharea.
Procedure
The flow system consisted of the peristaltic pump, the laboratory-made injection valve, and the flow-trough microcell (Figure 2).
The analytical procedure con-sisted of three steps: (a) electrode-
position of the analyte was forcedby polarizing electrodes with con-stant current during the flow of the sample solution; (b) dissolutionof the analyte into the defined vol-ume of the eluent and transportingthe solution was by forced air intothe graphite furnace; (c) heating ofthe graphite furnace was accordingto the temperature program foratomization of analyte and signalmeasurement. The direction of thesolution flow during each step isshown in Figure 2.
Preconcentration (Figure 2A):The deposition was performed at 1 mA. The defined volume (calcu-lated on the time base) of the sam-ple solution was pumped with a peristaltic pump at a flow rate of 1.2 mL/min. The effluent wasdirected to waste. During this step, lead was deposited on the surface of the electrode.
Rinsing: After the deposition,keeping both electrodes polarizedas during the deposition step, the cell was rinsed with water toremove the residues of the matrix.
Elution and signal measure-ment (Figure 2B): The flow systemwas flushed with air to clean out all liquid, then switch S of the con-stant current source (Figure 1) wasclosed to connect both workingelectrodes. The output tube fortransporting the solution from anelectrochemical cell was insertedinto the graphite tube through theinjection hole. Before elution, theloop was filled with an eluent solu-tion [2% (m/v) ascorbic acid in0.2% HNO3] using a polyethylenesyringe. Finally, an injection valve(V in Figure 2) was switched to theELUTION position. The volume ofthe eluent, defined by a volume ofthe loop (L in Figure 2), was trans-ported through the cell with forcedair and injected into the furnace.Then, the transporting tube wasremoved from the furnace and thetemperature program was applied.
A laboratory-made electrochemi-cal microcell (Figure 1) was usedfor the electrodeposition of lead.The body of the cell was made oftransparent Plexiglas®. Two elec-trodes with 5 mm diameter, onemade of glassy carbon (GC) and the other made of platinum (Pt),were sealed in epoxy resin. Theelectrodes were inserted into thecell body face to face, whichenabled control of their mutualposition and consequently of thecell volume. The thin-layer streamof the sample solution flowsbetween two electrodes by perpen-dicularly-oriented channels with adiameter of 1 mm.
A peristaltic pump, Model PP-2(Zalimp, Poland), was used fortransporting the solution throughthe cell. Tubing used to connect allparts of the flow system were madeof FEP® with 0.8 mm i.d. (Cole-Parmer, USA). Tubing of varioussizes used in peristaltic pumps weremade of C-Flex® (Cole-Parmer,USA)
Fig. 1. Flow-through electrochemicalmicrocell with constant currentsource.CS = constant current source; S = switch; GC = glassy carbon electrode;Pt = platinum electrode.
Fig. 2. Schematic of flow-through sys-tem for electrochemical microcell withinjection into the graphite furnace. P = peristaltic pump; V = valve; C = electrochemical microcell; L = sample loop; GF = graphite furnace;E = eluent solution.
A
B
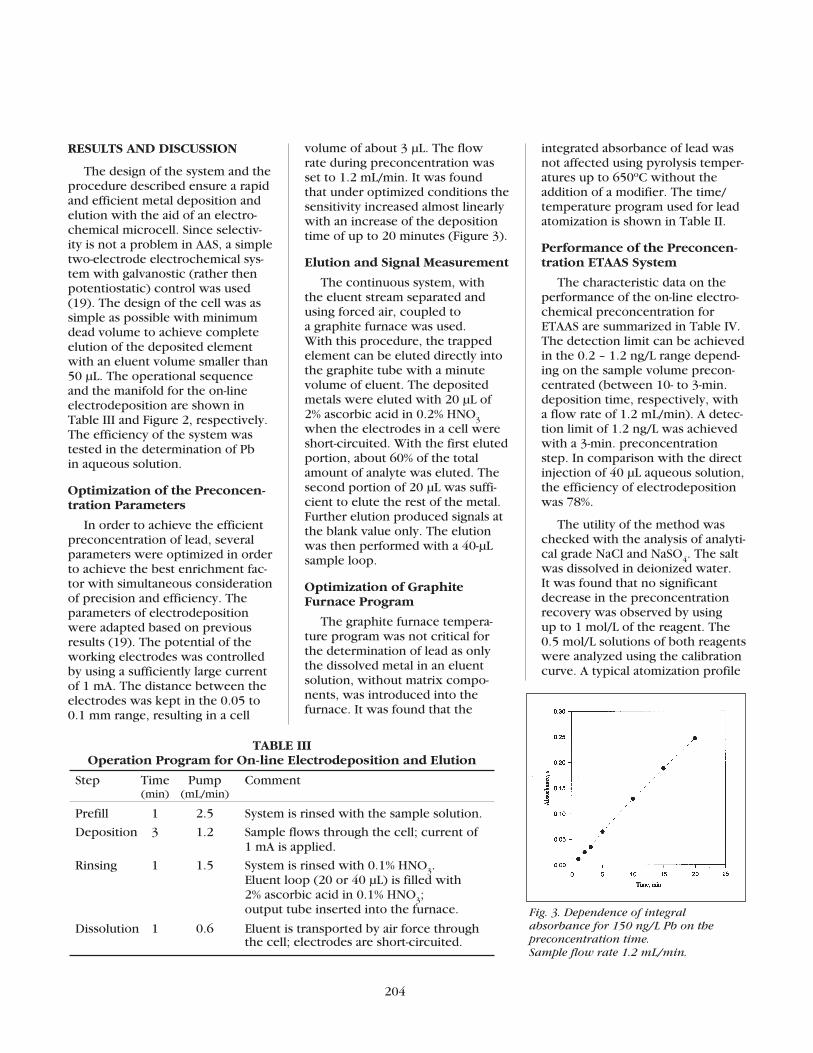
204
RESULTS AND DISCUSSION
The design of the system and theprocedure described ensure a rapidand efficient metal deposition andelution with the aid of an electro-chemical microcell. Since selectiv-ity is not a problem in AAS, a simpletwo-electrode electrochemical sys-tem with galvanostic (rather thenpotentiostatic) control was used(19). The design of the cell was assimple as possible with minimumdead volume to achieve completeelution of the deposited elementwith an eluent volume smaller than50 µL. The operational sequenceand the manifold for the on-lineelectrodeposition are shown inTable III and Figure 2, respectively.The efficiency of the system wastested in the determination of Pb in aqueous solution.
Optimization of the Preconcen-tration Parameters
In order to achieve the efficientpreconcentration of lead, severalparameters were optimized in orderto achieve the best enrichment fac-tor with simultaneous considerationof precision and efficiency. Theparameters of electrodepositionwere adapted based on previousresults (19). The potential of theworking electrodes was controlledby using a sufficiently large currentof 1 mA. The distance between theelectrodes was kept in the 0.05 to0.1 mm range, resulting in a cell
volume of about 3 µL. The flow rate during preconcentration wasset to 1.2 mL/min. It was found that under optimized conditions thesensitivity increased almost linearlywith an increase of the depositiontime of up to 20 minutes (Figure 3).
Elution and Signal Measurement
The continuous system, with the eluent stream separated andusing forced air, coupled to a graphite furnace was used. With this procedure, the trappedelement can be eluted directly intothe graphite tube with a minute volume of eluent. The depositedmetals were eluted with 20 µL of2% ascorbic acid in 0.2% HNO3when the electrodes in a cell wereshort-circuited. With the first elutedportion, about 60% of the totalamount of analyte was eluted. Thesecond portion of 20 µL was suffi-cient to elute the rest of the metal.Further elution produced signals atthe blank value only. The elution was then performed with a 40-µLsample loop.
Optimization of Graphite Furnace Program
The graphite furnace tempera-ture program was not critical forthe determination of lead as onlythe dissolved metal in an eluentsolution, without matrix compo-nents, was introduced into the furnace. It was found that the
integrated absorbance of lead wasnot affected using pyrolysis temper-atures up to 650oC without theaddition of a modifier. The time/temperature program used for leadatomization is shown in Table II.
Performance of the Preconcen-tration ETAAS System
The characteristic data on theperformance of the on-line electro-chemical preconcentration forETAAS are summarized in Table IV.The detection limit can be achievedin the 0.2 – 1.2 ng/L range depend-ing on the sample volume precon-centrated (between 10- to 3-min.deposition time, respectively, witha flow rate of 1.2 mL/min). A detec-tion limit of 1.2 ng/L was achievedwith a 3-min. preconcentrationstep. In comparison with the directinjection of 40 µL aqueous solution,the efficiency of electrodepositionwas 78%.
The utility of the method waschecked with the analysis of analyti-cal grade NaCl and NaSO4. The saltwas dissolved in deionized water. It was found that no significantdecrease in the preconcentrationrecovery was observed by using up to 1 mol/L of the reagent. The0.5 mol/L solutions of both reagentswere analyzed using the calibrationcurve. A typical atomization profile
Fig. 3. Dependence of integralabsorbance for 150 ng/L Pb on thepreconcentration time. Sample flow rate 1.2 mL/min.
TABLE IIIOperation Program for On-line Electrodeposition and Elution
Step Time Pump Comment(min) (mL/min)
Prefill 1 2.5 System is rinsed with the sample solution.
Deposition 3 1.2 Sample flows through the cell; current of 1 mA is applied.
Rinsing 1 1.5 System is rinsed with 0.1% HNO3. Eluent loop (20 or 40 µL) is filled with 2% ascorbic acid in 0.1% HNO3; output tube inserted into the furnace.
Dissolution 1 0.6 Eluent is transported by air force throughthe cell; electrodes are short-circuited.
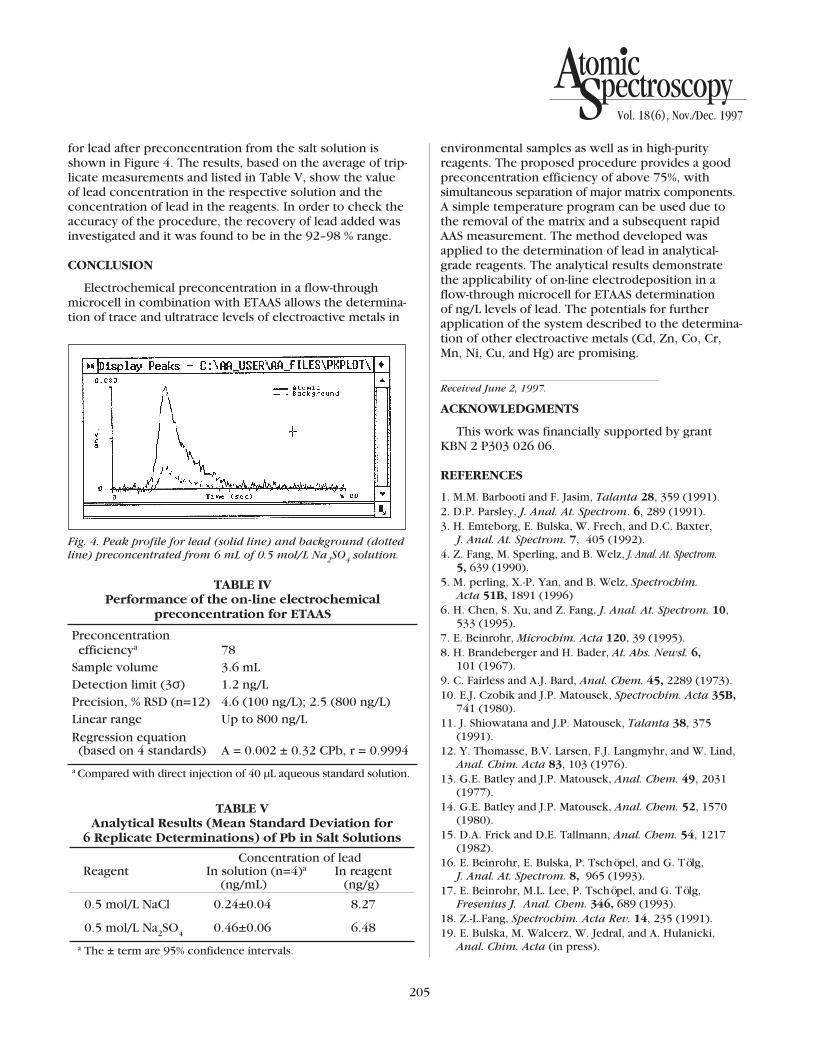
205
AtomicSpectroscopy
Vol. 18(6), Nov./Dec. 1997
for lead after preconcentration from the salt solution isshown in Figure 4. The results, based on the average of trip-licate measurements and listed in Table V, show the valueof lead concentration in the respective solution and theconcentration of lead in the reagents. In order to check theaccuracy of the procedure, the recovery of lead added wasinvestigated and it was found to be in the 92–98 % range.
CONCLUSION
Electrochemical preconcentration in a flow-throughmicrocell in combination with ETAAS allows the determina-tion of trace and ultratrace levels of electroactive metals in
environmental samples as well as in high-purityreagents. The proposed procedure provides a goodpreconcentration efficiency of above 75%, with simultaneous separation of major matrix components.A simple temperature program can be used due tothe removal of the matrix and a subsequent rapid AAS measurement. The method developed wasapplied to the determination of lead in analytical-grade reagents. The analytical results demonstrate the applicability of on-line electrodeposition in aflow-through microcell for ETAAS determination of ng/L levels of lead. The potentials for further application of the system described to the determina-tion of other electroactive metals (Cd, Zn, Co, Cr,Mn, Ni, Cu, and Hg) are promising.
Received June 2, 1997.
ACKNOWLEDGMENTS
This work was financially supported by grant KBN 2 P303 026 06.
REFERENCES
1. M.M. Barbooti and F. Jasim, Talanta 28, 359 (1991).2. D.P. Parsley, J. Anal. At. Spectrom. 6, 289 (1991).3. H. Emteborg, E. Bulska, W. Frech, and D.C. Baxter,
J. Anal. At. Spectrom. 7, 405 (1992).4. Z. Fang, M. Sperling, and B. Welz, J. Anal. At. Spectrom.
5, 639 (1990).5. M. perling, X.-P. Yan, and B. Welz, Spectrochim.
Acta 51B, 1891 (1996)6. H. Chen, S. Xu, and Z. Fang, J. Anal. At. Spectrom. 10,
533 (1995).7. E. Beinrohr, Microchim. Acta 120, 39 (1995).8. H. Brandeberger and H. Bader, At. Abs. Newsl. 6,
101 (1967).9. C. Fairless and A.J. Bard, Anal. Chem. 45, 2289 (1973).10. E.J. Czobik and J.P. Matousek, Spectrochim. Acta 35B,
741 (1980).11. J. Shiowatana and J.P. Matousek, Talanta 38, 375
(1991).12. Y. Thomasse, B.V. Larsen, F.J. Langmyhr, and W. Lind,
Anal. Chim. Acta 83, 103 (1976).13. G.E. Batley and J.P. Matousek, Anal. Chem. 49, 2031
(1977).14. G.E. Batley and J.P. Matousek, Anal. Chem. 52, 1570
(1980).15. D.A. Frick and D.E. Tallmann, Anal. Chem. 54, 1217
(1982).16. E. Beinrohr, E. Bulska, P. Tschöpel, and G. Tölg,
J. Anal. At. Spectrom. 8, 965 (1993).17. E. Beinrohr, M.L. Lee, P. Tschöpel, and G. Tölg,
Fresenius J. Anal. Chem. 346, 689 (1993).18. Z.-L.Fang, Spectrochim. Acta Rev. 14, 235 (1991).19. E. Bulska, M. Walcerz, W. Jedral, and A. Hulanicki,
Anal. Chim. Acta (in press).
TABLE IVPerformance of the on-line electrochemical
preconcentration for ETAAS
Preconcentration efficiencya 78
Sample volume 3.6 mLDetection limit (3σ) 1.2 ng/LPrecision, % RSD (n=12) 4.6 (100 ng/L); 2.5 (800 ng/L)Linear range Up to 800 ng/L
Regression equation (based on 4 standards) A = 0.002 ± 0.32 CPb, r = 0.9994
a Compared with direct injection of 40 µL aqueous standard solution.
TABLE VAnalytical Results (Mean Standard Deviation for
6 Replicate Determinations) of Pb in Salt Solutions
Concentration of leadReagent In solution (n=4)a In reagent
(ng/mL) (ng/g)
0.5 mol/L NaCl 0.24±0.04 8.27
0.5 mol/L Na2SO4 0.46±0.06 6.48
a The ± term are 95% confidence intervals.
Fig. 4. Peak profile for lead (solid line) and background (dottedline) preconcentrated from 6 mL of 0.5 mol/L Na2SO4 solution.

PITTCON® ‘98
March 1–6, 1998 – Ernest N. Morial Convention Center New Orleans, Louisiana USA
The Pittsburgh Conference on Analytical Chemistry and Applied Spectroscopy is the largest annual confer-ence and exposition on chemical analysis. It provides the most comprehensive coverage of analytical chemistry, spectroscopy and associated disciplines in the world.
For further information:
The Pittsburgh Converence, Dept. AR,300 Penn Center Boulevard, Suite 332Pittsburgh, PA 15235-5503 USATel: 412-825-3220 or 800-825-3221 • Fax: 412-825-3224http://www.pittcon.org
NINETEENTH ANNUAL ANALYTICAL CHEMISTRY STARTER GRANT AWARD
The Society for Analytical Chemists of Pittsburgh will award one grant of $20,000 to an assistant professorin the field of analytical chemistry. The purpose of this grant is to encourage high-quality, innovativeresearch by a new analytical chemistry professor and to promote the training and development of graduatestudents in this field. Assistant professors who have accepted a United States college or univesity appoint-ment since December 31, 1994, are eligible.
For application forms, which must be received by March 31, 1998, contact:
Ron Busch, Starter Grant Committee, Society for Analytical Chemists of Pittsburgh300 Penn Center Blvd., Suite 332, Pittsburgh, PA 15235Tel: 800-825-3221 • Fax: 412-825-3224
For subscription information or back issues, write or fax:
Atomic SpectroscopyP.O. Box 557
Florham Park, NJ 07932 USAFax: 973-822-9162
To submit articles for publication, write or fax:Editor, Atomic Spectroscopy
The Perkin-Elmer Corporation761 Main Avenue
Norwalk, CT 06859-0105 USAFax: 203-761-2892