atmautluak hydrological study final · pdf file3.0 study scope ... appendix a: hydrology and...
TRANSCRIPT

Atmautluak Hydrological Study and Community Drainage Plan
Prepared for:
Atmautluak Traditional Council
Issued as Final
June 27, 2016
Prepared by:
AECOM
700 G Street, Suite 500
Anchorage, AK 99501
In Association with:
DOWL
Hydraulics Mapping & Modeling

This page intentionally left blank.

ATMAUTLUAK HYDROLOGICAL STUDY & COMMUNITY DRAINAGE PLAN
i June 2016
TABLE OF CONTENTS
1.0 EXECUTIVE SUMMARY ............................................................................................ 1 1.1 Overview ........................................................................................................... 1 1.2 Purpose of Study ............................................................................................... 1 1.3 Conclusions ....................................................................................................... 1
2.0 BACKGROUND ........................................................................................................ 1
3.0 STUDY SCOPE ......................................................................................................... 3
4.0 FIELD RECONNAISANCE AND SITE SURVEY .............................................................. 4
5.0 GEOTECHNICAL BACKGROUND ............................................................................... 4 5.1 Previous Geotechnical Explorations ................................................................. 4 5.2 Permafrost ........................................................................................................ 5 5.3 Subsurface Soils ................................................................................................ 5
6.0 HYDROLOGY AND HYDRAULIC ANALYSIS ................................................................ 5
7.0 EROSION ANALYSIS ................................................................................................ 6 7.1 Shear Stress ....................................................................................................... 7 7.2 Other Factors Contributing to Erosion.............................................................. 7 7.3 Lake Erosion ...................................................................................................... 8
8.0 BANK STABILITY ALTERNATIVES.............................................................................. 9 8.1 Sheet Pile Wall Alternative ............................................................................... 9 8.2 Articulating Concrete Block Matting ............................................................... 12 8.3 Cellular Confinement System (CCS) – Geoweb/Geocell ................................. 15 8.4 Construction Below Water .............................................................................. 17 8.5 Recommended Bank Stability Alternatives .................................................... 18 8.6 Phased Construction ....................................................................................... 18 8.7 Right of Way and Utilities ............................................................................... 19
9.0 COMMUNITY DRAINAGE PLAN ............................................................................. 19 9.1 Drainage Swales .............................................................................................. 20 9.2 Permafrost Considerations ............................................................................. 21 9.3 School Sewage Lagoon and Water Quality Concerns ..................................... 22 9.4 Silt Stockpiles .................................................................................................. 23 9.5 Winter Crossing Locations .............................................................................. 23 9.6 Construction Cost Estimate ............................................................................ 25
10.0 PERMITTING ......................................................................................................... 25 10.1 USACE Department of the Army Permit ......................................................... 25 10.2 National Environmental Policy Act ................................................................. 26

This page intentionally left blank.

ATMAUTLUAK HYDROLOGICAL STUDY & COMMUNITY DRAINAGE PLAN
ii June 2016
10.3 Permitting for a Bank Stabilization Project and Community Drainage Project ............................................................................................................. 26
11.0 REFERENCES ......................................................................................................... 27
APPENDICES
Appendix A: Hydrology and Hydraulic Report
Appendix B: Community Meeting Notes
Appendix C: Trip Report, Inspection of Nunapitchuk Articulating Concrete Block
Appendix D: Drainage Swale Profiles and Cross Sections
Appendix E: Permitting Requirements
Appendix F: Cost Estimates
Appendix G: DOWL Survey Control, Discharge Reports, and River Cross Sections
FIGURES
Figure 1: Atmautluak 2007 ..................................................................................................................... 3
Figure 2: Pitmiktakik River (looking upstream). ..................................................................................... 5
Figure 3: Pitmiktakik River Bank Erosion, Bank Sections Sloughing Into River ...................................... 6
Figure 4: Bank retreat from erosion on Pitmiktakik River, from 1971 (photo) to 2007 ......................... 7
Figure 5: Lake Erosion Areas .................................................................................................................. 8
Figure 6: Sheet Pile Wall Alternative. ................................................................................................... 11
Figure 7: Sheet Pile Wall Section .......................................................................................................... 11
Figure 8: Articulating Concrete Block Section ...................................................................................... 13
Figure 9: Examples of ACB Installations.. ............................................................................................. 14
Figure 10: Articulating Concrete Block /Geo‐Cell Plan ......................................................................... 14
Figure 11: Cellular Confinement System (Geo‐Cell) Section ................................................................ 16
Figure 12: Cellular Confinement System (Geo‐Cell) Re‐Vegetated ...................................................... 16
Figure 13: Temporary Coffer Dam ........................................................................................................ 17
Figure 14: Temporary Coffer Dam Section ........................................................................................... 17
Figure 15: ACB Phased Construction .................................................................................................... 19
Figure 16: Pre‐Road Drainage Pattern .................................................................................................. 20
Figure 17: Community Drainage Plan ................................................................................................... 21
Figure 18: Ditch Excavation Sequence Plan .......................................................................................... 22
Figure 19: School District Old Sewage Lagoon ..................................................................................... 23
Figure 20: Winter Crossing Profile View ............................................................................................... 24
Figure 21: Carsonite Flexible Delineators ............................................................................................. 24

This page intentionally left blank.

ATMAUTLUAK HYDROLOGICAL STUDY & COMMUNITY DRAINAGE PLAN
iii June 2016
TABLES
Table 1: Sheet Pile Wall Costs .............................................................................................................. 10
Table 2: ACB Matting Cost Estimate ..................................................................................................... 13
Table 3: Cellular Confinement System Cost Estimate .......................................................................... 15
Table 4: Cost Estimate ACB Phase I Construction ................................................................................ 19
Table 5: Drainage Swale Cost Estimate ................................................................................................ 25

ATMAUTLUAK HYDROLOGICAL STUDY & COMMUNITY DRAINAGE PLAN
v June 2016
This page intentionally left blank.

ATMAUTLUAK HYDROLOGICAL STUDY & COMMUNITY DRAINAGE PLAN
1 June 2016
1.0 EXECUTIVE SUMMARY
1.1 Overview
The Community of Atmautluak is located on the Pitmiktakik River 17 miles northwest of Bethel. Riverine erosion has potential impact on the community due to proximity to the Pitmiktakik River. Erosion due to wave action has also been observed on the banks of the larger lake (not named) on the west side of Atmautluak.
Ponding in the center portion of the community has become a problem in recent years. A road constructed from the airport to the center of the community cut off a natural drainage swale. Water that previously drained to the north began ponding. Community elders report that land that was once higher and dry has subsided and now wet. Pig Lake overflows during high water periods in spring and fall.
1.2 Purpose of Study
The purpose of the Atmautluak Hydrological Study was to determine the recurrence intervals of floods and provide a hydrological basis for the evaluation the existing bank erosion and proposed alternatives to reduce bank erosion along the Pitmiktakik River (Section 7). Two areas on the shore of the larger lake west of the town were also studied (Section 7.3). The purpose of the Community Drainage Plan (which is included in this report as Section 9.0) was to identify alternatives that could drain excess surface waters at Pig Lake to nearby lakes and rivers in order to restore natural drainage, reduce flooding of properties in spring and fall, and reduce heat transfer to underlying tundra from standing water, which could potentially decrease permafrost degradation.
1.3 Conclusions
Erosion is primarily due to hydraulic shear stress on fine grained soils, with soil pore pressures and ice scour also contributing. Bank stability and reduced erosion can be achieved with installation of a sheet pile wall, articulating concrete block matting, or a cellular confinement system (see section 8). Articulating Concrete Block matting is the recommend alternative. A sheet pile wall would be more expensive than the other options and would be subject to corrosion. Articulating Concrete Block matting or a cellular confinement system would provide easier boat access than a sheet pile wall. A cellular confinement system would be susceptible to ice damage and was not recommended.
A new drainage swale can be constructed from Pig Lake to the north to restore natural drainage and keep the water levels in Pig Lake as low as possible (see section 9).
2.0 BACKGROUND
A community map can be downloaded from the State of Alaska at: https://www.commerce.alaska.gov/web/dcra/PlanningLandManagement/CommunityProfileMaps.aspx A Hazard Impact Assessment (HIA) was completed by WH Pacific in 2010, it can be downloaded at:

ATMAUTLUAK HYDROLOGICAL STUDY & COMMUNITY DRAINAGE PLAN
2 June 2016
https://www.commerce.alaska.gov/web/dcra/PlanningLandManagement/ACCIMP/CommunityPlanningGrants/AtmautluakCPG.aspx. The HIA included several potential hazards:
Wildfire (low probability)
Earthquake (low probability)
Flooding
Erosion
Ground Failure (due to permafrost thaw)
Potential hazard from wildfire is low due to lack of trees in the area. Atmautluak is not located in an area with high seismic risk. The probability of an earthquake of magnitude of 5.0 or higher occurring in Atmautluak within the next 50 years is 20% (contrast to 100% for Anchorage).
Flooding. Community elders reported in a 2016 meeting with AECOM that the river will slightly overtop the lowest banks and be just under the top of the highest banks during spring snow melt or during fall rains. They noted there has been no significant flooding beyond the banks for over 40 years. The Corps of Engineers reports the ‘flood of record’ occurred in 1972. (USACE 2007).There was a large flood that covered the whole region 200 years ago according to traditional lore.
Erosion. The U.S. Army Corps of Engineers provided an Erosion Information Paper for the community of Atmautluak in 2007. The paper reported that: “The entire length of the community has some erosion. Causes of erosion include natural river flow, spring breakup, melting permafrost, boat wakes and ice jams.” The report estimated loss of one foot of bank per year on average.
Ground Failure. Soil conditions underlying Atmautluak have been characterized as organic‐rich soils over thaw unstable permafrost soils. (Duane Miller & Associates, 1996 and Shannon & Wilson, 1993). Thaw‐unstable subsurface soils are subject to significant settlement if allowed to thaw. Sources of heat and other conditions that can lead to permafrost thaw include: standing water, removal of insulating vegetation layers (tundra), buildings, gravel surfaces, and boardwalks. Settlement of the high ice‐content silty soils can occur due to drainage of excess pore water when the soils thaw. Drainage of wet tundra areas would likely increase the depth of frost penetration, and could potentially both decrease the depth of the active thaw layer and decrease permafrost degradation (WHPacific, 2010). The HIA recommended a community wide drainage plan as a way to decrease the amount of standing water in the center of the community. Figure 1 shows the wet low areas that would be addressed by a drainage plan.

ATMAUTLUAK HYDROLOGICAL STUDY & COMMUNITY DRAINAGE PLAN
3 June 2016
Figure 1: Atmautluak 2007
3.0 STUDY SCOPE
The goals of this study were to provide a hydrological study, determine the most suitable combination of solutions to address bank erosion, and address standing water in the center of the community. The study consisted of the following tasks:
Field Reconnaissance and Site Survey
Hydrology and Hydraulic Analysis
Erosion Analysis
Bank Stability Alternatives Analysis
Drainage Study
Permitting Requirements
AECOM sub‐contracted to DOWL for field and river surveying and Hydraulic Mapping and Modeling (HMM) for hydrology and hydraulic analysis.

ATMAUTLUAK HYDROLOGICAL STUDY & COMMUNITY DRAINAGE PLAN
4 June 2016
4.0 FIELD RECONNAISANCE AND SITE SURVEY
The study team traveled to Atmautluak in August 2015 for the site survey and field reconnaissance investigation. The site visit coincided with an introductory meeting with the Atmautluak Traditional Council. The team included an AECOM community outreach specialist, AECOM civil engineer, a hydraulic engineer (Hydraulic Mapping and Modeling), and a surveyor (DOWL).
The site survey included a hydrographic survey of the river (including nine channel cross sections covering 4½ river miles), and topographic survey of upland areas in the center of the community. The field survey was performed by DOWL on August 26th and 27th, 2015. Static Global Satellite (GNSS) observations were taken on the primary control station at the Airport and based on Alaska Department of Transportation & Public Facilities (ADOT&PF) survey control. Upland ground shot points were obtained by Real Time Kinetic (RTK) GPS. The cross‐sections were surveyed using a combination of methods (DOWL, 2015). In addition to using an RTK GPS total station for upland and shallow water survey measurements, a SONTEK M9 Acoustic Doppler Profiler was used for the hydrographic survey. The acoustic Doppler profiler supplied both bed elevations along the cross‐section lines, and estimates of discharge at each cross‐section.
Vertical Datums. The 2015 DOWL survey vertical datum is 8.03 feet higher than the datum developed for the Atmautluak Community Map in 2007. The common point between the two surveys is the ADOT&PF monument HV‐1 located at the Atmautluak airport. Vertical conversion: DOWL 2015 elevation of 16.87 feet (see Appendix G) equals Atmautluak Community Map elevation 8.84 feet (the community map can be downloaded from the State of Alaska at: https://www.commerce.alaska.gov/web/dcra/PlanningLandManagement/CommunityProfileMaps.aspx)
5.0 GEOTECHNICAL BACKGROUND
Atmautluak is located in a zone of discontinuous permafrost. Permafrost in this region is relatively warm. Measured ground temperatures indicate soil temperatures in the upper 30 feet are within one degree of thawing (Shannon & Wilson 1993). The tundra mat consists of a 2 to 5 foot thick layer of peat. Underlying soils are typically frozen silt materials.
5.1 Previous Geotechnical Explorations
In order to determine the underlying geologic conditions at Atmautluak, a number of previous geotechnical studies were reviewed. These studies included:
Geotechnical Services for Proposed Lift Station, Honey Bucket Lagoon, Sewage Lagoon and Sewage Pipeline (Shannon & Wilson Inc., 1993); total of 12 borings (test holes) drilled to depths of 12 to 35 feet with a 3‐inch diameter core barrel and split spoon sampler; borings were drilled through the active zone and deep into the permafrost soils
Atmautluak Airport Construction (State of Alaska Department of Public Works Division of Aviation, 1975); 16 borings were drilled in the vicinity of the Atmautluak airport to depths between 10 and 15 feet.

ATMAUTLUAK HYDROLOGICAL STUDY & COMMUNITY DRAINAGE PLAN
5 June 2016
5.2 Permafrost
Permafrost conditions vary widely across the community according to previous geotechnical reports. The active layer thaws to depths of up to four feet deep. Soil was frozen to the bottom of all 12 borings drilled in 1993 (Shannon & Wilson), to depths of 35 feet. The Alaska Department of Environmental Conservation (ADEC) found permafrost to depths down to 235 feet in Atmautluak (ADEC 2010). Borings drilled by ADOT&PF in 1974 near the river encountered unfrozen and saturated soils to depths of 15 feet or greater. This is likely the result of a naturally deep thaw area underlying the river.
5.3 Subsurface Soils
The subsurface soils were generalized into the following layers based on the available information from previous geotechnical reports. The upper four feet is considered to be an active zone consisting of peat and silty peat. The soil descriptions for each generalized layer are summarized below.
Top organic mat ranging from 1.5 to 5 feet deep: Loose, wet, dark brown, peat (from boring logs, Shannon & Wilson 1993)
1.5 to 30 feet depth: Sandy silt, generally frozen (from boring logs, Shannon & Wilson 1993).
6.0 HYDROLOGY AND HYDRAULIC ANALYSIS
Figure 2: Pitmiktakik River (looking upstream).
The Pitmiktakik River is a meandering stream that originates about 60 miles northeast of Atmautluak in a flat tundra and lakes complex area. Atmautluak is located on an actively eroding outside bend of the river. The area around Atmautluak is flat and poorly drained with numerous lakes and small drainages that flow into the Pitmiktakik River (ADCED, 2009).
The hydraulic analysis for the Pikmiktakik River consisted of modeling the flow characteristics using the U.S. Army Corps of Engineers Hydrologic Engineering Center (HEC) River Analysis System (RAS) water surface profiling computer program HEC‐RAS version 4.1. Using the channel cross‐sections obtained in August 2015 as part of the hydrographic survey, HMM built the HEC‐RAS model of the river to estimate

ATMAUTLUAK HYDROLOGICAL STUDY & COMMUNITY DRAINAGE PLAN
6 June 2016
the river discharge volumes and channel conditions during ice jams. A full description of the hydrology and hydraulic analysis is included in Appendix A.
The 2010 WH Pacific Study indicated ice jams have been associated with floods in Atmautluak. The Corps of Engineers attributes the 1972 flood of record in Atmautluak to ice jamming (WHPacific, 2010). In addition, the Corps of Engineers noted in a 2007 report that ‘in the last 10 years, three to four ice jams have caused 1 to 2 feet of erosion per event, according to local officials’ (USACE, 2007). However, the U.S Army Cold Regions Research and Engineering Laboratory (CRREL) Ice Jam Database, which contains information on past ice jam events including dates, locations, and damage levels, includes no information on ice jams for Atmautluak or the Pitmiktakik River. A second database of ice jams in the State of Alaska contains a database of unofficial river flooding and ice jam observations by pilots and others. Maintained by the Alaska‐Pacific River Forecast Center, this National Weather Service web site also contained no information on ice jams for Atmautluak or the Pitmiktakik River. Based on conversations with the Atmautluak Traditional Council in August 2015 and January 2016, flooding due to ice jams has not been an issue in the community. They noted that ice on the Pitmiktakik River does not flow like it does on the Kuskokwim. It appears that flooding on the Pitmiktakik River due to ice jams has not been an issue. Ice jam analysis for the Atmautluak area was completed as part of the Hydrological Study and is included in Appendix A.
7.0 EROSION ANALYSIS
Figure 3: Pitmiktakik River Bank Erosion, Bank Sections Sloughing Into River
A comparison of the 2007 aerial photo with a 1971 photo shows that, on average, the bank has eroded about 47 feet over 36 years, or about 1.3 feet per year. The WH Pacific study showed a similar erosion rate, on average, of 32 feet over a 24 year period (1.3 feet per year).

ATMAUTLUAK HYDROLOGICAL STUDY & COMMUNITY DRAINAGE PLAN
7 June 2016
Figure 4: Bank retreat from erosion on Pitmiktakik River, from 1971 (photo) to 2007 (red line).
7.1 Shear Stress
The hydraulic analysis for this study utilized the USDA Bank Stability and Toe Erosion Model (BSTEM) to estimate erosion of the bank and bank toe by hydraulic shear stress. The model estimates strength, shear stress, and erodibility of different layers, and considers the effects of pore‐water pressure. The soil layer characterizations were based on descriptions from WH Pacific (2010). Changes in river level associated with twice daily tidal cycles on the Pitmiktakik River result in rapidly changing pore‐water pressure in the upper banks. Excess pore‐water pressure that develops when the river level falls reduces soil strength and can result in streambank erosion.
The BSTEM analysis estimated that shear stress may be responsible for up to 1 foot or so per year of bank erosion along the Pitmiktakik River. See Appendix A.
7.2 Other Factors Contributing to Erosion
In addition to shear stress, two other contributing factors of bank erosion are likely the freeze/thaw cycle and ice forces during breakup. The freeze/thaw cycle and formation of ice along the riverbanks results in bank sediment being dislodged and moved downslope via gravity. Additionally, ice thrust, ice

ATMAUTLUAK HYDROLOGICAL STUDY & COMMUNITY DRAINAGE PLAN
8 June 2016
retreat, and ice movement, which all occur during breakup and ice jam events, abrades and gouges the bank leading to bank erosion.
7.3 Lake Erosion
Erosion has been a problem at two locations on the lake to the west of the community at the Atmautluak Beachfront Subdivision (see Figure 5). Erosion appears to be primarily the result of wave action. Local residents report that wind driven waves are more pronounced at these locations due to their location at the end of a 7000 foot long fetch of the lake (fetch length measured from google earth). The erosion rate is approximately 1 foot per year, based on a comparison between a 1971 aerial photo and a 2007 aerial photo.
Figure 5: Lake Erosion Areas

ATMAUTLUAK HYDROLOGICAL STUDY & COMMUNITY DRAINAGE PLAN
9 June 2016
8.0 BANK STABILITY ALTERNATIVES
Three alternatives were considered as a means to stabilize the bank of the Pitmiktakik River and mitigate the effects of ongoing erosion. The Traditional Council requested shore protection at two areas susceptible to erosion on the lake shore just west of the community, as noted previously. Bank erosion in these locations is encroaching on private homes. River bank stability alternatives would be constructed from the south end of the community north to the airport. Bank stability alternatives considered for river shore protection included sheet pile walls, articulating concrete block matting, and cellular confinement systems (geocells). Bank stability alternatives considered for lake shore protection included articulating concrete block matting, and cellular confinement systems (geocells).
8.1 Sheet Pile Wall Alternative
Installation of a sheet pile wall was considered as a means to stabilize the bank of the Pitmiktakik River from the south end of the community to the airport, approximately 3060 feet in length. Breaks or gaps in the wall would be necessary at identified locations where access to the river is required for launching boats; gravel “launch ramps” would be constructed at these locations to prevent erosion from occurring behind the wall. A steel pile cap would be installed along the top of the wall and fill material or gravel could be placed behind the wall to provide a walkway/landing area for boats and pedestrian traffic. The wall could be constructed in phases over a period of years to spread out the cost and provide initial protection to areas of importance.
To construct the wall, interlocking galvanized steel sheet piles would be driven along the top of the riverbank to within one or two feet of the existing ground elevation. The piles would need to have a minimum of 35 feet of embedment to resist frost jacking, based on previous experience with pile supported structures in the area. Since the wall would have a freestanding (cantilevered) height of roughly 5 feet, the estimated lateral earth pressure forces would be low, and a relatively lightweight sheet pile section could be used. It may be possible to use a composite (fiberglass) sheet pile section if a site specific geotechnical investigation determines that hard permafrost does not exist above the required embedment depth and the native soils are “soft” enough to drive composites through without damaging them. It should be noted that if a galvanized steel section is used, the coating would typically need periodic inspection and repair after 15 years (re‐coating above water only) to ensure corrosion protection. Sacrificial metal anodes are typically installed on sheet piling to help reduce corrosion. Anode replacement is typically required every 10 to 20 years. See Figure 6 for proposed wall layout and typical sections.
Where the sheet pile wall is installed in bank sections with a gentle slope from the top of bank down to the submerged toe of bank, it is expected that the riverside bank material will eventually erode back to the sheetpile. This will create a vertical face and deeper water along the sheet pile wall, and will provide boat docking opportunities adjacent to the bank. See Figures 6 and 7.
Soil Parameters. Soil parameters for preliminary design were obtained from the Geotechnical Report for the Proposed Lift Station, Honey Bucket Lagoon, Sewage Lagoon and Sewage Pipeline (Shannon & Wilson Inc., 1993); the material parameters used were considered appropriate for this level of conceptual design. Additional geotechnical investigations along the proposed wall alignment would be required to confirm assumptions of the material parameters and the geologic cross section of the subsurface materials prior to final design.
ATMAUTLUAK HYDROLOGICAL STUDY & COMMUNITY DRAINAGE PLAN
10 June 2016
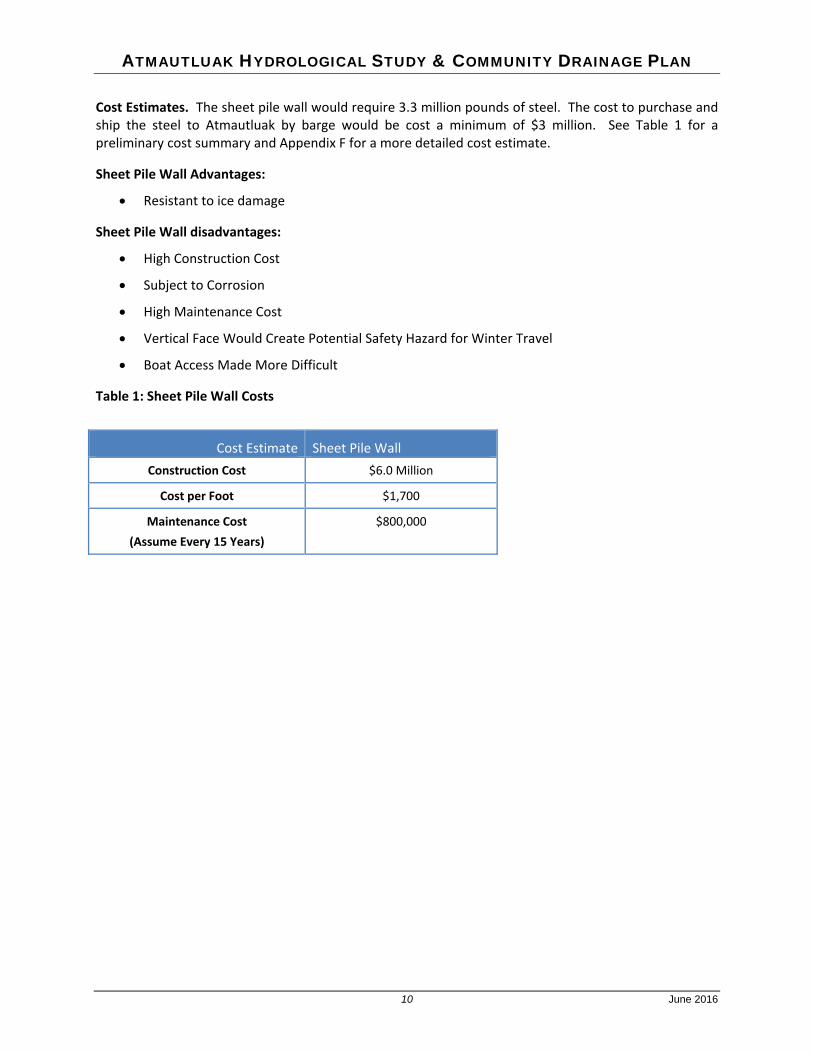
Cost Estimates. The sheet pile wall would require 3.3 million pounds of steel. The cost to purchase and ship the steel to Atmautluak by barge would be cost a minimum of $3 million. See Table 1 for a preliminary cost summary and Appendix F for a more detailed cost estimate.
Sheet Pile Wall Advantages:
Resistant to ice damage
Sheet Pile Wall disadvantages:
High Construction Cost
Subject to Corrosion
High Maintenance Cost
Vertical Face Would Create Potential Safety Hazard for Winter Travel
Boat Access Made More Difficult
Table 1: Sheet Pile Wall Costs
Cost Estimate Sheet Pile Wall
Construction Cost $6.0 Million
Cost per Foot $1,700
Maintenance Cost
(Assume Every 15 Years)
$800,000

ATMAUTLUAK HYDROLOGICAL STUDY & COMMUNITY DRAINAGE PLAN
11 June 2016
Figure 6: Sheet Pile Wall Alternative.
Figure 7: Sheet Pile Wall Section

ATMAUTLUAK HYDROLOGICAL STUDY & COMMUNITY DRAINAGE PLAN
12 June 2016
8.2 Articulating Concrete Block Matting
Articulating Concrete Block (ACB) mats are made of concrete blocks linked together to form a hard‐armored erosion‐resistant mat, typically 8 feet wide by 24 feet long. ACB matting would be placed along the river bank (3060 linear feet) and at two places along the lake west of the community (470 linear feet). ACB would be an effective revetment for the relatively mild current conditions present in the Pitmiktakik River. Installation of the ACB revetment would require excavation and grading to achieve a uniform surface for placement of the mats, though the term “articulating” implies the ability of the system to conform to some changes in subgrade while remaining interlocked. A site‐specific geotechnical investigation would be required to determine the strength of existing soils and their ability to support the weight of the ACB matting. Organic soils would first be removed and high strength geotextile fabric would be placed over the underlying silt soils for reinforcement. A layer of compacted granular fill material (one foot minimum thickness) would be placed over the geotextile fabric. The top of the revetment would be keyed into the bank by excavating a shallow termination trench and backfilling with native material to create a smooth transition from ground to the revetment. The voids in the ACB revetment above the high water line would then be filled with local organic soils and seeded to provide a vegetated bank. See Figure 8 for typical ACB revetment sections and Figure 10 for the plan view. This alternative has assumed that underlying soils are thawed due to proximity to the river, but this should be confirmed by geotechnical exploration prior to final design. If underlying permafrost is present then removal of the top organic layer could lead to thawing. In that case foam board insulation could be installed under the granular layer prior to placement of the ACB matting.
ACB matting installed to stabilize an adjacent riverbank at the nearby Nunapitchuk airport has held up well since it was installed in 2007. The ACB matting was installed along the Nunavakanukaksiak River, which has similar icing conditions to the Pitmiktakik River. AECOM made a site visit in April 2016 and found there was no noticeable settlement of the embankment slopes where ACB had been installed, or evidence of ice damage. Additional details and photographs of the ACB inspection are found in a trip report in Appendix C.
Scour Protection. The river thalweg (deepest portion of the channel) is located over 150 feet from shore and river bed slope is shallow (6%). Channel velocities on the Pitmiktakik River are relatively low, and the thalweg elevations upstream and downstream are fairly consistent, with no large scour holes detected at the surveyed cross‐sections. A large thalweg shift is not likely to occur over a long period of time, but more likely to be initiated during a large event (flood or ice jam) when velocities are much higher than normal (See Appendix A). The toe of the revetment would extend 3 feet below the riverbed to prevent undermining due to general scour. If undermined during a large event, the ACB can rotate at the mudline to a 1.5:1 slope to a position 4 feet below river bed. Placement of a layer of imported coarse granular material (angular shot rock material) on top of the ACB would provide additional protection in the unlikely case a deep scour hole develops near the bank.
Cost Estimates. The cost to purchase and deliver the ACB matting to Atmautluak would cost over $2 million. Granular fill material would also need to be barged to Atmautuak. The closest quarry is located at Platinum, Alaska, approximately 140 miles to the southwest on the Bering Sea coast near the mouth of the Kuskokwim River. See Table 2 for a preliminary cost summary and Appendix F for a more detailed cost estimate.
ACB Advantages:
Resistant to ice damage
Low maintenance costs

ATMAUTLUAK HYDROLOGICAL STUDY & COMMUNITY DRAINAGE PLAN
13 June 2016
Can be re‐vegetated for natural appearance.
ACB disadvantages:
Cost is higher than Cellular confinement system (see below).
Table 2: ACB Matting Cost Estimate
Figure 8: Articulating Concrete Block Section
Cost Estimate ACB Matting
Construction Cost $4.4 Million
Cost Per Foot $1,260
Maintenance Cost
(Assume Major Repair Every 15 Years)
$350,000

ATMAUTLUAK HYDROLOGICAL STUDY & COMMUNITY DRAINAGE PLAN
14 June 2016
Figure 9: Examples of ACB Installations. The right photo shows the revegetated ACB installation at Nunapitchuk.
Figure 10: Articulating Concrete Block /Geo‐Cell Plan

ATMAUTLUAK HYDROLOGICAL STUDY & COMMUNITY DRAINAGE PLAN
15 June 2016
8.3 Cellular Confinement System (CCS) – Geoweb/Geocell
Cellular confinement systems (CCS) such as Geoweb or Geocell are soil stabilization products made of high density polyethylene (HDPE) strips that are fused together to form honeycomb type cells. We did not find examples of similar CSS systems used in Alaska river locations so the performance of the CSS system in river ice conditions is unknown. The CCS alternative would provide erosion revetment along the river front and at two lake locations similar to the ACB matting alternative. Construction of the CSS system would be similar to ACB matting. CCS systems are typically filled with soil and seeded to create a vegetated mat capable of resisting erosive forces from wind and wave action. A CCS revetment would be constructed in a similar fashion to the ACB revetment mentioned previously. The portion of the CCS above the high water line would be filled with native soils and seeded to create a vegetated bank. Since it would not be possible to establish a vegetated mat below the high water line, the CCS would be filled with concrete slurry in this area to protect the underlying soils from erosion. See Figure 10 for the plan view and Figure 11 for typical CCS sections. See Table 3 for a preliminary cost summary and Appendix F for a more detailed cost estimate.
CCS Advantages:
Vegetated for natural appearance
Low construction cost relative to other alternatives
ACB disadvantages:
Susceptible to ice damage
Higher maintenance cost and more frequent repairs than other options
Table 3: Cellular Confinement System Cost Estimate
Cost Estimate Cellular Confinement System
Construction Cost $2.0 Million
Cost Per Foot $600
Maintenance Cost
(Assume Every 15 Years)
$500,000

ATMAUTLUAK HYDROLOGICAL STUDY & COMMUNITY DRAINAGE PLAN
16 June 2016
Figure 11: Cellular Confinement System (Geo‐Cell) Section
Figure 12: Cellular Confinement System (Geo‐Cell) Re‐Vegetated

ATMAUTLUAK HYDROLOGICAL STUDY & COMMUNITY DRAINAGE PLAN
17 June 2016
8.4 Construction Below Water
Construction of either the ACB or CCS bank protection methods would require diversion of the river away from the bank toe so that a toe trench can be excavated. A temporary cofferdam could be used to divert the river during construction. There are several rapidly deployed and easily dismantled bladder‐type cofferdam systems on the market that could be used for this purpose, which would allow the excavation and installation of the ACB matting or CCS revetment to be completed in segments. See Figures 13 and 14.
Figure 13: Temporary Coffer Dam
Figure 14: Temporary Coffer Dam Section
ATMAUTLUAK HYDROLOGICAL STUDY & COMMUNITY DRAINAGE PLAN
18 June 2016
8.5 Recommended Bank Stability Alternatives
Articulating Concrete Block (ACB) matting is the recommend alternative for river bank and lake shore erosion protection. Alternatives were presented to the Atmautluak community on April 25th, 2016. The Traditional Council voted in favor of the ACB matting as the option for erosion protection along the river, from the south end of the community north to the airport and at two locations along the lake west of the community. The Council was not in favor of the Sheet Pile Wall alternative; there were concerns that the vertical face of the wall would be a safety hazard with snow machines in the winter. The Council was not in favor of the CCS alternative; there were concerns that when the water is high in the spring the ice could rip out the geo‐cells. AECOM concurred that the performance of the CCS would likely be vulnerable to damage from ice and also from foot traffic.
8.6 Phased Construction
Installation of ACB matting should be done in phases in order to allow vegetation to establish. Areas where erosion is identified as a more immediate threat to homes and boardwalks could be done in the first phase. Completed ACB sections should be closed to foot traffic for a minimum of one summer season to allow grass roots to re‐establish.
Funding and Bidding Strategy. The final design could divide the ACB revetment design into distinct sections that can be prioritized by the community in order of importance. The construction project can be advertised for bid with a base bid alternative and additional ‘additive alternatives’. With this approach the community can obtain funding for the base bid and add in additive alternatives as project the funding allows. Figure 15 shows suggested layout for a first phase project (2280 linear feet). These are areas where erosion appears to be a more immediate threat to property and boardwalks.

ATMAUTLUAK HYDROLOGICAL STUDY & COMMUNITY DRAINAGE PLAN
19 June 2016
Figure 15: ACB Phased Construction
Table 4: Cost Estimate ACB Phase I Construction
8.7 Right of Way and Utilities
Easements would be required where the ACB revetment impacts residential lots, the Atmautluak School property, and Government Lots 2, 5, and 8. There are no known utility conflicts at present time.
9.0 COMMUNITY DRAINAGE PLAN
Insufficient drainage during high water periods is creating problems for the area to the north of Pig Lake. Due to construction of a road across the natural drainage path, the area does not drain well. The water
Cost Estimate ACB Phase I Construction
Construction Cost $2.2 Million
Cost Per Foot $1,540
Maintenance Cost
(Assume Every 15 Years)
$200,000

ATMAUTLUAK HYDROLOGICAL STUDY & COMMUNITY DRAINAGE PLAN
20 June 2016
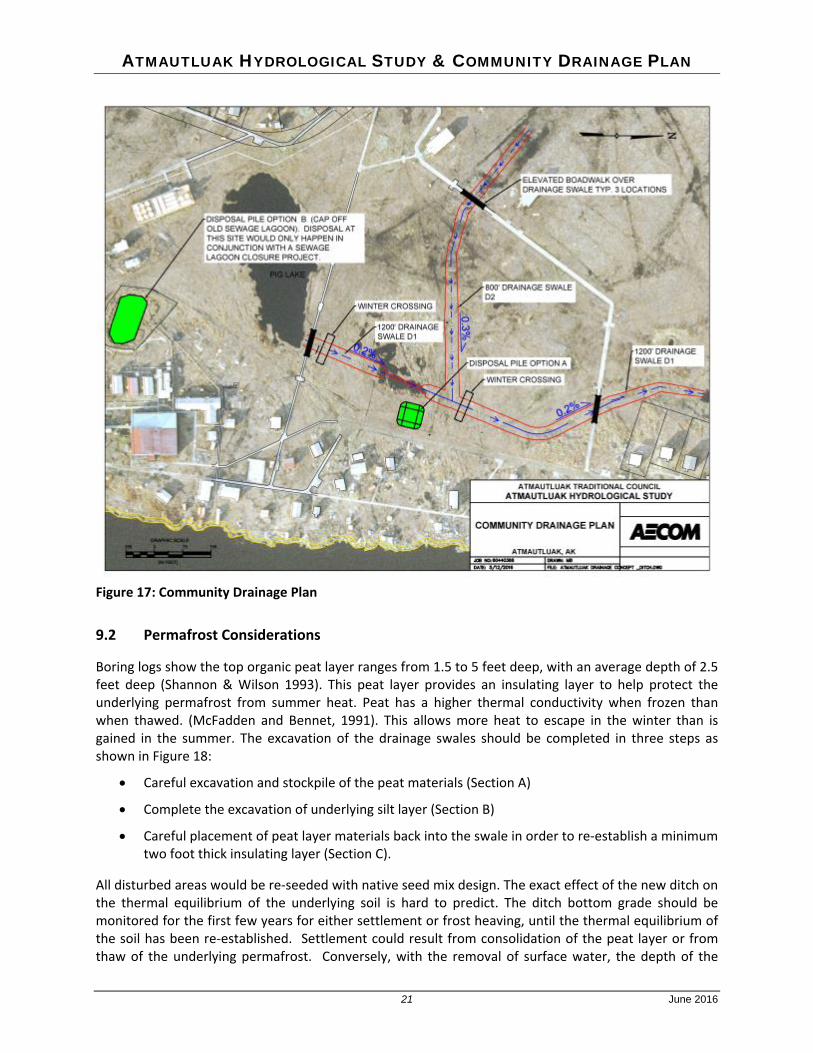
surface elevation of Pig Lake has increased, leading to additional flooding and inundation of previously dry ground. The Traditional Council members said the ground in this area used to be higher and dryer. The resulting standing water may be contributing to permafrost thaw and causing noticeable ground settlement in the area. The pre‐road drainage flowed to the lake north of the community, but now appears to be impounded in the circled area shown in Figure 16.
Figure 16: Pre‐Road Drainage Pattern
9.1 Drainage Swales
A drainage plan was developed to lower the water level of Pig Lake and help drain the wet area to the north of Pig Lake. Ground elevations in AutoCAD Civil 3D were based on survey points from the August 2015 DOWL ground survey and the 2007 Digital Terrain Model developed for the Community Map (Community Map elevations are 8.03 feet lower than DOWL elevations, see Section 4.0). The drainage plan includes construction of a 1200 foot long drainage swale (D1) to carry water from Pig Lake, North, to low lying marsh land near the airport, then to the large lake north of the townsite (see Figure 1). The low lying marsh area is approximately 4 feet lower than the low wet area shown in Figure 16. An 800 foot long swale (D2) would be constructed starting near the church and draining to the East into swale D1. This will drain the wet low area to the southwest of the church. See Figure 17 for proposed drainage paths. The proposed swales have a “V” shaped cross section with shallow 4:1 Horizontal:Vertical side slopes to mitigate concerns of vegetation “bridging” the swale and effectively closing it off. The swales will have shallow grades of 0.2 percent to 0.3 percent due to flat topography; shallow grades will keep runoff velocity low, reducing the chance of erosion. The swales would ideally be constructed in the spring before the active layer thaws and the underlying soil becomes too soft to support heavy equipment. Drainage profiles and cross sections for swales D1 and D2 can be seen in Appendix D.
ATMAUTLUAK HYDROLOGICAL STUDY & COMMUNITY DRAINAGE PLAN
21 June 2016
Figure 17: Community Drainage Plan
9.2 Permafrost Considerations
Boring logs show the top organic peat layer ranges from 1.5 to 5 feet deep, with an average depth of 2.5 feet deep (Shannon & Wilson 1993). This peat layer provides an insulating layer to help protect the underlying permafrost from summer heat. Peat has a higher thermal conductivity when frozen than when thawed. (McFadden and Bennet, 1991). This allows more heat to escape in the winter than is gained in the summer. The excavation of the drainage swales should be completed in three steps as shown in Figure 18:
Careful excavation and stockpile of the peat materials (Section A)
Complete the excavation of underlying silt layer (Section B)
Careful placement of peat layer materials back into the swale in order to re‐establish a minimum two foot thick insulating layer (Section C).
All disturbed areas would be re‐seeded with native seed mix design. The exact effect of the new ditch on the thermal equilibrium of the underlying soil is hard to predict. The ditch bottom grade should be monitored for the first few years for either settlement or frost heaving, until the thermal equilibrium of the soil has been re‐established. Settlement could result from consolidation of the peat layer or from thaw of the underlying permafrost. Conversely, with the removal of surface water, the depth of the

ATMAUTLUAK HYDROLOGICAL STUDY & COMMUNITY DRAINAGE PLAN
22 June 2016
active thaw layer could decrease, leading to formation of permafrost and localized heaving. Excess material stored in disposal piles could be used to re‐grade the ditch (and re‐seeded) as needed. Elimination of ponding is important because water has the potential to gain summer heat and lead to thawing of underlying permafrost and further settlement.
Figure 18: Ditch Excavation Sequence Plan
9.3 School Sewage Lagoon and Water Quality Concerns
The community is concerned with potential contamination from the school sewage lagoon that served the school prior to completion of a new sewage treatment system in 2012. Although the school lagoon is inactive and fenced off, the concern is that seasonal flooding could cause the lagoon to overflow and contaminate the surrounding tundra and water bodies. The fencing, as shown in Figure 19, is in disrepair and unable to keep intruders out. The Traditional Council expressed desire in the August 2015 community meeting to have the lagoon closed. A sewage lagoon closure would need to be completed in accordance with the State of Alaska Department of Environmental Conservations (ADEC) criteria and be coordinated with the Lower Kuskokwim School District. The ADEC sewage lagoon closure criteria document can be downloaded from the ADEC website at: https://dec.alaska.gov/eh/docs/sw/Sewage%20Lagoon%20Closure%20Guidance.pdf
Wastewater from the new sewage treatment plant is disinfected with ultraviolet radiation prior to its discharge into Pig Lake. The discharge into Pig Lake is permitted by an ADEC Discharge Permit. The discharge water is sampled and tested on a regular basis, with regular reports submitted to ADEC. During high water conditions, drainage from Pig Lake via the proposed drainage swale (D1) would not

ATMAUTLUAK HYDROLOGICAL STUDY & COMMUNITY DRAINAGE PLAN
23 June 2016
present water quality concerns to the surrounding areas and adjacent water bodies because strict EPA water quality standards are met at the outlet of the new sewage treatment plant discharge pipe (ADEC 2016). However, water quality in the old sewage lagoon is likely hazardous to human health, and overflow from the lagoon should be eliminated.
Figure 19: School District Old Sewage Lagoon
9.4 Silt Stockpiles
Construction of drainage swales would generate approximately 800 cubic yards of excess silt material that could be stockpiled for future use. A second option would be to use the excess material to cap the inactive school sewage lagoon. This option would need to be coordinated with the Lower Kuskokwim School District and could only be implemented after decommissioning of the sewage lagoon was completed and approved by ADEC. If this option is pursued, a survey of the lagoon should be done prior to construction in order to determine the volume of fill material that would be required to cap the lagoon. The final cap over the lagoon must be higher than the surrounding tundra to allow surface water to drain away in all directions. It will be critical to determine if the excess drainage swale material is sufficient for the lagoon closure project prior to construction or if additional material would need to be imported. Some excess material (20 to 30 cubic yards) should be retained to re‐grade the ditch, as needed over time, as discussed in Section 9.2.
9.5 Winter Crossing Locations
The Atmautluak Traditional Council commented during the April 25th 2016 Community Meeting that winter travel routes would traverse the proposed swale alignment. Two winter crossings for vehicle traffic were added to the swale design. Shallower swale slopes (8 Horizontal:1Vertical) were incorporated at two locations: one just north of Pig Lake and the second about 500 feet north of Pig Lake near where a public right‐of‐way corridor is located between the river and the gravel road (see Figure 17). The crossings should be marked with reflective delineators, four for each crossing. Carsonite flexible delineators, with reflectors, are recommended (Figure 21). The delineators can be driven into the tundra during summer and remain throughout the year.

ATMAUTLUAK HYDROLOGICAL STUDY & COMMUNITY DRAINAGE PLAN
24 June 2016
Figure 20: Winter Crossing Profile View
Figure 21: Carsonite Flexible Delineators

ATMAUTLUAK HYDROLOGICAL STUDY & COMMUNITY DRAINAGE PLAN
25 June 2016
9.6 Construction Cost Estimate
Table 5: Drainage Swale Cost Estimate
10.0 PERMITTING
This section provides an overview of permitting requirements for the proposed ACB matting and community drainage projects discussed in previous sections. A more detailed description of permitting requirements is included in Appendix E.
10.1 USACE Department of the Army Permit
U.S. Army Corps of Engineers (USACE) Department of the Army (DOA) Permits would be required for construction of a community drainage project in Atmautluak and a bank erosion project (ACB matting) along the Pitmiktakik River.
The USACE issues permits under the following authorities: 1) Section 404 of the Clean Water Act, which covers the discharge of dredged or fill material into waters of the U.S., including wetlands and 2) Section 10 of the Rivers and Harbors Act of 1899, which covers work in or affecting navigable water of the United States. Based on aerial photo review the area of the community drainage project appears to be comprised of freshwater wetlands. Because there is no wetland mapping available for the project area, the USACE may require delineation by a wetlands professional to confirm the presence of wetlands and determine the wetlands boundary.
There are two primary types of DOA permits, 1) Nationwide Permit and 2) Individual Permit. The proposed project activities do not appear to fall under any of the 2012 Nationwide Permits available in Alaska; the limits of a Nationwide permit are for projects with no more than 500’ of disturbance along the bank below the ordinary high water mark and no more than one cubic yard of fill material per foot of revetment; the proposed ACB matting project would not meet these requirements therefore, an Individual Permit would be required. A summary of the 2012 Nationwide Permits can be found at:
http://www.poa.usace.army.mil/Portals/34/docs/regulatory/Summary_Table_2012%20NWPs_14%20Feb%202012.pdf
As the lead Federal permitting agency, the USACE would contact other agencies to determine if the proposed project will have adverse effects on the environment. USACE would:
Consult with U.S. Fish & Wildlife Service and National Marine Fisheries Service concerning potential Threatened &Endangered species and Critical Habitat
Consult with National Marine Fisheries Service for an Essential Fish Habitat Assessment
Drainage Plan Cost Summary
1200’ Ditch D1
(2) Elevated Boardwalks over D1
800’ Ditch D2 Elevated boardwalk over D2
Total Drainage Ditch Cost
$235,000 $60,000 $160,000 $30,000 $490,000

ATMAUTLUAK HYDROLOGICAL STUDY & COMMUNITY DRAINAGE PLAN
26 June 2016
Coordinate the DOA application with the ADEC to obtain a State Water Quality Certification
Consult with the State Historic Preservation Office (SHPO) for the presence or absence of historic properties.
Additional permits would include:
Alaska Department of Fish and Game Fish Habitat Permit (FHP)
Alaska Pollutant Discharge Elimination System (APDES) Construction General Permit
Any work below the ordinary high water mark of the Pikmiktakik River associated with the bank erosion project would require a FHP. FHPs generally take 30 to 60 days to process. As part of the APDES General Permit, a permittee must prepare a Storm Water Pollution Prevention Plan (SWPPP). The SWPPP documents the selection, design, installation, and implementation of control measures to minimize pollutant discharges as required by law. The construction contractor would be responsible for preparation of the SWPPP and for obtaining coverage under the APDES General Permit, just prior to construction, as part of the construction contract.
Permitting of chosen alternatives would occur after the final designs are in advanced stages and prior to construction. Other permits in addition to the ones listed above could be required once the scope of the project is fully defined. A more detailed description of permit requirements is included in Appendix E.
10.2 National Environmental Policy Act
The National Environmental Policy Act (NEPA) of 1969 requires that prospective impacts of projects be understood and disclosed prior to a Federal agency issuing a permit or providing funding for a project. If USACE can determine that the environmental impacts from the project fall in a category of actions which do not have a significant effect on the environment, then neither an Environmental Assessment (EA) nor an Environmental Impact Statement (EIS) would be required. If the significance of environmental impacts from the proposed action is not clearly established and the activities do not fall under a list of categorically excluded actions from NEPA, the USACE as the lead permitting agency, would need to prepare an EA and may require the applicant to provide appropriate information necessary for the preparation of the EA. The purpose of the EA is to determine if the project will cause significant effects. If the EA concludes that no significant impacts will occur, a Finding of No Significant Impact is prepared and is used to support USACE’s permit decision. In the unlikely event that the EA for the proposed activity identifies significant impacts, an EIS would be required. Preliminary discussions with USACE in 2016 indicate that a small EA would probably be required for a river bank erosion revetment project (ACB matting) or a community drainage project.
10.3 Permitting for a Bank Stabilization Project and Community Drainage Project
As discussed above, a project for bank stabilization (ACB matting) would require a DOA Section 10 permit from USACE. A community drainage project for the purpose of reducing standing water in the community would require a Section 404 DOA permit from USACE. Federal agencies are reluctant to issue a permit that would in some way alter or modify wetlands unless a compelling case is made that the proposed project is the least environmentally damaging practicable alternative.
A purpose and need statement that would accompany a DOA permit application would need to make a case that the proposed project is needed. The need for a bank stabilization project is obvious, to preserve threatened land and property in the community. In the case of the community drainage plan,

ATMAUTLUAK HYDROLOGICAL STUDY & COMMUNITY DRAINAGE PLAN
27 June 2016
underlying soils in Atmautluak are within one degree of thawing (Shannon & Wilson 1993). The case could be made in Atmautuluak that removal of standing water is needed because it could potentially slow down or stop permafrost degradation in the center of the community. Degradation of permafrost could result in continuing ground settlement, leading to more surface flooding and even more permafrost degradation. The case also could be made that the road from the airport has blocked the natural drainage and resulted in the impoundment of water. A community drainage project would restore the natural drainage. If the purpose and need statement can demonstrate positive environmental impacts (potentially mitigating permafrost degradation) then compensatory mitigation may not be required.
11.0 REFERENCES
Alaska Department of Commerce, Community, and Economic Development (ADCED). 2009. Alaska Community Information Database Community Information Summaries. Accessed at http://commerce.state.ak.us/dnn/Portals/4/pub/Atmautluak_Final%20Report.pdf.
Alaska Department of Environmental Conservation (ADEC). 2010. Public source water executive summary: Available at: http://www.dec.state.ak.us/EH/dw/DWP/execsummary.aspx?PWSID=271033.001.
DOWL. 2015. Atmautluak Engineering Analysis, Atmautluak, Alaska. Surveying and mapping report. Prepared by DOWL, Anchorage, AK. DOWL HKM Project Number 1127.62038.01.
McFadden and Bennet. 1991. Construction in Cold Regions. Terry T. McFadden and F. Lawrence Bennet. Published by Wiley 1991.
Shannon & Wilson Inc. 1993. Geotechnical Services for Proposed Lift Station, Honey Bucket Lagoon, Sewage Lagoon and Sewage Pipeline. June 1993
State of Alaska Department of Public Works Division of Aviation. 1975. Construction Plans for Atmautluak Airport (1976 As Builts)
US Army Corps of Engineers (USACE). 2007. Erosion information paper ‐ Atmautluak, Alaska. August 27, 2007. Alaska District Corps of Engineers Civil Works Branch.
WHPacific. 2010. Atmautluak hazard impact assessment June 2010. Prepared for the Atmautluak Traditional Council. Prepared by WHPacific with Shannon and Wilson Inc.


Appendix A:
Hydrology and Hydraulic Report

This page intentionally left blank.

Hydrologic and Hydraulic Report
for
Atmautluak Hydrologic Study
Prepared for: Atmautluak Traditional Council
PO Box 6568 Atmautluak, AK 99559
And
AECOM Technical Services, Inc. 700 G Street, Suite 500 Anchorage, AK 99501
Prepared by:
Hydraulic Mapping and Modeling 1091 West Chena Hills Drive
Fairbanks, AK 99709
May 2016

ii Hydraulic Mapping Atmautluak And Modeling Hydrologic & Hydraulic Analysis
Hydrologic and Hydraulic Report
for
Atmautluak Hydrologic Study
Prepared for: Atmautluak Traditional Council
PO Box 6568 Atmautluak, AK 99559
And
AECOM Technical Services, Inc. 700 G Street, Suite 500 Anchorage, AK 99501
Prepared by:
Hydraulic Mapping and Modeling 1091 West Chena Hills Drive
Fairbanks, AK 99709
May 2016

iii Hydraulic Mapping Atmautluak And Modeling Hydrologic & Hydraulic Analysis
Table of Contents
Table of Figures ............................................................................................................................. iv
Table of Tables .............................................................................................................................. iv
Project Location and Description .................................................................................................... 1
Hydrology ....................................................................................................................................... 1
Bank Erosion at Atmautluak ........................................................................................................... 4
Shear Stress and Pore-Water Pressure ........................................................................................ 4
Ice ................................................................................................................................................ 4
Thermal Degradation .................................................................................................................. 5
Boat Wash ................................................................................................................................... 5
Hydraulic Analysis.......................................................................................................................... 6
Bankfull Discharge ..................................................................................................................... 8
Ice Cover and Ice Jam ................................................................................................................. 9
Erosion by Shear Stresses ......................................................................................................... 14
Scour ......................................................................................................................................... 15
Design Alternatives ....................................................................................................................... 16
Articulated Concrete Block ...................................................................................................... 17
Continuous Riprap Bank Protection ......................................................................................... 19
Bioengineering .......................................................................................................................... 20
Summary ....................................................................................................................................... 22
References ..................................................................................................................................... 23
Appendix 1-Surveyed Cross-sections and Results from HEC-RAS ............................................. 25
Appendix 2- Results from HEC-RAS Open Water Analysis ....................................................... 30

iv Hydraulic Mapping Atmautluak And Modeling Hydrologic & Hydraulic Analysis
Table of Figures Figure 1. Project location map. ...................................................................................................... 2
Figure 2. Change in ground temperatures. From UAF (2015). ..................................................... 5
Figure 3. Surveyed cross-sections used for HEC-RAS analysis. ................................................... 6
Figure 4. Water surface profiles from HEC-RAS analysis. ........................................................... 8
Figure 5. Water surface profile comparisons for Open Water and Ice Jam models at 1424 cfs. . 11
Figure 6. Water surface elevation comparisons at RS 17890 for Open Water and Ice Jam models. .......................................................................................................................................... 11
Figure 7. Water surface profile comparisons for Open Water and Ice Jam models at 2100 cfs. . 12
Figure 8. Water surface elevation comparisons at RS 17890 for Open Water and Ice Jam models at 2100 cfs. .................................................................................................................................... 12
Figure 9. Estimated rates of bank erosion for 4 hours (left) and 1460 hours (right). .................. 14
Figure 10. Proximity map of Nunapitchuk and Atmautluak. ........................................................ 17
Figure 11. ACB at Nunapitchuk Airport embankment along Nunavakanukakslak River. .......... 18
Figure 12. ACB installation at Nunapitchuk Airport embankment. ............................................ 18
Figure 13. ACB installation at Lake Hood/Spenard Lake channel, Anchorage, AK. .................. 19
Table of Tables
Table 1. Watershed characteristics. ................................................................................................ 3
Table 2. Flood discharges based on precipitation events. .............................................................. 3
Table 3. Discharge measurements on the Pikmiktalik River. ........................................................ 7
Table 4. HEC-RAS comparison results of Open Water and Ice Jam models. ............................. 13
Table 5. Estimated shear stress and erosion results at Atmautluak bank...................................... 14
Table 6. Summary table of three design methods for bank erosion protection. .......................... 21

1 Hydraulic Mapping Atmautluak And Modeling Hydrologic & Hydraulic Analysis
Project Location and Description The Village of Atmautluak is located on the Pitmiktakik River 18 miles west of Bethel, 62 miles inland from Kuskokwim Bay and the Bering Sea (Figure 1). The community is located on the outside bend of the river. Atmautluak faces a number of hazard threats, including: 1) river bank erosion, 2) ground settlement due to permafrost, and 3) flooding. A Hazardous Mitigation Plan (HMP) was prepared by the Village of Atmautluak hazard mitigation planning team in 2013. Based on the hazard threats detailed in the HMP, the Atmautluak Traditional Council requires assistance with determining the most suitable combination of solutions to mitigate the three primary hazard threats listed above. This report includes an analysis of the hydrologic characteristics of Atmautluak and the Pitmiktakik River, hydraulic analyses of bank erosion and ice jam scenarios, and a review of several erosion protection methods.
Hydrology Atmautluak is located in a maritime climate, approximately 65 miles from Kuskokwim Bay on the Bering Sea coast. The coast is bordered by sea ice in the winter, and the surrounding coastal area is treeless and dotted with numerous small lakes. Although the mean annual temperatures are similar to inland sites at the same latitudes, the seasonal range of temperatures is much lower and the winds are much higher. Annual precipitation at Atmautluak averages 22 inches, with 43 inches of snowfall annually. Summer temperatures range from 41 to 57 °F, and winter temperatures average 6 to 24 °F (ADCED, 2009). The Pitmiktakik River (also spelled Pikmiktalik) is a meandering stream that originates about 60 miles northeast of Atmautluak in a flat tundra and lakes complex area. Atmautluak is located on an actively eroding bend of the river. The area around Atmautluak is flat and poorly drained with numerous lakes and small drainages that flow into the Pitmiktakik River (ADCED, 2015). The channel is tidally influenced. On the rising (flood) tide, flow comes up the Kuskokwim River to the Johnson River, before entering the Pitmiktakik River channel adjacent to Atmautluak. Following high tide, the ebb tide flows out the Pitmiktakik River to the Johnson and Kuskokwim Rivers, ultimately to Kuskokwim Bay and the Bering Sea. Typical of most areas in Alaska, there are no long-term gaging records available for the Pitmiktakik River. As noted in WHPacific (2010), historic river discharge data in the Kuskokwim River delta is very limited and generally unsuited for assessing long-term trends. Flooding in the Atmautluak area could be caused by several sources, including: runoff from precipitation events, storm surge (high incoming tide) and ice jam floods. Since no gaging information exists for any nearby streams, precipitation-related flood magnitude estimations were developed using USGS regression equations for estimating the magnitude of peak streamflows in Alaska.

2 Hydraulic Mapping Atmautluak And Modeling Hydrologic & Hydraulic Analysis
Figure 1. Project location map.

3 Hydraulic Mapping Atmautluak And Modeling Hydrologic & Hydraulic Analysis
The latest USGS regression method for estimating peak streamflows at ungaged locations is described in the USGS Water Resources Investigations Report 03-4188 (Curran et al., 2003). Basin characteristic information is used in the USGS regression analysis. For Region 6, the characteristics include:
drainage area upstream from the site, percentage of lakes and ponds area, percentage of forest areas.
Drainage basin area was obtained from the USGS Watershed Boundary Dataset (USGS, 2015). Other basin characteristics were obtained by planimetric techniques used with USGS 1:63360 quad maps. Due to flat terrain and the ubiquitous presence of lakes, ponds and wetlands, the planimetered basin characteristics in Table 1 should be considered as an approximation. Table 1. Watershed characteristics.
Pitmiktakik River Watershed
Drainage Area (mi2) 671.5 Area of Lakes and Ponds (%) 50 Area of Forests (%) 0
The range of the ‘lakes and ponds area’ variable used to develop the regression equations for Streamflow Analysis Region 6 is 0 to15 %. The percentage of the ‘lakes and ponds’ areas for the Pitmiktakik River watershed is significantly larger than the high end of the range. Lakes and ponds act as temporary storage areas during floods, and tend to dampen peak flood magnitudes. Therefore, the peak flood magnitudes for a given recurrence interval in this watershed may be smaller than predicted by the regression equations. For flooding caused by precipitation events, the estimated magnitudes for the 2-year flood through the 100-year flood for the Pitmiktakik River watershed are shown in Table 2. The adequacy of the regression equations can be evaluated by several measures. Confidence limits provide a measure of the error in a particular prediction. The 5% and 95% confidence limits provide a 90% prediction interval for a particular site. Because this watershed is ungaged, has limited historic hydraulic information, and has boundaries that are difficult to delineate, the lower and upper confidence limits were calculated and included in Table 2. Due to reasons described above and detailed in an analysis later, actual flood magnitudes may be closer to the lower end of the 90% prediction interval. Values should be used with caution. Table 2. Flood discharges based on precipitation events.
Flood Recurrence Interval
Pitmiktakik River (cfs)
Confidence Limits 5% 95%
2‐year 6170 2920 13000 5‐year 7920 3670 17100 10‐year 9040 4010 20400 25‐year 10400 4320 25100 50‐year 11400 4480 29000 100‐year 12400 4590 33200

4 Hydraulic Mapping Atmautluak And Modeling Hydrologic & Hydraulic Analysis
Bank Erosion at Atmautluak According to an analysis of erosion by the US Army Corps of Engineers (USACE), erosion is affecting the bank of the Pitmiktakik River along the entire length of the community at Atmautluak (USACE, 2007). A comparison of aerial photographs from 1971 and 2007 shows the bank has eroded on average about 47 feet over 36 years, or about 1.3 feet per year. The 2010 WH Pacific study showed a similar erosion rate over a 32-year period of 1.3 feet per year. During a field visit in August 2015, villagers reported that material sloughing from the bank at Atmautluak was filling in the adjacent near-bank channel, making boat launching conditions difficult or impossible at some water levels. The USACE report attributes the erosion to several causes, including natural river flow, spring breakup, melting permafrost, boat wakes, and ice jams. Various methods of erosion are likely contributing to the high rate of erosion, and are discussed below.
ShearStressandPore‐WaterPressureErosion of the bank and bank toe can occur when a soil block fails because of excessive shear stress. When the hydraulic shear stress in a channel exceeds some threshold above the critical shear stress, or magnitude of shear stress required to move a given particle, then those particles are mobilized and bank/toe erosion is initiated. Additionally, positive pore-water pressure can lead directly to streambank erosion and instability. In addition to increasing the weight of the bank, pore-water pressure reduces the effective friction (normal stress) between soil particles, thereby weakening the soil and allowing particles to be dislodged. Bank erosion from positive pore water pressure is commonly attributed to areas with shallow water tables and non-cohesive bank materials such as gravels and sand. However, a literature review found papers that focus on the importance of accounting for positive and negative pore-water pressures of unsaturated cohesive materials when considering stream stability, bank erosion, and channel widening. Simon and Collison (2001) note that pore-water pressure within cohesive riverbeds will increase during the rising limb of a flood hydrograph (or tidal inflow). If the water level falls rapidly on the receding limb, bed pore-water pressure will also fall, though the impermeability of the soil delays pressure equalization. As a result, upward-directed seepage occurs to eliminate the pressure differential, and leads to rupture and erosion of the streambed, or to partial liquefaction of the upper part of the bed Similarities between the Simon and Collison study sites and the Pitmiktakik River bank erosion at Atmautluak include the soil type (silt) and the large rapid variation in the tidal elevations, which occurs approximately every 6 hours. For example, Bethel, Alaska is located on the Kuskokwim River approximately 19 miles upstream of its confluence with the Johnson River. Tidal changes of 2 to 4 feet occur twice a day there. Atmautluak is located approximately 26 miles upstream of the Johnson/Kuskokwim River confluence. Residents report that the typical daily tidal variation is approximately 2 feet.
IceRiver ice can contribute to riverbank erosion in several ways. Freeze-thaw cycling and the formation of ice in riverbanks disrupt bank soil structure, which reduces soil strength. This often results in in-situ bank sediment being dislodged and moved downslope via gravity. Additionally,
5 Hydraulic Mapping Atmautluak And Modeling Hydrologic & Hydraulic Analysis
there are several types of ice movements that can remove and transport in-situ bank soils and accumulated sediments, including: 1) ice retreat from the bank that results in plucking and rafting of material frozen into and lying on the ice, 2) ice thrust into the bank that disrupts the sediments and soils, and 3) ice shear parallel to the bank that abrades and gouges the bank (Gatto, 1993). The USACE (2007) notes that in the last 10 years, three to four ice jams have caused 1 to 2 feet of erosion per event.
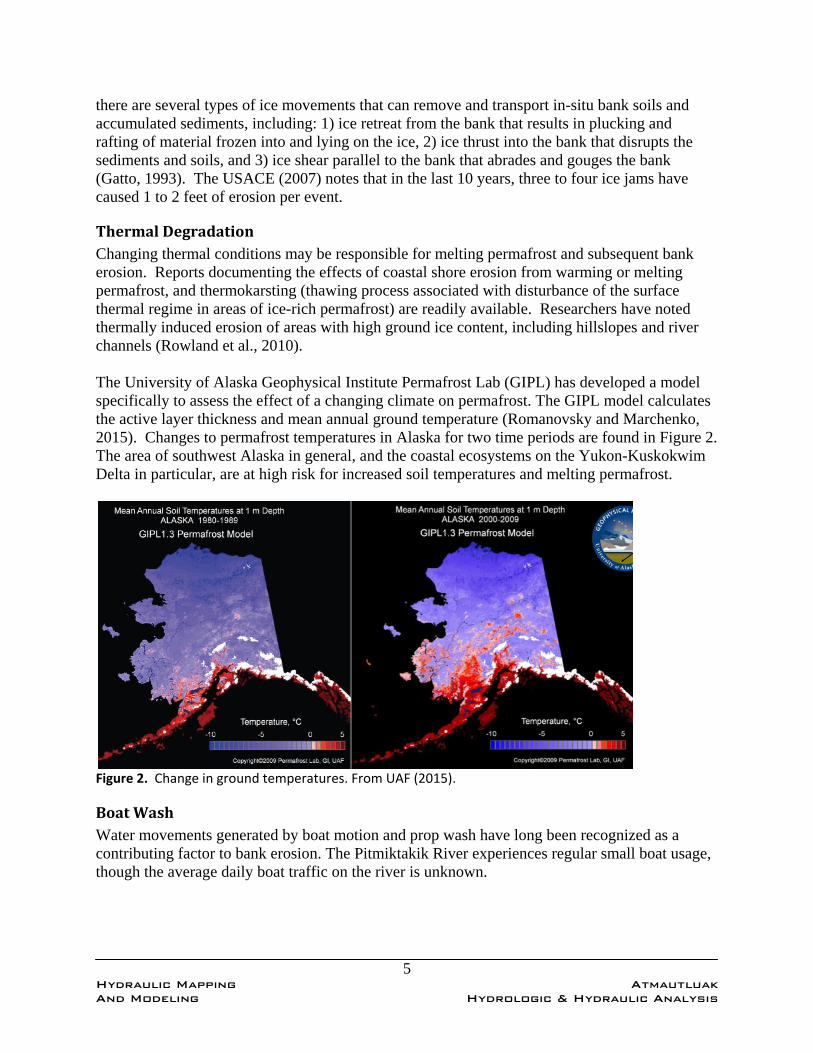
ThermalDegradationChanging thermal conditions may be responsible for melting permafrost and subsequent bank erosion. Reports documenting the effects of coastal shore erosion from warming or melting permafrost, and thermokarsting (thawing process associated with disturbance of the surface thermal regime in areas of ice-rich permafrost) are readily available. Researchers have noted thermally induced erosion of areas with high ground ice content, including hillslopes and river channels (Rowland et al., 2010). The University of Alaska Geophysical Institute Permafrost Lab (GIPL) has developed a model specifically to assess the effect of a changing climate on permafrost. The GIPL model calculates the active layer thickness and mean annual ground temperature (Romanovsky and Marchenko, 2015). Changes to permafrost temperatures in Alaska for two time periods are found in Figure 2. The area of southwest Alaska in general, and the coastal ecosystems on the Yukon-Kuskokwim Delta in particular, are at high risk for increased soil temperatures and melting permafrost.
Figure 2. Change in ground temperatures. From UAF (2015).
BoatWashWater movements generated by boat motion and prop wash have long been recognized as a contributing factor to bank erosion. The Pitmiktakik River experiences regular small boat usage, though the average daily boat traffic on the river is unknown.

6 Hydraulic Mapping Atmautluak And Modeling Hydrologic & Hydraulic Analysis
Hydraulic Analysis An analysis was conducted to determine the hydraulic characteristics of the Pitmiktakik River channel at various flow levels. Parameters to be determined from the analysis include velocity, water surface elevation, shear stress, and others. These hydraulic characteristics will be used to evaluate potential solutions for the bank erosion problem at Atmautluak. Cross-section geometry is used to create a numerical model of the channel for use in a hydraulic analysis, generally conducted with a computer software program. Cross-sections are located at intervals along a channel to characterize the flow carrying capability of the stream and its adjacent floodplain. Cross-section spacing is determined by balancing the improvements in accuracy (more cross-sections) with the additional costs of collecting such field data. Cross-sections on the Pitmiktakik River channel were surveyed for this project in August 2015. Cross-sections are spatially located by river stationing; stationing begins at 0 (zero) feet at the downstream end, which is about 4500 feet downstream from the village of Atmautluak. Nine cross-sections, labeled from River Station 0 (units of feet) (downstream) to 25374 (upstream) were used in the model. See Figure 3.
Figure 3. Surveyed cross‐sections used for HEC‐RAS analysis.

7 Hydraulic Mapping Atmautluak And Modeling Hydrologic & Hydraulic Analysis
The cross-sections were surveyed using a combination of methods (DOWL, 2015). In addition to using an RTK GPS total station for upland and shallow water survey measurements, a SONTEK M9 Acoustic Doppler Profiler was used for the hydrographic survey. The acoustic Doppler profiler supplied not only bed elevations along the cross-section lines, but estimates of discharge at each cross-section as well. A summary of the ADP measurements is found in Table 3. Note that four of the nine discharge measurements made by the ADP occurred during the rising (flood) tide cycle, when the direction of flow is upstream. Table 3. Discharge measurements on the Pitmiktakik River.
Cross Section
River Station (ft)
Date Time of
Measurement
Discharge(cfs)*
AverageVelocity(ft/s)*
MaximumVelocity (ft/s)*
Maximum Depth (ft)
9 0 08/27/15 1742 ‐1644.4 ‐0.80 ‐6.78 13.2 8 6738 08/27/15 1723 ‐1260.8 ‐0.71 ‐6.25 12.2 7 10806 08/27/15 1658 ‐1303.5 ‐0.70 ‐3.82 10.9 6 15332 08/27/15 1627 ‐341.0 ‐0.21 ‐3.76 9.3 5 16435 08/27/15 1445 1555.3 0.93 5.90 9.3 4 17890 08/27/15 1413 1534.2 0.87 4.16 10.6 3 19296 08/27/15 1348 1414.9 0.54 5.79 10.6 2 22659 08/27/15 1340 1424.4 0.88 2.33 14.7 1 25374 08/27/15 1238 1368.7 0.76 4.42 11.5
*negative sign indicates flow is in the upstream direction. The hydraulic analysis for the Pitmiktakik River consisted of modeling the flow characteristics using the U.S. Army Corps of Engineers Hydrologic Engineering Center water surface profiling computer program HEC-RAS version 4.1. The basic computational procedure for the HEC-RAS program is based on the solution of the one-dimensional energy equation. Energy losses are evaluated by friction (Manning’s equation) and contraction/expansion. The momentum equation is utilized in situations where the water surface profile is rapidly varied, such as at bridges (USACE, 1998). Channel and floodplain roughness coefficients were determined by calibrating the model using the discharge measurement and surveyed water surface elevations made on August 27, 2015 and were based on engineering judgment and values found in Chow (1959), FHWA (1961), and FHWA (1996). Once the model is constructed and calibrated, estimations of channel velocities and stage were calculated for each cross-section for a range of selected flows. In the HEC-RAS model, boundary conditions are necessary to establish the starting water surface at the ends of the river system. In a subcritical flow regime such as the Pitmiktakik River, boundary conditions are only necessary at the downstream end. For the HEC-RAS model, the normal slope, developed from surveyed water surface elevations, was used for the downstream boundary condition. The HEC-RAS model was run at several discharges to provide hydraulic characteristics useful for the selection and design of appropriate bank erosion methods. In addition to modeling the measured discharge of 1424 cfs, the HEC-RAS model was also used to estimate the bankfull discharge (approximately 2100 cfs), and channel conditions during an ice jam. See Figure 4 for

8 Hydraulic Mapping Atmautluak And Modeling Hydrologic & Hydraulic Analysis
measured and estimated water surface profiles through the surveyed reach.
Figure 4. Water surface profiles from HEC‐RAS analysis.
The surveyed cross-sections, with water surface elevations from the HEC-RAS results for 1420 cfs, are found in Appendix 1. Appendix 2 includes tabular results from the HEC-RAS analysis at 1420 cfs and 2100 cfs. BankfullDischargeThe recurrence interval for bankfull discharge has generally been considered to be 1.5 years (Leopold et al., 1964). In other studies, the average recurrence interval of the bankfull discharge ranged from 1.1 to 1.8 years (Rosgen, 1998). Note that the HEC-RAS analysis found the bankfull discharge of the Pitmiktakik River near Atmautluak to be approximately 2100 cfs, which is considerably smaller than the estimated 2-year discharge of 6170 cfs determined from the regression analysis and found in Table 2. This large discrepancy could indicate that the regression analysis used is inadequate for this watershed. As noted earlier, the range of the ‘lakes and ponds area’ variable used to develop the regression equations for Streamflow Analysis Region 6 is zero to 15 percent; however, the percentage of the ‘lakes and ponds’ areas for the Pitmiktakik River watershed is significantly larger (approximately 50 percent). Lakes and ponds act as temporary storage areas during floods, and can dampen peak flood magnitudes. This would lead to flood magnitude predictions that are much larger than what actually occurs in the watershed. Actual flood magnitudes may be closer to the values in the lower end of the 90% prediction intervals. For example, the 5% confidence value for the 2-year flood is 2920 cfs, and appears to agree more closely with the estimated value of the bankfull discharge. However, note that this does not imply or suggest any relationship between the ‘lakes and ponds area’ variable used to derive the regression equations, and the range of values given by the 90% confidence intervals. Values should be used with caution.
0 5000 10000 15000 20000 25000 30000-10
-5
0
5
10 Pitmiktakik River at Atmautluak
Main Channel Distance (ft)
Ele
vatio
n (
ft)
Legend
WS 2100 cfs
WS 1424 cfs
Ground

9 Hydraulic Mapping Atmautluak And Modeling Hydrologic & Hydraulic Analysis
IceCoverandIceJamIce jams often occur at discharges much less than those associated with the annual peak; however, they often produce water levels much higher than the 5-year, 50-year, or even 100-year water levels. Ice jam-related water levels can result in backwater and flooding in certain conditions. The presence of winter ice changes the geometry of a river channel. By the nature of an ice cover on a river channel, the shear area of the water flow in the river is significantly increased. The wetted perimeter of the channel is essentially doubled; this effect increases the resistance to flow, which increases the depth of water flow. In most southcentral and southwestern areas of Alaska, ice covers are an annual occurrence. Ice jams, however, may or may not occur in any given year due to variations in the spring weather, strength of the ice cover, discharge, and other factors. The WHPacific report notes that the Corps of Engineers attributes the 1972 flood of record in Atmautluak to ice jamming (WHPacific, 2010). In addition, the Corps of Engineers noted in a 2007 report that ‘in the last 10 years, three to four ice jams have caused 1 to 2 feet of erosion per event, according to local officials’ (USACE, 2007), though ice-jam flooding was not mentioned. However, the CRREL Ice Jam Database, which contains information on past ice jam events including dates, locations and damage levels, includes no information on ice jams for Atmautluak or the Pitmiktakik River. A second database of ice jams in the State of Alaska contains a database of unofficial river flooding and ice jam observations by pilots and others. Maintained by the Alaska-Pacific River Forecast Center, this National Weather Service web site also contained no information on ice jams for Atmautluak or the Pitmiktakik River. Additionally, the Atmautluak Traditional Council noted during two project meetings that flooding due to ice jams has not been an issue for the community. HEC-RAS can simulate channels with ice covers of known thickness and roughness. It can also simulate wide river ice jams by adjusting the jam thickness and roughness until the ice jam force balance equation and the standard step backwater equation are satisfied. To analyze ice cover conditions and evaluate the effectiveness of erosion control measures on a river that experiences ice jams, the HEC-RAS hydraulic model of the Pitmiktakik River was used. For the Pitmiktakik River, the HEC-RAS model was used to estimate water surface conditions and velocities on an ice-free channel, and changes to those conditions with an ice cover resulting from an ice jam. Though there is no calibration data for ice conditions on the Pitmiktakik River, conditions were assumed based on knowledge of ice jams elsewhere in Alaska. To effectively analyze ice jams with the HEC-RAS model, reasonable values of discharge during ice jams are needed. There are no known winter discharge measurements on the Pitmiktakik River, so estimations of appropriate discharge values were based on knowledge of hydrologic regimes in Alaska. Streams in Southcentral Alaska typically have low discharge in winter. Nonglacial streams in the Yukon hydrologic region start to rise rapidly after breakup, and flow peaks in mid to late May, during breakup snowmelt. Breakup ice jams are generally initiated by seasonal increases in discharge that cause the existing ice cover to disintegrate and potentially reform (jam) at another location downstream.

10 Hydraulic Mapping Atmautluak And Modeling Hydrologic & Hydraulic Analysis
The discharge that occurs during ice jams varies according to location and river. On the Tanana River near Salcha, discharge during ice jams is generally much less than the annual peak flow, which occurs later in the summer. Other reports note that ice jams in the Northeast United States generally require the 2-year discharge, while rivers in North Central Canada experience the annual peak discharge during spring breakup runoff. With a daily tidal influence, winter discharge of the Pitmiktakik River will be higher than that of a non-tidal river in a similarly sized watershed. For the analysis, several discharge values that may represent late winter/early spring conditions just prior to and during breakup were selected. Modeled discharges include 1424 cfs (measured), and 2100 cfs (bankfull discharge). Open Water (no ice cover)-The existing conditions model described earlier was used to model the open water example. Modeled discharges include 1400 cfs and 2100 cfs. Results for the open water (winter discharge) model are found in Figures 5 and 7 (channel profile) and Figures 6 and 8 (Cross-section 17890 at Atmautluak). Ice Jam-To analyze the potential impacts from an ice jam, an ice cover representing an ice jam was placed on the channel by modifying the geometry file. In general, ice jams form at a reach where the downstream transport capacity of ice is exceeded; typical reach conditions include downstream ice jams, channel slope changes, sharp bends, bridge piers, or other restrictions. This is usually due to surface obstructions, a downstream ice jam, bridge piers, width constrictions, or a significant change in bed slope. The jam was assumed to form at the sharp right-hand bend just downstream of cross-section 6738, where the ice thickness was set at 4 feet. This location was selected only to illustrate the possible hydraulic conditions; actual ice jams on the Pitmiktakik River may form at other locations. The ice jam is assumed to extend upriver to station 22659, where ice thickness was set at 2.0 feet. The other parameters, which describe the ice jam material properties, such as the friction angle, porosity, and stress ratio, were all left at their default values. Results for the ice jam model are found in Figures 5 and 7 (channel profile) and Figures 6 and 8 (Cross-section 17890 at Atmautluak). Note that the ice jam results in an increase to the water surface elevation of 2.5 to 3 feet, depending on cross-section location. The model indicates that an ice jam can create overbank flow even at low discharge levels that would normally stay confined within the channel. See Table 4 for comparisons of water surface elevation and average velocity at each cross-section.

11 Hydraulic Mapping Atmautluak And Modeling Hydrologic & Hydraulic Analysis
Figure 5. Water surface profile comparisons for Open Water and Ice Jam models at 1424 cfs. Flow downstream is from right to left.
Figure 6. Water surface elevation comparisons at RS 17890 for Open Water and Ice Jam models. Cross‐section is looking downstream (south).
0 5000 10000 15000 20000 25000 30000-10
-5
0
5
10
15 Pitmiktakik River at Atmautluak
Main Channel Distance (ft)
Ele
vatio
n (
ft)
Legend
1424 cfs with ice jam
1424 cfs open water
Ground
Ice Cover
0 500 1000 1500 2000-5
0
5
10
15
RS = 17890 Pitmiktakik River at Atmautluak
Station (ft)
Ele
vatio
n (
ft)
Legend
1420 cfs with ice jam
1420 cfs open water
Ground
Bank Sta
Ice Cover

12 Hydraulic Mapping Atmautluak And Modeling Hydrologic & Hydraulic Analysis
Figure 7. Water surface profile comparisons for Open Water and Ice Jam models at 2100 cfs. Flow is from right to left.
Figure 8. Water surface elevation comparisons at RS 17890 for Open Water and Ice Jam models at 2100 cfs. Cross‐section is looking downstream (south).
0 5000 10000 15000 20000 25000 30000-10
-5
0
5
10
15 Pitmiktakik River at Atmautluak
Main Channel Distance (ft)
Ele
vatio
n (
ft)
Legend
2100 cfs with ice jam
2100 cfs open water
Ground
Right Levee
Ice Cover
0 500 1000 1500 2000-5
0
5
10
15
RS = 17890 Pitmiktakik River at Atmautluak
Station (ft)
Ele
vatio
n (
ft)
Legend
2100 cfs with ice jam
2100 cfs open water
Ground
Bank Sta
Ice Cover

13 Hydraulic Mapping Atmautluak And Modeling Hydrologic & Hydraulic Analysis
Table 4. HEC‐RAS comparison results of Open Water and Ice Jam models.
River Sta Plan Q Total Min Ch El W.S. Elev Vel Chnl Flow Area Top Width
(cfs) (ft) (ft) (ft/s) (sq ft) (ft)
0
Ice Jam 1424 ‐6.51 6.57 0.71 2071.01 368.28
Open Water 1424 ‐6.51 6.57 0.71 2071.01 368.28
Ice Jam 2100 ‐6.51 8.41 0.83 2871.15 491.52
Open Water 2100 ‐6.51 8.41 0.83 2871.15 491.52
6738
Ice Jam 1424 ‐5.37 6.93 1.38 1105.75 258.28
Open Water 1424 ‐5.37 6.71 0.83 1793.83 271.81
Ice Jam 2100 ‐5.37 8.77 1.45 1645.17 432.51
Open Water 2100 ‐5.37 8.56 0.99 2331.4 326.75
10806
Ice Jam 1424 ‐4.28 8.46 0.91 1634.35 347.38
Open Water 1424 ‐4.28 6.8 0.74 2196.15 381
Ice Jam 2100 ‐4.28 10.11 1.05 2235.87 383.25
Open Water 2100 ‐4.28 8.65 0.87 2977.9 701.05
15332
Ice Jam 1424 ‐2.98 9.56 0.93 1645.11 299.83
Open Water 1424 ‐2.98 6.89 0.87 1807.62 506.08
Ice Jam 2100 ‐2.98 11.15 1.05 2849.12 1244.55
Open Water 2100 ‐2.98 8.76 1.02 2784.36 1619.4
16435
Ice Jam 1424 ‐3.55 9.75 0.76 2141.31 400.97
Open Water 1424 ‐3.55 6.92 0.79 2109.9 412
Ice Jam 2100 ‐3.55 11.34 0.9 3162.8 813.26
Open Water 2100 ‐3.55 8.79 0.92 3145.92 826.37
17890
Ice Jam 1424 ‐4.66 9.89 0.63 2393.97 427.09
Open Water 1424 ‐4.66 6.95 0.69 2147.42 562.66
Ice Jam 2100 ‐4.66 11.51 0.74 3254.9 702.32
Open Water 2100 ‐4.66 8.82 0.79 2963.74 1016.25
19296
Ice Jam 1424 ‐4.66 9.96 0.44 3388.7 624.53
Open Water 1424 ‐4.66 6.97 0.48 3031.3 765.6
Ice Jam 2100 ‐4.66 11.58 0.46 7747 2048.39
Open Water 2100 ‐4.66 8.84 0.57 3887.3 1983.03
22659
Ice Jam 1424 ‐8.73 10.09 0.67 2732.54 895.54
Open Water 1424 ‐8.73 7.01 0.8 1922.11 335.38
Ice Jam 2100 ‐8.73 11.7 0.78 4180.63 902.34
Open Water 2100 ‐8.73 8.88 0.96 2508.99 900.03
25374
Ice Jam 1424 ‐5.28 10.13 0.54 4834.97 1111.34
Open Water 1424 ‐5.28 7.06 0.79 2052.26 343.22
Ice Jam 2100 ‐5.28 11.75 0.65 6632.42 1113.93
Open Water 2100 ‐5.28 8.94 0.94 2889.15 1108.09

14 Hydraulic Mapping Atmautluak And Modeling Hydrologic & Hydraulic Analysis
ErosionbyShearStressesThe USDA Bank Stability and Toe Erosion Model (BSTEM) was utilized to estimate erosion of the bank and bank toe by hydraulic shear stress. The model estimates boundary shear stress from channel geometry and considers critical shear stress and erodibility of two separate zones with potentially different materials: the bank and bank toe (USDA, 2012). The model accounts for the strength of up to five soil layers, and the effects of pore-water pressure, both positive and negative. Cross-section 17890, surveyed at the high eroding bank at Atmautluak, was used to provide the bank geometry for the analysis. Soil layer characterizations were based on descriptions from WHPacific (2010). The input reach slope was based on water surface elevations surveyed simultaneously at two locations on the Pitmiktakik River channel, upstream and downstream of the village. The analysis was run at the discharge level surveyed August 2015. Analyses were conducted for two flow durations: 4 hours, representing two 2-hour high tide levels in one day, and 1460 hours, representing high tide levels for approximately one year. Estimated rates of erosion for the bank toe are found in Figure 9 and Table 5.
Figure 9. Estimated rates of bank erosion for 4 hours (left) and 1460 hours (right).
Table 5. Estimated shear stress and erosion results at Atmautluak bank for 1 day (two 2‐hour high tide levels) and 1 year (1460 hours of high tide levels).
Shear stress and erosion results 4 hours 1460 hours
Average applied boundary shear stress (Pa) 0.350 0.350 Maximum lateral retreat (cm) 1.25 39.36 Eroded area‐bank (m2) 0.029 9.850 Eroded area‐bank toe (m2) 0.014 3.850 Eroded area‐bed (m2) 0.011 1.774 Eroded area‐total (m2) 0.054 15.474
Results show that estimated bank erosion rates attributable to shear stress are approximately one foot per year.

15 Hydraulic Mapping Atmautluak And Modeling Hydrologic & Hydraulic Analysis
ScourOne of the most common causes of bank revetment failures is from floods scouring bed material from the toe of the revetment structure. With no information or data on long-term bed elevation changes in the Pitmiktakik River, a scour analysis of the channel at Atmautluak focused on general scour.
General Scour: Flow contraction at a revetment project may result in removal of material from the bed across all or most of the channel width. Other general scour conditions include flow around a bend where the scour may be concentrated near the outside of the bend. General scour is different from long-term degradation in that general scour may be cyclic and/or related to the passing of a flood (USDA, 2007).
The numerical computation of scour requires site specific stream data, including the bed material D50, design discharge, and top width and hydraulic radius at the design discharge, which are derived from a hydraulic analysis. Results from the HEC-RAS modeling analysis were used to provide the required hydraulic values for the scour calculations. Several methods were used to estimate general scour, including Lacey and Blench (USDA, 2007), and Zeller (Zeller, 1981). The Lacey equation was determined to best represent conditions at Atmautluak, including bed material (silt) and upstream conditions. The selected design discharge for scour estimation was 2100 cfs, which represents bankfull flow. The Lacey equation also includes a bend scour component in the calculations. The upstream radius ‘R’ of the river bend at Atmautluak was estimated at 1600 feet. With a design channel top width ‘T’ of 1016 feet, the degree of curvature ‘R/T’ is 1.6, which is classified as a severe bend. Based on the Lacey equation, general scour depth for Cross-section 17890, which is located at the center of the community, is estimated at 5.3 feet. Scour depth is estimated from the lowest part of the streambed. Hardening a bank can lead to increased bed scouring, incision, and a shift of the thalweg toward the revetment (Stein et al., 2013). With the hardening on an outside bend, this may be even more likely. However, channel velocities on the Pitmiktakik River are relatively low, and the thalweg elevations upstream and downstream are fairly consistent, with no large scour holes detected at the surveyed cross-sections. Note that the thalweg is located over 150 feet from the bank, and the lateral channel slope from the bank to thalweg is shallow (6 %). A large thalweg shift is less likely to occur over a long period of time, but more likely to be initiated during a large event (flood or ice jam) when velocities are much higher than normal. Note that scour equations are generally considered to provide conservative design values, especially in low risk or non-critical hydrologic conditions (Lagasse et. al., 2013). At the final design phase, a project-specific geotechnical investigation and updated channel survey should be performed. The use of regime scour equations must be balanced with local knowledge of channel conditions, confidence in the data used for each component in the scour equation, and engineering judgment.

16 Hydraulic Mapping Atmautluak And Modeling Hydrologic & Hydraulic Analysis
Design Alternatives Previous assessment of the bank erosion problem at Atmautluak indicates that bank erosion has occurred in the recent past, is ongoing, and will likely continue to be a characteristic trait of this river reach for the foreseeable future. The objective of this project is to analyze the hydrologic characteristics of the Pitmiktakik River, and develop methods to reduce or eliminate bank erosion at Atmautluak. The results from the hydraulic and shear stress analyses described above are summarized here:
Average velocities in the Pitmiktakik River channel are low, even during high flows. Average velocities are also low during ice jam events, though local velocities may
temporarily increase at constrictions or during the ice jam breakup. The channel slope is shallow. Depths are relatively shallow. As such, average shear
stresses are likely low in normal conditions. Upper bank material that fails is settling in lower bank regions, reducing the bank angle.
The two primary causes of bank erosion along the Pitmiktakik River are likely pore-water pressure in combination with ice forces during breakup and ice jam events.
Pore-water pressure, which increases and decreases with rapidly changing water levels, contributes to streambank erosion. Twice daily tidal cycles on the Pitmiktakik River result in rapidly changing pore-water pressure in the upper banks.
The freeze/thaw cycle and formation of ice along the riverbanks results in bank sediment being dislodged and moved downslope via gravity. Additionally, ice thrust, ice retreat and ice movement, which all occur during breakup and ice jam events, abrades and gouges the bank, leading to bank erosion.
These hydraulic characteristics will help determine types and methods of erosion protection that will be most effective at the project site. Most bank erosion protection techniques may be classified as either a resistive method or a redirective method. Resistive methods, such as riprap or sheetpile, are designed to protect against shear stress, and are generally used in a continuous application. Redirective techniques, usually discontinuous, are techniques that redirect the flow and energy of the river or stream away from the area of the eroding bank (McCullah, 2004). Examples of redirective techniques include rock vanes and bendway weirs. Such in-stream structures pose a threat to both large and small boats from boat hull strikes, and therefore were not considered suitable for use in this segment of the Pitmiktakik River. The alternatives discussed below address those conditions using various approaches and techniques. Channel shape and estimated velocities are important characteristics when designing bank protection. Results from the HEC-RAS analysis are found in Appendix 2, including velocity distribution across the cross-section. Note that the flow distribution results should be used cautiously, as they are based on a one-dimensional model. A true velocity and flow distribution varies vertically as well as horizontally (USACE, 2010).
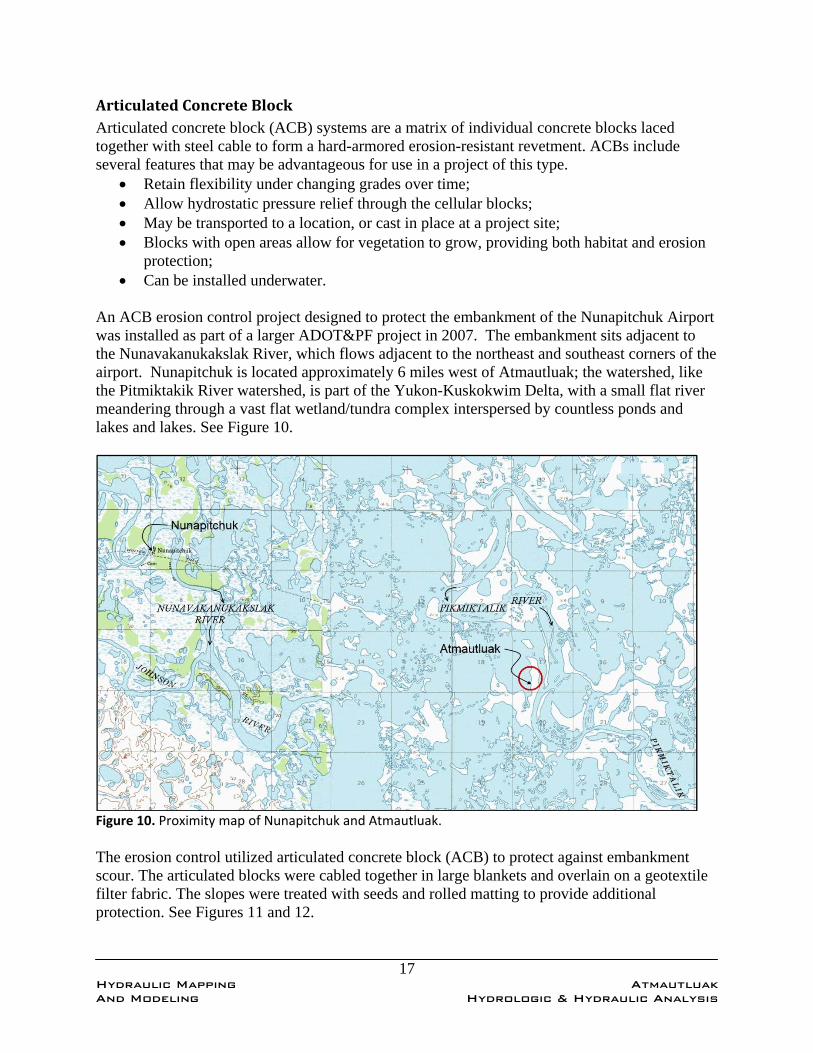
17 Hydraulic Mapping Atmautluak And Modeling Hydrologic & Hydraulic Analysis
ArticulatedConcreteBlockArticulated concrete block (ACB) systems are a matrix of individual concrete blocks laced together with steel cable to form a hard-armored erosion-resistant revetment. ACBs include several features that may be advantageous for use in a project of this type.
Retain flexibility under changing grades over time; Allow hydrostatic pressure relief through the cellular blocks; May be transported to a location, or cast in place at a project site; Blocks with open areas allow for vegetation to grow, providing both habitat and erosion
protection; Can be installed underwater.
An ACB erosion control project designed to protect the embankment of the Nunapitchuk Airport was installed as part of a larger ADOT&PF project in 2007. The embankment sits adjacent to the Nunavakanukakslak River, which flows adjacent to the northeast and southeast corners of the airport. Nunapitchuk is located approximately 6 miles west of Atmautluak; the watershed, like the Pitmiktakik River watershed, is part of the Yukon-Kuskokwim Delta, with a small flat river meandering through a vast flat wetland/tundra complex interspersed by countless ponds and lakes and lakes. See Figure 10.
Figure 10. Proximity map of Nunapitchuk and Atmautluak.
The erosion control utilized articulated concrete block (ACB) to protect against embankment scour. The articulated blocks were cabled together in large blankets and overlain on a geotextile filter fabric. The slopes were treated with seeds and rolled matting to provide additional protection. See Figures 11 and 12.

18 Hydraulic Mapping Atmautluak And Modeling Hydrologic & Hydraulic Analysis
Figure 11. ACB at Nunapitchuk Airport embankment along Nunavakanukakslak River.
Figure 12. ACB installation at Nunapitchuk Airport embankment.
This project was inspected in 2011 in order to assess how well it has performed since installation. Some block slumping at the submerged toe of the blanket is apparent in a few areas, where the ACBs were not keyed in properly. The elevation of the blanket does not appear to be
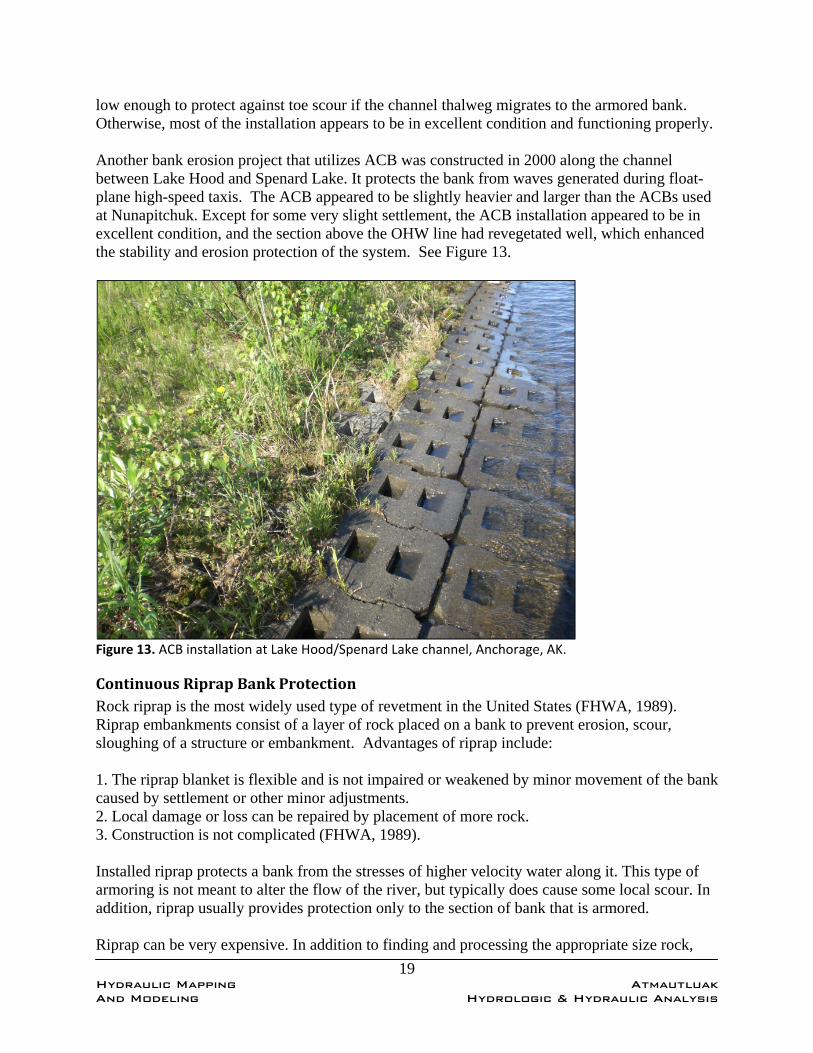
19 Hydraulic Mapping Atmautluak And Modeling Hydrologic & Hydraulic Analysis
low enough to protect against toe scour if the channel thalweg migrates to the armored bank. Otherwise, most of the installation appears to be in excellent condition and functioning properly. Another bank erosion project that utilizes ACB was constructed in 2000 along the channel between Lake Hood and Spenard Lake. It protects the bank from waves generated during float-plane high-speed taxis. The ACB appeared to be slightly heavier and larger than the ACBs used at Nunapitchuk. Except for some very slight settlement, the ACB installation appeared to be in excellent condition, and the section above the OHW line had revegetated well, which enhanced the stability and erosion protection of the system. See Figure 13.
Figure 13. ACB installation at Lake Hood/Spenard Lake channel, Anchorage, AK.
ContinuousRiprapBankProtectionRock riprap is the most widely used type of revetment in the United States (FHWA, 1989). Riprap embankments consist of a layer of rock placed on a bank to prevent erosion, scour, sloughing of a structure or embankment. Advantages of riprap include: 1. The riprap blanket is flexible and is not impaired or weakened by minor movement of the bank caused by settlement or other minor adjustments. 2. Local damage or loss can be repaired by placement of more rock. 3. Construction is not complicated (FHWA, 1989). Installed riprap protects a bank from the stresses of higher velocity water along it. This type of armoring is not meant to alter the flow of the river, but typically does cause some local scour. In addition, riprap usually provides protection only to the section of bank that is armored. Riprap can be very expensive. In addition to finding and processing the appropriate size rock,

20 Hydraulic Mapping Atmautluak And Modeling Hydrologic & Hydraulic Analysis
freight/haul costs can significantly affect the cost of these revetments. Riprap design is well-established, and several guidelines are available. Design requirements include:
design flood discharge and elevation, velocity, bed material gradation, scour depth excavation, cross-section geometry.
Following the design and selection of rock size, construction of the revetment would most likely occur from the river side of the bank. A road would have to be built at the base of the riprap toe along the length of the project; active river channels would have to be diverted out into the center of the braid plain. Bank preparation would require clearing all trees and debris, and grading the bank surface to the desired slope, generally between 1.5-2:1 (H:V). Where the bank has steepened due to previous erosion, additional bank material would have to be placed first. A filter is required between the bank material and the riprap layer to prevent migration of the fine soil particles out through the voids, and to allow relief of hydrostatic pressure on the bank side. Filter layers consist of either gravel and small stone or geotextile fabric. Though shear stresses are low, riprap would likely have to be oversized to resist ice plucking forces on the upper bank.
BioengineeringBioengineering techniques generally involve using a combination of materials to armor and protect stream banks, including vegetation (willow), root wads, toe rock, coconut fiber bio-logs (coir logs), and coir blankets. The subarctic and arctic climates in Alaska present special design challenges for bioengineered erosion control methods. The revegetation of barren and disturbed areas in colder climates, often a critical element of bioengineered bank protection, is very slow compared with similar situations in warmer climates. Contributing to slow re-establishment of natural conditions are such factors as: short cool growing seasons, permafrost, aufeis deposits, lack of annual plant species, and the resulting dependency on asexual vegetation reproduction. As a result, structures are often designed improperly and may fail prematurely, or not function properly from the start. Another challenge to the successful implementation of bioengineered bank protection methods is the need to understand the many complex processes associated with river behavior. Many of the structures that have been installed throughout the U.S. and Alaska in the past twenty years have essentially changed the dimension, pattern, and the profile of the host river. Designers may not focus on understanding the morphological variables that determine the river’s natural stability, and may attempt to apply standardized techniques to a wide variety of conditions. Other common problems include a design that has been developed only for a particular reach, ignoring upstream and downstream considerations. In 2003, an analysis of bioengineered erosion control structures was conducted at 11 sites around

21 Hydraulic Mapping Atmautluak And Modeling Hydrologic & Hydraulic Analysis
the State of Alaska (Karle, 2003). Part of that analysis documented any observed damage to these structures from winter ice. Such damage was documented at several sites. In several short sections of the Anchor River-Silverking site (willow brushlayering with coir logs and spruce tree revetment), ice damage was noted on the soil lifts. Ice damage was also noted on longer sections of the Chena River-Doyon site (willow brushlayering with soil lifts and toe rock). Damage from flowing ice left a distinctive mark; the fabric had been ripped out and pulled downstream, where it was found in a compacted bundle. A failed outer wrap was noted in numerous locations at the Chena River-Doyon site. The failed outer wrap, combined with a deteriorated inner wrap, led to the spillage of bank material used in the soil lifts, and subsequent failure of those lifts. Damage at the Chena River site may also be related to floating ice which attaches to the bank during the winter. Ice covers tend to follow the water level. As the winter progresses and discharge drops, the bank ice falls into the channel, and exerts a shear force on the bank material. Nearby residents reported that annual bank erosion results from bank ice action each spring. Additional problems may occur at sites with fixed structures which extend into the channel, such as root wads. River ice may attach to such structures; a buoyant force is then exerted on the structure if the water level rises. Table 6. Summary table of three design methods for bank erosion protection. Method Riprap ACB Bioengineered Other Advantage Well‐established design
and installation guidelines. Flexible installation is self‐healing in the event of toe erosion.
Blocks can be transported or cast onsite. Can be vegetated to add stability and habitat features. Hard protection against ice forces.
Use local materials. Suitable for channels with low average velocities and low shear stress. Easier approval from permitting agencies. Can be repaired relatively easily.
Technical Challenge
Rocks must be heavy enough to resist ice plucking. Large heavy rock may sink through silt/melting permafrost channel banks. Rock must be imported.
Upper and lower borders must be securely anchored in silt bank to prevent block overturning. Concrete cast‐in‐place would require strict quality control measures to ensure conformance with required concrete specifications.
Slow establishment of vegetation creates failure risk for several years after installation. Can be damaged by ice forces.
Cost Range High High Low‐Medium

22 Hydraulic Mapping Atmautluak And Modeling Hydrologic & Hydraulic Analysis
Summary The Pitmiktakik River is a tidally-influenced meandering stream that originates about 60 miles northeast of Atmautluak in a flat tundra and lakes complex area. Atmautluak is located on an actively eroding bend of the river. The area around Atmautluak is flat and poorly drained with numerous lakes and small drainages that flow into the Pitmiktakik River (ADCED, 2015). USGS regression equations were used to develop a flood frequency analysis for the Pitmiktakik River at Atmautluak. However, due to watershed characteristics that are outside of the range of those used to develop the regression equations, the actual flood magnitudes may be closer to the lower end of the calculated 90% prediction interval. The bank of the Pitmiktakik River is eroding along the entire length of the community at Atmautluak. The average erosion rate is estimated at 1.3 feet per year. Possible reasons for the ongoing bank erosion include: shear stress, pore-water pressure, thermal degradation, river ice, and boat wash. An analysis was conducted to determine the hydraulic characteristics of the Pitmiktakik River channel at various flow levels. Cross-sections on the Pitmiktakik River channel were surveyed in August 2015 and used to create a numerical model of the channel. The model was used to predict water velocities and channel widths at bankfull discharge, and to simulate conditions with an ice cover and ice jam. Results indicate that average velocities in the Pitmiktakik River channel are low, even during high flows. Average velocities are also low during ice jam events, though local velocities may temporarily increase at constrictions or during the ice jam breakup. The USDA Bank Stability and Toe Erosion Model (BSTEM) was utilized to estimate erosion of the bank and bank toe by hydraulic shear stress. Results show that estimated bank erosion rates attributable to shear stress are low, about 1.3 feet per year, even though banks consist of fine-grained, easily erodible soils. The hydraulic analysis indicates that the two primary causes of bank erosion along the Pitmiktakik River are likely pore-water pressure in combination with ice forces during breakup and ice jam events. Pore-water pressure, which increases and decreases with rapidly changing water levels, contributes to streambank erosion. Twice daily tidal cycles on the Pitmiktakik River result in rapidly changing pore-water pressure in the upper banks. The freeze/thaw cycle and formation of ice along the riverbanks results in bank sediment being dislodged and moved downslope via gravity. Additionally, ice thrust, ice retreat and ice movement, which all occur during breakup and ice jam events, abrades and gouges the bank, leading to bank erosion. Based on the results of the hydraulic analysis, alternatives for bank erosion protection were analyzed. Articulated concrete block systems, riprap, and bio-engineered revetments all present advantages and disadvantages for the Atmautluak location.

23 Hydraulic Mapping Atmautluak And Modeling Hydrologic & Hydraulic Analysis
References Alaska Department of Commerce, Community, and Economic Development (ADCED). 2009. Alaska Community Information Database Community Information Summaries. Accessed at http://commerce.state.ak.us/dnn/Portals/4/pub/Atmautluak_Final%20Report.pdf. Curran, J. H., D. F. Meyer, and G.D. Tasker. 2003. Estimating the magnitude and frequency of peak streamflows for ungaged sites on streams in Alaska and conterminous basins in Canada. U.S. Geological Survey, Water-resources investigations report 03-4188. Anchorage, AK. DOWL. 2015. Atmautluak engineering analysis, Atmautluak, Alaska. Surveying and mapping report. Prepared by DOWL, Anchorage, AK. DOWL HKM Project Number 1127.62038.01. Gatto, L.W. 1993. Riverbank conditions and erosion in winter. Proceedings of the workshop on environmental aspects of river ice. T.D. Prowse, editor, National Hydrology Research Institute, Saskatoon, Saskatchewan, NHRI Symposium Series No. 12, p. 43-56. Karle, K.F. N. Moore, and W.W. Emmett. 2003. Evaluation of bioengineered stream bank stabilization in Alaska. FHWA-AK-RD-0303. Prepared for Alaska Department of Transportation. Lagasse, P.F., M. Ghosn, P.A. Johnson, L.W. Zevenbergen, and P.E. Clopper. Reference guide for applying risk and reliability-based approaches for bridge scour prediction. NCHRP Report 761, Transportation Research Board, Washington, D.C. Leopold, L.B., M. G. Wolman, and J.P. Miller. 1964. Fluvial processes in geomorphology. Dover Publications, Inc. New York, NY. Rowland, J. C., C. E. Jones, G. Altmann, R. Bryan, B. T. Crosby, G. L. Geernaert, L.D. Hinzman, D. L. Kane, D. M. Lawrence, A. Mancino, P. Marsh, J. P. Mcnamara, V.E. Romanovsky, H. Toniolo, B. J. Travis, E. Trochim, and C. J. Wilson. 2010. Arctic landscapes in transition: responses to thawing permafrost. Eos, Transactions, AGU, 91, 229-236. Simon, A, and A. Collinson. 2001. Pore-water pressure effects on the detachment of cohesive streambeds: seepage forces and matric suction. Earth Surf. Process. Landforms. 26, 1421-1442. John Wiley & Sons, Ltd. Stein, E.D., M.R. Cover, A.E. Fetscher, C.O’Reilly, R. Guardado, and C.W. Solek. 2013. Reach-scale geomorphic and biological effects of localized streambank armoring. JAWR, Vol. 49, Issue 4 pp. 780-792. US Army Corps of Engineers (USACE). 2007. Erosion information paper - Atmautluak, Alaska. August 27, 2007. Alaska District Corps of Engineers Civil Works Branch. US Army Corps of Engineers (USACE). 2010. HEC-RAS River analysis system. Hydraulic reference manual, version 4.1, January 2010. CPD-69.

24 Hydraulic Mapping Atmautluak And Modeling Hydrologic & Hydraulic Analysis
US Department of Agriculture (USDA). 2007. Technical Supplement 14B, Scour calculations. National Engineering Handbook. Natural Resources Conservation Service. US Geological Survey (USGS). 2015. Watershed boundary dataset. Accessed at http://nhd.usgs.gov/wbd.html. Western Regional Climate Center (WRCC). 2012. Bethel WSO Airport, Alaska (500754), 1981-2010 monthly climate summary. http://www.wrcc.dri.edu/cgi-bin/cliMAIN.pl?ak0754. WHPacific. 2010. Atmautluak hazard impact assessment June 2010. Prepared for the Atmautluak Traditional Council. Prepared by WHPacific with Shannon and Wilson Inc. Zeller, M.E. 1981. Scour depth formula for estimation of toe protection against general scour. Pima County Department of Transportation and Flood Control District, Tucson, AZ.

25 Hydraulic Mapping Atmautluak And Modeling Hydrologic & Hydraulic Analysis
Appendix 1-Surveyed Cross-sections and Results from HEC-RAS All cross-section views are downstream.
0 200 400 600 800 1000 1200-10
-5
0
5
10
15
RS = 00 Pitmiktakik River at Atmautluak
Station (ft)
Ele
vatio
n (
ft)
Legend
WS 1424 cfs
Ground
Bank Sta
0 200 400 600 800 1000 1200-6
-4
-2
0
2
4
6
8
10
12
RS = 6738 Pitmiktakik River at Atmautluak
Station (ft)
Ele
vatio
n (
ft)
Legend
WS 1424 cfs
Ground
Bank Sta

26 Hydraulic Mapping Atmautluak And Modeling Hydrologic & Hydraulic Analysis
0 200 400 600 800 1000-6
-4
-2
0
2
4
6
8
10
12
14
RS = 10806 Pitmiktakik River at Atmautluak
Station (ft)
Ele
vatio
n (
ft)
Legend
WS 1424 cfs
Ground
Ineff
Bank Sta
0 200 400 600 800 1000 1200 1400 1600 1800-4
-2
0
2
4
6
8
10
12
RS = 15332 Pitmiktakik River at Atmautluak
Station (ft)
Ele
vatio
n (
ft)
Legend
WS 1424 cfs
Ground
Ineff
Bank Sta

27 Hydraulic Mapping Atmautluak And Modeling Hydrologic & Hydraulic Analysis
0 200 400 600 800 1000-4
-2
0
2
4
6
8
10
12
RS = 16435 Pitmiktakik River at Atmautluak
Station (ft)
Ele
vatio
n (
ft)
Legend
WS 1424 cfs
Ground
Ineff
Bank Sta
0 500 1000 1500 2000-5
0
5
10
15
RS = 17890 Pitmiktakik River at Atmautluak
Station (ft)
Ele
vatio
n (
ft)
Legend
WS 1424 cfs
Ground
Ineff
Bank Sta

28 Hydraulic Mapping Atmautluak And Modeling Hydrologic & Hydraulic Analysis
0 500 1000 1500 2000 2500-5
0
5
10
15
RS = 19296 Pitmiktakik River at Atmautluak
Station (ft)
Ele
vatio
n (
ft)
Legend
WS 1424 cfs
Ground
Ineff
Bank Sta
0 200 400 600 800 1000 1200-10
-5
0
5
10
15
RS = 22659 Pitmiktakik River at Atmautluak
Station (ft)
Ele
vatio
n (
ft)
Legend
WS 1424 cfs
Ground
Ineff
Bank Sta

29 Hydraulic Mapping Atmautluak And Modeling Hydrologic & Hydraulic Analysis
0 200 400 600 800 1000 1200-10
-5
0
5
10
15
RS = 25374 Pitmiktakik River at Atmautluak
Station (ft)
Ele
vatio
n (
ft)
Legend
WS 1424 cfs
Ground
Bank Sta

30 Hydraulic Mapping Atmautluak And Modeling Hydrologic & Hydraulic Analysis
Appendix 2- Results from HEC-RAS Open Water Analysis River Sta
Q Total
Min Ch El
W.S. Elev
Crit W.S.
E.G. Elev
E.G. Slope
Vel Chnl
Flow Area
Top Width
Froude # Chl
(cfs) (ft) (ft) (ft) (ft) (ft/ft) (ft/s) (sq ft) (ft)
0 1424 ‐6.51 6.57 ‐2.19 6.57 0.00002 0.71 2071.01 368.28 0.05 2100 ‐6.51 8.41 ‐1.65 8.42 0.00002 0.83 2871.15 491.52 0.05
6738 1424 ‐5.37 6.71 6.72 0.000023 0.83 1793.83 271.81 0.05 2100 ‐5.37 8.56 8.58 0.000025 0.99 2331.4 326.75 0.06
10806 1424 ‐4.28 6.8 ‐1.39 6.8 0.000018 0.74 2196.15 381 0.04 2100 ‐4.28 8.65 ‐0.83 8.67 0.000019 0.87 2977.9 701.05 0.05
15332 1424 ‐2.98 6.89 ‐0.55 6.9 0.000027 0.87 1807.62 506.08 0.05 2100 ‐2.98 8.76 ‐0.03 8.77 0.000028 1.02 2784.36 1619.4 0.06
16435 1424 ‐3.55 6.92 ‐1.39 6.93 0.000021 0.79 2109.9 412 0.05 2100 ‐3.55 8.79 ‐0.89 8.8 0.000022 0.92 3145.92 826.37 0.05
17890 1424 ‐4.66 6.95 ‐1.8 6.96 0.00002 0.69 2147.42 562.66 0.05 2100 ‐4.66 8.82 ‐1.25 8.83 0.000019 0.79 2963.74 1016.25 0.05
19296 1424 ‐4.66 6.97 ‐1.85 6.98 0.000008 0.48 3031.3 765.6 0.03 2100 ‐4.66 8.84 ‐1.46 8.85 0.000009 0.57 3887.3 1983.03 0.03
22659 1424 ‐8.73 7.01 ‐4.98 7.02 0.00002 0.8 1922.11 335.38 0.05 2100 ‐8.73 8.88 ‐4.25 8.89 0.000022 0.96 2508.99 900.03 0.05
25374 1424 ‐5.28 7.06 ‐2.26 7.07 0.000019 0.79 2052.26 343.22 0.05 2100 ‐5.28 8.94 ‐1.73 8.95 0.000021 0.94 2889.15 1108.09 0.05

Appendix B: Community Meeting Notes

This page intentionally left blank.

A 700 G Street, Suite 500 Anchorage, AK 99501 907‐562‐3366
Atmautluak Community Meeting Notes, April 25th
AECOM: Peter Crews, Civil Engineer
Traditional Council: President: Melvin Egoak, Nicholai Evan, Nicholai Pavilla Sr
Meeting: Melvin Egoak introduced Peter Crews. Peter Crews explained the study and Melvin translated
from English. Peter reviewed the erosion options: Sheet Pile Walls; Articulating Concrete Block matting;
Confined Cellular Systems (Geo Cells). Peter also explained the proposed Community Drainage Plan.
Melvin Translated from English.
Specific Comments from the Community:
Council was not in favor of the sheetpile wall. There were concerns that the vertical face of the
wall would be a safety hazard with snow machines in the winter.
Council was not in favor the CSS option. When the water is high in the spring the ice could rip
out the mesh. The CSS might be OK for erosion protection on the two lake sections identified
(on the west side of the community.
Council was in favor of the Articulating Concrete Block matting as the option for erosion
protection along the river, from the south end of the community north to the airport.
Council was OK with the swale option. Council suggested using the spoils to build up the road.
There was discussion of the community requesting the Lower Kuskokwim School District to close
the old sewage lagoon. Spoils could be stockpiled or be used to cap the old sewage lagoon
(note‐ this would need to be done in conjunction with a sewage lagoon closure project).
The council decided the fence around Pig Lake should not be installed, a fence would block
winter travel routes.
Two winter crossings should be added to the swale design so that vehicle traffic in the winter
can cross the swales. AECOM suggested shallower swale slopes at two locations. One would be
located just north of Pig Lake and the second about 500 feet north of Pig Lake near where there
is a public right of way corridor between the river and the gravel road.

This page intentionally left blank.

A 700 G Street, Suite 500 Anchorage, AK 99501 907‐562‐3366
Trip Notes Atmautluak Jan‐6‐2016
AECOM (Peter Crews) met with Atmautluak Traditional Council to discuss scope of study.
Council Members Present: Melvin Egoak (Vice President), Nicholai Evan, Nicholai Pavilla Sr, Daniel
Waska (Administrator)
Council: We want to provide drainage for pig lake. The lake used to drain to the lake to the north and
the level of the lake was lower. Now during spring and fall the lake can overflow. The whole area is
wet. It used to not be as wet. Water comes down the swale to the west (near the church) and goes into
the lake. When the road from the airport was built the drainage was cut off. The ditch can terminate
just north of the boardwalk (northernmost east‐west boardwalk). Suggest a spur to the west near the
south end of the road.
AECOM: We can provide a ditch to the north. The ditch would be a v ditch, covered with top soil and
seeded. The soil would be scraped to the side before the ditch is excavated, the ditch would be re‐
covered with soil and seeded, to try to restore the tundra mat. There is a possibility the permafrost
could thaw or create unlevel drainage slope, it might have to be re‐graded at some point if it begins to
pond. The slope will be very flat so the bottom will always be a little wet.
Council: We don’t want a pipe, they clog. Consider a half pipe. The vegetation grows out and clogs the
ditch.
AECOM: The ditch could have flat slopes. A half pipe could absorb heat in the summer and cause the
underlying permafrost to thaw, unless insulation boards are placed under.
Council: The flat slope ditch is OK.
Council: Bank erosion is a problem along river and also at the lake (west side of town). Need seawall or
something to stop erosion and save the good land.
AECOM: We propose articulating concrete blocks. These were installed in Nunapitchuk.
Council: They have sunk out of sight. They are too heavy and have sunk into the soil.
AECOM: There are similar plastic matting that could work, we are concerned with the ice damaging the
mats.
Council: The ice does not move fast. Speed depends on the tide. It does not move like it does on the
Kuskokwim.

A 700 G Street, Suite 500 Anchorage, AK 99501 907‐562‐3366 AECOM: We can consider a wall but walls are expensive.
Council: Sloping protection instead of wall preferred but it needs to work and last 40‐50 years. If wall is
built it needs gaps for boats to park, ramps in the gaps.
Council: We would like to have a public meeting. Would like AECOM to come out (maybe February) to
show alternatives.
AECOM: We can show a wall alternative and sloping protection alternative with costs.
AECOM: Any flooding in the last 45 years where the water went over the bank?
Council: During spring snow melt or in fall when it rains a lot the river will slightly overtop the low
elevation banks and be just under the top of the higher elevation banks. There has been no flooding
beyond the banks. 200 years ago there was a large flood that covered the whole region.
AECOM: How high are the tides?
Council: 2 feet
AECOM: how thick does the ice get?
Council: 3 feet maybe up to 4 feet.

August 26, 2015 Atmauthluak Traditional Council
P.O. Box 6568 Atmauthluak, Alaska 99559
(907) 553-5613
2:35 p.m.
AECOM Brian Giese Donne Fleagle, Rural Community Engagement Specialist TRADITIONAL COUNCIL STAFF Moses Pavilla Jr., Compliance Officer (Cell) 553-2146 TRADITIONAL COUNCIL Vice President: Melvin Egoak Treasurer: Nelson Nicholai Council Member: Nicholai Evan Council Member: Nicholai Pavilla Sr. ATMAUTHLUAK LIMITED P.O. Box 6548 Atmauthluak, Alaska 99559 LAND DEPARTMENT Sydney Nicholas Laure Nicholai Kim Daniel Brian Giese: Introduction of the Project and scope of work. Melvin Egoak, Vice President: Our main concern is erosion near the Clinic. There was land that has been covered by water that used to be there before the subdivision was built. When a SW or W wind blows it causes waves that erode the edges of the pond. There is a building about 3500’ from the pond and it is very important. We might lose it. There is an inner lake that fills with water when it rains or when the water rises in the fall time or during spring snowmelt. In 1969 the whole village moved. In 1970 we settled along the river. In the 1980’s new houses were built around this main concern. The inner lake used to have a little channel that drained into the far right lake (on the map) but when the road was build it covered and blocked the channel. The high ground began to erode so we had to move the parsonage because the water could not drain. Before we had the gravel road, that ground was high ground. Inner lake is filling with more water and when its too full it spreads all over. We tried to drain it but its not working. I want the drainage addressed, a channel or something, to save the land. The

2 lakes are now 1. When the airport was built there was a man made lake constructed. When the tide comes in (showed us on the map) it causes this. We are afraid of our lagoon now. Starting to drain, wets the tundra and lifts it up and floats the tundra while water flows underneath and on top of the clay level which sits on permafrost. So we have 2 concerns. The inner lake needs drainage and the lagoon is sickness. Our 3rd concern is the River Erosion at the end of the village to almost to the aport. Suggest a seawall in front of our village to save our good land. BRIAN: When the hydrologist arrives he will be doing an ice jam study and cross sectional study of the river. Of course with snow melt the river rises but there aren’t ice jams. The water in the river has varying heights with the tide from the Kuskokwim River. Our 4th concern is sickness in the state man made lake that the school used for their waste. There is contamination and it needs to be purified and dumped into the inner lake. Wish we could permanently get rid of it before it hurts our children. Our hope is to get help.

Appendix C: Trip Report, Inspection of Nunapitchuk Articulating Concrete Block

This page intentionally left blank.

A 700 G Street, Suite 500 Anchorage, AK 99501 907‐562‐3366
Trip Report Nunapitchuk Runway April 26th
Present: Peter Crews, Civil Engineer
Background: Articulating Concrete Block (ACB) matting is proposed at Atmautluak as an alternative to
address the eroding river bank in the community, as part of the Atmautluak Hydrological
Study/Community Drainage Plan. Residents of Atmautluak expressed concern that ACB blocks installed
in this area might be too heavy and sink into the tundra. The purpose of the trip was to document
condition of ACB matting installed at the nearby Nunapichuk airport in 2007, and verify that no
significant settlement has taken place over the course of 9 years. Nunapichuk is located 6 miles west of
Atmautluak. 2011 photos were provided by Ken Karle of Hydraulic Mapping and Modeling from a site
visit in 2011.
Findings: There was no noticeable settlement of the embankment slopes where ACB was installed. The
side slopes appeared uniform from the top of the embankments to the toe at all areas inspected.
Southeast Corner Runway Looking West 2016 Southeast Corner Runway Looking West 2011

A 700 G Street, Suite 500 Anchorage, AK 99501 907‐562‐3366
Southeast Corner Runway Looking South 2016 Southeast Corner Runway Looking South 2011
Southeast Corner Runway Looking East 2016 Southeast Corner Runway Looking East 2011

A 700 G Street, Suite 500 Anchorage, AK 99501 907‐562‐3366
Northeast Corner Runway Looking South 2016 Northeast Corner Runway Looking South 2011
2016 Photo: Note Thick Vegetated Mat on Top of Blocks, Typical

This page intentionally left blank.

Appendix D: Drainage Swale Profiles and Cross Sections

This page intentionally left blank.

60
44
03
68
ATMAUTLUAK
ATMAUTLUAK, AK
700 G STREET, SUITE 500
ANCHORAGE, AK 99501
TEL: (907) 279-0543
FAX: (907) 276-7679
G:\PROJECTS\60440368 ATMAUTLUAK HYDROLOGICAL STUDY\401 WORKING DRAWINGS\ATMAUTLUAK DRAINAGE CONCEPT _DITCH5.17.DWG; Revised 5/18/2016 10:56:27 AM
05
/1
8/2
01
6
D
RA
IN
AG
E D
1 P
RO
FIL
E
D
RA
IN
AG
E D
1 P
LA
N
NO
TE
: A
DIGI
TAL
TERR
AIN
MO
DEL
SURF
ACE
FOR
THIS
DRA
WIN
G W
ASBU
ILT
BASE
D O
N D
OW
L 20
15 S
URV
EY P
OIN
TS A
ND
SURF
ACE
DATA
PRO
VIDE
D TO
BY
AERO
MET
RIC
IN 2
007
FOR
THE
ATM
AUTL
UAK
COM
MU
NIT
Y M
AP. T
HE D
OW
L SU
RVEY
PO
INTS
WER
E AD
JUST
ED B
Y-8
.03
FEET
TO
MAT
CH T
HE C
OM
MU
NIT
Y M
AP S
URF
ACE.

This page intentionally left blank.

60
44
03
68
ATMAUTLUAK
ATMAUTLUAK, AK
700 G STREET, SUITE 500
ANCHORAGE, AK 99501
TEL: (907) 279-0543
FAX: (907) 276-7679
G:\PROJECTS\60440368 ATMAUTLUAK HYDROLOGICAL STUDY\401 WORKING DRAWINGS\ATMAUTLUAK DRAINAGE CONCEPT _DITCH5.17.DWG; Revised 5/18/2016 10:56:27 AM
05
/1
8/2
01
6
D
RA
IN
AG
E D
2 P
RO
FIL
E
D
RA
IN
AG
E D
2 P
LA
N
NO
TE
: A
DIGI
TAL
TERR
AIN
MO
DEL
SURF
ACE
FOR
THIS
DRA
WIN
G W
ASBU
ILT
BASE
D O
N D
OW
L 20
15 S
URV
EY P
OIN
TS A
ND
SURF
ACE
DATA
PRO
VIDE
D TO
BY
AERO
MET
RIC
IN 2
007
FOR
THE
ATM
AUTL
UAK
COM
MU
NIT
Y M
AP. T
HE D
OW
L SU
RVEY
PO
INTS
WER
E AD
JUST
ED B
Y-8
.03
FEET
TO
MAT
CH T
HE C
OM
MU
NIT
Y M
AP S
URF
ACE.

This page intentionally left blank.
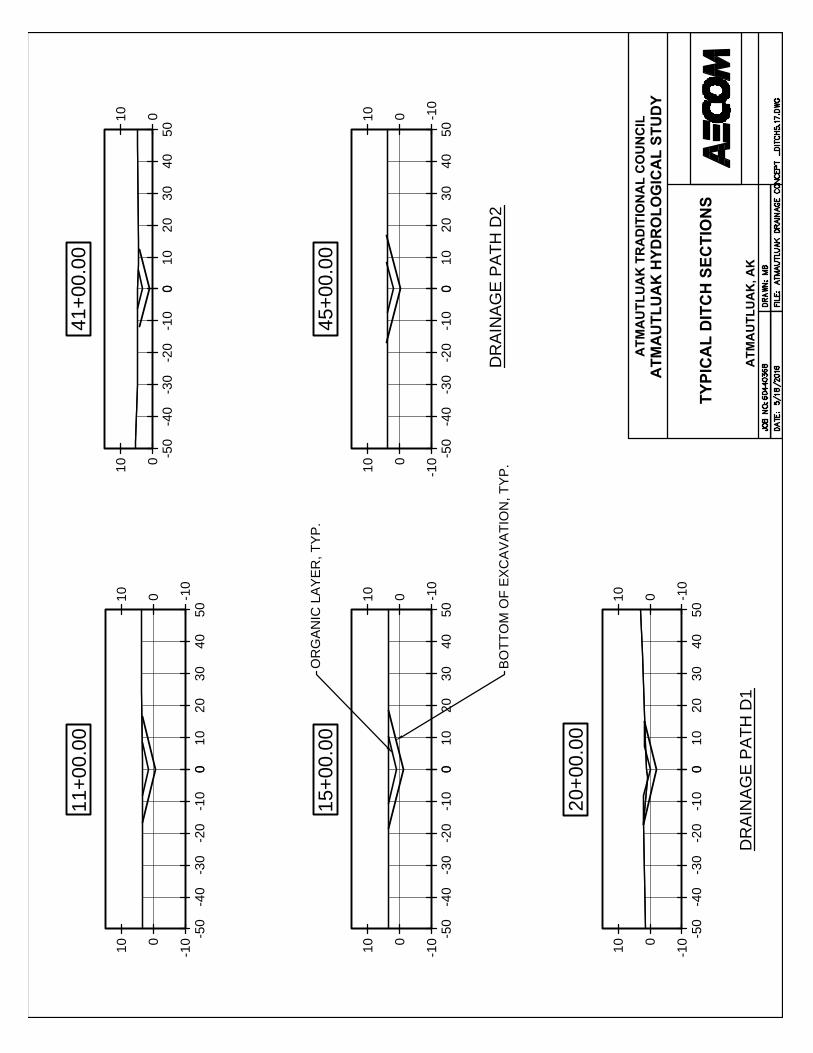
11+
00
.0
0
-100
10
-10
0
10
010
20
30
40
50
0-10
-20
-30
-40
-50
15+
00
.0
0
-100
10
-10
0
10
010
20
30
40
50
0-10
-20
-30
-40
-50
20+
00.00
-100
10
-10
0
10
010
20
30
40
50
0-10
-20
-30
-40
-50
45+
00.0
0
-100
10
-10
0
10
010
20
30
40
50
0-10
-20
-30
-40
-50
41+
00.0
0
0
10
0
10
010
20
30
40
50
0-10
-20
-30
-40
-50
DR
AIN
AG
E P
AT
H D
2
TY
PIC
AL
D
IT
CH
S
EC
TIO
NS
AT
MA
UT
LU
AK
, A
K
AT
MA
UT
LU
AK
H
YD
RO
LO
GIC
AL
S
TU
DY
AT
MA
UT
LU
AK
T
RA
DIT
IO
NA
L C
OU
NC
IL
DR
AIN
AG
E P
AT
H D
1
OR
GA
NIC
LA
YE
R, T
YP
.
BO
TT
OM
O
F E
XC
AV
AT
IO
N, T
YP
.

This page intentionally left blank.

Appendix E: Permitting Requirements

This page intentionally left blank.

Atmautluak Hydrology Study
Permitting Research April 2016
Project Scope
The purpose of the Atmautluak Hydrology Study is to determine the recurrence intervals of floods and provide a hydrological basis for the evaluation of alternatives to reduce bank erosion along the Pitmiktalik River. The purpose of the Community Drainage Plan is to identify alternatives that could drain excess surface waters to nearby lakes and rivers in order to restore natural drainage, reduce flooding of properties in spring and fall, and reduce heat transfer to underlying tundra from standing water, which could potentially decrease permafrost degradation. The scope includes a task to determine whether or not this activity would be allowed under current wetland provisions of local, state and federal law and what would actions would be required to mitigate environmental and regulatory considerations.
Natural Resources
AECOM researched publically available information on agency websites to summarize the natural resources in the vicinity of the project area. This information can be used to guide project design and evaluate potential impacts associate with project construction. A summary of AECOM’s research is provided below.
AECOM consulted the U.S. Fish and Wildlife Service’s (USFWS) IPaC online system1 for a preliminary assessment of natural resources potentially impacted by the proposed project. This web application is designed to assist private citizens and public employees who need information to assist in determining how their activities may impact sensitive natural resources managed by the USFWS. Based on the IPaC Trust Resources Report generated for the project location, there are no Threatened and Endangered (T&E) species or Critical Habitat concerns. However, there are multiple species of migratory birds that could potentially be affected by activities in this area. An official species list can be obtained from the USFWS during project permitting.
AECOM reviewed USFWS National Wetlands Inventory (NWI) mapping2 to verify the presence of wetlands in the project area. Unfortunately, there is no NWI mapping for area. It does appear however, based on aerial photography review, that wetlands are present in the project
1 USFWS IPaC: http://ecos.fws.gov/ipac/ 2 USFWS NWI Mapping: http://www.fws.gov/wetlands/Data/Mapper.html

area. An onsite delineation of wetlands may help expedite project permitting (see further discussion under the permitting section).
The Alaska Department of Fish and Game (AD&G) Fish Resource Monitor3 was viewed to identify anadromous water bodies in the vicinity of the project. According to these maps, there are two anadromous water bodies in the vicinity of the project area: Nunavakanukakslak Lake (AWC Code: 335-10-16600-2197-0040) and Pikmiktalik River (AWC Code: 335-10-16600-2197-3115).
The Office of History and Archaeology maintains a data repository called the Alaska Heritage Resources Survey (AHRS) with information on reported cultural resources in Alaska4. AECOM was granted permission to use the AHRS Mapper to identify the presence or absence of reported cultural resource sites in the vicinity of projects for baseline research. According to the AHRS Mapper, there are no reported sites within the Atmautluak project vicinity. However, the absence of reported cultural sites may simply mean that no surveys have been conducted in the project location (see further discussion under the permitting section).
The National Marine Fisheries Service provides an Essential Fish Habitat (EFH) Mapper5 as an online tool for the public to identify habitats specified as necessary to fish for spawning, breeding, feeding or growth to maturity. According to the EFH mapper, there are no Habitat Areas of Particular Concern but the Pitmiktalik River was identified as EFH for all five salmon species for Pitmiktalik River.
Permitting
The following permits / agency consultation would likely be required for construction of a drainage project in Atmautluak and a bank erosion project along the Pitmiktalik River. Permitting of chosen alternatives would occur after the final designs are in advanced stages and prior to construction. Other permits in addition to the ones listed below could be required once the scope of the project is fully defined.
U.S. Army Corps of Engineers Department of the Army Permit and National Environmental Policy Act
Consultation for T&E species and Critical Habitat National Marine Fisheries Service EFH Assessment State Water Quality Certification Alaska Pollutant Discharge Elimination System Construction General Permit Alaska Department of Fish and Game Fish Habitat Permit
3 ADFG Fish Resource Monitor: http://extra.sf.adfg.state.ak.us/FishResourceMonitor/?mode=culv 4 AHRS Mapper: https://dnr.alaska.gov/parks/oha/ahrs/ahrs.htm 5 http://www.habitat.noaa.gov/protection/efh/efhmapper/index.html

U.S Army Corps of Engineers Department of the Army Permit and National Environmental Policy Act
The U.S Army Corps of Engineers (USACE) issues permits under the following authorities: 1) Section 404 of the Clean Water Act (CWA), which covers the discharge of dredged or fill material into waters of the U.S., including wetlands and 2) Section 10 of the Rivers and Harbors Act of 1899, which covers work in or affecting navigable water of the United States. These permits are often referred to as Department of the Army (DOA) permits. Based on aerial photo review, the project area appears to be comprised of freshwater wetlands in the vicinity of the drainage project, which would fall under Section 404 of the CWA. If the USACE determines that the Pitmiktalik River is a navigable water body, work associated bank erosion project would fall under Section 10 of the Rivers and Harbors Act. Navigable waters is defined as "those waters that are subject to the ebb and flow of the tide and/or are presently used, or have been used in the past, or may be susceptible for use to transport interstate or foreign commerce.". Because there is no wetland mapping available for the project area, the USACE may require delineation by a wetlands professional to confirm the presence of wetlands and determine the wetlands boundary.
There are two types of DOA permits, 1) Nationwide Permit and 2) Individual Permit. The proposed project activities do not appear to fall under any of the 2012 Nationwide Permits available in Alaska; therefore, an Individual Permit would be required. A summary of the 2012 Nationwide Permits can be found at: http://www.poa.usace.army.mil/Portals/34/docs/regulatory/Summary_Table_2012%20NWPs_14%20Feb%202012.pdf
There are three primary steps to the Individual Permit process:
1) Pre-application (Optional). Meeting between the applicant, USACE, and resource agencies (Federal. State, or local) prior to submittal of a written application. The basic purpose of the Pre-application meeting is to facilitate discussions about a proposed activity before the applicant makes irreversible commitments of resources (funds, detailed design, etc.) The pre-application process is intended to provide the applicant with an assessment of the viability of some of the more obvious alternatives available to accomplish the project purpose, to discuss measures for reducing the impacts of the project, and to inform the applicant of factors the USACE must consider in it decision-making process. 2) Formal Review. After USACE receives a written application they will determine if the application is complete. Additional information may be requested if the application is determined incomplete. Once the application is determined complete the USACE will begin their formal review. During the formal review USACE determines if they have authority over project activities and issues a Public Notice to initiate public review. As discussed above, the USACE may require the applicant to conduct a wetland delineation by a wetlands professional in order to make their Jurisdictional Determination. They may also request that the consultant prepare a preliminary jurisdictional determination.
3) Evaluation and Decision. During this time the USACE will evaluate the environmental impacts of the proposed project and all public comments received during the public comment period. USACE will explain its decision in a decision document. This document may include a

Categorical Exclusion, an Environmental Assessment (EA), Environmental Impact Statement (EIS), a statement of findings or record of decision, a section 404(b)(1) guidelines evaluation (if necessary), and a public interest review evaluation. The USACE’s decision to issue or deny the permit is usually made within 120 days of receipt of application.
DOA application materials include:
Written Application – Form ENG 4345. Includes information on the project location, description, purpose and need of the project, type of discharge, and surface area and volume of fill material.
Mitigation Statement – statement to demonstrate how impacts to US waters and wetlands will be avoided, minimized, and compensated. The mitigation statement needs to be submitted with the written application. Information on applicant mitigation statements can be found at: http://www.poa.usace.army.mil/Portals/34/docs/regulatory/applicantproposedmitigationstatements.pdf.
Project/Property Location Map – overhead view of property that shows where proposed project will be built. Include landmarks, useful features, property boundaries, proposed project boundaries, MTSR, and latitude / longitude.
Project Plan View – Drawing to show the plan view of the proposed project, including details and dimensions of the proposed project (e.g., length, width, fill dimension and volumes).
Project Cross-Section View – Drawing showing the cross section of proposed project. Include all dimensions and quantities associated with the proposed project.
National Environmental Policy Act:
The National Environmental Policy Act (NEPA) of 1969 requires that prospective impacts of projects be understood and disclosed prior to a Federal agency issuing a permit or providing funding for a project. If the significance of environmental impacts from the proposed action is not clearly established and the activities do not fall under a list of categorically excluded actions from NEPA, the USACE as the lead permitting agency, will need to prepare an EA and may require the applicant to provide appropriate information necessary for the preparation of the EA. The purpose of the EA is to determine if the project will cause significant effects. If the EA concludes that no significant impacts will occur, a Finding of No Significant Impact is prepared and is used to support USACE’s permit decision. In the unlikely event that the EA for the proposed activity identifies significant impacts, an EIS would be required. Preliminary discussions with USACE in 2016 indicated that a small EA would probably be required for a river bank erosion revetment project (sheet pile walls, or articulating concrete block matting, etc.) or a community drainage project.
DOA Permit strategy:

An informal pre-application meeting with the USACE Regulatory Division and appropriate resource agencies would be beneficial to discuss the proposed project prior to submitting an application. During the pre-application meeting the applicant can seek regulatory input regarding potential environmental impacts, ways to reduce or minimize impacts, and determine if any studies, data, or analyses are needed to support the permitting effort (e.g., wetlands delineation and data to support an EA, as necessary).
The project area falls within the North Section which is coordinated through the Alaska District Office located on JBER in Anchorage. Contact information is provided below:
Alaska District Office P.O. Box 6898
JBER, Alaska 99506-0898 (907) 753-2712
The Purpose and Need (P&N) for the project needs to be well crafted. Incorporating a safety component provides a strong case for permitting. An alternative analysis summary can also helpful to demonstrate how the proposed design was selected and ideally that it is has the least environmental impact. It will also be important to demonstrate that construction of the drainage project will not cause a complete loss of wetlands (i.e., not draining the wetlands) and that the proposed drainage project will be restoring the area to its natural drainage; if this is the case.
The mitigation statement is another key component of the permit application. Some initial thoughts on mitigation are provided below for future discussion.
Avoidance – the area appears to be all wetland so avoidance may not be possible. A discussion of negative effects that could result with no action (i.e., increasing thaw bulb due to ponding water and continued bank erosion) may be helpful to stress the need for the project.
Minimization – If possible, the applicant should demonstrate that the project footprint has been minimized to the maximum extent. A discussion of other alternatives considered may also be helpful if there are alternatives with greater impacts that were eliminated or if there are alternatives with less impacts that are not feasible (i.e., drainage culverts that have failed).
Compensation – Compensatory mitigation means, for the purposes of the USACE regulatory program, the restoration, establishment, enhancement, or protection/maintenance of wetlands and/or other aquatic resources for the purpose of compensating for unavoidable adverse impacts which remain after all appropriate and practicable avoidance and minimization have been achieved. If possible, demonstration that the project would enhance aquatic habitat (i.e., by restoring natural drainage and mitigating continued bank erosion) could be used as a starting proposal for compensatory mitigation. However, typically unavoidable impacts are required to be mitigated at a 2:1 (or greater) ratio of mitigation to direct impacts.
Consultation for T&E Species and Critical Habitat
The Endangered Species Act requires Federal agencies to consult with the USFWS and the National Marine Fisheries Service (NMFS), as appropriate, if any activity that requires Federal

authorization may affect T&E species and critical habitat. The USACE, as the Federal permitting agency, will make a determination on the effect the proposed project may have on any listed (or proposed) T&E species and their critical habitat and determine the appropriate consultation with the USFWS and NMFS. Based on AECOM’s preliminary research, there are no T&E species or Critical Habitat in the vicinity of the project; therefore, formal consultation is not expected. However, USACE will coordinate with all applicable resource agencies during the public comment period of the DOA permit and any comments that the USFWS and NMFS may have concerning T&E species and Critical Habitat will be considered in their final assessment.
Essential Fish Habitat Assessment
The Magnuson-Stevens Fishery Conservation and Management Act requires the identification of EFH, which is defined as waters necessary for fish for spawning, breeding, feeding, or growth to maturity. This law requires Federal agencies to consult with the NMFS on proposed actions that are permitted, funded, or undertaken by the agency that may adversely affect EFH. USACE, as the Federal permitting agency, will assess potential project impacts to EFH and consult with the NMFS during the DOA permitting process. If the USACE determines that project activities may adversely affect EFH, an EFH Assessment would be required. The EFH Assessment provides information to the NMFS on the potential affects to EFH and ways to minimize any adverse effect. Any comments or EFH conservation recommendations that the NMFS may have will be considered in the USACE’s final permit decision and special conditions may be added to the DOA permit to minimize project impacts to EFH. Based on AECOM’s preliminary research, the Pikmiktalik River may provide EFH to Federally-managed salmon fisheries (based on the EFH mapper). However, the ADFG Fish Resource Monitor only identifies the presence of Sheefish and Whitefish for Pikmiktalik River. AECOM recommends contacting the NMFS once the design for Pitmiktalik River bank stabilization is complete to discuss the project and the verify the EFH mapping for this stretch of the river.
State Water Quality Certification
Any applicant for a federal license or permit to conduct an activity that might result in a discharge into navigable waters, in accordance with Section 401 of the Clean Water Act of 1977, also must apply for and obtain a certification from the ADEC stating that the discharge will comply with the Clean Water Act, the Alaska Water Quality Standards, and other applicable State laws. By agreement between the USACE and ADEC, application for the DOA permit also serves as application for the State Water Quality Certification. The USACE will coordinate with ADEC to obtain the certification prior to issuing the DOA permit. As necessary, special conditions may be added to the DOA permit and/or water quality certification to ensure water quality standards are met.
Alaska Pollutant Discharge Elimination System Construction General Permit
If the project footprint (e.g., ground disturbance) is greater than one acre, coverage under the ADEC’s Alaska Pollutant Discharge Elimination System Construction General Permit (CGP) will be required. To obtain coverage under the CGP the operator will need to file a Notice of Intent and prepare a Stormwater Pollution Prevention Plan prior to commencing construction. The goal

of the CGP is to minimize erosion and reduce or eliminate the discharge of pollutants, such as sediments carried in storm water runoff from construction sites through implementation of appropriate control measures. Instructions for filing an NOI and preparing a SWPPP can be found at: http://dec.alaska.gov/water/wnpspc/stormwater/sw_construction.htm.
ADFG Fish Habitat Permit
ADFG has the statutory responsibility for protecting freshwater anadromous fish habitat and providing free passage for anadromous and resident fish in fresh water bodies. Any activity or project that is conducted below the ordinary high water mark of an anadromous stream requires a Fish Habitat Permit (FHP). FHPs are required for the following activities:
construct a hydraulic project, or use, divert, obstruct, pollute, or change the natural flow or bed of a specified river, lake,
or stream, or use wheeled, tracked, or excavating equipment or log-dragging equipment in the bed of
a specified river, lake, or stream.
The two anadromous water bodies present in the project vicinity are the Nunavakanukakslak Lake and Pikmiktalik River. Depending on the final design of the drainage project a FHP may be required. The boundary of Nunavakanukakslak Lake was unclear from the ADFG mapper so AECOM recommends contacting the ADFG once the drainage design is complete to discuss the project and determine if a FHP will be required. Any work below the ordinary high water mark of Pikmiktalik River associated with the bank erosion project will require a FHP. FHPs generally take 30-60 days to process. Instructions for completing a Fish Habitat Permit application can be found at: http://www.adfg.alaska.gov/index.cfm?adfg=uselicense.main.
Cultural Resources
Section 106 of the National Historic Preservation Act requires the USACE to take into account the effects that activities authorized by DOA permits are likely to have on historic properties. USACE as the lead permitting agency will consult the latest published version of the AHRS for the presence or absence of historic properties and will coordinate with the State Historic Preservation Office (SHPO) during the DOA permitting process. Any comments that SHPO may have concerning presently known archaeological or historic data that may be lost or destroyed by work under the DOA permit will be considered in their final assessment. Based on AECOM’s research, there are no reported cultural resource sites around Atmautluak. However, the absence of reported cultural sites may simply mean that no surveys have been conducted in the project location. Although unlikely, that the SHPO may require an evaluation of the project area by a cultural resource professional to identify potential historic properties that could be affected by the proposed project. The need for a reconnaissance survey would depend on the project area’s prehistory and history and the likelihood for cultural/historic resources to be present in the project area.

This page intentionally left blank.

Appendix F: Cost Estimates

This page intentionally left blank.

Atm
autluak Hydrological Study and Community Drainage Plan
6/3/2016
Item
Des
crip
tio
nU
nit
Un
it C
ost
Qu
anti
tyC
ost
$C
om
men
tsS
heet
Pile
Wal
l - F
urni
sh a
nd In
stal
lsf
3014
1,20
04,
284,
290
Sca
led
dow
n co
st fr
om $
65 p
er s
f for
25
lb/s
f wal
lG
rave
l Ram
psC
Y16
020
032
,000
Uni
t cos
t bas
ed o
n $1
32/c
y m
ater
ials
del
iver
ed fr
om P
latin
um, p
lus
$28/
cy to
inst
all
Con
tinge
ncy
1,07
9,07
325
%M
obili
zatio
n/D
emob
iliza
tion
50
0,00
0S
ub-T
otal
Est
imat
ed C
onst
ruct
ion
Cos
ts$5
,895
,363
Eng
inee
ring,
Per
miti
ng, G
eote
ch10
0,00
0S
ub-T
otal
Est
imat
ed E
ngin
eerin
g C
osts
$100
,000
To
tal E
stim
ated
Co
st$5
,995
,363
$/L
inea
r F
oo
t$1
,698
.40
Not
es :
1. Q
uant
ities
abo
ve b
ased
on
auto
cad
mea
sure
men
ts
2. In
clud
es w
all a
long
riv
er fr
ont (
3060
ft),
and
two
loca
tions
on
lake
on
wes
t sid
e of
com
mun
ity (
3530
feet
tota
l)
3. 3
5 fo
ot e
mbe
dmen
t of p
iles
4.
Shi
ppin
g co
st =
$.3
per
poun
d, p
urch
ase
pric
e fo
r st
eel =
$.8
per
pou
nd F
OB
Sea
ttle
Mai
nten
ance
Epo
xy C
oatin
gsf
4510
500
$472
,500
Uni
t cos
t fro
m K
etch
ikan
Shi
pyar
d C
P p
roje
ct 2
102,
are
a as
sum
es 3
feet
hig
h x
leng
th o
f wal
lA
node
sea
500
350
$175
,000
Uni
t cos
t fro
m K
etch
ikan
Shi
pyar
d C
P p
roje
ct 2
103,
350
ano
des
(eve
ry 1
0 fe
et)
Mob
$50,
000
Con
tinge
ncy
15%
$97,
125
Tot
al$7
94,6
25
Sh
eet
Pile
Wal
l Alt
ern
ativ
e C
ost
Est
imat
e
F‐1

This page intentionally left blank.

Atm
autlu
ak H
ydro
logi
cal S
tudy
and
Com
mun
ity D
rain
age
Pla
n5/12/2016
Item
Des
crip
tio
nU
nit
Un
it C
ost
Qu
anti
tyC
ost
$C
om
men
ts
Exc
avat
ion
CY
208,
000
160,
000
Uni
t cos
t bas
ed o
n A
DO
T&
PF
bid
tabs
Tem
pora
ry C
offe
rdam
LS10
0,00
01
100,
000
Lum
p su
m e
stim
ate
Geo
text
ile F
abric
- F
urni
sh a
nd In
stal
lYD
22
11,0
0022
,000
Uni
t cos
t bas
ed o
n A
DO
T&
PF
bid
tabs
(K
ipnu
k)G
ranu
lar
Fill
(B
orro
w)
CY
160
4,00
064
0,00
0U
nit c
ost b
ased
on
$132
/cy
mat
eria
ls d
eliv
ered
from
Pla
tinum
, plu
s $2
8/cy
to in
stal
l
Geo
grid
- F
urni
sh a
nd In
stal
lYD
26
11,0
0070
,000
Uni
t cos
t bas
ed o
n A
DO
T&
PF
bid
tabs
(K
ipnu
k)
AC
B-
Fur
nish
and
Inst
all
YD2
185
11,0
002,
040,
000
Uni
t cos
t inc
lude
s $1
70/s
q yd
for
proc
uem
ent a
nd s
hipp
ing
and
$15/
sq y
d fo
r pl
acem
ent
Top
Soi
l Abo
ve W
ater
line
CY
202,
700
54,0
00U
nit c
ost b
ased
on
AD
OT
&P
F b
id ta
bs (
Kip
nuk)
See
ding
lb70
200
14,0
00U
nit c
ost b
ased
on
AD
OT
&P
F b
id ta
bs, a
ssum
es 2
lbs
per
1000
sf
Gra
nula
r F
ill B
elow
Wat
erlin
eCY
160
1,40
022
4,00
0S
ee a
bove
Con
tinge
ncy
831,
000
25%
Mob
iliza
tion/
Dem
obili
zatio
n
100,
000
Sub
-Tot
al E
stim
ated
Con
stru
ctio
n C
osts
$4,2
55,0
00
Eng
inee
ring,
Per
miti
ng, G
eote
ch20
0,00
0S
ub-T
otal
Est
imat
ed E
ngin
eerin
g C
osts
$200
,000
To
tal E
stim
ated
Co
st$4
,455
,000
$/L
inea
r F
oo
t$1
,262
.04
Not
es :
1. Q
uant
ities
abo
ve b
ased
on
auto
cad
mea
sure
men
ts
2
. Inc
lude
s A
CB
alo
ng r
iver
fron
(30
60 ft
), a
nd tw
o lo
catio
ns o
n la
ke o
n w
est s
ide
of c
omm
unity
(35
30 fe
et to
tal)
Mai
ntna
nce
Cos
tR
epai
r 10
% o
f AC
B
$332
,400
Ass
ume
10%
of A
CB
Are
aM
obili
zatio
n/D
emob
iliza
tion
$50,
000
Tot
al$3
82,4
00R
ou
nd
to
$35
0,00
0
ACB M
atting Alternative Cost Estim
ate
F‐2

This page intentionally left blank.

Atm
autluak Hydrological Study and Community Drainage Plan
5/13/2016
Item
Des
crip
tio
nU
nit
Un
it C
ost
Qu
anti
tyC
ost
$C
om
men
ts
Exc
avat
ion
CY
208,
000
160,
000
Uni
t cos
t bas
ed o
n A
DO
T&
PF
bid
tabs
Tem
pora
ry C
offe
rdam
LS10
0,00
01
100,
000
Lum
p su
m e
stim
ate
Geo
text
ile F
abric
- F
urni
sh a
nd In
stal
lYD
22
11,0
0022
,000
Uni
t cos
t bas
ed o
n A
DO
T&
PF
bid
tabs
(K
ipnu
k)
Gra
nula
r F
ill (
Bor
row
)CY
160
2,70
043
2,00
0U
nit c
ost b
ased
on
$132
/cy
mat
eria
ls d
eliv
ered
from
Pla
tinum
, plu
s $2
8/cy
to in
stal
l
CS
S-
Fur
nish
and
Inst
all
YD2
3011
,000
330,
000
Uni
t cos
t bas
ed o
n A
DO
T&
PF
bid
tabs
(K
ipnu
k)T
op S
oil A
bove
Wat
erlin
eCY
202,
700
54,0
00U
nit c
ost b
ased
on
AD
OT
&P
F b
id ta
bs (
Kip
nuk)
See
ding
lb70
200
14,0
00A
ssum
es 2
lbs
per
1000
sf
Con
cret
e S
lurr
yLS
350,
000
Pur
chas
e &
shi
p ce
men
t = $
180k
; $80
k im
port
agg
rega
te; 1
50 c
rew
hou
rs to
mix
& p
our
$75k
Con
tinge
ncy
365,
500
25%
Mob
iliza
tion/
Dem
obili
zatio
n
100,
000
Sub
-Tot
al E
stim
ated
Con
stru
ctio
n C
osts
$1,9
27,5
00
Eng
inee
ring,
Per
miti
ng, G
eote
ch10
0,00
0S
ub-T
otal
Est
imat
ed E
ngin
eerin
g C
osts
$100
,000
Total Estim
ated Cost
$2,0
27,5
00$/foot
$574
.36
Not
es :
1. Q
uant
ities
abo
ve b
ased
on
auto
cad
mea
sure
men
ts
2. I
nclu
des
CC
S a
long
riv
er fr
on (
3060
ft),
and
two
loca
tions
on
lake
on
wes
t sid
e of
com
mun
ity (
3530
feet
tota
l)
Mai
ntna
nce
Cos
tR
epai
r 10
% o
f CS
S$4
38,6
00A
ssum
e 30
% o
f AC
B A
rea
Mob
iliza
tion/
Dem
obili
zatio
n$5
0,00
0T
otal
$488
,600
Rou
nd to
$50
0,00
0
Cellu
lar Confinement System (CCS) Alternative Cost Estim
ate
F ‐3

This page intentionally left blank.

Atm
autluak Hydrological Study and Community Drainage Plan
5/12/2016
Base Bid Riverfront‐South End of Community =1450
LF
Item
Des
crip
tio
nU
nit
Un
it C
ost
Qu
anti
tyC
ost
$C
om
men
ts
Exc
avat
ion
CY
204,
000
80,0
00U
nit c
ost b
ased
on
AD
OT
&P
F b
id ta
bsT
empo
rary
Cof
ferd
amLS
100,
000
110
0,00
0Lu
mp
sum
est
imat
e
Geo
text
ile F
abric
- F
urni
sh a
nd In
stal
lYD
22
5,00
010
,000
Uni
t cos
t bas
ed o
n A
DO
T&
PF
bid
tabs
(K
ipnu
k)G
ranu
lar
Fill
(B
orro
w)
CY
160
1,70
027
2,00
0U
nit c
ost b
ased
on
$132
/cy
mat
eria
ls d
eliv
ered
from
Pla
tinum
, plu
s $2
8/cy
to in
stal
l
Geo
grid
- F
urni
sh a
nd In
stal
lYD
26
5,00
030
,000
Uni
t cos
t bas
ed o
n A
DO
T&
PF
bid
tabs
(K
ipnu
k)
AC
B-
Fur
nish
and
Inst
all
YD2
185
5,00
093
0,00
0U
nit c
ost i
nclu
des
$170
/sq
yd fo
r pr
ocue
men
t and
shi
ppin
g an
d $1
5/sq
yd
for
plac
emen
tT
op S
oil A
bove
Wat
erlin
eCY
201,
100
22,0
00U
nit c
ost b
ased
on
AD
OT
&P
F b
id ta
bs (
Kip
nuk)
See
ding
lb70
100
7,00
0U
nit c
ost b
ased
on
AD
OT
&P
F b
id ta
bs, a
ssum
es 2
lbs
per
1000
sf
Gra
nula
r F
ill B
elow
Wat
erlin
eCY
160
600
96,0
00S
ee a
bove
Con
tinge
ncy
386,
750
25%
Mob
iliza
tion/
Dem
obili
zatio
n
100,
000
Sub
-Tot
al E
stim
ated
Con
stru
ctio
n C
osts
$2,0
33,7
50
Eng
inee
ring,
Per
miti
ng, G
eote
ch20
0,00
0S
ub-T
otal
Est
imat
ed E
ngin
eerin
g C
osts
$200,000
Total Estim
ated Cost
$2,233,750
$/Li
near
Foo
t$1,540.52
ACB M
atting Additive Alternates
Additive Alternates, Cost Per Foot
$1,334Equals above costs, m
inus mobilizization/engineering/permitting/ divided
by 1450 ft (includes 25% contingency
Cost
Additive Alternate #1
Lake (W
est) Len
gth =
290ft
$390,000Equals cost per foot x length
Add
itive
Alte
rnat
e #2
Lak
e (E
ast)
leng
th =
180ft
$240,000Equals cost per foot x length
Add
itive
Alte
rnat
e #3
Riv
er (
mid
dle)
leng
th =
200ft
$270,000Equals cost per foot x length
Add
itive
Alte
rnat
e #
4 R
iver
(no
rth)
leng
th =
160ft
$210,000Equals cost per foot x length
ACB M
atting Alternative Phase I Cost Estim
ate
F‐4

This page intentionally left blank.

Atm
autluak Hydrological Study and Community Drainage Plan
5/12/2016
Item
Des
crip
tio
nU
nit
Un
it C
os
Qu
anti
tyC
ost
$C
om
men
tsE
xcav
atio
n C
Y20
4,50
090
,000
Uni
t cos
t bas
ed o
n A
DO
T&
PF
bid
tabs
Bac
kfill
(T
op S
oilin
g)C
Y20
3600
72,0
0080
% o
f exc
avat
ed m
ater
ial
See
ding
lb70
240
16,8
002
lbs
per
1000
sf
Ele
vate
d B
oard
wal
kE
A30
000
390
,000
Uni
t cos
t bas
ed o
n A
DO
T&
PF
bid
tabs
, K
ipnu
k B
oard
wal
kC
ontin
genc
y67
,200
25%
Mob
iliza
tion/
Dem
obili
zatio
n
100,
000
Sub
-Tot
al E
stim
ated
Con
stru
ctio
n C
osts
$436
,000
Eng
inee
ring,
Per
miti
ng, G
eote
ch50
,000
To
tal E
stim
ated
Co
st$4
86,0
00
Note: Quantites measured from autocad drawing
Dra
inag
e S
wal
e A
lter
nat
ive
Co
st E
stim
ate
F‐5

This page intentionally left blank.

Appendix G: DOWL Survey Control, Discharge Reports, and River Cross Sections

This page intentionally left blank.

Control Monuments used this SurveyID Northing Easting Elevation Description Survey Point #ARS-1 2504877.77 1590959.44 14.383 ALCAP 1HV-1 2508293.83 1591395.96 16.87 SS Rod 551TBM-601 2505659 1590314 16.11 NE Bolt 601
Horizontal Control
Vertical Control
Page 1
Elevations are NAVD88 Orthometric Heights expressed in U.S. Survey Feet as determined by the National GeodeticSurvey Online Positioning User Service (NGS OPUS) at station "ARS-1" using Geoid-12A modeling.TBM 601 is the north-east bolt on the north-east leg of the antennae tower on the west side of Atmautluak.
Coordinates are NAD83(2011) (EPOCH 2010.0000) Alaska State Plane Zone 7, expressed in U.S. Survey Feet.Coordinates were determined by the National Geodetic Survey Online Positioning User Service (NGS OPUS).HV-1 is located approximately 800' north of airport equipment building near NW corner of apron; ARS-1 is lo-cated approximately140 feet south of Post Office. TBM-601 is located approximately 120 feet west of Pig Lake.
DOWL AUGUST 2015 CONTROL POINT LISTING
ATMAUTLUAK ENGINEERING ANALYSISATMAUTLUAK, ALASKA

This page intentionally left blank.
CROSS SECTION POINT LISTING ATMAUTLUAK ENGINEERING ANALYSIS
ATMAUTLUAK, ALASKA
Cross Section 1
Survey Point # Northing Easting Elevation Description6141 2511746.54 1593498.09 5.55 GS/6142 2511751.37 1593490.36 5.20 GS/6143 2511756.46 1593485.25 5.06 GS/6144 2511759.68 1593475.33 4.92 GS/6145 2511762.83 1593461.98 4.16 GS/6146 2511744.54 1593502.43 5.99 GS/6147 2511745.96 1593512.37 6.83 EW6148 2511747.61 1593521.41 7.58 GS/6149 2511746.57 1593542.90 7.73 VEG6150 2511738.16 1593586.64 7.82 GS/6151 2511735.52 1593613.10 7.71 GS/6152 2511729.75 1593647.59 7.82 GS/6153 2511722.31 1593668.04 8.15 GS/6154 2511714.76 1593712.84 8.09 GS/6155 2511716.62 1593759.19 7.85 GS/6156 2511799.59 1593176.35 7.00 EW6157 2511794.24 1593184.64 5.88 GS/6158 2511791.38 1593200.77 5.02 GS/6159 2511786.68 1593212.58 4.87 GS/6160 2511785.62 1593223.28 4.98 GS/6161 2511788.93 1593233.84 4.89 GS/6162 2511790.38 1593244.69 4.70 GS/6163 2511791.67 1593256.11 4.46 GS/6164 2511803.33 1593170.89 8.06 GS/6165 2511806.66 1593162.28 9.03 GS/6166 2511806.82 1593158.30 8.30 VEG6167 2511816.28 1593119.39 8.64 GS/6168 2511824.99 1593081.75 8.24 GS/6169 2511821.78 1593052.69 7.50 GS/6170 2511822.57 1593007.32 7.63 GS/6171 2511825.54 1592953.90 7.65 GS/6172 2511823.10 1592907.79 8.47 GS/6173 2511836.20 1592855.81 7.32 GS/6174 2511840.93 1592808.95 8.19 GS/6175 2511838.29 1592755.09 8.05 GS/6176 2511826.48 1592697.65 7.16 GS/6177 2511820.01 1592657.17 7.33 GS/6178 2511816.63 1592647.49 13.15 GS/6179 2511812.75 1592617.77 14.31 GS/8881 2511791.77 1593264.54 4.33 SOUN8882 2511790.21 1593268.15 3.91 SOUN8883 2511789.69 1593272.70 2.23 SOUN8884 2511787.43 1593276.28 1.64 SOUN
Page 1

CROSS SECTION POINT LISTING ATMAUTLUAK ENGINEERING ANALYSIS
ATMAUTLUAK, ALASKA
8885 2511784.74 1593279.90 1.20 SOUN8886 2511781.67 1593283.29 0.76 SOUN8887 2511779.48 1593286.93 0.36 SOUN8888 2511777.90 1593290.53 -0.12 SOUN8889 2511776.81 1593294.03 -0.71 SOUN8890 2511776.13 1593297.70 -1.32 SOUN8891 2511775.30 1593301.69 -2.05 SOUN8892 2511773.98 1593306.32 -2.98 SOUN8893 2511772.79 1593310.56 -3.51 SOUN8894 2511772.21 1593315.05 -3.92 SOUN8895 2511771.95 1593319.38 -4.10 SOUN8896 2511772.26 1593324.26 -4.05 SOUN8897 2511771.85 1593329.36 -4.26 SOUN8898 2511771.20 1593334.18 -4.81 SOUN8899 2511771.17 1593338.79 -5.28 SOUN8900 2511771.44 1593343.81 -5.07 SOUN8901 2511771.85 1593348.83 -4.43 SOUN8902 2511772.37 1593353.75 -3.84 SOUN8903 2511773.22 1593358.59 -3.46 SOUN8904 2511773.88 1593363.46 -3.65 SOUN8905 2511774.19 1593368.43 -3.90 SOUN8906 2511774.18 1593373.51 -4.30 SOUN8907 2511774.30 1593378.43 -4.33 SOUN8908 2511774.25 1593383.56 -4.32 SOUN8909 2511773.91 1593388.57 -4.32 SOUN8910 2511773.56 1593393.76 -4.17 SOUN8911 2511773.15 1593398.76 -3.89 SOUN8912 2511772.48 1593403.93 -3.47 SOUN8913 2511771.95 1593409.08 -3.03 SOUN8914 2511771.09 1593414.35 -2.42 SOUN8915 2511769.72 1593419.53 -1.87 SOUN8916 2511768.59 1593424.74 -1.33 SOUN8917 2511767.42 1593429.89 -0.80 SOUN8918 2511766.54 1593434.63 -0.04 SOUN8919 2511765.72 1593439.63 0.83 SOUN8920 2511764.87 1593443.98 1.35 SOUN8921 2511764.01 1593448.53 2.18 SOUN8922 2511763.25 1593452.77 3.02 SOUN8923 2511763.59 1593456.34 3.91 SOUN8924 2511764.33 1593460.19 4.29 SOUN
Cross Section 2
Survey Point # Northing Easting Elevation Description6180 2509363.41 1594239.72 6.95 EW6181 2509364.03 1594240.67 7.80 VEG
Page 2

CROSS SECTION POINT LISTING ATMAUTLUAK ENGINEERING ANALYSIS
ATMAUTLUAK, ALASKA
6182 2509362.90 1594233.45 5.37 GS/6183 2509361.41 1594226.25 4.82 GS/6184 2509359.85 1594214.05 4.60 GS/6185 2509356.61 1594202.29 4.12 GS/6186 2509369.86 1594252.99 7.73 GS/6187 2509378.74 1594279.50 8.13 GS/6188 2509376.90 1594286.90 11.23 GS/6189 2509385.15 1594323.19 11.68 GS/6190 2509386.79 1594372.64 11.26 GS/6191 2509389.75 1594424.50 12.30 GS/6192 2509399.44 1594481.40 12.14 GS/6193 2509394.04 1594537.96 12.03 GS/6194 2509318.41 1593960.63 6.76 EW6195 2509319.96 1593968.09 5.59 GS/6196 2509322.85 1593979.52 5.31 GS/6197 2509325.12 1593996.40 4.83 GS/6198 2509327.62 1594011.75 4.72 GS/6199 2509331.62 1594026.41 4.25 GS/6200 2509317.38 1593948.56 8.27 GS/6201 2509310.31 1593901.82 8.13 GS/6202 2509304.78 1593852.53 7.54 GS/6203 2509290.72 1593803.15 7.51 GS/6204 2509285.08 1593753.71 7.37 GS/6205 2509271.98 1593696.57 8.13 GS/6206 2509267.53 1593641.09 7.42 GS/6207 2509251.77 1593592.74 7.41 GS/6208 2509238.67 1593545.58 7.54 GS/6209 2509231.34 1593497.52 7.33 GS/6210 2509225.80 1593447.84 7.04 GS/6211 2509218.07 1593414.21 6.72 GS/6212 2509213.72 1593394.92 4.68 GS/8737 2509327.30 1594014.70 4.59 SOUN8738 2509327.36 1594018.12 4.25 SOUN8739 2509327.52 1594021.70 4.43 SOUN8740 2509327.87 1594025.27 3.88 SOUN8741 2509328.62 1594028.81 4.39 SOUN8742 2509328.80 1594032.93 4.66 SOUN8743 2509328.92 1594037.29 3.63 SOUN8744 2509329.05 1594041.88 2.62 SOUN8745 2509329.49 1594046.58 1.80 SOUN8746 2509329.99 1594051.24 1.02 SOUN8747 2509330.76 1594055.75 -0.31 SOUN8748 2509331.81 1594060.39 -2.82 SOUN8749 2509332.22 1594064.98 -5.75 SOUN8750 2509332.74 1594069.71 -6.70 SOUN8751 2509333.11 1594075.02 -7.84 SOUN
Page 3
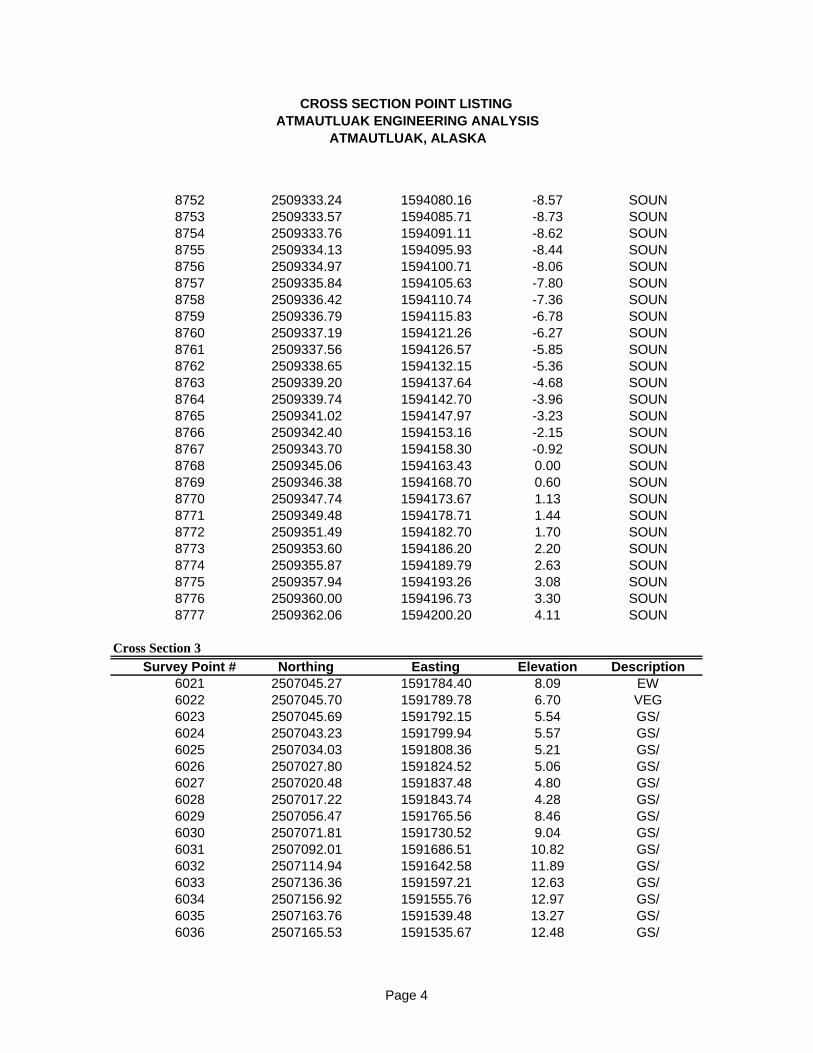
CROSS SECTION POINT LISTING ATMAUTLUAK ENGINEERING ANALYSIS
ATMAUTLUAK, ALASKA
8752 2509333.24 1594080.16 -8.57 SOUN8753 2509333.57 1594085.71 -8.73 SOUN8754 2509333.76 1594091.11 -8.62 SOUN8755 2509334.13 1594095.93 -8.44 SOUN8756 2509334.97 1594100.71 -8.06 SOUN8757 2509335.84 1594105.63 -7.80 SOUN8758 2509336.42 1594110.74 -7.36 SOUN8759 2509336.79 1594115.83 -6.78 SOUN8760 2509337.19 1594121.26 -6.27 SOUN8761 2509337.56 1594126.57 -5.85 SOUN8762 2509338.65 1594132.15 -5.36 SOUN8763 2509339.20 1594137.64 -4.68 SOUN8764 2509339.74 1594142.70 -3.96 SOUN8765 2509341.02 1594147.97 -3.23 SOUN8766 2509342.40 1594153.16 -2.15 SOUN8767 2509343.70 1594158.30 -0.92 SOUN8768 2509345.06 1594163.43 0.00 SOUN8769 2509346.38 1594168.70 0.60 SOUN8770 2509347.74 1594173.67 1.13 SOUN8771 2509349.48 1594178.71 1.44 SOUN8772 2509351.49 1594182.70 1.70 SOUN8773 2509353.60 1594186.20 2.20 SOUN8774 2509355.87 1594189.79 2.63 SOUN8775 2509357.94 1594193.26 3.08 SOUN8776 2509360.00 1594196.73 3.30 SOUN8777 2509362.06 1594200.20 4.11 SOUN
Cross Section 3
Survey Point # Northing Easting Elevation Description6021 2507045.27 1591784.40 8.09 EW6022 2507045.70 1591789.78 6.70 VEG6023 2507045.69 1591792.15 5.54 GS/6024 2507043.23 1591799.94 5.57 GS/6025 2507034.03 1591808.36 5.21 GS/6026 2507027.80 1591824.52 5.06 GS/6027 2507020.48 1591837.48 4.80 GS/6028 2507017.22 1591843.74 4.28 GS/6029 2507056.47 1591765.56 8.46 GS/6030 2507071.81 1591730.52 9.04 GS/6031 2507092.01 1591686.51 10.82 GS/6032 2507114.94 1591642.58 11.89 GS/6033 2507136.36 1591597.21 12.63 GS/6034 2507156.92 1591555.76 12.97 GS/6035 2507163.76 1591539.48 13.27 GS/6036 2507165.53 1591535.67 12.48 GS/
Page 4

CROSS SECTION POINT LISTING ATMAUTLUAK ENGINEERING ANALYSIS
ATMAUTLUAK, ALASKA
6037 2507184.58 1591490.86 11.72 GS/6038 2507201.23 1591451.43 11.35 GS/6039 2507205.44 1591443.28 9.04 GS/6040 2507209.03 1591433.73 11.38 GS/6041 2507226.32 1591398.43 9.35 GS/6042 2507228.78 1591395.89 8.44 GS/6043 2507242.92 1591365.54 8.34 GS/6044 2507259.69 1591332.71 8.43 GS/6045 2507275.98 1591296.40 7.95 GS/6046 2507291.52 1591261.83 8.15 GS/6047 2507303.28 1591231.17 8.54 GS/6048 2507328.90 1591179.77 8.72 GS/6049 2507346.01 1591139.35 8.84 GS/6050 2507364.06 1591093.98 8.46 GS/6051 2507386.26 1591046.87 8.73 GS/6052 2507409.27 1591000.29 8.47 GS/6053 2507428.78 1590956.12 7.37 GS/6054 2507433.84 1590948.42 6.56 EW6055 2507439.41 1590935.33 4.49 GS/6056 2507455.37 1590905.38 4.05 GS/6057 2507470.69 1590871.28 3.97 GS/6058 2507484.26 1590841.19 3.82 GS/6059 2507497.69 1590808.71 3.64 GS/6060 2507510.97 1590777.06 4.27 GS/6061 2507527.29 1590750.33 4.30 GS/6062 2507542.80 1590724.62 4.47 GS/6063 2507549.70 1590712.19 4.83 GS/6064 2507551.11 1590705.32 6.77 EW6065 2507564.44 1590677.35 7.19 GS/6066 2507577.25 1590648.33 6.91 GS/6067 2507596.13 1590607.92 7.28 GS/6068 2507617.66 1590570.36 6.76 GS/6069 2507638.87 1590530.69 7.28 GS/6070 2507653.63 1590488.59 7.11 GS/6071 2507673.98 1590452.52 7.40 GS/6072 2507681.97 1590443.00 6.65 EW6213 2506862.94 1592169.19 9.07 VEG6214 2506864.27 1592167.59 6.73 EW6215 2506865.82 1592164.07 4.01 GS/6216 2506867.41 1592160.87 2.55 GS/6217 2506868.29 1592160.42 2.07 GS/6218 2506853.44 1592185.65 7.81 GS/6219 2506844.66 1592230.45 8.41 GS/6220 2506832.90 1592259.66 8.85 GS/6221 2506813.76 1592304.76 8.82 GS/6222 2506785.17 1592363.69 8.39 GS/
Page 5

CROSS SECTION POINT LISTING ATMAUTLUAK ENGINEERING ANALYSIS
ATMAUTLUAK, ALASKA
6223 2506762.62 1592408.40 8.09 GS/6224 2506745.15 1592453.43 7.79 GS/6225 2506723.36 1592493.86 8.66 GS/6226 2506701.46 1592530.62 7.67 GS/6227 2506673.83 1592569.49 8.08 GS/6228 2506660.22 1592594.47 7.87 GS/8634 2507018.79 1591840.46 4.48 SOUN8635 2507016.72 1591844.65 4.41 SOUN8636 2507014.18 1591849.20 2.13 SOUN8637 2507011.46 1591853.76 1.27 SOUN8638 2507008.98 1591858.76 0.80 SOUN8639 2507006.81 1591864.24 1.03 SOUN8640 2507003.59 1591869.64 1.10 SOUN8641 2507000.65 1591874.93 1.03 SOUN8642 2506997.63 1591880.40 0.81 SOUN8643 2506994.65 1591885.54 0.67 SOUN8644 2506992.00 1591891.02 0.25 SOUN8645 2506989.77 1591896.73 -0.25 SOUN8646 2506987.94 1591902.75 -0.77 SOUN8647 2506984.52 1591908.29 -1.46 SOUN8648 2506980.91 1591913.77 -2.26 SOUN8649 2506977.13 1591918.36 -3.03 SOUN8650 2506974.76 1591923.13 -3.52 SOUN8651 2506972.44 1591928.13 -3.77 SOUN8652 2506969.64 1591933.43 -4.32 SOUN8653 2506966.43 1591939.21 -4.66 SOUN8654 2506962.96 1591945.03 -4.57 SOUN8655 2506959.92 1591950.11 -4.22 SOUN8656 2506956.65 1591955.78 -3.94 SOUN8657 2506953.36 1591961.29 -3.68 SOUN8658 2506949.94 1591966.80 -3.48 SOUN8659 2506947.29 1591972.46 -2.97 SOUN8660 2506944.02 1591978.67 -2.37 SOUN8661 2506940.53 1591984.75 -1.98 SOUN8662 2506936.88 1591990.89 -1.84 SOUN8663 2506933.35 1591997.02 -2.28 SOUN8664 2506929.96 1592003.21 -4.62 SOUN8665 2506926.60 1592009.23 -4.60 SOUN8666 2506922.50 1592015.43 -3.02 SOUN8667 2506918.39 1592021.62 -3.01 SOUN8668 2506916.35 1592028.64 -3.16 SOUN8669 2506914.21 1592035.51 -2.81 SOUN8670 2506912.34 1592042.41 -2.11 SOUN8671 2506910.12 1592049.37 -1.93 SOUN8672 2506907.32 1592056.28 -1.92 SOUN8673 2506904.37 1592062.96 -1.87 SOUN
Page 6

CROSS SECTION POINT LISTING ATMAUTLUAK ENGINEERING ANALYSIS
ATMAUTLUAK, ALASKA
8674 2506901.42 1592069.65 -0.74 SOUN8675 2506898.48 1592076.33 -0.50 SOUN8676 2506895.53 1592083.02 -0.50 SOUN8677 2506892.59 1592089.70 -0.50 SOUN8678 2506889.65 1592096.39 -0.50 SOUN8679 2506886.70 1592103.07 0.44 SOUN8680 2506885.38 1592108.31 0.62 SOUN8681 2506883.53 1592114.03 1.06 SOUN8682 2506882.47 1592118.33 1.55 SOUN8683 2506881.78 1592123.29 1.84 SOUN8684 2506880.35 1592127.25 1.96 SOUN8685 2506878.67 1592131.19 1.66 SOUN8686 2506877.62 1592134.65 1.19 SOUN8687 2506876.82 1592137.59 0.68 SOUN8688 2506875.91 1592140.35 0.43 SOUN8689 2506874.77 1592142.81 0.24 SOUN8690 2506873.74 1592145.25 0.14 SOUN8691 2506873.01 1592147.70 -0.02 SOUN8693 2506872.34 1592151.62 -0.15 SOUN8695 2506872.27 1592154.71 0.11 SOUN8697 2506870.99 1592157.72 0.86 SOUN8699 2506868.20 1592161.78 1.46 SOUN
Cross Section 4
Survey Point # Northing Easting Elevation Description5787 2505644.55 1590862.26 7.52 GS/5790 2505626.11 1590768.96 7.72 GS/5831 2505640.86 1590194.30 11.18 TOP035973 2505638.43 1590627.85 6.75 GS/5979 2505637.11 1590438.12 7.24 GS/5980 2505649.83 1590468.13 6.59 GS/5991 2505630.64 1590543.29 6.45 GS/6073 2505637.53 1590260.30 13.17 GS/6074 2505635.85 1590299.21 13.53 GS/6075 2505635.15 1590333.93 13.24 GS/6076 2505637.77 1590376.03 12.82 GS/6077 2505640.03 1590425.04 9.12 GS/6078 2505633.73 1590900.41 11.96 GS/6079 2505631.91 1591418.53 6.45 GS/6080 2505632.02 1591428.55 5.68 GS/6081 2505631.65 1591440.63 4.94 GS/6082 2505631.36 1591449.69 4.32 GS/6083 2505634.80 1591409.82 7.74 EW6084 2505634.77 1591409.30 8.21 VEG6085 2505631.13 1591395.81 10.35 GS/
Page 7

CROSS SECTION POINT LISTING ATMAUTLUAK ENGINEERING ANALYSIS
ATMAUTLUAK, ALASKA
6086 2505631.07 1591372.82 10.99 GS/6087 2505632.52 1591326.01 12.56 GS/6088 2505634.22 1591272.73 13.43 GS/6089 2505631.36 1591222.32 13.24 GS/6090 2505635.83 1591172.50 13.32 GS/6091 2505633.16 1591128.62 13.62 GS/6092 2505633.15 1591069.72 13.72 GS/6093 2505633.59 1591023.81 13.60 GS/6094 2505635.32 1590979.59 13.67 GS/6095 2505634.73 1590926.78 13.15 GS/6229 2505628.73 1591769.33 6.66 EW6230 2505630.30 1591764.05 5.53 GS/6231 2505631.28 1591754.90 3.99 GS/6232 2505630.55 1591750.82 3.34 GS/6233 2505624.74 1591780.98 7.91 GS/6234 2505629.87 1591820.31 7.32 GS/6235 2505629.14 1591858.26 7.52 VEG6236 2505624.71 1591896.31 8.71 GS/6237 2505620.03 1591942.08 9.24 GS/6238 2505609.22 1591982.76 8.89 GS/6239 2505614.61 1592027.21 8.86 GS/6240 2505618.89 1592064.86 8.74 GS/6241 2505626.30 1592109.01 7.69 GS/8483 2505630.23 1591454.68 4.07 SOUN8484 2505630.59 1591457.19 3.85 SOUN8485 2505630.58 1591460.20 3.62 SOUN8486 2505631.42 1591462.97 3.39 SOUN8487 2505632.53 1591465.76 2.71 SOUN8488 2505633.88 1591468.41 2.26 SOUN8489 2505635.13 1591471.29 1.68 SOUN8490 2505636.03 1591474.13 1.12 SOUN8491 2505636.47 1591476.96 0.60 SOUN8492 2505636.53 1591479.78 -0.03 SOUN8493 2505636.27 1591482.72 -0.60 SOUN8494 2505635.70 1591485.92 -0.98 SOUN8495 2505635.32 1591489.27 -1.28 SOUN8496 2505634.74 1591492.37 -1.54 SOUN8497 2505634.49 1591495.71 -1.80 SOUN8498 2505634.27 1591499.11 -2.09 SOUN8499 2505634.66 1591503.44 -2.41 SOUN8500 2505634.08 1591507.73 -2.76 SOUN8501 2505633.44 1591512.06 -2.95 SOUN8502 2505633.06 1591516.80 -3.04 SOUN8503 2505632.92 1591521.59 -3.20 SOUN8504 2505632.72 1591526.43 -3.31 SOUN8505 2505633.16 1591531.73 -3.42 SOUN
Page 8

CROSS SECTION POINT LISTING ATMAUTLUAK ENGINEERING ANALYSIS
ATMAUTLUAK, ALASKA
8506 2505632.59 1591536.96 -3.56 SOUN8507 2505631.78 1591541.95 -3.88 SOUN8508 2505630.79 1591546.37 -4.06 SOUN8509 2505630.81 1591551.16 -4.22 SOUN8510 2505631.04 1591556.61 -4.43 SOUN8511 2505630.74 1591562.44 -4.56 SOUN8512 2505630.18 1591568.51 -4.66 SOUN8513 2505629.78 1591574.80 -4.57 SOUN8514 2505629.35 1591580.97 -4.32 SOUN8515 2505628.31 1591587.40 -3.83 SOUN8516 2505627.70 1591593.84 -3.13 SOUN8517 2505627.35 1591600.01 -2.53 SOUN8518 2505627.83 1591606.37 -1.89 SOUN8519 2505628.12 1591612.14 -1.09 SOUN8520 2505628.61 1591618.23 -0.19 SOUN8521 2505629.31 1591624.32 0.40 SOUN8522 2505629.70 1591630.23 0.87 SOUN8523 2505630.32 1591635.91 1.15 SOUN8524 2505630.11 1591642.04 1.58 SOUN8525 2505629.41 1591647.88 1.94 SOUN8526 2505628.83 1591653.62 2.37 SOUN8527 2505628.62 1591659.30 2.80 SOUN8528 2505628.16 1591665.02 3.18 SOUN8529 2505627.94 1591670.24 3.44 SOUN8530 2505628.68 1591675.44 3.58 SOUN8531 2505629.20 1591680.63 3.69 SOUN8532 2505629.47 1591685.92 3.76 SOUN8533 2505629.68 1591690.96 3.88 SOUN8534 2505629.89 1591696.06 3.94 SOUN8535 2505630.09 1591701.25 3.99 SOUN8536 2505630.32 1591706.44 3.97 SOUN8537 2505630.26 1591711.97 3.88 SOUN8538 2505629.98 1591717.03 3.85 SOUN8539 2505629.88 1591722.25 3.71 SOUN8540 2505630.02 1591726.61 3.53 SOUN8541 2505630.47 1591730.81 3.37 SOUN8542 2505630.65 1591734.93 3.19 SOUN8543 2505630.57 1591738.76 2.85 SOUN8544 2505630.25 1591742.34 2.51 SOUN8545 2505630.06 1591746.29 2.40 SOUN
Cross Section 5
Survey Point # Northing Easting Elevation Description6096 2504132.53 1591392.03 8.06 EW6097 2504132.82 1591393.73 7.50 VEG
Page 9

CROSS SECTION POINT LISTING ATMAUTLUAK ENGINEERING ANALYSIS
ATMAUTLUAK, ALASKA
6098 2504133.52 1591397.28 6.11 GS/6099 2504136.70 1591405.65 5.55 GS/6100 2504139.71 1591414.83 5.20 GS/6101 2504143.59 1591425.83 4.84 GS/6102 2504148.74 1591444.54 4.62 GS/6103 2504149.83 1591448.75 4.39 GS/6104 2504123.74 1591372.13 8.79 GS/6105 2504114.79 1591352.17 10.49 GS/6106 2504104.90 1591306.12 9.64 GS/6107 2504083.14 1591246.64 7.99 GS/6108 2504060.98 1591198.30 7.71 GS/6109 2504049.22 1591163.57 8.17 GS/6110 2504042.17 1591137.16 7.43 GS/6111 2504040.85 1591126.76 8.01 EW6112 2504035.83 1591115.73 6.04 GS/6113 2504033.44 1591108.88 5.22 GS/6242 2504259.35 1591756.21 6.61 EW6243 2504255.79 1591742.89 4.96 GS/6244 2504253.63 1591736.22 5.00 GS/6245 2504264.37 1591768.28 6.70 GS/6246 2504270.71 1591788.21 7.86 GS/6247 2504287.13 1591832.42 7.82 GS/6248 2504308.61 1591871.75 7.13 GS/6249 2504323.08 1591912.72 7.09 GS/6250 2504326.14 1591926.43 7.30 VEG6251 2504347.08 1591982.01 8.35 GS/8968 2504153.50 1591452.19 4.62 SOUN8971 2504149.27 1591454.72 4.55 SOUN8972 2504148.07 1591455.61 4.64 SOUN8973 2504155.42 1591458.31 4.60 SOUN8974 2504157.34 1591462.34 4.63 SOUN8975 2504158.17 1591466.10 4.66 SOUN8976 2504161.54 1591469.60 4.49 SOUN8979 2504162.35 1591475.93 4.56 SOUN8983 2504163.22 1591479.98 4.42 SOUN8986 2504164.22 1591483.37 4.18 SOUN8989 2504165.50 1591487.34 4.65 SOUN8991 2504166.83 1591491.04 4.49 SOUN8994 2504167.71 1591494.93 3.45 SOUN8996 2504169.37 1591498.92 2.40 SOUN9000 2504170.83 1591502.91 1.46 SOUN9005 2504172.88 1591506.78 0.71 SOUN9008 2504174.07 1591511.38 0.28 SOUN9009 2504176.02 1591513.56 0.12 SOUN9010 2504174.72 1591518.44 -0.25 SOUN9011 2504174.21 1591523.09 -0.68 SOUN
Page 10

CROSS SECTION POINT LISTING ATMAUTLUAK ENGINEERING ANALYSIS
ATMAUTLUAK, ALASKA
9012 2504174.54 1591527.94 -0.96 SOUN9013 2504175.36 1591533.10 -1.28 SOUN9014 2504175.76 1591537.19 -1.57 SOUN9015 2504176.70 1591540.60 -1.73 SOUN9016 2504177.98 1591545.33 -2.00 SOUN9017 2504178.75 1591549.45 -2.20 SOUN9018 2504180.37 1591554.15 -2.33 SOUN9019 2504182.11 1591558.89 -2.66 SOUN9020 2504184.87 1591563.58 -2.91 SOUN9021 2504187.60 1591568.12 -3.14 SOUN9022 2504190.51 1591572.56 -3.17 SOUN9023 2504193.25 1591576.70 -3.14 SOUN9024 2504196.12 1591581.36 -3.20 SOUN9025 2504198.21 1591586.28 -3.27 SOUN9026 2504200.49 1591591.06 -3.44 SOUN9027 2504202.71 1591595.81 -3.55 SOUN9028 2504204.87 1591600.84 -3.54 SOUN9029 2504206.89 1591606.07 -3.47 SOUN9030 2504207.74 1591611.98 -3.43 SOUN9031 2504208.44 1591617.93 -3.47 SOUN9032 2504208.59 1591623.83 -3.54 SOUN9033 2504210.17 1591629.10 -3.30 SOUN9034 2504212.11 1591634.14 -3.07 SOUN9035 2504214.04 1591639.12 -3.05 SOUN9036 2504215.62 1591644.30 -3.07 SOUN9037 2504217.29 1591649.99 -2.47 SOUN9038 2504218.85 1591655.31 -1.41 SOUN9039 2504220.17 1591660.26 -0.36 SOUN9040 2504222.23 1591664.93 0.33 SOUN9041 2504224.03 1591669.64 0.87 SOUN9042 2504225.74 1591674.25 1.17 SOUN9043 2504228.05 1591677.92 1.53 SOUN9044 2504230.66 1591681.46 1.95 SOUN9045 2504232.62 1591684.73 2.78 SOUN9046 2504234.31 1591687.52 3.83 SOUN9047 2504235.99 1591690.74 4.21 SOUN9048 2504238.49 1591692.86 4.44 SOUN9049 2504238.32 1591695.50 4.40 SOUN9050 2504238.15 1591698.14 4.67 SOUN9051 2504237.98 1591700.79 4.55 SOUN9052 2504239.51 1591704.63 4.64 SOUN9053 2504241.85 1591708.99 4.80 SOUN9054 2504242.80 1591712.68 4.80 SOUN9055 2504243.76 1591715.51 4.83 SOUN9056 2504244.41 1591717.12 4.79 SOUN9057 2504246.35 1591720.33 4.70 SOUN
Page 11

CROSS SECTION POINT LISTING ATMAUTLUAK ENGINEERING ANALYSIS
ATMAUTLUAK, ALASKA
9058 2504248.54 1591724.69 4.74 SOUN9059 2504250.29 1591730.00 4.71 SOUN
Cross Section 6
Survey Point # Northing Easting Elevation Description6114 2503118.89 1591946.35 7.88 EW6115 2503123.81 1591951.97 6.72 GS/6116 2503129.15 1591960.92 5.53 GS/6117 2503133.42 1591967.52 4.69 VEG6118 2503135.94 1591972.17 4.37 GS/6119 2503138.13 1591975.14 4.21 GS/6120 2503118.25 1591943.08 8.83 GS/6121 2503112.94 1591934.71 10.03 GS/6122 2503093.50 1591918.07 7.45 GS/6123 2503085.29 1591909.28 4.41 GS/6124 2503075.37 1591895.55 5.67 GS/6125 2503061.82 1591876.59 6.96 GS/6126 2503047.00 1591847.31 7.08 GS/6127 2503028.11 1591817.96 6.30 GS/6128 2503004.51 1591783.20 5.33 GS/6129 2502977.34 1591745.52 7.30 GS/6130 2502950.07 1591704.09 7.25 GS/6131 2502925.68 1591665.98 7.46 GS/6132 2502899.11 1591623.29 7.43 GS/6133 2502868.58 1591582.29 7.41 GS/6134 2502840.94 1591542.23 7.70 GS/6135 2502810.29 1591499.71 6.86 GS/6136 2502783.50 1591465.12 7.47 GS/6137 2502760.19 1591426.25 7.37 GS/6138 2502725.70 1591378.49 6.90 GS/6139 2502698.22 1591344.06 6.75 GS/6253 2503302.09 1592202.10 7.12 EW6254 2503294.79 1592197.10 5.54 GS/6255 2503289.39 1592191.39 5.16 GS/6256 2503285.52 1592184.25 5.27 GS/6257 2503276.68 1592170.24 5.08 GS/6258 2503267.33 1592156.08 4.31 GS/6259 2503302.37 1592208.34 7.55 GS/6260 2503324.51 1592244.48 8.70 GS/6261 2503359.55 1592301.52 8.19 GS/6262 2503394.81 1592345.95 7.73 GS/6263 2503425.87 1592385.39 7.74 VEG6264 2503454.14 1592425.57 7.64 GS/6265 2503465.05 1592445.03 7.70 GS/6266 2503478.64 1592473.51 8.41 GS/
Page 12

CROSS SECTION POINT LISTING ATMAUTLUAK ENGINEERING ANALYSIS
ATMAUTLUAK, ALASKA
6267 2503502.36 1592510.56 7.63 GS/6268 2503526.10 1592555.05 8.43 GS/6269 2503557.04 1592593.20 8.22 GS/6270 2503591.03 1592635.09 8.71 GS/6271 2503621.50 1592682.04 7.99 GS/6272 2503626.03 1592698.49 7.74 GS/8392 2503144.37 1591982.24 4.32 SOUN8393 2503146.71 1591985.95 2.09 SOUN8394 2503150.60 1591989.13 1.09 SOUN8395 2503155.01 1591991.97 0.78 SOUN8396 2503157.92 1591995.73 0.38 SOUN8397 2503160.95 1591999.65 0.27 SOUN8398 2503164.31 1592003.47 0.19 SOUN8399 2503167.28 1592006.73 -0.01 SOUN8400 2503169.89 1592010.34 -0.24 SOUN8401 2503173.15 1592013.74 -0.40 SOUN8402 2503175.47 1592017.70 -0.51 SOUN8403 2503177.94 1592021.66 -0.70 SOUN8404 2503180.83 1592025.44 -0.93 SOUN8405 2503183.68 1592029.64 -1.15 SOUN8406 2503186.51 1592033.76 -1.42 SOUN8407 2503189.45 1592037.64 -1.53 SOUN8408 2503193.10 1592041.54 -1.72 SOUN8409 2503196.31 1592045.37 -1.90 SOUN8410 2503198.96 1592048.91 -2.03 SOUN8411 2503201.99 1592052.17 -2.15 SOUN8412 2503204.90 1592056.78 -2.26 SOUN8413 2503206.43 1592061.02 -2.48 SOUN8414 2503208.94 1592065.32 -2.66 SOUN8415 2503211.80 1592069.64 -2.81 SOUN8416 2503215.12 1592073.84 -2.92 SOUN8417 2503217.74 1592078.51 -2.98 SOUN8418 2503220.30 1592083.34 -2.94 SOUN8419 2503222.39 1592088.12 -2.81 SOUN8420 2503225.20 1592092.23 -2.71 SOUN8421 2503228.62 1592096.30 -2.68 SOUN8422 2503231.36 1592100.62 -2.65 SOUN8423 2503234.44 1592104.35 -2.57 SOUN8424 2503237.21 1592108.10 -2.35 SOUN8425 2503240.09 1592111.99 -2.19 SOUN8426 2503242.94 1592116.13 -1.80 SOUN8427 2503244.53 1592121.03 -1.36 SOUN8428 2503247.06 1592125.24 -0.66 SOUN8429 2503249.50 1592129.06 -0.09 SOUN8430 2503252.77 1592132.07 0.29 SOUN8431 2503255.57 1592135.52 0.54 SOUN
Page 13
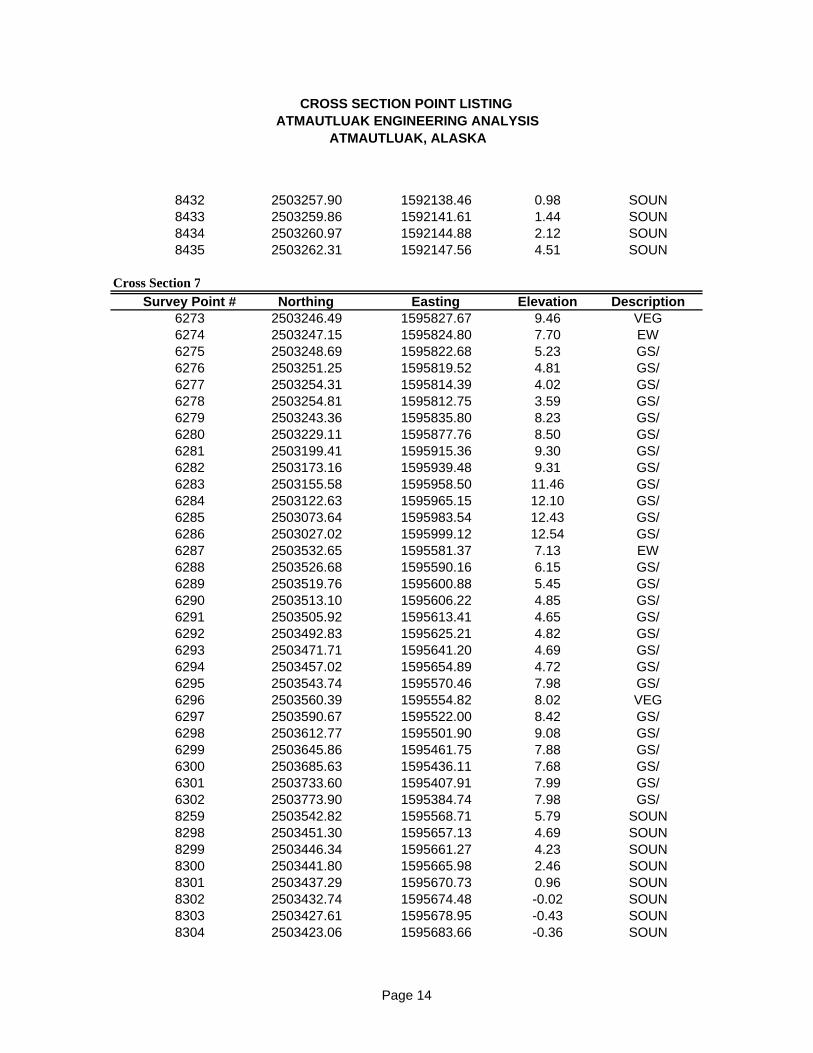
CROSS SECTION POINT LISTING ATMAUTLUAK ENGINEERING ANALYSIS
ATMAUTLUAK, ALASKA
8432 2503257.90 1592138.46 0.98 SOUN8433 2503259.86 1592141.61 1.44 SOUN8434 2503260.97 1592144.88 2.12 SOUN8435 2503262.31 1592147.56 4.51 SOUN
Cross Section 7
Survey Point # Northing Easting Elevation Description6273 2503246.49 1595827.67 9.46 VEG6274 2503247.15 1595824.80 7.70 EW6275 2503248.69 1595822.68 5.23 GS/6276 2503251.25 1595819.52 4.81 GS/6277 2503254.31 1595814.39 4.02 GS/6278 2503254.81 1595812.75 3.59 GS/6279 2503243.36 1595835.80 8.23 GS/6280 2503229.11 1595877.76 8.50 GS/6281 2503199.41 1595915.36 9.30 GS/6282 2503173.16 1595939.48 9.31 GS/6283 2503155.58 1595958.50 11.46 GS/6284 2503122.63 1595965.15 12.10 GS/6285 2503073.64 1595983.54 12.43 GS/6286 2503027.02 1595999.12 12.54 GS/6287 2503532.65 1595581.37 7.13 EW6288 2503526.68 1595590.16 6.15 GS/6289 2503519.76 1595600.88 5.45 GS/6290 2503513.10 1595606.22 4.85 GS/6291 2503505.92 1595613.41 4.65 GS/6292 2503492.83 1595625.21 4.82 GS/6293 2503471.71 1595641.20 4.69 GS/6294 2503457.02 1595654.89 4.72 GS/6295 2503543.74 1595570.46 7.98 GS/6296 2503560.39 1595554.82 8.02 VEG6297 2503590.67 1595522.00 8.42 GS/6298 2503612.77 1595501.90 9.08 GS/6299 2503645.86 1595461.75 7.88 GS/6300 2503685.63 1595436.11 7.68 GS/6301 2503733.60 1595407.91 7.99 GS/6302 2503773.90 1595384.74 7.98 GS/8259 2503542.82 1595568.71 5.79 SOUN8298 2503451.30 1595657.13 4.69 SOUN8299 2503446.34 1595661.27 4.23 SOUN8300 2503441.80 1595665.98 2.46 SOUN8301 2503437.29 1595670.73 0.96 SOUN8302 2503432.74 1595674.48 -0.02 SOUN8303 2503427.61 1595678.95 -0.43 SOUN8304 2503423.06 1595683.66 -0.36 SOUN
Page 14

CROSS SECTION POINT LISTING ATMAUTLUAK ENGINEERING ANALYSIS
ATMAUTLUAK, ALASKA
8305 2503418.51 1595688.38 -0.19 SOUN8306 2503414.20 1595693.88 -0.12 SOUN8307 2503409.06 1595697.75 -0.27 SOUN8308 2503403.04 1595701.52 -0.25 SOUN8309 2503397.04 1595705.32 -0.47 SOUN8310 2503391.30 1595709.61 -0.91 SOUN8311 2503386.02 1595714.60 -1.68 SOUN8312 2503382.23 1595720.02 -2.32 SOUN8313 2503377.07 1595724.59 -2.94 SOUN8314 2503371.88 1595729.08 -3.50 SOUN8315 2503366.22 1595732.99 -3.88 SOUN8316 2503360.62 1595736.80 -4.03 SOUN8317 2503354.79 1595741.01 -4.28 SOUN8318 2503349.14 1595745.13 -4.23 SOUN8319 2503343.13 1595749.89 -4.08 SOUN8320 2503338.47 1595755.84 -3.87 SOUN8321 2503332.92 1595760.75 -3.51 SOUN8322 2503327.78 1595764.79 -2.84 SOUN8323 2503322.33 1595767.54 -2.58 SOUN8324 2503317.11 1595770.73 -2.57 SOUN8325 2503312.03 1595773.26 -2.10 SOUN8326 2503307.03 1595775.75 -1.84 SOUN8327 2503302.46 1595778.38 -1.55 SOUN8328 2503298.43 1595780.75 -1.42 SOUN8329 2503294.35 1595784.09 -1.29 SOUN8330 2503290.09 1595787.00 -1.05 SOUN8331 2503287.06 1595789.06 -0.70 SOUN8332 2503284.37 1595791.30 -0.54 SOUN8333 2503281.81 1595793.49 -0.32 SOUN8334 2503279.58 1595795.21 -0.01 SOUN8336 2503276.03 1595797.92 0.78 SOUN8338 2503272.97 1595800.00 1.11 SOUN8340 2503270.59 1595801.34 1.53 SOUN8342 2503267.78 1595803.04 1.73 SOUN8344 2503264.99 1595804.88 2.02 SOUN8346 2503261.53 1595807.17 2.67 SOUN8348 2503258.68 1595809.43 3.34 SOUN
Cross Section 8
Survey Point # Northing Easting Elevation Description6332 2503900.75 1599421.48 8.42 VEG6333 2503900.00 1599421.09 7.66 EW6334 2503898.44 1599420.71 5.36 GS/6335 2503891.55 1599419.31 4.47 GS/6336 2503888.86 1599419.25 4.13 GS/
Page 15

CROSS SECTION POINT LISTING ATMAUTLUAK ENGINEERING ANALYSIS
ATMAUTLUAK, ALASKA
6337 2503910.07 1599424.98 8.97 GS/6338 2503942.47 1599428.59 8.63 GS/6339 2503986.62 1599441.71 8.92 GS/6340 2504032.72 1599461.32 8.59 GS/6341 2504057.10 1599472.42 10.72 GS/6342 2504106.04 1599491.39 10.46 GS/6343 2504153.42 1599514.74 11.41 GS/6344 2504196.00 1599531.74 11.60 GS/6345 2504248.30 1599543.30 11.00 GS/6346 2504294.77 1599556.29 11.03 GS/6347 2504337.26 1599570.36 10.71 GS/6348 2503622.81 1599351.16 7.53 EW6349 2503640.03 1599357.34 6.36 GS/6350 2503652.84 1599362.10 5.72 GS/6351 2503667.66 1599365.13 4.94 GS/6352 2503679.66 1599367.69 4.82 GS/6353 2503619.38 1599351.71 7.76 GS/6354 2503610.92 1599350.09 8.06 VEG6355 2503587.66 1599339.43 8.61 GS/6356 2503543.19 1599326.57 8.88 GS/6357 2503499.73 1599315.47 8.85 GS/6358 2503462.52 1599313.39 9.50 GS/6359 2503428.44 1599319.87 9.13 GS/6360 2503389.41 1599335.28 9.33 GS/6361 2503354.02 1599317.01 8.49 GS/8190 2503682.80 1599366.41 4.84 SOUN8191 2503684.28 1599364.71 4.81 SOUN8192 2503686.97 1599363.07 4.95 SOUN8193 2503690.74 1599362.29 3.81 SOUN8194 2503695.70 1599361.97 2.60 SOUN8195 2503700.69 1599362.16 0.97 SOUN8196 2503706.24 1599362.68 0.60 SOUN8197 2503711.88 1599362.77 0.28 SOUN8198 2503718.01 1599364.90 -0.01 SOUN8199 2503724.65 1599365.13 -0.11 SOUN8200 2503730.59 1599367.09 -0.45 SOUN8201 2503736.87 1599368.56 -1.12 SOUN8202 2503743.22 1599370.50 -1.96 SOUN8203 2503749.50 1599372.52 -2.85 SOUN8204 2503755.94 1599374.25 -3.27 SOUN8205 2503762.43 1599375.88 -4.06 SOUN8206 2503768.62 1599376.49 -4.56 SOUN8207 2503775.41 1599377.40 -4.92 SOUN8208 2503781.69 1599379.03 -5.37 SOUN8209 2503788.30 1599380.75 -5.33 SOUN8210 2503794.35 1599382.64 -4.89 SOUN
Page 16

CROSS SECTION POINT LISTING ATMAUTLUAK ENGINEERING ANALYSIS
ATMAUTLUAK, ALASKA
8211 2503799.88 1599384.76 -4.52 SOUN8212 2503805.60 1599386.68 -4.11 SOUN8213 2503811.14 1599388.41 -3.70 SOUN8214 2503816.33 1599390.19 -3.47 SOUN8215 2503821.66 1599392.05 -3.09 SOUN8216 2503826.85 1599394.10 -2.88 SOUN8217 2503831.98 1599395.60 -2.33 SOUN8218 2503836.30 1599397.24 -2.02 SOUN8219 2503840.59 1599397.96 -1.82 SOUN8220 2503844.61 1599399.94 -1.66 SOUN8221 2503847.92 1599401.03 -1.37 SOUN8222 2503850.79 1599402.36 -1.24 SOUN8223 2503853.37 1599403.60 -0.96 SOUN8224 2503855.55 1599404.57 -0.71 SOUN8225 2503857.60 1599405.56 -0.39 SOUN8226 2503859.54 1599406.85 -0.10 SOUN8227 2503861.87 1599408.74 0.12 SOUN8228 2503863.77 1599410.50 0.37 SOUN8229 2503865.42 1599412.23 0.69 SOUN8230 2503867.92 1599413.23 1.11 SOUN8231 2503870.40 1599414.01 1.61 SOUN8232 2503872.91 1599414.31 2.35 SOUN8233 2503875.80 1599414.99 3.18 SOUN8234 2503878.00 1599415.71 3.49 SOUN8235 2503880.39 1599416.30 4.16 SOUN8236 2503883.14 1599416.83 3.87 SOUN8237 2503885.83 1599417.59 4.05 SOUN
Cross Section 9
Survey Point # Northing Easting Elevation Description6303 2499821.82 1600509.77 12.02 VEG6304 2499795.57 1600470.62 12.65 GS/6305 2499754.09 1600429.13 12.83 GS/6306 2499712.01 1600381.05 12.30 GS/6307 2499674.66 1600342.14 12.90 GS/6308 2499643.32 1600293.29 11.84 GS/6309 2499613.95 1600245.80 12.25 GS/6310 2499593.31 1600192.07 12.72 GS/6311 2499573.30 1600141.21 12.09 GS/6312 2499824.39 1600513.44 7.60 EW6313 2499826.32 1600516.57 5.36 GS/6314 2499828.20 1600521.55 5.16 GS/6315 2499831.99 1600527.84 4.73 GS/6316 2500036.08 1600803.37 6.46 GS/6317 2500050.87 1600832.81 6.76 GS/
Page 17
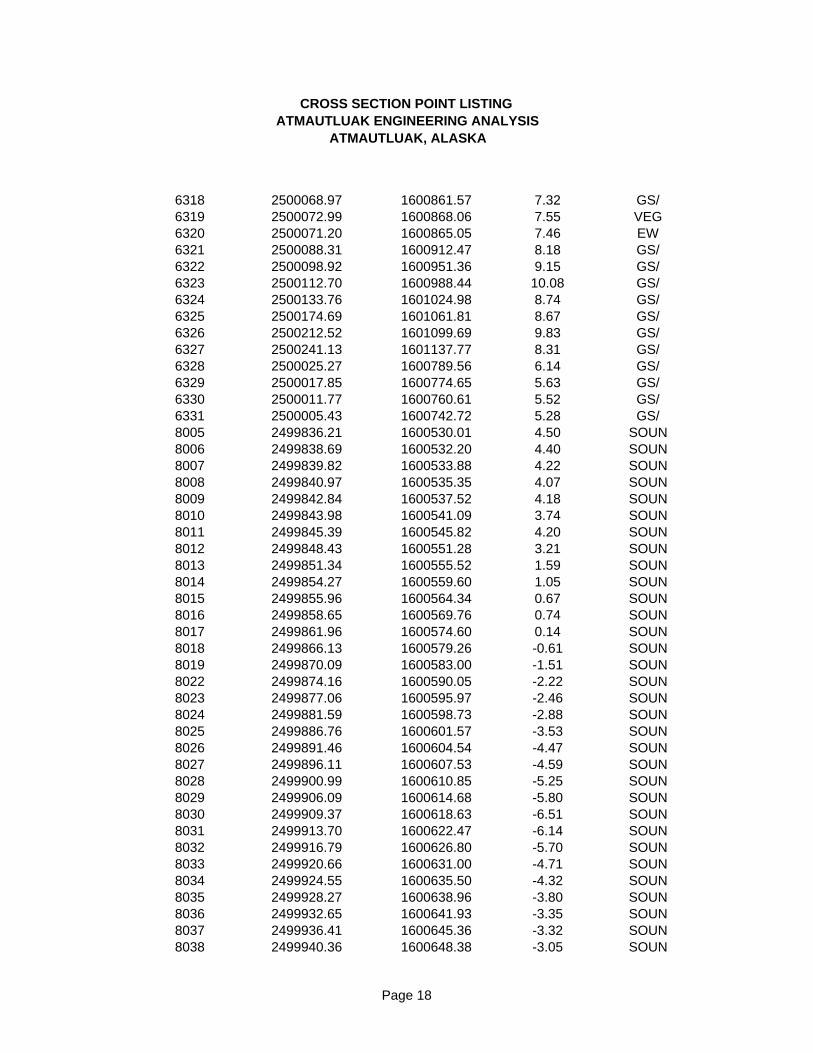
CROSS SECTION POINT LISTING ATMAUTLUAK ENGINEERING ANALYSIS
ATMAUTLUAK, ALASKA
6318 2500068.97 1600861.57 7.32 GS/6319 2500072.99 1600868.06 7.55 VEG6320 2500071.20 1600865.05 7.46 EW6321 2500088.31 1600912.47 8.18 GS/6322 2500098.92 1600951.36 9.15 GS/6323 2500112.70 1600988.44 10.08 GS/6324 2500133.76 1601024.98 8.74 GS/6325 2500174.69 1601061.81 8.67 GS/6326 2500212.52 1601099.69 9.83 GS/6327 2500241.13 1601137.77 8.31 GS/6328 2500025.27 1600789.56 6.14 GS/6329 2500017.85 1600774.65 5.63 GS/6330 2500011.77 1600760.61 5.52 GS/6331 2500005.43 1600742.72 5.28 GS/8005 2499836.21 1600530.01 4.50 SOUN8006 2499838.69 1600532.20 4.40 SOUN8007 2499839.82 1600533.88 4.22 SOUN8008 2499840.97 1600535.35 4.07 SOUN8009 2499842.84 1600537.52 4.18 SOUN8010 2499843.98 1600541.09 3.74 SOUN8011 2499845.39 1600545.82 4.20 SOUN8012 2499848.43 1600551.28 3.21 SOUN8013 2499851.34 1600555.52 1.59 SOUN8014 2499854.27 1600559.60 1.05 SOUN8015 2499855.96 1600564.34 0.67 SOUN8016 2499858.65 1600569.76 0.74 SOUN8017 2499861.96 1600574.60 0.14 SOUN8018 2499866.13 1600579.26 -0.61 SOUN8019 2499870.09 1600583.00 -1.51 SOUN8022 2499874.16 1600590.05 -2.22 SOUN8023 2499877.06 1600595.97 -2.46 SOUN8024 2499881.59 1600598.73 -2.88 SOUN8025 2499886.76 1600601.57 -3.53 SOUN8026 2499891.46 1600604.54 -4.47 SOUN8027 2499896.11 1600607.53 -4.59 SOUN8028 2499900.99 1600610.85 -5.25 SOUN8029 2499906.09 1600614.68 -5.80 SOUN8030 2499909.37 1600618.63 -6.51 SOUN8031 2499913.70 1600622.47 -6.14 SOUN8032 2499916.79 1600626.80 -5.70 SOUN8033 2499920.66 1600631.00 -4.71 SOUN8034 2499924.55 1600635.50 -4.32 SOUN8035 2499928.27 1600638.96 -3.80 SOUN8036 2499932.65 1600641.93 -3.35 SOUN8037 2499936.41 1600645.36 -3.32 SOUN8038 2499940.36 1600648.38 -3.05 SOUN
Page 18

CROSS SECTION POINT LISTING ATMAUTLUAK ENGINEERING ANALYSIS
ATMAUTLUAK, ALASKA
8039 2499943.92 1600651.72 -2.70 SOUN8040 2499946.99 1600655.59 -2.44 SOUN8041 2499950.13 1600659.71 -2.27 SOUN8042 2499952.52 1600663.72 -2.39 SOUN8043 2499954.86 1600667.67 -2.29 SOUN8044 2499957.23 1600671.98 -1.97 SOUN8045 2499959.81 1600676.36 -1.26 SOUN8046 2499961.45 1600680.96 -1.20 SOUN8047 2499964.11 1600685.13 -0.88 SOUN8048 2499966.18 1600689.65 -0.98 SOUN8049 2499969.40 1600693.52 -0.78 SOUN8050 2499972.46 1600697.92 -0.57 SOUN8051 2499976.29 1600701.82 -0.17 SOUN8052 2499977.72 1600706.94 0.53 SOUN8053 2499979.32 1600711.53 0.86 SOUN8054 2499982.58 1600715.11 1.94 SOUN8055 2499984.03 1600719.28 2.69 SOUN8056 2499986.78 1600723.42 3.36 SOUN8057 2499988.84 1600726.06 3.93 SOUN8058 2499991.02 1600728.77 4.31 SOUN8061 2499992.46 1600730.82 4.52 SOUN8062 2499994.51 1600734.59 4.52 SOUN8063 2499997.83 1600739.80 4.71 SOUN8064 2500000.08 1600743.46 4.93 SOUN
Page 19

This page intentionally left blank.

Date Measured: Thursday, August 27, 2015Discharge Measurement SummaryMeasurement Information
PartyBoat/MotorMeas. Number
Site InformationAtmautluak, AlaskaSite Name
Cross Section 1Station NumberLocation
Units
ftDistanceft/sVelocityft2AreacfsDischarge
degFTemperature
System Setup
0.00Transducer Depth (ft)0.0Salinity (ppt)0.0Magnetic Declination (deg)
System Information
RS-M9System Type3107Serial Number2.00Firmware Version3.8Software Version
Discharge Results
360.761Width (ft)1,801.634Area (ft2)
0.760Mean Speed (ft/s)1,368.653Total Q (cfs)
11.483Maximum Measured Depth
4.419Maximum Measured Speed
Discharge Calculation SettingsSloped BankLeft MethodBottom-TrackTrack ReferenceSloped BankRight MethodVertical BeamDepth ReferencePower FitTop Fit TypeENUCoordinate SystemPower FitBottom Fit Type
Measurement Results%DischargeMean Vel Distance Time Tr
MeasuredMBTotalTotalBottomMiddleTopRightLeftWaterBoatAreaWidthDMGTrackTemp.DurationTime #
77.6--1,368.653221.121,061.8384.100.001.610.7600.8411,801.634360.761327.76431.2453.80:08:3312:37:59
PMR1
77.60.0001,368.653221.121,061.8384.100.001.610.7600.8411,801.634360.761327.76431.2453.8Mean
0.00.0000.0000.000.000.000.000.000.0000.0000.0000.0000.000.000.0Std Dev
0.0000.0000.0000.0000.0000.0000.0000.0000.0000.0000.0000.0000.0000.0000.0COV
Exposure Time: 0:08:33
Tr1=20150827103721.riv;
CommentsTr1=20150827103721.riv - ;
Compass CalibrationPassed CalibrationCalibration duration = 110 secondsM10.00 = Magnetic influence is acceptableQ9 = Magnetic field is uniformH9 = Complete horizontal rotationV9 = High pitch/rollRecommendation(s):Avoid any changes to the instrument setup or its orientation to the magnetic influences detected during the compass calibration.Measurements should be made in locations with similar magnetic influences as the location of the compass calibration.
System TestSystem Test: PASS
Report generated using SonTek RiverSurveyor Live v3.8Parameters and settings marked with a * are not constant for all files.

Date Measured: Thursday, August 27, 2015Discharge Measurement SummaryMeasurement Information
PartyBoat/MotorMeas. Number
Site InformationAtmautluak, AlaskaSite Name
Cross Section 2Station NumberLocation
Units
ftDistanceft/sVelocityft2AreacfsDischarge
degFTemperature
System Setup
0.00Transducer Depth (ft)0.0Salinity (ppt)0.0Magnetic Declination (deg)
System Information
RS-M9System Type3107Serial Number2.00Firmware Version3.8Software Version
Discharge Results
259.555Width (ft)1,626.654Area (ft2)
0.876Mean Speed (ft/s)1,424.446Total Q (cfs)
14.728Maximum Measured Depth
2.326Maximum Measured Speed
Discharge Calculation SettingsSloped BankLeft MethodBottom-TrackTrack ReferenceSloped BankRight MethodVertical BeamDepth ReferencePower FitTop Fit TypeENUCoordinate SystemPower FitBottom Fit Type
Measurement Results%DischargeMean Vel Distance Time Tr
MeasuredMBTotalTotalBottomMiddleTopRightLeftWaterBoatAreaWidthDMGTrackTemp.DurationTime #
78.9--1,424.446221.331,124.3877.630.810.300.8761.1561,626.654259.555233.55267.0152.50:03:511:40:41
PMR1
78.90.0001,424.446221.331,124.3877.630.810.300.8761.1561,626.654259.555233.55267.0152.5Mean
0.00.0000.0000.000.000.000.000.000.0000.0000.0000.0000.000.000.0Std Dev
0.0000.0000.0000.0000.0000.0000.0000.0000.0000.0000.0000.0000.0000.0000.0COV
Exposure Time: 0:03:51
Tr1=20150827114003.riv;
CommentsTr1=20150827114003.riv - ;
Compass CalibrationPassed CalibrationCalibration duration = 110 secondsM10.00 = Magnetic influence is acceptableQ9 = Magnetic field is uniformH9 = Complete horizontal rotationV9 = High pitch/rollRecommendation(s):Avoid any changes to the instrument setup or its orientation to the magnetic influences detected during the compass calibration.Measurements should be made in locations with similar magnetic influences as the location of the compass calibration.
System TestSystem Test: PASS
Report generated using SonTek RiverSurveyor Live v3.8Parameters and settings marked with a * are not constant for all files.
�

Date Measured: Thursday, August 27, 2015Discharge Measurement SummaryMeasurement Information
PartyBoat/MotorMeas. Number
Site InformationAtmautluak, AlaskaSite Name
Cross Section 3Station NumberLocation
Units
ftDistanceft/sVelocityft2AreacfsDischarge
degFTemperature
System Setup
0.00Transducer Depth (ft)0.0Salinity (ppt)0.0Magnetic Declination (deg)
System Information
RS-M9System Type3107Serial Number2.00Firmware Version3.8Software Version
Discharge Results
423.904Width (ft)2,610.958Area (ft2)
0.542Mean Speed (ft/s)1,414.884Total Q (cfs)
10.564Maximum Measured Depth
5.785Maximum Measured Speed
Discharge Calculation SettingsSloped BankLeft MethodBottom-TrackTrack ReferenceSloped BankRight MethodVertical BeamDepth ReferencePower FitTop Fit TypeENUCoordinate SystemPower FitBottom Fit Type
Measurement Results%DischargeMean Vel Distance Time Tr
MeasuredMBTotalTotalBottomMiddleTopRightLeftWaterBoatAreaWidthDMGTrackTemp.DurationTime #
76.1--1,414.884243.141,076.2894.061.53-0.130.5422.0982,610.958423.904400.90451.1453.00:03:351:58:21
PMR1
76.10.0001,414.884243.141,076.2894.061.53-0.130.5422.0982,610.958423.904400.90451.1453.0Mean
0.00.0000.0000.000.000.000.000.000.0000.0000.0000.0000.000.000.0Std Dev
0.0000.0000.0000.0000.0000.0000.0000.0000.0000.0000.0000.0000.0000.0000.0COV
Exposure Time: 0:03:35
Tr1=20150827115743.riv;
CommentsTr1=20150827115743.riv - ;
Compass CalibrationPassed CalibrationCalibration duration = 110 secondsM10.00 = Magnetic influence is acceptableQ9 = Magnetic field is uniformH9 = Complete horizontal rotationV9 = High pitch/rollRecommendation(s):Avoid any changes to the instrument setup or its orientation to the magnetic influences detected during the compass calibration.Measurements should be made in locations with similar magnetic influences as the location of the compass calibration.
System TestSystem Test: PASS
Report generated using SonTek RiverSurveyor Live v3.8Parameters and settings marked with a * are not constant for all files.

Date Measured: Thursday, August 27, 2015Discharge Measurement SummaryMeasurement Information
PartyBoat/MotorMeas. Number
Site InformationAtmautluak, AlaskaSite Name
Cross Section 4Station NumberLocation
Units
ftDistanceft/sVelocityft2AreacfsDischarge
degFTemperature
System Setup
0.00Transducer Depth (ft)0.0Salinity (ppt)0.0Magnetic Declination (deg)
System Information
RS-M9System Type3107Serial Number2.00Firmware Version3.8Software Version
Discharge Results
334.859Width (ft)1,761.055Area (ft2)
0.871Mean Speed (ft/s)1,534.158Total Q (cfs)
10.564Maximum Measured Depth
4.159Maximum Measured Speed
Discharge Calculation SettingsSloped BankLeft MethodBottom-TrackTrack ReferenceSloped BankRight MethodVertical BeamDepth ReferencePower FitTop Fit TypeENUCoordinate SystemPower FitBottom Fit Type
Measurement Results%DischargeMean Vel Distance Time Tr
MeasuredMBTotalTotalBottomMiddleTopRightLeftWaterBoatAreaWidthDMGTrackTemp.DurationTime #
77.5--1,534.158240.011,189.75104.87-0.41-0.070.8711.7371,761.055334.859314.86354.4052.80:03:242:13:54
PMR3
77.50.0001,534.158240.011,189.75104.87-0.41-0.070.8711.7371,761.055334.859314.86354.4052.8Mean
0.00.0000.0000.000.000.000.000.000.0000.0000.0000.0000.000.000.0Std Dev
0.0000.0000.0000.0000.0000.0000.0000.0000.0000.0000.0000.0000.0000.0000.0COV
Exposure Time: 0:03:24
Tr3=20150827121317.riv;
CommentsTr3=20150827121317.riv - ;
Compass CalibrationPassed CalibrationCalibration duration = 110 secondsM10.00 = Magnetic influence is acceptableQ9 = Magnetic field is uniformH9 = Complete horizontal rotationV9 = High pitch/rollRecommendation(s):Avoid any changes to the instrument setup or its orientation to the magnetic influences detected during the compass calibration.Measurements should be made in locations with similar magnetic influences as the location of the compass calibration.
System TestSystem Test: PASS
Report generated using SonTek RiverSurveyor Live v3.8Parameters and settings marked with a * are not constant for all files.

Date Measured: Thursday, August 27, 2015Discharge Measurement SummaryMeasurement Information
PartyBoat/MotorMeas. Number
Site InformationAtmautluak, AlaskaSite Name
Cross Section 5Station NumberLocation
Units
ftDistanceft/sVelocityft2AreacfsDischarge
degFTemperature
System Setup
0.00Transducer Depth (ft)0.0Salinity (ppt)0.0Magnetic Declination (deg)
System Information
RS-M9System Type3107Serial Number2.00Firmware Version3.8Software Version
Discharge Results
390.317Width (ft)1,677.949Area (ft2)
0.927Mean Speed (ft/s)1,555.345Total Q (cfs)
9.354Maximum Measured Depth
5.897Maximum Measured Speed
Discharge Calculation SettingsSloped BankLeft MethodBottom-TrackTrack ReferenceSloped BankRight MethodVertical BeamDepth ReferencePower FitTop Fit TypeENUCoordinate SystemPower FitBottom Fit Type
Measurement Results%DischargeMean Vel Distance Time Tr
MeasuredMBTotalTotalBottomMiddleTopRightLeftWaterBoatAreaWidthDMGTrackTemp.DurationTime #
77.3--1,555.345241.371,203.75110.590.22-0.590.9272.0411,677.949390.317376.32461.2152.20:03:462:45:44
PMR1
77.30.0001,555.345241.371,203.75110.590.22-0.590.9272.0411,677.949390.317376.32461.2152.2Mean
0.00.0000.0000.000.000.000.000.000.0000.0000.0000.0000.000.000.0Std Dev
0.0000.0000.0000.0000.0000.0000.0000.0000.0000.0000.0000.0000.0000.0000.0COV
Exposure Time: 0:03:46
Tr1=20150827124505.riv;
CommentsTr1=20150827124505.riv - ;
Compass CalibrationPassed CalibrationCalibration duration = 110 secondsM10.00 = Magnetic influence is acceptableQ9 = Magnetic field is uniformH9 = Complete horizontal rotationV9 = High pitch/rollRecommendation(s):Avoid any changes to the instrument setup or its orientation to the magnetic influences detected during the compass calibration.Measurements should be made in locations with similar magnetic influences as the location of the compass calibration.
System TestSystem Test: PASS
Report generated using SonTek RiverSurveyor Live v3.8Parameters and settings marked with a * are not constant for all files.

Date Measured: Thursday, August 27, 2015Discharge Measurement SummaryMeasurement Information
PartyBoat/MotorMeas. Number
Site InformationAtmautluak, AlaskaSite Name
Cross Section 6Station NumberLocation
Units
ftDistanceft/sVelocityft2AreacfsDischarge
degFTemperature
System Setup
0.00Transducer Depth (ft)0.0Salinity (ppt)0.0Magnetic Declination (deg)
System Information
RS-M9System Type3107Serial Number2.00Firmware Version3.8Software Version
Discharge Results
284.474Width (ft)1,641.055Area (ft2)
-0.208Mean Speed (ft/s)-341.020Total Q (cfs)
9.301Maximum Measured Depth
3.756Maximum Measured Speed
Discharge Calculation SettingsSloped BankLeft MethodBottom-TrackTrack ReferenceSloped BankRight MethodVertical BeamDepth ReferencePower FitTop Fit TypeENUCoordinate SystemPower FitBottom Fit Type
Measurement Results%DischargeMean Vel Distance Time Tr
MeasuredMBTotalTotalBottomMiddleTopRightLeftWaterBoatAreaWidthDMGTrackTemp.DurationTime #
78.7---
341.020-52.92-268.69-
19.540.140.00-0.2081.1691,641.055284.474278.97378.6551.90:05:244:27:02
PMR1
78.70.000-
341.020-52.92-268.69-
19.540.140.00-0.2081.1691,641.055284.474278.97378.6551.9Mean
0.00.0000.0000.000.000.000.000.000.0000.0000.0000.0000.000.000.0Std Dev
0.0000.0000.0000.0000.0000.0000.0000.0000.0000.0000.0000.0000.0000.0000.0COV
Exposure Time: 0:05:24
Tr1=20150827142623.riv;
CommentsTr1=20150827142623.riv - ;
Compass CalibrationPassed CalibrationCalibration duration = 110 secondsM10.00 = Magnetic influence is acceptableQ9 = Magnetic field is uniformH9 = Complete horizontal rotationV9 = High pitch/rollRecommendation(s):Avoid any changes to the instrument setup or its orientation to the magnetic influences detected during the compass calibration.Measurements should be made in locations with similar magnetic influences as the location of the compass calibration.
System TestSystem Test: PASS
Report generated using SonTek RiverSurveyor Live v3.8Parameters and settings marked with a * are not constant for all files.
w

Date Measured: Thursday, August 27, 2015Discharge Measurement SummaryMeasurement Information
PartyBoat/MotorMeas. Number
Site InformationAtmautluak, AlaskaSite Name
Cross Section 7Station NumberLocation
Units
ftDistanceft/sVelocityft2AreacfsDischarge
degFTemperature
System Setup
0.00Transducer Depth (ft)0.0Salinity (ppt)0.0Magnetic Declination (deg)
System Information
RS-M9System Type3107Serial Number2.00Firmware Version3.8Software Version
Discharge Results
369.984Width (ft)1,855.877Area (ft2)
-0.702Mean Speed (ft/s)-
1,303.452Total Q (cfs)
10.876Maximum Measured Depth
3.819Maximum Measured Speed
Discharge Calculation SettingsSloped BankLeft MethodBottom-TrackTrack ReferenceVertical BankRight MethodVertical BeamDepth ReferencePower FitTop Fit TypeENUCoordinate SystemPower FitBottom Fit Type
Measurement Results%DischargeMean Vel Distance Time Tr
MeasuredMBTotalTotalBottomMiddleTopRightLeftWaterBoatAreaWidthDMGTrackTemp.DurationTime #
78.8---
1,303.452-189.92-1,027.02-
85.45-0.99-0.08-0.7020.5451,855.877369.984359.48388.9252.90:11:534:58:55
PML2
78.80.000-
1,303.452-189.92-1,027.02-
85.45-0.99-0.08-0.7020.5451,855.877369.984359.48388.9252.9Mean
0.00.0000.0000.000.000.000.000.000.0000.0000.0000.0000.000.000.0Std Dev
0.0000.0000.0000.0000.0000.0000.0000.0000.0000.0000.0000.0000.0000.0000.0COV
Exposure Time: 0:11:53
Tr2=20150827145817.riv;
CommentsTr2=20150827145817.riv - ;
Compass CalibrationPassed CalibrationCalibration duration = 110 secondsM10.00 = Magnetic influence is acceptableQ9 = Magnetic field is uniformH9 = Complete horizontal rotationV9 = High pitch/rollRecommendation(s):Avoid any changes to the instrument setup or its orientation to the magnetic influences detected during the compass calibration.Measurements should be made in locations with similar magnetic influences as the location of the compass calibration.
System TestSystem Test: PASS
Report generated using SonTek RiverSurveyor Live v3.8Parameters and settings marked with a * are not constant for all files.

Date Measured: Thursday, August 27, 2015Discharge Measurement SummaryMeasurement Information
PartyBoat/MotorMeas. Number
Site InformationAtmautluak, AlaskaSite Name
Cross Section 8Station NumberLocation
Units
ftDistanceft/sVelocityft2AreacfsDischarge
degFTemperature
System Setup
0.00Transducer Depth (ft)0.0Salinity (ppt)0.0Magnetic Declination (deg)
System Information
RS-M9System Type3107Serial Number2.00Firmware Version3.8Software Version
Discharge Results
264.064Width (ft)1,772.716Area (ft2)
-0.711Mean Speed (ft/s)-
1,260.813Total Q (cfs)
12.172Maximum Measured Depth
6.252Maximum Measured Speed
Discharge Calculation SettingsSloped BankLeft MethodBottom-TrackTrack ReferenceSloped BankRight MethodVertical BeamDepth ReferencePower FitTop Fit TypeENUCoordinate SystemPower FitBottom Fit Type
Measurement Results%DischargeMean Vel Distance Time Tr
MeasuredMBTotalTotalBottomMiddleTopRightLeftWaterBoatAreaWidthDMGTrackTemp.DurationTime #
79.5---
1,260.813-184.55-1,002.44-
73.900.000.08-0.7111.0771,772.716264.064241.06318.6753.80:04:565:23:53
PMR5
79.50.000-
1,260.813-184.55-1,002.44-
73.900.000.08-0.7111.0771,772.716264.064241.06318.6753.8Mean
0.00.0000.0000.000.000.000.000.000.0000.0000.0000.0000.000.000.0Std Dev
0.0000.0000.0000.0000.0000.0000.0000.0000.0000.0000.0000.0000.0000.0000.0COV
Exposure Time: 0:04:56
Tr5=20150827152314.riv;
CommentsTr5=20150827152314.riv - ;
Compass CalibrationPassed CalibrationCalibration duration = 110 secondsM10.00 = Magnetic influence is acceptableQ9 = Magnetic field is uniformH9 = Complete horizontal rotationV9 = High pitch/rollRecommendation(s):Avoid any changes to the instrument setup or its orientation to the magnetic influences detected during the compass calibration.Measurements should be made in locations with similar magnetic influences as the location of the compass calibration.
System TestSystem Test: PASS
Report generated using SonTek RiverSurveyor Live v3.8Parameters and settings marked with a * are not constant for all files.

Date Measured: Thursday, August 27, 2015Discharge Measurement SummaryMeasurement Information
PartyBoat/MotorMeas. Number
Site InformationAtmautluak, AlaskaSite Name
Cross Section 9Station NumberLocation
Units
ftDistanceft/sVelocityft2AreacfsDischarge
degFTemperature
System Setup
0.00Transducer Depth (ft)0.0Salinity (ppt)0.0Magnetic Declination (deg)
System Information
RS-M9System Type3107Serial Number2.00Firmware Version3.8Software Version
Discharge Results
362.495Width (ft)2,056.523Area (ft2)
-0.800Mean Speed (ft/s)-
1,644.357Total Q (cfs)
13.205Maximum Measured Depth
6.778Maximum Measured Speed
Discharge Calculation SettingsSloped BankLeft MethodBottom-TrackTrack ReferenceVertical BankRight MethodVertical BeamDepth ReferencePower FitTop Fit TypeENUCoordinate SystemPower FitBottom Fit Type
Measurement Results%DischargeMean Vel Distance Time Tr
MeasuredMBTotalTotalBottomMiddleTopRightLeftWaterBoatAreaWidthDMGTrackTemp.DurationTime #
77.1---
1,644.357-270.58-1,267.83-
105.20-0.51-0.23-0.8001.4902,056.523362.495339.49385.8653.50:04:195:42:52
PMR5
77.10.000-
1,644.357-270.58-1,267.83-
105.20-0.51-0.23-0.8001.4902,056.523362.495339.49385.8653.5Mean
0.00.0000.0000.000.000.000.000.000.0000.0000.0000.0000.000.000.0Std Dev
0.0000.0000.0000.0000.0000.0000.0000.0000.0000.0000.0000.0000.0000.0000.0COV
Exposure Time: 0:04:19
Tr5=20150827154214.riv;
CommentsTr5=20150827154214.riv - ;
Compass CalibrationPassed CalibrationCalibration duration = 110 secondsM10.00 = Magnetic influence is acceptableQ9 = Magnetic field is uniformH9 = Complete horizontal rotationV9 = High pitch/rollRecommendation(s):Avoid any changes to the instrument setup or its orientation to the magnetic influences detected during the compass calibration.Measurements should be made in locations with similar magnetic influences as the location of the compass calibration.
System TestSystem Test: PASS
Report generated using SonTek RiverSurveyor Live v3.8Parameters and settings marked with a * are not constant for all files.