appendix a oxford study
TRANSCRIPT

APPENDIX A
OXFORD STUDY
A-1
Oxford Study
This appendix describes the results from the single-site field test at the Oxford, Ohio NDAMN location. Data are included for the following:
• Physical/chemical parameter testing on soils from 25 individual sampling points (top 0-5 cm).
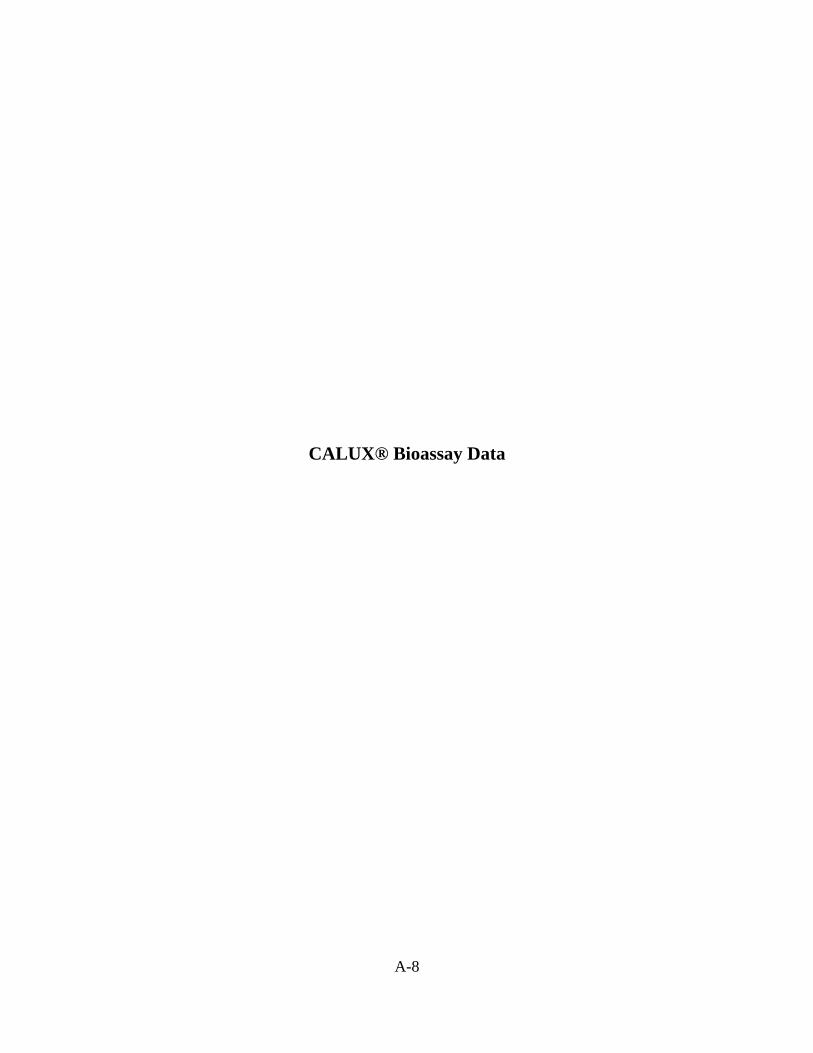
• CALUX® bioassay TEQ results for soils from 25 individual sampling points (top 0-5 cm) as well as duplicate analysis of one composite made from equivalent portions of the top 0-5 cm from all 25 locations (Oxford-Comp-T) and duplicate analysis of one composite made from equivalent portions of the bottom 5-10 cm from all 25 sampling locations (Oxford- Comp-B), plus results for one field blank, one trip blank, and one equipment blank. The CALUX® bioassay TEQ results from 25 individual samples from the Oxford, Ohio location were evaluated statistically to determine the minimum number of samples that should be collected at an uncontaminated sampling location to ensure a representative sampling for the remainder of the sampling locations planned for a pilot survey of dioxins in soil. Results of this statistical analysis are included with the CALUX® data.
• Mercury determination of duplicate analysis of Oxford-Comp-T and duplicate analysis of Oxford-Comp-B.
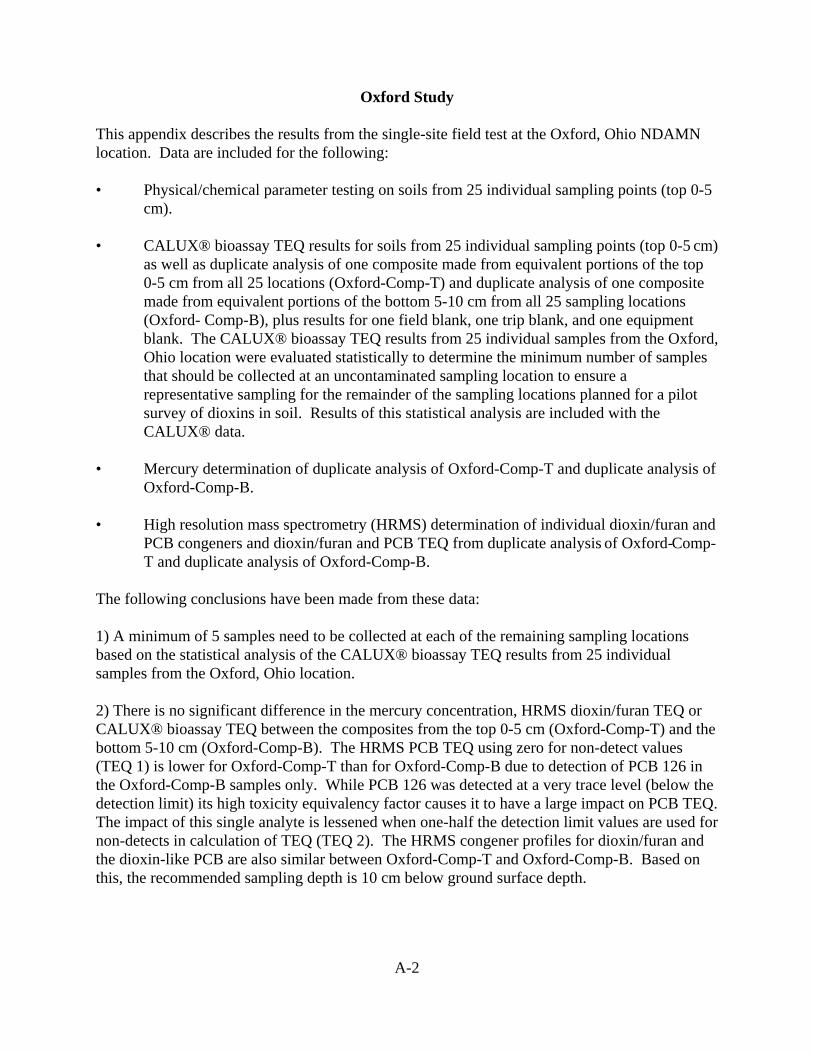
• High resolution mass spectrometry (HRMS) determination of individual dioxin/furan and PCB congeners and dioxin/furan and PCB TEQ from duplicate analysis of Oxford-Comp-T and duplicate analysis of Oxford-Comp-B.
The following conclusions have been made from these data:
1) A minimum of 5 samples need to be collected at each of the remaining sampling locations based on the statistical analysis of the CALUX® bioassay TEQ results from 25 individual samples from the Oxford, Ohio location.
2) There is no significant difference in the mercury concentration, HRMS dioxin/furan TEQ or CALUX® bioassay TEQ between the composites from the top 0-5 cm (Oxford-Comp-T) and the bottom 5-10 cm (Oxford-Comp-B). The HRMS PCB TEQ using zero for non-detect values (TEQ 1) is lower for Oxford-Comp-T than for Oxford-Comp-B due to detection of PCB 126 in the Oxford-Comp-B samples only. While PCB 126 was detected at a very trace level (below the detection limit) its high toxicity equivalency factor causes it to have a large impact on PCB TEQ. The impact of this single analyte is lessened when one-half the detection limit values are used for non-detects in calculation of TEQ (TEQ 2). The HRMS congener profiles for dioxin/furan and the dioxin-like PCB are also similar between Oxford-Comp-T and Oxford-Comp-B. Based on this, the recommended sampling depth is 10 cm below ground surface depth.
A-2

Table 1. Data Summary from Oxford-Comp-T and Oxford-Comp-B Hg (mg/Kg dry)
HRMS Dioxin/Furan (pg TEQ 1/g dry)
HRMS Dioxin/Furan (pg TEQ 2/g dry)
HRMS PCB (pg TEQ 1 /g dry)
HRMS PCB (pg TEQ 2 /g dry)
CALUX® Bioassay (pg TEQ/g dry)
Oxford-Comp-T <0.050 0.150 3.61 0.017 0.108 1.66
Oxford-Comp-T duplicate
0.077 0.160 4.02 0.011 0.112 2.16
Oxford-Comp-B 0.051 0.155 3.68 0.125 0.134 1.66
Oxford-Comp-B duplicate
0.059 0.170 3.76 0.131 0.140 2.15
TEQ 1 = zero used for non-detects TEQ 2 = one-half the detection limit used for non-detects
A-3
A-4

3) The average CALUX® TEQ for samples collected within the 100 x 100 ft grid (Oxford -1-T through Oxford-21-T) was 2.39 pg TEQ/g dry versus an average of 2.49 pg TEQ/g dry for the four samples representing a 1000 x 1000 ft grid (Oxford-22-T through Oxford-25-T). Based on this, while it is still recommended for samplers to try to obtain all samples within a 100 x 100 ft grid, this may be expanded to 1000 x 1000 ft if necessary to find undisturbed sampling locations without compromising the samples being representative of the site.
A-5

PHYSICAL/CHEMICAL PARAMETER DATA
A-6

Sample ID Moisture Content (%)
Grain Size Distribution pH
TOC %Finer #4
Sieve % Finer
#200 Sieve % Finer
0.005mm Result (mg/kg)
Reporting Limit (mg/kg)
Oxford-1-T 40.9 100.0 86.7 22.9 5.3 22,400 990 Oxford-2-T 41.7 100.0 86.7 24.3 5.3 23,600 990 Oxford-3-T 22.3 98.7 84.9 39.9 7.6 14,600 962 Oxford-4-T 33.4 100.0 84.8 29.6 6.8 24,900 971 Oxford-5-T 30.9 100.0 80.8 23.6 6.3 31,700 988 Oxford-6-T 28.2 99.5 79.4 30.5 7.4 15,400 943 Oxford-7-T 35.7 100.0 84.6 28.2 6.7 21,400 971 Oxford-8-T 38.7 100.0 87.2 25.8 6.2 21,400 962 Oxford-9-T 29.8 98.2 82.8 26.6 6.2 22,600 980 Oxford-10-T 37.0 100.0 86.1 22.6 6.3 24,000 990 Oxford-11-T 41.0 100.0 83.5 22.1 7.1 32,100 1,000 Oxford-12-T 37.5 100.0 79.2 28.4 7.3 25,800 1,000 Oxford-13-T 54.5 100.0 87.0 27.1 5.7 25,200 990 Oxford-14-T 30.5 98.6 75.1 23.6 7.4 26,200 971 Oxford-15-T 41.9 100.0 84.5 22.8 6.7 21,900 952 Oxford-16-T 41.5 100.0 82.3 23.9 7.2 27,800 980 Oxford-17-T 35.8 100.0 87.8 26.7 6.0 22,800 990 Oxford-18-T 42.8 100.0 86.1 26.7 6.7 22,200 990 Oxford-19-T 44.5 100.0 84.8 24.4 6.8 21,800 990 Oxford-20-T 34.9 100.0 89.7 25.5 6.1 27,000 330 Oxford-21-T 24.8 100.0 89.1 24.2 6.2 27,100 1,000 Oxford-22-T 13.3 97.9 68.8 24.3 7.9 11,100 990 Oxford-23-T 27.5 100.0 80.7 25.0 7.3 18,400 971 Oxford-24-T 33.2 100.0 91.1 20.2 7.4 23,300 971 Oxford-25-T 19.2 100.0 85.4 26.3 6.4 10,100 498
A-7
CALUX® Bioassay Data
A-8

CALUX QC Sample Summaries
Method Blanks Sample Batch # pg/g mean std dev
B8-82-35 0.311 0.33 0.03 B8-82-36 0.347 B8-82-37 1.219 DBQ 0.96 ratio
B8-82A-32 0.668 0.50 0.11 B8-82A-33 0.502 B8-82A-34 0.419 B8-82A-35 0.430
B8-82B-26 0.490 0.35 0.13 B8-82B-27 0.242 B8-82B-28 0.333
B8-82C-6 0.663 0.58 0.05 B8-82C-7 0.572 B8-82C-8 0.537 B8-82C-9 0.565
Surrogate Spike Sample Batch #
CPM Spiked
CPM Recovered % Recovery
82-34 1984.5 1313.5 66% B8-32A-31 2061 1395 68% B8-82B-25 2002.5 1480.5 74% B8-82C-5 2384.5 1469 62%
CPM: Counts per minute of 14C TCDD recovered
XDS Solid QC Sample Batch # pg/g mean std dev
B8-82 16.86 13.28 3.28 B8-82A 10.43 B8-82B 12.56
Matrix Spikes Sample Batch # pg/g
Spike sample minus sample pg % Recovery
B8-82-29 3.513 2.523 63% B8-82-30 0.990 Matrix spike 4.015 B8-82A-29 3.304 2.569 69% B8-82A-30 0.735 Matrix spike 3.746 B8-82B-19 3.620 2.540 61% B8-82B-20 1.080 B8-82B-21 4.276 3.436 82% B8-82B-22 0.840 Matrix spike 4.192 B8-82C-4 4.985 3.498 93% B8-82C-1 1.487 Matrix spike 3.746
Lab Control Spike Sample Batch #
pg/g minus blank % Recovery
B8-82-32 2.309 57% B8-82-33 2.863 71% LCS control 4.015 B8-82A-30 2.905 78% LCS control 3.746 B8-82B-24 3.440 82% LCS control 4.192
A-9
CALUX Sample Summary
XDS ID #
Client ID #
Sample Aliquot
TEQ-ppt (wet weight) PCDD / PCDF
TEQ-ppt (dry weight) PCDD / PCDF
Percent Moisture
A02868 Oxford -1-T 2g 1.92 ± 0.19 2.75 ± 0.28 31% A02869 Oxford -2-T 2g 1.73 ± 0.45 2.31 ± 0.61 26% A02870 Oxford -3-T 2g 1.09 ± 0.21 1.31 ± 0.25 18% A02871 Oxford -4-T 2g 1.28 ± 0.35 1.64 ± 0.45 23% A02872 Oxford -5-T 2g 2.86 ± 0.86 3.69 ± 1.12 23% A02873 Oxford -6-T 2g 0.87 ± 0.20 1.11 ± 0.26 23% A02874 Oxford -7-T 2g 1.40 ± 0.10 1.89 ± 0.14 27% A02875 Oxford -8-T 2g 1.38 ± 0.05 1.91 ± 0.07 29% A02876 Oxford -9-T 2g 1.25 ± 0.25 1.58 ± 0.32 22% A02877 Oxford -10-T 2g 2.67 ± 0.42 3.68 ± 0.59 28% A02878 Oxford -11(sd)-T 2g 2.07 ± 0.36 3.02 ± 0.51 30% A02879 Oxford -12-T 2g 1.31 ± 0.28 1.80 ± 0.37 25% A02880 Oxford -13-T 2g 2.72 ± 0.72 4.20 ± 1.05 33% A02881 Oxford -14-T 2g 1.29 ± 0.17 1.74 ± 0.23 23% A02882 Oxford -15-T 2g 1.30 ± 0.21 1.98 ± 0.32 32% A02883 Oxford -16-T 2g 1.34 ± 0.60 1.97 ± 0.86 30% A02884 Oxford -17-T 2g 2.36 ± 0.50 3.25 ± 0.67 26% A02885 Oxford -18-T 2g 1.60 ± 0.19 2.35 ± 0.28 30% A02886 Oxford -19-T 2g 1.30 ± 0.29 1.82 ± 0.40 26% A02887 Oxford -20-T 2g 2.81 ± 0.38 3.78 ± 0.49 25% A02888 Oxford -21-T 2g 1.88 ± 0.26 2.32 ± 0.32 19% A02889 Oxford -22-T 2g 2.99 ± 0.49 3.35 ± 0.55 11% A02890 Oxford -23-T 2g 0.83 ± 0.10 1.07 ± 0.13 22% A02891 Oxford -24-T 2g 3.18 ± 0.10 4.30 ± 0.13 26% A02892 Oxford -25-T 2g 1.04 ± 0.003 1.24 ± 0.00 16% A02893 Oxford - TB - 5 2g ND<0.26 N/A N/A A02894 Oxford - FB - 2 2g ND<0.26 N/A N/A A02895 Oxford - ER - 1 356ml ND <0.05 N/A N/A A02896 Oxford - Comp-B 2g 1.33 ± 0.27 1.63 ± 0.34 20% A02897 Oxford - Comp-B-DUP 2g 1.75 ± 0.37 2.01 ± 0.49 19% A02898 Oxford - Comp-T-DUP 2g 1.59 ± 0.002 2.01 ± 0.49 26% A02899 Oxford - Comp-T 2g 1.26 ± 0.26 1.62 ± 0.34 24% A02900 Oxford - 1MS-T 2g 1.97 ± 0.06 2.80 ± 0.05 30% A02901 Oxford - 11DUP-T 2g 1.02 ± 0.05 1.42 ± 0.07 28% A02902 Oxford - 14MS-T 2g 0.95 ± 0.49 1.12 ± 0.74 21%
A-10

Statistical Analysis of CALUX® Bioassay TEQ Data
The twenty-five individual top 0-5 cm soil samples had a mean of 2.386 TEQ - ppt (dry weight basis) and a standard deviation of 0.979 TEQ - ppt (dy weight basis). The analysis described below assumes that the variability at the other NDAMN sites will be similar to this site. In particular, it is assumed that soil samples will vary as described by a normal distribution with a site-specific mean and a standard deviation that is proportional to that mean.
0 0.5 1 1.5 2 2.5 3 3.5 4 4.5 2
0
2
4
6
Mea
sure
d Q
uant
ile (T
EQ
-ppt
)
Q-Q Plot and 95% Confidence Region
Normal Distribution Quantile (TEQ-ppt)
Figure 1. A Quantile-Quantile Plot of the CALUX ® Bioassay TEQ data with an Approximate 95 Percent Confidence Region.
While the proportionality assumption cannot be verified with data from one site, it is a reasonable starting assumption. The normality assumption can be checked for this site. A standard check is to plot the quantiles of the observed data against the quantiles of a normal distribution with the same mean and standard deviation. If the data are distributed according to a normal distribution, then the plot should be approximately straight. Figure 1 shows a Quantile-Quantile (Q-Q) plot of the data along with an approximate 95% confidence region for the plot. The approximate confidence region shows the boundaries from generating data sets of 25 points drawn from a normal distribution with the same mean and standard deviation as the soil data. There are no major departures from the normality assumption (a straight line). Hence normal distribution theory can be used.
A-11
Relative Standard Error of the Mean 50
40
30
20
Perc
ent o
f the
Mea
n
10
0 0 5 10 15 20 25
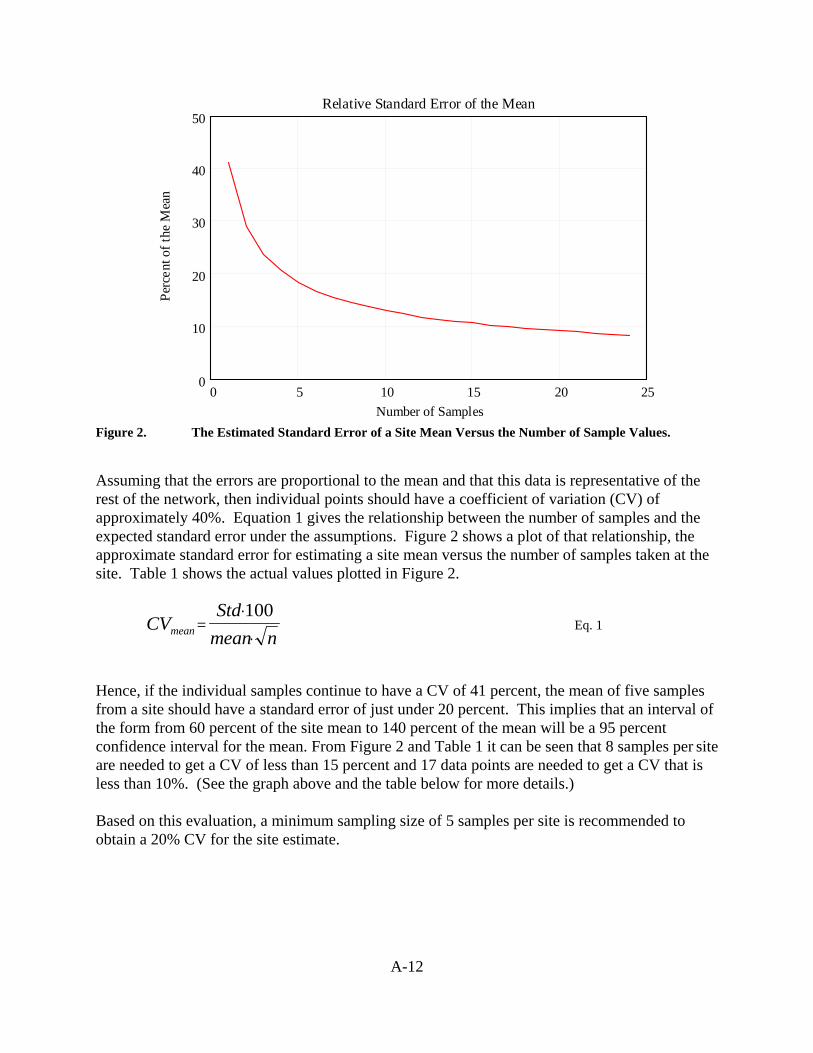
Number of Samples Figure 2. The Estimated Standard Error of a Site Mean Versus the Number of Sample Values.
Assuming that the errors are proportional to the mean and that this data is representative of the rest of the network, then individual points should have a coefficient of variation (CV) of approximately 40%. Equation 1 gives the relationship between the number of samples and the expected standard error under the assumptions. Figure 2 shows a plot of that relationship, the approximate standard error for estimating a site mean versus the number of samples taken at the site. Table 1 shows the actual values plotted in Figure 2.
Std ⋅100CVmean =
mean ⋅ n Eq. 1
Hence, if the individual samples continue to have a CV of 41 percent, the mean of five samples from a site should have a standard error of just under 20 percent. This implies that an interval of the form from 60 percent of the site mean to 140 percent of the mean will be a 95 percent confidence interval for the mean. From Figure 2 and Table 1 it can be seen that 8 samples per site are needed to get a CV of less than 15 percent and 17 data points are needed to get a CV that is less than 10%. (See the graph above and the table below for more details.)
Based on this evaluation, a minimum sampling size of 5 samples per site is recommended to obtain a 20% CV for the site estimate.
A-12

Table 1. Estimated Standard Errors of a Site Mean
Sample Size Estimated Standard Error of the Mean
1 41.0%
2 29.0%
3 23.7%
4 20.5%
5 18.3%
6 16.7%
7 15.5%
8 14.5%
9 13.7%
10 13.0%
11 12.4%
12 11.8%
13 11.4%
14 11.0%
15 10.6%
16 10.3%
17 9.9%
18 9.7%
19 9.4%
20 9.2%
A-13

Mercury Data
A-14

Mercury Analysis Results
ug/L
Wet Weight
(g) % Solids
Dry Weight
(g)
Final Volume
(L)
Hg (mg/Kg
dry)
CCB 0.00 CCV 5.0 ug/L 5.20
104%
Reagent Blank 0.00 Method Blank <0.2 0.48 100.00% 0.48 0.1 <0.042
Spiked Method Blank (2.0ug/L) 2.30 0.47 100.00% 0.47 0.1 0.489 Spike Concentration 2.00 0.47 100.00% 0.47 0.1 0.426 Percent Spike Recovery 115%
SRM 1944 1 15.70 0.4500 98.75% 0.44 0.1 3.53 Percent Recovery 104% Percent Difference 3.9%
SRM 1944 2 9.20 0.2600 98.75% 0.26 0.1 3.58 Percent Recovery 105% Percent Difference 5.4%
Comp B 0.20 0.48 81.47% 0.39 0.1 0.051 Comp B Duplicate 0.30 0.62 81.47% 0.51 0.1 0.059 Comp T 0.20 0.52 76.25% 0.40 0.1 <0.050 Comp T Duplicate 0.30 0.51 76.25% 0.39 0.1 0.077
Comp T Spike 2.30 0.51 76.25% 0.39 0.1 0.591 Spike Concentration 2.00 0.51 76.25% 0.39 0.1 0.514 Percent Spike Recovery 115%
A-15

B-1
APPENDIX B
CALUX PAPER
This paper has been reprinted from the website:
http://www.dioxins.com/pages/Publicationstechnical.shtml
with the permission of Xenobiotic Detection Systems, 1601 East Geer Street, Suite S, Durham,NC 27704, USA. (Downloaded on November 16, 2005.)

Analysis of Soil Samples from a Hazardous Waste Site: Comparison of CALUX® Bioassay TEQ Determinations with High Resolution GC/MS
George C. Clark1, Michael S. Denison2, Richard W. Morris3, Michael Chu1, Andrew Chu1, and David J. Brown1 1 Xenobiotic Detection Systems, 1601 East Geer Street, Suite S, Durham, NC 27704, USA 2 Department of Environmental Toxicology, Meyer Hall, University of California, Davis, CA 3 Analytical Sciences Inc., 2605 Meridian Parkway, Suite 200, Durham, NC 27713, USA Introduction Remediation of hazardous material contaminated sites requires analysis of levels of dioxin-like chemicals that are potentially important contaminants of these areas. Traditionally high-resolution gas chromatography/mass spectrometry (HRGC/MS) has been used to detect the presence of dioxin-like chemicals. This is a complex, expensive and time consuming method based on measuring the concentrations of 17 individual chlorinated dioxin and furan congeners that are considered toxic. To estimate a Toxic Equivalency (TEQ), the individual concentrations of each toxic congener is multiplied by a Toxic Equivalency Factor (TEF) and these determinations summed to produce a TEQ Determination. This TEQ determination provides an estimate of the potential toxicity of the sample for risk assessment purposes. A rapid, less expensive and more easily performed method of estimating TEQ determinations would aid in remediation efforts of hazardous waste sites.
Xenobiotic Detection Systems, Inc. (XDS) has developed a cellular bioassay based on the mechanism of toxicity of dioxin for estimating TEQ contamination with dioxin-like chemicals. This system has been developed with a rapid method of sample extraction and processing and application of the extract to living cells that respond to dioxin-like chemicals. The cell bioassay is depicted in Figure1; it utilizes a recombinant cell line with a stably integrated AhR-responsive luciferase reporter gene. Exposure of this Chemically Activated Luciferase Expression (CALUX®) bioassay to extracts containing 2,3,7,8-tetrachlorodibenzo-p-dioxin (TCDD) and/or related halogenated aromatic hydrocarbons produces the enzyme luciferase in a time, dose and chemical specific manner. Luciferase activity is determined by measuring light emitted and is directly proportional to the amount of dioxin-like chemicals within the test sample.

Figure 1. Schematic representation of the cellular processes involved in the CALUX® bioassay.
We participated in a double-blind study to compare the results of TEQ determinations for soil samples from a hazardous material remediation area measured by the CALUX® bioassay and HRGC/MS. Here we report the results of this double blind validation study.
Materials and Methods
A corporation under contract from the US Environmental Protection Agency collected soil samples from a hazardous material remediation site. These samples were sent to an independent laboratory for HRGC/MS analysis of TEQ contamination. The laboratory sent an aliquot of each soil to XDS for CALUX® determination. Results of HRGC/MS analysis and CALUX® bioassayresults were sent to an independent statistician (Richard W. Morris, Analytical Sciences, Inc.) so that a double-blind format was maintained. After all results were reported comparison of the results was performed.

HRGC/MS. Sediment and ash samples were spiked with 13C12-labeled PCDD/PCDF standards and analyzed for congener-specific PCDD/PCDFs at the corporation’s lab using EPA Method 8290. I-TEQs for PCDDs/PCDFs were calculated using TEF values from the World Health Organization1.
CALUX® bioassay. XDS has a patented genetically engineered cell line (mouse hepatoma H1L6.1) that contains the gene for firefly luciferase under transactivational control of the arylhydrocarbon receptor2. This cell line can be used for the detection and relative quantificatation of a sample’s total dioxin I-TEQ. Using a patent pending sample processing procedure it is also possible to use the CALUX® assay to estimate the I-TEQ contributions of PCDDs/PCDFs or theI-TEQ contributions of the coplanar PCBs3. The assay that uses this cell line is called theChemically-Activated Luciferase Expression or CALUX® assay.
The samples were extracted using a modification of the EPA 8290 extraction method4. Briefly, the dried samples were ground and one gram aliquots were placed in solvent cleaned glass vials with PTFE lined caps. The sample was extracted with a 20% solution of methanol in toluenethen twice with toluene. During each extraction step the samples were incubated in an ultrasonic water bath. The three extracts from each sample were filtered, pooled and concentrated by vacuum centrifugation. The sample extract was suspended in hexane and prepared for the bioassay by a patent pending clean up method3. The eluate from the clean up method was concentrated under vacuum into dimethyl sulfoxide (DMSO). The DMSO solution was used to dose the genetically engineered cells in the CALUX® bioassay. Prior to dosing cells, the sample extracts in DMSO were suspended in cell culture medium. This medium was then used to expose monolayers of the H1L6.1 cell line grown in 96 well culture plates. In addition to the samples, a standard curve of 2,3,7,8-tetrachlorodibenzo-p-dioxin (TCDD) was assayed (500, 250, 125, 62.5, 31.2, 15.6, 7.8, 3.9, 1.9, and 1.0 parts per trillion (ppt) TCDD). The plates were incubated for a time to produce optimal expression of the luciferase activity in a humidified CO2 incubator. Following incubation, the medium was removed and the cells were examined microscopically for viability. The induction of luciferase activity was quantified using the luciferase assay kit from Promega.
Results and Discussion
A double-blind format comparison was made of TEQ determinations with dioxin-like chemicals in soil samples with the CALUX bioassay versus HRGC/MS. The two methods were highly correlated (R2 = 0.9815). Figure 2 depicts a dot plot comparing results from the two assays.

Figure 2. Correlation of CALUX® bioassay determination of TEQ versus HRGC/MS TEQ determinations in soil samples from a hazardous waste site. The study was performed with the corporation by contract with the US Environmental Protection Agency in a double blind format to compare measurements of TEQ contamination in soil samples by the CALUX® bioassay versus HRGC/MS. Results of both analytical procedures correlate highly (R2 = 0.9815).
These data demonstrate that the CALUX bioassay system provides a sensitive and less expensive system to rapidly evaluate remediation efforts of soils contaminated with dioxin-like chemicals. We are currently investigating if our analysis system can be modified into a kit format in which it could be used in the field to investigate contamination of remediation sites. This would be particularly valuable in that delays in receiving data can be a major cost factor in remediation of these hazardous sites.
References 1. Van den Berg, M., Birnbaum, L., Bosveld, A., Brunström, B., Cook, P., Feeley, M., Giesy, J.,
Hanberg, A., Hasegawa, R., Kennedy, S., Kubiak, T., Larsen, J., Van Leeuwen, R., Djien Liem, A., Nolt, C., Peterson, R., Poellinger, L., Safe, S., Schrenk, D., Tillitt, D., Tysklind, M., Younes, M., Waern, F., and Zacharewski, T. (1998) Environ. Health Perspec. 106, 775.
2. Denison, M., Brouwer, A. and Clark, G. (1998). U.S. patent # 5,854,010. 3. Chu, M. and Clark, G. (2000). Patent application submitted. 4. US EPA Method 8290, September 1994. Acknowledgements The National Institutes of Environmental Health Sciences Grant (R44ES08372-02) supported portions of this research work. The authors would like to acknowledge the contributions of Bill Coakley of the US Environmental Protection Agencies Environmental Response Team in completing this research work. CALUX® is a registered U.S. Trademark.
APPENDIX C
SAMPLING PROTOCOL AND STANDARD OPERATINGPROCEDURE FOR DIOXINS IN SURFACE SOIL
C-1

SAMPLING PROTOCOL
for
DIOXINS IN SURFACE SOILS
Contract No.: 68-W-99-033Work Assignment 5-11
Prepared for:
U.S. EPANational Center for Environmental Assessment
Office of Research and DevelopmentWashington, DC 20460
Prepared by:
Battelle505 King Avenue
Columbus, Ohio 43201
August 26, 2003
C-2
Sampling Protocol for Dioxins in Surface Soils Version 1.0
August 26, 2003
CONTENTS
FIGURES TABLES ATTACHMENTS ABBREVIATIONS AND ACRONYMS
1.0: INTRODUCTION1.1 Objective1.2 Background of Dioxin Source and Fate
2.0: SAMPLING PROCEDURES2.1 Sampling Strategy
2.1.1 Sampling Location2.1.2 Sampling Depth2.1.3 Sample Number2.1.4 Sample Quantity
2.2 Sampling Equipment2.3 Sample Collection2.4 Long-Term Archiving of Samples
3.0: FIELD SAMPLING QUALITY ASSURANCE3.1 Field Quality Control Samples
3.1.1 Equipment Rinsate Blanks3.1.2 Trip Blanks3.1.3 Field Blanks3.1.4 Temperature Blanks
3.2 Sample Handling and Custody3.2.1 Sample Containers, Preservation and Holding Time3.2.2 Sample Identification3.2.3 Sample Labeling3.2.4 Sample Packing and Shipment
3.3 Field Documents and Records3.3.1 Field Logbook3.3.2 Sample Custody
3.4 Field Corrective Action
C-3

Sampling Protocol for Dioxins in Surface Soils Version 1.0
August 26, 2003
4.0: FIELD SAFETY 4.1 Safety Guidelines for Soil Sampling
4.1.1 Slip-Trip-Fall Hazards 4.1.2 Lifting Hazards 4.1.3 Decontamination Safety
4.2 Heat and Cold Stress Hazards 4.2.1 Heat Stress 4.2.2 Cold Stress
4.3 Biological Hazards
5.0: REFERENCES
FIGURES
Figure 2-1. Example of a Grid Sampling Technique Figure 2-2. Example of X Sampling Technique
TABLES
Table 3-1. Sample Holding Times and Preservation Methods Table 4-1. Signs and Symptoms of Heat-Related Illnesses and Treatments
ATTACHMENTS
Attachment -1. Standard Operating Procedure for Surface Soil Sampling
C-4
Sampling Protocol for Dioxins in Surface Soils Version 1.0
August 26, 2003
ABBREVIATIONS AND ACRONYMS
bgs below ground surface
DI deionized
EMS Emergency Medical Services EPA United States Environmental Protection Agency
GPS global positioning system
HUD United States Department of Housing and Urban Development
IATA International Air Transportation Association ID identification
MSDS Material Safety Data Sheets MS/MSD matrix spike/matrix spike duplicate
NA not applicable
PCBs polychlorinated biphenyls PCDDs polychlorinated dibenzo-p-dioxins PCDFs polychlorinated dibenzofurans PPE personal protective equipment PVC polyvinyl chloride
QA quality assurance QC quality control
SRM standard reference material
C-5

Sampling Protocol for Dioxins in Surface Soils Version 1.0
August 26, 2003
1.0 INTRODUCTION
This sampling protocol was prepared to aid in the determination of an initial estimate of background levels of dioxins in soil of the United States. This sampling protocol was prepared under Contract Number 68-W-99-033, Work Assignment No. 511; Pilot Survey of Dioxins in Soil. This sampling protocol describes the methods for determining sampling locations, number of samples required, and appropriate sampling depth, as well as field methods and procedures for collection of surface soil samples.
For the purposes of this document the term dioxins refers to the broad class of compounds including polychlorinated dibenzo-p-dioxins (PCDDs), polychlorinated dibenzofurans (PCDFs), and dioxin-like polychlorinated biphenyls (PCBs).
1.1 Objective
The objective of this sampling protocol is to 1) provide field sampling procedures to be used in the collection of surface soil samples to be analyzed for dioxins and 2) establish sample gathering, handling, and documentation methods that are precise, accurate, representative, complete, and comparable to meet U.S. Environmental Protection Agency (EPA) quality control (QC) requirements.
1.2 Background of Dioxin Source and Fate
Dioxins are formed in trace amounts during almost any type of combustion process. They can also be formed during some chemical processes such as those associated with the manufacture of phenoxy herbicides and bleached wood pulp. These sources lead to the atmospheric transport of dioxins and subsequently the deposition of dioxin in soils and sediment (EPA, 2000). Dioxin compounds in soil tend to have low mobility because of their low water solubilities and vapor pressure. Therefore little vertical migration of dioxins in soils is expected, leaving the majority of atmospherically deposited dioxins in the surface soil (EPA, 2000).
C-6
Sampling Protocol for Dioxins in Surface Soils Version 1.0
August 26, 2003
2.0 SAMPLING PROCEDURES
The development of sampling procedures should be based on the objectives of each individual sampling survey. The following are guidelines for sampling soils from non-impacted areas where levels of dioxins should be representative of background and may need to be modified for surveys where analyses other than dioxins are required or if a non-background site is to be studied. The EPA guidance document, Preparation of Soil Sampling Protocols: Sampling Techniques and Strategies (EPA, 1992), can be used as an aid in the development of soil sampling protocols for other surveys. Attachment-1 (Standard Operating Procedure [SOP] for Surface Soil Sampling for Dioxins) contains a more detailed description of sample collection and handling procedures, groundcover removal, equipment required, and decontamination procedures.
2.1 Sampling Strategy
Samples can be collected for analysis by two general methods: soil cores (undisturbed samples with no headspace and only in situ voids) and sample container. Soil cores in inert liners can be capped, refrigerated and sent to the laboratory. If the sample container method is used, the collection method, container type, sample size, and preservatives vary according to the analysis to be performed. Soil cores are generally required if an undisturbed sample is needed or if the sample will also be analyzed for volatile compounds. If soil samples will be composited after collection, then soil coring is not necessary since the samples will need to be mixed during compositing. The costs associated with soil coring are generally higher than for the sample container method because of equipment cost and additional sampling time. Also, soil coring may not be feasible in areas that have sandy soil or very fine soil (HUD, 1995). A modified soil coring method using a bulb planter can be used to collect a sample to a predetermined depth. The sample collected with the bulb planter can then be transferred to a sample container.
When conducting sampling care should be taken to avoid the following.
• Disturbed areas (i.e. construction sites, areas around concrete pads or foundations, telephone and electric poles, freshly plowed crop fields, trees, planters, and areas of animal burrowing activity).
• Areas near wooden structures where treated wood may have been used. • High-traffic areas (i.e. parking lots, roadways, sidewalks). • Areas with potential for run-on/run-off from rain or snowmelt. • Areas near known dioxin sources. • Areas of very dense turf grass. • Areas which are not level.
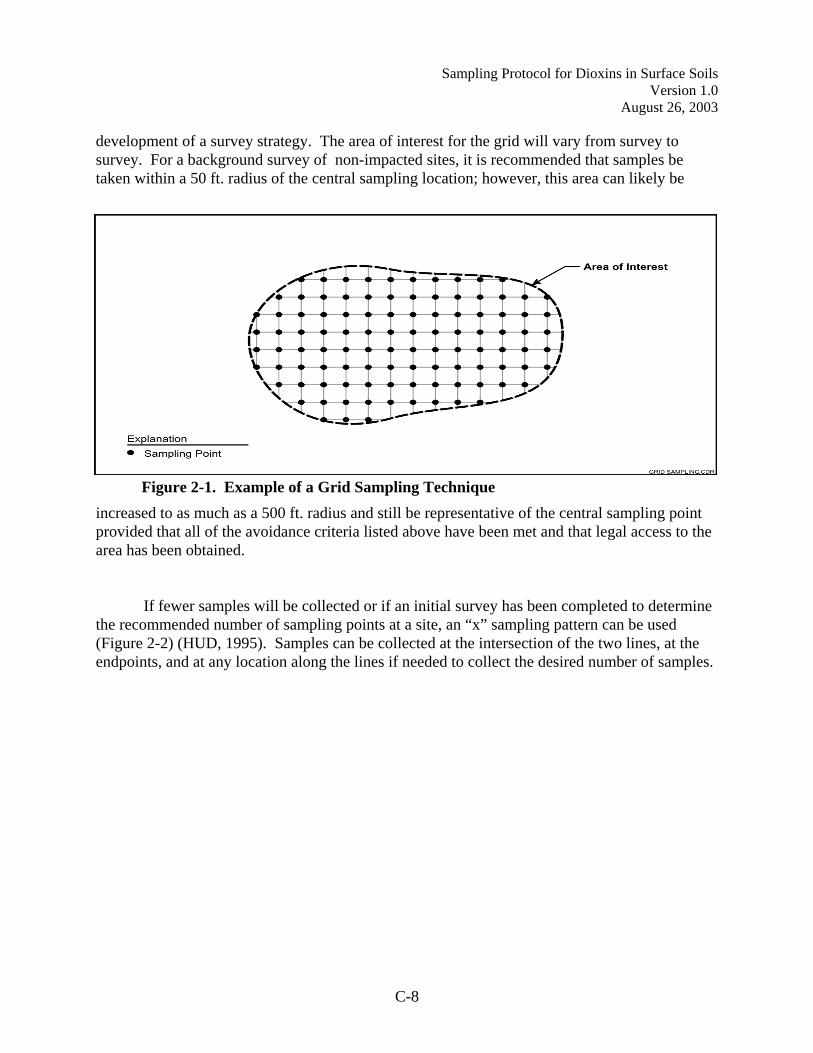
The exact number and location of soil samples will depend on the sampling objectives that need to be achieved. If a larger number of samples will be collected to achieve the sampling objectives, then a grid system of sampling is recommended (Figure 2-1) with samples collected at the intersection points. The grid sampling approach is ideal for initial studies at a site or in the
C-7
Sampling Protocol for Dioxins in Surface Soils Version 1.0
August 26, 2003
development of a survey strategy. The area of interest for the grid will vary from survey to survey. For a background survey of non-impacted sites, it is recommended that samples be taken within a 50 ft. radius of the central sampling location; however, this area can likely be
Figure 2-1. Example of a Grid Sampling Technique increased to as much as a 500 ft. radius and still be representative of the central sampling point provided that all of the avoidance criteria listed above have been met and that legal access to the area has been obtained.
If fewer samples will be collected or if an initial survey has been completed to determine the recommended number of sampling points at a site, an “x” sampling pattern can be used (Figure 2-2) (HUD, 1995). Samples can be collected at the intersection of the two lines, at the endpoints, and at any location along the lines if needed to collect the desired number of samples.
C-8

Sampling Protocol for Dioxins in Surface Soils Version 1.0
August 26, 2003
The length of the sampling line will depend on the size area to be studied and the placement of buildings, structures, or roadways at the site. The center sampling point should be located approximately in the center of the area to be studied and should allow the remaining sampling points to stay within the area to be studied and away from disturbed areas. The area that each individual sampling point can be moved without relocating the entire sampling grid should be determined in an initial sampling survey and will depend on the number of sampling points and the sampling grid size.
2.1.1 Sampling Location. For the purposes of this sampling protocol, sampling location refers to the general site where a set of samples will be collected. The term sampling point refers to the exact spot within a sampling location where the soil samples will be collected.
In order for a site to be considered for background sampling, there must be some site history available to rule-out any potential for contamination. There should be no known dioxin contamination and the site should not be located near highly populated areas to be considered for background purposes. Possible background sites should be evaluated for dioxin sources utilizing lists of known sources of dioxins such as Database of Sources of Environmental Releases of Dioxin-Like Compounds in the United States (EPA, 2001). Maps of the potential sampling location should be studied before the area is selected for a background sample location. Proximity to large urban areas, general site topography, and potential areas of erosion or deposition are some of the information that can be gathered from a review of maps of potential sampling locations. Maps can be found on the internet (topozone.com, mapserver.maptech.com, etc.) or they can be ordered through the United States Geologic Survey (USGS). The USGS has conducted geologically surveys throughout the United States and may have a lot of available data on potential sampling locations. Topographic and aerial maps of many areas of the United States are available through the USGS.
Figure 2-2. Example of “X” Sampling Technique
C-9

Sampling Protocol for Dioxins in Surface Soils Version 1.0
August 26, 2003
During field sampling, correct sampling points should be verified using a global positioning system (GPS) or some other survey method to determine latitude and longitude. Since the use of GPS may be impractical for large sampling efforts or where multiple sampling teams will be utilized, sampling points can be identified from a point that has previously been surveyed. In this case the starting point from Figure 2-2 would be located at the surveyed point and the remaining sampling points would be measured from the surveyed point. A compass would be used to determine direction from the surveyed point and a measuring tape would be used to measure the distance away from the surveyed point. Care should be taken to ensure that each sampling point avoids problematic areas as listed in the previous section.
2.1.2 Sampling Depth. Background levels of dioxins, which are deposited across the country via airborne transportation, can be determined by sampling surface soils. Deeper sampling should not be required because dioxins are not considered mobile contaminants, especially when atmospheric deposition is the suspected source (Rogowski et al., 1999).
The definition of surface soil varies throughout literature, but for the purpose of background sampling for dioxins a depth of 0 – 10 cm is generally accepted (Rogowski and Yake, 1999; Vikelsoe, 2002). Where the primary source of dioxins is air deposition, the type of soil will play a role in how deep the dioxins migrate into the soil. Highly organic soils will retain dioxins closer to the surface. The sampling depth should be kept to a minimum to avoid diluting analytes. Ideally an initial survey should be carried out to assess the distribution of dioxins in the soil to determine an adequate sampling depth of 10 cm or less. This can be accomplished by collecting plugs of soil with a bulb planter and segmenting the resulting soil plug into discreet sections (i.e., 0 - 5 cm and 5 -10 cm). The discreet sections of soil can be analyzed to determine how far dioxins have migrated and this information can be used to finalize the sampling depth.
2.1.3 Sample Number. The recommended number of sampling points will be dependent on individual survey objectives. Conducting an initial survey that oversamples a site is recommended. Variability of the data generated from the initial survey can be analyzed to establish the standard error as a function of the number of samples in order to determine an acceptable number of sampling points. Further guidance on sample number can be found in Preparation of Soil Sampling Protocols: Sampling Techniques and Strategies (EPA, 1992).
2.1.4 Sample Quantity. The total quantity of sample required will depend on the analyses being performed and if samples will be archived for future analyses. The amount of soil needed for each analysis should be determined and should take into account extra material needed to supply laboratory quality control samples such as matrix spikes and replicates. The amount of soil needed for each analysis should be summed to determine a total amount of soil. Enough additional soil should be collected to allow for compositing and additional or repeat analyses that may be required. As guidance for sampling surface soils for dioxins and chemical/physical parameters, and a few selected additional analytes approximately 600 g of soil should be collected in three 8-oz wide-mouth, amber glass, certified clean sample containers (Environmental Sampling Supply PC class, or equivalent). An additional set of containers can be collected if samples will be archived for future analyses. To fill six 8-oz soil jars with a
C-10
Sampling Protocol for Dioxins in Surface Soils Version 1.0
August 26, 2003
sampling depth of 0-10 cm an area of approximately 20 cm by 20 cm will need to be sampled. The actual area may vary by site depending on how rocky the soil is and how much vegetation is present.
2.2 Sampling Equipment
Section 2.0 of Standard Operating Procedure [SOP] for Surface Soil Sampling for Dioxins (Attachment 1) contains a detailed list of sampling equipment.
2.3 Sample Collection
Section 3.0 of SOP for Surface Soil Sampling for Dioxins (Attachment 1) contains a detailed information on sampling procedures.
2.4 Long-Term Archiving of Samples
Long-term archiving of soil samples may be required if there is the potential for future analyses (i.e., analysis of individual samples because of composite sample results). For long term storage, EPA Method 1613, Revision B (EPA, 1994) for PCDD/PCDF and EPA Method 1668, Revision A (EPA, 1999) for PCBs state that soil samples can be stored in the dark at a temperature of less than -10°C for up to one year.
If samples are to be archived for potential future analysis of other analytes, it is recommended that they be maintained frozen, at a temperature of less than -10°C. Note that holding times for many other analytes are comparatively short (1 month or less). If the archived samples exceed method recommended holding times, it is recommended that the data be flagged as such.
3.0 FIELD SAMPLING QUALITY ASSURANCE
Quality assurance (QA) is an integrated system of activities in the area of quality planning, assessment, and improvement to provide the survey with a measurable assurance that the established standards of quality are met. Quality control (QC) checks, including both field and laboratory, are specific operational techniques and activities used to fulfill the QA requirements. Project specific field and laboratory QC checks should be specified in a project specific Qaulity Assurance Project Plan.
3.1 Field Quality Control Samples
The field QC samples should be assigned unique sample numbers and submitted as regular (blind) samples to the analytical laboratory. If abnormalities are detected in field QC samples, the data associated with the QC samples should be flagged and appropriate actions should be taken to rectify issues. Field QC samples will be survey specific and should be outlined in the Quality Assurance Project Plan for the survey. Field QC samples may include
C-11

Sampling Protocol for Dioxins in Surface Soils Version 1.0
August 26, 2003
equipment rinsate blanks, trip blanks, and field blanks. A temperature blank should always be used for sample shipment of samples requiring a temperature preservative.
3.1.1 Equipment Rinsate Blanks. Equipment rinsate blanks are generally collected at a frequency of one per day to ensure that nondedicated sampling devices have been decontaminated effectively. Equipment rinsate blanks consist of the rinsewater used in the final water rinse step of the sampling equipment decontamination procedure before the equipment is sprayed or rinsed with a solvent. Rinsate samples may be collected more frequently if required to meet the survey requirements. Details on collecting an equipment rinsate blank can be found in Section 3.11 of SOP for Surface Soil Sampling for Dioxins (Attachment 1).
3.1.2 Trip Blanks. Trip blanks are generally prepared either by the analytical laboratory or the field sampling crew by filling an amber glass soil jar with clean playsand. Trip blanks are not to be opened in the field. Trip blanks generally only need to be analyzed if contamination is suspected in actual associated site samples. Trip blanks indicate whether the field samples have been contaminated during storage and shipping and are usually collected at a frequency of one per sample cooler.
3.1.3 Field Blanks. Field blanks can indicate contamination of samples during sample collection. Field blanks are usually collected at a frequency of one per site. Field blanks are prepared either by the analytical laboratory or the field sampler(s) by filling an amber glass soil jar with clean playsand. This jar should be opened and placed uncapped on an even surface upwind of the sample location during collection of the soil samples.
3.1.4 Temperature Blanks. Temperature blanks should accompany each cooler containing samples with a temperature preservative requirement. The temperature blank is prepared either by the analytical laboratory or the field sampler(s) by filling an amber glass soil jar with clean playsand. The temperature of the samples is verified upon arrival at the analytical laboratory using the temperature blank.
3.2 Sample Handling and Custody
The following procedures ensure proper handling, custody, and documentation of the samples from field collection through laboratory analysis.
3.2.1 Sample Containers, Preservation and Holding Time. Requirements for sample preservation and holding times are listed in Table 3-1. New, precleaned amber sample containers (Environmental Sampling Supply PC Class, or equivalent) should be used for soil sample collection. Once collected, each containerized sample is labeled and placed into a sample cooler. The sample cooler serves as the shipping container and should be packed with ice to cool samples to the appropriate temperature for preservation. It is important that wet ice be used to cool and ship samples to maintain proper temperature.
C-12
Sampling Protocol for Dioxins in Surface Soils Version 1.0
August 26, 2003
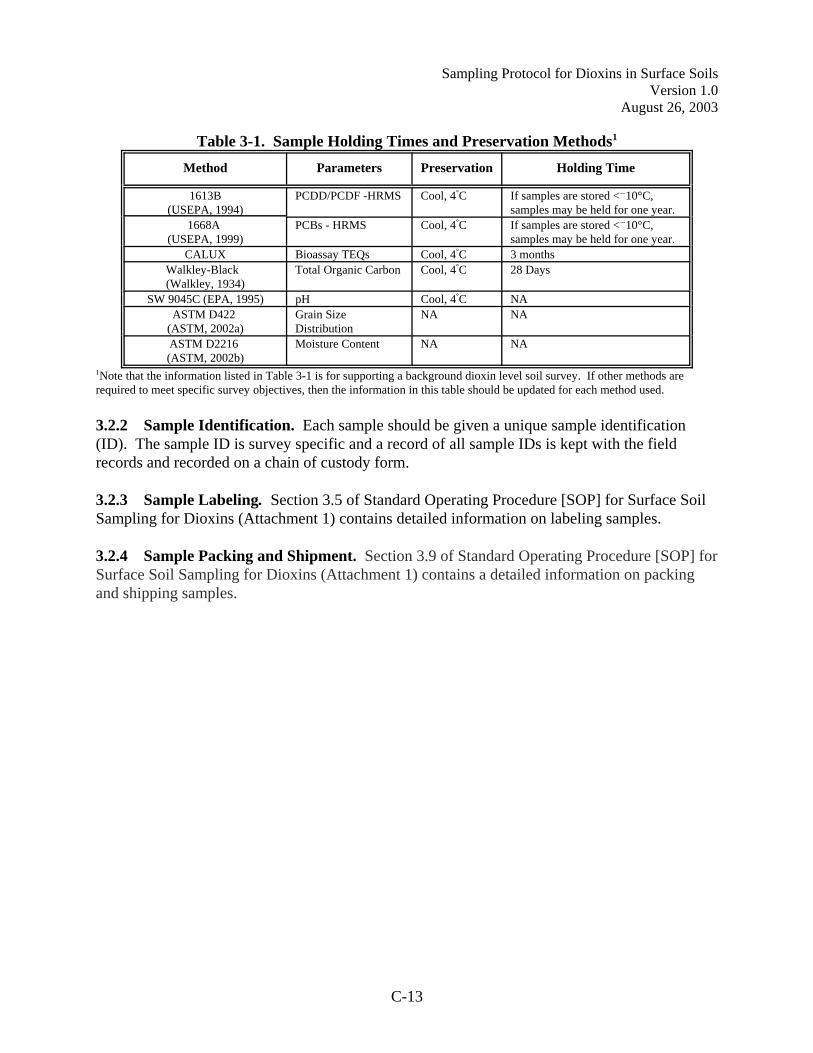
Table 3-1. Sample Holding Times and Preservation Methods1
Method Parameters Preservation Holding Time
1613B (USEPA, 1994)
PCDD/PCDF -HRMS Cool, 4°C If samples are stored <G10°C, samples may be held for one year.
1668A (USEPA, 1999)
PCBs - HRMS Cool, 4°C If samples are stored <G10°C, samples may be held for one year.
CALUX Bioassay TEQs Cool, 4°C 3 months Walkley-Black (Walkley, 1934)
Total Organic Carbon Cool, 4°C 28 Days
SW 9045C (EPA, 1995) pH Cool, 4°C NA ASTM D422
(ASTM, 2002a) Grain Size Distribution
NA NA
ASTM D2216 (ASTM, 2002b)
Moisture Content NA NA
1Note that the information listed in Table 3-1 is for supporting a background dioxin level soil survey. If other methods are required to meet specific survey objectives, then the information in this table should be updated for each method used.
3.2.2 Sample Identification. Each sample should be given a unique sample identification (ID). The sample ID is survey specific and a record of all sample IDs is kept with the field records and recorded on a chain of custody form.
3.2.3 Sample Labeling. Section 3.5 of Standard Operating Procedure [SOP] for Surface Soil Sampling for Dioxins (Attachment 1) contains detailed information on labeling samples.
3.2.4 Sample Packing and Shipment. Section 3.9 of Standard Operating Procedure [SOP] for Surface Soil Sampling for Dioxins (Attachment 1) contains a detailed information on packing and shipping samples.
C-13
Sampling Protocol for Dioxins in Surface Soils Version 1.0
August 26, 2003
3.3 Field Documents and Records
3.3.1 Field Logbook. A survey-specific and site-specific field logbook is used to provide daily records of significant events, observations, and measurements during field investigations. The field logbook is also used to document all sampling activities. All logbook entries should be made with indelible ink to provide a permanent record. These logbooks should be maintained as permanent records.
The field logbooks are intended to provide sufficient data and observations to reconstruct events that occurred during field activities. Field logbooks should be bound and prepaginated; the use of designated forms should be used whenever possible to ensure that field records are complete. A site map and area to record sampling locations should be included with the field logbook.
Section 3.6 of Standard Operating Procedure [SOP] for Surface Soil Sampling for Dioxins (Attachment 1) contains a detailed information on completing field logbooks.
3.3.2 Sample Custody. All samples collected must be logged onto a chain-of-custody form in the field prior to shipment to the laboratory. The chain-of-custody form is signed by the individual responsible for custody of the sample containers, and the original accompanies the samples to the laboratory. One copy of the chain-of-custody form should be kept by the field team and included in any survey files.
The laboratory receiving the samples should have a designated sample custodian. This individual is responsible for inspecting and verifying the correctness of the chain-of-custody records upon sample receipt. The sample custodian will accept the samples by signing the chain-of-custody form and noting the condition of the samples in the space provided on the chain-ofcustody form or other receipt form.
Immediately after receipt, the samples should be stored in an appropriate secure storage area meeting the holding requirements listed in Table 3-1. The laboratory should maintain custody of the samples as required by the project. The analytical laboratory should keep written records showing the chronology of sample handling during the analysis process by various individuals at the laboratory.
Section 3.7 of Standard Operating Procedure [SOP] for Surface Soil Sampling for Dioxins (Attachment 1) contains a detailed information on completing chain-of-custody.
3.4 Field Corrective Action
Corrective actions may be initiated by any of the participants of the field data generation process (i.e., field technicians, field team leader, etc). It is important to generate corrective actions early in the field sampling process so that the problem has a greater chance of being resolved in a timely and cost-effective manner.
C-14

Sampling Protocol for Dioxins in Surface Soils Version 1.0
August 26, 2003
4.0 FIELD SAFETY
4.1 Safety Guidelines for Soil Sampling
Personnel should wear prescribed Personal Protective Equipment (PPE), as appropriate, during sampling activities. Sturdy shoes with good traction (i.e., steel-toed safety shoes) are recommended for use in the field. High levels of dioxins or other contaminants should not be encountered during sampling of background, non-impacted sites; regardless, contamination avoidance should be practiced at all times. Personnel responsible for handling soil samples should wear disposable nitrile gloves (or equivalent) and safety glasses with side shields should be worn during decontamination procedures. Personnel should be advised of the hazard type and potential contaminants present in the samples. Because cigarette smoke is a potential source of dioxins and because flammable materials may be used during equipment decontamination, there should be absolutely no smoking at any time during the sample collection process.
4.1.1 Slip-Trip-Fall Hazards. Although it is difficult to prevent slip-trip-fall hazards, these hazards can be minimized through good housekeeping, proper site control measures and by keeping the work area free of obstructions. Slip, trip, and fall hazards should be addressed through an ongoing proactive housekeeping program that eliminates elements in the work area that have potential for causing substantial loss of footing.
4.1.2 Lifting Hazards. Field operations often require that physical labor tasks be performed. All personnel should employ proper lifting procedures. Additionally, personnel should not attempt to lift bulky or heavy objects (greater than 60 pounds) without assistance.
4.1.3 Decontamination Safety. Exposure to chemical decontamination materials and solutions should be controlled by the use of appropriate personal protective clothing and accessories, which includes safety glasses and nitrile gloves or equivalent. Material Safety Data Sheet (MSDS) can be used to find safety information for the solvent(s) (i.e. methanol, acetone, or hexane) and the non-phosphate detergent.
4.2 Heat and Cold Stress Hazards
4.2.1 Heat Stress. During hot or humid days, or during the performance of strenuous work, extra precautions are necessary to reduce the potential for heat stress. Implementation of worker rotation and rest period schedules and adjustment of the workday to take advantage of the cooler parts of the day may be used to prevent exposure to heat stress hazards. Whenever possible, shade should be utilized or provided to field personnel to help mitigate heat stress hazards. Also, frequent consumption of water or an electrolytic beverage is necessary to prevent dehydration. The levels of heat stress are characterized in Table 4-1.
C-15
Sampling Protocol for Dioxins in Surface Soils Version 1.0
August 26, 2003
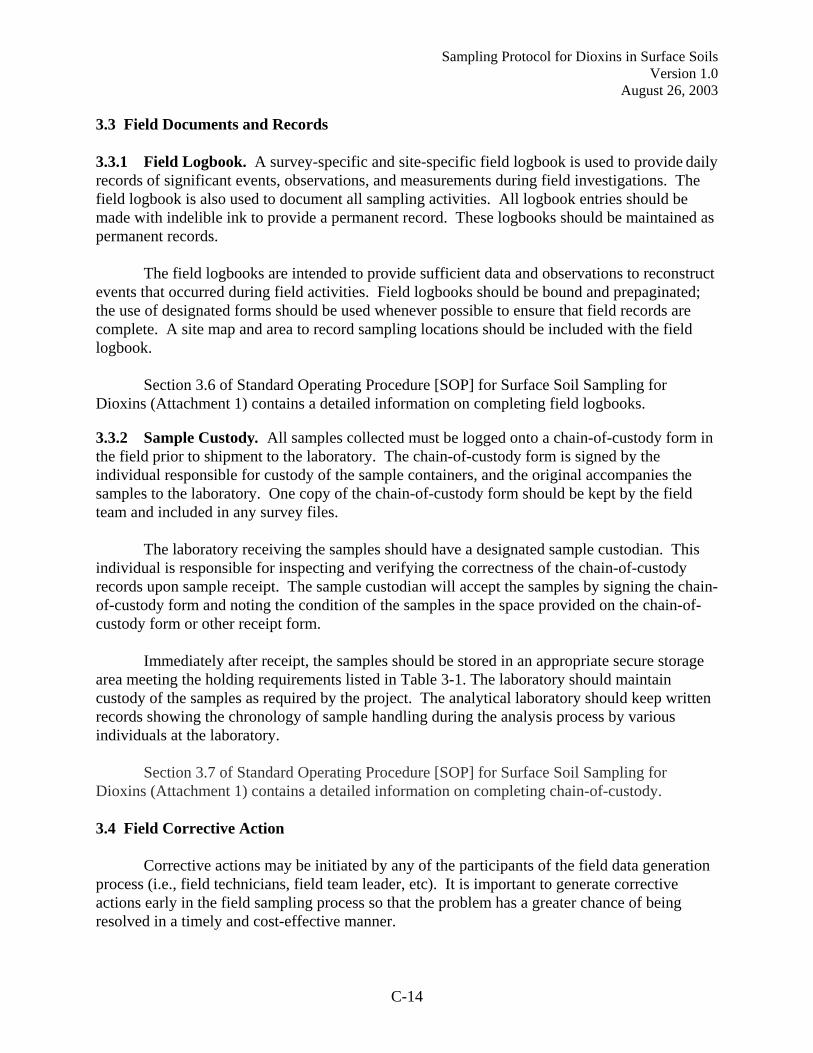
Table 4-1. Signs and Symptoms of Heat-Related Illnesses and Treatments Heat Induced Problems
Problem Body Response Signs and Symptoms Treatment Heat Cramps The body loses too much salt
from heavy exertion in heat. Painful spasms of muscles used during work.
Increase fluid intake with electrolytes (Unless otherwise indicated by a doctor). Take frequent breaks, preferably in a cool area.
Heat The body can’t replace fluids Weakness, dizziness, Move to a cool place. Exhaustion and/or salt lost in sweating. nausea. Loosen clothes and apply cool
Perspiration in heat is Pale or flushed compresses. important because it cools the appearance. Drink water slowly. body as it evaporates. Sweating, moist and Elevate feet 8-12 inches.
clammy skin. Heat Stroke The body no longer sweats DRY, hot reddish skin, Treat as a MEDICAL
and holds so much heat that and LACK OF EMERGENCY! body temperature reaches SWEATING! Call for EMS or a doctor dangerous levels. Heat stroke is a medical EMERGENCY and can lead to delirium,
High body temperature and strong, rapid pulse. Chills Confusion
immediately! Move to a cool area immediately. Use cool water to soak person’s clothes and body.
convulsions, Fan the body. unconsciousness, or death. Don’t give fluids if victim is
unconscious. EMS = Emergency Medical Services.
4.2.2 Cold Stress. Working under cold conditions can lead to various injuries or health effects, collectively known as cold stress. The hazardous effects of cold on the body may include dehydration, numbness, shivering, frostbite, immersion foot (trench foot), and hypothermia.
The effects of cold stress can be minimized by providing the proper training, controlling temperature and wind whenever possible by using heaters and/or windbreaks. Workers should be rotated if extreme cold conditions are encountered to avoid overexposure. Proper protective clothing, which provides insulation but also allows sweat to evaporate, should be used, including protection for the feet, hands, head, and face. Seek warm locations during breaks and replace lost fluids with warm, sweet, non-caffeine-containing drinks to avoid dehydration.
4.3 Biological Hazards
Biological hazards may include animal bites, insect bites and stings, contact with poisonous plants, and exposure to pathogenic (disease producing) microorganisms. Animal and bird droppings often contain mold, fungus, bacteria or viruses that represent a respiratory hazard. If encountered, personnel should avoid touching droppings.
First aid procedures for biological hazards should follow recommended procedures set by the American Red Cross. Paramedics should be summoned for serious injuries.
C-16

Sampling Protocol for Dioxins in Surface Soils Version 1.0
August 26, 2003
5.0 REFERENCES
ASTM, see American Society for Testing and Materials
American Society for Testing and Materials. 2002a. D422-63 (1998) Standard Test Method for Particle-Size Analysis of Soils. West Conshohocken, PA.
American Society for Testing and Materials. 2002b. D2216-98 Standard Test Method for Laboratory Determination of Water (Moisture) Content for Soil and Rock by Mass. WestConshohocken, PA.
EPA, see United States Environmental Protection Agency.
HUD. See United States Department of Housing and Urban Development.
Rogowski, David; Steven Golding; Dennis Bowhay; and Stacie Singleton. 1999. Final ReportScreening Survey for Metals and Dioxins in Fertilizer Products and Soils in Washington State.Washington State Department of Ecology, Olympia Washington. Ecology Publication No. 99309. April.
Rogowski, David and Bill Yake. 1999. Addendum to Final Report: Screening Survey for Metals and Dioxins in Fertilizer Products and Soils in Washington State. Washington State Department of Ecology, Olympia Washington. Ecology Publication No. 99-333. November
United States Department of Housing and Urban Development. 1995. Guidelines for the Evaluation of Lead-Based Paint Hazards in Housing. June.
United States Environmental Protection Agency. 1992. Preparation of Soil Sampling Protocols: Sampling Techniques and Strategies. EPA/600/R-92/128. July.
Unites States Environmental Protection Agency. 1994. Method 1613: Tetra- Through Octa-Chlorinated Dioxins and Furans by Isotope Dilution HRGC/HRMS, Revision B. EPA 821-B-94005.
United States Environmental Protection Agency. 1995. Test Methods for Evaluating Solid Waste, Physical/Chemical Methods (SW-846). Method 9045C: Soil and Waste pH. Revision 3. January.
United States Environmental Protection Agency. 1999. Method 1668, Revision A: Chlorinated Biphenyl Congeners in Water, Soil, Sediment, and Tissue by HRGC/HRMS. EPA-821-R-00-002.
United States Environmental Protection Agency. 2000. Draft Exposure and Human Health Reassessment of 2,3,7,8-Tetrachlorodibenzo-p-dioxin (TCDD) and Related Compounds. September.
C-17
Sampling Protocol for Dioxins in Surface Soils Version 1.0
August 26, 2003
United States Environmental Protection Agency. 2001. Database of Sources of Environmental Release of Dioxin-Like Compounds in the United States; Reference Years 1987 and 1995. EPA/600/C-01/012. March.
Vikelsoe, Jorgen. 2002. Dioxins in Danish Soil. National Environmental Research Institute, Roskilde, Denmark. August.
Walkley, A. and I.A. Black. 1934. An Examination of the Degiareff Method for Determining SOM and a Proposed Modification of the Chromic Acid Titration Method. Soil Science 37: 2938.
C-18

Sampling Protocol for Dioxins in Surface Soils Version 1.0
August 26, 2003
Attachment-1
Standard Operating Procedure for
Surface Soil Sampling for Dioxins
C-19
SOP:Surface Soil Sampling for Dioxins Rev: 1.0
Date: August 26, 2003
STANDARD OPERATING PROCEDUREfor
SURFACE SOIL SAMPLING FOR DIOXINS
C-20

SOP:Surface Soil Sampling for Dioxins Rev: 1.0
Date: August 26, 2003
Table of Contents
1.0 Scope and Application . . . . . . . . . . . . . . . . . . . . . . . . . . . . . . . . . . . . . . . . . . . . . . . . . . . . . .
2.0 Equipment/Materials Required . . . . . . . . . . . . . . . . . . . . . . . . . . . . . . . . . . . . . . . . . . . . . . . .
3.0 Sampling Procedures . . . . . . . . . . . . . . . . . . . . . . . . . . . . . . . . . . . . . . . . . . . . . . . . . . . . . . . 3.1 Locating Recommended Surface Soil Sampling Points . . . . . . . . . . . . . . . . . . . . . . . 3.2 Groundcover Removal . . . . . . . . . . . . . . . . . . . . . . . . . . . . . . . . . . . . . . . . . . . . . . . . 3.3 Pre-Sample Collection Activities . . . . . . . . . . . . . . . . . . . . . . . . . . . . . . . . . . . . . . . . 3.4 Soil Sampling . . . . . . . . . . . . . . . . . . . . . . . . . . . . . . . . . . . . . . . . . . . . . . . . . . . . . . . 3.5 Sample Container Labels . . . . . . . . . . . . . . . . . . . . . . . . . . . . . . . . . . . . . . . . . . . . . . 3.6 Field Logbooks . . . . . . . . . . . . . . . . . . . . . . . . . . . . . . . . . . . . . . . . . . . . . . . . . . . . . . 3.7 Chain-of-Custody . . . . . . . . . . . . . . . . . . . . . . . . . . . . . . . . . . . . . . . . . . . . . . . . . . . . 3.8 Decontamination of Sampling Equipment . . . . . . . . . . . . . . . . . . . . . . . . . . . . . . . . . 3.9 Packing and Shipping Samples . . . . . . . . . . . . . . . . . . . . . . . . . . . . . . . . . . . . . . . . . . 3.10 Soil and Air Temperature Measurements . . . . . . . . . . . . . . . . . . . . . . . . . . . . . . . . . 3.11 Equipment Rinsate Blank Collection . . . . . . . . . . . . . . . . . . . . . . . . . . . . . . . . . . . . .3.12 Compositing and Sample Processing . . . . . . . . . . . . . . . . . . . . . . . . . . . . . . . . . . . . .
4.0 Health and Safety . . . . . . . . . . . . . . . . . . . . . . . . . . . . . . . . . . . . . . . . . . . . . . . . . . . . . . . . . .
5.0 References . . . . . . . . . . . . . . . . . . . . . . . . . . . . . . . . . . . . . . . . . . . . . . . . . . . . . . . . . . . . . . . .
Figure 1. Example Field Logbook Page . . . . . . . . . . . . . . . . . . . . . . . . . . . . . . . . . . . . . . . . . . . Figure 2. Site Map Schematic . . . . . . . . . . . . . . . . . . . . . . . . . . . . . . . . . . . . . . . . . . . . . . . . . . . Figure 3. Example Chain-of-Custody Form. . . . . . . . . . . . . . . . . . . . . . . . . . . . . . . . . . . . . . .
C-21
SOP:Surface Soil Sampling for Dioxins Rev: 1.0
Date: August 26, 2003
1.0 Scope and Application
The purpose of this Standard Operating Procedure (SOP) is to provide samplers with a step-by-step guide for collecting surface soil samples for dioxin analysis.
For the purposes of this document the term dioxin refers to the broad class of compounds including polychlorinated dibenzo-p-dioxins (PCDDs), polychlorinated dibenzofurans (PCDFs), and dioxin-like polychlorinated biphenyls (PCBs).
2.0 Equipment/Materials Required
C Surface Soil Sampling for Dioxins SOP C Map of the site and potential sampling points C Field Logbook and Site Map Schematic (See Figures 1 and 2) C Ballpoint pens C Permanent markers (Must be used on sample labels, ballpoint pens may run) C Chain-of-Custody (See Figure 3) C Cooler(s) C Nitrile gloves (or equivalent) C Wooden or metal stakes with reflective plastic ties C Bulb planter, stainless steel scoops/spades, or coring device C Trowel for bulb planter method C Disposable aluminum foil pans or tub/tray lined with aluminum foil C Hand-held grass clippers C Sample containers (8-oz amber glass, wide mouth soil jars with lids,
Environmental Sampling Supply PC Class, or equivalent) C Sample Labels C Clear plastic packing tape (to tape over sample label) C Strapping or duct tape (to tape up coolers) C Tape Measure (Length of at least 100 feet) C Compass or GPS unit C Ruler (cm) C Plastic bags (gallon size zip lock for ice and chain-of-custody) C Plastic bags (quart size zip lock for sample containers) C Plastic trash bags (lawn and leaf) C Decontamination supplies (one to two buckets, 2 gallon size or larger), stiff
bristle brush, spray bottles, reagent-grade methanol, and non-phosphate detergent)
C Deionized (DI) or distilled water (approximately 4 gallons) C Container with potable water
C-22
SOP:Surface Soil Sampling for Dioxins Rev: 1.0
Date: August 26, 2003
C Waste container C Funnel (to transfer liquid waste to waste container) C Aluminum foil C Paper towels C Bubble wrap C Federal Express (or other overnight courier service) labels C Ice (approximately 4 bags) C Soil/Air thermometer (digital or standard liquid-filled)
Optional equipment includes: C Safety glasses with side shields, sturdy shoes with good traction [i.e., steel-toed
safety shoes], sun screen, and hat C Sieve (19 millimeter opening) C Potting soil for use in site restoration C Disposable or digital camera for site photos C Custody seals
3.0 Sampling Procedures
Please note that because cigarette smoke is a potential source of dioxins and because flammable materials will be used during equipment decontamination, there should be absolutely no smoking at any time during the sample collection process. Exhaust from vehicles and electrical generators can also be a source of dioxins and therefore sample collection should be performed away from running vehicles or generators.
3.1 Locating Recommended Surface Soil Sampling Points. Recommended sampling points should be determined and placed on a site map prior to beginning field activities. All sampling points must avoid the following problem areas.
C Disturbed areas (i.e. construction sites, areas around concrete pads or foundations, telephone and electric poles, freshly plowed crop fields, trees, planters, and areas of animal burrowing activity).
C Areas near wooden structures where treated wood may have been used. C High-traffic areas (i.e. parking lots, roadways, sidewalks). C Areas with potential for run-on/run-off from rain or snowmelt.C Areas near known dioxin sources. C Areas of very dense turf grass.C Areas which are not level.
C-23

SOP:Surface Soil Sampling for Dioxins Rev: 1.0
Date: August 26, 2003
Once in the field, make sure the center sampling point avoids all problem areas noted above. The sampler should be given instructions as to how far the center point and all other sampling points can be relocated to avoid problem areas without affecting the project goals.
Once at the site, stake out the final sampling points using the wooden or metal stakes with reflective ties or flags and verify the latitude and longitude of each point using global positioning satellite (GPS) or other means of surveying. Sampling points can also be measured from a previously surveyed point using a tape measure and compass. If desired, a disposable or digital camera can be used to take photos documenting each sampling point and the sampling location.
3.2 Groundcover Removal. Groundcover may consist of grass, other vegetation, or rocks/pebbles. Areas with dense groundcover, including turf grass, should be avoided.
C Groundcover removal should be performed using gloved hands. The groundcover should only be removed to the point where soil is exposed, being careful not to disturb the soil below. If tall grass or weeds are present they can be cut down using hand-held grass clippers to within 0.25 in. of the soil to the point where exposed soil can be identified.
C If the sampling point does not contain vegetation then any rocks or pebbles can be brushed aside by the sampler(s) using a gloved hand.
C If areas with large or dense vegetation, such as trees, turf grass, or bushes are located at the sampling point the sampling point should be moved (See Section 3.1). Cover from vegetation may affect the deposition of dioxins and therefore may not represent a true background sample.
C An area of approximately 20 cm by 20 cm will need to be uncovered; this can be measured using a ruler. The actual area may vary by site depending on how rocky the soil is and how much vegetation is present.
C-24

SOP:Surface Soil Sampling for Dioxins Rev: 1.0
Date: August 26, 2003
3.3 Pre-Sample Collection Activities
Picture 1. Grass Removal to within 0.25 in. of the Soil Surface
C Before beginning sampling, take out the field blank and position it upwind of the sampling point making sure that the container is on an even surface in an area where the container will not be knocked over.
C Remove the lid of the field blank container. C The field blank should be recapped after each sample is collected and
moved to the next sampling point where the lid should again be removed. C After sampling is complete the lid should be secured tightly and the field
blank should be handled like the other soil samples following the guidelines in Section 3.9.
C Place bubble wrap on the bottom of the sample cooler. C Place one garbage bag (lawn and leaf size) in the sample cooler on top of
the bubble wrap. C Divide one bag of ice into several (3 or 4) double bagged gallon-size zip
lock bags and place them inside the garbage bag at the bottom of the sample cooler. The garbage bag will help to ensure that water from the ice does not leak out of the cooler during shipping.
C Place the temperature blank and trip blank in the cooler with the ice. C As samples are collected they should be placed in the cooler with the ice.
3.4 Soil Sampling. Once the vegetation and/or rocks/pebbles have been removed per Section 3.2, a soil sample can be retrieved from 0-10 cm (exact depth should be specified in individual project plans) below ground surface (bgs) using a bulb planter (diameter of approximately 7.5 cm), stainless steel spade/scoop, or coring device. A bulb planter is the recommended method of surface sampling if an intact core is not necessary, but may not be a practical method of sampling in
C-25

SOP:Surface Soil Sampling for Dioxins Rev: 1.0
Date: August 26, 2003
sandy soils. The scoop/spade method is recommended for sampling sandy soils if the bulb planter can not be used.
Picture 2. Sampling Using the Bulb Planter Method C Put on nitrile gloves (or equivalent). C Determine the number of sample containers needed at each point to
acquire sufficient sample. C If soil temperature is required, follow the instructions in Section 3.10. C If a bulb planter is used to collect samples the device should be inserted
into the soil to the project specified sampling depth (no more than10 cm bgs) and twisted. A metal trowel should be inserted below the bottom of the bulb planter to ensure that the soil does not fall out when the bulb planter is lifted. Multiple plugs of soil taken next to the first may be needed to fill the required sample containers. Soil from the bulb planter can be placed onto disposable aluminum foil pan or a tub/tray covered with aluminum foil while the remaining sample is collected. Continue collecting plugs until enough sample has been collected to fill all sample containers. Sampling depth can be measured by placing a ruler in the sampling hole.
C Care should be taken to avoid including rocks, pebbles, vegetation, or debris in the sample container. A sieve with a 19 mm opening can be used to remove rocks, pebbles, vegetation, or debris. If a sieve is used the material passing through the sieve should be collected in disposable aluminum foil pan or tub/tray covered with aluminum foil before being transferred to a sampling container.
C If a sieve is not used, the sampler should inspect the sample in the disposable aluminum foil pan or tub/tray covered with aluminum foil and
C-26

C
SOP:Surface Soil Sampling for Dioxins Rev: 1.0
Date: August 26, 2003
use a gloved hand to remove rocks, pebbles, vegetation, or debris largerthan 19 mm.Carefully knead soil to remove roots.
Picture 3. Removal of Rocks, Vegetation, or Debris
C If samples are to be composited in the field, follow compositing instructions in Section 3.12.
C To fill the sample containers, one scoop of soil should be divided equally among the total number of containers, (e.g., for three containers, the first third of the soil on the scoop should go into the first container then the next third in the next container, etc., continuing to fill each container in order until the containers are all full).
C If soil is too sandy or rocky to collect samples using a bulb planter or coring device then a scoop/spade can be used.
C If samples are collected with a coring device, after collecting the sample, the ends of the core should be capped with Teflon caps or Teflon sheets should be placed between the plastic cap and the soil.
C Once containers are full, the rim of the sample container should be wiped using a clean, unused paper towel and the lids should be tightly screwed into place.
C The sample container should be labeled according to Section 3.5 and packed into a cooler according to Section 3.9.
C After collection of the first soil sample the bulb planter and trowel, scoop/spade, or coring device should be decontaminated according to Section 3.8 and the equipment rinsate blank sample should be collected according to Section 3.11. A new disposable aluminum foil pan should be used for each sampling point. If a tub/tray covered in aluminum foil is
C-27
SOP:Surface Soil Sampling for Dioxins Rev: 1.0
Date: August 26, 2003
used instead of the disposable aluminum pan, the aluminum foil should be changed for each sampling point.
C Sampling equipment should be decontaminated according to Section 3.8 between each sampling point, but the equipment rinsate blank will only need to be collected after the first soil sample is taken each day of sampling.
C Remove and dispose of gloves after sampling and decontamination is complete. Put on a new pair of gloves before collecting a new sample.
C Fill out the field logbook and chain-of-custody per Sections 3.6 and 3.7, respectively.
C Remove stakes once soil samples have been collected and return site to original state as best as possible. Potting soil may be used to fill any holes created by sample removal.
3.5 Sample Container Labels. Each sample container should have a sample label affixed to the outside of the container in an obvious location. All information should be recorded using a permanent marker.
C Immediately after sampling record the date and time (military time [i.e., 1330]) of sampling along with the initials of the sampler(s) on the sample label.
C Any other required information should be included (i.e. sample identification number, preservation used). If possible this information should be filled in before sample labels are sent to the field.
C The completed sample label should be placed on the jar in an obvious location, then be completely taped over with clear tape (i.e. packing tape) to prevent the label from getting wet, smudged, or lost during transport. Tape over the label before placing the sample in the cooler because the tape will not stick properly after the sample container is wet or cold.
3.6 Field Logbooks. The field logbooks are intended to provide sufficient data and observations to reconstruct events that occurred during field activities. An example field logbook page is included as Figure 1. The following are examples of information to be included by the sampler(s) in a field logbook:
C Project name and location C Name, date, and time of entry C Names and responsibilities of field crew members C Name and titles of any site visitors involved in or actively observing the
sampling.
C-28

SOP:Surface Soil Sampling for Dioxins Rev: 1.0
Date: August 26, 2003
C Weather information including air temperature and recent precipitation; soil temperature if required for a survey.
C Descriptions of deviations or option selections from the sampling SOP procedures and any problems encountered
C Number, amount, and ID of samples taken at each point C Details of sampling location, including sampling coordinates in latitude
and longitude. Actual sampling points should be marked on a map or schematic (See Figure 2).
C Date and time of sample collectionC General observations
3.7 Chain-of-Custody. All samples must be logged onto a chain-of-custody form in the field prior to shipment of samples to the laboratory. An example chain-ofcustody form is included as Figure 3. As much information as possible should be filled in before sending the chain-of-custody form into the field. The following are examples of information to be recorded using a ballpoint pen by the sampler(s) in the field:
C Sample matrix C Sample collector’s name C Dates/times of sample collection C Sample identification numbers C Number and type of containers for each sample aliquot C Type of preservation C Special handling instructions C Name, date, time, and signature of each individual releasing or receiving
the shipping container
The original copy of the chain-of-custody must be included with the samples and a copy should be kept with the field logbook.
3.8 Decontamination of Sampling Equipment. Decontamination is a process completed on all reusable or nondedicated field equipment to avoid cross-contamination between samples and to ensure the health and safety of the field sampler(s). The following sequence should be used to clean the bulb planter and trowel, scoop/spade, or coring device prior to taking the first sample and between each use:
1) Nitrile gloves (or equivalent) must be worn during decontamination.
C-29

SOP:Surface Soil Sampling for Dioxins Rev: 1.0
Date: August 26, 2003
2) Rinse with potable water, collecting rinse water in one of the decontamination buckets.
3) Wash with a spray bottle containing Liquinox™ (or equivalent non-phosphate detergent) and water and clean with the stiff-bristle brush until all evidence of soil or other material has been removed.
4) Rinse with DI or distilled water three times, ensuring that all soap from the previous step has been removed. (After the first sampling point has been completed, the equipment rinsate blank is collected after the third rinse with DI or distilled water before the equipment is sprayed with methanol [See Section 3.11]). For other samples these water rinses should be collected in the second decontamination bucket.
5) Rinse with methanol contained in a spray bottle. Use the spray bottle to completely mist the equipment with methanol.
6) Place the bulb planter and trowel, scoop/spade or coring device on a piece of aluminum foil to keep the equipment clean and air-dry, protected from the environment. The bulb planter, trowel, scoop/spade or coring device must be air-dried before use.
7) A trash bag should be provided for waste paper towels and used nitrile gloves.
8) Decontamination water in the 2-gallon buckets should be disposed of according to applicable regulations.
9) Replace disposable aluminum pans for each sample. If a tub/tray covered in aluminum foil is used instead, replace the foil covering the tub/tray for each sample.
Picture 4. Example Decontamination Set Up for Soil Sampling
C-30
C
SOP:Surface Soil Sampling for Dioxins Rev: 1.0
Date: August 26, 2003
3.9 Packing and Shipping Samples. Immediately after sample collection and sample labeling, samples should be packed as follows:
The cooler should be lined with a garbage bag and filled with wet ice which has been double bagged in gallon-size zip lock bags in order to meet the temperature requirements (4 ± 2/C).
C The temperature blank and trip blank should accompany the cooler with the soil samples.
C Sample cooler drain spouts (if present) should be taped (using duct tape) from the inside and outside of the cooler to prevent any leakage.
C The sample container should be put in a quart size zip lock bag. The bagged sample container should be wrapped with bubble wrap. Sample containers should then be placed in the sample cooler.
C Once all of the samples have been collected and placed in the cooler the samples should be packed with additional bubble wrap to prevent movement or breakage of the sample jars during transport.
C The completed chain-of-custody form (Section 3.7) should be placed in a resealable bag and taped to the lid of the cooler.
C The cooler should be banded with duct or strapping tape and if required custody seals can be placed along the cooler lid in order to prevent or indicate tampering.
C The cooler containing the environmental samples should be shipped to its destination by Federal Express (or other overnight courier) using the appropriate shipping labels for the courier. The cooler must be scheduled for priority overnight service to ensure that the temperature preservative requirement is not exceeded. Saturday deliveries, if required, should be coordinated with the laboratory.
3.10 Soil and Air Temperature. Soil and air temperature should be measured if required. Soil temperature can be measured with a digital thermometer or a standard liquid-filled thermometer. The digital thermometer can be purchased with the probe that is inserted into the soil to the required sampling depth for the survey. The soil temperature should be measured next to the area where the soil sample is collected, but should not be inserted into the exact location where the sample will be collected. This is to prevent cross-contamination from other sampling locations. The probe should remain in soil during sampling to allow the temperature reading to stabilize, once a stable reading is achieved this temperature should be recorded in the field logbook. A new soil temperature reading should be taken at each new sampling point. Air temperature can be measured using any thermometer designed for standard temperature readings. The air temperature should be taken away from direct sunlight and sheltered from wind. Allow the temperature reading to stabilize
C-31

SOP:Surface Soil Sampling for Dioxins Rev: 1.0
Date: August 26, 2003
over several minutes. A new temperature reading should be measured at each new sampling point or at least several times throughout a sampling day.
3.11 Eshould be collected to ensure that nondedicated sampling devices (bulb planter and trowel, scoop/spade or coring device) have been decontaminated effectively. Equipment rinsate blanks consist of the rinsewater used in the final water rinse step of the sampling equipment decontamination procedure before the equipment is sprayed or rinsed with a solvent.
1) Collect the ER blank after the first sample is collected. 2) Decontaminate the scoop/spade or coring device as described in Section 3.8
steps 1-4. 3) Before the bulb planter and trowel, scoop/spade or coring device is sprayed
with methanol, open the ER blank sample containers, rinse the bulb planter and trowel, scoop/spade or coring device with the DI or distilled water into the sample containers. Immediately replace and tighten the lid on the sample container.
4) Write the time and date on the sample label as described in Section 3.5. 5) Continue with step 5 of the decontamination process.
3.12 Compositing and Sample Processing. Soil samples can be composited in the field after sample collection is complete or samples can be shipped to the analytical laboratory where compositing under more controlled conditions can be performed.
1) Surface soil samples should be separated by site and by sampling point. 2) If a single sampling point required more than one container to obtain
sufficient volume, then the contents of all containers from an individual sampling point should be homogenized into a single sample by emptying the contents of all the containers into an aluminum foil pan or stainless steel bowl and mixing thoroughly. The homogenized sample can then be returned to the original sample containers.
3) If the survey requires compositing samples from multiple sampling points within a single site, composites should be prepared by mixing uniform amounts of soil from each sampling point. Only samples from the same site should be combined to form composite samples. The uniform amount of each soil sample should be placed into an aluminum foil pan or stainless steel bowl and mixed thoroughly. Adequate mixing is achieved by stirring the material in a circular fashion with a stainless steel spoon and occasionally turning the material over.
quipment Rinsate Blank Collection. One equipment rinsate (ER) blank
C-32
SOP:Surface Soil Sampling for Dioxins Rev: 1.0
Date: August 26, 2003
4) Sample identification numbers, which correspond to the sample identification of the individual sampling points that make up the composite, should be assigned to composite samples. The composite should be transferred to a sample container, labeled according to Section 3.5.
5) Individual samples and composites should be prepared for analytical testing or stored following specific survey guidance.
4.0 Health and Safety
Health and safety procedures are discussed in the sampling protocol (Battelle, 2003) and must be observed and implemented prior to any sample collection. The potential for chemical exposure will depend on the nature of the samples being collected and appropriate precautions should be taken. Physical hazards are only those that would be found in any typical outdoor activity. Please note that because cigarette smoke is a potential source of dioxins and because flammable materials will be used during equipment decontamination, there should be absolutely no smoking at any time during the sample collection process.
5.0 References
Battelle. 2003. Sampling Protocol for Dioxins in Soil. Prepared for the Environmental Protection Agency under Contract No. 68-W-99-033, Work Assignment 5-11.
C-33

FIELD ACTIVITIES LOG
Site Name: Date: Page ___ of ___
Personnel Present: Weather:
Time Activity
Time Sample ID Sample Location/Coordinates
Soil Sampler's Signature ________________________________________________________________
SOP:Surface Soil Sampling for Dioxins Rev: 1.0
Date: August 26, 2003
Figure 1. Example Field Logbook Page
C-34
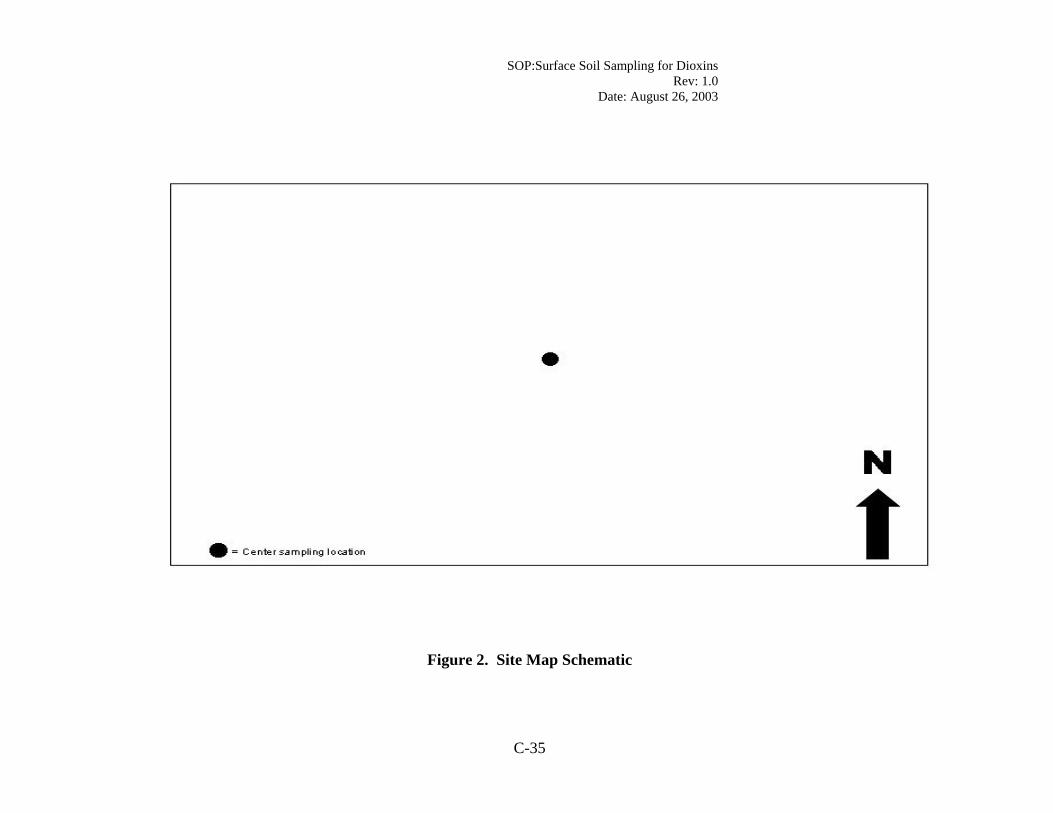
SOP:Surface Soil Sampling for Dioxins Rev: 1.0
Date: August 26, 2003
Figure 2. Site Map Schematic
C-35

SOP:Surface Soil Sampling for Dioxins Rev: 1.0
Date: August 26, 2003
Figure 3. Example Chain-of-Custody Form
C-36
APPENDIX D
QUALITY ASSURANCE/QUALITY CONTROL
D-1

WA5-11: CALUX Bioassay
))))))))))))))))))))))))))))))))))))))))))))))))))))))))))))))))))))) PROJECT: Pilot Survey of Dioxins in Soil PARAMETER: CALUX Bioassay LABORATORY: Xenobiotic Detection Systems, Inc. (XDS) MATRIX: Soil SAMPLE CUSTODY: Samples were received from Battelle on September 25, 2003, and October
30, 2003. All samples were intact and the cooler temperatures were 14°C and 2°C, respectively.
))))))))))))))))))))))))))))))))))))))))))))))))))))))))))))))))))))))
QA/QC MEASUREMENT QUALITY OBJECTIVES:
Parameter Method Blank
LCS/MS Recovery
SRM % Difference
Replicate Relative Precision
CALUX Bioassay
<3 × RL >50% Within 50 PD of certified or consensus values
#50% RPD
RL: reporting limit; LCS: laboratory control sample; MS: matrix spike; SRM: standard reference material; PD: percent difference; RPD: relative percent difference.
4444444444444444444444444444444444444444444444444444444444444444444
METHOD: Sample Preparation: Samples were prepared according to XDS Method WL-2 “Extraction” and XDS Method WL-3 “Cleanup.”
Sample Analysis: Samples were analyzed according to XDS Method C-5.
Note: A more detailed description of the methodology is included in final report to Battelle.
HOLDING TIMES: Samples for CALUX analyses were stored at room temperature until extraction.
Samples were extracted within 30 days of receipt and analyzed within 3 weeks of extraction.
Batch Extraction Date Analysis Date B9-10 10/5/03 10/15/03 B9-10A 10/2/03 10/20/03 B9-10B 10/4/03 10/15/03 B9-10C 10/5/03 10/20/03 B9-10D 10/5/03 10/18/03 B9-10E 10/6/03 10/23/03 B9-10F 10/7/03 10/23/03 B9-10G 10/9/03 10/23/03
D-2

B9-10H 10/10/03 10/26/03 B9-10I 10/11/03 10/26/03 B9-10J 10/11/03 10/26/03 B9-10K 10/27/03 11/2/03 B9-10Gr1 11/3/03 11/6/03 B9-10L 11/5/03 11/9/03 B9-27 11/14/03 11/28/03
Reporting Limits (RLs) for CALUX analyses were determined on the basis of the nondetect limit of each bioassay. This level was adjusted for individual sample processing volumes and factors as follows:
RL (pg/g wet weight) = Toxicity equivalent of DMSO blanks Formula: (2.5 × standard deviation (std dev) DMSO + positive B value [intercept parameter] calculated) corrected for samples size, dilution, and recovery.
Example: DMSO Relative light units: 439,430,430.Std dev = 5.102 × std dev = 12.76B value = 39.03Total = 51.83Calculated per hill four equation (v*(d^n))/(d^n + k^n) = 0.027 TEQCalculated per 2 g sample, 1:4 dilution, and 76% recovery = 0.07 pg/gnondetect limit.
The target RLs of 0.2–0.5 pg/g wet was achieved for all nondetect samples.
DETECTION LIMITS:
BLANKS: A laboratory method blank (MB) was prepared with each batch. The MBfor each assay was less than three times the plate nondetect limit. Six of themethod blanks were discarded by Q test.
LABORATORY CONTROL SAMPLE (LCS):
An LCS was prepared with each batch. Analyte recovery was determinedto measure data quality in terms of accuracy.
CDD/CDF and PCB mixtures were used for the LCS. One was run on eachbioassay.
For samples received on September 25, 2003, and processed in subsequentbatches the LCS results were:CDD/CDF = 77% ± 13%PCB = 97% ± 15%
For samples received on October 30, 2003, the LCS results were:CDD/CDF = 113%PCB = 81%
D-3

MATRIX SPIKES (MSs):
Multiple MS samples were prepared and run with these samples. The percent recoveries of analytes in the MSs were calculated to measure data quality in terms of accuracy.
All MS recoveries were >50%.
MS samples processed with samples received September 25, 2003, were within 80% ± 18%.
MS samples processed with the samples received October 30, 2003, were within 66% ± 5%.
REPLICATES: Each sample was prepared in duplicate. The relative percent difference (RPD) between duplicates was calculated to measure data quality in terms of precision.
RPDs ranged from 0% to 49% and were <50% for all samples except as follows: samples A03028, A03052, A03110, A03114, and A03121 were very low level or exhibited nonhomogenous traits that caused std devs higher than 50%.
STANDARD REFERENCE MATERIAL (SRM):
XDS QC sample (A00371) SRM was prepared with each batch. The percent difference (PD) between the measured value and the certified values were calculated to measure data quality in terms of accuracy.
SRM PDs were within 50% of certified values.
PROBLEMS/ CORRECTIVE ACTIONS:
Samples with replicate std devs above 50% were re-extracted. With the exception of samples A03028, A03052, A03110, A03114, and A03121, all re-extract std devs were below 50%.
D-4
WA5-11: Mercury
))))))))))))))))))))))))))))))))))))))))))))))))))))))))))))))))))))))) PROJECT: Pilot Survey of Dioxins in Soil PARAMETER: Mercury LABORATORY: Battelle Columbus, OH MATRIX: Soil SAMPLE CUSTODY: Sample Sets 1, 2, and 3 were received from Battelle’s high-resolution mass
spectrometry laboratory on September 9 and 29 and November 3, 2003, respectively. The samples had been stored in a refrigerator until pick-up for mercury analysis.
))))))))))))))))))))))))))))))))))))))))))))))))))))))))))))))))))))))))
QA/QC MEASUREMENT QUALITY OBJECTIVES:
Parameter Method Blank
LCS/MS Recovery
SRM % Difference
Replicate Relative Precision
Mercury <3 × RL 75–125% #25% PD of certified or consensus values
#20% RPD
RL: reporting limit; LCS: laboratory control sample; MS: matrix spike; SRM: standard reference material; PD: percent difference; RPD: relative percent difference. 444444444444444444444444444444444444444444444444444444444444444444
METHOD: Sample Preparation and Analysis: The samples were digested in a water bath using sulfuric acid, nitric acid, potassium permanganate, and hydroxyl amine hydrochloride according to EPA SW846 Method 7471A. Approximately 2 g of each soil sample was digested. Samples were analyzed for total mercury using Cold Vapor Atomic Absorption following Method 7471A.
HOLDING TIMES: Samples for mercury analysis were refrigerated until extraction.
Samples were extracted within 28 days of receipt and analyzed the same day as extraction, with the exception of EPA-1 and EPA-17 in Set 2 and EPA-2 in Set 3. Due to a misunderstanding of sample receipt date, EPA-1 and EPA-17 were extracted after the 28-day hold time. EPA-2 was not received at Battelle until after the 28-day hold time.
Batch Extraction Date Analysis Date Set 1 09/09/03 09/09/03 Set 2 09/29/03 09/29/03 Set 3 11/03/03 11/03/03
DETECTION LIMITS:
Reporting Limits (RLs) for mercury were based on the detection limit reported in the method (0.2 µg/L). This level was adjusted for individual sample processing volumes and factors as follows:
D-5
RL (pg/g dry weight) = (Detection Limit × Digest Volume)/Sample Weight
Where,
Detection limit = 0.2 µg/LDigest volume = 0.100 LSample weight (dry weight basis) = ~2g
The achieved detection limit of ~0.01µg/g met the target RL of 0.04 µg/g.
A laboratory method blank was prepared with each sample set. No mercury was detected in any of the blanks.
BLANKS:
LABORATORY CONTROL SAMPLE (LCS):
An LCS was prepared with each sample set to measure data quality in terms of accuracy.
Mercury was recovered within the 75–125% control limit for the LCS with each sample set.
Set 1 = 110% Set 2 = 105% Set 3 = 95%
MATRIX SPIKES (MSs):
An MS sample was prepared with each sample set. The percent recovery of mercury in the MS was calculated to measure data quality in terms of accuracy.
Mercury was recovered within the control limits of 75–125% for the MS in each sample set.
Set 1 = 94% Set 2 = 85% Set 3 = 122%
REPLICATES: One sample was prepared in duplicate with each sample set. The relative percent difference (RPD) between replicate analyses for mercury was calculated to measure data quality in terms of precision.
RPDs were within the limit of 20% except for the duplicates in Set 1. The concentration of mercury in the duplicate sample for Set 1 was very close to the RL, and the absolute difference in the duplicates was less than the RL. Because of the very low levels of mercury in the duplicate sample, this duplicate, with an RPD of 27%, was still considered to show acceptable precision.
Set 1 = 27% Set 2 = 3% Set 3 = 15%
D-6

STANDARD REFERENCE MATERIAL (SRM):
NIST 1944 NY/NJ Sediment SRM was prepared with each sample set. The percent difference (PD) between the measured value and the certified values was calculated to measure data quality in terms of accuracy. The SRMs were within the 25% PD control limit for each sample set.
Set 1 = 8% Set 2 = 3% Set 3 = 17%
PROBLEMS/ CORRECTIVE ACTIONS:
Three samples exceeded the 28-day holding time: EPA-1 and EPA-17 in Set 2 and EPA-2 in Set 3. These samples were analyzed in spite of the holding time exceedence. Data from these three samples are flagged in the report.
The duplicate precision for Set 1 exceeded 20%; however, low mercury levels in this sample contributed to the exceedence, as described in the replicate section above. Because of the low analyte levels, results for the duplicate in Set 1 were still considered to demonstrate acceptable precision.
D-7

WA5-11- PCDD/PCDFQC Batch 49971-13
PROJECT: Pilot Survey of Dioxins in Soil PARAMETER: CDD/CDF LABORATORY: Battelle Columbus, OH MATRIX: Soil SAMPLE CUSTODY: Soil samples for PCDD/PCDF were received at Battelle Columbus
between August 14, 2003, and October 22, 2003. Samples processed in QC Batch 49971-13 were homogenized and composited prior to being submitted for PCDD/PCDF extraction on September 10 and 15.
QA/QC MEASUREMENT QUALITY OBJECTIVES:
Parameter Method Blank
Internal Standard Recovery
LCS/MS Recovery
SRM %
Difference
Replicate Relative Precision
CDD/CDF <3 × RL or associated
samples >10X blank
concentrations
25–150% LCS within Method 1613B
Table 6 limits for OPR; MS within
50–120% Recoverya
#30% PD of certified or consensus
values
#30% RPDa
RL: reporting limit; LCS: laboratory control sample; MS: matrix spike; SRM: standard reference material; PD: percent difference; RPD: relative percent difference.
a Analyte concentrations must be >5 × RL.
METHOD: Soil samples were processed and analyzed for 17 2,3,7,8-substituted CDDs and CDFs and total dioixns and furans following general procedures in EPA Method 1613B.
Sample Preparation: Aliquots of each soil sample were weighed into individual jars and mixed with Hydromatrix drying agent. Approximately 20 g wet weight of each soil sample were used. The soil/Hydromatrix mixtures were spiked with 13C12-labeled CDD/CDF and PCB internal standard solutions. Matrix spike (MS) and the laboratory control sample (LCS) were spiked with native CDDs/CDFs and PCBs at this time. The soil/Hydromatrix mixtures were placed into Accelerated Solvent Extraction (ASE) cells. The samples were ASE extracted using methylene choride. Each extract was processed through gel permeation chromatography cleanup and then spiked with 2,3,7,8-TCDD-37Cl4 and PCB cleanup standards for monitoring recovery of analytes through the cleanup procedures. Each extract was processed through acid/base silica and carbon cleanup columns. Each extract was separated into a CDD/CDF and PCB fraction on the carbon column. The CDD/CDF extracts were spiked with
D-8

1,2,3,4-TCDD-13C12 and 1,2,3,7,8,9-HxCDD-13C12 recovery standard and concentrated to a final sample volume of 10 µL. The PCB extracts were prepared as described in a separate report for PCB analysis of QC Batch 49971-13.
CDD/CDF Analysis: Each extract was analyzed by GC/HRMS in the selected ion-monitoring mode at a resolution of 10,000 or greater. A DB5 column was used for analysis of the 17 2,3,7,8-CDDs/CDFs and a DB225 column was used for second column confirmation of 2,3,7,8-TCDF.
The following revisions to Method 1613 as well as several items to note specifically related to these analyses are summarized below:
1. Quality control samples processed with this batch of samples included one method blank, one LCS, one sediment standard reference material (SRM), one matrix spike, and three samples prepared in duplicate.
2. The GC/HRMS instrumentation was calibrated for CDDs/CDFs at levels specified in Method 1613 with one additional calibration standard at concentrations equivalent to ½ the level of Method 1613’s lowest calibration point. The calibration range corresponded to the following levels in the samples, assuming an average sample dry weight of 17.1554 g and a final sample volume of 10 µL: 0.15 to 120 pg/g dry for tetra compounds, 0.73 to 580 pg/g dry for penta through hepta compounds, and 1.50 to 1,200pg/g dry for octa compounds.
Any additional minor revisions to Method 1613 are fully documnented in the analytical record.
HOLDING TIMES: Samples for CDD/CDF analyses were stored frozen until extraction.
Samples were extracted within 5 days of when the composites were received for CDD/CDF analysis, and initial analysis was completed within 5 weeks of extraction.
SDG Batch Extraction Date Analysis Date 49971-13 9/15/2003 10/13–14/2003 10/18/2003 (confirmation)
DETECTION LIMITS:
Reporting Limits (RLs) for CDDs/CDFs were determined on the basis of the lowest reasonably achievable detectable amount, determined as ¼ the lowest calibration standard. This level was adjusted for individual sample processing volumes and factors as follows:
RL (pg/g dry weight) = (0.25 × Concentration in Low Standard × Pre-rejection Volume)/Sample Weight
Where,
Concentration in low standard = 0.25 to 2.5 pg/µL
D-9

Pre-injection volume = 10 µL Sample weight (dry weight basis) = ~ 17 g
The target RLs of 0.13–1.3 pg/g dry were achieved for all samples.
A laboratory method blank was prepared with the sample delivery group (SDG). Several analytes were found above the detection limit but below the action limit of <3X the RL.
BLANKS:
LABORATORY CONTROL SAMPLE:
An LCS was prepared with the SDG. The concentrations found were compared with limits in Method 1613B Table 6 ongoing precision and recovery sample to measure data quality in terms of accuracy.
49971-13: CDDs/CDFs were recovered within the control limits specified in Method 1613B Table 6.
An MS sample was prepared with the SDG. The percent recoveries of CDD/CDF in the MS were calculated to measure data quality in terms of accuracy.
49971-13: All CDDs/CDFs were recovered within the control limits of 50–120% except for 1,2,3,7,8,9-HxCDD, which had a recovery of 125%.
49971-13-17: CDD/CDF recoveries ranged from 94% to 125%.
MATRIX SPIKES:
LABELED INTERNAL STANDARDS:
Fifteen labeled internal standards were added to each sample prior to extraction. One labeled internal standard was also added to each sample prior to cleanup. Labeled internal standard recoveries were calculated to measure data quality in terms of accuracy (extraction efficiency).
49971-13: Internal standard recoveries were within the control limits for all analytes in all samples.
Three samples were prepared in duplicate with the SDG. The relative percent difference (RPD) between replicate analyses for CDDs/CDFs was calculated to measure data quality in terms of precision.
49971-13: For analytes >5X the RL, the RPDs ranges were
EPA 7: 5–13% EPA 8: 8–72% EPA 25: 1–5%
REPLICATES:
STANDARD REFERENCE MATERIAL (SRM):
NIST 1944 NY/NJ Sediment SRM was prepared with the SDG. Only reference values were available for CDDs/CDFs. The percent difference (PD) between the measured value and the reference values was calculated to measure data quality in terms of accuracy.
D-10

49971-13: The SRM was found to have very poor chromatography upon analysis. This sample was diluted and re-analyzed. The diluted analysis still had poor chromatography; however, results were obtained for nine of the analytes.
SRM PDs were within the control limits with the exception of OCDF, which had 35% PD.
PROBLEMS/ CORRECTIVE
One of the continuing calibrations associated with this set had one native fail the criteria in Method 1613B and another had two natives fail the
ACTIONS: criteria. The average daily response factor was used to re-calculate the results for these outliers.
D-11
WA5-11- PCDD/PCDFQC Batch 49917-23 and 49971-28
PROJECT: Pilot Survey of Dioxins in Soil PARAMETER: CDD/CDF LABORATORY: Battelle Columbus, OH MATRIX: Soil SAMPLE CUSTODY: Soil samples for CDDs/CDFs were received at Battelle Columbus
between August 14, 2003, and October 22, 2003. Samples processed in QC Batch 49971-23 were homogenized and composited prior to being extracted on November 6.
QA/QC MEASUREMENT QUALITY OBJECTIVES:
Parameter Method Blank
Internal Standard Recovery
LCS/MS Recovery
SRM % Difference
Replicate Relative Precision
CDD/CDF <3 × RL or associated
samples >10X blank
concentrations
25–150% LCS within Method 1613B
Table 6 limits for OPR; MS within
50–120% Recoverya
#30% PD of certified or consensus
values
#30% RPDa
RL: reporting limit; LCS: laboratory control sample; MS: matrix spike; SRM: standard reference material; PD: percent difference; RPD: relative percent difference. a Analyte concentrations must be >5 × RL.
METHOD: Soil samples were processed and analyzed for seventeen 2,3,7,8-substituted CDDs/CDFs and total dioixns and furans following general procedures in EPA Method 1613B.
Sample Preparation: Aliquots of each soil sample were weighed into individual jars and mixed with Hydromatrix drying agent. Approximately 20 g wet weight of each soil sample were used. The soil/Hydromatrix mixtures were spiked with 13C12-labeled CDD/CDF and PCB internal standard solutions. Matrix spike (MS) and the laboratory control sample (LCS) were spiked with native CDDs/CDFs and PCBs at this time. The soil/Hydromatrix mixtures were placed into Accelerated Solvent Extraction (ASE) cells. The samples were ASE extracted using methylene choride. Each extract was intended to go through GPC cleanup, but there was a problem with the GPC instrument, and three samples were lost. These three samples (EPA-2 COMP, EPA-4 COMP, and the method blank) were re-extracted in sample delivery group (SDG) 49971-28. Each extract was
D-12

spiked with 2,3,7,8-TCDD-37Cl4 and PCB cleanup standards for monitoring recovery of analytes through the cleanup procedures. All of the sample extracts from both SDGs were processed through the following cleanup procedures. Each extract was processed through acid/base wash, acid/base silica and carbon cleanup columns. Each extract was separated into a CDD/CDF and PCB fraction on the carbon column. The CDD/CDF fractions were spiked with 1,2,3,4-TCDD-13C12 and 1,2,3,7,8,9-HxCDD13C12 recovery standard and concentrated to a final sample volume of 10 µL. The PCB extracts were prepared as described in a separate report for PCB analysis of QC Batches 49971-23 and 49971-28.
CDD/CDF Analysis: Each extract was analyzed by GC/HRMS in the selected ion-monitoring mode at a resolution of 10,000 or greater. A DB5 column was used for analysis of the 17 2,3,7,8-CDDs/CDFs and a DB225 column was used for second column confirmation of 2,3,7,8-TCDF.
The following revisions to Method 1613 as well as several items to note specifically related to these analyses are summarized below:
1. Quality control samples processed with this batch of samples included one method blank, one LCS, one sediment standard reference material (SRM), one matrix spike, and three samples prepared in duplicate.
2. The GC/HRMS instrumentation was calibrated for CDDs/CDFs at levels specified in Method 1613 with one additional calibration standard at concentrations equivalent to ½ the level of Method 1613’s lowest calibration point. The calibration range corresponded to the following levels in the samples, assuming an average sample dry weight of 16.599 g and a final sample volume of 10 µL: 0.15 to 120 pg/g dry for tetra compounds, 0.73 to 600 pg/g dry for penta through hepta compounds, and 1.50 to 1,200 pg/g dry for octa compounds.
Any additional minor revisions to Method 1613 are fully documnented in the analytical record.
Samples for CDD/CDF analyses were stored frozen until extraction.
HOLDING TIMES:Samples were extracted within 15 days of when the last composites were received for CDD/CDF analysis, and initial analysis was completed within 5 weeks of extraction.
SDG Batch Extraction Date Analysis Date 49971-23 11/06/2003 11/18–20/2003 49971-28 11/12/2003 12/09/2003
(re-extracts) (confirmation)
DETECTION LIMITS: Reporting Limits (RLs) for CDDs/CDFs were determined on the basis of the
lowest reasonably achievable detectable amount, determined as ¼ the lowest calibration standard. This level was adjusted for individual sample processing volumes and factors as follows:
D-13

RL (pg/g dry weight) = (0.25 × Concentration in Low Standard × Pre-injection Volume)/Sample Weight
Where,
Concentration in low standard = 0.25 to 2.5 pg/µLPre-injection volume = 10 µLSample weight (dry weight basis) = ~ 16 g
The target RLs of 0.13–1.3 pg/g dry were achieved for all samples.
BLANKS: A laboratory method blank was prepared with the SDG.
49971-23: Several analytes were found above the detection limit, but below the action limit of <3X the RL.
LABORATORY CONTROL SAMPLE:
An LCS was prepared with the SDG. The concentrations found were compared with limits in Method 1613B Table 6 ongoing precision and recovery sample to measure data quality in terms of accuracy.
49971-23: CDD/CDF were recovered within the control limits specified in Method 1613B Table 6.
MATRIX SPIKES: An MS sample was prepared with the SDG. The percent recoveries of CDDs/CDFs in the MS were calculated to measure data quality in terms of accuracy.
49971-23: All CDDs/CDFs were recovered within the control limits of 50–120% except for OCDD, which had a recovery of –65%. To be effective, the spike concentration needs to be greater than five times the background concentration of the analyte of interest.a For OCDD the spike level was not greater than five times the background concentration.
49971-23-20: CDD/CDF recoveries ranged from –65 to 92%.
LABELED INTERNAL STANDARDS:
Fifteen labeled internal standards were added to each sample prior to extraction. One labeled internal standard was also added to each sample prior to cleanup. Labeled internal standard recoveries were calculated to measure data quality in terms of accuracy (extraction efficiency).
49971-23: Internal standard recoveries were within the control limits for all analytes in all samples except in EPA 4 COMP, EPA 4 COMP DUP, EPA 4 COMP MS, EPA 29 COMP, and EPA 30 COMP. Between one and nine internal standards fell outside the QC limits in these samples.
Poor recovery in EPA 29 COMP appears to be from interferences in the sample rather than from poor extraction efficiency or loss in cleanup. This sample was diluted 1:3 and re-analyzed to minimize the effect of
D-14
interferences. Dilution results are reported for this sample; however, interference effects were still seen, and recoveries were not significantly improved with the dilution.
Three samples were prepared in duplicate with the SDG. The relative percent difference (RPD) between replicate analyses for CDDs/CDFs was calculated to measure data quality in terms of precision.
49971-23: For analytes >5X the RL the RPDs ranged from:
EPA 4: 1–38% EPA 20: 2–38% EPA 28: 0–59%
REPLICATES:
STANDARD REFERENCE MATERIAL (SRM):
NIST 1944 NY/NJ Sediment SRM was prepared with the SDG. Only reference values are available for CDDs/CDFs. The percent difference (PD) between the measured value and the reference values was calculated to measure data quality in terms of accuracy.
49971-23: SRM PDs were within the control limits with the exception of 1,2,3,7,8,9-HxCDD, which had 55% PD.
PROBLEMS/ CORRECTIVE ACTIONS:
All of the continuing calibrations associated with this set had between three and five natives fail the criteria in Method 1613B. The average daily response factor was used to re-calculate the results for these outliers.
a Provost, LP; Elder, RS. (1983) Interpretation of percent recovery data. American Laboratory December, pp. 57–62.
D-15

APPENDIX E
PCB DATA
The following codes are used in this report:
Codes Definition
C indicates that the congener co-elutes, the congener that it co-elutes with is indicated by the number following C
J reported value < reporting limit
RL the low calibration level adjusted for sample final volume and weight
U not detected
& outside QC limits
E-1

Pilot Survey of Levels of PCDDs, PCDFs, PCBs and Mercury in Rural Soils fo the U.S.- Final Report WA 5-11 Batch 1 BATTELLE SDG 49971-13 MOD 1668M
NOTES QC CLIENT_ ID PROCEDURAL BLANK Penn Nursery, PA McNay Farm, IA Lake Scott, KS Lake Scott, KS LAB_SAMP_ ID Method Blank EPA-1 COMP EPA 7 COMP EPA 8 COMP EPA 8 COMP DUP SAMPLE_WGT_VOL 17.3100 15.6769 16.0618 15.5239 15.8020 SAMP_WGT_VOL_UNIT G DRYWT G DRYWT G DRYWT G DRYWT G DRYWT PCT_DRY_WT 78.27 81.32 78.17 78.17 COLLECTION_DATE 8/17/2003 9/2/2003 8/19/2003 8/19/2003 RECEIPT_DATE 8/19/2003 9/4/2003 8/23/2003 8/23/2003 COMPOSITE_DATE 9/10/2003 9/10/2003 9/4/2003 9/4/2003 EXTRACT_DATE 9/15/2003 9/15/2003 9/15/2003 9/15/2003 9/15/2003 ANALYSIS_DATE 10/1/2003 10/1/2003 10/1/2003 10/2/2003 10/2/2003 DIOXIN_ EXTRACT_ LRB_ NUMBER 49971-13-20 49971-13-02 49971-13-03 49971-13-04 49971-13-15 REPORTING UNIT PG/G DRYWT PG/G DRYWT PG/G DRYWT PG/G DRYWT PG/G DRYWT REPORTING LIMIT (RL) 0.29 0.32 0.31 0.32 0.32
PARAM_NAME RESULT LAB_QUAL RESULT LAB_QUAL RESULT LAB_QUAL RESULT LAB_QUAL RESULT LAB_QUAL PCB-1 1.02 2.25 1.16 7.79 2.18 PCB-2 U 1.02 0.55 4.85 0.80 PCB-3 0.38 2.60 1.16 5.77 1.81 PCB-4 2.38 U 1.96 24.41 U PCB-10 U U U 1.45 U PCB-9 U U U 4.61 U PCB-7 U U U 2.15 U PCB-6 U 1.16 1.09 15.44 U PCB-5 U U U 1.69 U PCB-8 0.92 4.65 2.97 18.02 U PCB-19 0.68 0.41 0.63 14.30 U PCB-14 U U U 0.38 U PCB-30 C18 C18 C18 C18 C18 PCB-18 0.72 C 3.40 C 2.94 C 34.38 C 3.72 C PCB-11 U 5.07 1.62 9.16 U PCB-17 1.06 1.66 1.48 18.49 2.09 PCB-13 C12 C12 C12 C12 C12 PCB-27 C16 C16 C16 C16 C16 PCB-12 0.60 C CU CU 13.20 C CU PCB-24 C16 C16 C16 C16 C16 PCB-16 1.05 C 1.74 C 1.41 C 16.98 C 2.07 C PCB-15 0.78 4.26 1.46 7.19 U PCB-54 U U U 3.14 U PCB-32 0.34 1.11 0.92 5.80 1.22 PCB-34 U U U 1.18 U PCB-23 U U U U U PCB-26 0.54 C 1.10 C 0.78 C 16.50 C 0.94 C PCB-29 C26 C26 C26 C26 C26 PCB-25 0.08 J 0.39 0.34 5.92 U PCB-50 CU 0.74 C 0.62 C 16.78 C 0.58 C PCB-53 C50 C50 C50 C50 C50 PCB-31 1.13 6.10 3.27 18.24 4.50 PCB-28 C20 C20 C20 C20 C20 PCB-20 2.48 C 9.72 C 5.40 C 38.28 C 8.80 C PCB-45 CU 0.86 C 0.86 C 17.22 C 0.82 C PCB-21 C20 C20 C20 C20 C20 PCB-51 C45 C45 C45 C45 C45 PCB-33 C20 C20 C20 C20 C20 PCB-46 U U U 4.49 U PCB-22 0.63 2.65 1.45 8.13 2.16 PCB-52 C43 C43 C43 C43 C43 PCB-73 C43 C43 C43 C43 C43 PCB-43 3.21 C 17.07 C 6.96 C 40.77 C 9.36 C PCB-36 U U U U U PCB-69 C49 C49 C49 C49 C49 PCB-49 1.16 C 7.08 C 2.58 C 18.42 C 2.66 C PCB-39 U U U U U PCB-48 U U 0.59 11.99 0.72 PCB-104 U U U U U PCB-65 C44 C44 C44 C44 C44 PCB-47 C44 C44 C44 C44 C44 PCB-44 3.30 C 9.06 C 4.35 C 25.89 C 5.97 C PCB-62 C59 C59 C59 C59 C59 PCB-38 U U U U U PCB-75 C59 C59 C59 C59 C59 PCB-59 CU 0.60 C 0.30 CJ 3.96 C 0.27 CJ PCB-96 U U U 7.38 U PCB-42 0.37 1.29 0.65 6.69 0.93 PCB-35 U U U 7.76 U PCB-41 C40 C40 C40 C40 C40 PCB-71 C40 C40 C40 C40 C40 PCB-40 1.17 C 2.37 C 1.71 C 16.29 C 2.49 C PCB-37 1.00 3.96 1.51 8.98 1.42 PCB-64 1.05 2.97 1.49 6.45 2.17 PCB-72 U U U U U PCB-103 U U U 1.29 U PCB-68 U U U U U
E-1

Pilot Survey of Levels of PCDDs, PCDFs, PCBs and Mercury in Rural Soils fo the U.S.- Final Report WA 5-11 Batch 1 BATTELLE SDG 49971-13 MOD 1668M
NOTES QC CLIENT_ ID PROCEDURAL BLANK Penn Nursery, PA McNay Farm, IA Lake Scott, KS Lake Scott, KS LAB_SAMP_ ID Method Blank EPA-1 COMP EPA 7 COMP EPA 8 COMP EPA 8 COMP DUP SAMPLE_WGT_VOL 17.3100 15.6769 16.0618 15.5239 15.8020 SAMP_WGT_VOL_UNIT G DRYWT G DRYWT G DRYWT G DRYWT G DRYWT PCT_DRY_WT 78.27 81.32 78.17 78.17 COLLECTION_DATE 8/17/2003 9/2/2003 8/19/2003 8/19/2003 RECEIPT_DATE 8/19/2003 9/4/2003 8/23/2003 8/23/2003 COMPOSITE_DATE 9/10/2003 9/10/2003 9/4/2003 9/4/2003 EXTRACT_DATE 9/15/2003 9/15/2003 9/15/2003 9/15/2003 9/15/2003 ANALYSIS_DATE 10/1/2003 10/1/2003 10/1/2003 10/2/2003 10/2/2003 DIOXIN_ EXTRACT_ LRB_ NUMBER 49971-13-20 49971-13-02 49971-13-03 49971-13-04 49971-13-15 REPORTING UNIT PG/G DRYWT PG/G DRYWT PG/G DRYWT PG/G DRYWT PG/G DRYWT REPORTING LIMIT (RL) 0.29 0.32 0.31 0.32 0.32
PARAM_NAME RESULT LAB_QUAL RESULT LAB_QUAL RESULT LAB_QUAL RESULT LAB_QUAL RESULT LAB_QUAL PCB-94 U U U 2.45 U PCB-57 0.23 J 0.75 U U 0.82 PCB-95 6.20 24.25 8.09 76.11 14.65 PCB-58 U U U 3.94 U PCB-100 C93 C93 C93 C93 C93 PCB-93 CU CU CU 15.04 C CU PCB-67 U U U U U PCB-102 C93 C93 C93 C93 C93 PCB-98 C93 C93 C93 C93 C93 PCB-63 U 0.30 J U U U PCB-88 0.88 C 3.78 C 1.32 C 17.56 C 2.24 C PCB-61 7.60 C 18.44 C 7.04 C 45.56 C 10.36 C PCB-70 C61 C61 C61 C61 C61 PCB-76 C61 C61 C61 C61 C61 PCB-91 C88 C88 C88 C88 C88 PCB-74 C61 C61 C61 C61 C61 PCB-84 2.64 6.65 2.27 20.37 5.34 PCB-66 3.94 9.68 3.16 19.58 3.70 PCB-55 U U U U U PCB-89 U U U 3.52 U PCB-121 U U U U U PCB-56 1.72 3.19 1.30 11.48 2.01 PCB-60 1.01 2.07 0.84 4.10 1.08 PCB-92 1.75 7.84 2.26 17.66 3.22 PCB-80 U U U U U PCB-155 U U U U U PCB-113 C90 C90 C90 C90 C90 PCB-90 10.11 C 46.89 C 11.76 C 100.77 C 17.19 C PCB-101 C90 C90 C90 C90 C90 PCB-152 U U U 0.95 U PCB-150 U U U 0.73 U PCB-83 4.71 C 28.62 C 7.50 C 37.98 C 7.35 C PCB-99 C83 C83 C83 C83 C83 PCB-136 1.41 6.06 1.74 23.70 2.79 PCB-112 C83 C83 C83 C83 C83 PCB-145 U U U U U PCB-109 C86 C86 C86 C86 C86 PCB-119 C86 C86 C86 C86 C86 PCB-79 U 1.04 U 2.21 U PCB-97 C86 C86 C86 C86 C86 PCB-86 7.98 C 23.46 C 6.66 C 62.46 C 11.94 C PCB-125 C86 C86 C86 C86 C86 PCB-87 C86 C86 C86 C86 C86 PCB-78 U U U U U PCB-117 C85 C85 C85 C85 C85 PCB-116 C85 C85 C85 C85 C85 PCB-85 1.59 C 10.11 C 2.91 C 14.04 C 2.88 C PCB-110 11.58 C 33.42 C 10.94 C 88.40 C 17.72 C PCB-115 C110 C110 C110 C110 C110 PCB-81 U U U U U PCB-148 U U U U U PCB-82 1.45 3.33 0.99 10.46 2.19 PCB-111 U U U U U PCB-77 U 3.28 1.25 3.53 0.46 PCB-151 C135 C135 C135 C135 C135 PCB-135 3.30 C 26.52 C 6.87 C 50.52 C 6.15 C PCB-154 C135 C135 C135 C135 C135 PCB-120 U U U U U PCB-144 0.45 2.72 0.53 7.44 0.83 PCB-147 5.74 C 45.64 C 9.34 C 89.14 C 12.30 C PCB-149 C147 C147 C147 C147 C147 PCB-134 0.58 C CU 0.40 C 6.64 C 1.00 C PCB-143 C134 C134 C134 C134 C134 PCB-124 C108 C108 C108 C108 C108 PCB-108 0.36 C 2.32 C 0.68 C 3.78 C 0.58 C PCB-139 CU 1.36 C CU 1.70 C CU PCB-140 C139 C139 C139 C139 C139 PCB-107 C106 C106 C106 C106 C106 PCB-123 C106 C106 C106 C106 C106 PCB-131 U U U U U PCB-106 CU 4.42 C 2.17 C 7.53 C 1.21 C PCB-142 U U U U 0.34
E-2

Pilot Survey of Levels of PCDDs, PCDFs, PCBs and Mercury in Rural Soils fo the U.S.- Final Report WA 5-11 Batch 1 BATTELLE SDG 49971-13 MOD 1668M
NOTES QC CLIENT_ ID PROCEDURAL BLANK Penn Nursery, PA McNay Farm, IA Lake Scott, KS Lake Scott, KS LAB_SAMP_ ID Method Blank EPA-1 COMP EPA 7 COMP EPA 8 COMP EPA 8 COMP DUP SAMPLE_WGT_VOL 17.3100 15.6769 16.0618 15.5239 15.8020 SAMP_WGT_VOL_UNIT G DRYWT G DRYWT G DRYWT G DRYWT G DRYWT PCT_DRY_WT 78.27 81.32 78.17 78.17 COLLECTION_DATE 8/17/2003 9/2/2003 8/19/2003 8/19/2003 RECEIPT_DATE 8/19/2003 9/4/2003 8/23/2003 8/23/2003 COMPOSITE_DATE 9/10/2003 9/10/2003 9/4/2003 9/4/2003 EXTRACT_DATE 9/15/2003 9/15/2003 9/15/2003 9/15/2003 9/15/2003 ANALYSIS_DATE 10/1/2003 10/1/2003 10/1/2003 10/2/2003 10/2/2003 DIOXIN_ EXTRACT_ LRB_ NUMBER 49971-13-20 49971-13-02 49971-13-03 49971-13-04 49971-13-15 REPORTING UNIT PG/G DRYWT PG/G DRYWT PG/G DRYWT PG/G DRYWT PG/G DRYWT REPORTING LIMIT (RL) 0.29 0.32 0.31 0.32 0.32
PARAM_NAME RESULT LAB_QUAL RESULT LAB_QUAL RESULT LAB_QUAL RESULT LAB_QUAL RESULT LAB_QUAL PCB-118 9.00 31.73 12.12 71.33 11.47 PCB-132 2.90 13.62 2.93 29.99 5.55 PCB-122 U U U U U PCB-188 U U U U U PCB-114 U U U U U PCB-133 U U U 1.47 U PCB-179 0.49 10.24 2.21 12.76 1.84 PCB-165 U U U U U PCB-146 0.90 C 16.92 C 3.82 C 5.28 C 2.24 C PCB-105 3.28 12.44 6.28 20.66 4.57 PCB-184 U U U U U PCB-161 C146 C146 C146 C146 C146 PCB-176 0.16 J 2.07 0.42 3.81 0.44 PCB-153 6.02 C 98.42 C 25.08 C 90.32 C 16.74 C PCB-168 C153 C153 C153 C153 C153 PCB-141 1.13 10.54 2.06 18.88 2.54 PCB-186 U U U U U PCB-130 0.55 4.64 1.27 4.92 1.26 PCB-127 U U U U U PCB-137 0.76 C 9.00 C 2.14 C 9.56 C 1.90 C PCB-164 C137 C137 C137 C137 C137 PCB-163 C129 C129 C129 C129 C129 PCB-138 C129 C129 C129 C129 C129 PCB-129 6.60 C 109.68 C 25.32 C 87.64 C 19.20 C PCB-160 C129 C129 C129 C129 C129 PCB-158 0.71 9.26 1.80 8.29 1.53 PCB-178 0.24 J 10.79 2.50 6.60 1.50 PCB-175 U 1.56 U U U PCB-126 U U U U U PCB-166 C128 C128 C128 C128 C128 PCB-128 1.22 C 18.04 C 3.76 C 7.60 C 3.22 C PCB-187 1.46 62.64 11.61 34.82 7.24 PCB-182 U 0.69 U U U PCB-183 C174 C174 C174 C174 C174 PCB-185 C174 C174 C174 C174 C174 PCB-159 U 1.15 U U U PCB-174 1.47 C 48.09 C 9.27 C 46.32 C 7.20 C PCB-162 U U U 0.37 U PCB-177 0.39 16.40 3.75 12.46 2.65 PCB-202 0.19 J 16.73 1.96 3.01 1.08 PCB-167 0.35 6.45 1.35 3.09 0.97 PCB-181 U U U U U PCB-171 0.26 CJ 8.52 C 1.40 C 6.88 C 1.24 C PCB-173 C171 C171 C171 C171 C171 PCB-201 U 6.61 0.72 2.44 U PCB-156 0.72 C 8.38 C 2.88 C 7.20 C 1.68 C PCB-157 C156 C156 C156 C156 C156 PCB-204 U U U U U PCB-197 0.10 CJ 6.26 C 0.84 C 2.64 C CU PCB-200 C197 C197 C197 C197 C197 PCB-172 U 8.16 1.48 4.53 0.90 PCB-192 U U U U U PCB-193 C180 C180 C180 C180 C180 PCB-180 1.40 C 71.82 C 14.20 C 57.54 C 10.18 C PCB-191 U U U 1.11 U PCB-170 0.57 27.12 6.84 19.57 4.23 PCB-190 0.21 J 6.10 1.90 4.65 0.74 PCB-169 0.32 0.42 0.76 U U PCB-198 0.58 C 66.76 C 10.10 C 14.08 C 4.36 C PCB-199 C198 C198 C198 C198 C198 PCB-196 0.21 J 17.70 2.87 7.02 1.69 PCB-203 0.49 35.37 5.71 10.06 3.05 PCB-208 0.23 J 20.84 4.03 2.10 1.11 PCB-195 0.14 J 9.51 2.10 4.54 1.31 PCB-189 0.40 1.71 0.50 0.84 U PCB-207 U 9.39 1.74 1.02 U PCB-194 0.52 32.18 6.59 13.81 3.09 PCB-205 0.77 1.73 0.47 0.74 U PCB-206 1.31 51.71 9.90 6.76 2.94 PCB-209 1.71 44.74 11.96 4.59 3.73
J = reported value < Reporting Limit (RL). U = not detected. RL = the low calibration level adjusted for sample final volume and weight. & = outside QC limits.
E-3

Pilot Survey of Levels of PCDDs, PCDFs, PCBs and Mercury in Rural Soils fo the U.S.- Final Report WA 5-11 Batch 1 BATTELLE SDG 49971-13 MOD 1668M
NOTES CLIENT_ ID Bennington, VT Caldwell, OH Dixon Springs, IL Quincy, FL Bay St. Louis, MS LAB_SAMP_ ID EPA 11 COMP EPA 14 COMP EPA 16 COMP EPA 17 COMP EPA 18 COMP SAMPLE_WGT_VOL 15.9883 17.0640 17.6250 14.5225 16.6717 SAMP_WGT_VOL_UNIT G DRYWT G DRYWT G DRYWT G DRYWT G DRYWT PCT_DRY_WT 79.62 83.86 86.84 72.84 83.08 COLLECTION_DATE 8/28/2003 8/21/2003 8/16/2003 8/17/2003 8/19/2003 RECEIPT_DATE 8/29/2003 8/22/2003 8/18/2003 8/19/2003 8/21/2003 COMPOSITE_DATE 9/4/2003 9/4/2003 9/4/2003 9/10/2003 9/4/2003 EXTRACT_DATE 9/15/2003 9/15/2003 9/15/2003 9/15/2003 9/15/2003 ANALYSIS_DATE 10/2/2003 10/2/2003 10/2/2003 10/2/2003 10/2/2003 DIOXIN_ EXTRACT_ LRB_ NUMBER 49971-13-05 49971-13-06 49971-13-07 49971-13-08 49971-13-09 REPORTING UNIT PG/G DRYWT PG/G DRYWT PG/G DRYWT PG/G DRYWT PG/G DRYWT REPORTING LIMIT (RL) 0.31 0.29 0.28 0.34 0.30
PARAM_NAME RESULT LAB_QUAL RESULT LAB_QUAL RESULT LAB_QUAL RESULT LAB_QUAL RESULT LAB_QUAL PCB-1 3.37 1.26 0.99 2.43 2.95 PCB-2 1.49 0.51 0.39 0.92 0.87 PCB-3 3.22 1.37 1.03 1.70 3.37 PCB-4 6.76 1.74 1.30 U 3.36PCB-10 U U U U U PCB-9 1.23 U U U U PCB-7 0.83 U U U U PCB-6 4.19 1.14 0.83 1.21 1.77PCB-5 U U U U U PCB-8 11.34 3.40 2.82 4.77 7.41 PCB-19 2.36 0.55 0.39 0.50 1.21PCB-14 U U U U UPCB-30 C18 C18 C18 C18 C18 PCB-18 11.26 C 3.30 C 3.02 C 3.32 C 14.46 C PCB-11 3.04 1.99 1.83 1.78 2.07 PCB-17 5.86 1.70 1.47 1.70 5.44PCB-13 C12 C12 C12 C12 C12PCB-27 C16 C16 C16 C16 C16 PCB-12 3.34 C 0.76 C 0.38 C CU 0.94 CPCB-24 C16 C16 C16 C16 C16 PCB-16 5.73 C 1.83 C 1.59 C 1.95 C 5.01 C PCB-15 6.49 2.08 1.67 1.96 6.17 PCB-54 0.44 U U U U PCB-32 2.78 1.06 1.06 1.24 3.97PCB-34 U U U U UPCB-23 U U U U U PCB-26 4.38 C 1.22 C 0.76 C 1.00 C 3.76 CPCB-29 C26 C26 C26 C26 C26 PCB-25 1.73 0.46 0.33 0.42 1.21 PCB-50 3.56 C 0.96 C 0.70 C 0.58 C 5.76 CPCB-53 C50 C50 C50 C50 C50 PCB-31 12.39 4.91 4.63 4.89 42.67PCB-28 C20 C20 C20 C20 C20 PCB-20 22.96 C 9.68 C 7.52 C 8.48 C 45.04 C PCB-45 4.34 C 1.12 C 0.94 C 0.64 C 6.58 CPCB-21 C20 C20 C20 C20 C20PCB-51 C45 C45 C45 C45 C45PCB-33 C20 C20 C20 C20 C20PCB-46 U U U 0.24 J 1.85 PCB-22 5.25 2.80 1.91 2.01 12.13PCB-52 C43 C43 C43 C43 C43PCB-73 C43 C43 C43 C43 C43 PCB-43 21.33 C 14.97 C 12.39 C 10.77 C 119.91 CPCB-36 U U U 0.11 J 1.69PCB-69 C49 C49 C49 C49 C49 PCB-49 8.38 C 4.32 C 3.72 C 2.80 C 47.64 CPCB-39 U U U U U PCB-48 3.09 1.09 0.74 0.71 8.15PCB-104 U U U U UPCB-65 C44 C44 C44 C44 C44PCB-47 C44 C44 C44 C44 C44 PCB-44 11.76 C 9.48 C 6.57 C 5.73 C 64.14 CPCB-62 C59 C59 C59 C59 C59PCB-38 U U U U UPCB-75 C59 C59 C59 C59 C59 PCB-59 1.26 C 0.75 C 0.48 C 0.30 CJ 3.93 C PCB-96 1.21 0.26 J 0.16 J U 1.21 PCB-42 2.39 1.73 1.06 0.86 11.03 PCB-35 1.72 0.42 0.12 J U UPCB-41 C40 C40 C40 C40 C40PCB-71 C40 C40 C40 C40 C40 PCB-40 5.73 C 5.34 C 2.37 C 2.16 C 25.89 C PCB-37 5.89 5.14 1.84 1.12 18.13 PCB-64 4.31 4.31 2.55 1.93 39.13PCB-72 U U U U UPCB-103 U U U U UPCB-68 U U U U U
E-4
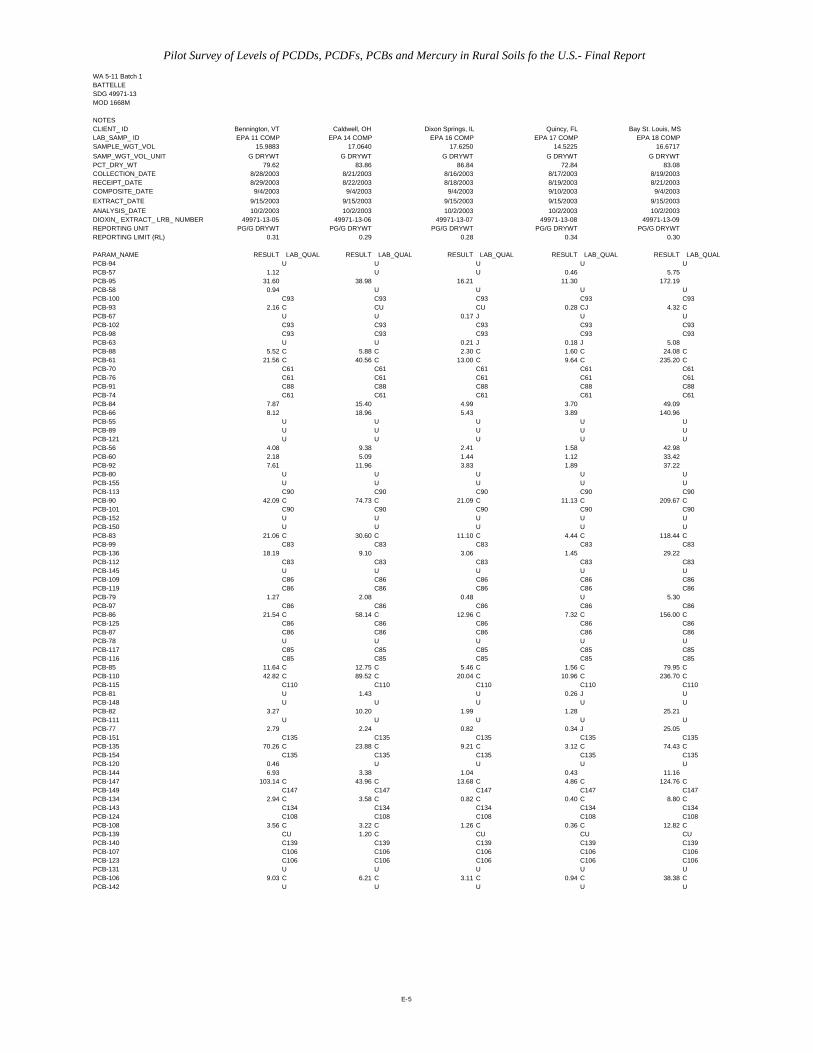
Pilot Survey of Levels of PCDDs, PCDFs, PCBs and Mercury in Rural Soils fo the U.S.- Final Report WA 5-11 Batch 1 BATTELLE SDG 49971-13 MOD 1668M
NOTES CLIENT_ ID Bennington, VT Caldwell, OH Dixon Springs, IL Quincy, FL Bay St. Louis, MS LAB_SAMP_ ID EPA 11 COMP EPA 14 COMP EPA 16 COMP EPA 17 COMP EPA 18 COMP SAMPLE_WGT_VOL 15.9883 17.0640 17.6250 14.5225 16.6717 SAMP_WGT_VOL_UNIT G DRYWT G DRYWT G DRYWT G DRYWT G DRYWT PCT_DRY_WT 79.62 83.86 86.84 72.84 83.08 COLLECTION_DATE 8/28/2003 8/21/2003 8/16/2003 8/17/2003 8/19/2003 RECEIPT_DATE 8/29/2003 8/22/2003 8/18/2003 8/19/2003 8/21/2003 COMPOSITE_DATE 9/4/2003 9/4/2003 9/4/2003 9/10/2003 9/4/2003 EXTRACT_DATE 9/15/2003 9/15/2003 9/15/2003 9/15/2003 9/15/2003 ANALYSIS_DATE 10/2/2003 10/2/2003 10/2/2003 10/2/2003 10/2/2003 DIOXIN_ EXTRACT_ LRB_ NUMBER 49971-13-05 49971-13-06 49971-13-07 49971-13-08 49971-13-09 REPORTING UNIT PG/G DRYWT PG/G DRYWT PG/G DRYWT PG/G DRYWT PG/G DRYWT REPORTING LIMIT (RL) 0.31 0.29 0.28 0.34 0.30
PARAM_NAME RESULT LAB_QUAL RESULT LAB_QUAL RESULT LAB_QUAL RESULT LAB_QUAL RESULT LAB_QUALPCB-94 U U U U U PCB-57 1.12 U U 0.46 5.75 PCB-95 31.60 38.98 16.21 11.30 172.19 PCB-58 0.94 U U U UPCB-100 C93 C93 C93 C93 C93 PCB-93 2.16 C CU CU 0.28 CJ 4.32 CPCB-67 U U 0.17 J U UPCB-102 C93 C93 C93 C93 C93PCB-98 C93 C93 C93 C93 C93PCB-63 U U 0.21 J 0.18 J 5.08 PCB-88 5.52 C 5.88 C 2.30 C 1.60 C 24.08 C PCB-61 21.56 C 40.56 C 13.00 C 9.64 C 235.20 CPCB-70 C61 C61 C61 C61 C61PCB-76 C61 C61 C61 C61 C61PCB-91 C88 C88 C88 C88 C88PCB-74 C61 C61 C61 C61 C61 PCB-84 7.87 15.40 4.99 3.70 49.09 PCB-66 8.12 18.96 5.43 3.89 140.96PCB-55 U U U U UPCB-89 U U U U UPCB-121 U U U U U PCB-56 4.08 9.38 2.41 1.58 42.98 PCB-60 2.18 5.09 1.44 1.12 33.42 PCB-92 7.61 11.96 3.83 1.89 37.22PCB-80 U U U U UPCB-155 U U U U UPCB-113 C90 C90 C90 C90 C90 PCB-90 42.09 C 74.73 C 21.09 C 11.13 C 209.67 CPCB-101 C90 C90 C90 C90 C90PCB-152 U U U U UPCB-150 U U U U U PCB-83 21.06 C 30.60 C 11.10 C 4.44 C 118.44 CPCB-99 C83 C83 C83 C83 C83 PCB-136 18.19 9.10 3.06 1.45 29.22PCB-112 C83 C83 C83 C83 C83PCB-145 U U U U UPCB-109 C86 C86 C86 C86 C86PCB-119 C86 C86 C86 C86 C86 PCB-79 1.27 2.08 0.48 U 5.30PCB-97 C86 C86 C86 C86 C86 PCB-86 21.54 C 58.14 C 12.96 C 7.32 C 156.00 CPCB-125 C86 C86 C86 C86 C86PCB-87 C86 C86 C86 C86 C86PCB-78 U U U U UPCB-117 C85 C85 C85 C85 C85PCB-116 C85 C85 C85 C85 C85 PCB-85 11.64 C 12.75 C 5.46 C 1.56 C 79.95 C PCB-110 42.82 C 89.52 C 20.04 C 10.96 C 236.70 CPCB-115 C110 C110 C110 C110 C110PCB-81 U 1.43 U 0.26 J UPCB-148 U U U U U PCB-82 3.27 10.20 1.99 1.28 25.21PCB-111 U U U U U PCB-77 2.79 2.24 0.82 0.34 J 25.05PCB-151 C135 C135 C135 C135 C135 PCB-135 70.26 C 23.88 C 9.21 C 3.12 C 74.43 CPCB-154 C135 C135 C135 C135 C135 PCB-120 0.46 U U U U PCB-144 6.93 3.38 1.04 0.43 11.16 PCB-147 103.14 C 43.96 C 13.68 C 4.86 C 124.76 CPCB-149 C147 C147 C147 C147 C147 PCB-134 2.94 C 3.58 C 0.82 C 0.40 C 8.80 CPCB-143 C134 C134 C134 C134 C134PCB-124 C108 C108 C108 C108 C108 PCB-108 3.56 C 3.22 C 1.26 C 0.36 C 12.82 CPCB-139 CU 1.20 C CU CU CUPCB-140 C139 C139 C139 C139 C139PCB-107 C106 C106 C106 C106 C106PCB-123 C106 C106 C106 C106 C106PCB-131 U U U U U PCB-106 9.03 C 6.21 C 3.11 C 0.94 C 38.38 CPCB-142 U U U U U
E-5

Pilot Survey of Levels of PCDDs, PCDFs, PCBs and Mercury in Rural Soils fo the U.S.- Final Report WA 5-11 Batch 1 BATTELLE SDG 49971-13 MOD 1668M
NOTES CLIENT_ ID Bennington, VT Caldwell, OH Dixon Springs, IL Quincy, FL Bay St. Louis, MS LAB_SAMP_ ID EPA 11 COMP EPA 14 COMP EPA 16 COMP EPA 17 COMP EPA 18 COMP SAMPLE_WGT_VOL 15.9883 17.0640 17.6250 14.5225 16.6717 SAMP_WGT_VOL_UNIT G DRYWT G DRYWT G DRYWT G DRYWT G DRYWT PCT_DRY_WT 79.62 83.86 86.84 72.84 83.08 COLLECTION_DATE 8/28/2003 8/21/2003 8/16/2003 8/17/2003 8/19/2003 RECEIPT_DATE 8/29/2003 8/22/2003 8/18/2003 8/19/2003 8/21/2003 COMPOSITE_DATE 9/4/2003 9/4/2003 9/4/2003 9/10/2003 9/4/2003 EXTRACT_DATE 9/15/2003 9/15/2003 9/15/2003 9/15/2003 9/15/2003 ANALYSIS_DATE 10/2/2003 10/2/2003 10/2/2003 10/2/2003 10/2/2003 DIOXIN_ EXTRACT_ LRB_ NUMBER 49971-13-05 49971-13-06 49971-13-07 49971-13-08 49971-13-09 REPORTING UNIT PG/G DRYWT PG/G DRYWT PG/G DRYWT PG/G DRYWT PG/G DRYWT REPORTING LIMIT (RL) 0.31 0.29 0.28 0.34 0.30
PARAM_NAME RESULT LAB_QUAL RESULT LAB_QUAL RESULT LAB_QUAL RESULT LAB_QUAL RESULT LAB_QUAL PCB-118 37.97 68.14 17.38 8.34 347.87 PCB-132 24.08 19.75 4.71 2.41 64.97PCB-122 U U U U UPCB-188 U U U U UPCB-114 U 1.46 U 0.19 J 7.35 PCB-133 3.03 0.98 0.72 U U PCB-179 54.08 5.06 3.24 0.87 21.91PCB-165 U U U U U PCB-146 28.04 C CU 5.96 C 1.40 C 39.16 C PCB-105 24.27 21.75 8.17 3.86 232.74PCB-184 U U U U UPCB-161 C146 C146 C146 C146 C146 PCB-176 13.26 1.52 0.54 U 5.29 PCB-153 214.40 C 49.70 C 40.02 C 9.48 C 290.46 CPCB-168 C153 C153 C153 C153 C153 PCB-141 30.32 9.62 2.92 0.87 33.47PCB-186 U U U U U PCB-130 7.57 3.47 1.57 0.50 16.64PCB-127 U U U U U PCB-137 16.36 C 6.48 C 3.00 C 0.94 C 28.68 CPCB-164 C137 C137 C137 C137 C137PCB-163 C129 C129 C129 C129 C129PCB-138 C129 C129 C129 C129 C129 PCB-129 198.80 C 53.88 C 41.80 C 12.88 C 391.36 CPCB-160 C129 C129 C129 C129 C129 PCB-158 12.19 5.52 2.69 0.88 33.07 PCB-178 34.96 3.06 3.98 1.19 19.01 PCB-175 4.21 0.56 0.19 J 0.11 J 1.76 PCB-126 1.80 U 0.41 U 1.28PCB-166 C128 C128 C128 C128 C128 PCB-128 25.78 C 7.44 C 6.14 C 2.40 C 81.54 C PCB-187 195.24 17.21 17.03 4.91 115.92PCB-182 U U U U 0.38PCB-183 C174 C174 C174 C174 C174PCB-185 C174 C174 C174 C174 C174 PCB-159 5.45 U U U U PCB-174 226.17 C 19.65 C 10.38 C 3.24 C 87.42 C PCB-162 0.95 U 0.25 J U 1.51 PCB-177 68.81 4.43 4.92 1.80 34.79 PCB-202 27.02 2.22 6.46 2.16 13.72 PCB-167 8.38 1.92 2.31 0.80 20.47PCB-181 U U U U U PCB-171 26.06 C 3.08 C 1.76 C 0.60 C 18.32 CPCB-173 C171 C171 C171 C171 C171 PCB-201 14.61 1.30 1.25 0.31 J 4.19 PCB-156 17.36 C 4.72 C 4.58 C 1.78 C 57.78 CPCB-157 C156 C156 C156 C156 C156PCB-204 U U U U U PCB-197 18.68 C 1.56 C 1.26 C 0.42 C 6.38 CPCB-200 C197 C197 C197 C197 C197 PCB-172 20.92 1.95 1.58 0.52 12.87PCB-192 U U U U UPCB-193 C180 C180 C180 C180 C180 PCB-180 290.80 C 23.20 C 14.98 C 6.32 C 140.90 C PCB-191 3.47 0.39 0.30 U 2.45 PCB-170 100.02 9.16 7.61 3.62 79.68 PCB-190 25.23 2.11 2.51 0.97 20.15 PCB-169 1.42 U 0.29 0.22 J 1.39 PCB-198 143.44 C 11.16 C 13.90 C 5.74 C 66.64 CPCB-199 C198 C198 C198 C198 C198 PCB-196 55.74 4.40 2.74 0.91 15.87 PCB-203 88.03 6.93 8.40 3.41 39.37 PCB-208 17.27 1.63 20.87 3.62 11.41 PCB-195 46.01 3.55 2.91 1.29 19.81 PCB-189 3.61 0.26 J 0.52 0.28 J 3.92 PCB-207 6.97 0.73 8.05 1.25 2.76 PCB-194 124.96 8.73 6.85 3.75 47.35 PCB-205 6.14 0.54 0.66 0.50 4.07 PCB-206 64.32 5.41 23.17 7.76 39.63 PCB-209 29.44 2.92 305.80 38.27 12.46
J = reported value < Reporting Limit (RL). U = not detected. RL = the low calibration level adjusted for s & = outside QC limits.
E-6

Pilot Survey of Levels of PCDDs, PCDFs, PCBs and Mercury in Rural Soils fo the U.S.- Final Report WA 5-11 Batch 1 BATTELLE SDG 49971-13 MOD 1668M
NOTES CLIENT_ ID Padre Island, TX North Platte, NE Theodore Roosevelt, ND Theodore Roosevelt, ND Chiricahua, AZLAB_SAMP_ ID EPA 19 COMP EPA 21 COMP EPA 25 COMP EPA 25 COMP DUP EPA 27 COMP SAMPLE_WGT_VOL 20.2499 18.5140 18.6793 18.9976 19.5077 SAMP_WGT_VOL_UNIT G DRYWT G DRYWT G DRYWT G DRYWT G DRYWT PCT_DRY_WT 99.15 91.61 93.59 93.59 96.20 COLLECTION_DATE 8/19/2003 8/13/2003 8/12/2003 8/12/2003 8/18/2003 RECEIPT_DATE 8/20/2003 8/14/2003 8/19/2003 8/19/2003 8/20/2003 COMPOSITE_DATE 9/4/2003 9/4/2003 9/4/2003 9/4/2003 9/4/2003 EXTRACT_DATE 9/15/2003 9/15/2003 9/15/2003 9/15/2003 9/15/2003 ANALYSIS_DATE 10/2/2003 10/2/2003 10/2/2003 10/2/2003 10/2/2003 DIOXIN_ EXTRACT_ LRB_ NUMBER 49971-13-10 49971-13-11 49971-13-12 49971-13-16 49971-13-13 REPORTING UNIT PG/G DRYWT PG/G DRYWT PG/G DRYWT PG/G DRYWT PG/G DRYWT REPORTING LIMIT (RL) 0.25 0.27 0.27 0.26 0.26
PARAM_NAME RESULT LAB_QUAL RESULT LAB_QUAL RESULT LAB_QUAL RESULT LAB_QUAL RESULT LAB_QUAL PCB-1 1.03 1.39 1.09 0.93 0.97 PCB-2 0.40 0.84 0.62 0.59 0.45 PCB-3 1.07 1.72 1.10 0.99 1.28 PCB-4 1.68 1.63 1.62 U 1.28PCB-10 U U U U UPCB-9 U U U U UPCB-7 U U U U U PCB-6 1.05 U 0.79 U 0.70PCB-5 U U U U U PCB-8 3.10 3.10 2.71 U 3.04 PCB-19 0.43 0.49 0.44 0.48 0.37PCB-14 U U U U UPCB-30 C18 C18 C18 C18 C18 PCB-18 2.66 C 2.88 C 2.66 C 2.82 C 2.52 C PCB-11 1.12 1.92 1.45 U 1.47 PCB-17 1.45 1.63 1.44 1.55 1.19PCB-13 C12 C12 C12 C12 C12PCB-27 C16 C16 C16 C16 C16PCB-12 CU CU CU CU CUPCB-24 C16 C16 C16 C16 C16 PCB-16 1.29 C 1.50 C 1.38 C 1.26 C 1.38 C PCB-15 1.62 2.27 1.36 U 1.59PCB-54 U 0.12 J U U U PCB-32 0.87 1.03 0.85 0.95 0.96PCB-34 U U U U UPCB-23 U U U U U PCB-26 0.74 C 0.84 C 0.66 C 0.78 C 0.68 CPCB-29 C26 C26 C26 C26 C26 PCB-25 0.26 0.33 0.28 U 0.29 PCB-50 0.66 C 0.70 C 0.58 C 0.70 C 0.48 CPCB-53 C50 C50 C50 C50 C50 PCB-31 3.30 4.61 3.51 3.66 3.81PCB-28 C20 C20 C20 C20 C20 PCB-20 6.00 C 7.76 C 5.88 C 6.32 C 6.64 C PCB-45 0.74 C 0.94 C 0.74 C 0.78 C 0.74 CPCB-21 C20 C20 C20 C20 C20PCB-51 C45 C45 C45 C45 C45PCB-33 C20 C20 C20 C20 C20PCB-46 U 0.18 J 0.24 J 0.21 J U PCB-22 1.53 2.16 1.70 1.74 1.80PCB-52 C43 C43 C43 C43 C43PCB-73 C43 C43 C43 C43 C43 PCB-43 9.60 C 11.73 C 9.93 C 8.64 C 9.57 C PCB-36 0.08 J U U 0.10 J 0.11 JPCB-69 C49 C49 C49 C49 C49 PCB-49 2.54 C 3.96 C 2.60 C 2.44 C 2.82 CPCB-39 U U 0.09 J U U PCB-48 0.59 0.81 0.70 0.54 0.60PCB-104 U 0.08 J U U UPCB-65 C44 C44 C44 C44 C44PCB-47 C44 C44 C44 C44 C44 PCB-44 4.92 C 7.11 C 5.22 C 5.31 C 5.70 CPCB-62 C59 C59 C59 C59 C59PCB-38 U 0.08 J 0.12 J U UPCB-75 C59 C59 C59 C59 C59 PCB-59 0.18 CJ 0.42 C CU CU 0.30 C PCB-96 0.12 J 0.13 J 0.13 J 0.25 J 0.08 J PCB-42 0.77 1.01 0.75 0.61 0.74PCB-35 U U 0.09 J U UPCB-41 C40 C40 C40 C40 C40PCB-71 C40 C40 C40 C40 C40 PCB-40 1.83 C 2.64 C 1.89 C 2.04 C 2.22 C PCB-37 1.04 2.07 1.54 1.72 1.36 PCB-64 1.68 2.52 2.15 2.01 1.98PCB-72 U U U U UPCB-103 U U U U UPCB-68 U U U U 0.09 J
E-7

Pilot Survey of Levels of PCDDs, PCDFs, PCBs and Mercury in Rural Soils fo the U.S.- Final Report WA 5-11 Batch 1 BATTELLE SDG 49971-13 MOD 1668M
NOTES CLIENT_ ID Padre Island, TX North Platte, NE Theodore Roosevelt, ND Theodore Roosevelt, ND Chiricahua, AZLAB_SAMP_ ID EPA 19 COMP EPA 21 COMP EPA 25 COMP EPA 25 COMP DUP EPA 27 COMP SAMPLE_WGT_VOL 20.2499 18.5140 18.6793 18.9976 19.5077 SAMP_WGT_VOL_UNIT G DRYWT G DRYWT G DRYWT G DRYWT G DRYWT PCT_DRY_WT 99.15 91.61 93.59 93.59 96.20 COLLECTION_DATE 8/19/2003 8/13/2003 8/12/2003 8/12/2003 8/18/2003 RECEIPT_DATE 8/20/2003 8/14/2003 8/19/2003 8/19/2003 8/20/2003 COMPOSITE_DATE 9/4/2003 9/4/2003 9/4/2003 9/4/2003 9/4/2003 EXTRACT_DATE 9/15/2003 9/15/2003 9/15/2003 9/15/2003 9/15/2003 ANALYSIS_DATE 10/2/2003 10/2/2003 10/2/2003 10/2/2003 10/2/2003 DIOXIN_ EXTRACT_ LRB_ NUMBER 49971-13-10 49971-13-11 49971-13-12 49971-13-16 49971-13-13 REPORTING UNIT PG/G DRYWT PG/G DRYWT PG/G DRYWT PG/G DRYWT PG/G DRYWT REPORTING LIMIT (RL) 0.25 0.27 0.27 0.26 0.26
PARAM_NAME RESULT LAB_QUAL RESULT LAB_QUAL RESULT LAB_QUAL RESULT LAB_QUAL RESULT LAB_QUALPCB-94 U U U U UPCB-57 U 0.59 0.59 0.73 0.56 PCB-95 13.38 17.55 18.72 19.07 14.43PCB-58 U U U U UPCB-100 C93 C93 C93 C93 C93PCB-93 CU CU CU 0.44 C CUPCB-67 U U U U UPCB-102 C93 C93 C93 C93 C93PCB-98 C93 C93 C93 C93 C93PCB-63 U U 0.15 J U U PCB-88 1.80 C 2.54 C 3.08 C 3.22 C 2.62 C PCB-61 8.44 C 16.12 C 11.84 C 11.32 C 12.32 CPCB-70 C61 C61 C61 C61 C61PCB-76 C61 C61 C61 C61 C61PCB-91 C88 C88 C88 C88 C88PCB-74 C61 C61 C61 C61 C61 PCB-84 4.17 5.97 5.74 5.85 5.01 PCB-66 3.14 5.55 4.82 4.68 4.89PCB-55 U U U 0.16 J UPCB-89 U U U U UPCB-121 U U U U UPCB-56 U 2.92 2.20 2.13 2.37 PCB-60 0.78 1.36 1.09 0.99 1.22 PCB-92 2.60 4.42 3.47 3.75 3.50PCB-80 U U U U UPCB-155 U U U U UPCB-113 C90 C90 C90 C90 C90 PCB-90 14.40 C 23.10 C 17.40 C 19.08 C 19.65 CPCB-101 C90 C90 C90 C90 C90PCB-152 U U U U UPCB-150 U U U U U PCB-83 5.82 C 11.70 C 9.24 C 9.39 C 10.29 CPCB-99 C83 C83 C83 C83 C83 PCB-136 2.38 3.25 5.40 5.78 3.28PCB-112 C83 C83 C83 C83 C83PCB-145 U U U U UPCB-109 C86 C86 C86 C86 C86PCB-119 C86 C86 C86 C86 C86 PCB-79 0.40 0.65 0.58 0.72 0.65PCB-97 C86 C86 C86 C86 C86 PCB-86 9.84 C 14.58 C 13.08 C 13.74 C 14.40 CPCB-125 C86 C86 C86 C86 C86PCB-87 C86 C86 C86 C86 C86PCB-78 U U U U UPCB-117 C85 C85 C85 C85 C85PCB-116 C85 C85 C85 C85 C85 PCB-85 2.10 C 4.59 C 3.48 C 3.21 C 4.02 C PCB-110 14.88 C 23.34 C 30.38 C 31.92 C 24.78 CPCB-115 C110 C110 C110 C110 C110PCB-81 U U U U UPCB-148 U U U U 0.12 J PCB-82 1.54 2.50 2.16 2.20 2.65PCB-111 U U U U U PCB-77 0.50 2.00 1.04 1.04 0.76PCB-151 C135 C135 C135 C135 C135 PCB-135 4.89 C 10.11 C 17.79 C 17.88 C 9.15 CPCB-154 C135 C135 C135 C135 C135PCB-120 U U U U U PCB-144 0.71 1.28 2.16 2.06 1.21 PCB-147 8.26 C 16.68 C 30.88 C 33.98 C 17.42 CPCB-149 C147 C147 C147 C147 C147 PCB-134 0.60 C 0.84 C 1.72 C 2.04 C 0.96 CPCB-143 C134 C134 C134 C134 C134PCB-124 C108 C108 C108 C108 C108 PCB-108 0.56 C 1.12 C 0.52 C 0.86 C 1.00 C PCB-139 0.24 CJ CU 0.52 C 0.48 C CUPCB-140 C139 C139 C139 C139 C139PCB-107 C106 C106 C106 C106 C106PCB-123 C106 C106 C106 C106 C106PCB-131 U U U U U PCB-106 1.10 C 2.18 C 1.40 C 1.66 C 2.07 C PCB-142 0.15 J U U U 0.29
E-8

Pilot Survey of Levels of PCDDs, PCDFs, PCBs and Mercury in Rural Soils fo the U.S.- Final Report WA 5-11 Batch 1 BATTELLE SDG 49971-13 MOD 1668M
NOTES CLIENT_ ID Padre Island, TX North Platte, NE Theodore Roosevelt, ND Theodore Roosevelt, ND Chiricahua, AZLAB_SAMP_ ID EPA 19 COMP EPA 21 COMP EPA 25 COMP EPA 25 COMP DUP EPA 27 COMP SAMPLE_WGT_VOL 20.2499 18.5140 18.6793 18.9976 19.5077 SAMP_WGT_VOL_UNIT G DRYWT G DRYWT G DRYWT G DRYWT G DRYWT PCT_DRY_WT 99.15 91.61 93.59 93.59 96.20 COLLECTION_DATE 8/19/2003 8/13/2003 8/12/2003 8/12/2003 8/18/2003 RECEIPT_DATE 8/20/2003 8/14/2003 8/19/2003 8/19/2003 8/20/2003 COMPOSITE_DATE 9/4/2003 9/4/2003 9/4/2003 9/4/2003 9/4/2003 EXTRACT_DATE 9/15/2003 9/15/2003 9/15/2003 9/15/2003 9/15/2003 ANALYSIS_DATE 10/2/2003 10/2/2003 10/2/2003 10/2/2003 10/2/2003 DIOXIN_ EXTRACT_ LRB_ NUMBER 49971-13-10 49971-13-11 49971-13-12 49971-13-16 49971-13-13 REPORTING UNIT PG/G DRYWT PG/G DRYWT PG/G DRYWT PG/G DRYWT PG/G DRYWT REPORTING LIMIT (RL) 0.25 0.27 0.27 0.26 0.26
PARAM_NAME RESULT LAB_QUAL RESULT LAB_QUAL RESULT LAB_QUAL RESULT LAB_QUAL RESULT LAB_QUAL PCB-118 9.57 18.62 14.99 17.09 16.63 PCB-132 4.21 5.64 11.85 12.86 6.93PCB-122 U U U U UPCB-188 U U U U 0.33 PCB-114 0.20 J U U 0.19 J UPCB-133 U 0.60 U 0.71 0.57 PCB-179 0.99 2.70 6.42 6.64 3.52PCB-165 U U U U U PCB-146 1.64 C 4.62 C 5.58 C 5.70 C 4.52 C PCB-105 4.28 9.08 7.23 7.72 7.13PCB-184 U U U U UPCB-161 C146 C146 C146 C146 C146 PCB-176 0.32 0.63 1.59 1.88 0.90 PCB-153 9.44 C 27.86 C 24.78 C 26.44 C 22.02 CPCB-168 C153 C153 C153 C153 C153 PCB-141 1.58 3.20 5.10 5.26 3.25PCB-186 U U U U U PCB-130 0.88 1.93 2.73 2.83 1.87PCB-127 U U U U U PCB-137 1.34 C 2.90 C 4.70 C 5.00 C 2.78 CPCB-164 C137 C137 C137 C137 C137PCB-163 C129 C129 C129 C129 C129PCB-138 C129 C129 C129 C129 C129 PCB-129 13.16 C 30.12 C 37.60 C 40.80 C 25.88 CPCB-160 C129 C129 C129 C129 C129 PCB-158 1.30 2.11 3.75 4.02 2.37 PCB-178 0.69 3.06 3.81 3.75 3.65PCB-175 U 0.29 0.53 0.53 0.71PCB-126 U 0.71 U U UPCB-166 C128 C128 C128 C128 C128 PCB-128 2.40 C 4.70 C 7.24 C 7.64 C 4.70 C PCB-187 3.04 13.54 21.62 21.20 16.65PCB-182 U 0.12 J U U UPCB-183 C174 C174 C174 C174 C174PCB-185 C174 C174 C174 C174 C174PCB-159 U U 0.59 0.83 0.62 PCB-174 3.78 C 11.55 C 25.80 C 25.44 C 15.33 CPCB-162 U U U U U PCB-177 1.49 4.80 9.55 9.60 4.97 PCB-202 0.46 2.45 2.69 2.69 3.82 PCB-167 0.63 1.64 1.46 1.25 1.62PCB-181 U U U U U PCB-171 0.66 C 1.82 C 4.00 C 4.36 C 2.20 CPCB-173 C171 C171 C171 C171 C171 PCB-201 0.35 1.05 1.74 1.73 2.29 PCB-156 2.04 C 3.68 C 3.04 C 3.64 C 3.04 CPCB-157 C156 C156 C156 C156 C156PCB-204 U U U U U PCB-197 0.30 C 0.98 C 1.82 C 1.72 C 1.96 CPCB-200 C197 C197 C197 C197 C197 PCB-172 0.50 1.80 2.70 2.85 2.48PCB-192 U U U U UPCB-193 C180 C180 C180 C180 C180 PCB-180 5.42 C 15.74 C 29.50 C 30.30 C 19.18 CPCB-191 U 0.29 U 0.70 U PCB-170 3.17 7.92 13.98 13.85 7.77 PCB-190 0.73 2.06 2.83 2.88 1.74 PCB-169 0.17 J 0.67 U U 0.22 J PCB-198 2.66 C 8.92 C 11.36 C 11.58 C 15.64 CPCB-199 C198 C198 C198 C198 C198 PCB-196 0.85 2.38 4.88 4.43 5.03 PCB-203 1.63 5.11 7.93 7.99 9.54 PCB-208 0.79 3.96 1.97 1.95 8.00 PCB-195 1.00 2.31 4.03 3.50 2.82 PCB-189 0.37 0.56 0.59 0.62 0.65 PCB-207 0.47 1.45 0.96 0.80 3.06 PCB-194 3.02 6.31 10.14 9.07 9.33 PCB-205 0.68 0.68 0.70 U 0.59 PCB-206 3.19 8.91 6.78 6.57 19.19 PCB-209 1.93 11.81 3.88 3.94 20.91
J = reported value < Reporting Limit (RL). U = not detected. RL = the low calibration level adjusted for s & = outside QC limits.
E-9

Pilot Survey of PCDDs, PCDFs, PCBs and Mercury in Rural Soils of the U.S. - Final Report
WA5-11 Batch 2 BATTELLE SDG 49971-23&28 MOD 1668M
NOTES QC CLIENT_ ID PROCEDURAL BLANK Clinton Crops, NC Everglades, FL Everglades, FL Lake Dubay, WI LAB_SAMP_ ID Method Blank EPA-2 COMP EPA-4 COMP EPA-4 COMP Duplicate EPA-5 COMP SAMPLE_WGT_VOL 16.6259 18.2470 11.0188 11.0058 16.7103 SAMP_WGT_VOL_UNIT G DRYWT G DRYWT G DRYWT G DRYWT G DRYWT PCT_DRY_WT 90.91 54.96 54.96 84.78 COLLECTION_DATE 9/6/2003 10/20/2003 10/20/2003 8/12/2003 RECEIPT_DATE 10/21/2003 10/22/2003 10/22/2003 8/18/2003 COMPOSITE_DATE 10/27/2003 10/27/2003 10/27/2003 9/4/2003 EXTRACT_DATE 11/12/2003 11/12/2003 11/12/2003 11/6/2003 11/6/2003 ANALYSIS_DATE 12/14/2003 12/14/2003 12/14/2003 12/18/2003 12/14/2003 DIOXIN_ EXTRACT_ LRB_ NUMBER 49971-28-04 49971-28-02 49971-28-03 49971-23-17 49971-23-04 REPORTING UNIT PG/G DRYWT PG/G DRYWT PG/G DRYWT PG/G DRYWT PG/G DRYWT REPORTING LIMIT (RL) 0.30 0.27 0.45 1.82 0.30
PARAM_NAME RESULT LAB_QUAL RESULT LAB_QUAL RESULT LAB_QUAL RESULT LAB_QUAL RESULT LAB_QUAL PCB-1 1.22 6.02 20.49 3.97 406.36 PCB-2 0.68 0.29 18.40 3.34 119.20 PCB-3 0.90 0.85 17.20 4.59 119.97 PCB-4 1.56 14.27 33.38 U 2199.20 PCB-10 U 2.05 2.46 U 395.02 PCB-9 U U 10.99 U 46.02 PCB-7 U U 4.81 U U PCB-6 1.70 0.88 27.05 U 55.73 PCB-5 U U 3.35 U U PCB-8 2.54 2.30 28.81 7.93 62.58 PCB-19 0.85 3.75 17.99 3.90 1394.84 PCB-14 U U U U U PCB-30 C18 C18 C18 C18 C18 PCB-18 2.85 C 2.04 C 49.66 C 10.74 C 55.68 C PCB-11 1.40 0.87 16.47 7.12 85.66 PCB-17 1.86 4.31 29.90 5.92 1899.27 PCB-13 C12 C12 C12 C12 C12 PCB-27 C16 C16 C16 C16 C16 PCB-12 1.27 C 1.84 C 21.16 C CU 827.58 C PCB-24 C16 C16 C16 C16 C16 PCB-16 1.49 C 2.79 C 21.78 C 6.36 C 1059.72 C PCB-15 1.28 2.64 12.29 U 799.53 PCB-54 U U 2.81 U 24.17 PCB-32 0.69 0.89 4.64 3.39 152.56 PCB-34 U U U U U PCB-23 U U 1.07 U 22.54 PCB-26 1.56 C 1.08 C 19.32 C 3.66 C 282.28 C PCB-29 C26 C26 C26 C26 C26 PCB-25 0.53 0.31 7.11 1.35 J 19.71 PCB-50 1.41 C 0.96 C 23.40 C 5.98 C 204.58 C PCB-53 C50 C50 C50 C50 C50 PCB-31 2.43 2.69 22.43 9.78 72.08 PCB-28 C20 C20 C20 C20 C20 PCB-20 5.79 C 5.12 C 45.20 C 20.80 C 38.72 C PCB-45 1.39 C 1.36 C 25.46 C 6.66 C 390.14 C PCB-21 C20 C20 C20 C20 C20 PCB-51 C45 C45 C45 C45 C45 PCB-33 C20 C20 C20 C20 C20 PCB-46 U 0.25 J 6.80 U 8.71 PCB-22 1.26 1.16 7.74 4.52 U PCB-52 C43 C43 C43 C43 C43 PCB-73 C43 C43 C43 C43 C43 PCB-43 5.97 C 7.77 C 62.79 C 42.30 C 390.27 C PCB-36 U U U U 20.25 PCB-69 C49 C49 C49 C49 C49 PCB-49 2.93 C 2.96 C 34.96 C 17.58 C 368.98 C PCB-39 U U U U U PCB-48 1.26 0.60 16.37 6.17 U PCB-104 U U U U 1.54 PCB-65 C44 C44 C44 C44 C44 PCB-47 C44 C44 C44 C44 C44 PCB-44 4.25 C 6.27 C 38.55 C 25.20 C 1449.63 C PCB-62 C59 C59 C59 C59 C59 PCB-38 U U U U U PCB-75 C59 C59 C59 C59 C59 PCB-59 0.46 C 0.27 CJ 2.55 C 2.04 C CU PCB-96 0.30 J U 5.74 U 13.39 PCB-42 1.16 0.96 6.48 6.28 U PCB-35 0.47 0.15 J 6.35 1.83 U PCB-41 C40 C40 C40 C40 C40 PCB-71 C40 C40 C40 C40 C40 PCB-40 2.16 C 1.74 C 11.04 C 11.55 C CU PCB-37 1.08 1.13 11.23 6.23 17.80 PCB-64 1.21 1.45 4.94 9.57 U PCB-72 U 0.09 J U U 56.72 PCB-103 U U U U 30.86 PCB-68 U U U U 53.91
E-10
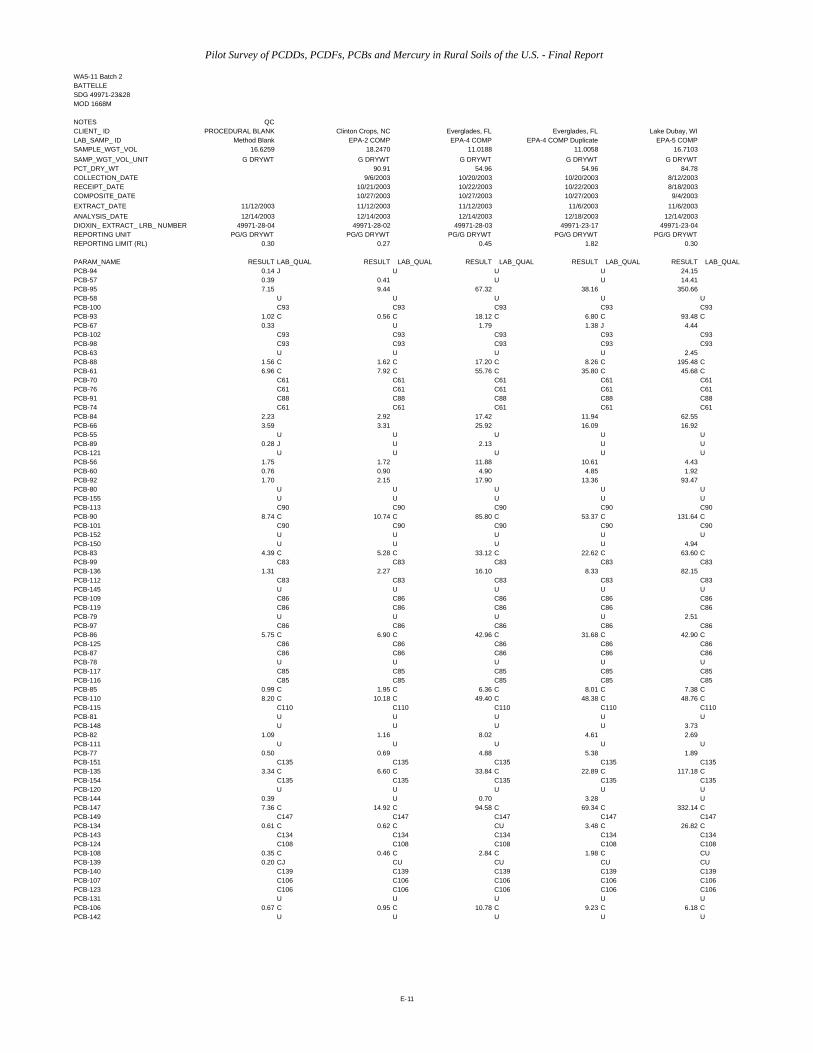
Pilot Survey of PCDDs, PCDFs, PCBs and Mercury in Rural Soils of the U.S. - Final Report
WA5-11 Batch 2 BATTELLE SDG 49971-23&28 MOD 1668M
NOTES QC CLIENT_ ID PROCEDURAL BLANK Clinton Crops, NC Everglades, FL Everglades, FL Lake Dubay, WI LAB_SAMP_ ID Method Blank EPA-2 COMP EPA-4 COMP EPA-4 COMP Duplicate EPA-5 COMP SAMPLE_WGT_VOL 16.6259 18.2470 11.0188 11.0058 16.7103 SAMP_WGT_VOL_UNIT G DRYWT G DRYWT G DRYWT G DRYWT G DRYWT PCT_DRY_WT 90.91 54.96 54.96 84.78 COLLECTION_DATE 9/6/2003 10/20/2003 10/20/2003 8/12/2003 RECEIPT_DATE 10/21/2003 10/22/2003 10/22/2003 8/18/2003 COMPOSITE_DATE 10/27/2003 10/27/2003 10/27/2003 9/4/2003 EXTRACT_DATE 11/12/2003 11/12/2003 11/12/2003 11/6/2003 11/6/2003 ANALYSIS_DATE 12/14/2003 12/14/2003 12/14/2003 12/18/2003 12/14/2003 DIOXIN_ EXTRACT_ LRB_ NUMBER 49971-28-04 49971-28-02 49971-28-03 49971-23-17 49971-23-04 REPORTING UNIT PG/G DRYWT PG/G DRYWT PG/G DRYWT PG/G DRYWT PG/G DRYWT REPORTING LIMIT (RL) 0.30 0.27 0.45 1.82 0.30
PARAM_NAME RESULT LAB_QUAL RESULT LAB_QUAL RESULT LAB_QUAL RESULT LAB_QUAL RESULT LAB_QUAL PCB-94 0.14 J U U U 24.15 PCB-57 0.39 0.41 U U 14.41 PCB-95 7.15 9.44 67.32 38.16 350.66 PCB-58 U U U U U PCB-100 C93 C93 C93 C93 C93 PCB-93 1.02 C 0.56 C 18.12 C 6.80 C 93.48 C PCB-67 0.33 U 1.79 1.38 J 4.44 PCB-102 C93 C93 C93 C93 C93 PCB-98 C93 C93 C93 C93 C93 PCB-63 U U U U 2.45 PCB-88 1.56 C 1.62 C 17.20 C 8.26 C 195.48 C PCB-61 6.96 C 7.92 C 55.76 C 35.80 C 45.68 C PCB-70 C61 C61 C61 C61 C61 PCB-76 C61 C61 C61 C61 C61 PCB-91 C88 C88 C88 C88 C88 PCB-74 C61 C61 C61 C61 C61 PCB-84 2.23 2.92 17.42 11.94 62.55 PCB-66 3.59 3.31 25.92 16.09 16.92 PCB-55 U U U U U PCB-89 0.28 J U 2.13 U U PCB-121 U U U U U PCB-56 1.75 1.72 11.88 10.61 4.43 PCB-60 0.76 0.90 4.90 4.85 1.92 PCB-92 1.70 2.15 17.90 13.36 93.47 PCB-80 U U U U U PCB-155 U U U U U PCB-113 C90 C90 C90 C90 C90 PCB-90 8.74 C 10.74 C 85.80 C 53.37 C 131.64 C PCB-101 C90 C90 C90 C90 C90 PCB-152 U U U U U PCB-150 U U U U 4.94 PCB-83 4.39 C 5.28 C 33.12 C 22.62 C 63.60 C PCB-99 C83 C83 C83 C83 C83 PCB-136 1.31 2.27 16.10 8.33 82.15 PCB-112 C83 C83 C83 C83 C83 PCB-145 U U U U U PCB-109 C86 C86 C86 C86 C86 PCB-119 C86 C86 C86 C86 C86 PCB-79 U U U U 2.51 PCB-97 C86 C86 C86 C86 C86 PCB-86 5.75 C 6.90 C 42.96 C 31.68 C 42.90 C PCB-125 C86 C86 C86 C86 C86 PCB-87 C86 C86 C86 C86 C86 PCB-78 U U U U U PCB-117 C85 C85 C85 C85 C85 PCB-116 C85 C85 C85 C85 C85 PCB-85 0.99 C 1.95 C 6.36 C 8.01 C 7.38 C PCB-110 8.20 C 10.18 C 49.40 C 48.38 C 48.76 C PCB-115 C110 C110 C110 C110 C110 PCB-81 U U U U U PCB-148 U U U U 3.73 PCB-82 1.09 1.16 8.02 4.61 2.69 PCB-111 U U U U U PCB-77 0.50 0.69 4.88 5.38 1.89 PCB-151 C135 C135 C135 C135 C135 PCB-135 3.34 C 6.60 C 33.84 C 22.89 C 117.18 C PCB-154 C135 C135 C135 C135 C135 PCB-120 U U U U U PCB-144 0.39 U 0.70 3.28 U PCB-147 7.36 C 14.92 C 94.58 C 69.34 C 332.14 C PCB-149 C147 C147 C147 C147 C147 PCB-134 0.61 C 0.62 C CU 3.48 C 26.82 C PCB-143 C134 C134 C134 C134 C134 PCB-124 C108 C108 C108 C108 C108 PCB-108 0.35 C 0.46 C 2.84 C 1.98 C CU PCB-139 0.20 CJ CU CU CU CU PCB-140 C139 C139 C139 C139 C139 PCB-107 C106 C106 C106 C106 C106 PCB-123 C106 C106 C106 C106 C106 PCB-131 U U U U U PCB-106 0.67 C 0.95 C 10.78 C 9.23 C 6.18 C PCB-142 U U U U U
E-11

Pilot Survey of PCDDs, PCDFs, PCBs and Mercury in Rural Soils of the U.S. - Final Report
WA5-11 Batch 2 BATTELLE SDG 49971-23&28 MOD 1668M
NOTES QC CLIENT_ ID PROCEDURAL BLANK Clinton Crops, NC Everglades, FL Everglades, FL Lake Dubay, WI LAB_SAMP_ ID Method Blank EPA-2 COMP EPA-4 COMP EPA-4 COMP Duplicate EPA-5 COMP SAMPLE_WGT_VOL 16.6259 18.2470 11.0188 11.0058 16.7103 SAMP_WGT_VOL_UNIT G DRYWT G DRYWT G DRYWT G DRYWT G DRYWT PCT_DRY_WT 90.91 54.96 54.96 84.78 COLLECTION_DATE 9/6/2003 10/20/2003 10/20/2003 8/12/2003 RECEIPT_DATE 10/21/2003 10/22/2003 10/22/2003 8/18/2003 COMPOSITE_DATE 10/27/2003 10/27/2003 10/27/2003 9/4/2003 EXTRACT_DATE 11/12/2003 11/12/2003 11/12/2003 11/6/2003 11/6/2003 ANALYSIS_DATE 12/14/2003 12/14/2003 12/14/2003 12/18/2003 12/14/2003 DIOXIN_ EXTRACT_ LRB_ NUMBER 49971-28-04 49971-28-02 49971-28-03 49971-23-17 49971-23-04 REPORTING UNIT PG/G DRYWT PG/G DRYWT PG/G DRYWT PG/G DRYWT PG/G DRYWT REPORTING LIMIT (RL) 0.30 0.27 0.45 1.82 0.30
PARAM_NAME RESULT LAB_QUAL RESULT LAB_QUAL RESULT LAB_QUAL RESULT LAB_QUAL RESULT LAB_QUAL PCB-118 6.10 7.55 43.03 45.52 45.40 PCB-132 3.05 4.42 28.17 27.96 24.51 PCB-122 U U U U U PCB-188 U U U U U PCB-114 U U U 1.69 J U PCB-133 U 0.45 U U 10.50 PCB-179 0.83 4.47 13.28 8.20 29.72 PCB-165 U U U U U PCB-146 1.59 C 3.80 C 24.24 C 29.18 C 40.40 C PCB-105 2.38 3.40 32.76 37.48 13.85 PCB-184 U U U U U PCB-161 C146 C146 C146 C146 C146 PCB-176 0.25 J 1.08 3.76 U 3.52 PCB-153 8.04 C 25.52 C 138.14 C 134.04 C 94.58 C PCB-168 C153 C153 C153 C153 C153 PCB-141 1.58 3.61 8.09 19.10 8.52 PCB-186 U U U U U PCB-130 0.51 0.88 U 7.16 U PCB-127 U U U U U PCB-137 0.84 C 2.02 C 5.40 C 14.42 C CU PCB-164 C137 C137 C137 C137 C137 PCB-163 C129 C129 C129 C129 C129 PCB-138 C129 C129 C129 C129 C129 PCB-129 7.71 C 23.60 C 147.08 C 182.40 C 128.32 C PCB-160 C129 C129 C129 C129 C129 PCB-158 0.74 1.54 3.30 9.31 U PCB-178 0.37 3.42 16.50 17.97 16.51 PCB-175 0.10 J 0.28 U U U PCB-126 U U U U U PCB-166 C128 C128 C128 C128 C128 PCB-128 1.21 C 3.62 C 32.96 C 47.18 C 7.70 C PCB-187 2.52 18.88 111.44 118.87 59.66 PCB-182 0.05 J U U U U PCB-183 C174 C174 C174 C174 C174 PCB-185 C174 C174 C174 C174 C174 PCB-159 U U U U U PCB-174 2.43 C 16.02 C 17.43 C 38.52 C 31.62 C PCB-162 U 0.26 J 2.17 1.25 J 1.90 PCB-177 0.90 5.23 25.02 24.32 29.11 PCB-202 0.18 J 8.34 28.68 32.21 5.22 PCB-167 0.35 1.33 11.74 10.42 4.73 PCB-181 U U U U U PCB-171 0.37 C 1.82 C 13.86 C 13.76 C 8.30 C PCB-173 C171 C171 C171 C171 C171 PCB-201 0.07 J 1.63 4.75 3.87 2.14 PCB-156 0.86 C 2.38 C 22.98 C 19.42 C 9.48 C PCB-157 C156 C156 C156 C156 C156 PCB-204 U U U U U PCB-197 0.18 CJ 1.34 C 2.58 C 3.20 C 1.78 C PCB-200 C197 C197 C197 C197 C197 PCB-172 0.19 J 1.84 14.79 18.59 6.46 PCB-192 U U U U U PCB-193 C180 C180 C180 C180 C180 PCB-180 2.98 C 21.68 C 221.02 C 228.66 C 56.96 C PCB-191 0.10 J U 1.17 U U PCB-170 1.44 7.47 112.62 127.13 27.00 PCB-190 0.24 J 2.14 18.15 16.16 6.71 PCB-169 0.51 0.73 U U 0.71 PCB-198 0.83 C 21.64 C 101.86 C 94.70 C 18.26 C PCB-199 C198 C198 C198 C198 C198 PCB-196 0.39 4.05 7.30 11.98 1.65 PCB-203 0.53 10.57 31.97 26.71 4.29 PCB-208 0.67 11.07 32.18 35.00 6.04 PCB-195 0.65 3.27 16.97 17.32 5.59 PCB-189 0.84 1.04 4.21 3.66 1.96 PCB-207 0.51 2.36 3.80 4.44 2.22 PCB-194 1.91 9.06 69.57 77.76 15.08 PCB-205 1.96 1.85 5.38 4.99 1.06 PCB-206 3.29 25.55 60.10 64.74 14.31 PCB-209 3.16 21.49 54.62 59.18 20.42
J = reported value < Reporting Limit (RL). U = not detected. RL = the low calibration level adjusted for sample final volume and weight. & = outside QC limits.
E-12

Pilot Survey of PCDDs, PCDFs, PCBs and Mercury in Rural Soils of the U.S. - Final Report
WA5-11 Batch 2 BATTELLE SDG 49971-23&28 MOD 1668M
NOTES CLIENT_ ID Monmouth, IL Keystone State Park, OK Arkadelphia, AK Jasper, NY LAB_SAMP_ ID EPA-6 COMP EPA-9 COMP EPA-10 COMP EPA-12 COMP SAMPLE_WGT_VOL 17.3948 17.8582 17.5451 14.1085 SAMP_WGT_VOL_UNIT G DRYWT G DRYWT G DRYWT G DRYWT PCT_DRY_WT 87.36 88.71 88.91 70.95 COLLECTION_DATE 8/15/2003 8/18/2003 9/10/2003 8/20/2003 RECEIPT_DATE 8/18/2003 8/19/2003 9/12/2003 8/22/2003 COMPOSITE_DATE 9/4/2003 9/4/2003 9/18/2003 9/4/2003 EXTRACT_DATE 11/6/2003 11/6/2003 11/6/2003 11/6/2003 ANALYSIS_DATE 12/15/2003 12/15/2003 12/15/2003 12/15/2003 DIOXIN_ EXTRACT_ LRB_ NUMBER 49971-23-05 49971-23-06 49971-23-07 49971-23-08 REPORTING UNIT PG/G DRYWT PG/G DRYWT PG/G DRYWT PG/G DRYWT REPORTING LIMIT (RL) 0.29 0.28 0.28 0.35
PARAM_NAME RESULT LAB_QUAL RESULT LAB_QUAL RESULT LAB_QUAL RESULT LAB_QUAL PCB-1 3.64 91.84 8.92 2.60 PCB-2 3.68 8.39 7.79 2.00 PCB-3 3.73 20.57 7.31 2.44 PCB-4 7.55 247.17 18.05 4.37 PCB-10 0.58 43.54 1.16 UPCB-9 U 6.95 U UPCB-7 U U U U PCB-6 6.00 13.48 14.04 2.89PCB-5 U U U U PCB-8 8.42 17.00 13.52 5.31 PCB-19 4.67 98.82 10.11 2.50PCB-14 U U U UPCB-30 C18 C18 C18 C18 PCB-18 18.02 C 28.88 C 31.94 C 8.20 C PCB-11 5.22 U 6.69 2.90 PCB-17 11.00 131.16 19.95 5.48PCB-13 C12 C12 C12 C12PCB-27 C16 C16 C16 C16 PCB-12 6.68 C 68.68 C 12.00 C 2.88 CPCB-24 C16 C16 C16 C16 PCB-16 9.00 C 76.74 C 13.83 C 4.29 C PCB-15 5.49 69.01 6.45 3.48 PCB-54 0.83 2.60 2.02 0.33 J PCB-32 3.78 12.94 5.35 2.12PCB-34 U 2.09 1.14 U PCB-23 0.50 0.26 J 0.23 J U PCB-26 8.96 C 24.40 C 13.50 C 3.14 CPCB-29 C26 C26 C26 C26 PCB-25 3.66 5.49 5.50 1.34 PCB-50 10.04 C 22.34 C 15.96 C 4.30 CPCB-53 C50 C50 C50 C50 PCB-31 12.23 16.62 14.76 6.70PCB-28 C20 C20 C20 C20 PCB-20 23.60 C 25.84 C 30.72 C 13.08 C PCB-45 10.16 C 33.36 C 15.26 C 4.62 CPCB-21 C20 C20 C20 C20PCB-51 C45 C45 C45 C45PCB-33 C20 C20 C20 C20 PCB-46 2.83 3.37 3.90 1.25 PCB-22 4.93 4.33 5.45 2.79PCB-52 C43 C43 C43 C43PCB-73 C43 C43 C43 C43 PCB-43 40.44 C 54.27 C 75.75 C 24.93 C PCB-36 1.62 2.67 2.23 0.50PCB-69 C49 C49 C49 C49 PCB-49 26.36 C 37.64 C 31.76 C 11.70 C PCB-39 0.84 0.91 U U PCB-48 7.96 9.42 12.76 3.80PCB-104 U U U UPCB-65 C44 C44 C44 C44PCB-47 C44 C44 C44 C44 PCB-44 24.54 C 100.71 C 34.23 C 14.70 CPCB-62 C59 C59 C59 C59PCB-38 U U U UPCB-75 C59 C59 C59 C59 PCB-59 1.29 C 2.49 C 3.24 C 0.75 C PCB-96 3.05 4.35 5.36 1.52 PCB-42 3.30 4.74 7.35 2.26 PCB-35 3.31 3.64 6.03 1.40PCB-41 C40 C40 C40 C40PCB-71 C40 C40 C40 C40 PCB-40 5.94 C 7.68 C 13.41 C 4.08 C PCB-37 8.41 6.54 6.68 3.79 PCB-64 3.56 3.44 10.47 3.15 PCB-72 1.81 3.64 1.85 U PCB-103 1.41 2.56 2.16 U PCB-68 1.08 2.51 0.75 U
E-13

Pilot Survey of PCDDs, PCDFs, PCBs and Mercury in Rural Soils of the U.S. - Final Report
WA5-11 Batch 2 BATTELLE SDG 49971-23&28 MOD 1668M
NOTES CLIENT_ ID Monmouth, IL Keystone State Park, OK Arkadelphia, AK Jasper, NY LAB_SAMP_ ID EPA-6 COMP EPA-9 COMP EPA-10 COMP EPA-12 COMP SAMPLE_WGT_VOL 17.3948 17.8582 17.5451 14.1085 SAMP_WGT_VOL_UNIT G DRYWT G DRYWT G DRYWT G DRYWT PCT_DRY_WT 87.36 88.71 88.91 70.95 COLLECTION_DATE 8/15/2003 8/18/2003 9/10/2003 8/20/2003 RECEIPT_DATE 8/18/2003 8/19/2003 9/12/2003 8/22/2003 COMPOSITE_DATE 9/4/2003 9/4/2003 9/18/2003 9/4/2003 EXTRACT_DATE 11/6/2003 11/6/2003 11/6/2003 11/6/2003 ANALYSIS_DATE 12/15/2003 12/15/2003 12/15/2003 12/15/2003 DIOXIN_ EXTRACT_ LRB_ NUMBER 49971-23-05 49971-23-06 49971-23-07 49971-23-08 REPORTING UNIT PG/G DRYWT PG/G DRYWT PG/G DRYWT PG/G DRYWT REPORTING LIMIT (RL) 0.29 0.28 0.28 0.35
PARAM_NAME RESULT LAB_QUAL RESULT LAB_QUAL RESULT LAB_QUAL RESULT LAB_QUAL PCB-94 2.03 2.73 3.00 U PCB-57 4.09 4.31 13.26 1.46 PCB-95 59.59 60.35 216.00 37.08PCB-58 U U U UPCB-100 C93 C93 C93 C93 PCB-93 11.68 C 14.84 C 15.12 C 4.60 C PCB-67 3.37 2.72 3.51 UPCB-102 C93 C93 C93 C93PCB-98 C93 C93 C93 C93 PCB-63 0.99 U 1.00 U PCB-88 16.06 C 18.80 C 37.28 C 7.58 C PCB-61 45.60 C 23.40 C 69.28 C 20.68 CPCB-70 C61 C61 C61 C61PCB-76 C61 C61 C61 C61PCB-91 C88 C88 C88 C88PCB-74 C61 C61 C61 C61 PCB-84 11.71 12.89 66.43 8.76 PCB-66 16.66 10.00 26.64 7.62PCB-55 U U U U PCB-89 2.23 1.70 U 0.72PCB-121 U U U U PCB-56 11.17 5.36 10.84 4.01 PCB-60 3.89 1.92 2.84 1.77 PCB-92 19.08 16.74 46.19 11.35PCB-80 U U U UPCB-155 U U U UPCB-113 C90 C90 C90 C90 PCB-90 93.33 C 68.94 C 311.31 C 58.62 CPCB-101 C90 C90 C90 C90 PCB-152 0.41 0.50 0.67 U PCB-150 0.44 0.75 0.63 U PCB-83 74.91 C 32.52 C 140.85 C 36.57 CPCB-99 C83 C83 C83 C83 PCB-136 12.98 13.93 30.99 8.40PCB-112 C83 C83 C83 C83PCB-145 U U U UPCB-109 C86 C86 C86 C86PCB-119 C86 C86 C86 C86 PCB-79 3.12 2.21 10.89 1.55PCB-97 C86 C86 C86 C86 PCB-86 42.42 C 29.46 C 198.66 C 28.14 CPCB-125 C86 C86 C86 C86PCB-87 C86 C86 C86 C86PCB-78 U U U UPCB-117 C85 C85 C85 C85PCB-116 C85 C85 C85 C85 PCB-85 16.83 C 7.14 C 44.46 C 10.41 C PCB-110 71.54 C 37.22 C 339.92 C 54.18 CPCB-115 C110 C110 C110 C110PCB-81 U U U UPCB-148 U U U U PCB-82 8.49 3.59 32.35 3.91PCB-111 U U U U PCB-77 7.33 2.30 3.79 3.72PCB-151 C135 C135 C135 C135 PCB-135 28.38 C 27.93 C 65.55 C 24.66 CPCB-154 C135 C135 C135 C135PCB-120 U U U UPCB-144 U U U U PCB-147 100.84 C 71.28 C 208.26 C 76.48 CPCB-149 C147 C147 C147 C147PCB-134 CU 7.16 C 20.64 C CUPCB-143 C134 C134 C134 C134PCB-124 C108 C108 C108 C108 PCB-108 3.96 C 2.30 C 10.70 C 2.84 C PCB-139 2.78 C 0.76 C CU CUPCB-140 C139 C139 C139 C139PCB-107 C106 C106 C106 C106PCB-123 C106 C106 C106 C106PCB-131 U U U U PCB-106 11.24 C 4.93 C 20.74 C 7.71 CPCB-142 U U U U
E-14

Pilot Survey of PCDDs, PCDFs, PCBs and Mercury in Rural Soils of the U.S. - Final Report
WA5-11 Batch 2 BATTELLE SDG 49971-23&28 MOD 1668M
NOTES CLIENT_ ID Monmouth, IL Keystone State Park, OK Arkadelphia, AK Jasper, NY LAB_SAMP_ ID EPA-6 COMP EPA-9 COMP EPA-10 COMP EPA-12 COMP SAMPLE_WGT_VOL 17.3948 17.8582 17.5451 14.1085 SAMP_WGT_VOL_UNIT G DRYWT G DRYWT G DRYWT G DRYWT PCT_DRY_WT 87.36 88.71 88.91 70.95 COLLECTION_DATE 8/15/2003 8/18/2003 9/10/2003 8/20/2003 RECEIPT_DATE 8/18/2003 8/19/2003 9/12/2003 8/22/2003 COMPOSITE_DATE 9/4/2003 9/4/2003 9/18/2003 9/4/2003 EXTRACT_DATE 11/6/2003 11/6/2003 11/6/2003 11/6/2003 ANALYSIS_DATE 12/15/2003 12/15/2003 12/15/2003 12/15/2003 DIOXIN_ EXTRACT_ LRB_ NUMBER 49971-23-05 49971-23-06 49971-23-07 49971-23-08 REPORTING UNIT PG/G DRYWT PG/G DRYWT PG/G DRYWT PG/G DRYWT REPORTING LIMIT (RL) 0.29 0.28 0.28 0.35
PARAM_NAME RESULT LAB_QUAL RESULT LAB_QUAL RESULT LAB_QUAL RESULT LAB_QUAL PCB-118 93.48 31.11 218.07 39.01 PCB-132 29.63 19.57 100.58 21.44PCB-122 U U U UPCB-188 U U U UPCB-114 U U U U PCB-133 2.68 U U U PCB-179 17.64 12.11 18.71 17.48PCB-165 U U U U PCB-146 22.38 C 14.80 C 30.08 C 16.06 C PCB-105 36.22 10.60 78.28 21.23PCB-184 U U U UPCB-161 C146 C146 C146 C146 PCB-176 4.55 3.14 6.26 3.44 PCB-153 197.40 C 94.00 C 219.88 C 131.70 CPCB-168 C153 C153 C153 C153PCB-141 U 16.62 57.14 14.81PCB-186 U U U U PCB-130 4.95 4.05 18.67 3.64PCB-127 U U U U PCB-137 7.82 C 7.38 C 35.96 C 8.12 CPCB-164 C137 C137 C137 C137PCB-163 C129 C129 C129 C129PCB-138 C129 C129 C129 C129 PCB-129 174.28 C 85.72 C 286.16 C 133.28 CPCB-160 C129 C129 C129 C129 PCB-158 8.68 5.88 26.22 6.19 PCB-178 11.24 9.28 10.36 14.94 PCB-175 1.47 1.20 1.94 1.08PCB-126 U U U UPCB-166 C128 C128 C128 C128 PCB-128 22.14 C 11.06 C 50.48 C 16.88 C PCB-187 49.39 45.35 50.11 60.84PCB-182 U U U UPCB-183 C174 C174 C174 C174PCB-185 C174 C174 C174 C174PCB-159 U U U U PCB-174 40.80 C 35.76 C 60.57 C 46.38 C PCB-162 1.56 1.41 2.23 1.51 PCB-177 21.12 16.18 23.77 21.79 PCB-202 6.22 4.97 4.18 14.04 PCB-167 7.66 4.55 11.82 5.06PCB-181 U U U U PCB-171 9.94 C 7.44 C 14.02 C 8.36 CPCB-173 C171 C171 C171 C171 PCB-201 2.95 1.93 1.92 3.96 PCB-156 18.84 C 8.36 C 33.62 C 11.12 CPCB-157 C156 C156 C156 C156PCB-204 U U U U PCB-197 1.82 C 1.64 C 1.72 C 2.84 CPCB-200 C197 C197 C197 C197 PCB-172 6.82 6.05 7.91 7.99PCB-192 U U U UPCB-193 C180 C180 C180 C180 PCB-180 74.70 C 62.42 C 80.90 C 82.08 C PCB-191 1.10 U 1.56 U PCB-170 32.32 25.82 41.16 30.50 PCB-190 7.35 6.26 7.80 9.22 PCB-169 1.18 U U U PCB-198 18.20 C 21.62 C 17.20 C 48.86 CPCB-199 C198 C198 C198 C198 PCB-196 0.69 6.17 6.23 9.27 PCB-203 4.06 12.22 9.76 22.91 PCB-208 9.77 3.70 2.29 13.49 PCB-195 5.24 5.85 4.70 7.49 PCB-189 1.66 1.73 1.66 1.37 PCB-207 4.20 1.72 0.90 5.04 PCB-194 13.02 14.99 12.44 23.03 PCB-205 1.28 1.97 0.75 1.42 PCB-206 17.76 11.87 7.59 33.88 PCB-209 40.70 10.15 5.36 28.13
J = reported value < Reporting Limit (RL U = not detected. RL = the low calibration level adjusted fo & = outside QC limits.
E-15

Pilot Survey of PCDDs, PCDFs, PCBs and Mercury in Rural Soils of the U.S. - Final Report
WA5-11 Batch 2 BATTELLE SDG 49971-23&28 MOD 1668M
NOTES CLIENT_ ID Fond du Lac, MN Fond du Lac, MN Goodwell, OK Big Bend, TX Grand Canyon, AZ LAB_SAMP_ ID EPA-20 COMP EPA-20 COMP Duplicate EPA-22 COMP EPA-23 COMP EPA-24 COMP SAMPLE_WGT_VOL 19.0782 19.6037 17.5068 18.1705 19.0697 SAMP_WGT_VOL_UNIT G DRYWT G DRYWT G DRYWT G DRYWT G DRYWT PCT_DRY_WT 97.1 97.1 88.38 91.6 95.74 COLLECTION_DATE 8/22/2003 8/22/2003 8/20/2003 9/8/2003 8/26/2003 RECEIPT_DATE 8/26/2003 8/26/2003 8/22/2003 9/10/2003 8/29/2003 COMPOSITE_DATE 9/4/2003 9/4/2003 9/4/2003 9/18/2003 9/4/2003 EXTRACT_DATE 11/6/2003 11/6/2003 11/6/2003 11/6/2003 11/6/2003 ANALYSIS_DATE 12/15/2003 12/16/2003 12/18/2003 12/15/2003 12/18/2003 DIOXIN_ EXTRACT_ LRB_ NUMBER 49971-23-09 49971-23-18 49971-23-10 49971-23-11 49971-23-12 REPORTING UNIT PG/G DRYWT PG/G DRYWT PG/G DRYWT PG/G DRYWT PG/G DRYWT REPORTING LIMIT (RL) 0.26 0.26 0.86 0.28 1.05
PARAM_NAME RESULT LAB_QUAL RESULT LAB_QUAL RESULT LAB_QUAL RESULT LAB_QUAL RESULT LAB_QUAL PCB-1 4.22 5.57 52.02 1.95 2.55 PCB-2 4.70 5.10 46.92 1.51 1.45 PCB-3 5.03 4.89 40.56 1.86 1.87 PCB-4 9.95 10.51 89.02 3.91 UPCB-10 U 0.89 6.46 U UPCB-9 U 2.78 21.33 0.87 UPCB-7 U 1.30 10.15 0.49 UPCB-6 U 7.16 58.06 2.78 3.50PCB-5 U 0.63 6.75 0.29 UPCB-8 U 7.39 52.85 4.15 4.83 PCB-19 6.11 5.08 35.74 2.17 2.36PCB-14 U U U U UPCB-30 C18 C18 C18 C18 C18 PCB-18 18.24 C 18.22 C 103.68 C 6.10 C 9.36 CPCB-11 U 5.28 24.72 2.23 U PCB-17 12.01 11.95 65.72 4.11 5.94PCB-13 C12 C12 C12 C12 C12PCB-27 C16 C16 C16 C16 C16PCB-12 CU 7.28 C 47.00 C 3.12 C CUPCB-24 C16 C16 C16 C16 C16 PCB-16 8.34 C 8.01 C 48.96 C 3.06 C 5.37 CPCB-15 U 3.91 17.77 2.85 U PCB-54 1.05 0.89 14.59 0.52 U PCB-32 3.13 3.09 17.00 1.75 2.15 PCB-34 0.41 0.53 2.73 U UPCB-23 U U 0.76 J U U PCB-26 7.18 C 6.44 C 30.16 C 3.28 C 3.72 CPCB-29 C26 C26 C26 C26 C26 PCB-25 3.04 2.33 9.48 1.62 1.20 PCB-50 9.04 C 11.10 C 64.24 C 17.28 C 8.18 CPCB-53 C50 C50 C50 C50 C50 PCB-31 9.35 7.19 34.79 5.42 4.88PCB-28 C20 C20 C20 C20 C20 PCB-20 20.16 C 15.44 C 70.36 C 14.56 C 8.84 C PCB-45 9.38 C 10.32 C 67.92 C 6.84 C 6.78 CPCB-21 C20 C20 C20 C20 C20PCB-51 C45 C45 C45 C45 C45PCB-33 C20 C20 C20 C20 C20 PCB-46 2.05 2.79 15.84 1.66 U PCB-22 3.76 3.18 10.71 2.21 1.76PCB-52 C43 C43 C43 C43 C43PCB-73 C43 C43 C43 C43 C43 PCB-43 38.67 C 39.18 C 135.36 C 330.60 C 33.84 CPCB-36 U U 1.58 U UPCB-69 C49 C49 C49 C49 C49 PCB-49 17.08 C 21.12 C 84.94 C 72.40 C 15.68 CPCB-39 U 0.49 0.83 J U U PCB-48 7.30 9.62 52.18 5.19 6.16PCB-104 U U U U UPCB-65 C44 C44 C44 C44 C44PCB-47 C44 C44 C44 C44 C44 PCB-44 20.31 C 22.44 C 81.42 C 105.03 C 19.11 CPCB-62 C59 C59 C59 C59 C59PCB-38 U 0.27 U U 9.01PCB-75 C59 C59 C59 C59 C59 PCB-59 2.31 C 1.74 C 14.79 C 3.30 C 1.74 C PCB-96 2.55 U 9.94 7.02 U PCB-42 4.75 4.58 28.76 14.58 5.03 PCB-35 2.88 2.71 13.89 1.55 1.51PCB-41 C40 C40 C40 C40 C40PCB-71 C40 C40 C40 C40 C40 PCB-40 9.00 C 8.16 C 52.05 C 37.77 C 11.46 C PCB-37 3.72 4.41 13.07 5.49 1.77 PCB-64 6.66 3.68 18.50 109.27 4.72 PCB-72 0.94 1.20 6.55 U UPCB-103 U U 3.52 U UPCB-68 U 0.47 1.93 U U
E-16
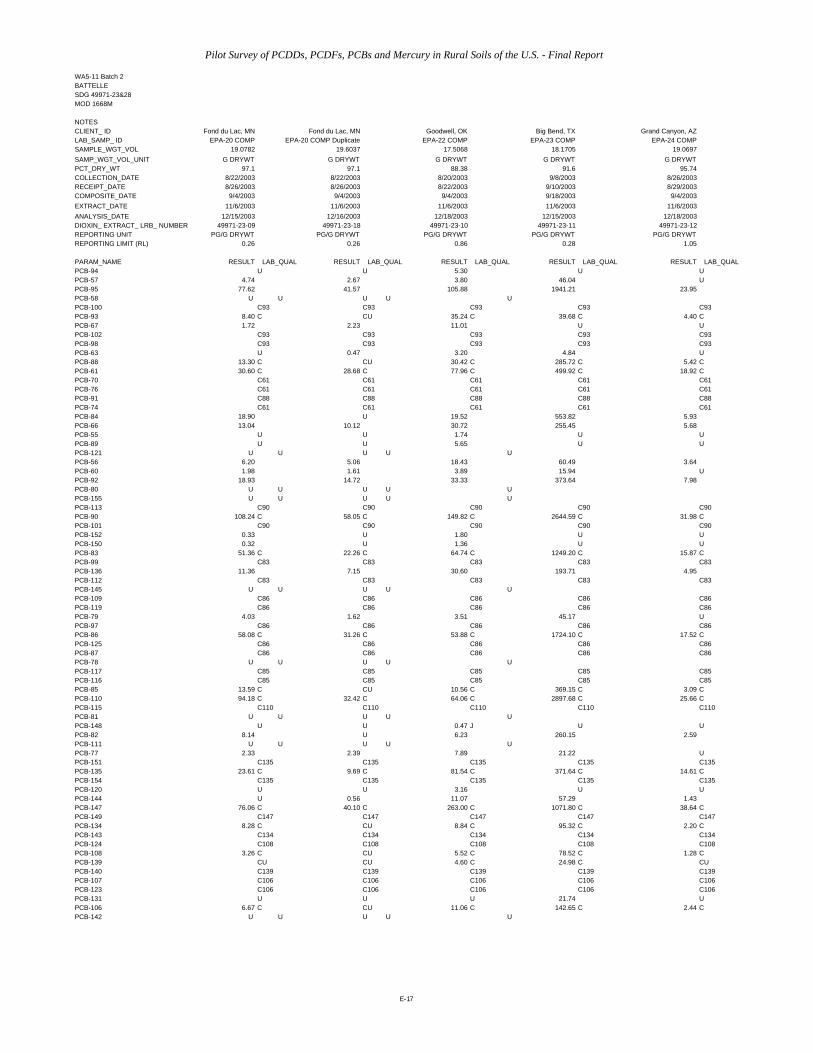
Pilot Survey of PCDDs, PCDFs, PCBs and Mercury in Rural Soils of the U.S. - Final Report
WA5-11 Batch 2 BATTELLE SDG 49971-23&28 MOD 1668M
NOTES CLIENT_ ID Fond du Lac, MN Fond du Lac, MN Goodwell, OK Big Bend, TX Grand Canyon, AZ LAB_SAMP_ ID EPA-20 COMP EPA-20 COMP Duplicate EPA-22 COMP EPA-23 COMP EPA-24 COMP SAMPLE_WGT_VOL 19.0782 19.6037 17.5068 18.1705 19.0697 SAMP_WGT_VOL_UNIT G DRYWT G DRYWT G DRYWT G DRYWT G DRYWT PCT_DRY_WT 97.1 97.1 88.38 91.6 95.74 COLLECTION_DATE 8/22/2003 8/22/2003 8/20/2003 9/8/2003 8/26/2003 RECEIPT_DATE 8/26/2003 8/26/2003 8/22/2003 9/10/2003 8/29/2003 COMPOSITE_DATE 9/4/2003 9/4/2003 9/4/2003 9/18/2003 9/4/2003 EXTRACT_DATE 11/6/2003 11/6/2003 11/6/2003 11/6/2003 11/6/2003 ANALYSIS_DATE 12/15/2003 12/16/2003 12/18/2003 12/15/2003 12/18/2003 DIOXIN_ EXTRACT_ LRB_ NUMBER 49971-23-09 49971-23-18 49971-23-10 49971-23-11 49971-23-12 REPORTING UNIT PG/G DRYWT PG/G DRYWT PG/G DRYWT PG/G DRYWT PG/G DRYWT REPORTING LIMIT (RL) 0.26 0.26 0.86 0.28 1.05
PARAM_NAME RESULT LAB_QUAL RESULT LAB_QUAL RESULT LAB_QUAL RESULT LAB_QUAL RESULT LAB_QUALPCB-94 U U 5.30 U U PCB-57 4.74 2.67 3.80 46.04 U PCB-95 77.62 41.57 105.88 1941.21 23.95PCB-58 U U U U UPCB-100 C93 C93 C93 C93 C93 PCB-93 8.40 C CU 35.24 C 39.68 C 4.40 C PCB-67 1.72 2.23 11.01 U UPCB-102 C93 C93 C93 C93 C93PCB-98 C93 C93 C93 C93 C93PCB-63 U 0.47 3.20 4.84 U PCB-88 13.30 C CU 30.42 C 285.72 C 5.42 C PCB-61 30.60 C 28.68 C 77.96 C 499.92 C 18.92 CPCB-70 C61 C61 C61 C61 C61PCB-76 C61 C61 C61 C61 C61PCB-91 C88 C88 C88 C88 C88PCB-74 C61 C61 C61 C61 C61 PCB-84 18.90 U 19.52 553.82 5.93 PCB-66 13.04 10.12 30.72 255.45 5.68PCB-55 U U 1.74 U UPCB-89 U U 5.65 U UPCB-121 U U U U U PCB-56 6.20 5.06 18.43 60.49 3.64 PCB-60 1.98 1.61 3.89 15.94 U PCB-92 18.93 14.72 33.33 373.64 7.98PCB-80 U U U U UPCB-155 U U U U UPCB-113 C90 C90 C90 C90 C90 PCB-90 108.24 C 58.05 C 149.82 C 2644.59 C 31.98 CPCB-101 C90 C90 C90 C90 C90 PCB-152 0.33 U 1.80 U U PCB-150 0.32 U 1.36 U U PCB-83 51.36 C 22.26 C 64.74 C 1249.20 C 15.87 CPCB-99 C83 C83 C83 C83 C83 PCB-136 11.36 7.15 30.60 193.71 4.95PCB-112 C83 C83 C83 C83 C83PCB-145 U U U U UPCB-109 C86 C86 C86 C86 C86PCB-119 C86 C86 C86 C86 C86 PCB-79 4.03 1.62 3.51 45.17 UPCB-97 C86 C86 C86 C86 C86 PCB-86 58.08 C 31.26 C 53.88 C 1724.10 C 17.52 CPCB-125 C86 C86 C86 C86 C86PCB-87 C86 C86 C86 C86 C86PCB-78 U U U U UPCB-117 C85 C85 C85 C85 C85PCB-116 C85 C85 C85 C85 C85 PCB-85 13.59 C CU 10.56 C 369.15 C 3.09 C PCB-110 94.18 C 32.42 C 64.06 C 2897.68 C 25.66 CPCB-115 C110 C110 C110 C110 C110PCB-81 U U U U UPCB-148 U U 0.47 J U U PCB-82 8.14 U 6.23 260.15 2.59PCB-111 U U U U U PCB-77 2.33 2.39 7.89 21.22 UPCB-151 C135 C135 C135 C135 C135 PCB-135 23.61 C 9.69 C 81.54 C 371.64 C 14.61 CPCB-154 C135 C135 C135 C135 C135PCB-120 U U 3.16 U UPCB-144 U 0.56 11.07 57.29 1.43 PCB-147 76.06 C 40.10 C 263.00 C 1071.80 C 38.64 CPCB-149 C147 C147 C147 C147 C147 PCB-134 8.28 C CU 8.84 C 95.32 C 2.20 CPCB-143 C134 C134 C134 C134 C134PCB-124 C108 C108 C108 C108 C108 PCB-108 3.26 C CU 5.52 C 78.52 C 1.28 CPCB-139 CU CU 4.60 C 24.98 C CUPCB-140 C139 C139 C139 C139 C139PCB-107 C106 C106 C106 C106 C106PCB-123 C106 C106 C106 C106 C106PCB-131 U U U 21.74 U PCB-106 6.67 C CU 11.06 C 142.65 C 2.44 CPCB-142 U U U U U
E-17

Pilot Survey of PCDDs, PCDFs, PCBs and Mercury in Rural Soils of the U.S. - Final Report
WA5-11 Batch 2 BATTELLE SDG 49971-23&28 MOD 1668M
NOTES CLIENT_ ID Fond du Lac, MN Fond du Lac, MN Goodwell, OK Big Bend, TX Grand Canyon, AZ LAB_SAMP_ ID EPA-20 COMP EPA-20 COMP Duplicate EPA-22 COMP EPA-23 COMP EPA-24 COMP SAMPLE_WGT_VOL 19.0782 19.6037 17.5068 18.1705 19.0697 SAMP_WGT_VOL_UNIT G DRYWT G DRYWT G DRYWT G DRYWT G DRYWT PCT_DRY_WT 97.1 97.1 88.38 91.6 95.74 COLLECTION_DATE 8/22/2003 8/22/2003 8/20/2003 9/8/2003 8/26/2003 RECEIPT_DATE 8/26/2003 8/26/2003 8/22/2003 9/10/2003 8/29/2003 COMPOSITE_DATE 9/4/2003 9/4/2003 9/4/2003 9/18/2003 9/4/2003 EXTRACT_DATE 11/6/2003 11/6/2003 11/6/2003 11/6/2003 11/6/2003 ANALYSIS_DATE 12/15/2003 12/16/2003 12/18/2003 12/15/2003 12/18/2003 DIOXIN_ EXTRACT_ LRB_ NUMBER 49971-23-09 49971-23-18 49971-23-10 49971-23-11 49971-23-12 REPORTING UNIT PG/G DRYWT PG/G DRYWT PG/G DRYWT PG/G DRYWT PG/G DRYWT REPORTING LIMIT (RL) 0.26 0.26 0.86 0.28 1.05
PARAM_NAME RESULT LAB_QUAL RESULT LAB_QUAL RESULT LAB_QUAL RESULT LAB_QUAL RESULT LAB_QUAL PCB-118 66.92 U 44.51 1917.27 19.96 PCB-132 33.16 23.17 66.48 609.59 13.77PCB-122 U U 1.34 U UPCB-188 U U U U UPCB-114 U U U 24.47 UPCB-133 U U 5.30 U U PCB-179 9.01 8.94 49.91 39.86 4.62PCB-165 U U U U U PCB-146 12.96 C 10.52 C 56.22 C 159.06 C 9.92 C PCB-105 24.47 U 12.74 657.10 6.73PCB-184 U U U U UPCB-161 C146 C146 C146 C146 C146 PCB-176 2.66 2.61 10.49 14.54 1.37 PCB-153 88.32 C 82.22 C 323.64 C 1183.70 C 46.30 CPCB-168 C153 C153 C153 C153 C153 PCB-141 18.59 12.70 43.90 241.27 9.36PCB-186 U U U U U PCB-130 6.61 2.83 14.47 105.42 UPCB-127 U U U U U PCB-137 13.36 C 7.20 C 31.04 C 201.12 C 5.22 CPCB-164 C137 C137 C137 C137 C137PCB-163 C129 C129 C129 C129 C129PCB-138 C129 C129 C129 C129 C129 PCB-129 106.36 C 84.00 C 295.16 C 1692.12 C 43.48 CPCB-160 C129 C129 C129 C129 C129 PCB-158 9.68 4.95 22.01 169.24 3.69 PCB-178 4.63 4.81 34.11 18.70 2.03 PCB-175 0.84 1.06 3.81 4.30 UPCB-126 U U 2.15 U UPCB-166 C128 C128 C128 C128 C128 PCB-128 17.20 C 12.18 C 31.48 C 306.66 C 4.32 C PCB-187 23.34 23.48 176.26 99.95 11.56PCB-182 U 0.20 J U 0.79 UPCB-183 C174 C174 C174 C174 C174PCB-185 C174 C174 C174 C174 C174PCB-159 U U 3.56 U U PCB-174 28.41 C 27.48 C 154.98 C 167.82 C 15.03 C PCB-162 1.07 0.50 2.81 6.50 U PCB-177 11.02 10.43 85.76 57.52 5.07 PCB-202 1.98 2.24 14.88 4.47 0.67 J PCB-167 4.69 3.45 10.91 56.94 1.65PCB-181 U U U 2.19 U PCB-171 6.08 C 5.26 C 32.18 C 39.32 C 2.20 CPCB-173 C171 C171 C171 C171 C171 PCB-201 1.13 1.31 6.29 3.25 0.43 J PCB-156 11.34 C 7.82 C 15.14 C 185.24 C 2.84 CPCB-157 C156 C156 C156 C156 C156PCB-204 U U U 0.32 U PCB-197 0.98 C 0.86 C 8.90 C 3.94 C CUPCB-200 C197 C197 C197 C197 C197 PCB-172 3.85 3.55 23.48 17.92 1.73PCB-192 U U U U UPCB-193 C180 C180 C180 C180 C180 PCB-180 39.30 C 41.10 C 225.46 C 184.20 C 18.64 C PCB-191 0.53 U 3.39 4.38 U PCB-170 18.28 14.61 103.51 120.72 7.92 PCB-190 3.75 1.91 3.29 21.22 1.19 PCB-169 U 0.48 U U U PCB-198 10.10 C 11.58 C 65.58 C 24.82 C 2.86 CPCB-199 C198 C198 C198 C198 C198 PCB-196 3.68 4.23 19.60 11.25 1.91 PCB-203 5.51 5.35 44.21 15.42 1.86 PCB-208 2.85 3.25 7.88 3.14 0.29 J PCB-195 2.44 2.92 28.03 8.99 1.10 PCB-189 0.95 1.22 4.35 5.91 U PCB-207 1.61 1.74 3.04 1.78 U PCB-194 7.61 8.29 53.93 19.49 3.07 PCB-205 1.15 1.31 3.18 2.90 U PCB-206 7.78 8.51 30.71 7.97 2.30 PCB-209 8.43 9.34 8.48 4.18 1.81
J = reported value < Reporting Limit (RL U = not detected. RL = the low calibration level adjusted fo & = outside QC limits.
E-18
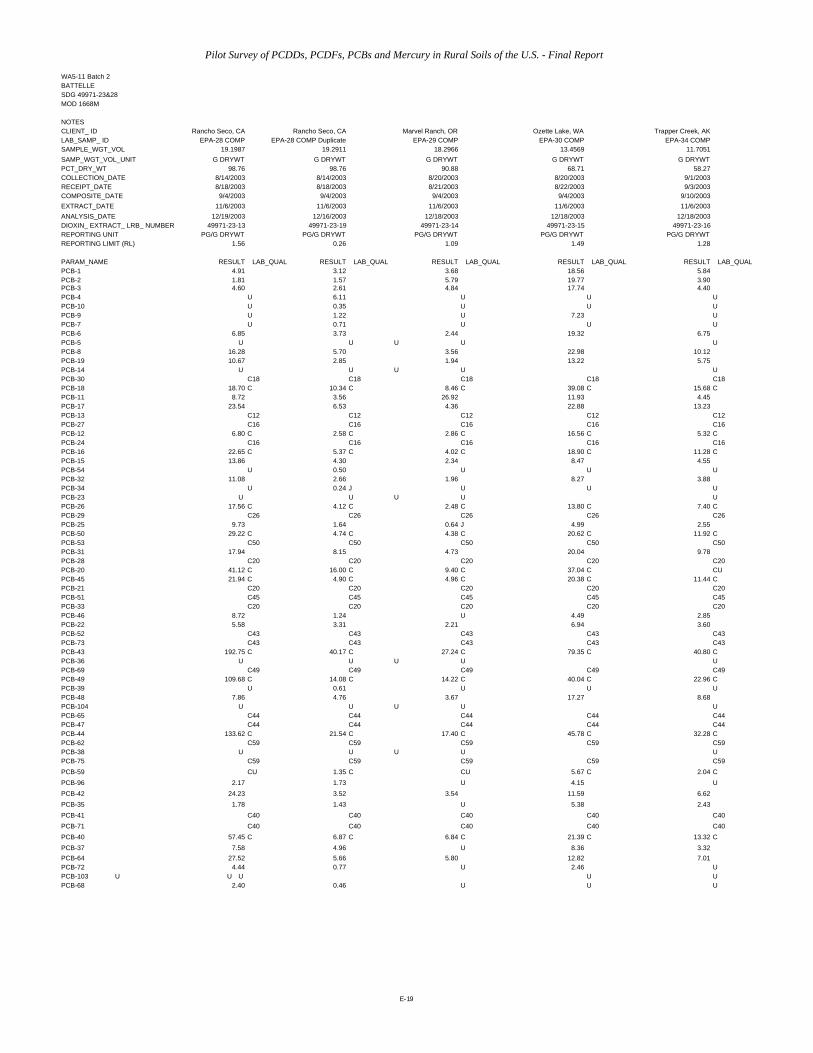
Pilot Survey of PCDDs, PCDFs, PCBs and Mercury in Rural Soils of the U.S. - Final Report
WA5-11 Batch 2 BATTELLE SDG 49971-23&28 MOD 1668M
NOTES CLIENT_ ID Rancho Seco, CA Rancho Seco, CA Marvel Ranch, OR Ozette Lake, WA Trapper Creek, AK LAB_SAMP_ ID EPA-28 COMP EPA-28 COMP Duplicate EPA-29 COMP EPA-30 COMP EPA-34 COMP SAMPLE_WGT_VOL 19.1987 19.2911 18.2966 13.4569 11.7051 SAMP_WGT_VOL_UNIT G DRYWT G DRYWT G DRYWT G DRYWT G DRYWT PCT_DRY_WT 98.76 98.76 90.88 68.71 58.27 COLLECTION_DATE 8/14/2003 8/14/2003 8/20/2003 8/20/2003 9/1/2003 RECEIPT_DATE 8/18/2003 8/18/2003 8/21/2003 8/22/2003 9/3/2003 COMPOSITE_DATE 9/4/2003 9/4/2003 9/4/2003 9/4/2003 9/10/2003 EXTRACT_DATE 11/6/2003 11/6/2003 11/6/2003 11/6/2003 11/6/2003 ANALYSIS_DATE 12/19/2003 12/16/2003 12/18/2003 12/18/2003 12/18/2003 DIOXIN_ EXTRACT_ LRB_ NUMBER 49971-23-13 49971-23-19 49971-23-14 49971-23-15 49971-23-16 REPORTING UNIT PG/G DRYWT PG/G DRYWT PG/G DRYWT PG/G DRYWT PG/G DRYWT REPORTING LIMIT (RL) 1.56 0.26 1.09 1.49 1.28
PARAM_NAME RESULT LAB_QUAL RESULT LAB_QUAL RESULT LAB_QUAL RESULT LAB_QUAL RESULT LAB_QUAL PCB-1 4.91 3.12 3.68 18.56 5.84 PCB-2 1.81 1.57 5.79 19.77 3.90 PCB-3 4.60 2.61 4.84 17.74 4.40PCB-4 U 6.11 U U UPCB-10 U 0.35 U U UPCB-9 U 1.22 U 7.23 UPCB-7 U 0.71 U U U PCB-6 6.85 3.73 2.44 19.32 6.75PCB-5 U U U U U PCB-8 16.28 5.70 3.56 22.98 10.12 PCB-19 10.67 2.85 1.94 13.22 5.75PCB-14 U U U U UPCB-30 C18 C18 C18 C18 C18 PCB-18 18.70 C 10.34 C 8.46 C 39.08 C 15.68 C PCB-11 8.72 3.56 26.92 11.93 4.45 PCB-17 23.54 6.53 4.36 22.88 13.23PCB-13 C12 C12 C12 C12 C12PCB-27 C16 C16 C16 C16 C16 PCB-12 6.80 C 2.58 C 2.86 C 16.56 C 5.32 CPCB-24 C16 C16 C16 C16 C16 PCB-16 22.65 C 5.37 C 4.02 C 18.90 C 11.28 C PCB-15 13.86 4.30 2.34 8.47 4.55PCB-54 U 0.50 U U U PCB-32 11.08 2.66 1.96 8.27 3.88PCB-34 U 0.24 J U U UPCB-23 U U U U U PCB-26 17.56 C 4.12 C 2.48 C 13.80 C 7.40 CPCB-29 C26 C26 C26 C26 C26 PCB-25 9.73 1.64 0.64 J 4.99 2.55 PCB-50 29.22 C 4.74 C 4.38 C 20.62 C 11.92 CPCB-53 C50 C50 C50 C50 C50 PCB-31 17.94 8.15 4.73 20.04 9.78PCB-28 C20 C20 C20 C20 C20 PCB-20 41.12 C 16.00 C 9.40 C 37.04 C CU PCB-45 21.94 C 4.90 C 4.96 C 20.38 C 11.44 CPCB-21 C20 C20 C20 C20 C20PCB-51 C45 C45 C45 C45 C45PCB-33 C20 C20 C20 C20 C20 PCB-46 8.72 1.24 U 4.49 2.85 PCB-22 5.58 3.31 2.21 6.94 3.60PCB-52 C43 C43 C43 C43 C43PCB-73 C43 C43 C43 C43 C43 PCB-43 192.75 C 40.17 C 27.24 C 79.35 C 40.80 CPCB-36 U U U U UPCB-69 C49 C49 C49 C49 C49 PCB-49 109.68 C 14.08 C 14.22 C 40.04 C 22.96 CPCB-39 U 0.61 U U U PCB-48 7.86 4.76 3.67 17.27 8.68PCB-104 U U U U UPCB-65 C44 C44 C44 C44 C44PCB-47 C44 C44 C44 C44 C44 PCB-44 133.62 C 21.54 C 17.40 C 45.78 C 32.28 CPCB-62 C59 C59 C59 C59 C59PCB-38 U U U U UPCB-75 C59 C59 C59 C59 C59PCB-59 CU 1.35 C CU 5.67 C 2.04 C PCB-96 2.17 1.73 U 4.15 U PCB-42 24.23 3.52 3.54 11.59 6.62 PCB-35 1.78 1.43 U 5.38 2.43PCB-41 C40 C40 C40 C40 C40PCB-71 C40 C40 C40 C40 C40 PCB-40 57.45 C 6.87 C 6.84 C 21.39 C 13.32 C PCB-37 7.58 4.96 U 8.36 3.32 PCB-64 27.52 5.66 5.80 12.82 7.01 PCB-72 4.44 0.77 U 2.46 UPCB-103 U U U U U PCB-68 2.40 0.46 U U U
E-19

Pilot Survey of PCDDs, PCDFs, PCBs and Mercury in Rural Soils of the U.S. - Final Report
WA5-11 Batch 2 BATTELLE SDG 49971-23&28 MOD 1668M
NOTES CLIENT_ ID Rancho Seco, CA Rancho Seco, CA Marvel Ranch, OR Ozette Lake, WA Trapper Creek, AK LAB_SAMP_ ID EPA-28 COMP EPA-28 COMP Duplicate EPA-29 COMP EPA-30 COMP EPA-34 COMP SAMPLE_WGT_VOL 19.1987 19.2911 18.2966 13.4569 11.7051 SAMP_WGT_VOL_UNIT G DRYWT G DRYWT G DRYWT G DRYWT G DRYWT PCT_DRY_WT 98.76 98.76 90.88 68.71 58.27 COLLECTION_DATE 8/14/2003 8/14/2003 8/20/2003 8/20/2003 9/1/2003 RECEIPT_DATE 8/18/2003 8/18/2003 8/21/2003 8/22/2003 9/3/2003 COMPOSITE_DATE 9/4/2003 9/4/2003 9/4/2003 9/4/2003 9/10/2003 EXTRACT_DATE 11/6/2003 11/6/2003 11/6/2003 11/6/2003 11/6/2003 ANALYSIS_DATE 12/19/2003 12/16/2003 12/18/2003 12/18/2003 12/18/2003 DIOXIN_ EXTRACT_ LRB_ NUMBER 49971-23-13 49971-23-19 49971-23-14 49971-23-15 49971-23-16 REPORTING UNIT PG/G DRYWT PG/G DRYWT PG/G DRYWT PG/G DRYWT PG/G DRYWT REPORTING LIMIT (RL) 1.56 0.26 1.09 1.49 1.28
PARAM_NAME RESULT LAB_QUAL RESULT LAB_QUAL RESULT LAB_QUAL RESULT LAB_QUAL RESULT LAB_QUALPCB-94 U U U U UPCB-57 U 3.38 U U U PCB-95 195.72 91.64 35.60 78.21 35.79PCB-58 U U U U UPCB-100 C93 C93 C93 C93 C93 PCB-93 16.92 C 5.64 C 3.40 C 14.00 C 5.56 C PCB-67 5.41 1.09 U 4.65 2.14PCB-102 C93 C93 C93 C93 C93PCB-98 C93 C93 C93 C93 C93 PCB-63 2.74 0.52 U U U PCB-88 39.38 C 15.56 C 6.94 C 15.92 C 8.36 C PCB-61 129.68 C 29.44 C 28.92 C 51.76 C 35.00 CPCB-70 C61 C61 C61 C61 C61PCB-76 C61 C61 C61 C61 C61PCB-91 C88 C88 C88 C88 C88PCB-74 C61 C61 C61 C61 C61 PCB-84 66.11 26.94 11.35 19.83 10.34 PCB-66 67.88 11.76 12.15 21.98 15.70PCB-55 U U U U UPCB-89 U U U U UPCB-121 U U U U U PCB-56 18.56 5.96 6.53 12.38 6.81 PCB-60 5.15 2.09 3.49 5.59 3.34 PCB-92 66.42 24.48 12.46 21.93 13.70PCB-80 U U U U UPCB-155 U U U U UPCB-113 C90 C90 C90 C90 C90 PCB-90 271.05 C 116.22 C 55.05 C 104.61 C 55.89 CPCB-101 C90 C90 C90 C90 C90PCB-152 U U U U UPCB-150 U U U U U PCB-83 139.89 C 63.12 C 30.78 C 47.88 C 26.58 CPCB-99 C83 C83 C83 C83 C83 PCB-136 26.72 12.63 6.40 14.63 8.94PCB-112 C83 C83 C83 C83 C83PCB-145 U U U U UPCB-109 C86 C86 C86 C86 C86PCB-119 C86 C86 C86 C86 C86PCB-79 U 2.74 U U UPCB-97 C86 C86 C86 C86 C86 PCB-86 175.44 C 68.88 C 34.62 C 44.28 C 27.30 CPCB-125 C86 C86 C86 C86 C86PCB-87 C86 C86 C86 C86 C86PCB-78 U 0.30 U U UPCB-117 C85 C85 C85 C85 C85PCB-116 C85 C85 C85 C85 C85 PCB-85 35.31 C 15.21 C 10.29 C 11.70 C 7.23 C PCB-110 294.68 C 112.76 C 58.82 C 60.12 C 43.10 CPCB-115 C110 C110 C110 C110 C110PCB-81 U U U U UPCB-148 U U U U U PCB-82 26.40 10.76 6.32 7.54 3.52PCB-111 U U U U U PCB-77 7.44 4.59 2.37 4.82 2.84PCB-151 C135 C135 C135 C135 C135 PCB-135 59.28 C 27.51 C 16.65 C 39.09 C 22.68 CPCB-154 C135 C135 C135 C135 C135PCB-120 U U U U U PCB-144 7.64 U 2.84 5.87 2.98 PCB-147 239.58 C 90.24 C 65.54 C 125.58 C 77.48 CPCB-149 C147 C147 C147 C147 C147 PCB-134 19.04 C 8.22 C 3.46 C 6.26 C 4.90 CPCB-143 C134 C134 C134 C134 C134PCB-124 C108 C108 C108 C108 C108 PCB-108 9.00 C 3.40 C 2.32 C 4.06 C 2.00 CPCB-139 CU 1.32 C CU CU CUPCB-140 C139 C139 C139 C139 C139PCB-107 C106 C106 C106 C106 C106PCB-123 C106 C106 C106 C106 C106PCB-131 U U U U U PCB-106 14.91 C 8.03 C 4.85 C 6.54 C 5.61 CPCB-142 U U U U U
E-20

Pilot Survey of PCDDs, PCDFs, PCBs and Mercury in Rural Soils of the U.S. - Final Report
WA5-11 Batch 2 BATTELLE SDG 49971-23&28 MOD 1668M
NOTES CLIENT_ ID Rancho Seco, CA Rancho Seco, CA Marvel Ranch, OR Ozette Lake, WA Trapper Creek, AK LAB_SAMP_ ID EPA-28 COMP EPA-28 COMP Duplicate EPA-29 COMP EPA-30 COMP EPA-34 COMP SAMPLE_WGT_VOL 19.1987 19.2911 18.2966 13.4569 11.7051 SAMP_WGT_VOL_UNIT G DRYWT G DRYWT G DRYWT G DRYWT G DRYWT PCT_DRY_WT 98.76 98.76 90.88 68.71 58.27 COLLECTION_DATE 8/14/2003 8/14/2003 8/20/2003 8/20/2003 9/1/2003 RECEIPT_DATE 8/18/2003 8/18/2003 8/21/2003 8/22/2003 9/3/2003 COMPOSITE_DATE 9/4/2003 9/4/2003 9/4/2003 9/4/2003 9/10/2003 EXTRACT_DATE 11/6/2003 11/6/2003 11/6/2003 11/6/2003 11/6/2003 ANALYSIS_DATE 12/19/2003 12/16/2003 12/18/2003 12/18/2003 12/18/2003 DIOXIN_ EXTRACT_ LRB_ NUMBER 49971-23-13 49971-23-19 49971-23-14 49971-23-15 49971-23-16 REPORTING UNIT PG/G DRYWT PG/G DRYWT PG/G DRYWT PG/G DRYWT PG/G DRYWT REPORTING LIMIT (RL) 1.56 0.26 1.09 1.49 1.28
PARAM_NAME RESULT LAB_QUAL RESULT LAB_QUAL RESULT LAB_QUAL RESULT LAB_QUAL RESULT LAB_QUAL PCB-118 224.99 70.78 42.39 49.92 34.05 PCB-132 114.32 34.45 26.06 39.45 23.66PCB-122 U U U U UPCB-188 U U U U UPCB-114 U U U U UPCB-133 U U U U U PCB-179 17.12 10.94 10.06 17.13 7.84PCB-165 U U U U U PCB-146 50.46 C 16.90 C 12.32 C 27.98 C 15.60 C PCB-105 73.62 28.99 20.80 18.45 12.32PCB-184 U U U U UPCB-161 C146 C146 C146 C146 C146 PCB-176 4.71 2.60 2.66 4.76 3.26 PCB-153 291.96 C 137.92 C 85.12 C 154.06 C 89.56 CPCB-168 C153 C153 C153 C153 C153 PCB-141 50.69 21.31 14.12 26.33 14.92PCB-186 U U U U U PCB-130 21.66 8.26 5.48 8.28 4.62PCB-127 U U U U U PCB-137 40.90 C 14.30 C 10.02 C 13.30 C 10.02 CPCB-164 C137 C137 C137 C137 C137PCB-163 C129 C129 C129 C129 C129PCB-138 C129 C129 C129 C129 C129 PCB-129 347.96 C 149.92 C 95.16 C 133.48 C 79.88 CPCB-160 C129 C129 C129 C129 C129 PCB-158 33.44 10.88 9.25 10.77 6.49 PCB-178 11.77 8.24 5.08 8.98 3.83 PCB-175 1.44 J 0.97 0.96 J 1.23 J UPCB-126 U U U U UPCB-166 C128 C128 C128 C128 C128 PCB-128 56.42 C 22.28 C 15.54 C 15.84 C 10.50 C PCB-187 47.84 38.32 29.79 50.93 22.78 PCB-182 0.60 J U 0.41 J 0.60 J UPCB-183 C174 C174 C174 C174 C174PCB-185 C174 C174 C174 C174 C174PCB-159 U U U U U PCB-174 63.33 C 38.16 C 34.05 C 56.85 C 29.07 CPCB-162 U 1.03 U U U PCB-177 24.67 13.68 11.50 21.44 10.31 PCB-202 8.44 5.81 7.05 7.41 1.78 PCB-167 10.06 6.22 3.18 4.60 2.97PCB-181 U U U U U PCB-171 14.00 C 6.88 C 6.46 C 11.56 C 4.66 CPCB-173 C171 C171 C171 C171 C171 PCB-201 3.10 2.37 3.12 2.97 1.04 J PCB-156 30.86 C 15.64 C 7.14 C 8.28 C 5.66 CPCB-157 C156 C156 C156 C156 C156PCB-204 U U U U U PCB-197 3.54 C 1.72 C 2.04 C 2.74 C CUPCB-200 C197 C197 C197 C197 C197 PCB-172 13.56 6.03 4.18 6.95 3.18PCB-192 U U U U UPCB-193 C180 C180 C180 C180 C180 PCB-180 91.98 C 59.42 C 48.84 C 78.82 C 34.04 C PCB-191 1.60 1.13 1.10 U U PCB-170 44.39 26.21 19.89 30.73 14.03 PCB-190 10.63 7.31 4.07 7.22 2.20 PCB-169 U 0.86 U U U PCB-198 27.72 C 25.50 C 27.00 C 23.98 C 6.78 CPCB-199 C198 C198 C198 C198 C198 PCB-196 9.78 7.16 7.84 7.22 3.17 PCB-203 17.07 13.82 17.42 13.45 3.48 PCB-208 7.37 6.32 8.53 18.13 U PCB-195 7.60 5.16 4.69 5.84 1.61 PCB-189 1.79 1.94 1.05 J 1.34 J U PCB-207 3.59 3.27 3.37 3.73 U PCB-194 21.34 15.26 17.02 17.73 5.58 PCB-205 1.05 J 2.19 0.65 J 0.78 J U PCB-206 21.93 17.50 28.76 47.16 2.14PCB-209 U 12.10 12.72 63.96 1.70
J = reported value < Reporting Limit (RL U = not detected. RL = the low calibration level adjusted fo & = outside QC limits.
E-21

APPENDIX F
LITERATURE REVIEW OF CDD, CDF, PCB, AND MERCURY LEVELS IN SOIL
F-1

Appendix F: Literature Review of CDD, CDF, PCB, and Mercury Levels in Soil
This appendix provides a literature review of studies reporting CDD, CDF, PCB, and mercury levels in soil. The review focuses mainly on rural soils in the U.S., but it includes some information on studies from other countries as well. Section 1 (CDDs and CDFs) was excerpted (with minor editing/updating) from the U.S. Environmental Protection Agency’s (EPA’s) draft dioxin reassessment (U.S. EPA, 2000). It should be noted that the studies included in this review have a wide variety of design features (e.g., detection limits, treatment of nondetects in deriving statistics, congener inclusion, sampling procedures, analytical techniques) that make them difficult to compare on a completely equal basis. Information is provided to help readers consider these differences, but no adjustments were made to the values reported in the original studies.
1. CDDs and CDFs 1.1. North American Data
Soil sampled in 1987 from the vicinity of a sewage sludge incinerator was compared with soil from rural and urban sites in Ontario, Canada, by Pearson et al. (1990). Soil in the vicinity of the incinerator showed a general increase in CDD concentration with increasing degree of chlorination (Table 1). Of the CDFs, only OCDF was detected (mean concentration, 43 ppt). Rural wood lot soil samples contained only OCDD (mean concentration, 30 ppt). Soil samples from undisturbed urban parkland settings revealed only HpCDDs and OCDD, but all CDF congener groups (Cl4 to Cl8) were present. Those samples showed an increase in concentration from the HpCDDs to OCDD and PeCDFs to OCDF. TCDFs had the highest mean value (29 ppt) of all the CDF congener groups. Resampling of one urban site in 1988, however, showed high variability in the concentrations of CDDs and CDFs.
Reed et al. (1990) analyzed background soil samples from a semi-rural location in Elk River, MN, as part of a baseline assessment prior to the operation of a refuse-derived fuel-powered electric generation station. Four soil samples (two from an untilled site and two from a tilled site) were collected and analyzed for CDD/CDFs. Of the CDD/CDF congeners, OCDD concentrations were the highest, ranging from 340 ppt to 3,300 ppt. OCDF concentrations ranged from nondetect (ND) to 270 ppt. The 2,3,7,8-tetra- and-penta-chlorinated congeners were not detected in any of the samples analyzed (Table 2).
Data were collected on CDD and CDF levels in soil samples from industrial, urban, and rural sites in Ontario and some U.S. midwestern states (Birmingham, 1990). CDD/CDF levels in rural soils were primarily ND, although the HpCDDs and OCDD were found in a few samples. In urban soils, the tetra through octa homologue groups were measured for both CDDs and CDFs. The HpCDDs and OCDD dominated and were two orders of magnitude greater than in the rural soils. These soils also contained measurable quantities of the TCDDs and PeCDDs. Industrial soils did not contain any TCDDs or PeCDDs, but they contained the highest levels of the TCDFs, HpCDFs, and OCDF. Total CDD/CDF concentrations averaged 73 ± 50 ppt in rural soils (n = 30), 2,075 ± 3,608 ppt in urban soils (n = 47), and 8,314 ± 9,955 ppt in industrial soils (n = 20) when NDs were assumed to be zero. I-TEQDFs were also calculated for these three types of sites by Birmingham (1990) by assuming that the 2,3,7,8-substituted CDD/CDF congeners
F-2

Table 1. Mean CDD and CDF concentrations (ppt) in Canadian soil in 1987a
Homolog group
Soil near sludge incinerator
(n = 12) Urban background
(n = 11) Rural background
(n = 26)
TCDDs 69 (ND–430) ND ND PeCDDs 81 (ND–540) ND ND HxCDDs 9 (ND–70) ND ND HpCDDs 43 (ND–300) 31 (ND–140) ND OCDD 570 (ND–1,500) 1,461 (ND–11,000) 30 (ND–100) Total CDDs 772 (ND–2,770) 1,492 (ND–11,140) 30 (ND–100)
TCDFs ND 29 (ND–120) ND PeCDFs ND 1 (ND–10) ND HxCDFs ND 7 (ND–35) ND HpCDFs ND 9 (ND–60) ND OCDF 43 (ND–230) 16 (ND–160) ND Total CDFs 43 (ND–230) 65 (ND–262) ND
a Data collected in 1987 in Ontario Canada; range presented in parentheses.
ND = not detected
Source: Pearson et al. (1990).
represent specified proportions of the homologue group concentrations and by applying I-TEFDFs. Birmingham estimated the I-TEQDFs to be 0.4 ± 0.6 ppt for rural soil, 11.3 ± 21.8 ppt for urban soils, and 40.8 ± 33.1 for industrial soils.
Nine background soil samples were collected from the Yarmouth Pole Yard site located in Yarmouth, ME (Tewhey Associates, 1997). One of these samples, collected from soil near the base of a utility pole, yielded an I-TEQDF concentration of 57,000 pg/g. The I-TEQDF concentrations for the other eight samples ranged from 0.73 pg/g to 5.9 pg/g when NDs were assumed to be zero and 1.46 pg/g to 6.07 pg/g when NDs were assumed to be one-half the detection limit. These samples are from rural background locations. The mean I-TEQDF for these eight samples was 3.58 pg/g (TEQDFWHO98 was 2.89 pg/g) when NDs were set to zero and 3.93 pg/g when NDs were set to one-half the detection limit. The sample collected near the utility pole was not included in these mean TEQ values because its results were not considered to be representative of typical rural background concentrations.
In an effort to determine whether incineration of municipal waste influenced CDD/CDF levels in the immediate area of waste incineration facilities, soil samples were collected from cities with and without operating incinerators throughout Connecticut. Between the years of 1987 and 1990, 34 soil samples were collected from eight different Connecticut cities where no municipal waste incinerators were operating (MRI, 1992). These pre-operational samples were considered to be representative of rural background concentrations. The total I-TEQDF reported for these samples was 6.07 pg/g, with NDs assumed to be one-half the detection limit. When the
F-3
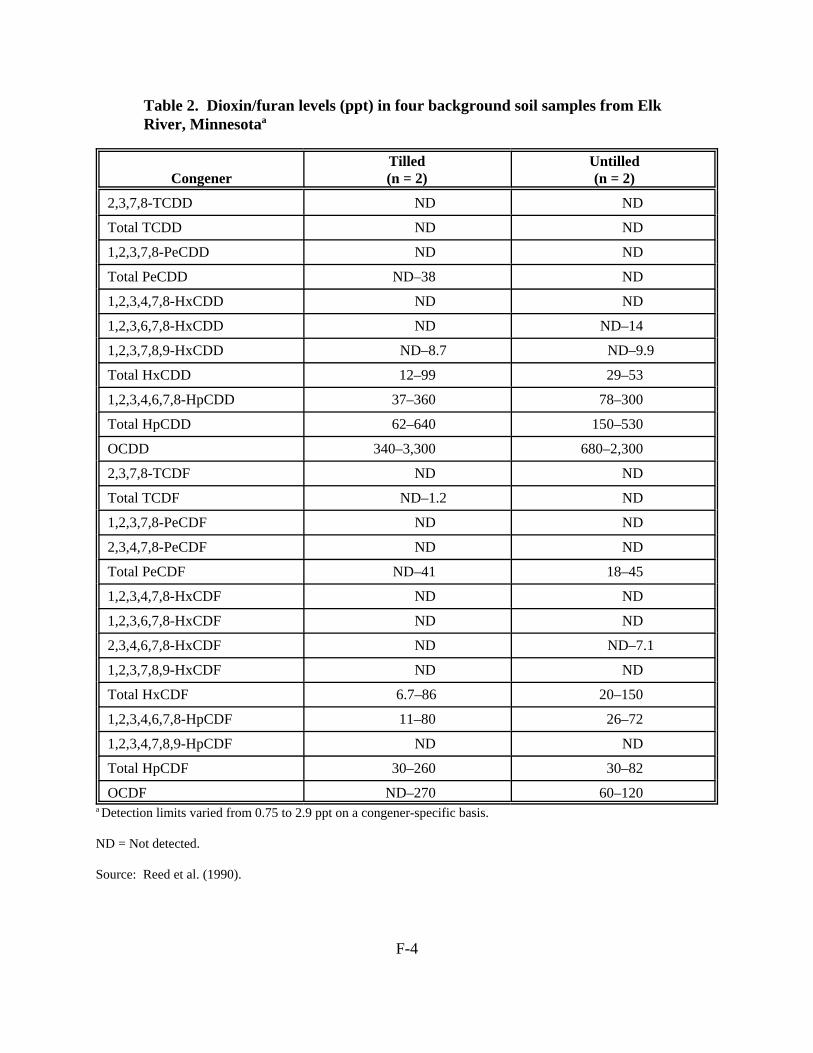
Table 2. Dioxin/furan levels (ppt) in four background soil samples from Elk River, Minnesotaa
Congener Tilled (n = 2)
Untilled (n = 2)
2,3,7,8-TCDD ND ND
Total TCDD ND ND
1,2,3,7,8-PeCDD ND ND
Total PeCDD ND–38 ND
1,2,3,4,7,8-HxCDD ND ND
1,2,3,6,7,8-HxCDD ND ND–14
1,2,3,7,8,9-HxCDD ND–8.7 ND–9.9
Total HxCDD 12–99 29–53
1,2,3,4,6,7,8-HpCDD 37–360 78–300
Total HpCDD 62–640 150–530
OCDD 340–3,300 680–2,300
2,3,7,8-TCDF ND ND
Total TCDF ND–1.2 ND
1,2,3,7,8-PeCDF ND ND
2,3,4,7,8-PeCDF ND ND
Total PeCDF ND–41 18–45
1,2,3,4,7,8-HxCDF ND ND
1,2,3,6,7,8-HxCDF ND ND
2,3,4,6,7,8-HxCDF ND ND–7.1
1,2,3,7,8,9-HxCDF ND ND
Total HxCDF 6.7–86 20–150
1,2,3,4,6,7,8-HpCDF 11–80 26–72
1,2,3,4,7,8,9-HpCDF ND ND
Total HpCDF 30–260 30–82
OCDF ND–270 60–120 a Detection limits varied from 0.75 to 2.9 ppt on a congener-specific basis.
ND = Not detected.
Source: Reed et al. (1990).
F-4
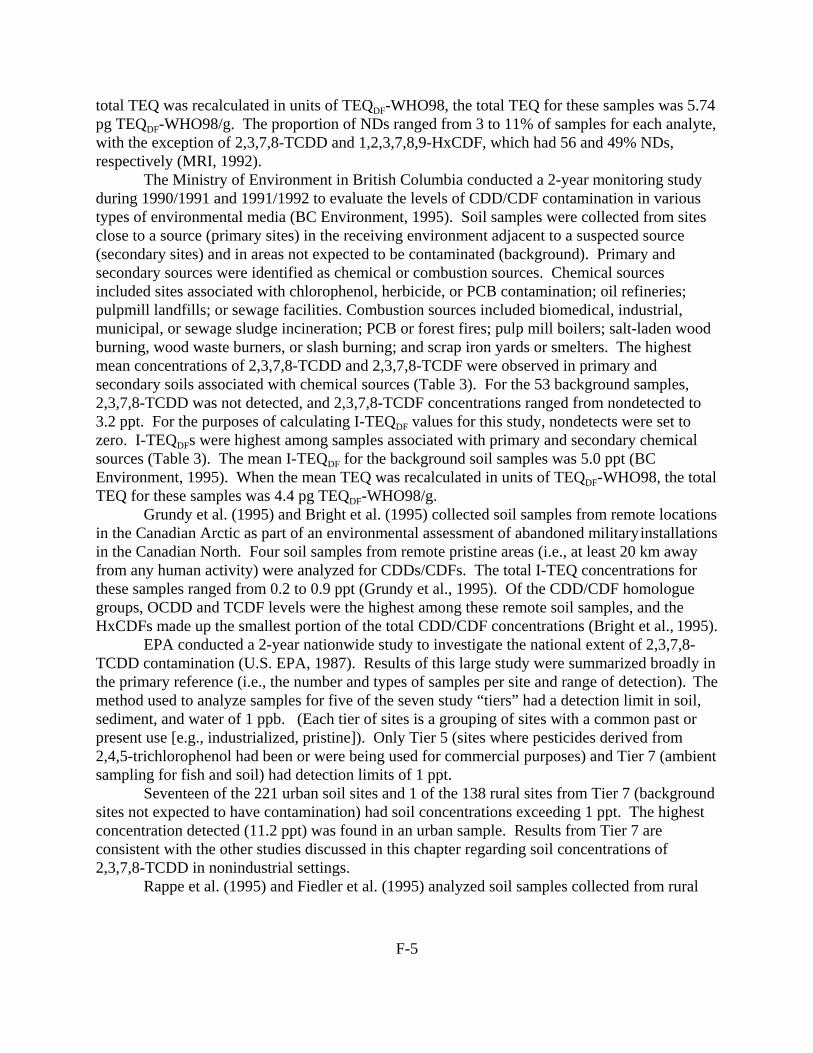
total TEQ was recalculated in units of TEQDF-WHO98, the total TEQ for these samples was 5.74 pg TEQDF-WHO98/g. The proportion of NDs ranged from 3 to 11% of samples for each analyte, with the exception of 2,3,7,8-TCDD and 1,2,3,7,8,9-HxCDF, which had 56 and 49% NDs, respectively (MRI, 1992).
The Ministry of Environment in British Columbia conducted a 2-year monitoring study during 1990/1991 and 1991/1992 to evaluate the levels of CDD/CDF contamination in various types of environmental media (BC Environment, 1995). Soil samples were collected from sites close to a source (primary sites) in the receiving environment adjacent to a suspected source (secondary sites) and in areas not expected to be contaminated (background). Primary and secondary sources were identified as chemical or combustion sources. Chemical sources included sites associated with chlorophenol, herbicide, or PCB contamination; oil refineries; pulpmill landfills; or sewage facilities. Combustion sources included biomedical, industrial, municipal, or sewage sludge incineration; PCB or forest fires; pulp mill boilers; salt-laden wood burning, wood waste burners, or slash burning; and scrap iron yards or smelters. The highest mean concentrations of 2,3,7,8-TCDD and 2,3,7,8-TCDF were observed in primary and secondary soils associated with chemical sources (Table 3). For the 53 background samples, 2,3,7,8-TCDD was not detected, and 2,3,7,8-TCDF concentrations ranged from nondetected to 3.2 ppt. For the purposes of calculating I-TEQDF values for this study, nondetects were set to zero. I-TEQDFs were highest among samples associated with primary and secondary chemical sources (Table 3). The mean I-TEQDF for the background soil samples was 5.0 ppt (BC Environment, 1995). When the mean TEQ was recalculated in units of TEQDF-WHO98, the total TEQ for these samples was 4.4 pg TEQDF-WHO98/g.
Grundy et al. (1995) and Bright et al. (1995) collected soil samples from remote locations in the Canadian Arctic as part of an environmental assessment of abandoned military installations in the Canadian North. Four soil samples from remote pristine areas (i.e., at least 20 km away from any human activity) were analyzed for CDDs/CDFs. The total I-TEQ concentrations for these samples ranged from 0.2 to 0.9 ppt (Grundy et al., 1995). Of the CDD/CDF homologue groups, OCDD and TCDF levels were the highest among these remote soil samples, and the HxCDFs made up the smallest portion of the total CDD/CDF concentrations (Bright et al., 1995).
EPA conducted a 2-year nationwide study to investigate the national extent of 2,3,7,8TCDD contamination (U.S. EPA, 1987). Results of this large study were summarized broadly in the primary reference (i.e., the number and types of samples per site and range of detection). The method used to analyze samples for five of the seven study “tiers” had a detection limit in soil, sediment, and water of 1 ppb. (Each tier of sites is a grouping of sites with a common past or present use [e.g., industrialized, pristine]). Only Tier 5 (sites where pesticides derived from 2,4,5-trichlorophenol had been or were being used for commercial purposes) and Tier 7 (ambient sampling for fish and soil) had detection limits of 1 ppt.
Seventeen of the 221 urban soil sites and 1 of the 138 rural sites from Tier 7 (background sites not expected to have contamination) had soil concentrations exceeding 1 ppt. The highest concentration detected (11.2 ppt) was found in an urban sample. Results from Tier 7 are consistent with the other studies discussed in this chapter regarding soil concentrations of 2,3,7,8-TCDD in nonindustrial settings.
Rappe et al. (1995) and Fiedler et al. (1995) analyzed soil samples collected from rural
F-5
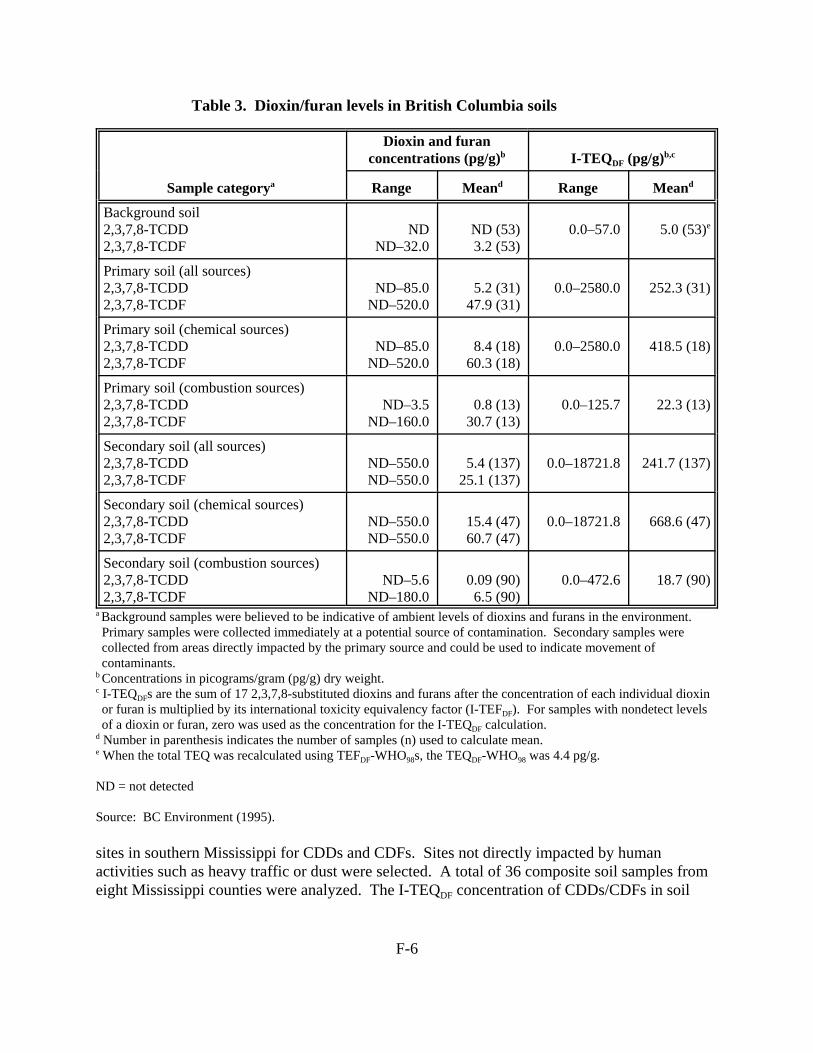
Table 3. Dioxin/furan levels in British Columbia soils
Sample categorya
Dioxin and furan concentrations (pg/g)b I-TEQDF (pg/g)b,c
Range Meand Range Meand
Background soil 2,3,7,8-TCDD 2,3,7,8-TCDF
ND ND–32.0
ND (53) 3.2 (53)
0.0–57.0 5.0 (53)e
Primary soil (all sources) 2,3,7,8-TCDD 2,3,7,8-TCDF
ND–85.0 ND–520.0
5.2 (31) 47.9 (31)
0.0–2580.0 252.3 (31)
Primary soil (chemical sources) 2,3,7,8-TCDD 2,3,7,8-TCDF
ND–85.0 ND–520.0
8.4 (18) 60.3 (18)
0.0–2580.0 418.5 (18)
Primary soil (combustion sources) 2,3,7,8-TCDD 2,3,7,8-TCDF
ND–3.5 ND–160.0
0.8 (13) 30.7 (13)
0.0–125.7 22.3 (13)
Secondary soil (all sources) 2,3,7,8-TCDD 2,3,7,8-TCDF
ND–550.0 ND–550.0
5.4 (137) 25.1 (137)
0.0–18721.8 241.7 (137)
Secondary soil (chemical sources) 2,3,7,8-TCDD 2,3,7,8-TCDF
ND–550.0 ND–550.0
15.4 (47) 60.7 (47)
0.0–18721.8 668.6 (47)
Secondary soil (combustion sources) 2,3,7,8-TCDD 2,3,7,8-TCDF
ND–5.6 ND–180.0
0.09 (90) 6.5 (90)
0.0–472.6 18.7 (90)
a Background samples were believed to be indicative of ambient levels of dioxins and furans in the environment. Primary samples were collected immediately at a potential source of contamination. Secondary samples were collected from areas directly impacted by the primary source and could be used to indicate movement of contaminants.
b Concentrations in picograms/gram (pg/g) dry weight. c I-TEQDFs are the sum of 17 2,3,7,8-substituted dioxins and furans after the concentration of each individual dioxin or furan is multiplied by its international toxicity equivalency factor (I-TEFDF). For samples with nondetect levels of a dioxin or furan, zero was used as the concentration for the I-TEQDF calculation.
d Number in parenthesis indicates the number of samples (n) used to calculate mean. e When the total TEQ was recalculated using TEFDF-WHO98s, the TEQDF-WHO98 was 4.4 pg/g.
ND = not detected
Source: BC Environment (1995).
sites in southern Mississippi for CDDs and CDFs. Sites not directly impacted by human activities such as heavy traffic or dust were selected. A total of 36 composite soil samples from eight Mississippi counties were analyzed. The I-TEQDF concentration of CDDs/CDFs in soil
F-6

ranged from 0.16 to 22.9 ppt dry mass (Fiedler et al., 1995). The mean I-TEQDF concentration was 3.1 ppt dry mass and the median I-TEQDF concentration was 0.8 ppt dry mass (Fiedler et al., 1995). CDDs were found at higher concentrations than were CDFs, and OCDD was the most dominant congener.
Soil samples were collected from the National Institutes of Health (NIH) campus in Bethesda, MD, during 1995 in an effort to determine the effect of 30 years of pathological waste incineration on the campus and its surroundings (NIH, 1995). Thirty-seven samples were collected from the soil at a depth of 6 in. The total I-TEQDF for these samples was 7.83 pg/g when NDs were assumed to be zero and 8.49 pg/g, when NDs were assumed to be one-half the detection limit. OCDD, at a I-TEQDF concentration of 6.29 pg/g, was the principal contributor to the total I-TEQDF for these samples, regardless of whether NDs were assumed to be zero or one-half the detection limit. It should be noted that using the new TEFDF-WHO98s, the TEQ for OCDD would be 10 times lower (i.e., 0.63 pg/g). This reduction would also result in a significant decrease in the total TEQ. The total TEQDF-WHO98 would be 2.21 pg/g when NDs were set to zero. Samples were also collected at depths of 12 and 24 in for comparison with levels found in the shallow (6-in) samples. Although CDD/CDF concentrations found at the surface indicate deposition, strong correlation with I-TEQDF concentrations at the deeper depths were observed. This seemed to indicate either long-term presence of the source (i.e., greater than 40 years) or soil mixing that occurred either during or after deposition. An expert panel (comprised of toxicologists, chemists, soil scientists, engineers, risk assessors, and public health professionals) concluded that the levels of I-TEQDF in the samples were low and not significantly different from background. Thus, these samples are assumed to be representative of urban background concentrations. The spatial pattern of I-TEQDF concentrations showed no particular trends that could be related to the incinerator. Other anthropogenic activities, such as vehicular traffic, other medical waste incinerators not related to NIH, and fireplaces burning in the vicinity, may have contributed to the deposition (NIH, 1995).
Soil samples were collected by EPA (U.S. EPA, 1996) in the vicinity of a municipal waste-to-energy facility in Columbus, OH, to determine whether surface soils around the incinerator contained higher CDD/CDF levels than did soils collected from background sites. The facility is not currently in operation, but CDD/CDF residues may be present in the soil near the facility as a result of past emissions. Samples were collected (1) on site, (2) from urban background locations near the incinerator, and (3) from areas remote from the facility (i.e., rural background sites). The results of the analyses indicated that soil from the rural background sites had the lowest I-TEQDF concentrations and on-site samples had the highest I-TEQDF concentrations (Table 4). For rural background soil samples, total I-TEQDFs ranged from 0.9 to 1.3 ppt (n = 3) with a mean of 1.1 ppt (TEQDF-WHO98 = 0.9 ppt) when NDs were assumed to be zero and 1.0 to 2.0 ppt with a mean of 1.4 ppt (TEQDF-WHO98 = 1.3 ppt) when NDs were set to one-half the detection limit. Total I-TEQDFs for urban background soils ranged from approximately 3 to 60 ppt (n = 18) with a mean of 19 ppt (TEQDF-WHO98 = 21 ppt) when NDs were set to either zero or one-half the detection limit. For on-site samples, all 2,3,7,8-CDD/CDF congeners were detected in all samples (n = 4). Total I-TEQDF concentrations ranged from 50 to 760 ppt with a mean of 356 ppt (TEQDF-WHO98 = 444 ppt). Additional detail and analyses of these data are presented in Lorber et al. (1998a).
F-7

Table 4. Number of positive soil samples and CDD/CDF concentrations in background, urban, and impacted sites near a waste-to-energy facility in Ohio
F-8
Congener
Background Urban Impacted
No. of positive samples
Mean concentration (ppt)
(NDs = ½ DL) No. of positive
samples
Mean concentration (ppt)
(NDs = ½ DL) No. of positive
samples
Mean concentration (ppt)
(NDs = ½ DL) 2,3,7,8-TCDD 2/3 0.39 15/18 2.27 3/3 28.5 1,2,3,7,8-PeCDD 0/3 0.14 18/18 6.58 3/3 180.0 1,2,3,4,7,8-HxCDD 1/3 0.35 18/18 6.14 3/3 142.3 1,2,3,6,7,8-HxCDD 3/3 0.82 18/18 10.9 3/3 137.8 1,2,3,7,8,9-HxCDD 3/3 1.23 18/18 10.8 3/3 201.6 1,2,3,4,6,7,8-HpCDD 3/3 17.7 18/18 190.1 3/3 765.2 OCDD 3/3 160.9 18/18 1,560.2 3/3 1495.4 2,3,7,8-TCDF 0/3 0.45 18/18 4.12 3/3 85.9 1,2,3,7,8-PeCDF 0/3 0.17 17/18 5.50 3/3 139.6 2,3,4,7,8-PeCDF 1/3 0.21 17/18 7.56 3/3 199.9 1,2,3,4,7,8-HxCDF 1/3 0.19 15/18 8.06 3/3 196.8 1,2,3,6,7,8-HxCDF 3/3 0.52 17/18 8.12 3/3 209.1 1,2,3,7,8,9-HxCDF 0/3 0.15 6/18 0.51 3/3 11.6 2,3,4,6,7,8-HxCDF 3/3 0.64 18/18 6.99 3/3 156.7 1,2,3,4,6,7,8-HpCDF 3/3 4.06 18/18 41.7 3/3 641.0 1,2,3,4,7,8,9-HpCDF 1/3 0.27 16/18 3.82 3/3 57.9 OCDF 3/3 10.72 18/18 44.3 3/3 184.5 Mean total I-TEQDF, ppt (ND = ½ DL)
-- 1.4 -- 19.2 -- 356.0
Mean total I-TEQDF, ppt (ND = 0)
-- 1.1 -- 19.2 -- 356.0
Mean total TEQDF-WHO98, ppt (NDs = ½ DL)
-- 1.3 -- 21.0 -- 444.5
Mean total TEQDF-WHO98, ppt (ND = 0)
-- 0.92 -- 21.0 -- 444.5
DL= detection limit ND = nondetects
Source: U.S. EPA (1996).
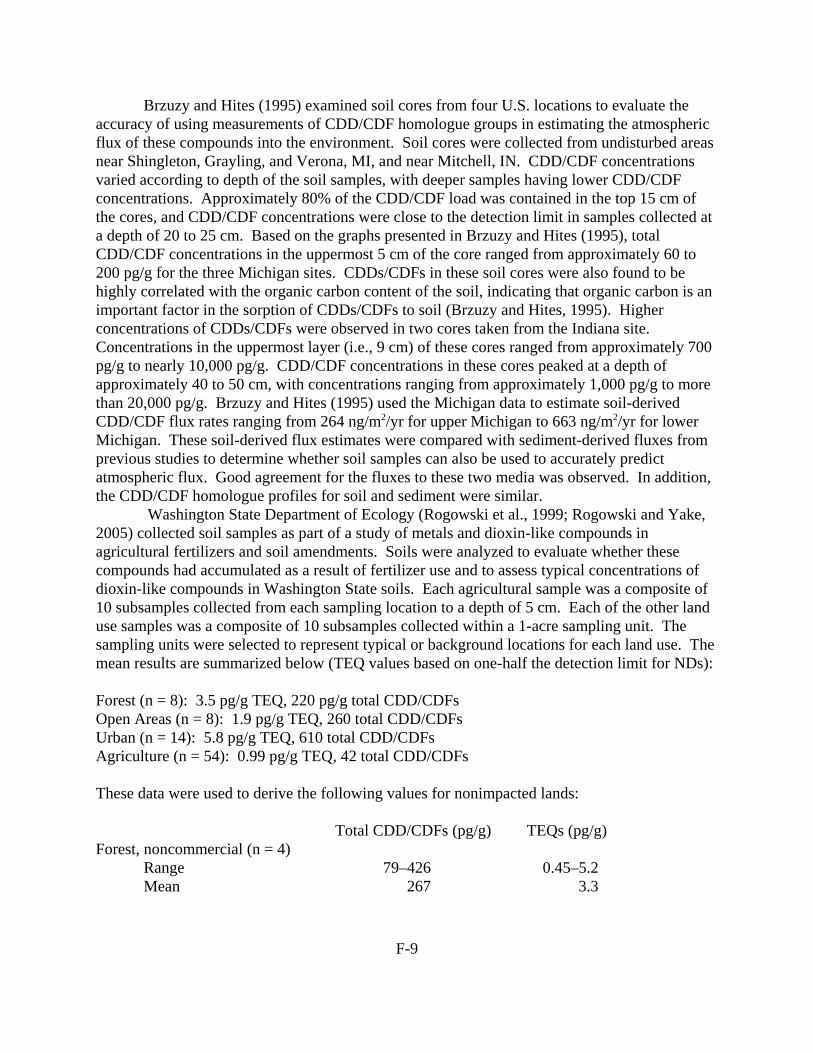
Brzuzy and Hites (1995) examined soil cores from four U.S. locations to evaluate the accuracy of using measurements of CDD/CDF homologue groups in estimating the atmospheric flux of these compounds into the environment. Soil cores were collected from undisturbed areas near Shingleton, Grayling, and Verona, MI, and near Mitchell, IN. CDD/CDF concentrations varied according to depth of the soil samples, with deeper samples having lower CDD/CDF concentrations. Approximately 80% of the CDD/CDF load was contained in the top 15 cm of the cores, and CDD/CDF concentrations were close to the detection limit in samples collected at a depth of 20 to 25 cm. Based on the graphs presented in Brzuzy and Hites (1995), total CDD/CDF concentrations in the uppermost 5 cm of the core ranged from approximately 60 to 200 pg/g for the three Michigan sites. CDDs/CDFs in these soil cores were also found to be highly correlated with the organic carbon content of the soil, indicating that organic carbon is an important factor in the sorption of CDDs/CDFs to soil (Brzuzy and Hites, 1995). Higher concentrations of CDDs/CDFs were observed in two cores taken from the Indiana site. Concentrations in the uppermost layer (i.e., 9 cm) of these cores ranged from approximately 700 pg/g to nearly 10,000 pg/g. CDD/CDF concentrations in these cores peaked at a depth of approximately 40 to 50 cm, with concentrations ranging from approximately 1,000 pg/g to more than 20,000 pg/g. Brzuzy and Hites (1995) used the Michigan data to estimate soil-derived CDD/CDF flux rates ranging from 264 ng/m2/yr for upper Michigan to 663 ng/m2/yr for lower Michigan. These soil-derived flux estimates were compared with sediment-derived fluxes from previous studies to determine whether soil samples can also be used to accurately predict atmospheric flux. Good agreement for the fluxes to these two media was observed. In addition, the CDD/CDF homologue profiles for soil and sediment were similar.
Washington State Department of Ecology (Rogowski et al., 1999; Rogowski and Yake, 2005) collected soil samples as part of a study of metals and dioxin-like compounds in agricultural fertilizers and soil amendments. Soils were analyzed to evaluate whether these compounds had accumulated as a result of fertilizer use and to assess typical concentrations of dioxin-like compounds in Washington State soils. Each agricultural sample was a composite of 10 subsamples collected from each sampling location to a depth of 5 cm. Each of the other land use samples was a composite of 10 subsamples collected within a 1-acre sampling unit. The sampling units were selected to represent typical or background locations for each land use. The mean results are summarized below (TEQ values based on one-half the detection limit for NDs):
Forest (n = 8): 3.5 pg/g TEQ, 220 pg/g total CDD/CDFs Open Areas (n = 8): 1.9 pg/g TEQ, 260 total CDD/CDFs Urban (n = 14): 5.8 pg/g TEQ, 610 total CDD/CDFs Agriculture (n = 54): 0.99 pg/g TEQ, 42 total CDD/CDFs
These data were used to derive the following values for nonimpacted lands:
Total CDD/CDFs (pg/g) TEQs (pg/g) Forest, noncommercial (n = 4)
Range 79–426 0.45–5.2 Mean 267 3.3
F-9

Open Area, nongrazed (n = 4) Range 9–258 0.046–2.4 Mean 94 0.71
EPA, Region 8, conducted a set of four related studies on dioxin-like compounds in surficial soils along the Denver, CO, Front Range. One of these studies (U.S. EPA, 2001) evaluated regional background soil; other sampling efforts included characterization of the Rocky Mountain arsenal using random samples at the site or from historic use sites. A large number of reference soils were collected and analyzed for CDDs/CDFs and dioxin-like PCBs. These data will be used to assess whether the soil concentrations observed in the Western Tier Parcel of the Rocky Mountain Arsenal, an EPA National Priority List site, are higher than regional background levels. EPA, Region 8, collected and analyzed 162 surface soil samples for investigation into background concentrations of dioxin-like compounds at multiple locations within 1,000 square miles of the Denver, CO, Front Range. The multiland-use areas that were sampled were situated on public lands and were categorized as agricultural (n = 27), commercial (n = 31), industrial (n = 29), open space (n = 36), and residential (i.e., within 200 ft of private land) (n = 39). The fine-soil fractions of samples obtained in the upper 2 in of the soil were analyzed for the 17 dioxins and furans and 12 PCBs (77, 81, 105, 114, 118, 123, 126, 156, 157, 167, 169, and 189). The mean TEQDFP-WHO98 ranged from less than 1 ppt TEQ to approximately 100 ppt TEQ (with two outliers of 142 and 155 ppt removed—one from a residential site and one from a commercial site). The mean TEQDFP-WHO98 values were 1.9 ppt for agricultural sites, 8.5 ppt for commercial sites, 15.4 ppt for industrial sites, 2.8 ppt for open space, and 8.6 ppt for residential locations, with a total mean of 7.5 ppt when NDs were set to one-half the detection limit. PCBs made up approximately 20% of the TEQDFP-WHO98. The TEQDF values for open space (n = 36) ranged from 0.1 to 9.1 with a mean of 1.6. The analytical values indicate that open space and agricultural lands had the lowest TEQDFP-WHO98 concentrations and industrial, commercial, and residential locations had slightly higher concentrations. It should be noted that because sieved samples were analyzed, these results may be higher than whether bulk samples had been analyzed. Further testing is being conducted to identify whether the increased total organic carbon content of agricultural and open space soils have a higher affinity for dioxin-like compounds than do other soil types, thereby skewing the analytical results to produce lower than actual values.
The state of Michigan conducted a soil sampling and assessment program in the Tittabawassee/Saginaw River flood plain to determine the source and extent of dioxin contamination (MDEQ, 2003). Elevated concentrations of dioxin were confirmed within the lower Tittabawassee River flood plain near the river’s confluence with the Saginaw River. The upstream area levels were found to be consistent with state background levels. These levels were derived from a compilation of statewide data on CDD/CDF TEQ levels in background soils. This dataset of 68 samples has a range of 0.4 to 35 pg/g TEQ and a mean of 6 pg/g TEQ.
Hilscherova et al. (2003) also studied dioxin levels in the Tittabawassee River flood plain and found similar results. The TEQ levels in the downstream flood plain soils were found to average about 800 pg/g TEQ (n = 7), compared with an average of 4.3 pg/g TEQ (n = 3) in upstream flood plains.
F-10
1.2. European Data Soil samples from rural and semi-urban sites in England, Wales, and lowland Scotland
showed a general increase in concentration from the TCDDs to OCDD, whereas CDF levels showed very little variation between the congener groups (Creaser et al., 1989). Concentrations of 2,3,7,8-TCDD at those sites ranged from <0.5 to 2.1 ppt. The median values for the TCDDs to OCDD were 6.0, 4.6, 31, 55, and 143 ppt, respectively. The median values for the TCDFs to OCDF were 16, 17, 32, 15, and 15 ppt. Evaluation of soil data from urban sites in the same geographical area showed that the mean levels for the CDD and CDF congeners were significantly greater (p<0.01) than those for rural and semi-urban background soils (Creaser et al., 1990). Concentrations of 2,3,7,8-TCDD at the urban sites ranged from <0.5 to 4.2 ppt. The median values for the TCDDs to OCDD were 40, 63, 141, 256, and 469 ppt, respectively. The median values for the TCDFs to OCDF were 140, 103, 103, 81, and 40 ppt. Significantly elevated levels of the lower congeners, together with higher overall CDD/CDF concentrations, indicate that local sources and short-range transport mechanisms are major contributors of CDDs and CDFs to urban soils. Cox and Creaser (1995) evaluated soils from urban and rural locations in the United Kingdom before the introduction of Integrated Pollution Control in 1991. I-TEQDFs for 11 rural locations ranged from 0.78 to 17.48 ppt with a mean of 5.17 ppt, and the I-TEQDFs for 5 urban samples ranged from 4.88 to 87.34 ppt with a mean of 28.37 ppt.
A soil sampling survey in Salzburg, Austria, also showed that the concentrations of CDDs/CDFs were higher in urban and industrial sites than in rural sites (Boos et al., 1992). The total CDD content of the soils ranged from 33.7 to 1236.7 ppt for urban sites, 92.2 to 455 ppt for industrial sites, and 7.1 to 183.6 ppt for rural sites. The total CDF content of the soils ranged from 45.6 to 260.8 ppt for urban sites, 53.0 to 355.3 ppt for industrial sites, and 12.0 to 77.7 ppt for rural sites. I-TEQDFs ranged from 0.1 to 3.1 ppt for rural sites, 1.0 to 8.3 ppt for urban sites, and 3.5 to 11.5 ppt for industrial sites when NDs were assumed to be zero. When NDs were set to one-half the detection limit, I-TEQDFs ranged from 1.3 to 3.8 ppt for rural sites, 2.0 to 8.6 ppt for urban sites, and 4.1 to 12.5 ppt for industrial sites. Rappe and Kjeller (1987) presented data on CDDs/CDFs in soil collected from rural (n = 3) and industrial (n = 2) sites in various parts of Europe. Concentrations were higher among industrial soils than in rural soils for all of the CDD/CDF homologue groups, and the hepta-chlorinated compounds made up the largest portion of the total CDD/CDF concentrations in both rural and industrial samples. HpCDDs ranged from ND to 17 ppt in rural samples and 370 to 1,600 ppt in industrial samples. HpCDFs ranged from 14 to 22 ppt in rural soils and 260 to 4,500 ppt in industrial soils.
Rotard et al. (1994) measured CDDs/CDFs in soil samples collected from forest, grassland, and plowland sites in western Germany. The highest mean concentrations of CDDs/CDFs were found in the subsoil and topsoil layers of deciduous (38.0 ng I-TEQDF/kg dry matter; n = 9) and coniferous forests (36.9 ng I-TEQDF/kg dry matter; n = 11). Grassland and plowland sites had mean concentrations of 2.3 ng I-TEQDF/kg dry matter (n = 7) and 1.7 ng ITEQDF/kg dry matter (n = 14), respectively.
Stenhouse and Badsha (1990) collected baseline data for soils around a site proposed for a chemical waste incinerator in Great Britain. All of the 2,3,7,8-substituted CDD/CDF congeners except PeCDD were detected in all samples. Concentrations were highest for the octa-
F-11
chlorinated CDDs/CDFs. Background I-TEQDF concentrations ranged from 3 to 20 ppt. The mean I-TEQDF concentration was 8 ppt (n = 12) with a standard deviation of 4 ppt.
Buckland et al. (1998) evaluated soils collected in New Zealand. Dry weight CDD/CDF concentrations ranged from 0.17 to 1.99 pg I-TEQDF/g for pristine soils, 0.17 to 0.90 pg I-TEQDF/g for agricultural soils, and 0.52 to 6.67 pg I-TEQDF/g for urban soils. The congeners below the detection limit were included in the total TEQ using one-half their detection limits.
2. PCBs Relatively little data could be found on total PCB levels in rural areas of the U.S. The
EPA Region 8 survey (U.S. EPA, 2001) measured the coplanar PCBs in background areas but did not measure total PCBs (see discussion above on TEQ levels).
Wilcke and Amelgung (2000) measured 14 PCBs at 18 grassland sites in the Great Plains of North America. Sites were located in Texas, Kansas, Colorado, Wyoming, Montana, North Dakota, Minnesota, and Saskatchewan (Canada). Samples were collected in the late spring of 1994. Composite samples at a depth of 0 to10 cm were collected at each site. Measured PCB congeners were numbers 1, 8, 20, 28, 35, 52, 101, 118, 138, 153, 180, 199, 206, and 209. The PCB congener sum was 3136 ng/g at one site and at the others ranged from 7.9 to 92.8 ng/g. No correlation was observed between the PCBs and soil organic matter.
Between 1994 and 1995, house dust and yard soil from 34 homes surrounding New Bedford Harbor, MA, were analyzed for PCB concentrations during the dredging of PCB-contaminated sediments (Vorhees et al., 1999). House dust samples were collected from the carpet, and yard soil was collected from the main entryway. The results indicated that concentrations in house dust samples were 10 times higher (260–23,000 ng/g) than yard soil concentrations (15–1,800 ng/g).
Hwang et al. (1999) conducted a PCB soil survey at the Mohawk Nation at Akwesasne, located along the St. Lawrence River in northern New York. Although this is a generally rural area, it is located within 10 miles of several large industrial sources with known PCB releases. All samples were collected in residential yards. Total PCBs averaged 48 ng/g (n = 106, SD = 119 ng/g).
In the Canadian Arctic, a string of 21 radar stations called The Distant Early Warning (DEW) Line stretches along 3,000 km and has been in operation since the 1950s. These radar stations have been associated with former PCB use and contamination (Bright et al. 1995a, b). Site samples from the 21 DEW Line facilities and three additional Arctic radar installations were collected from 1989 to 1992. PCBs were detected in undisturbed soils near the 21 DEW Line sites and as far as 5 km but were not detected in soil 20 km from site. Concentrations ranged from not detected (detection limit, 0.1–5.3 ng/g) to 45 ng/g in soil. These data indicate short-range redistribution of PCBs in a terrestrial environment.
Meijer et al. (2003) presented data from a survey of PCBs and hexachlorobenzene concentrations in 191 global background surface (0–5 cm) soils. Differences of up to four orders of magnitude were found between sites for PCBs. The lowest and highest PCB concentrations (26 and 97,000 pg/g dw) were found in samples from Greenland and mainland Europe (France, Germany, Poland), respectively. The mean total PCB level was 5,410 pg/g. Background soil
F-12

PCB concentrations were strongly influenced by proximity to source, region and soil organic matter content.
Masahide et al. (1998) examined soil samples collected at the depth of 0 to 10 cm from various sites located in Poland between 1990 and 1994. The mean dry weight total PCB concentration was 5.4 ng/g for agricultural soils (seven sites) and 15 ng/g for forest soils (four sites), 170 ng/g (n = 31) for urban soils, and 900 ng/g for the soils sampled at a military area. Dry weight PCB concentrations increased from 21 ng/g in Northern Poland to 48–380 ng/g in highly populated and industrialized regions in southern Poland.
Another rural soil survey was conducted in Poland in 2002 (Wyrzykowska et al., 2005). This study sampled soils in 13 agricultural areas and found a range of 0.054 to 0.42 pg TEQ/g and an average of 0.18 pg TEQ/g.
Buckland et al. (1998) evaluated soils collected in New Zealand. The PCB concentrations ranged from 0.067 to 2.3 pg TEQP/g (the TEFs used for PCBs were not identified) for provincial centers and 0.087 to 1.33 pg TEQP/g for metropolitan centers. The congeners below the detection limit were included in the total TEQ using one-half their detection limits.
3. Mercury Mercury occurs naturally as a mineral and is distributed throughout the environment by
both natural and anthropogenic processes. In a review of the mercury content of virgin and cultivated surface soils from a number of countries, it was found that the average concentrations ranged from 20 to 625 ng/g (ATSDR, 1999). Soil mercury levels are usually less than 200 ng/g in the top soil layer, but values exceeding this level are not uncommon, especially in areas affected by anthropogenic activities (U.S. EPA, 1997). NOAA (1999) reported that background mercury levels in natural soils of the U.S. ranged from ND to 4600 ng/g with a geometric mean of 58 ng/g.
The state of New Jersey formed a mercury task force in 1998 to review current science, inventory sources, estimate impacts, review policies, and recommend emission controls (NJDEP, 2001). This report states that mercury levels in rural New Jersey ranged from <10 to 260 ng/g with a median of <10 (n = 35). The report also provides “background” levels from other states in the range of 1 to 876 ng/g, but it is unclear how many of these are based on true rural areas.
Mercury was detected at soil concentrations ranging from 10 to 550 ng/g in orchard soils in New York State (Merwin et al., 1994) in a study primarily aimed at measuring lead and arsenic. Lead arsenate was used for pest control in fruit orchards for many years in the U.S., and its residues remain in most of these soils. Because arsenic and lead are toxic and only slightly mobile in soils, an analytical survey was conducted in 1993 to determine the concentrations of these elements persisting in soil samples from 13 older and newer orchards in New York State. Mercury levels were found to correlate with both arsenic and lead. Given the activities at these orchards, the mercury in these soils may be elevated over those of other rural areas.
Glass et al. (1990) measured mercury concentrations in precipitation, lake water and sediment, zooplankton, and fish and examined extensive watershed and lake chemistry data for 80 lake watersheds in northeastern Minnesota, including the Superior National Forest, Voyageurs National Park, and Boundary Waters Canoe Area Wilderness. They reported that mercury levels in soils from this region ranged from 12 to 220 ng/g. They also measured mercury in bedrock
F-13

(gabbros and granites) from this area, finding levels ranging from 5 to 16 ng/g. They also cite other studies indicating that soils away from mercury deposits had concentrations ranging from 20 to 150 ng/g and averaging 70 ng/g.
The state of Michigan has compiled a data set of metal levels in background (unimpacted) soils (MDEQ, 2005). This data set includes 431 samples that were analyzed for mercury. Eight-three percent of the samples were less than detection limits, the median was <100 ng/g, and the range encompassing 95% of the data points was <25 to 600 ng/g.
Tack et al. (2005) measured mercury levels in baseline soils in Belgium. The soils sampled included agricultural fields, forest, pasture, and fallow land. Sampling depth was 20 cm. The mean concentration was 240 ng/g (n = 316) and the range was 30 to 4,190 ng/g. They also reported background levels from a variety of countries, with levels ranging from 0.8 to 190 ng/g.
Washington State Department of Ecology (Rogowski et al., 1999; Rogowski and Yake, 2005) collected soil samples as part of a study of metals and dioxin-like compounds in agricultural fertilizers and soil amendments (see earlier discussion in Section 1.1). Mercury levels at background sites (n = 13) ranged from <3.2 to 66 ng/g with a mean of 11 ng/g.
F-14

REFERENCES
ATSDR (Agency for Toxic Substances and Disease Registry). (1999) Toxicological profile for mercury. U.S. Department of Health and Human Services, Public Health Service, Atlanta, GA.
BC Environment. (1995) Dioxins and furans in the British Columbia environment. Report prepared for the Environmental Protection Department, British Columbia Environment, Victoria, British Columbia.
Birmingham, B. (1990) Analysis of PCDD and PCDF patterns in soil samples: use in the estimation of the risk of exposure. Chemosphere 20(7–9):807–814.
Boos, R; Himsl, A; Wurst, F; et al. (1992) Determination of PCDDs and PCDFs in soil samples from Salzburg, Austria. Chemosphere 25(3):283–291.
Bright, DA; Dushenko, WT; Englander, S; et al. (1995) Threshold levels for PCDD/PCDF uptake in plants from soil in the Canadian Arctic. Organohalogen Compounds 24:469–473.
Bright, DA; Dushenko, WT; Grundy, SL; et al. (1995a) Effects of local and distant contaminant sources: polychlorinated biphenyls and other organochlorines in bottom-dwelling animals from an Arctic estuary. Sci Total Environ 160–161:265–283.
Bright, DA; Dushenko, WT; Grundy, SL; et al. (1995b) Evidence for short-range transport of polychlorinated biphenyls in the Canadian Arctic using congener signatures of PCBs in soils. Sci Total Environ 160–161:251–263.
Brzuzy, LP; Hites, RA. (1995) Estimating the atmospheric deposition of polychlorinated dibenzo-p-dioxins and dibenzofurans from soils. Environ Sci Technol 29:2090–2098.
Buckland, SJ; Ellis, HK; Salter, RT; et al. (1998) Ambient concentrations of PCDDs, PCDFs and PCBs in New Zealand soils. Organohalogen Compounds 39:101–104.
Cox, EA; Creaser, CS. (1995) Determination of polychlorinated biphenyls, polychlorinated dibenzo-p-dioxins, and polychlorinated dibenzofurans in UK soils, 2nd technical report. H.M. Inspectorate of Pollution, Environmental Agency for England and Wales.
Creaser, CS; Fernandes, AR; Al-Haddad, A; et al. (1989) Survey of background levels of PCDDs and PCDFs in UK soils. Chemosphere 18(1–6):767–776.
Creaser, CS; Fernandes, AR; Harrad, SJ; et al. (1990) Levels and sources of PCDDs and PCDFs in urban British soils. Chemosphere 21:931–938.
Fiedler, H; Lau, C; Cooper, K; et al. (1995) PCDD/PCDF in soil and pine needle samples in a rural area in the United States of America. Organohalogen Compounds 24:285–292.
Glass, GE; Sorensen, JA; Schmidt, KW; et al. (1990) New source identification of mercury contamination in the Great Lakes. Environ Sci Technol 24(7):1059–1069.
Grundy, SL; Bright, DA; Dushenko, WT; et al. (1995) Sources and signatures of PCDDs and PCDFs in soils from the Canadian North. Organohalogen Compounds 24:63–67.
Hilscherova, K; Kannan, K; Nakata, H; et al. (2003) Polychlorinated dibenzo-p-dioxin and dibenzofuran concentration profiles in sediments and flood-plain soils of the Tittabawassee River, Michigan. Environ Sci Technol 37(3):468–74.
F-15

Hwang, S; Fitzgerald, EF; Cayo, M; et al. (1999) Assessing environmental exposure to PCBs among Mohawks at Akwesasne through the use of geostatistical methods environmental research. Environmental Research, Section A 80:S189–S199.
Lorber, M; Pinsky, P; Gehring, P; et al. (1998) Relationships between dioxins in soil, air, ash, and emissions from a municipal solid waste incinerator emitting large amounts of dioxins. Chemosphere 37:2173–2197.
Masahide, K; Jerzy, F; Beata, B; et al. (1998) Persistent organochlorine pesticides in polychlorinated biphenyls in soils in Poland. Organohalogen Compounds 39:337–342.
MDEQ (Michigan Department of Environmental Quality). (2003) Final report: phase II Tittabawassee/Saginaw River dioxin flood plain sampling study. Available at: http://www.deq.state.mi.us/documents/ deq-rrd-TR-FINALPHASEIIREPORTSOIL6-24-2003.pdf.
MDEQ (Michigan Department of Environmental Quality). (2005) Michigan background soil survey 2005. Available at: http://www.deq.state.mi.us/documents/deq-whm-hw-Michigan-Background-Soil-revJuly2005.pdf.
Meijer, SN; Ockenden, WA; Sweetman, A; et al. (2003) Global distribution and budget of PCBs and HCB in background surface soils: implications for sources and environmental processes. Environ Sci Technol 37:667–672.
Merwin, I; Pruyne, PT; Ebel, JG; et al. (1994) Persistence, phytotoxicity, and management of arsenic, lead and mercury residues in old orchard soils or New York state. Chemosphere 29(6):1361–1367.
MRI. (1992) Multivariate statistical analyses of dioxin and furan levels in fish, sediment, and soil samples collected near resource recovery facilities, final report. Report produced for Connecticut Department of Environmental Protection, Water Compliance Unit, Hartford, CT.
NIH (National Institutes of Health). (1995) Expert panel: report on the impact and assessment of medical and pathological waste incineration on the Bethesda, Maryland, campus of the National Institutes of Health. Report produced for NIH by EEI, Alexandria, VA.
NJDEP (New Jersey Department of Environmental Protection). (2001) New Jersey Mercury Task Force. Vol. II. Exposure and impacts. Available at: http://www.state.nj.us/dep/dsr/mercury_task_force.htm.
NOAA (National Oceanographic and Atmospehric Aministration). (1999) Screening Quick Referecne Tables (SQirRT). Hazmat Reprot 99-1. Available at: http://response.restoration.noaa.gov/book_shelf/122_squirt_cards.pdf.
Pearson, RG; McLaughlin, DL; McIlveen, WD. (1990) Concentrations of PCDD and PCDF in Ontario soils from the vicinity of refuse and sewage sludge incinerators and remote rural and urban locations. Chemosphere 20:1543–1548.
Rappe, C; Kjeller, L. (1987) PCDDs and PCDFs in environmental samples: air, particulates, sediments and soil. Chemosphere 16:1775–1780.
Rappe, C; Andersson, R; Kulp, SE; et al. (1995) Concentrations of PCDDs and PCDFs in soil samples from Southern Mississippi, USA. Organohalogen Compounds 24:345–347.
Reed, LW; Hunt, GT; Maisel, BE; et al. (1990) Baseline assessment of PCDDs/PCDFs in the vicinity of the Elk River, Minnesota generating station. Chemosphere 21(1–2):159–171.
F-16

Rogowski, DL; Yake, W. (2005) Typical dioxin concentrations in agriculture soils of Washington state and potential sources. Environ Sci Technol 39(14):5170–5176.
Rogowski, D; Golding, S; Bowhay, D; et al. (1999) Screening survey for metals and dioxins in fertilizer products and soils in Washington State. Final Report. Prepared for the Washington State Department of Ecology. Ecology Publication No. 99-309. Available at: http://www.ecy.wa.gov/biblio/99309.html.
Rotard, W; Christmann, W; Knoth, W. (1994) Background levels of PCDD/F in soils of Germany. Chemosphere 29:2193–2200.
Stenhouse, IA; Badsha, KS. (1990) PCB, PCDD, and PCDF concentrations in soils from the Kirk Sandall/Edenthorpe/Barnby Dun area. Chemosphere 21:563–573.
Tack, FMG; Vanhaesebroeck, T; Verloo, MG; et al. (2005). Mercury baseline levels in Flemish soil (Belgium). Environmental Pollution 134:173–179.
U.S. EPA (Environmental Protection Agency). (1987) National dioxin study. Office of Solid Waste and Emergency Response, Washington, DC. EPA/530-SW-87-025.
U.S. EPA (Environmental Protection Agency). (1996) Columbus waste-to-energy municipal incinerator dioxin soil sampling project. Region 5, Chicago, IL.
U.S. EPA (Environmental Protection Agency). (1997) Mercury study report to congress. Vol. III. Fate and transport of mercury in the environment. EPA-425/R-097-005.
U.S. EPA (Environmental Protection Agency). (2000) Exposure and human health reassessment of 2,3,7,8tetrachlorodibenzo-p-dioxin (TCDD) and related compounds. Draft final report. Vol. III. Properties, environmental levels, and background exposures. EPA/600/P-00/001Bc. Available at: http://cfpub2.epa.gov/ncea/cfm/recordisplay.cfm?deid=55264.
U.S. EPA (Environmental Protection Agency). (2001) Denver front range study. Dioxin in surface soil: study 1: characterization of dioxins, furans and PCBs in soil samples collected from the Denver Front Range Area. Available at: http://www.epa.gov/region8/superfund/co/rkymtnarsenal/rmdioxrpt.html.
Vorhees, DJ; Cullen, AC; Altshul, LM. (1999) Polychlorinated biphenyls in house dust and yard soil near a Superfund site. Environ Sci Technol 33:2151–2156.
Wilcke, W; Amelgung, W. (2000) Persistent organic pollutants in native grassland soils along a climosequence in North America. Journal of the Soil Science Society of America 64:2140–2148.
Wyrzykowska, B; Hanari, N; Orlikowska, A; et al. (2005) Importance of dioxin-like PCBs and PCNs for TEQs of agricultural soils with low level of 2,3,7,8-TeCDDs and its analogues. Organohalogen Compounds 67:678–680.
F-17

APPENDIX G
PHYSICAL/CHEMICAL PARAMETER DATA
G-1

Moisture Grain Sizeb Distribution Total Organic Contentd
Site Sample ID Contenta
(%) % Finer #4 Sieve
% Finer #200 Sieve
% Finer 0.005mm
pHc Result
(mg/kg) Reporting Limit
(mg/kg)
EPA-1-1 24.6 81.7 38.5 14.7 3.7 50,500 1,000
Penn Nursery, PA
EPA-1-2 26.4 88.0 40.2 15.4 3.8 47,000 1,000
EPA-1-3 28.3 100.0 48.0 15.7 3.7 68,700 1,000
EPA-1-4 31.3 68.7 25.7 10.4 3.9 76,200 1,000
EPA-1-5 25.1 86.6 38.3 15.2 3.5 56,600 1,000
EPA-2-1 8.0 100.0 15.1 4.5 6.1 9,100 1,000
Clinton Crops, NC
EPA-2-2 9.5 100.0 14.1 4.1 5.2 9,100 1,000
EPA-2-3 17.1 100.0 21.2 7.3 5.4 12,000 1,000
EPA-2-4 11.7 100.0 14.4 4.7 5.2 9,700 1,000
EPA-2-5 8.6 100.0 11.8 3.2 4.3 5,400 1,000
EPA-4-1 154.0 100.0 68.3 25.2 7.1 120,000 1,000
EPA-4-2 85.7 100.0 63.1 22.7 7.7 87,000 1,000
Everglades, FL EPA-4-3 88.4 100.0 46.8 17.5 7.8 82,000 1,000
EPA-4-4 46.3 100.0 60.7 23.6 7.8 84,000 1,000
EPA-4-5 107.9 100.0 57.1 19.6 7.7 84,000 1,000
EPA-5-1 21.0 100.0 71.1 12.4 5.7 18,500 1,000
EPA-5-2 19.0 99.2 66.3 10.3 5.8 15,900 1,000
Lake Dubay, WI EPA-5-3 14.9 99.1 68.2 10.5 5.9 14,800 1,000
EPA-5-4 16.5 98.5 67.0 10.6 5.8 19,300 1,000
EPA-5-5 19.3 98.9 64.3 10.5 6.0 17,800 1,000
EPA-6-1 12.3 100.0 94.4 23.2 7.1 47,700 1,000
EPA-6-2 10.1 100.0 95.0 20.7 6.7 47,200 1,000
Monmouth, IL EPA-6-3 9.5 100.0 97.3 25.7 6.6 22,700 1,000
EPA-6-4 6.0 100.0 97.8 31.3 6.6 15,700 1,000
EPA-6-5 37.2 100.0 95.2 27.6 6.9 56,600 1,000
G-2

Moisture Grain Sizeb Distribution Total Organic Contentd
Site Sample ID Contenta
(%) % Finer #4 Sieve
% Finer #200 Sieve
% Finer 0.005mm
pHc Result
(mg/kg) Reporting Limit
(mg/kg)
EPA-7-1 23.5 100.0 94.7 36.2 6.1 49,900 1,000
McNay Farms, IA
EPA-7-2 28.0 100.0 92.3 35.7 5.9 50,000 1,000
EPA-7-3 26.1 100.0 95.3 50.5 6.4 50,700 1,000
EPA-7-4 26.3 100.0 94.1 40.1 6.3 38,700 1,000
EPA-7-5 18.8 100.0 69.4 35.2 6.8 37,400 1,000
EPA-8-1 22.3 100.0 77.6 16.0 7.4 19,300 1,000
EPA-8-2 18.5 100.0 72.9 13.8 7.5 22,800 1,000
Lake Scott, KS EPA-8-3 29.9 100.0 76.5 16.9 7.3 21,100 1,000
EPA-8-4 35.2 100.0 68.9 16.0 7.3 19,300 1,000
EPA-8-5 39.2 100.0 75.3 19.2 6.8 18,900 1,000
EPA-9-1 22.9 99.8 70.4 16.7 7.4 14,200 1,000
Keystone State Park, OK
EPA-9-2 19.2 100.0 66.5 14.8 6.5 12,800 1,000
EPA-9-3 7.2 99.0 66.9 12.8 7.2 11,700 1,000
EPA-9-4 4.8 94.8 42.2 10.5 7.8 43,500 1,000
EPA-9-5 10.3 96.5 55.9 12.4 7.7 27,700 1,000
EPA-10-1 9.2 100.0 58.4 15.4 6.2 15,900 1,000
EPA-10-2 13.6 100.0 66.4 15.2 5.7 18,700 1,000
Arkadelphia, AR EPA-10-3 9.3 99.4 39.7 12.6 5.6 15,500 1,000
EPA-10-4 7.1 99.8 55.4 16.4 5.7 15,200 1,000
EPA-10-5 13.4 100.0 67.4 19.7 5.0 24,900 1,000
EPA-11-1 30.7 99.7 63.3 9.8 5.8 33,700 1,000
EPA-11-2 29.5 98.5 58.5 8.2 5.8 28,300 1,000
Bennington, VT EPA-11-3 23.6 99.6 66.0 9.5 5.6 39,200 1,000
EPA-11-4 27.4 100.0 53.2 3.5 5.0 32,600 1,000
EPA-11-5 11.1 92.1 23.2 5.2 7.5 35,500 1,000
EPA-12-1 40.3 94.3 74.9 23.3 4.5 49,300 1,000
EPA-12-2 38.5 100.0 82.2 26.7 4.6 54,700 1,000
Jasper, NY EPA-12-3 42.5 100.0 83.1 22.8 4.5 51,500 1,000
EPA-12-4 41.7 99.0 82.1 24.9 4.5 51,300 1,000
EPA-12-5 42.2 100.0 82.0 27.9 4.3 55,700 1,000
Caldwell, OH EPA-14-1 18.6 100.0 87.6 38.5 4.5 44,700 1,000
EPA-14-2 28.6 100.0 90.2 56.1 4.3 69,800 1,000
G-3
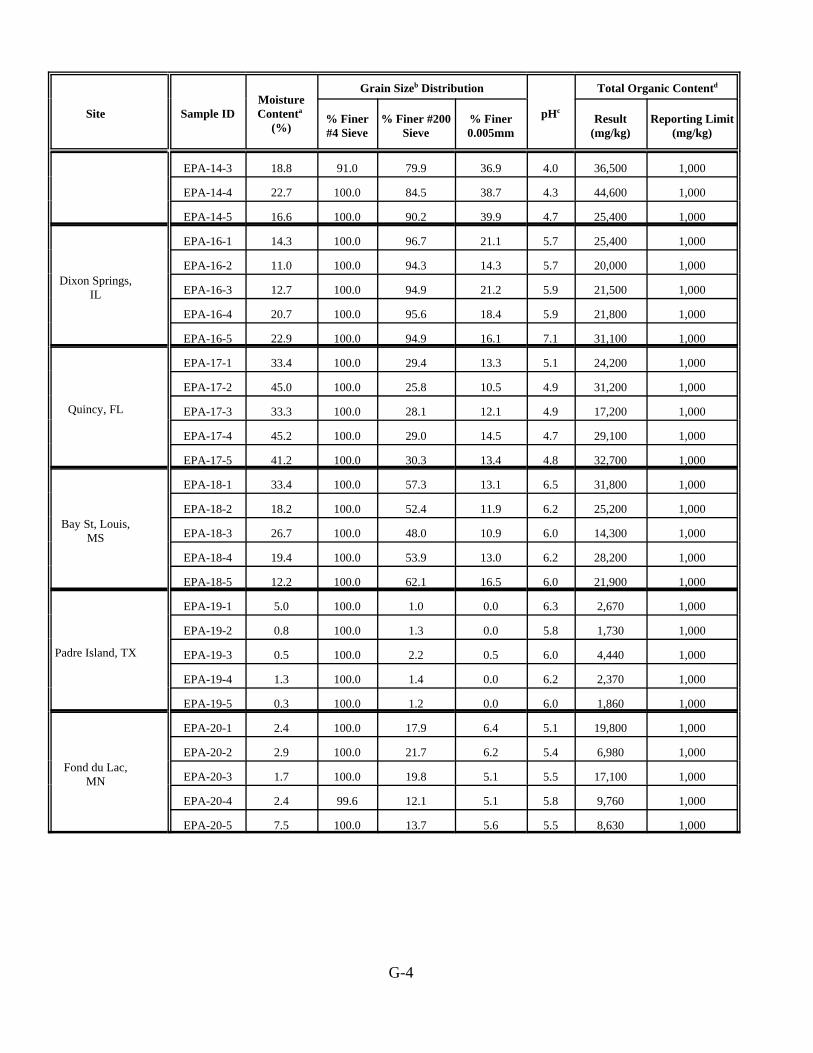
Moisture Grain Sizeb Distribution Total Organic Contentd
Site Sample ID Contenta
(%) % Finer #4 Sieve
% Finer #200 Sieve
% Finer 0.005mm
pHc Result
(mg/kg) Reporting Limit
(mg/kg)
EPA-14-3 18.8 91.0 79.9 36.9 4.0 36,500 1,000
EPA-14-4 22.7 100.0 84.5 38.7 4.3 44,600 1,000
EPA-14-5 16.6 100.0 90.2 39.9 4.7 25,400 1,000
EPA-16-1 14.3 100.0 96.7 21.1 5.7 25,400 1,000
Dixon Springs, IL
EPA-16-2 11.0 100.0 94.3 14.3 5.7 20,000 1,000
EPA-16-3 12.7 100.0 94.9 21.2 5.9 21,500 1,000
EPA-16-4 20.7 100.0 95.6 18.4 5.9 21,800 1,000
EPA-16-5 22.9 100.0 94.9 16.1 7.1 31,100 1,000
EPA-17-1 33.4 100.0 29.4 13.3 5.1 24,200 1,000
EPA-17-2 45.0 100.0 25.8 10.5 4.9 31,200 1,000
Quincy, FL EPA-17-3 33.3 100.0 28.1 12.1 4.9 17,200 1,000
EPA-17-4 45.2 100.0 29.0 14.5 4.7 29,100 1,000
EPA-17-5 41.2 100.0 30.3 13.4 4.8 32,700 1,000
EPA-18-1 33.4 100.0 57.3 13.1 6.5 31,800 1,000
Bay St, Louis, MS
EPA-18-2 18.2 100.0 52.4 11.9 6.2 25,200 1,000
EPA-18-3 26.7 100.0 48.0 10.9 6.0 14,300 1,000
EPA-18-4 19.4 100.0 53.9 13.0 6.2 28,200 1,000
EPA-18-5 12.2 100.0 62.1 16.5 6.0 21,900 1,000
EPA-19-1 5.0 100.0 1.0 0.0 6.3 2,670 1,000
EPA-19-2 0.8 100.0 1.3 0.0 5.8 1,730 1,000
Padre Island, TX EPA-19-3 0.5 100.0 2.2 0.5 6.0 4,440 1,000
EPA-19-4 1.3 100.0 1.4 0.0 6.2 2,370 1,000
EPA-19-5 0.3 100.0 1.2 0.0 6.0 1,860 1,000
EPA-20-1 2.4 100.0 17.9 6.4 5.1 19,800 1,000
Fond du Lac, MN
EPA-20-2 2.9 100.0 21.7 6.2 5.4 6,980 1,000
EPA-20-3 1.7 100.0 19.8 5.1 5.5 17,100 1,000
EPA-20-4 2.4 99.6 12.1 5.1 5.8 9,760 1,000
EPA-20-5 7.5 100.0 13.7 5.6 5.5 8,630 1,000
G-4
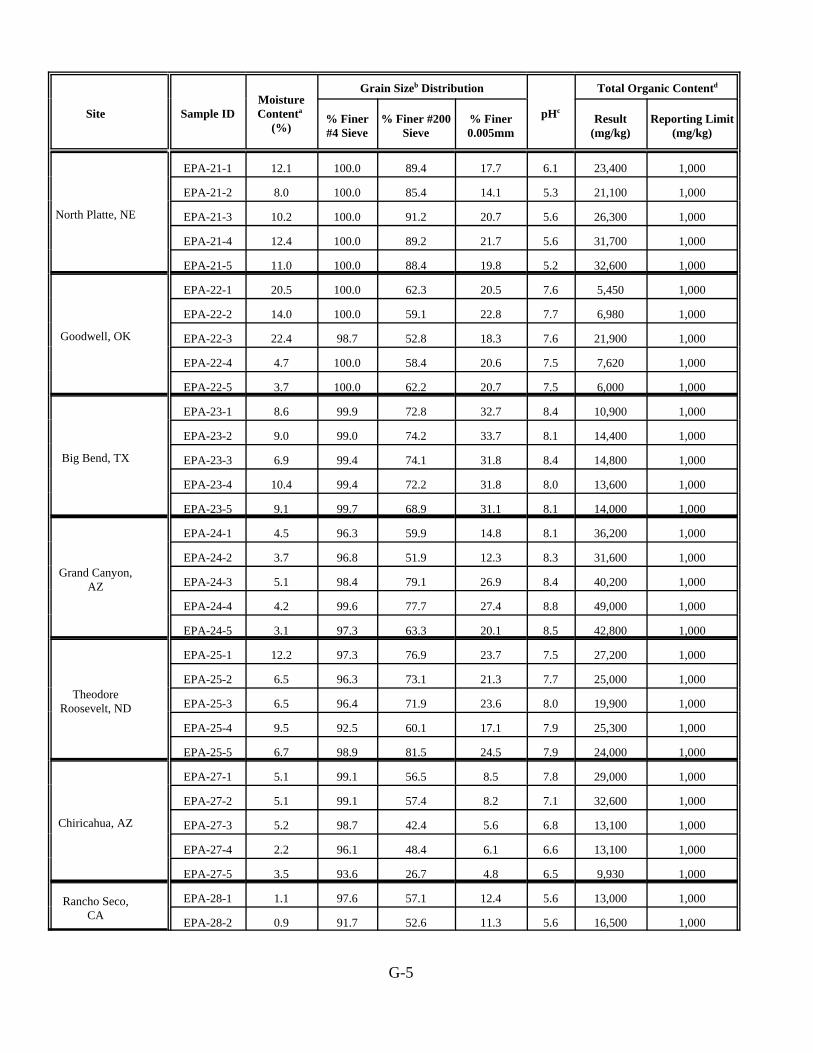
Moisture Grain Sizeb Distribution Total Organic Contentd
Site Sample ID Contenta
(%) % Finer #4 Sieve
% Finer #200 Sieve
% Finer 0.005mm
pHc Result
(mg/kg) Reporting Limit
(mg/kg)
EPA-21-1 12.1 100.0 89.4 17.7 6.1 23,400 1,000
EPA-21-2 8.0 100.0 85.4 14.1 5.3 21,100 1,000
North Platte, NE EPA-21-3 10.2 100.0 91.2 20.7 5.6 26,300 1,000
EPA-21-4 12.4 100.0 89.2 21.7 5.6 31,700 1,000
EPA-21-5 11.0 100.0 88.4 19.8 5.2 32,600 1,000
EPA-22-1 20.5 100.0 62.3 20.5 7.6 5,450 1,000
EPA-22-2 14.0 100.0 59.1 22.8 7.7 6,980 1,000
Goodwell, OK EPA-22-3 22.4 98.7 52.8 18.3 7.6 21,900 1,000
EPA-22-4 4.7 100.0 58.4 20.6 7.5 7,620 1,000
EPA-22-5 3.7 100.0 62.2 20.7 7.5 6,000 1,000
EPA-23-1 8.6 99.9 72.8 32.7 8.4 10,900 1,000
EPA-23-2 9.0 99.0 74.2 33.7 8.1 14,400 1,000
Big Bend, TX EPA-23-3 6.9 99.4 74.1 31.8 8.4 14,800 1,000
EPA-23-4 10.4 99.4 72.2 31.8 8.0 13,600 1,000
EPA-23-5 9.1 99.7 68.9 31.1 8.1 14,000 1,000
EPA-24-1 4.5 96.3 59.9 14.8 8.1 36,200 1,000
Grand Canyon, AZ
EPA-24-2 3.7 96.8 51.9 12.3 8.3 31,600 1,000
EPA-24-3 5.1 98.4 79.1 26.9 8.4 40,200 1,000
EPA-24-4 4.2 99.6 77.7 27.4 8.8 49,000 1,000
EPA-24-5 3.1 97.3 63.3 20.1 8.5 42,800 1,000
EPA-25-1 12.2 97.3 76.9 23.7 7.5 27,200 1,000
Theodore Roosevelt, ND
EPA-25-2 6.5 96.3 73.1 21.3 7.7 25,000 1,000
EPA-25-3 6.5 96.4 71.9 23.6 8.0 19,900 1,000
EPA-25-4 9.5 92.5 60.1 17.1 7.9 25,300 1,000
EPA-25-5 6.7 98.9 81.5 24.5 7.9 24,000 1,000
EPA-27-1 5.1 99.1 56.5 8.5 7.8 29,000 1,000
EPA-27-2 5.1 99.1 57.4 8.2 7.1 32,600 1,000
Chiricahua, AZ EPA-27-3 5.2 98.7 42.4 5.6 6.8 13,100 1,000
EPA-27-4 2.2 96.1 48.4 6.1 6.6 13,100 1,000
EPA-27-5 3.5 93.6 26.7 4.8 6.5 9,930 1,000
Rancho Seco, EPA-28-1 1.1 97.6 57.1 12.4 5.6 13,000 1,000 CA EPA-28-2 0.9 91.7 52.6 11.3 5.6 16,500 1,000
G-5

Moisture Grain Sizeb Distribution Total Organic Contentd
Site Sample ID Contenta
(%) % Finer #4 Sieve
% Finer #200 Sieve
% Finer 0.005mm
pHc Result
(mg/kg) Reporting Limit
(mg/kg)
EPA-28-3 0.8 90.2 44.0 8.4 5.7 12,400 1,000
EPA-28-4 1.5 96.8 60.6 16.7 5.6 15,900 1,000
EPA-28-5 0.8 91.5 52.0 11.6 5.6 14,100 1,000
EPA-29-1 12.1 98.6 58.3 15.3 5.3 129,000 1,000
Marvel Ranch, OR
EPA-29-2 10.3 94.6 49.3 18.8 5.6 85,300 1,000
EPA-29-3 13.1 99.4 60.9 17.1 5.2 132,000 1,000
EPA-29-4 6.6 100.0 79.1 28.4 4.8 76,200 1,000
EPA-29-5 5.0 97.3 75.1 38.2 4.6 26,900 1,000
EPA-30-1 50.7 100.0 89.3 35.3 3.8 90,200 1,000
Ozette Lake, WA
EPA-30-2 51.1 100.0 89.2 36.2 3.9 89,900 1,000
EPA-30-3 74.7 100.0 82.9 37.5 3.8 113,000 1,000
EPA-30-4 10.2 89.5 22.3 10.5 4.7 50,400 1,000
EPA-30-5 44.6 100.0 91.9 46.0 4.9 99,200 1,000
EPA-34-1 75.5 100.0 85.5 18.1 4.7 66,200 1,000
Trapper Creek, AK
EPA-34-2 67.1 100.0 84.3 15.6 4.8 37,900 1,000
EPA-34-3 83.3 100.0 82.5 17.2 4.4 100,000 1,000
EPA-34-4 85.6 100.0 82.6 19.1 4.7 78,400 1,000
EPA-34-5 81.8 100.0 74.3 16.6 5.0 81,300 1,000
aBased on ASTM 2216, which yields the ratio of water mass in sample to mass of dry solids in sample.bBased on ASTM D422.cBased on EPA Method SW 9045C.dBased on Walkey-Black Method.
G-6

APPENDIX H
PCDD/PCDF DATA
H-1

Pilot Survey of Levels of PCDDs, PCDFs, PCBs and Mercury in Rural Soils of the U.S.
WA 5-11 Batch 1 BATTELLE SDG 49971-13 MOD 1613M
NOTES QC CLIENT_ ID PROCEDURAL BLANK Penn Nursery, PA McNay Farm, IA McNay Farm, IA Lake Scott, KS Lake Scott, KS LAB_SAMP_ ID METHOD BLANK EPA 1 COMP EPA 7 COMP EPA 7 DUP EPA 8 COMP EPA 8 DUP SAMPLE_WGT_VOL 17.1554 15.6769 16.0618 16.4463 15.5239 15.8020 SAMP_WGT_VOL_UNIT G DRYWT G DRYWT G DRYWT G DRYWT G DRYWT G DRYWT PCT_DRY_WT 78.27 81.32 81.32 78.17 78.17 COLLECTION_DATE 8/17/2003 9/2/2003 9/2/2003 8/19/2003 8/19/2003 RECEIPT_DATE 8/19/2003 9/4/2003 9/4/2003 8/23/2003 8/23/2003 COMPOSITE_DATE 9/10/2003 9/10/2003 9/10/2003 9/4/2003 9/4/2003 EXTRACT_DATE 9/15/2003 9/15/2003 9/15/2003 9/15/2003 9/15/2003 9/15/2003 ANALYSIS_DATE 10/13/2003 10/13/2003 10/13/2003 10/14/2003 10/13/2003 10/14/2003 DIOXIN_ EXTRACT_ LRB_ NUMBER 49971-13-20 49971-13-02 49971-13-03 49971-13-14 49971-13-04 49971-13-15 REPORTING UNIT PG/G DRYWT PG/G DRYWT PG/G DRYWT PG/G DRYWT PG/G DRYWT PG/G DRYWT
PARAM_NAME RESULT LAB_QUAL RL RESULT LAB_QUAL RL RESULT LAB_QUAL RL RESULT LAB_QUAL RL RESULT LAB_QUAL RL RESULT LAB_QUAL RL 2378-TCDD U 0.04 0.07 0.04 0.10 0.04 0.07 0.04 U 0.04 U 0.04 12378-PECDD U 0.18 0.30 0.20 0.48 0.19 0.48 0.19 U 0.20 U 0.20 123478-HXCDD 0.06 J 0.18 0.63 0.20 0.79 0.19 0.87 0.19 U 0.20 0.04 J 0.20 123678-HXCDD 0.08 J 0.18 0.93 0.20 1.47 0.19 1.55 0.19 0.05 J 0.20 0.06 J 0.20 123789-HXCDD 0.09 J 0.18 1.55 0.20 3.11 0.19 2.78 0.19 0.11 J 0.20 0.06 J 0.20 1234678-HPCDD 0.17 J 0.18 53.77 0.20 54.36 0.19 57.36 0.19 1.26 0.20 1.16 0.20 OCDD 0.72 0.36 6468.45 0.40 1516.18 0.39 1619.09 0.38 25.35 0.40 11.98 0.40 2378-TCDF U 0.04 0.30 # 0.04 0.11 0.04 0.12 0.04 0.04 0.04 0.03 J 0.04 12378-PECDF U 0.18 0.30 0.20 0.05 J 0.19 0.06 J 0.19 0.02 J 0.20 U 0.20 23478-PECDF U 0.18 0.43 0.20 0.09 J 0.19 0.10 J 0.19 0.04 J 0.20 0.03 J 0.20 123478-HXCDF 0.07 J 0.18 0.90 0.20 0.40 0.19 0.36 0.19 0.09 J 0.20 0.09 J 0.20 123678-HXCDF 0.05 J 0.18 0.48 0.20 0.24 0.19 0.25 0.19 0.04 J 0.20 0.05 J 0.20 123789-HXCDF 0.08 J 0.18 0.27 0.20 0.02 J 0.19 0.01 J 0.19 0.02 J 0.20 U 0.20 234678-HXCDF 0.08 J 0.18 0.56 0.20 0.24 0.19 0.26 0.19 0.05 J 0.20 U 0.20 1234678-HPCDF 0.11 J 0.18 4.28 0.20 6.44 0.19 5.98 0.19 0.39 0.20 0.33 0.20 1234789-HPCDF 0.12 J 0.18 0.49 0.20 0.38 0.19 0.40 0.19 U 0.20 0.03 J 0.20 OCDF 0.44 0.36 8.70 0.40 18.82 0.39 21.39 0.38 0.58 0.40 0.52 0.40
Total Tetra-Furans U 0.04 1.44 0.04 0.57 0.04 0.32 0.04 0.08 0.04 0.08 0.04 Total Tetra-Dioxins U 0.04 0.23 0.04 0.87 0.04 0.75 0.04 U 0.04 U 0.04 Total Penta-Furans U 0.18 4.66 0.20 1.65 0.19 1.71 0.19 0.40 0.20 0.31 0.20 Total Penta-Dioxins U 0.18 1.77 0.20 2.86 0.19 3.33 0.19 U 0.20 U 0.20 Total Hexa-Furans 0.28 0.18 5.88 0.20 5.97 0.19 6.08 0.19 0.58 0.20 0.52 0.20 Total Hexa-Dioxins 0.22 0.18 12.52 0.20 17.88 0.19 17.86 0.19 0.64 0.20 0.56 0.20 Total Hepta-Furans 0.24 0.18 7.89 0.20 17.60 0.19 19.18 0.19 0.70 0.20 0.70 0.20 Total Hepta-Dioxins 0.17 J 0.18 119.30 0.20 104.81 0.19 109.19 0.19 2.63 0.20 2.50 0.20
J = reported value < Reporting Limit (RL) U = not detected RL = (0.25 * low cal std* final extract volume)/ sample dry weight # = value from confirmation analysis.
H-2

Pilot Survey of Levels of PCDDs, PCDFs, PCBs and Mercury in Rural Soils of the U.S.
WA 5-11 Batch 1 BATTELLE SDG 49971-13 MOD 1613M
NOTES CLIENT_ ID Bennington, VT Caldwell, OH Dixon Springs, IL Quincy, FL Bay St. Louis, MS LAB_SAMP_ ID EPA 11 COMP EPA 14 COMP EPA 16 COMP EPA 17 COMP EPA 18 COMP SAMPLE_WGT_VOL 15.9883 17.0640 17.6250 14.5225 16.6717 SAMP_WGT_VOL_UNIT G DRYWT G DRYWT G DRYWT G DRYWT G DRYWT PCT_DRY_WT 79.62 83.86 86.84 72.84 83.08 COLLECTION_DATE 8/28/2003 8/21/2003 8/16/2003 8/17/2003 8/19/2003 RECEIPT_DATE 8/29/2003 8/22/2003 8/18/2003 8/19/2003 8/21/2003 COMPOSITE_DATE 9/4/2003 9/4/2003 9/4/2003 9/10/2003 9/4/2003 EXTRACT_DATE 9/15/2003 9/15/2003 9/15/2003 9/15/2003 9/15/2003 ANALYSIS_DATE 10/13/2003 10/13/2003 10/13/2003 10/13/2003 10/14/2003 DIOXIN_ EXTRACT_ LRB_ NUMBER 49971-13-05 49971-13-06 49971-13-07 49971-13-08 49971-13-09 REPORTING UNIT PG/G DRYWT PG/G DRYWT PG/G DRYWT PG/G DRYWT PG/G DRYWT
PARAM_NAME RESULT LAB_QUAL RL RESULT LAB_QUAL RL RESULT LAB_QUAL RL RESULT LAB_QUAL RL RESULT LAB_QUAL RL 2378-TCDD U 0.04 U 0.04 0.27 0.04 U 0.04 0.10 0.04 12378-PECDD 0.18 J 0.20 0.11 J 0.18 0.86 0.18 U 0.22 0.40 0.19 123478-HXCDD 0.31 0.20 0.21 0.18 2.12 0.18 0.08 J 0.22 0.55 0.19 123678-HXCDD 0.62 0.20 0.41 0.18 4.99 0.18 0.25 0.22 1.95 0.19 123789-HXCDD 0.90 0.20 0.69 0.18 5.09 0.18 0.18 J 0.22 2.65 0.19 1234678-HPCDD 15.67 0.20 21.47 0.18 213.85 0.18 8.15 0.22 64.87 0.19 OCDD 140.32 0.39 2251.74 0.37 9115.58 0.35 351.98 0.43 1530.37 0.37 2378-TCDF 0.25 # 0.04 0.07 0.04 0.18 0.04 U 0.04 0.14 0.04 12378-PECDF 0.26 0.20 0.06 J 0.18 0.14 J 0.18 U 0.22 0.09 J 0.19 23478-PECDF 0.34 0.20 0.07 J 0.18 0.17 J 0.18 U 0.22 0.11 J 0.19 123478-HXCDF 0.81 0.20 0.26 0.18 1.05 0.18 0.12 J 0.22 0.42 0.19 123678-HXCDF 0.36 0.20 0.14 J 0.18 0.72 0.18 0.05 J 0.22 0.24 0.19 123789-HXCDF 0.04 J 0.20 0.01 J 0.18 0.04 J 0.18 0.07 J 0.22 0.04 J 0.19 234678-HXCDF 0.47 0.20 0.14 J 0.18 0.72 0.18 0.09 J 0.22 0.25 0.19 1234678-HPCDF 4.48 0.20 3.07 0.18 35.50 0.18 1.68 0.22 7.52 0.19 1234789-HPCDF 0.25 0.20 0.14 J 0.18 1.43 0.18 0.15 J 0.22 0.34 0.19 OCDF 7.85 0.39 6.15 0.37 108.01 0.35 5.12 0.43 18.67 0.37
Total Tetra-Furans 1.21 0.04 0.17 0.04 0.51 0.04 0.02 J 0.04 0.64 0.04 Total Tetra-Dioxins 0.05 0.04 0.05 0.04 0.31 0.04 U 0.04 0.20 0.04 Total Penta-Furans 4.44 0.20 1.03 0.18 3.76 0.18 0.15 J 0.22 1.66 0.19 Total Penta-Dioxins 1.04 0.20 0.67 0.18 4.30 0.18 U 0.22 2.00 0.19 Total Hexa-Furans 5.43 0.20 2.58 0.18 26.70 0.18 1.07 0.22 7.85 0.19 Total Hexa-Dioxins 6.08 0.20 5.39 0.18 41.89 0.18 1.68 0.22 17.75 0.19 Total Hepta-Furans 8.61 0.20 5.83 0.18 100.09 0.18 3.97 0.22 22.38 0.19 Total Hepta-Dioxins 30.37 0.20 48.76 0.18 412.30 0.18 15.50 0.22 136.07 0.19
J = reported value < Reporting Limit (RL U = not detected RL = (0.25 * low cal std* final extract volu # = value from confirmation analysis.
H-3
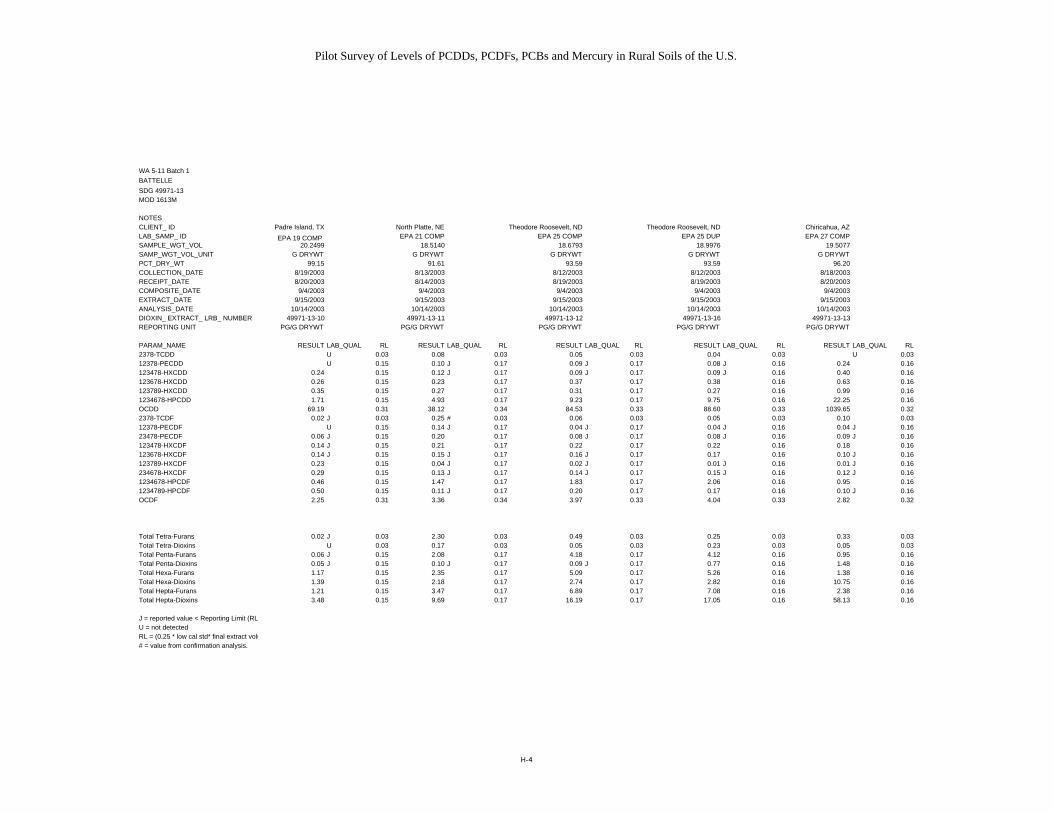
Pilot Survey of Levels of PCDDs, PCDFs, PCBs and Mercury in Rural Soils of the U.S.
WA 5-11 Batch 1 BATTELLE SDG 49971-13 MOD 1613M
NOTES CLIENT_ ID Padre Island, TX North Platte, NE Theodore Roosevelt, ND Theodore Roosevelt, ND Chiricahua, AZLAB_SAMP_ ID EPA 19 COMP EPA 21 COMP EPA 25 COMP EPA 25 DUP EPA 27 COMP SAMPLE_WGT_VOL 20.2499 18.5140 18.6793 18.9976 19.5077 SAMP_WGT_VOL_UNIT G DRYWT G DRYWT G DRYWT G DRYWT G DRYWT PCT_DRY_WT 99.15 91.61 93.59 93.59 96.20 COLLECTION_DATE 8/19/2003 8/13/2003 8/12/2003 8/12/2003 8/18/2003 RECEIPT_DATE 8/20/2003 8/14/2003 8/19/2003 8/19/2003 8/20/2003 COMPOSITE_DATE 9/4/2003 9/4/2003 9/4/2003 9/4/2003 9/4/2003 EXTRACT_DATE 9/15/2003 9/15/2003 9/15/2003 9/15/2003 9/15/2003 ANALYSIS_DATE 10/14/2003 10/14/2003 10/14/2003 10/14/2003 10/14/2003 DIOXIN_ EXTRACT_ LRB_ NUMBER 49971-13-10 49971-13-11 49971-13-12 49971-13-16 49971-13-13 REPORTING UNIT PG/G DRYWT PG/G DRYWT PG/G DRYWT PG/G DRYWT PG/G DRYWT
PARAM_NAME RESULT LAB_QUAL RL RESULT LAB_QUAL RL RESULT LAB_QUAL RL RESULT LAB_QUAL RL RESULT LAB_QUAL RL 2378-TCDD U 0.03 0.08 0.03 0.05 0.03 0.04 0.03 U 0.03 12378-PECDD U 0.15 0.10 J 0.17 0.09 J 0.17 0.08 J 0.16 0.24 0.16 123478-HXCDD 0.24 0.15 0.12 J 0.17 0.09 J 0.17 0.09 J 0.16 0.40 0.16 123678-HXCDD 0.26 0.15 0.23 0.17 0.37 0.17 0.38 0.16 0.63 0.16 123789-HXCDD 0.35 0.15 0.27 0.17 0.31 0.17 0.27 0.16 0.99 0.16 1234678-HPCDD 1.71 0.15 4.93 0.17 9.23 0.17 9.75 0.16 22.25 0.16 OCDD 69.19 0.31 38.12 0.34 84.53 0.33 88.60 0.33 1039.65 0.32 2378-TCDF 0.02 J 0.03 0.25 # 0.03 0.06 0.03 0.05 0.03 0.10 0.03 12378-PECDF U 0.15 0.14 J 0.17 0.04 J 0.17 0.04 J 0.16 0.04 J 0.16 23478-PECDF 0.06 J 0.15 0.20 0.17 0.08 J 0.17 0.08 J 0.16 0.09 J 0.16 123478-HXCDF 0.14 J 0.15 0.21 0.17 0.22 0.17 0.22 0.16 0.18 0.16 123678-HXCDF 0.14 J 0.15 0.15 J 0.17 0.16 J 0.17 0.17 0.16 0.10 J 0.16 123789-HXCDF 0.23 0.15 0.04 J 0.17 0.02 J 0.17 0.01 J 0.16 0.01 J 0.16 234678-HXCDF 0.29 0.15 0.13 J 0.17 0.14 J 0.17 0.15 J 0.16 0.12 J 0.16 1234678-HPCDF 0.46 0.15 1.47 0.17 1.83 0.17 2.06 0.16 0.95 0.16 1234789-HPCDF 0.50 0.15 0.11 J 0.17 0.20 0.17 0.17 0.16 0.10 J 0.16 OCDF 2.25 0.31 3.36 0.34 3.97 0.33 4.04 0.33 2.82 0.32
Total Tetra-Furans 0.02 J 0.03 2.30 0.03 0.49 0.03 0.25 0.03 0.33 0.03 Total Tetra-Dioxins U 0.03 0.17 0.03 0.05 0.03 0.23 0.03 0.05 0.03 Total Penta-Furans 0.06 J 0.15 2.08 0.17 4.18 0.17 4.12 0.16 0.95 0.16 Total Penta-Dioxins 0.05 J 0.15 0.10 J 0.17 0.09 J 0.17 0.77 0.16 1.48 0.16 Total Hexa-Furans 1.17 0.15 2.35 0.17 5.09 0.17 5.26 0.16 1.38 0.16 Total Hexa-Dioxins 1.39 0.15 2.18 0.17 2.74 0.17 2.82 0.16 10.75 0.16 Total Hepta-Furans 1.21 0.15 3.47 0.17 6.89 0.17 7.08 0.16 2.38 0.16 Total Hepta-Dioxins 3.48 0.15 9.69 0.17 16.19 0.17 17.05 0.16 58.13 0.16
J = reported value < Reporting Limit (RL U = not detected RL = (0.25 * low cal std* final extract volu # = value from confirmation analysis.
H-4
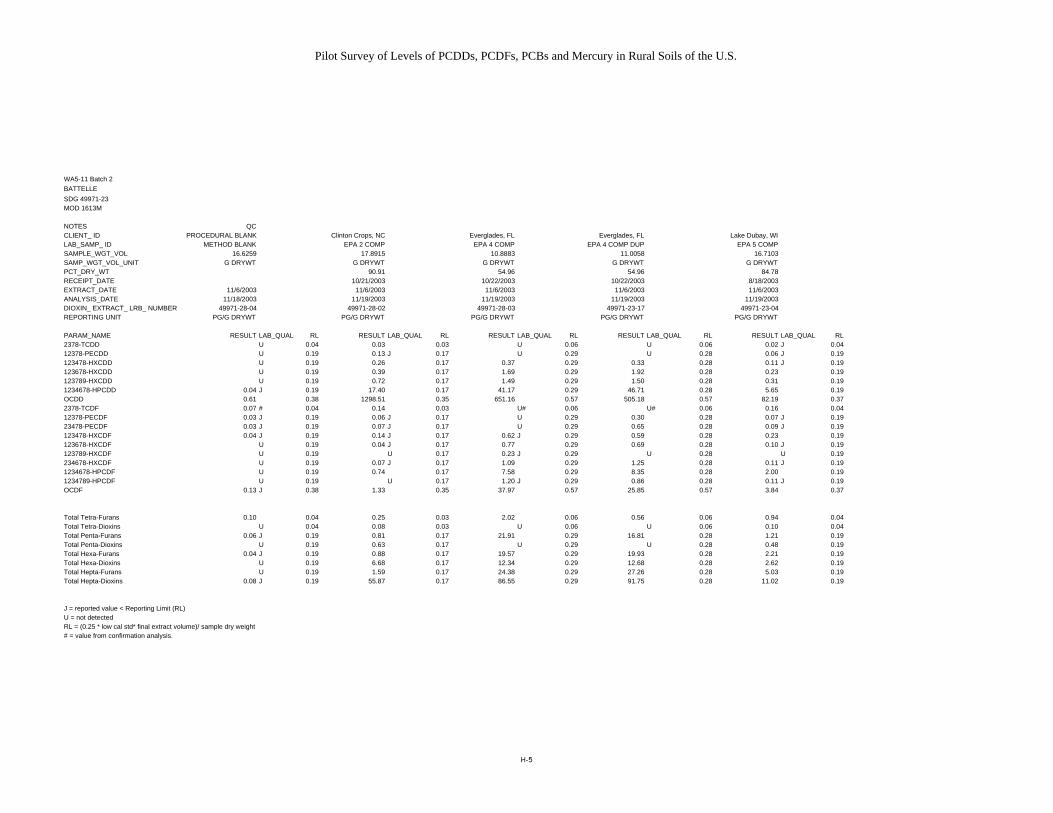
Pilot Survey of Levels of PCDDs, PCDFs, PCBs and Mercury in Rural Soils of the U.S.
WA5-11 Batch 2 BATTELLE SDG 49971-23 MOD 1613M
NOTES QC CLIENT_ ID PROCEDURAL BLANK Clinton Crops, NC Everglades, FL Everglades, FL Lake Dubay, WI LAB_SAMP_ ID METHOD BLANK EPA 2 COMP EPA 4 COMP EPA 4 COMP DUP EPA 5 COMP SAMPLE_WGT_VOL 16.6259 17.8915 10.8883 11.0058 16.7103 SAMP_WGT_VOL_UNIT G DRYWT G DRYWT G DRYWT G DRYWT G DRYWT PCT_DRY_WT 90.91 54.96 54.96 84.78 RECEIPT_DATE 10/21/2003 10/22/2003 10/22/2003 8/18/2003 EXTRACT_DATE 11/6/2003 11/6/2003 11/6/2003 11/6/2003 11/6/2003 ANALYSIS_DATE 11/18/2003 11/19/2003 11/19/2003 11/19/2003 11/19/2003 DIOXIN_ EXTRACT_ LRB_ NUMBER 49971-28-04 49971-28-02 49971-28-03 49971-23-17 49971-23-04 REPORTING UNIT PG/G DRYWT PG/G DRYWT PG/G DRYWT PG/G DRYWT PG/G DRYWT
PARAM_NAME RESULT LAB_QUAL RL RESULT LAB_QUAL RL RESULT LAB_QUAL RL RESULT LAB_QUAL RL RESULT LAB_QUAL RL 2378-TCDD U 0.04 0.03 0.03 U 0.06 U 0.06 0.02 J 0.04 12378-PECDD U 0.19 0.13 J 0.17 U 0.29 U 0.28 0.06 J 0.19 123478-HXCDD U 0.19 0.26 0.17 0.37 0.29 0.33 0.28 0.11 J 0.19 123678-HXCDD U 0.19 0.39 0.17 1.69 0.29 1.92 0.28 0.23 0.19 123789-HXCDD U 0.19 0.72 0.17 1.49 0.29 1.50 0.28 0.31 0.19 1234678-HPCDD 0.04 J 0.19 17.40 0.17 41.17 0.29 46.71 0.28 5.65 0.19 OCDD 0.61 0.38 1298.51 0.35 651.16 0.57 505.18 0.57 82.19 0.37 2378-TCDF 0.07 # 0.04 0.14 0.03 U# 0.06 U# 0.06 0.16 0.04 12378-PECDF 0.03 J 0.19 0.06 J 0.17 U 0.29 0.30 0.28 0.07 J 0.19 23478-PECDF 0.03 J 0.19 0.07 J 0.17 U 0.29 0.65 0.28 0.09 J 0.19 123478-HXCDF 0.04 J 0.19 0.14 J 0.17 0.62 J 0.29 0.59 0.28 0.23 0.19 123678-HXCDF U 0.19 0.04 J 0.17 0.77 0.29 0.69 0.28 0.10 J 0.19 123789-HXCDF U 0.19 U 0.17 0.23 J 0.29 U 0.28 U 0.19 234678-HXCDF U 0.19 0.07 J 0.17 1.09 0.29 1.25 0.28 0.11 J 0.19 1234678-HPCDF U 0.19 0.74 0.17 7.58 0.29 8.35 0.28 2.00 0.19 1234789-HPCDF U 0.19 U 0.17 1.20 J 0.29 0.86 0.28 0.11 J 0.19 OCDF 0.13 J 0.38 1.33 0.35 37.97 0.57 25.85 0.57 3.84 0.37
Total Tetra-Furans 0.10 0.04 0.25 0.03 2.02 0.06 0.56 0.06 0.94 0.04 Total Tetra-Dioxins U 0.04 0.08 0.03 U 0.06 U 0.06 0.10 0.04 Total Penta-Furans 0.06 J 0.19 0.81 0.17 21.91 0.29 16.81 0.28 1.21 0.19 Total Penta-Dioxins U 0.19 0.63 0.17 U 0.29 U 0.28 0.48 0.19 Total Hexa-Furans 0.04 J 0.19 0.88 0.17 19.57 0.29 19.93 0.28 2.21 0.19 Total Hexa-Dioxins U 0.19 6.68 0.17 12.34 0.29 12.68 0.28 2.62 0.19 Total Hepta-Furans U 0.19 1.59 0.17 24.38 0.29 27.26 0.28 5.03 0.19 Total Hepta-Dioxins 0.08 J 0.19 55.87 0.17 86.55 0.29 91.75 0.28 11.02 0.19
J = reported value < Reporting Limit (RL) U = not detected RL = (0.25 * low cal std* final extract volume)/ sample dry weight # = value from confirmation analysis.
H-5

Pilot Survey of Levels of PCDDs, PCDFs, PCBs and Mercury in Rural Soils of the U.S.
WA5-11 Batch 2 BATTELLE SDG 49971-23 MOD 1613M
NOTES CLIENT_ ID Monmouth, IL Keystone State Park, OK Arkadelphia, AK Jasper, NY Fond du Lac, MN Fond du Lac, MN LAB_SAMP_ ID EPA 6 COMP EPA 9 COMP EPA 10 COMP EPA 12 COMP EPA 20 COMP EPA 20 COMP DUP SAMPLE_WGT_VOL 17.3948 17.8582 17.5451 14.1085 19.0782 19.6037 SAMP_WGT_VOL_UNIT G DRYWT G DRYWT G DRYWT G DRYWT G DRYWT G DRYWT PCT_DRY_WT 87.36 88.71 88.91 70.95 97.10 97.10 RECEIPT_DATE 8/18/2003 8/20/2003 9/12/2003 8/22/2003 8/26/2003 8/26/2003 EXTRACT_DATE 11/6/2003 11/6/2003 11/6/2003 11/6/2003 11/6/2003 11/6/2003 ANALYSIS_DATE 11/19/2003 11/19/2003 11/19/2003 11/19/2003 11/19/2003 11/20/2003 DIOXIN_ EXTRACT_ LRB_ NUMBER 49971-23-05 49971-23-06 49971-23-07 49971-23-08 49971-23-09 49971-23-18 REPORTING UNIT PG/G DRYWT PG/G DRYWT PG/G DRYWT PG/G DRYWT PG/G DRYWT PG/G DRYWT
PARAM_NAME RESULT LAB_QUAL RL RESULT LAB_QUAL RL RESULT LAB_QUAL RL RESULT LAB_QUAL RL RESULT LAB_QUAL RL RESULT LAB_QUAL RL 2378-TCDD 0.18 0.04 U 0.03 0.03 J 0.04 0.16 0.04 U 0.03 U 0.03 12378-PECDD 0.75 0.18 0.06 J 0.17 0.08 J 0.18 0.92 0.22 0.10 J 0.16 0.12 J 0.16 123478-HXCDD 0.48 J 0.18 0.09 J 0.17 0.18 0.18 2.13 0.22 0.19 0.16 0.20 0.16 123678-HXCDD 1.58 0.18 0.22 0.17 0.28 0.18 4.45 0.22 0.63 0.16 0.64 0.16 123789-HXCDD 5.18 0.18 0.32 0.17 0.53 0.18 5.17 0.22 0.51 0.16 0.53 0.16 1234678-HPCDD 37.53 0.18 5.07 0.17 12.00 0.18 180.15 0.22 16.78 0.16 16.21 0.16 OCDD 308.18 0.36 51.33 0.35 649.79 0.36 10915.30 0.44 78.02 0.33 115.12 0.32 2378-TCDF U# 0.04 2.34 # 0.03 0.21 # 0.04 0.99 # 0.04 0.18 0.03 0.12 0.03 12378-PECDF 0.14 J 0.18 1.43 0.17 0.16 J 0.18 0.74 0.22 0.13 J 0.16 0.08 J 0.16 23478-PECDF 0.18 0.18 0.99 0.17 0.12 J 0.18 0.67 0.22 0.11 J 0.16 0.09 J 0.16 123478-HXCDF 0.56 0.18 1.04 0.17 0.21 0.18 1.07 0.22 0.36 0.16 0.37 0.16 123678-HXCDF 0.28 0.18 0.28 0.17 0.07 J 0.18 0.53 0.22 0.24 0.16 0.23 0.16 123789-HXCDF U 0.18 0.08 J 0.17 0.08 J 0.18 0.13 J 0.22 U 0.16 0.03 0.16 234678-HXCDF 0.48 0.18 0.17 0.17 0.06 J 0.18 0.52 0.22 0.23 0.16 0.26 0.16 1234678-HPCDF 9.39 0.18 1.87 0.17 0.59 0.18 9.59 0.22 6.66 0.16 6.79 0.16 1234789-HPCDF 0.42 0.18 0.15 J 0.17 0.05 J 0.18 0.46 J 0.22 0.41 0.16 0.37 0.16 OCDF 30.10 0.36 3.28 0.35 1.11 0.36 25.48 0.44 30.36 0.33 27.05 0.32
Total Tetra-Furans 1.26 0.04 5.69 0.03 0.65 0.04 3.20 0.04 0.54 0.03 0.36 0.03 Total Tetra-Dioxins 0.53 0.04 0.04 0.03 0.04 0.04 0.36 0.04 0.04 0.03 U 0.03 Total Penta-Furans 3.00 0.18 5.17 0.17 0.57 0.18 5.39 0.22 1.97 0.16 1.76 0.16 Total Penta-Dioxins 2.63 0.18 0.43 0.17 0.33 0.18 3.86 0.22 0.56 0.16 0.61 0.16 Total Hexa-Furans 9.87 0.18 3.30 0.17 0.90 0.18 11.58 0.22 7.20 0.16 6.48 0.16 Total Hexa-Dioxins 19.59 0.18 2.28 0.17 3.69 0.18 42.31 0.22 4.71 0.16 4.33 0.16 Total Hepta-Furans 51.47 0.18 4.30 0.17 1.28 0.18 31.67 0.22 24.46 0.16 24.88 0.16 Total Hepta-Dioxins 64.03 0.18 11.19 0.17 31.28 0.18 442.92 0.22 29.38 0.16 27.94 0.16
J = reported value < Reporting Limit (RL U = not detected RL = (0.25 * low cal std* final extract volu # = value from confirmation analysis.
H-6
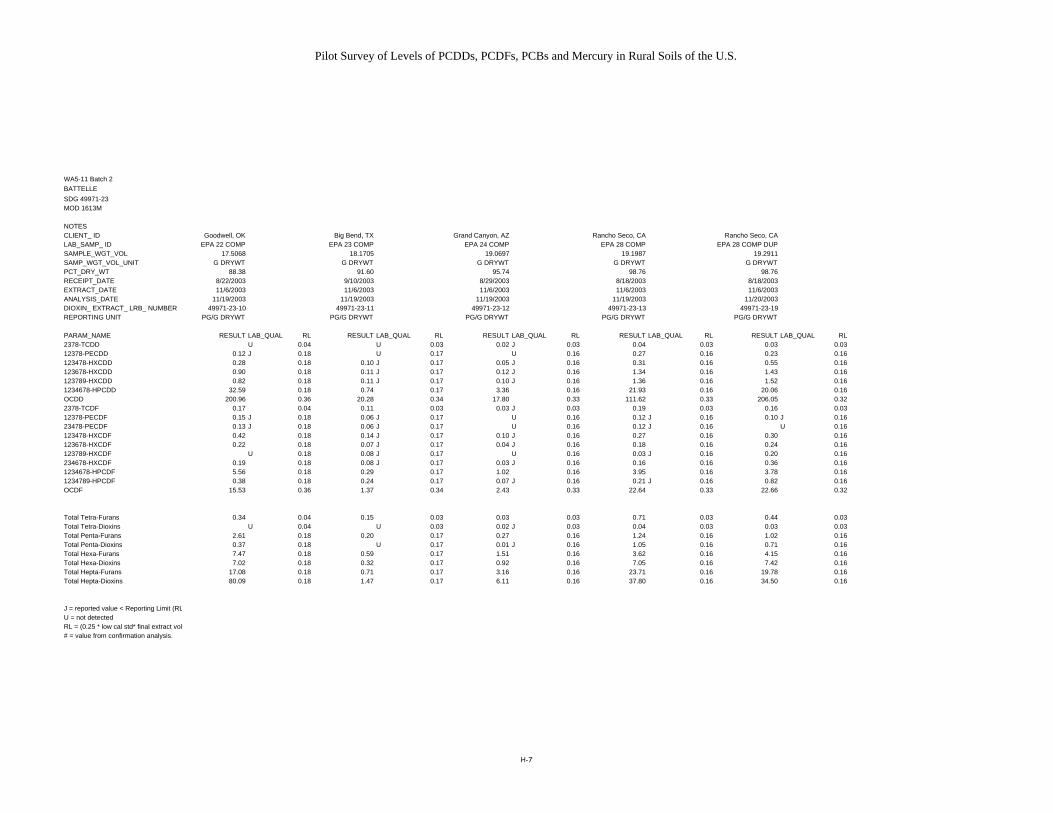
Pilot Survey of Levels of PCDDs, PCDFs, PCBs and Mercury in Rural Soils of the U.S.
WA5-11 Batch 2 BATTELLE SDG 49971-23 MOD 1613M
NOTES CLIENT_ ID Goodwell, OK Big Bend, TX Grand Canyon, AZ Rancho Seco, CA Rancho Seco, CA LAB_SAMP_ ID EPA 22 COMP EPA 23 COMP EPA 24 COMP EPA 28 COMP EPA 28 COMP DUP SAMPLE_WGT_VOL 17.5068 18.1705 19.0697 19.1987 19.2911 SAMP_WGT_VOL_UNIT G DRYWT G DRYWT G DRYWT G DRYWT G DRYWT PCT_DRY_WT 88.38 91.60 95.74 98.76 98.76 RECEIPT_DATE 8/22/2003 9/10/2003 8/29/2003 8/18/2003 8/18/2003 EXTRACT_DATE 11/6/2003 11/6/2003 11/6/2003 11/6/2003 11/6/2003 ANALYSIS_DATE 11/19/2003 11/19/2003 11/19/2003 11/19/2003 11/20/2003 DIOXIN_ EXTRACT_ LRB_ NUMBER 49971-23-10 49971-23-11 49971-23-12 49971-23-13 49971-23-19 REPORTING UNIT PG/G DRYWT PG/G DRYWT PG/G DRYWT PG/G DRYWT PG/G DRYWT
PARAM_NAME RESULT LAB_QUAL RL RESULT LAB_QUAL RL RESULT LAB_QUAL RL RESULT LAB_QUAL RL RESULT LAB_QUAL RL 2378-TCDD U 0.04 U 0.03 0.02 J 0.03 0.04 0.03 0.03 0.03 12378-PECDD 0.12 J 0.18 U 0.17 U 0.16 0.27 0.16 0.23 0.16 123478-HXCDD 0.28 0.18 0.10 J 0.17 0.05 J 0.16 0.31 0.16 0.55 0.16 123678-HXCDD 0.90 0.18 0.11 J 0.17 0.12 J 0.16 1.34 0.16 1.43 0.16 123789-HXCDD 0.82 0.18 0.11 J 0.17 0.10 J 0.16 1.36 0.16 1.52 0.16 1234678-HPCDD 32.59 0.18 0.74 0.17 3.36 0.16 21.93 0.16 20.06 0.16 OCDD 200.96 0.36 20.28 0.34 17.80 0.33 111.62 0.33 206.05 0.32 2378-TCDF 0.17 0.04 0.11 0.03 0.03 J 0.03 0.19 0.03 0.16 0.03 12378-PECDF 0.15 J 0.18 0.06 J 0.17 U 0.16 0.12 J 0.16 0.10 J 0.16 23478-PECDF 0.13 J 0.18 0.06 J 0.17 U 0.16 0.12 J 0.16 U 0.16 123478-HXCDF 0.42 0.18 0.14 J 0.17 0.10 J 0.16 0.27 0.16 0.30 0.16 123678-HXCDF 0.22 0.18 0.07 J 0.17 0.04 J 0.16 0.18 0.16 0.24 0.16 123789-HXCDF U 0.18 0.08 J 0.17 U 0.16 0.03 J 0.16 0.20 0.16 234678-HXCDF 0.19 0.18 0.08 J 0.17 0.03 J 0.16 0.16 0.16 0.36 0.16 1234678-HPCDF 5.56 0.18 0.29 0.17 1.02 0.16 3.95 0.16 3.78 0.16 1234789-HPCDF 0.38 0.18 0.24 0.17 0.07 J 0.16 0.21 J 0.16 0.82 0.16 OCDF 15.53 0.36 1.37 0.34 2.43 0.33 22.64 0.33 22.66 0.32
Total Tetra-Furans 0.34 0.04 0.15 0.03 0.03 0.03 0.71 0.03 0.44 0.03 Total Tetra-Dioxins U 0.04 U 0.03 0.02 J 0.03 0.04 0.03 0.03 0.03 Total Penta-Furans 2.61 0.18 0.20 0.17 0.27 0.16 1.24 0.16 1.02 0.16 Total Penta-Dioxins 0.37 0.18 U 0.17 0.01 J 0.16 1.05 0.16 0.71 0.16 Total Hexa-Furans 7.47 0.18 0.59 0.17 1.51 0.16 3.62 0.16 4.15 0.16 Total Hexa-Dioxins 7.02 0.18 0.32 0.17 0.92 0.16 7.05 0.16 7.42 0.16 Total Hepta-Furans 17.08 0.18 0.71 0.17 3.16 0.16 23.71 0.16 19.78 0.16 Total Hepta-Dioxins 80.09 0.18 1.47 0.17 6.11 0.16 37.80 0.16 34.50 0.16
J = reported value < Reporting Limit (RL U = not detected RL = (0.25 * low cal std* final extract volu # = value from confirmation analysis.
H-7
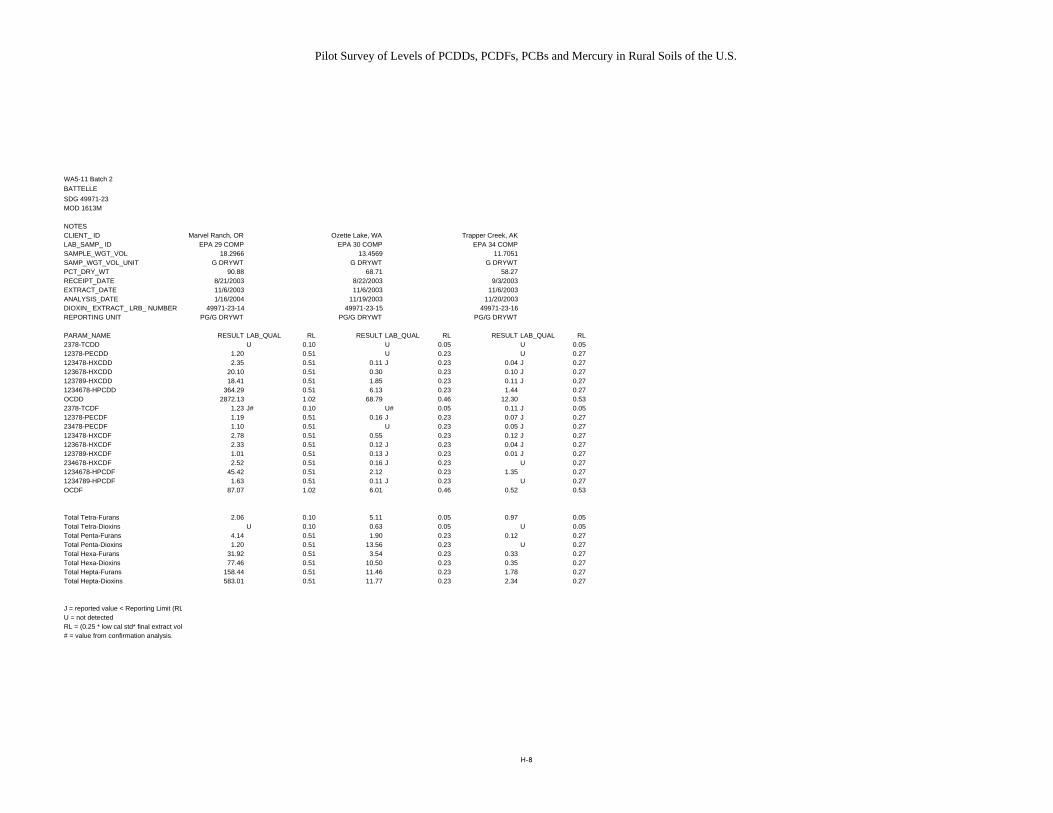
Pilot Survey of Levels of PCDDs, PCDFs, PCBs and Mercury in Rural Soils of the U.S.
WA5-11 Batch 2 BATTELLE SDG 49971-23 MOD 1613M
NOTES CLIENT_ ID Marvel Ranch, OR Ozette Lake, WA Trapper Creek, AK LAB_SAMP_ ID EPA 29 COMP EPA 30 COMP EPA 34 COMP SAMPLE_WGT_VOL 18.2966 13.4569 11.7051 SAMP_WGT_VOL_UNIT G DRYWT G DRYWT G DRYWT PCT_DRY_WT 90.88 68.71 58.27 RECEIPT_DATE 8/21/2003 8/22/2003 9/3/2003 EXTRACT_DATE 11/6/2003 11/6/2003 11/6/2003 ANALYSIS_DATE 1/16/2004 11/19/2003 11/20/2003 DIOXIN_ EXTRACT_ LRB_ NUMBER 49971-23-14 49971-23-15 49971-23-16 REPORTING UNIT PG/G DRYWT PG/G DRYWT PG/G DRYWT
PARAM_NAME RESULT LAB_QUAL RL RESULT LAB_QUAL RL RESULT LAB_QUAL RL 2378-TCDD U 0.10 U 0.05 U 0.05 12378-PECDD 1.20 0.51 U 0.23 U 0.27 123478-HXCDD 2.35 0.51 0.11 J 0.23 0.04 J 0.27 123678-HXCDD 20.10 0.51 0.30 0.23 0.10 J 0.27 123789-HXCDD 18.41 0.51 1.85 0.23 0.11 J 0.27 1234678-HPCDD 364.29 0.51 6.13 0.23 1.44 0.27 OCDD 2872.13 1.02 68.79 0.46 12.30 0.53 2378-TCDF 1.23 J# 0.10 U# 0.05 0.11 J 0.05 12378-PECDF 1.19 0.51 0.16 J 0.23 0.07 J 0.27 23478-PECDF 1.10 0.51 U 0.23 0.05 J 0.27 123478-HXCDF 2.78 0.51 0.55 0.23 0.12 J 0.27 123678-HXCDF 2.33 0.51 0.12 J 0.23 0.04 J 0.27 123789-HXCDF 1.01 0.51 0.13 J 0.23 0.01 J 0.27 234678-HXCDF 2.52 0.51 0.16 J 0.23 U 0.27 1234678-HPCDF 45.42 0.51 2.12 0.23 1.35 0.27 1234789-HPCDF 1.63 0.51 0.11 J 0.23 U 0.27 OCDF 87.07 1.02 6.01 0.46 0.52 0.53
Total Tetra-Furans 2.06 0.10 5.11 0.05 0.97 0.05 Total Tetra-Dioxins U 0.10 0.63 0.05 U 0.05 Total Penta-Furans 4.14 0.51 1.90 0.23 0.12 0.27 Total Penta-Dioxins 1.20 0.51 13.56 0.23 U 0.27 Total Hexa-Furans 31.92 0.51 3.54 0.23 0.33 0.27 Total Hexa-Dioxins 77.46 0.51 10.50 0.23 0.35 0.27 Total Hepta-Furans 158.44 0.51 11.46 0.23 1.78 0.27 Total Hepta-Dioxins 583.01 0.51 11.77 0.23 2.34 0.27
J = reported value < Reporting Limit (RL U = not detected RL = (0.25 * low cal std* final extract volu # = value from confirmation analysis.
H-8

APPENDIX I
CALUX DATA
I-1

CALUX Bioassay Data- Field Samples
Site Sample ID XDS ID
Percent Moisture
TEQ (pg/g dry weight)
EPA-1-1 A03011 21 6.03 ± 0.79 EPA-1-2 A03012 21 7.08 ± 0.84
Penn EPA-1-3 A03013 19 8.31 ± 1.74 Nursery, PA EPA-1-4 A03014 24 4.66 ± 1.40
EPA-1-5 A03015 23 9.22 ± 2.99 EPA-1-COMP A03016 21 9.19 ± 1.84
EPA-2-1 A03278 8 0.97 ± 0.23 EPA-2-2 A03279 10 0.92 ± 0.18
Clinton EPA-2-3 A03280 14 2.99 ± 0.15 Crops, NC EPA-2-4 A03281 10 2.23 ± 0.04
EPA-2-5 A03282 8 0.79 ± 0.36 EPA-2-COMP A03283 10 2.10 ± 0.33
EPA-4-1 A03272 65 3.37 ± 0.10 EPA-4-2 A03273 50 1.79 ± 0.46
Everglades, FL
EPA-4-3 A03274 45 1.84 ± 0.36 EPA-4-4 A03275 32 2.07 ± 0.08 EPA-4-5 A03276 52 0.88 ± 0.32
EPA-4-COMP A03277 47 2.16 ± 0.89 EPA-5-1 A03059 17 10.83 ± 0.13 EPA-5-2 A03060 14 9.68 ± 0.19
Lake Dubay, WI
EPA-5-3 A03061 12 10.31 ± 2.47 EPA-5-4 A03062 13 3.69 ± 0.59 EPA-5-5 A03063 16 2.94 ± 0.01
EPA-5-COMP A03064 16 3.68 ± 0.21 EPA-6-1 A02987 10 9.18 ± 1.47 EPA-6-2 A02988 8 4.84 ± 0.10
Monmouth, EPA-6-3 A02989 7 3.38 ± 0.36 IL EPA-6-4 A02990 3 1.95 ± 0.55
EPA-6-5 A02991 26 4.23 ± 0.79 EPA-6-COMP A02992 11 4.97 ± 0.43
I-2

Site Sample ID XDS ID
Percent Moisture
TEQ (pg/g dry weight)
EPA-7-1 A03017 18 15.59 ± 0.39 EPA-7-2 A03018 24 13.01 ± 0.83
McNay Farms, IL
EPA-7-3 A03019 22 12.41 ± 2.38 EPA-7-4 A03020 21 12.23 ± 1.89 EPA-7-5 A03021 16 12.43 ± 1.78
EPA-7-COMP A03022 18 11.04 ± 0.30 EPA-8-1 A03129 19 ND<0.50 EPA-8-2 A03130 16 1.22 ± 0.54
Lake Scott, EPA-8-3 A03131 22 1.12 ± 0.36 KS EPA-8-4 A03132 25 ND<0.56
EPA-8-5 A03133 31 0.82 ± 0.33 EPA-8-COMP A03134 23 1.58 ± 0.76
EPA-9-1 A02993 17 0.87 ± 0.30
Keystone State Park,
OK
EPA-9-2 A02994 15 2.00 ± 0.41 EPA-9-3 A02995 7 2.34 ± 0.07 EPA-9-4 A02996 3 1.20 ± 0.17 EPA-9-5 A02997 7 1.23 ± 0.14
EPA-9-COMP A02998 9 1.88 ± 0.50 EPA-10-1 A03123 8 3.17 ± 0.04 EPA-10-2 A03124 11 3.10 ± 1.02
Arkadelphia, AR
EPA-10-3 A03125 9 2.59 ± 0.19 EPA-10-4 A03126 8 2.86 ± 0.02 EPA-10-5 A03127 12 3.72 ± 0.21
EPA-10-COMP A03128 6 2.92 ± 0.35 EPA-11-1 A03035 24 5.89 ± 0.23 EPA-11-2 A03036 23 5.67 ± 0.42
Bennington, VT
EPA-11-3 A03037 19 8.27 ± 0.53 EPA-11-4 A03038 21 7.30 ± 1.16 EPA-11-5 A03039 10 2.30 ± 0.34
EPA-11-COMP A03040 15 5.86 ± 0.64
Jasper, NY EPA-12-1 A03083 32 7.57 ± 0.17 EPA-12-2 A03084 29 7.23 ± 0.53
I-3

Site Sample ID XDS ID
Percent Moisture
TEQ (pg/g dry weight)
EPA-12-3 A03085 30 4.98 ± 0.81 EPA-12-4 A03086 20 6.58 ± 0.20 EPA-12-5 A03087 30 6.69 ± 0.93
EPA-12-COMP A03088 30 7.04 ± 1.74 EPA-14-1 A03089 16 4.20 ± 0.12 EPA-14-2 A03090 22 5.66 ± 0.79
Caldwell, EPA-14-3 A03091 15 3.81 ± 0.05 OH EPA-14-4 A03092 21 5.87 ± 0.13
EPA-14-5 A03093 14 6.46 ± 0.81 EPA-14-COMP A03094 16 4.60 ± 1.81
EPA-16-1 A02999 11 8.00 ± 0.63 EPA-16-2 A03000 9 7.16 ± 0.11
Dixon EPA-16-3 A03001 10 10.25 ± 1.37 Springs, IL EPA-16-4 A03002 15 10.08 ± 1.28
EPA-16-5 A03003 17 9.74 ± 0.76 EPA-16-COMP A03004 13 12.61 ± 0.00
EPA-17-1 A03041 24 2.48 ± 0.35 EPA-17-2 A03042 35 1.55 ± 0.57
Quincy, FL EPA-17-3 A03043 29 2.52 ± 0.60 EPA-17-4 A03044 29 1.80 ± 0.65 EPA-17-5 A03045 27 1.03 ± 0.33
EPA-17-COMP A03046 29 1.54 ± 0.11 EPA-18-1 A03095 25 14.68 ± 0.63 EPA-18-2 A03096 17 16.60 ± 1.02
Bay St, Louis, MS
EPA-18-3 A03097 21 15.22 ± 2.58 EPA-18-4 A03098 17 18.24 ± 1.40 EPA-18-5 A03099 12 22.89 ± 2.63
EPA-18-COMP A03100 18 17.06 ± 1.01 EPA-19-1 A03101 5 0.53 ± 0.19
Padre EPA-19-2 A03102 1 0.25 ± 0.01 Island, TX EPA-19-3 A03103 1 0.40 ± 0.07
EPA-19-4 A03104 2 0.34 ± 0.07
I-4

Site Sample ID XDS ID
Percent Moisture
TEQ (pg/g dry weight)
EPA-19-5 A03105 0 0.36 ± 0.05 EPA-19-COMP A03106 2 0.62 ± 0.24
EPA-20-1 A03135 2 2.89 ± 1.29 EPA-20-2 A03136 3 1.85 ± 0.37
Fond du EPA-20-3 A03137 2 6.91 ± 0.99 Lac, MN EPA-20-4 A03138 2 1.00 ± 0.49
EPA-20-5 A03139 7 1.47 ± 0.02 EPA-20-COMP A03140 2 2.87 ± 0.11
EPA-21-1 A03065 9 5.71 ± 0.53 EPA-21-2 A03066 7 4.88 ± 1.10
North Platte, EPA-21-3 A03067 8 6.72 ± 1.60 NE EPA-21-4 A03068 11 8.74 ± 1.33
EPA-21-5 A03069 9 6.80 ± 0.34 EPA-21-COMP A03070 16 6.33 ± 0.21
EPA-22-1 A03141 18 4.93 ± 2.42 EPA-22-2 A03142 11 4.72 ± 0.89
Goodwell, EPA-22-3 A03143 18 4.27 ± 0.88 OK EPA-22-4 A03144 5 3.14 ± 0.41
EPA-22-5 A03145 3 3.60 ± 0.30 EPA-22-COMP A03146 12 3.61 ± 0.46
EPA-23-1 A03023 6 0.98 ± 0.31 EPA-23-2 A03024 7 1.54 ± 0.22
Big Bend, TX
EPA-23-3 A03025 5 0.63 ± 0.07 EPA-23-4 A03026 9 1.52 ± 0.44 EPA-23-5 A03027 7 0.69 ± 0.01
EPA-23-COMP A03028 7 0.62 ± 0.69
I-5
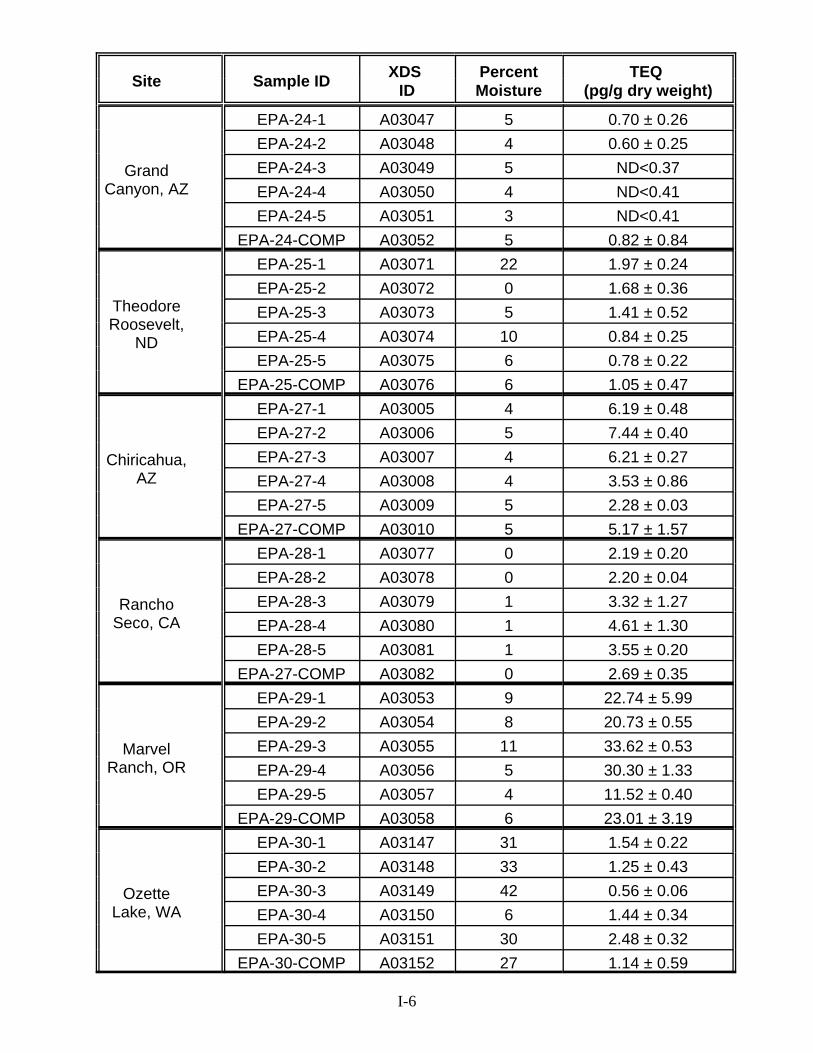
Site Sample ID XDS ID
Percent Moisture
TEQ (pg/g dry weight)
EPA-24-1 A03047 5 0.70 ± 0.26 EPA-24-2 A03048 4 0.60 ± 0.25
Grand EPA-24-3 A03049 5 ND<0.37 Canyon, AZ EPA-24-4 A03050 4 ND<0.41
EPA-24-5 A03051 3 ND<0.41 EPA-24-COMP A03052 5 0.82 ± 0.84
EPA-25-1 A03071 22 1.97 ± 0.24
Theodore Roosevelt,
ND
EPA-25-2 A03072 0 1.68 ± 0.36 EPA-25-3 A03073 5 1.41 ± 0.52 EPA-25-4 A03074 10 0.84 ± 0.25 EPA-25-5 A03075 6 0.78 ± 0.22
EPA-25-COMP A03076 6 1.05 ± 0.47 EPA-27-1 A03005 4 6.19 ± 0.48 EPA-27-2 A03006 5 7.44 ± 0.40
Chiricahua, EPA-27-3 A03007 4 6.21 ± 0.27 AZ EPA-27-4 A03008 4 3.53 ± 0.86
EPA-27-5 A03009 5 2.28 ± 0.03 EPA-27-COMP A03010 5 5.17 ± 1.57
EPA-28-1 A03077 0 2.19 ± 0.20 EPA-28-2 A03078 0 2.20 ± 0.04
Rancho EPA-28-3 A03079 1 3.32 ± 1.27 Seco, CA EPA-28-4 A03080 1 4.61 ± 1.30
EPA-28-5 A03081 1 3.55 ± 0.20 EPA-27-COMP A03082 0 2.69 ± 0.35
EPA-29-1 A03053 9 22.74 ± 5.99 EPA-29-2 A03054 8 20.73 ± 0.55
Marvel EPA-29-3 A03055 11 33.62 ± 0.53 Ranch, OR EPA-29-4 A03056 5 30.30 ± 1.33
EPA-29-5 A03057 4 11.52 ± 0.40 EPA-29-COMP A03058 6 23.01 ± 3.19
EPA-30-1 A03147 31 1.54 ± 0.22 EPA-30-2 A03148 33 1.25 ± 0.43
Ozette EPA-30-3 A03149 42 0.56 ± 0.06 Lake, WA EPA-30-4 A03150 6 1.44 ± 0.34
EPA-30-5 A03151 30 2.48 ± 0.32 EPA-30-COMP A03152 27 1.14 ± 0.59
I-6

Site Sample ID XDS ID
Percent Moisture
TEQ (pg/g dry weight)
EPA-34-1 A03029 40 1.12 ± 0.10 EPA-34-2 A03030 41 2.00 ± 0.47
Trapper Creek, AK
EPA-34-3 A03031 40 2.22 ± 0.54 EPA-34-4 A03032 42 2.57 ± 0.98 EPA-34-5 A03033 43 6.53 ± 2.73
EPA-34-COMP A03034 44 1.79 ± 0.58
I-7

CALUX Bioassay Data- Field Blanks
Sample ID XDS ID
Percent Moisture
(%)
TEQ (pg/g dry weight)
Lake Dubay, WI EPA-5-FB A03107 0 0.29 ± 0.09
McNay Farm, IL EPA-7-FB A03108 1 0.76 ± 0.01
Lake Scott, KS EPA-8-FB A03109 2 0.46 ± 0.11
Arkadelphia, AR EPA-10-FB A03110 3 0.66 ± 0.50
Bennington, VT EPA-11-FB A03111 0 ND<0.23
Caldwell, OH EPA-14-FB A03112 0 0.44 ± 0.15
Dixon Springs, IL EPA-16-FB A03113 1 0.69 ± 0.09
Bay St. Louis, MS EPA-18-FB A03114 0 0.66 ± 0.62
Padre Island, TX EPA-19-FB A03115 0 0.27 ± 0.10
Big Bend, TX EPA-23-FB A03116 4 ND<0.50
Grand Canyon, AZ EPA-24-FB A03117 0 ND<0.50
Theodore Roosevelt, ND EPA-25-FB A03118 0 0.84 ± 0.31
Chiricahua, AZ EPA-27-FB A03119 0 ND<0.23
Rancho Seco, CA EPA-28-FB A03120 0 ND<0.50
Ozette Lake, WA EPA-30-FB A03121 0 0.63 ± 0.44
Trapper Creek, AK EPA-34-FB A03122 0 ND<0.50
I-8

J-1
APENDIX J
MERCURY DATA

J-2
Mercury Analysis Results: Set 1
Sample IdConcentration
(µg/L)
DigestVolume
(L)
DigestWeight
(g)Concentration
(µg/g wet)Percent
Dry
FinalConcentration
(µg/g)CCV 4.9 0.1Percent Recovery 98%
Blk <0.2 0.1LCS Blk <0.2 0.1 2.04 100 0.000LCS 2.2 0.1 2.08 0.106 100 0.106spike concentration 2 0.1 2.08 0.096Percent Recovery 110%
Nist 1944 (TV 3.4) 11.1 0.1 0.35 3.171 98.75 3.132Percent Recovery 92% Relative Percent Difference 8%
EPA-25COMP 0.01 0.1 1.88 0.0005 93.59 0.0005EPA-5COMP <0.2 0.1 2.16 <0.009 84.78 <0.008EPA-28COMP 0.8 0.1 2.14 0.037 98.76 0.037EPA-21COMP 0.3 0.1 2.12 0.014 91.61 0.013EPA-21COMP DUP 0.7 0.1 3.78 0.019 91.61 0.017Relative Percent Difference 27%
EPA-16COMP 0.4 0.1 1.80 0.022 86.84 0.019EPA-19COMP <0.2 0.1 2.25 <.009 99.15 <.009EPA-27COMP 0.8 0.1 1.72 0.047 96.20 0.045EPA-6COMP 0.5 0.1 1.74 0.029 87.36 0.025EPA-9COMP 0.2 0.1 1.90 0.011 88.71 0.009EPA-14COMP 0.6 0.1 1.91 0.031 83.86 0.026EPA-12COMP 0.4 0.1 1.86 0.022 70.95 0.015EPA-24COMP 0.2 0.1 2.10 0.010 95.74 0.009EPA-8COMP 0.4 0.1 2.79 0.014 78.17 0.011EPA-18COMP 0.6 0.1 2.05 0.029 83.08 0.024EPA-11COMP 0.9 0.1 1.67 0.054 79.62 0.043EPA-22COMP 0.1 0.1 1.81 0.006 88.38 0.005EPA-30COMP 1 0.1 1.76 0.057 68.71 0.039EPA-20COMP 0.4 0.1 2.02 0.020 97.10 0.019EPA-29COMP 0.4 0.1 1.50 0.027 90.88 0.024EPA-29 SPK 2.3 0.1 1.55 0.148 90.88 0.135spike concentration 2 0.1 1.55 0.129 90.88 0.117Percent Recovery 94%
CCV 4.8 0.1Percent Recovery 96%

J-3
Mercury Analysis Results: Set 2
Sample Id Concentration(µg/L)
DigestVolume
(L)
DigestWeight
(g)
Concentration(µg/g wet)
PercentDry
FinalConcentration
(µg/g)CCV 5.2 0.1Percent Recovery 104%
Blk <0.2 0.1LCS Blk <0.2 0.1 2.12LCS 2.1 0.1 2.11 0.100spike concentration 2 0.1 2.11 0.095Percent Recovery 105%
Nist 1944 (TV 3.4) 10.7 0.1 0.32 3.344 98.75 3.302Percent Recovery 97% Relative Percent Difference 3%
EPA-10COMP 0.9 0.1 3.12 0.029 88.91 0.026EPA-10COMP DUP 0.6 0.1 2.15 0.028 88.91 0.025Relative Percent 3% Difference
EPA-1COMP 0.7 0.1 2.14 0.033 78.27 0.026EPA-7COMP 0.8 0.1 2.17 0.037 81.32 0.030EPA-17COMP 0.7 0.1 3.78 0.019 72.84 0.013EPA-34COMP 0.8 0.1 2.08 0.038 58.27 0.022CCV 5EPA-23COMP 0.5 0.1 2.50 0.020 91.6 0.018EPA-23COMP SPK 2.2 0.1 2.54 0.087 91.6 0.079spike concentration 2 0.1 2.54 0.079 91.6 0.072Percent Recovery 85%
CCV 5.1 0.1Percent Recovery 102%
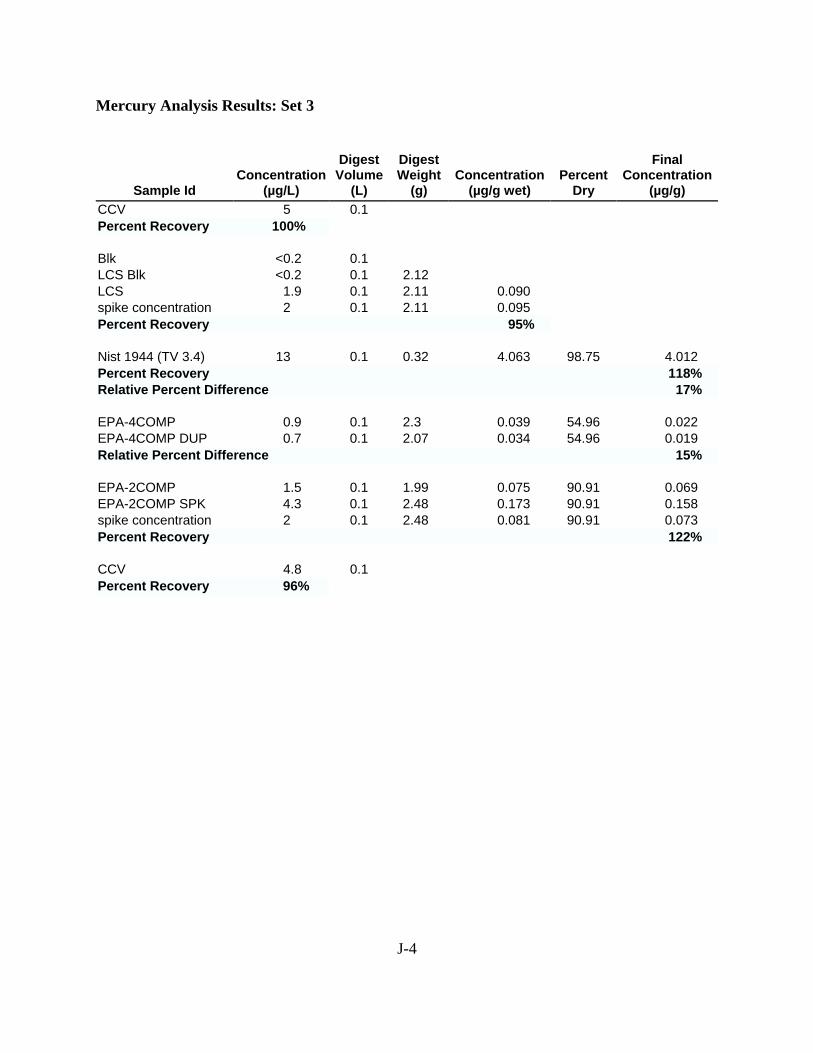
J-4
Mercury Analysis Results: Set 3
Sample IdConcentration
(µg/L)
DigestVolume
(L)
DigestWeight
(g)Concentration
(µg/g wet)Percent
Dry
FinalConcentration
(µg/g)CCV 5 0.1Percent Recovery 100%
Blk <0.2 0.1LCS Blk <0.2 0.1 2.12LCS 1.9 0.1 2.11 0.090spike concentration 2 0.1 2.11 0.095Percent Recovery 95%
Nist 1944 (TV 3.4) 13 0.1 0.32 4.063 98.75 4.012Percent Recovery 118% Relative Percent Difference 17%
EPA-4COMP 0.9 0.1 2.3 0.039 54.96 0.022EPA-4COMP DUP 0.7 0.1 2.07 0.034 54.96 0.019Relative Percent Difference 15%
EPA-2COMP 1.5 0.1 1.99 0.075 90.91 0.069EPA-2COMP SPK 4.3 0.1 2.48 0.173 90.91 0.158spike concentration 2 0.1 2.48 0.081 90.91 0.073Percent Recovery 122%
CCV 4.8 0.1Percent Recovery 96%
APPENDIX K
DIOXIN/FURAN AND PCB PROFILES
K-1

Site 1Penn Nursery, PA
PCDD/PCDF Concentration Profiles for Site 1
Site 1Penn Nursery, PA
Dioxin-like PCB Concentration Profiles for Site 1
K-2

PCDD/PCDF TEQ Profiles for Site 1
Dioxin-like PCB TEQ Profiles for Site 1
K-3

Site 2Clinton Crops, NC
PCDD/PCDF Concentration Profiles for Site 2
Dioxin-like PCB Concentration Profiles for Site 2
K-4

Site 2Clinton Crops, NC
PCDD/PCDF TEQ Profiles for Site 2
Dioxin-like PCB TEQ Profiles for Site 2
K-5
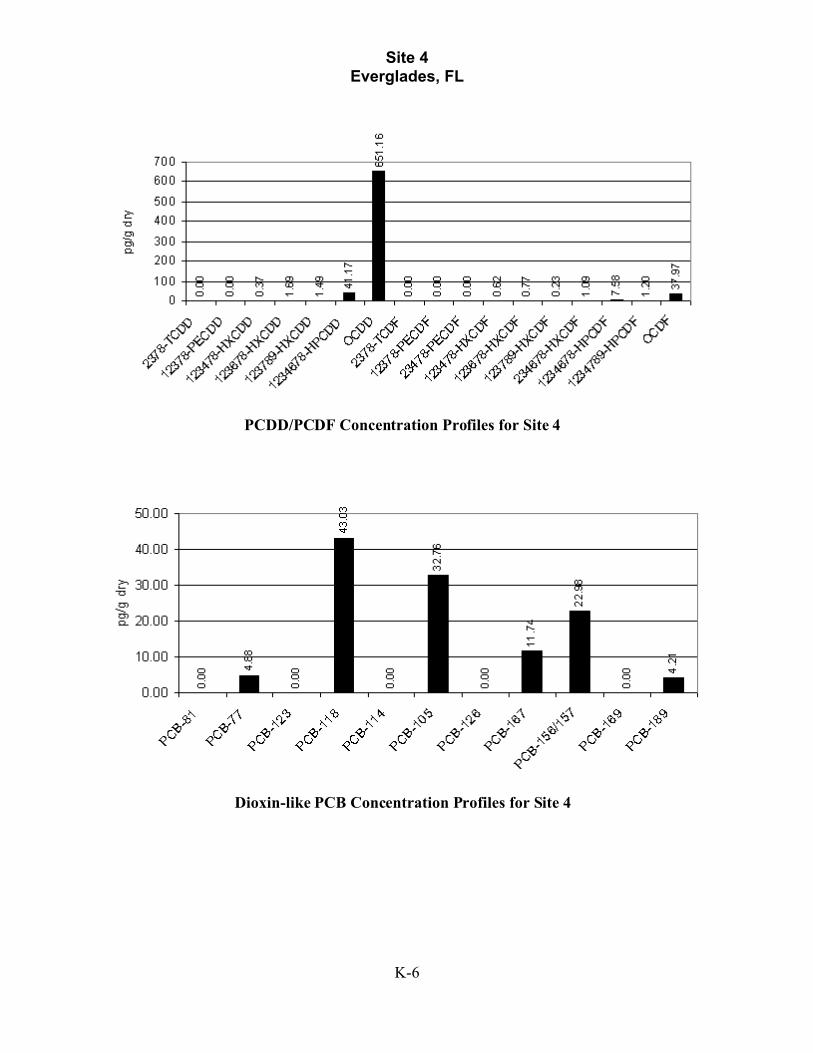
Site 4Everglades, FL
PCDD/PCDF Concentration Profiles for Site 4
Dioxin-like PCB Concentration Profiles for Site 4
K-6

Site 4Everglades, FL
PCDD/PCDF TEQ Profiles for Site 4
Dioxin-like PCB TEQ Profiles for Site 4
K-7
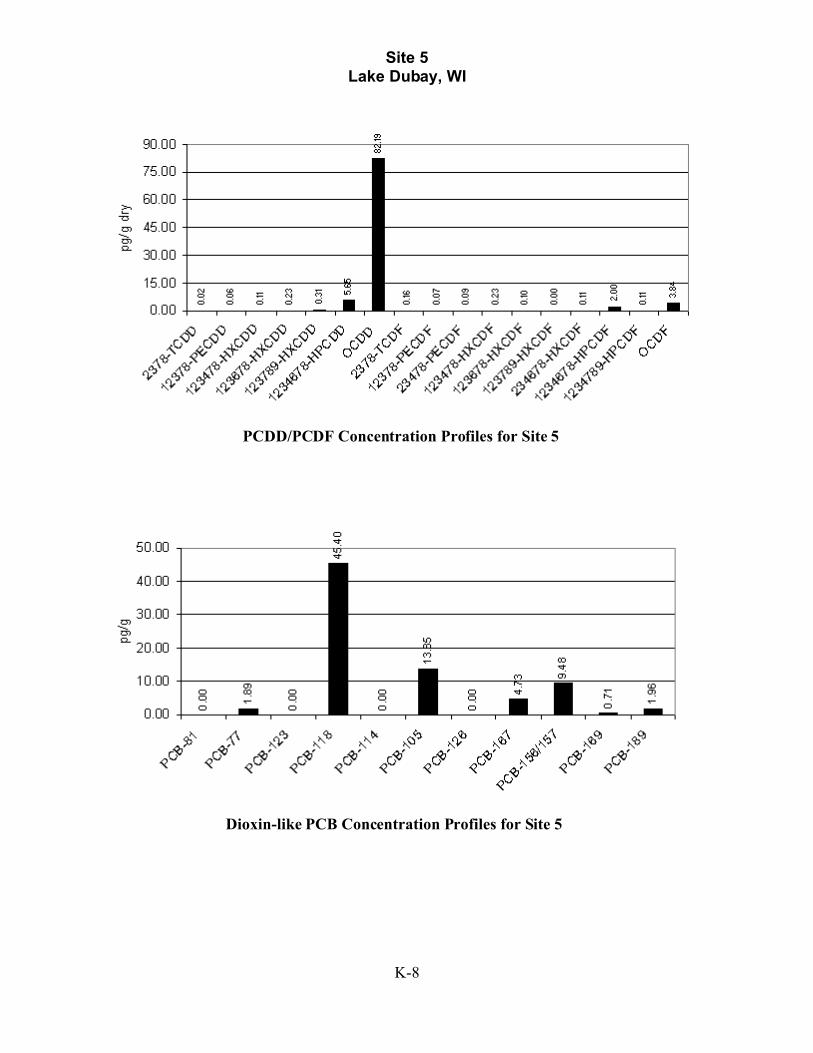
Site 5Lake Dubay, WI
PCDD/PCDF Concentration Profiles for Site 5
Dioxin-like PCB Concentration Profiles for Site 5
K-8

Site 5Lake Dubay, WI
PCDD/PCDF TEQ Profiles for Site 5
Dioxin-like PCB TEQ Profiles for Site 5
K-9

Site 6Monmouth, IL
PCDD/PCDF Concentration Profiles for Site 6
Dioxin-like PCB Concentration Profiles for Site 6
K-10

Site 6Monmouth, IL
PCDD/PCDF TEQ Profiles for Site 6
Dioxin-like PCB TEQ Profiles for Site 6
K-11

Site 7McNay Farms, IA
PCDD/PCDF Concentration Profiles for Site 7
Dioxin-like PCB Concentration Profiles for Site 7
K-12

Site 7McNay Farms, IA
PCDD/PCDF TEQ Profiles for Site 7
Dioxin-like PCB TEQ Profiles for Site 7
K-13
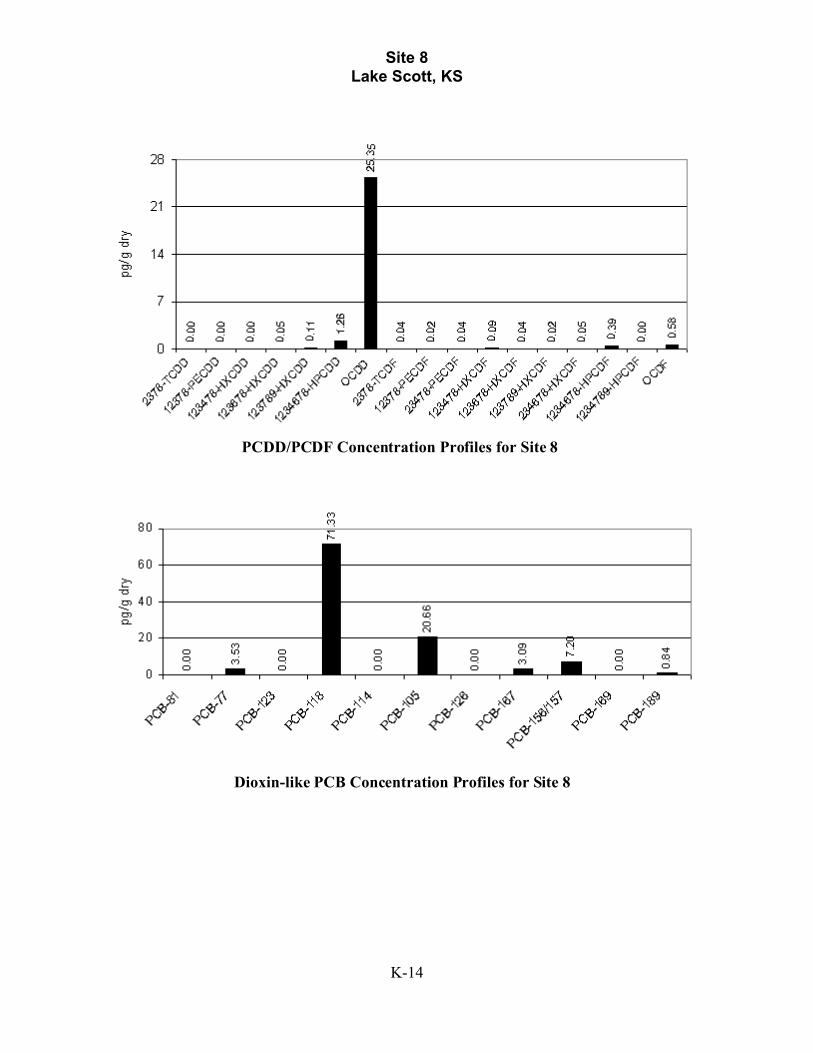
Site 8Lake Scott, KS
PCDD/PCDF Concentration Profiles for Site 8
Dioxin-like PCB Concentration Profiles for Site 8
K-14

Site 8Lake Scott, KS
PCDD/PCDF TEQ Profiles for Site 8
Dioxin-like PCB TEQ Profiles for Site 8
K-15

Site 9Keystone State Park, OK
PCDD/PCDF Concentration Profiles for Site 9
Dioxin-like PCB Concentration Profiles for Site 9
K-16

Site 9Keystone State Park, OK
PCDD/PCDF TEQ Profiles for Site 9
Dioxin-like PCB TEQ Profiles for Site 9
K-17

Site 10Arkadelphia, AR
PCDD/PCDF Concentration Profiles for Site 10
Dioxin-like PCB Concentration Profiles for Site 10
K-18

Site 10Arkadelphia, AR
PCDD/PCDF TEQ Profiles for Site 10
Dioxin-like PCB TEQ Profiles for Site 10
K-19
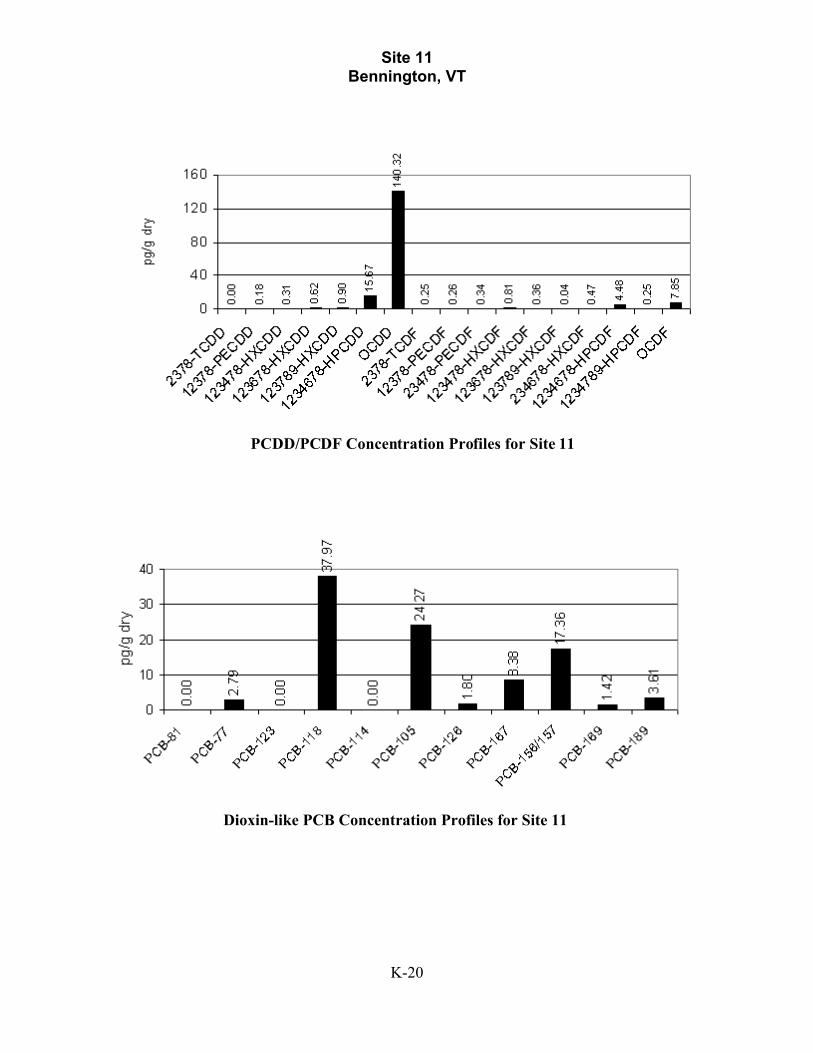
Site 11Bennington, VT
PCDD/PCDF Concentration Profiles for Site 11
Dioxin-like PCB Concentration Profiles for Site 11
K-20

Site 11Bennington, VT
PCDD/PCDF TEQ Profiles for Site 11
Dioxin-like PCB TEQ Profiles for Site 11
K-21

Site 12Jasper, NY
PCDD/PCDF Concentration Profiles for Site 12
Dioxin-like PCB Concentration Profiles for Site 12
K-22

Site 12Jasper, NY
PCDD/PCDF TEQ Profiles for Site 12
Dioxin-like PCB TEQ Profiles for Site 12
K-23

Site 14Caldwell, OH
PCDD/PCDF Concentration Profiles for Site 14
Dioxin-like PCB Concentration Profiles for Site 14
K-24

Site 14Caldwell, OH
PCDD/PCDF TEQ Profiles for Site 14
Dioxin-like PCB TEQ Profiles for Site 14
K-25
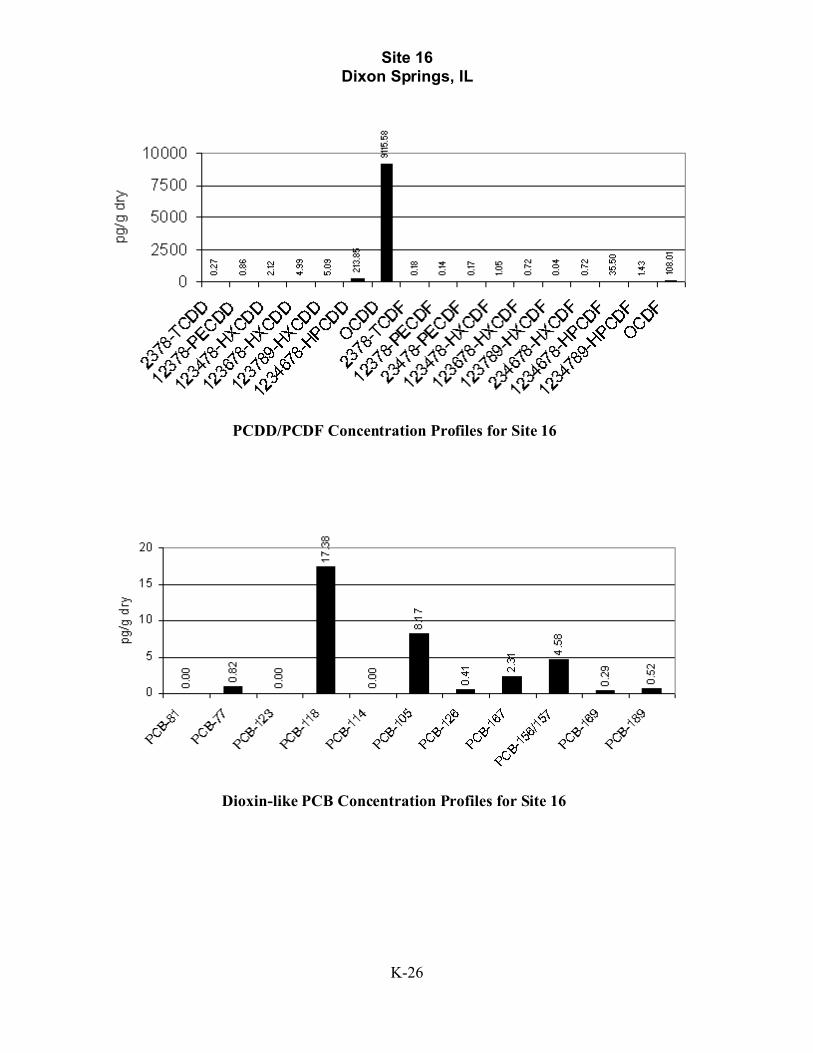
Site 16Dixon Springs, IL
PCDD/PCDF Concentration Profiles for Site 16
Dioxin-like PCB Concentration Profiles for Site 16
K-26

Site 16Dixon Springs, IL
PCDD/PCDF TEQ Profiles for Site 16
Dioxin-like PCB TEQ Profiles for Site 16
K-27

Site 17Quincy, FL
PCDD/PCDF Concentration Profiles for Site 17
Dioxin-like PCB Concentration Profiles for Site 17
K-28
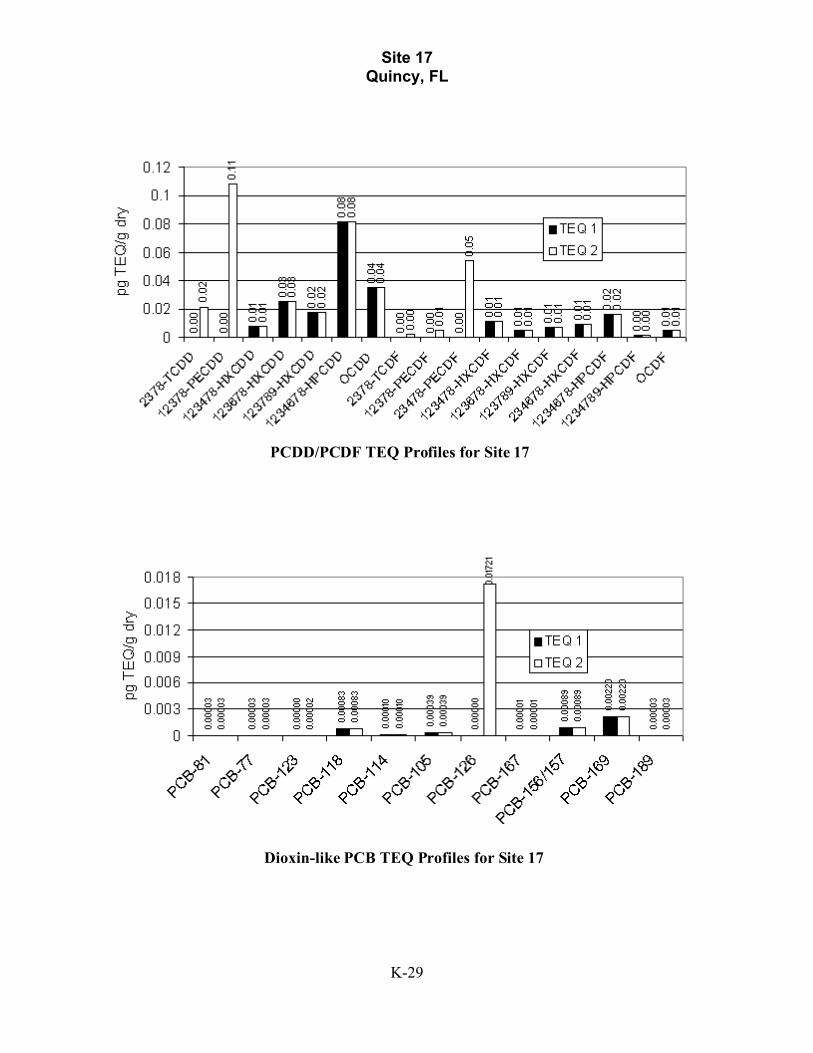
Site 17Quincy, FL
PCDD/PCDF TEQ Profiles for Site 17
Dioxin-like PCB TEQ Profiles for Site 17
K-29

Site 18Bay St. Louis, MS
PCDD/PCDF Concentration Profiles for Site 18
Dioxin-like PCB Concentration Profiles for Site 18
K-30

Site 18Bay St. Louis, MS
PCDD/PCDF TEQ Profiles for Site 18
Dioxin-like PCB TEQ Profiles for Site 18
K-31

Site 19Padre Island, TX
PCDD/PCDF Concentration Profiles for Site 19
Dioxin-like PCB Concentration Profiles for Site 19
K-32

Site 19Padre Island, TX
PCDD/PCDF TEQ Profiles for Site 19
Dioxin-like PCB TEQ Profiles for Site 19
K-33

Site 20Fond du Lac, MN
PCDD/PCDF Concentration Profiles for Site 20
Dioxin-like PCB Concentration Profiles for Site 20
K-34
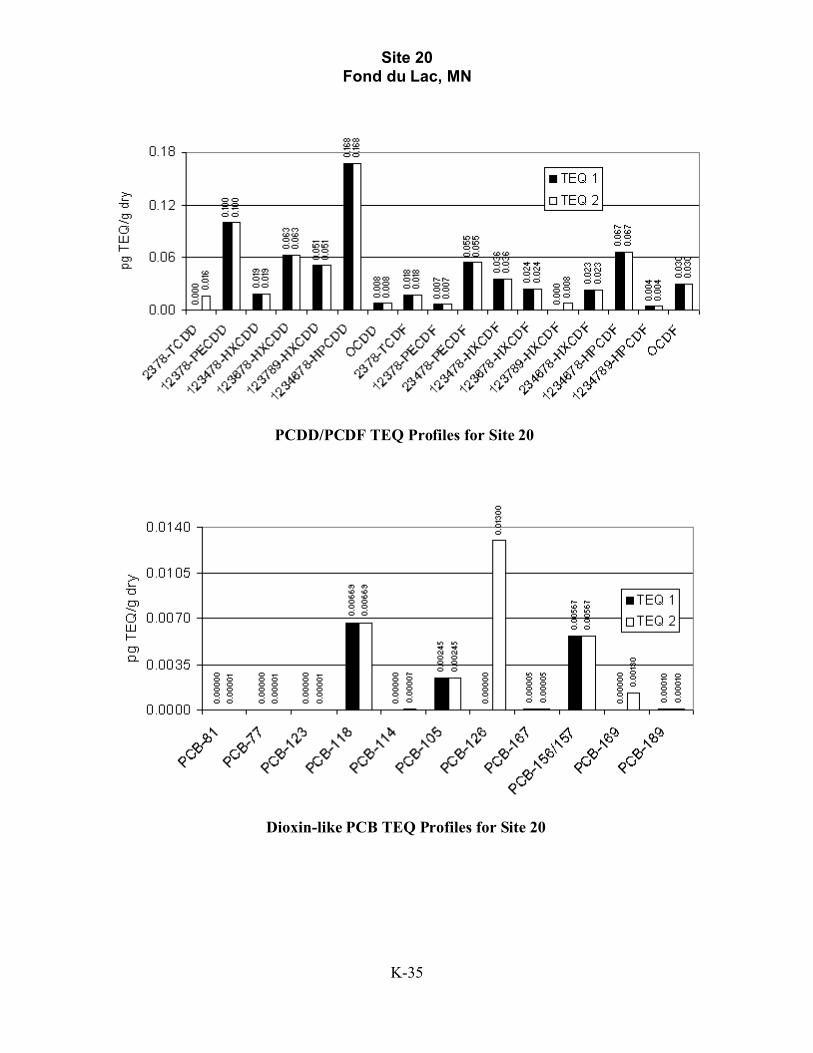
Site 20Fond du Lac, MN
PCDD/PCDF TEQ Profiles for Site 20
Dioxin-like PCB TEQ Profiles for Site 20
K-35

Site 21North Platte, NE
PCDD/PCDF Concentration Profiles for Site 21
Dioxin-like PCB Concentration Profiles for Site 21
K-36

Site 21North Platte, NE
PCDD/PCDF TEQ Profiles for Site 21
Dioxin-like PCB TEQ Profiles for Site 21
K-37
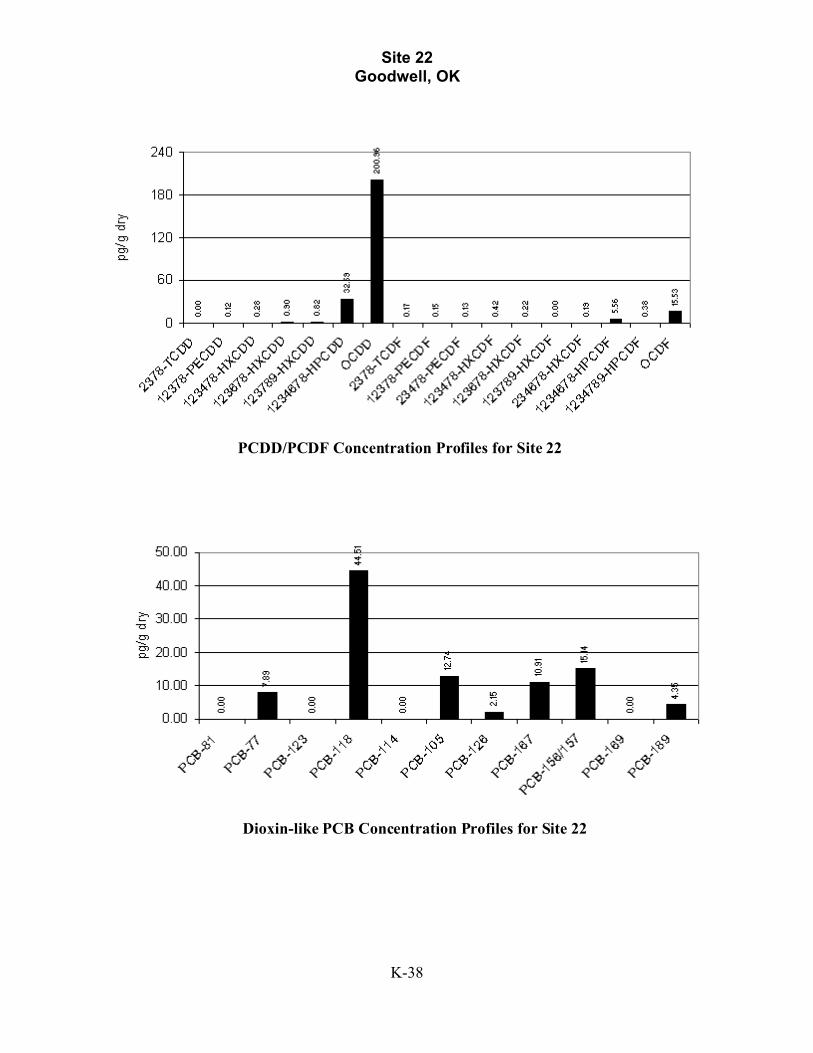
Site 22Goodwell, OK
PCDD/PCDF Concentration Profiles for Site 22
Dioxin-like PCB Concentration Profiles for Site 22
K-38
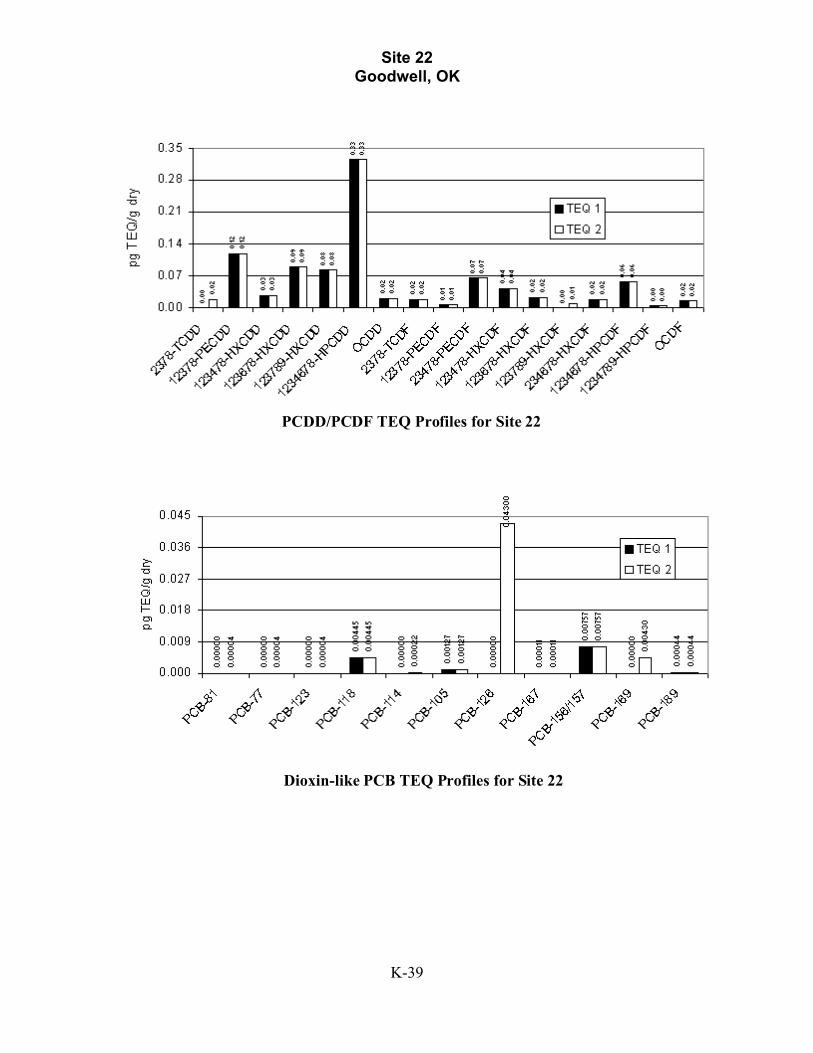
Site 22Goodwell, OK
PCDD/PCDF TEQ Profiles for Site 22
Dioxin-like PCB TEQ Profiles for Site 22
K-39

Site 23Big Bend, TX
PCDD/PCDF Concentration Profiles for Site 23
Dioxin-like PCB Concentration Profiles for Site 23
K-40

Site 23Big Bend, TX
PCDD/PCDF TEQ Profiles for Site 23
Dioxin-like PCB TEQ Profiles for Site 23
K-41

Site 24Grand Canyon, AZ
PCDD/PCDF Concentration Profiles for Site 24
Dioxin-like PCB Concentration Profiles for Site 24
K-42

Site 24Grand Canyon, AZ
PCDD/PCDF TEQ Profiles for Site 24
Dioxin-like PCB TEQ Profiles for Site 24
K-43

Site 25Theodore Roosevelt, ND
PCDD/PCDF Concentration Profiles for Site 25
Dioxin-like PCB Concentration Profiles for Site 25
K-44

Site 25Theodore Roosevelt, ND
PCDD/PCDF TEQ Profiles for Site 25
Dioxin-like PCB TEQ Profiles for Site 25
K-45

Site 27Chiricahua, AZ
PCDD/PCDF Concentration Profiles for Site 27
Dioxin-like PCB Concentration Profiles for Site 27
K-46

Site 27Chiricahua, AZ
PCDD/PCDF TEQ Profiles for Site 27
Dioxin-like PCB TEQ Profiles for Site 27
K-47

Site 28Rancho Seco, CA
PCDD/PCDF Concentration Profiles for Site 28
Dioxin-like PCB Concentration Profiles for Site 28
K-48
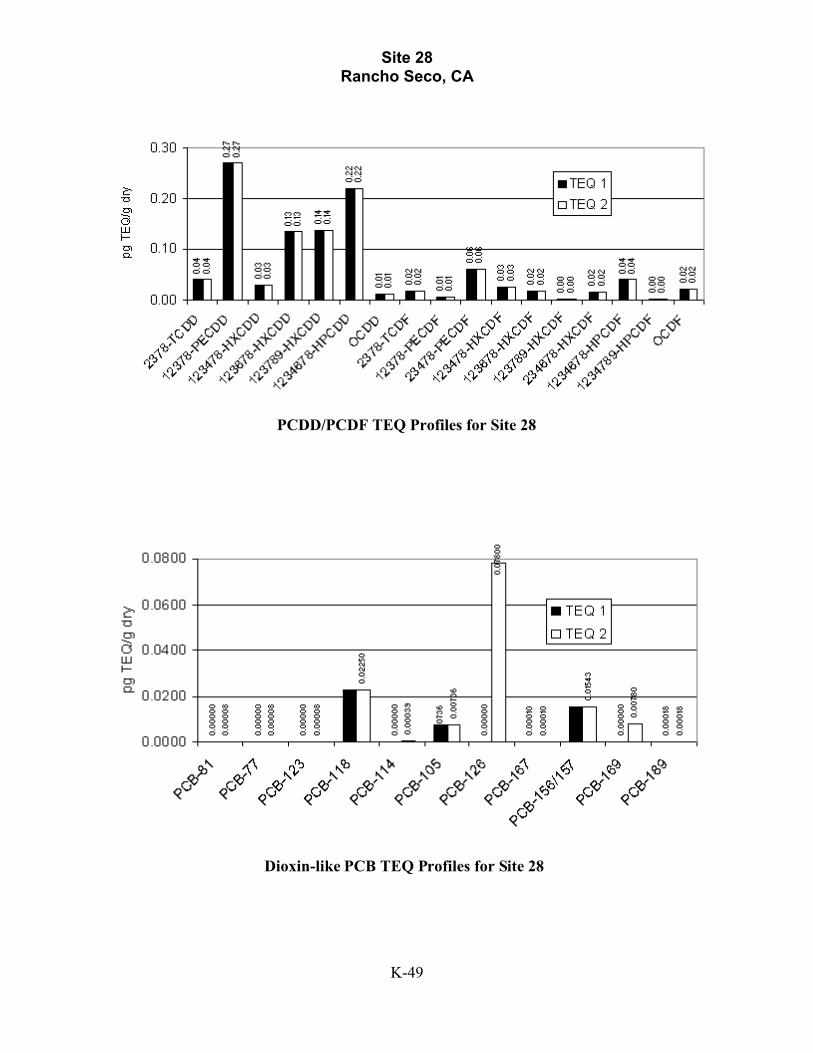
Site 28Rancho Seco, CA
PCDD/PCDF TEQ Profiles for Site 28
Dioxin-like PCB TEQ Profiles for Site 28
K-49

Site 29Marvel Ranch, OR
PCDD/PCDF Concentration Profiles for Site 29
Dioxin-like PCB Concentration Profiles for Site 29
K-50
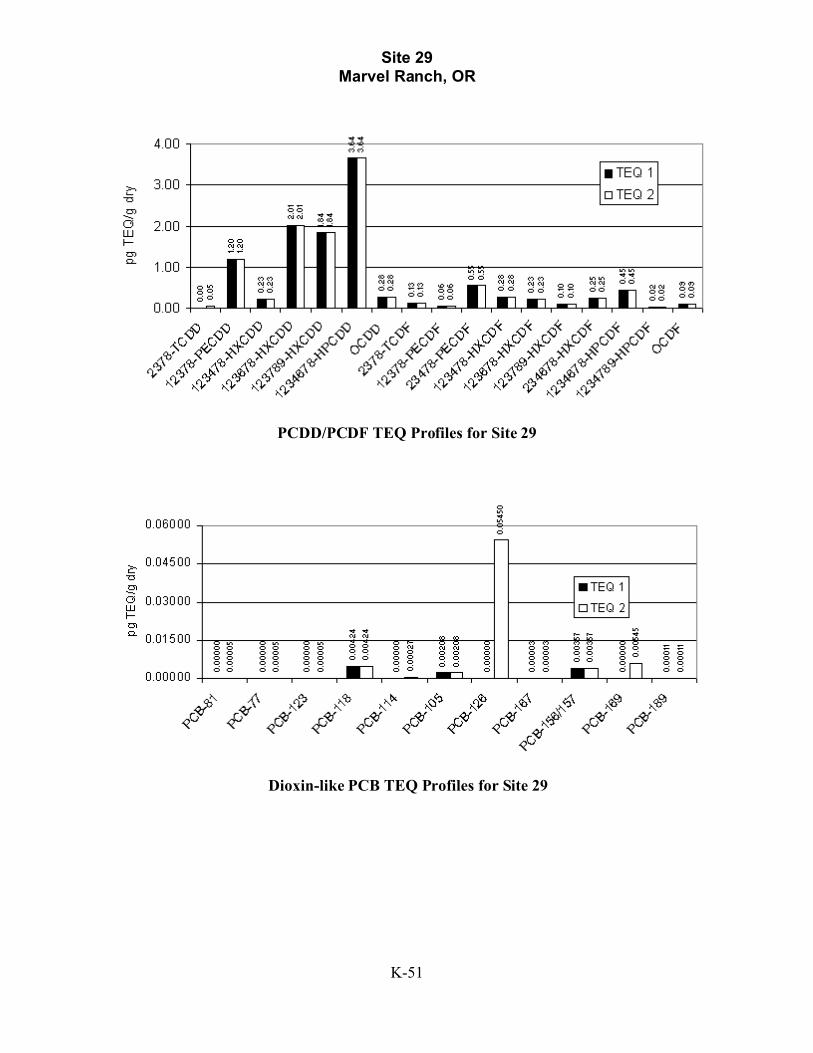
Site 29Marvel Ranch, OR
PCDD/PCDF TEQ Profiles for Site 29
Dioxin-like PCB TEQ Profiles for Site 29
K-51

Site 30Ozette Lake, WA
PCDD/PCDF Concentration Profiles for Site 30
Dioxin-like PCB Concentration Profiles for Site 30
K-52

Site 30Ozette Lake, WA
PCDD/PCDF TEQ Profiles for Site 30
Dioxin-like PCB TEQ Profiles for Site 30
K-53

Site 34Trapper Creek, AK
PCDD/PCDF Concentration Profiles for Site 34
Dioxin-like PCB Concentration Profiles for Site 34
K-54

Site 34Trapper Creek, AK
PCDD/PCDF TEQ Profiles for Site 34
Dioxin-like PCB TEQ Profiles for Site 34
K-55