at the harvard graduate school of education - kenyon … · at the harvard graduate school of...
TRANSCRIPT

COACHE Faculty Job Satisfaction SurveyPROVOST'S REPORT
Kenyon College2015
The Collaborative on Academic Careers in Higher Educationat the Harvard Graduate School of Education

Acknowledgements: Many people and organizations are responsible for making the COACHE project possible. We would especially like to thank the following: The Ford Foundation The Atlantic Philanthropies Harvard Graduate School of Education All of our member institutions Reproduction: No part of this report or its appendices may be reproduced in any form without written permission from the Collaborative on Academic Careers in Higher Education (COACHE), such as that given in a participation agreement signed by representatives of participating institutions and COACHE. Any reproduction of the report material must include a credit line. Contact information: The Collaborative on Academic Careers in Higher Education (COACHE) Harvard Graduate School of Education 8 Story Street, 5th Floor Cambridge, MA 02138 Email: [email protected] URL: http://www.coache.org Voice: 617-495-5285 Fax: 617-496-9350 Copyright © 2015 by The President and Fellows of Harvard College. All Rights Reserved.
The Collaborative on Academic Careers in Higher Education at the Harvard Graduate School of Education
CONTENTS OF YOUR REPORT
Introduction
Preface 3
Guide to your report 5
Results
Response rates and selected comparison institutions 13
Your results at a glance 14
The COACHE dashboard 16
Benchmark dashboards
Nature of work in research, teaching, service 18
Facilities, personal/family policies, benefits and salary 22
Interdisciplinary work, collaboration, and mentoring 24
Tenure and promotion 28
Leadership and governance 32
Departmental collegiality, engagement, and quality 34
Appreciation and recognition 36
Retention and negotiations 38
Best and worst aspects 40
Thematic analysis of open-ended questions 42
Demographic characteristics 44
Appendices
Your COACHE results are in your hands… now what? 49
Background and definitions 55
Participating institutions 59


The Collaborative on Academic Careers in Higher Education at the Harvard Graduate School of Education
The Provost’s Report
INTRODUCTION


The Collaborative on Academic Careers in Higher Education at the Harvard Graduate School of Education
PREFACE
The core strength of an institution of higher education is its faculty. A preponderance of evidence supports the notion that college faculty are affected by their perception of the values and rewards in their workplace, and that supportive environments promote faculty satisfaction, which can lead to a greater commitment to and relationship with their home institution. With this understanding, the Collaborative on Academic Careers in Higher Education (COACHE) at the Harvard Graduate School of Education developed the Tenure-track Faculty Job Satisfaction Survey.
Since 2003, COACHE institutions have used data from this survey to leverage improvements in the workplace for pre-tenure faculty. Meanwhile, COACHE and its research partners have analyzed the data more broadly to understand the themes associated with faculty satisfaction and to contribute to the existing literature on faculty. Perhaps one of the most critical lessons learned in the first few years of COACHE’s development is the role that tenured faculty play as catalysts for the success of pre-tenure faculty. Tenured faculty serve as leaders for campus governance and policy decisions, as mentors to pre-tenure faculty, and as the arbiters of campus culture and climate. Simply put, tenured faculty shape nearly every facet of campus life. To understand them better, COACHE expanded its focus in 2010 to include the design and launch of the Tenured Faculty Job Satisfaction Survey.
After a successful pilot study with seven large research universities, the COACHE team merged the two surveys to create a unified instrument (with appropriate branches) attending to the full spectrum of tenure-stream faculty. In 2012-13, COACHE added an optional survey module to assess the work satisfaction of full-time, non-tenure-track faculty.
COACHE surveys faculty about their experiences and views as regards several important areas of their work lives:
• Research, teaching, service • Resources in support of faculty work • Benefits, compensation, and work/life • Interdisciplinary work and collaboration • Mentoring • Tenure and promotion practices • Leadership and governance • Departmental collegiality, quality, engagement • Appreciation and recognition
We are pleased to provide this diagnostic and comparative management tool for college and university leaders. Tailored to each participating institution, this COACHE report and supplementary materials pinpoint problem areas, whether within a particular policy, practice, or demographic. This benchmarking report identifies the overall performance of your campus compared to your selected comparison institutions, compares subgroups at your campus to subgroups at other campuses, and describes differences between groups on your campus. Thorough, yet accessible, this report is designed to assist faculty and administrators to confront concerns and showcase achievements.
Membership in the Collaborative, however, does not conclude with delivery of this report. Academic leaders use COACHE results to focus attention, spot successes and weaknesses, and then to take concrete steps to make policies and practices more effective and more prevalent. Our mission to make the academy a more attractive place to work is advanced only when supported by institutional action. To that end, COACHE is your partner and a resource for maximizing the ability of your data to initiate dialogue, recruit talented scholars, and further the work satisfaction of all faculty at your institution. For our advice on making the most of your participation, please review the supplementary material provided with this report. Then, contact us with any questions or new ideas that have emerged.
3

4
The Collaborative on Academic Careers in Higher Education at the Harvard Graduate School of Education
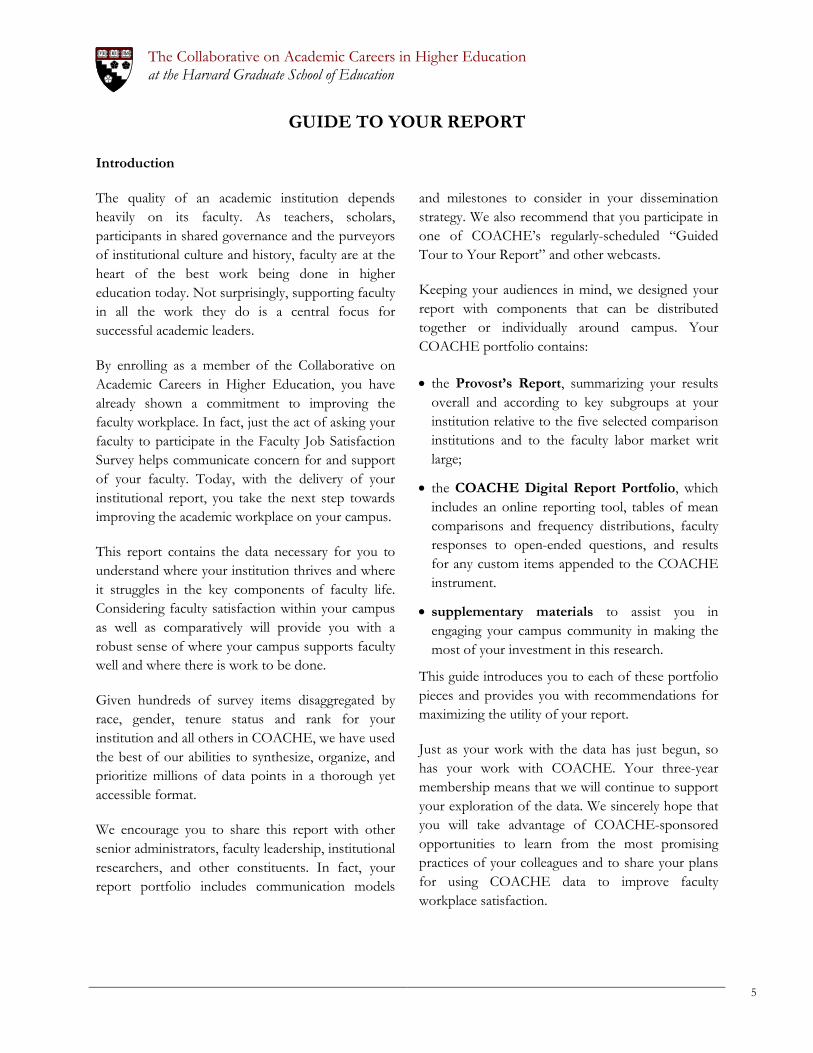
GUIDE TO YOUR REPORT Introduction
The quality of an academic institution depends heavily on its faculty. As teachers, scholars, participants in shared governance and the purveyors of institutional culture and history, faculty are at the heart of the best work being done in higher education today. Not surprisingly, supporting faculty in all the work they do is a central focus for successful academic leaders.
By enrolling as a member of the Collaborative on Academic Careers in Higher Education, you have already shown a commitment to improving the faculty workplace. In fact, just the act of asking your faculty to participate in the Faculty Job Satisfaction Survey helps communicate concern for and support of your faculty. Today, with the delivery of your institutional report, you take the next step towards improving the academic workplace on your campus.
This report contains the data necessary for you to understand where your institution thrives and where it struggles in the key components of faculty life. Considering faculty satisfaction within your campus as well as comparatively will provide you with a robust sense of where your campus supports faculty well and where there is work to be done.
Given hundreds of survey items disaggregated by race, gender, tenure status and rank for your institution and all others in COACHE, we have used the best of our abilities to synthesize, organize, and prioritize millions of data points in a thorough yet accessible format.
We encourage you to share this report with other senior administrators, faculty leadership, institutional researchers, and other constituents. In fact, your report portfolio includes communication models
and milestones to consider in your dissemination strategy. We also recommend that you participate in one of COACHE’s regularly-scheduled “Guided Tour to Your Report” and other webcasts.
Keeping your audiences in mind, we designed your report with components that can be distributed together or individually around campus. Your COACHE portfolio contains:
• the Provost’s Report, summarizing your results overall and according to key subgroups at your institution relative to the five selected comparison institutions and to the faculty labor market writ large;
• the COACHE Digital Report Portfolio, which includes an online reporting tool, tables of mean comparisons and frequency distributions, faculty responses to open-ended questions, and results for any custom items appended to the COACHE instrument.
• supplementary materials to assist you in engaging your campus community in making the most of your investment in this research.
This guide introduces you to each of these portfolio pieces and provides you with recommendations for maximizing the utility of your report.
Just as your work with the data has just begun, so has your work with COACHE. Your three-year membership means that we will continue to support your exploration of the data. We sincerely hope that you will take advantage of COACHE-sponsored opportunities to learn from the most promising practices of your colleagues and to share your plans for using COACHE data to improve faculty workplace satisfaction.
5

Guide to your report
The Provost’s Report Your Provost’s Report is designed to provide the reader with an “at-a-glance” understanding of the views of your faculty with respect to faculty at your comparison institutions and across the sector. It will also help you to see where subgroups of faculty on your campus differ with respect to each other. Understanding the balancing act that senior administrators perform on a daily basis, COACHE designed this report with the goal of providing your campus with top-level analysis and some indicators of where to dig deeper. In other words, it is the best place to start; just keep in mind that much more is available. Response rates and selected comparison institutions In this section, you will find the response rates for your campus, your selected comparison institutions, and the faculty labor market. Disaggregation by tenure status, rank, gender, and race will help you to consider non-response generally and within subgroups of your faculty.
Your results at a glance This single chart summarizes the benchmark results for your institution relative to your selected comparison institutions and the entire cohort of participating institutions. Each column represents the range of institutional means (not the distribution of individual respondents) along that dimension. Within each chart, you can see your institution’s mean score on the benchmark (), the mean scores of your five selected comparison institutions (), and the distribution of the responses of the entire cohort as signified by the red, grey, and green boxes.
You should be most concerned with the placement of your marker (). A score in the red section of the column indicates that your institution ranked in the bottom 30 percent of all institutions. A mark in the green section indicates your faculty rated a benchmark in the top 30 percent of all institutions. A mark in the grey area indicates a middle-of-the-road result.
This combination of your cohort comparison and rank relative to your selected comparison institutions establishes the threshold COACHE uses to identify areas of strength and areas of concern. An area of strength is identified as any benchmark or survey item where your score is in the top two among your selected comparison institutions and in the top 30 percent across all institutions. An area of concern is any benchmark or item where your campus falls in the bottom two among the selected comparison institutions and in the bottom 30 percent compared to the entire survey cohort. This two-step criterion allows you to differentiate between results that are typical of your institutional type and those that are out of the ordinary.
The COACHE Dashboard This data display offers a view of your faculty from 10,000 feet. Each benchmark represents the mean score of several items that share a common theme. Thus, the benchmark scores provide a general sense of how faculty feel about a particular aspect of their work/life. The benchmarks include:
• Nature of work in research, teaching, service • Resources in support of faculty work • Benefits, compensation, and work/life • Interdisciplinary work and collaboration • Mentoring • Tenure and promotion practices • Leadership and governance • Departmental collegiality, quality, engagement • Appreciation and recognition
For each result, your report will use two adjacent triangles () to compare your faculty’s rating to those of your selected comparison institutions (the left ) and the cohort (the right ). Red triangles () indicate an area of concern relative to the comparison group; green triangles () are areas of strength; grey triangles () suggest unexceptional
6

Guide to your report
performance; and empty triangles () signify insufficient data for reporting comparisons.
With this iconography, your dashboard page shows your results relative to your selected comparison institutions and the cohort overall, by tenure status, rank, gender, and race/ethnicity. For example, a finding for females might read , meaning that, compared to women elsewhere, your female faculty’s ratings placed your campus in the top two among your selected comparison institutions and in the bottom 30 percent among all COACHE institutions. Thus, although you are generally doing well against your selected comparators, you and your comparators have room for improvement in women’s attitudes along this dimension.
On the right side of the page are your intra-institutional comparisons, which highlight the meaningful differences between subgroups on your own campus. Here, effect sizes are indicated as small (text appears in cell), moderate (text appears in cell with yellow highlight), and large (text appears in the cell with orange highlight). Trivial differences remain blank. The name of the group with the lower rating appears in the cell to indicate the direction of the difference. Ideally, this section of your report would be blank, suggesting parity across subgroups. (We did not design a typical red/yellow/green signal here because a large difference is not necessarily a poor outcome, but depends, instead, on the context of the result.)
Even if your campus performs well compared to other institutions, large differences between subgroups can suggest a problem. For example, it is quite possible for a campus to perform very well overall on a particular benchmark (or individual item) while still having great disparity based on rank, race, or gender. This is especially true when the number of faculty in a particular subgroup is small. The underrepresented group may be less satisfied, but because their numbers are so small, their concerns may get lost in the overall result.
Benchmark dashboards After reviewing the COACHE Dashboard, you will have a sense of where, generally, your faculty are most satisfied, moderately satisfied, and least satisfied. To understand these benchmarks fully, you must explore the individual items within them. The next pages of your report apply the same organization of data in the COACHE Dashboard to each survey dimension. Using the framework described above, these tables display results for the individual items nested in each benchmark.
For those institutions with prior COACHE data, the tables include comparisons of your new data to your most recent past results. A plus sign (+) indicates improvement since your last survey administration. A minus sign (-) indicates a decline in your score. Change over time is only reported for survey items that have not changed since your prior survey administration. Given the update that occurred to the instrument in 2011-12, many questions do not track perfectly to prior versions of the survey. If the question changed even slightly since the last time it was administered, the data are not reported here. However, please feel free to contact COACHE for help comparing more items in this year’s report to prior years’ reports.
Other displays of data Some questions in the COACHE Survey do not fit into a benchmark. This happens when an item does not use a five-point Likert scale or when the nature of the question does not lend itself to analysis by a central tendency (i.e., a mean). In most of these exceptions, a separate display highlights those results.
The Retention and Negotiation items are such an example: the COACHE Survey asks faculty about their intent to remain at the institution and details about what, if anything, they would renegotiate in their employment contracts. The Provost’s Report includes two pages dedicated to these items.
7

Guide to your report
The Best and Worst Aspects pages are another example of important survey items that do not fit a benchmark factor scale. The survey asks faculty to identify, from a list of common characteristics of the academic workplace, the two best and two worst aspects of working at your institution. The most frequently mentioned “best” and “worst” aspects are highlighted.
Your Provost’s Report also includes COACHE’s Thematic Analysis of Open-ended Questions. The final open-ended question in the survey asks respondents to identify the one thing they feel their institutions could do to improve the workplace for faculty. COACHE reviews all comments, redacts any identifying information, and codes them thematically. This table summarizes those themes by rank and provides comparative data. Note that responses often touch upon multiple themes, so the total number of comments reported in this thematic summary is likely to exceed the actual number of faculty who responded to this question. The complete responses are available in the Excel version of your COACHE Digital Report Portfolio.
Finally, the Demographic Characteristics section includes self-reported background information about respondents’ careers, family status, and other personal qualities. Though most of this information is not used explicitly in our analysis of your results, your online reporting tool (see below) and COACHE staff are available for deeper analysis that deploys these and other survey or institutional variables.
Appendix The Provost’s Report concludes with suggestions in your appendix for taking the next steps in your COACHE campus strategy. The appendix also includes information about COACHE’s methods and definitions, including a list of the colleges and universities that comprise the “All Comparable Institutions” cohort used in your report. That list also includes, separately, the names of institutions that have participated in past rounds of COACHE surveys, for which comparison data (de-identified) are available for subsequent, follow-up analysis.
The COACHE Digital Report Portfolio
Your digital report portfolio includes access to an online tool for survey data analysis and, in both Excel and PDF formats, the Mean Comparisons and Frequency Distributions for all survey results overall, by tenure status, rank, gender, and race/ethnicity. The digital report also includes survey responses to open-ended questions. Use these tools to gain a comprehensive understanding of every result of your survey, to build your own charts or tables, and to tailor your own analyses of the data.
Mean comparisons The mean comparisons are based on results from all survey respondents at your institution, at the five comparison institutions you selected, and at all other institutions participating in this study. For each survey dimension, the mean is the unweighted
arithmetic average of faculty responses on a particular item. Means and standard deviations are provided for your institution overall, for your selected comparison institutions individually and overall, for all comparable institutions overall, and—where population size allows—for groups by tenure status, rank, gender, race/ethnicity (i.e., white faculty or faculty of color), and against prior survey results (if your institution has previously participated in a COACHE survey).* Note that your Digital Report Portfolio also contains these data in Excel format.
* During prior administrations of the COACHE Survey,
means were weighted based on race and gender. Although means are no longer weighted, your prior data remain weighted to maintain consistency with your records.
8

Guide to your report
That file provides additional data hidden in the PDF version, as well as the ability to filter and sort the results.
Frequency distributions As with the mean comparisons, these frequency distribution tables are based on results from all survey respondents at your institution and at all other institutions participating in this study. Provided here are the unweighted counts and percentages of faculty responses on each survey dimension. We provide comparisons overall and between the same sub-groups identified in the mean comparisons (i.e., by tenure status, rank, gender, race/ethnicity, and over time).
A note on interpreting means and frequencies Relative frequencies of responses for each item can provide crucial information not given by the mean score alone. While a group’s mean score gives valuable information about the group’s central tendency, the frequency can tell you the extent to which the group is polarized in their responses. For example, consider two hypothetical cases: Case #1: Half of a group of pre-tenure faculty chose
“Very dissatisfied” (1) on a 5-point scale, and half chose “Very satisfied” (5);
Case #2: Every respondent in the group chose “Neither satisfied nor dissatisfied” (3).
In both cases, the mean score is 3.0; however, whereas in the second case the mean reflects individuals’ attitudes perfectly, in the first case, the mean value (“Neither satisfied nor dissatisfied”) does not actually reflect the attitude of anyone in the group. Rather, these respondents seem to be made up of two sub-groups with very different attitudes. It is important to take into account the polarization of scores when considering major policy changes in order to accurately anticipate how faculty members will be affected.
Open-ended responses This portion of your report lists the comments written by your faculty in response to open-ended questions, including the final survey item, which states, “Please use the space below to tell us the number one thing that you, personally, feel your institution could do to improve the workplace.” These results, coded by themes and ranks, are also available in Excel format.
Results of custom questions (if applicable) For institutions that appended additional, custom questions to the COACHE survey, the results are displayed here in cross-tabulations and/or open-ended narrative. Online reporting tool COACHE is currently in the development of a new online reporting tool. Members in the 2015 Cohort will have access to this tool in 2016.
Supplementary material Your digital repository also includes supporting material to help you contextualize your results and to consider policies and practices in response.
• The COACHE Survey Instrument
• Your Results in Context compiles in one document the explanatory pages that accompany the Benchmark Dashboards in your Provost’s Report, but includes also a list of seminal readings.
• A review of potential Communication Models and Milestones may help you design a dissemination and engagement strategy around COACHE at your institution.
• A folder of Suggested Readings includes an array of COACHE’s prior reports, research, and other materials to support your efforts to make the most of your investment in this project.
9
Guide to your report
10

The Collaborative on Academic Careers in Higher Education at the Harvard Graduate School of Education
The Provost’s Report
RESULTS
11

12

The Collaborative on Academic Careers in Higher EducationFaculty Job Satisfaction Survey 2015
RESPONSE RATES AND COMPARATORS
Kenyon College
overall tenuredpre-
tenure full assoc men women whitefaculty of
colorpopulation 156 131 25 79 52 90 66 117 39
responders 98 82 16 52 30 52 46 76 22response rate 63% 63% 64% 66% 58% 58% 70% 65% 56%
population 871 702 169 418 286 493 378 710 159responders 565 442 123 270 175 304 261 464 100
response rate 65% 63% 73% 65% 61% 62% 69% 65% 63%population 3996 3115 881 1694 1435 2221 1775 3098 873
responders 2553 1948 605 1054 908 1338 1215 2045 504response rate 64% 63% 69% 62% 63% 60% 68% 66% 58%
SELECTED COMPARISON INSTITUTIONS
CHANGE OVER TIME
2011 2008
You selected five institutions as peers against whom to assess your COACHE Survey results. The results at these institutions are included throughout this report in the aggregate or, when cited individually, in random order. Your peer institutions are:
Kenyon College
Selected peers
All
Note: Due to some missing gender and race/ethnicity data, the numbers of males and females, and of white faculty and faculty of color, may not sum to the total populations.
If your institution participated in a previous administration of the COACHE Faculty Job Satisfaction Survey, this report will show change over time for any questions that have remained unchanged. For campuses with multiple years of comparative data, users may toggle between cohort years by using the Criteria tab of the Excel report.
Connecticut CollegeHamilton CollegeMiddlebury CollegeSkidmore CollegeSt. Olaf College
13

This chart summarizes over a half million data points in benchmark results for your institution relative to peers and the full cohort of COACHE’s participating institutions.
Each column represents the range of institutional means (not the distribution of individual respondents) along that dimension. Within each chart, you can see your institution’s mean score on the benchmark (), the mean scores of your five peers (O), and the distribution of the responses of the entire cohort of institutions as signified by the red, grey, and green boxes.
You should be most concerned with the placement of your marker (). A score in the red section of the column indicates that your institution ranked in the bottom 30 percent of all institutions. A mark in the green section indicates your faculty rated a benchmark in the top 30 percent of all institutions. A mark in the grey area indicates a “middle-of-the-road” result.
COACHEResults at a Glance
top 30%of institutions
middle 40%of institutions
bottom 30%of institutions
your institutionselected peers
Mentoring
5.0
4.0
3.0
2.0
1.0
cohort mean
14

The Collaborative on Academic Careers in Higher EducationFaculty Job Satisfaction Survey 2015
COACHE RESULTS AT A GLANCE
Kenyon College
1.0
1.5
2.0
2.5
3.0
3.5
4.0
4.5
5.0
Nat
ure
of w
ork:
Res
earc
h
Nat
ure
of w
ork:
Ser
vice
Nat
ure
of w
ork:
Tea
chin
g
Faci
litie
s an
d w
ork
reso
urce
s
Per
sona
l and
fam
ily p
olic
ies
Hea
lth a
nd re
tirem
ent b
enef
its
Inte
rdis
cipl
inar
y w
ork
Col
labo
ratio
n
Men
torin
g
Tenu
re p
olic
ies
Tenu
re c
larit
y
Pro
mot
ion
Lead
ersh
ip: S
enio
r
Lead
ersh
ip: D
ivis
iona
l
Lead
ersh
ip: D
epar
tmen
tal
Dep
artm
enta
l col
legi
ality
Dep
artm
enta
l eng
agem
ent
Dep
artm
enta
l qua
lity
App
reci
atio
n an
d re
cogn
ition
15

Here, the faculty subgroup with the lower rating appears. Shading conveys the magnitude of sub-group di�erences: small e�ects appear as text only, moderate e�ects are shaded yellow, and large e�ects are shaded orange. Trivial di�erences remain blank. Change over time appears as +/-.
Regardless of your results compared to peers and others (on the left), you should direct your concern to subgroups who consistently appear here in yellow or orange shaded cells.
mean overall tenured pre-ten full assoc men women white foc tenure rank gender race prior
Health and retirement benefits 3.43 pre-ten full women focInterdisciplinary work 3.00 pre-ten assoc women whiteCollaboration 3.46 tenured full women whiteMentoring 3.18 tenured assoc men focTenure policies 3.64 N/A N/A N/A N<5 N/A N/A women N<5Tenure clarity 3.33 N/A N/A N/A N<5 N/A N/A men
This is theoverall score
(between 1 and 5) for all facultyrespondents
at your institution.
These columns describe how your faculty’s responses compare to similar faculty at other
COACHE institutions: tenured vs. tenured, men vs. men, faculty of color
vs. faculty of color, etc.
These columns comparegroups on your campus:
pre-tenure/tenured, associate/full, women/men,
white/faculty of color.
What do these triangles mean?These symbols represent results that �t COACHE’s criteria (adjustable in Excel) for “areas of strength” (in green) and “areas of concern” (in red).
Your ranking among peers: 1st or 2nd 3rd or 4th 5th or 6th
Your percentile among all members: Top 30% Middle 40% Bottom 30%
women
This result, for example, shows that your female faculty are less satis�ed than are women at your peers (), but moresatis�ed than are women at 70% of other institutions (). Although the women at your institution are “less satis�ed” than women at peers, they still fare better than most.
assoc And these results?
COACHEDashboardGuide
insu�cient data for reporting
2008
+
16
The Collaborative on Academic Careers in Higher EducationFaculty Job Satisfaction Survey 2015
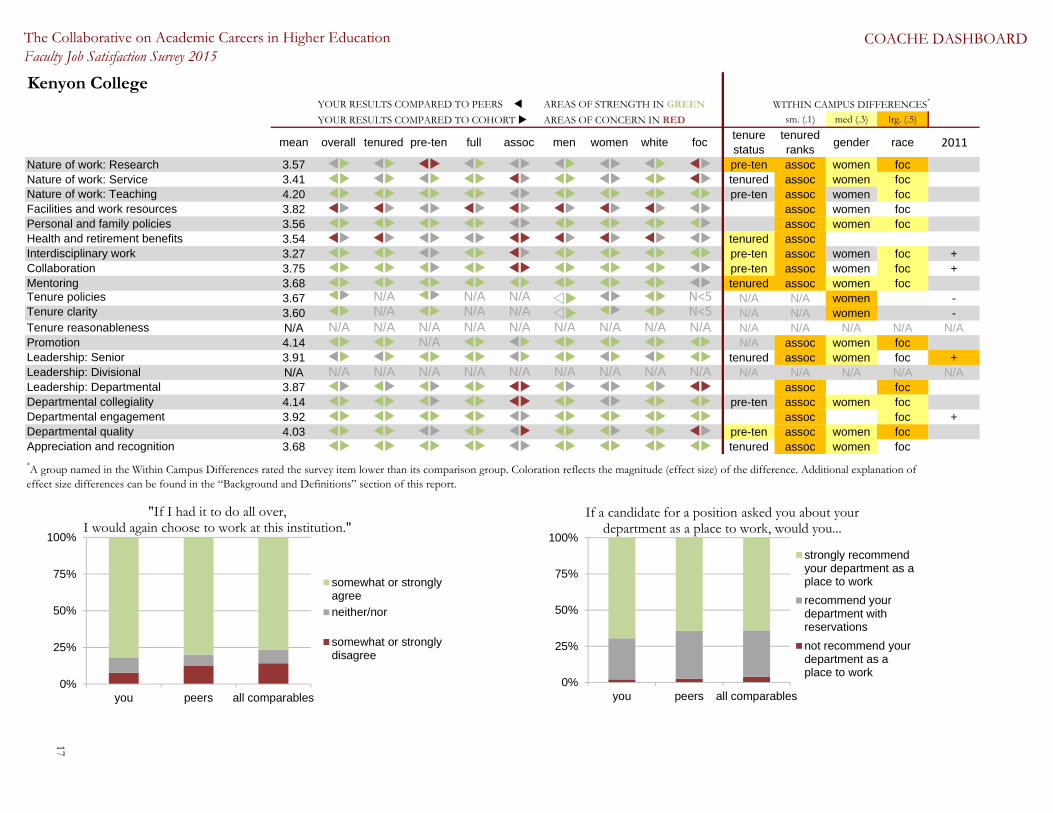
COACHE DASHBOARD
Kenyon CollegeYOUR RESULTS COMPARED TO PEERS AREAS OF STRENGTH IN GREEN
YOUR RESULTS COMPARED TO COHORT AREAS OF CONCERN IN RED sm. (.1) med (.3) lrg. (.5)
mean overall tenured pre-ten full assoc men women white foc tenure status
tenured ranks gender race 2011
Nature of work: Research 3.57 pre-ten assoc women focNature of work: Service 3.41 tenured assoc women focNature of work: Teaching 4.20 pre-ten assoc women focFacilities and work resources 3.82 assoc women focPersonal and family policies 3.56 assoc women focHealth and retirement benefits 3.54 tenured assocInterdisciplinary work 3.27 pre-ten assoc women foc +Collaboration 3.75 pre-ten assoc women foc +Mentoring 3.68 tenured assoc women focTenure policies 3.67 N/A N/A N/A N<5 N/A N/A women N<5 -Tenure clarity 3.60 N/A N/A N/A N<5 N/A N/A women N<5 -Tenure reasonableness N/A N/A N/A N/A N/A N/A N/A N/A N/A N/A N/A N/A N/A N/A N/APromotion 4.14 N/A N/A assoc women focLeadership: Senior 3.91 tenured assoc women foc +Leadership: Divisional N/A N/A N/A N/A N/A N/A N/A N/A N/A N/A N/A N/A N/A N/A N/ALeadership: Departmental 3.87 assoc focDepartmental collegiality 4.14 pre-ten assoc women focDepartmental engagement 3.92 assoc foc +Departmental quality 4.03 pre-ten assoc women focAppreciation and recognition 3.68 tenured assoc women foc*A group named in the Within Campus Differences rated the survey item lower than its comparison group. Coloration reflects the magnitude (effect size) of the difference. Additional explanation of effect size differences can be found in the “Background and Definitions” section of this report.
WITHIN CAMPUS DIFFERENCES*
0%
25%
50%
75%
100%
you peers all comparables
"If I had it to do all over,I would again choose to work at this institution."
somewhat or stronglyagreeneither/nor
somewhat or stronglydisagree
0%
25%
50%
75%
100%
you peers all comparables
If a candidate for a position asked you about your department as a place to work, would you...
strongly recommendyour department as aplace to workrecommend yourdepartment withreservationsnot recommend yourdepartment as aplace to work
17

The Collaborative on Academic Careers in Higher Education at the Harvard Graduate School of Education
Your Findings in Context
Nature of Work: Research
Guiding Principles Faculty satisfaction with research is a function not just of the time faculty members have to commit to research, but importantly, of the clarity and consistency of institutional expectations for research productivity and the resources colleges and universities provide faculty to meet them. When faculty are criticized for falling short of others’ expectations for research, consider the demands, obstacles, mixed signals, and lack of meaningful support that may be undermining their ability to do their best work.
The COACHE instrument invites faculty to assess the environmental qualities conducive to research productivity. The questions are designed to be agnostic on institutional type (e.g., research university, liberal arts college) and research area (in the disciplines, creative work, the scholarship of teaching and learning). It is in the analysis where participating colleges and universities can determine whether faculty feel they are being supported in fulfilling the expectations of them.
Hallmarks of Successful Models If your institution is serious about supporting faculty research and creativity, then be prepared to commit to the essential elements of success:
Leadership on research support comes from the top. C-level leadership in stressing the importance of excellence in research is critical substantively and symbolically. This means that resources directed at supporting faculty work—across the creative lifecycle—are crucial, as is the messaging that goes along with the financial support.
Formal offices and programs energetically support faculty research. Visibly dedicating resources to support faculty work clearly demonstrates how important faculty members are to institutional success. Our studies identified the following areas of focus for full-time college staff:
Grant support. Many universities offer pre-award support to faculty preparing proposals for outside
funding. What is less common, but equally important, is post-award support.
Internal grants. Faculty are grateful for internal funding, even in small amounts. Well-designed programs can foster interdivisional collaboration, extramural mentoring, and other innovations.
Research institutes. Such institutes may be a source of internal grant support, but even more, they are places where faculty find collaborators and inspiration.
Colloquia, workshops, and seminars. All faculty, and especially pre-tenure faculty, appreciate opportunities to present their research at colloquia on campus, receive feedback, and fine-tune their work prior to presenting at a national conference. Workshops and seminars for writing grants, running a lab, getting published, mentoring undergraduates and graduates, getting tenure and “getting to full” are all programs that support fulfilling collaboration and engagement.
Nature of Work: Teaching
Guiding Principles Among the core areas of faculty work explored by the COACHE survey, teaching—and the supports institutions provide faculty to teach well—is bound by significant constraints, but also by great opportunities. The challenge for every faculty member is to strike a balance between institutional expectations for teaching and the time and ability available to invest in it.
Dissatisfaction can occur when expectations for teaching are unreasonable or contrary to what faculty were promised at the point of hire, when institutional support is lacking, or when the distribution of work is inequitable. Time is the common denominator: if expectations for teaching outstrips the time available to meet them, morale and productivity can suffer.
When considering COACHE results on this benchmark, keep in mind that our instrument measures not teaching load, but faculty satisfaction with teaching load. While reducing teaching load is often “off the table” as a short-term fix, increasing faculty satisfaction with teaching load can be accomplished through workshops and seminars
18

Your Findings in Context
about improving teaching, mentoring students, using instructional technologies, and experimenting with new pedagogical techniques. These opportunities may be housed in centers of teaching and learning (or of “faculty success” or “faculty excellence”), where other resources and advice are dispensed by seasoned experts. The implementation of and communication about these supports can increase faculty satisfaction with the nature of teaching.
Hallmarks of Successful Models Most COACHE institutions with exemplary results on this benchmark had a number of qualities in common. They make expectations for teaching clear from the point of hire. They recruit faculty with a demonstrated devotion to teaching. They ensure that faculty members have a say in which courses they teach and in their content. They offer grants for pedagogical development and innovation, usually through a center for teaching. They also recognize excellence in the classroom through prestigious and substantive awards (e.g., for exemplary teaching informed by creative scholarship, or for outstanding teaching in the humanities) given in public (e.g., at mid-court during a basketball game).
Nature of Work: Service
Guiding Principles Among the top three responsibilities of the tenure-stream faculty—but almost always the third—service is infused in the ethos of shared governance and the DNA of faculty life. In COACHE focus groups, faculty included in their definition of their most “vital” colleagues an engagement in service to the discipline and university. Yet, tenured faculty expressed their dissatisfaction with their service work: too many committees doing unfulfilling work, too many reports sitting unread on administrators’ shelves, and too many good soldiers picking up the slack of faculty colleagues who, whether by influence or incompetence, seem always to evade service commitments. Meanwhile, college and universities are often encouraged as a best practice to “protect” pre-tenure faculty from too many time commitments outside of the teaching and research
that will make their tenure case. The aggregate result is a gulf between institutional expectations for service and the recognition it receives in evaluations of faculty.
The COACHE survey instrument invites faculty to explore these tensions with questions about the quantity, quality, and equitable distribution of their service work broadly defined, as well as their institutions’ efforts to help faculty be service leaders and sustain their other commitments as faculty. In follow-up interviews with faculty and institutional leaders, a common refrain emerged: faculty are eager to participate not in more service, but in more meaningful service, and we must do better to engage and to reward those contributions.
Hallmarks of Successful Models Colleges and universities with faculty satisfied with service consistently cited institutional mission and culture in explaining their results. Among these exemplars were land-grant universities committed to fostering a service-oriented culture; religiously-affiliated colleges with an explicit service mission; comprehensive colleges with strong ties with the local community; and former normal schools whose minority-serving mission is inextricable from its faculty’s ethic of care. So, institutions struggling with service might do well to explore, engage, and elaborate their mission and historical circumstances—above and beyond the usual website boilerplate—as the foundation of an ethos of service.
College leaders cited other commitments as the basis for ensuring faculty satisfaction with service. Most communicate expectations regarding service through a number of avenues including handbooks, guidelines for mentoring, workshops, orientations, and reviews. It is also common practice to provide course release time for taking on leadership roles and to keep the service commitments of tenure-track faculty few (but not zero), particularly at the college and university level, and to make certain what commitments are required are meaningful.
For practical-minded inspiration from COACHE members with high ratings in the Nature of Work, read our Benchmark Best Practices white papers.
19

The Collaborative on Academic Careers in Higher Education at the Harvard Graduate School of Education
This page intentionally left blank
20

The Collaborative on Academic Careers in Higher EducationFaculty Job Satisfaction Survey 2015
NATURE OF WORK:RESEARCH, SERVICE, TEACHING
Kenyon CollegeYOUR RESULTS COMPARED TO PEERS AREAS OF STRENGTH IN GREEN
YOUR RESULTS COMPARED TO COHORT AREAS OF CONCERN IN RED sm. (.1) med (.3) lrg. (.5)
mean overall tenured pre-ten full assoc men women white foc tenure status
tenured ranks gender race 2011
Benchmark: Nature of Work Research 3.57 pre-ten assoc women focTime spent on research 2.88 pre-ten assoc women foc N/AExpectations for finding external funding 3.85 tenured assoc women focInfluence over focus of research 4.49 pre-ten assoc women foc -Quality of grad students to support research N/A N/A N/A N/A N/A N/A N/A N/A N/A N/A N/A N/A N/A N/A N/ASupport for research 3.79 assoc women foc +Support for engaging undergrads in research 3.53 tenured assoc womenSupport for obtaining grants (pre-award) 3.23 pre-ten assoc foc -Support for maintaining grants (post-award) 3.57 pre-ten assoc women foc +Support for securing grad student assistance N/A N/A N/A N/A N/A N/A N/A N/A N/A N/A N/A N/A N/A N/A N/ASupport for travel to present/conduct research 3.98 tenured assoc women foc +Availability of course release for research 2.74 pre-ten assoc women focBenchmark: Nature of Work: Service 3.41 tenured assoc women focTime spent on service 3.30 tenured assoc women focSupport for faculty in leadership roles 2.93 pre-ten assoc womenNumber of committees 3.57 tenured assoc womenAttractiveness of committees 3.57 tenured assoc focDiscretion to choose committees 4.00 tenured assoc women focEquitability of committee assignments 3.14 tenured assoc women focNumber of student advisees 3.68 tenured assoc focBenchmark: Nature of Work: Teaching 4.20 pre-ten assoc women focTime spent on teaching 4.18 pre-ten assoc women focNumber of courses taught 3.92 pre-ten assoc women focLevel of courses taught 4.23 pre-ten assoc women focDiscretion over course content 4.59 assoc men foc -Number of students in classes taught 4.26 pre-ten assoc -Quality of students taught 4.44 assoc men focEquitability of distribution of teaching load 3.71 tenured assoc women focQuality of grad students to support teaching N/A N/A N/A N/A N/A N/A N/A N/A N/A N/A N/A N/A N/A N/A N/ARelated survey itemsTime spent on outreach 3.49 assoc women focTime spent on administrative tasks 3.00 tenured assoc white +Ability to balance teaching/research/service 3.21 pre-ten assoc women foc
WITHIN CAMPUS DIFFERENCES*
*A group named in the Within Campus Differences rated the survey item lower than its comparison group. Coloration reflects the magnitude (effect size) of the difference. Additional explanation of effect size differences can be found in the “Background and Definitions” section of this report.
21
The Collaborative on Academic Careers in Higher Education at the Harvard Graduate School of Education
Your Findings in Context
Facilities & Work Resources, Personal & Family Policies, and Health & Retirement Benefits Guiding Principles Facilities and support. COACHE found a number of facets of the physical workplace for faculty to be especially important to faculty satisfaction, including office, lab, research or studio space, equipment, and classrooms. In addition, many faculty need support for technology, administrative work, and improvements to teaching.
Personal and family policies. The COACHE survey measures faculty beliefs about the effectiveness of various policies—many of them related to work-family balance and support for families. This is especially important because more than two-thirds of COACHE respondents are married; three-fifths, half, and one-third of assistant, associate, and full professors, respectively, have children under the age of 18. In addition, more than one in 10 professors are providing care for an elderly, disabled, or ill family member.
Health and retirement benefits. Health benefits, once a given, have been steadily eroding as the costs of insurance skyrocket, and many faculty put their retirements on hold in the wake of the recent economic recession. To encourage timely retirements, phased programs have become more prevalent. Some allow individuals to enjoy institutional affiliation, intellectual engagement, and contact with students and colleagues, while the institutions realize salary savings and more reliable staffing projections.
Hallmarks of Successful Models Analysis of our survey identified partner institutions whose faculty rated these themes exceptionally well. Here’s what we learned from them:
When it comes to facilities, new is nice but equity is best. Faculty understand that not everyone can have a brand new office or lab because campuses must invest in different areas over time, but everyone should enjoy
equity in the distribution of resources and space within a department.
Hire personnel to staff work-life services. This is important not only to get the job done but also for symbolic reasons. Putting physical resources behind your words signifies meaning beyond the rhetoric. It is unlikely that universities will need fewer personnel in the future to attend to these matters.
Have written policies. Platitudes that “This is a family-friendly place” or “There’s plenty of work-life balance here” are no longer enough. In addition to assuring pre-tenure faculty that the institution is doing more than just paying lip-service to work-life balance, written policies provide clarity, consistency, and transparency which leads to greater fairness and equity. Written policies concerning dual-career hiring; early promotion and tenure; parental leave; modified duties; part-time tenure options; and stop-the-tenure-clock provision are also indicators of how family-friendly a campus actually is.
Ensure that written policies are communicated to everyone—pre-tenure and tenured faculty members, chairs, heads, and deans. COACHE research indicates that written policies are particularly important to women and under-represented minorities. Make certain the policies are easily accessible online, and provide personnel to assist faculty in choosing the right healthcare option.
Provide additional accommodations: Childcare, eldercare, lactation rooms, flexibility, and opportunities for social occasions in which kids can be included are all relevant practices that help ensure a viable workplace for the future. Communicating their availability is critical.
Offer phased retirement for faculty to ease into retirement gradually. At the same time, institutions have the flexibility to fill the void left by retiring faculty more easily. Retiring faculty can continue their contributions to the institution by developing the teachers, scholars, and leaders who follow them.
22
The Collaborative on Academic Careers in Higher EducationFaculty Job Satisfaction Survey 2015
FACILITIES, PERSONAL/FAMILY POLICIES,BENEFITS, AND SALARY
Kenyon CollegeYOUR RESULTS COMPARED TO PEERS AREAS OF STRENGTH IN GREEN
YOUR RESULTS COMPARED TO COHORT AREAS OF CONCERN IN RED sm. (.1) med (.3) lrg. (.5)
mean overall tenured pre-ten full assoc men women white foc tenure status
tenured ranks gender race 2011
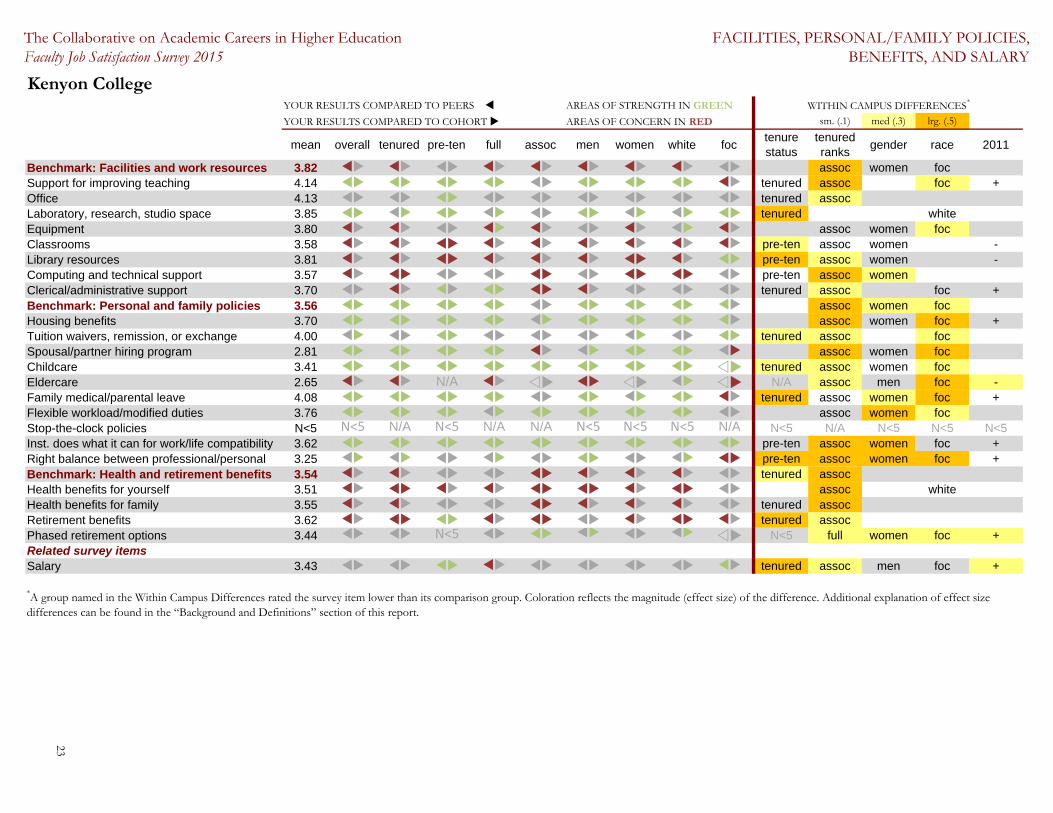
Benchmark: Facilities and work resources 3.82 assoc women focSupport for improving teaching 4.14 tenured assoc foc +Office 4.13 tenured assocLaboratory, research, studio space 3.85 tenured whiteEquipment 3.80 assoc women focClassrooms 3.58 pre-ten assoc women -Library resources 3.81 pre-ten assoc women -Computing and technical support 3.57 pre-ten assoc womenClerical/administrative support 3.70 tenured assoc foc +Benchmark: Personal and family policies 3.56 assoc women focHousing benefits 3.70 assoc women foc +Tuition waivers, remission, or exchange 4.00 tenured assoc focSpousal/partner hiring program 2.81 assoc women focChildcare 3.41 tenured assoc women focEldercare 2.65 N/A N/A assoc men foc -Family medical/parental leave 4.08 tenured assoc women foc +Flexible workload/modified duties 3.76 assoc women focStop-the-clock policies N<5 N<5 N/A N<5 N/A N/A N<5 N<5 N<5 N/A N<5 N/A N<5 N<5 N<5Inst. does what it can for work/life compatibility 3.62 pre-ten assoc women foc +Right balance between professional/personal 3.25 pre-ten assoc women foc +Benchmark: Health and retirement benefits 3.54 tenured assocHealth benefits for yourself 3.51 assoc whiteHealth benefits for family 3.55 tenured assocRetirement benefits 3.62 tenured assocPhased retirement options 3.44 N<5 N<5 full women foc +Related survey itemsSalary 3.43 tenured assoc men foc +
WITHIN CAMPUS DIFFERENCES*
*A group named in the Within Campus Differences rated the survey item lower than its comparison group. Coloration reflects the magnitude (effect size) of the difference. Additional explanation of effect size differences can be found in the “Background and Definitions” section of this report.
23
The Collaborative on Academic Careers in Higher Education at the Harvard Graduate School of Education
Your Findings in Context
Interdisciplinary Work and Collaboration Guiding Principles Interdisciplinary Work. First, universities (and also many liberal arts colleges) have seen widespread growth in research collaboration within and between institutions and with off-campus partners. Although not exclusively the province of the sciences, interdisciplinary research has become the predominant model there. Second, public and private funding for interdisciplinary research has increased. Third, there is a great deal of interest and intrinsic motivation for researchers to cross-fertilize; this type of work attracts many graduate students and early-career faculty. However, because the academy has not yet fully embraced interdisciplinary work, unchanged policies, structures and cultures are institutional disincentives, as they are still best-suited to narrower work within disciplines. This includes publication vehicles, multiple authors, peer review, and reward structures (for promotion and tenure; merit pay; incentives), to name a few.
Collaboration. Despite a popular perception of faculty as soloists, most faculty work requires collaboration whether with students, peers, administrators, or other colleagues inside and outside of the institution, in the classroom or the lab, and with the broader community through service or outreach programs. Although many faculty members value the work they do independently, they also enjoy collaborative projects within and across their disciplines. In addition, many early career faculty members report an expectation for collaboration, having come to enjoy and expect such intellectual commerce during graduate school.
Hallmarks of Successful Models Leading institutions on these benchmarks openly consider among faculty and administrative leaders the salience and importance of interdisciplinarity to their campuses, including the variety of forms such work can take. These may include:
• cross-fertilization, when individuals make cognitive connections among disciplines;
• team-collaboration, when several individuals spanning different fields work together;
• field creation, when existing research domains are bridged to form new disciplines or sub-disciplines at their intersection; and
• problem orientation, when researchers from multiple disciplines work together to solve a ‘real world’ problem.
If interdisciplinary work is important on your campus, discuss and potentially remove the barriers to its practice. The common obstacles to interdisciplinary work extend beyond the disciplinary criteria for promotion and tenure to include also discipline-based budgets and environmental limitations such as space and facilities.
Likewise, discuss the importance of teaching and research collaborations on your campus and the factors that enhance or inhibit it; then determine ways to remove the barriers.
Mentoring
Guiding Principles Mentoring has always been important in the academic workplace. Only in recent years, however, has the practice evolved more widely from incidental to intentional as academic leaders have come to appreciate that mentorship is too valuable to be left to chance.
Many pre-tenure faculty members feel mentoring is essential to their success, but such support is also instrumental for associate professors on their path to promotion in rank. While some institutions rely on the mentor-protégé approach (a senior faculty member formally paired with a junior faculty member), new models encourage mutual mentoring (where faculty members of all ages and career stages reap benefits), team mentoring (a small group approach), and strategic collaborations (in which faculty members build networks beyond their departments and colleges).
24
Your Findings in Context
Hallmarks of Successful Models COACHE partners who are high performers on the mentoring benchmark follow some or all of the following guidelines:
Ensure mentoring for assistant and associate professors.
Promote the mutual benefits for mentee and mentor alike: mentees learn the ropes, collect champions and confidants, and enjoy a greater sense of “fit” within their departments. Mentors feel a greater sense of purpose, even vitality, through these relationships.
Mentoring should meet individuals’ needs, so make no “silver bullet” assumptions about what type of mentoring faculty will want (or even if they will want it at all). Instead, provide multiple paths to mentors on faculty’s own terms.
Transparency is important, especially to women and faculty of color. Therefore, written, department-sensitive guidelines help both mentors and mentees.
For underrepresented faculty groups, finding a mentor with a similar background can be vital to success, yet difficult to find in some disciplines. Support mentoring networks beyond the department and division by reaching out to other institutions (e.g., through a consortium or system).
If possible, reward mentors through stipends, course releases, or other avenues of recognition (examples are available in Benchmark Best Practices: Appreciation & Recognition).
Evaluate the quality of mentoring. Both mentors and mentees should be part of the evaluative process. COACHE results can be used to frame the conversation.
For practical-minded inspiration from COACHE members with high ratings in Interdisciplinary Work, Collaboration, and Mentoring, read our Benchmark Best Practices white papers.
25

The Collaborative on Academic Careers in Higher EducationFaculty Job Satisfaction Survey 2015
INTERDISCIPLINARY WORK, COLLABORATION, AND MENTORING
Kenyon College
YOUR RESULTS COMPARED TO PEERS AREAS OF STRENGTH IN GREEN
YOUR RESULTS COMPARED TO COHORT AREAS OF CONCERN IN RED sm. (.1) med (.3) lrg. (.5)
mean overall tenured pre-ten full assoc men women white foc tenure status
tenured ranks gender race 2011
Benchmark: Interdisciplinary work 3.27 pre-ten assoc women foc +Budgets encourage interdiscip. work 2.98 assoc focFacilities conducive to interdiscip. work 2.94 pre-ten assoc women focInterdiscip. work is rewarded in merit 3.43 pre-ten assoc women focInterdiscip. work is rewarded in promotion 3.51 N/A N/A assoc women foc +Interdiscip. work is rewarded in tenure 3.14 N/A N/A N/A N<5 N/A N/A N/A N<5 N/A -Dept. knows how to evaluate interdiscip. work 3.71 pre-ten assoc women foc +Benchmark: Collaboration 3.75 pre-ten assoc women foc +Opportunities for collab. within dept. 3.76 pre-ten assoc women focOpportunities for collab. outside dept. 3.72 pre-ten assoc women foc +Opportunities for collab. outside inst. 3.78 pre-ten assoc women +Benchmark: Mentoring 3.68 tenured assoc women focEffectiveness of mentoring within dept. 4.07 tenured assoc women foc +Effectiveness of mentoring outside dept. 4.01 tenured +Mentoring of pre-tenure faculty 3.87 pre-ten assoc women foc -Mentoring of associate faculty 2.97 N/A N/A assoc women focSupport for faculty to be good mentors 3.10 N/A N/A assoc women focBeing a mentor is fulfilling 4.15 N/A N/A assoc women focRelated survey itemsImportance of mentoring within dept. 4.40 tenured full +Importance of mentoring outside dept. 4.05 tenured full white +Importance of mentoring outside inst. 3.88 tenured men white +Effectiveness of mentoring outside the inst. 3.92 tenured men white +
WITHIN CAMPUS DIFFERENCES*
*A group named in the Within Campus Differences rated the survey item lower than its comparison group. Coloration reflects the magnitude (effect size) of the difference. Additional explanation of effect size differences can be found in the “Background and Definitions” section of this report.
26

The Collaborative on Academic Careers in Higher EducationFaculty Job Satisfaction Survey 2015
INTERDISCIPLINARY WORK, COLLABORATION, AND MENTORING
79% 10% 7%0%
somewhat or very effective neither/nor have not received somewhat or very ineffective
75%
100%
full assoc men women white foc
% of respondents who report serving asa mentor in the past five years
you peers all
71%
0%
25%
50%
pre-ten assoc men women white foc
% of respondents reporting s/he has not received mentoring withinthe department% of respondents reporting s/he has not received mentoring outsidethe department at this institution
79%
% faculty rating mentoring from outside
inst. as important
83% 3% 1% 8%
90%
78% 9% 5%4%
% faculty rating mentoring from within dept. as
important
% faculty rating mentoring from outside
dept. as important
Effectiveness of mentoring for those faculty who rated mentoring as important
0% 25% 50% 75% 100%
pre-tenure faculty
associate faculty
non-tenure track faculty
pre-tenure faculty
associate faculty
non-tenure track faculty
outs
ide
the
depa
rtmen
tw
ithin
the
depa
rtmen
t
Whom are the mentors mentoring?
you peers all
27

The Collaborative on Academic Careers in Higher Education at the Harvard Graduate School of Education
Your Findings in Context
Tenure & Promotion Guiding Principles Tenure. Administrators and faculty alike acknowledge that, at most institutions, the bar to achieve tenure has risen over time. While it is impossible to eliminate anxiety from the minds of all pre-tenure faculty members, or the pressures exerted on their lives en route to tenure, academic leaders can improve the clarity of tenure policies and expectations, and the satisfaction of their faculty, without sacrificing rigor. After so much has been invested to recruit and to hire them, pre-tenure faculty are owed consistent messages about what is required for tenure and credible assurances of fairness and equity, that is, that tenure decisions are based on performance, not influenced by demographics, relationships, or departmental politics.
Promotion. While the academy has recently improved many policies for assistant professors, it has done far less for associate professors. Fortunately, new practices—some truly novel, others novel only to this rank—have emerged from COACHE’s research on tenured faculty. These include modified duties such as reduced teaching load; sabbatical planning and other workshops; workload shifts (i.e., more teaching or more research); improved communication about timing for promotion and a nudge to stand for full; small grants to support mid-career faculty (e.g., matching funds, travel support); a trigger mechanism, such as a ninth year review; and broader, more inclusive criteria.
Hallmarks of Successful Models
We have learned from leading institutions on these benchmarks what practices promote faculty satisfaction. Some findings:
Be direct with faculty during the interview stage about tenure and promotion expectations, then reinforce relative weights and priorities in a memorandum of understanding, then discuss them again in orientation sessions. These are formative opportunities.
If collegiality, outreach, and service count in the tenure process, provide definitions, say how they count, and state how they will be measured.
Provide written information about where to find everything they need to feel comfortable with the tenure process and with their campus. Use intuitively-organized websites with links to relevant policies and people.
Conduct year-long faculty orientations and workshops to support effective teaching and research throughout their years as assistant and associate professors. Host Q&A sessions or provide other venues where pre-tenure faculty can safely ask difficult questions. Teach departments chairs to deliver plenty of feedback along the way—annually, and then more thoroughly in a third- or fourth-year review. Written summaries of such conversations are particularly important to women and underrepresented minorities. Provide sample dossiers to pre-tenure faculty and sample feedback letters to those responsible for writing them. Ensure open doors for early-career faculty to chairs and senior faculty members in the department. The most clear and satisfied pre-tenure faculty have such access for questions about tenure, for feedback, for opportunities to collaborate, and for colleagueship. Be cognizant of the workload placed on associate professors. They often find themselves buried suddenly with more service, mentoring, and student advising, as well as more leadership and administrative duties that may get in the way of their trajectory to promotion.
Provide mentors. COACHE data confirm that just because a faculty member earns tenure does not mean that s/he no longer needs or wants a mentor.
For practical-minded inspiration from COACHE members with high ratings in Tenure and Promotion, read our Benchmark Best Practices white papers.
28

The Collaborative on Academic Careers in Higher Education at the Harvard Graduate School of Education
This page intentionally left blank
29

The Collaborative on Academic Careers in Higher EducationFaculty Job Satisfaction Survey 2015
TENURE AND PROMOTION
Kenyon CollegeYOUR RESULTS COMPARED TO PEERS AREAS OF STRENGTH IN GREEN
YOUR RESULTS COMPARED TO COHORT AREAS OF CONCERN IN RED sm. (.1) med (.3) lrg. (.5)
mean overall tenured pre-ten full assoc men women white foc tenure status
tenured ranks gender race 2011
Benchmark: Tenure policies 3.67 N/A N/A N/A N<5 N/A N/A women N<5 -Clarity of tenure process 3.93 N/A N/A N/A N<5 N/A N/A N<5 -Clarity of tenure criteria 3.67 N/A N/A N/A N<5 N/A N/A women N<5 -Clarity of tenure standards 3.20 N/A N/A N/A N<5 N/A N/A women N<5 -Clarity of body of evidence for deciding tenure 4.13 N/A N/A N/A N<5 N/A N/A men N<5Clarity of whether I will achieve tenure 3.53 N/A N/A N/A N<5 N/A N/A women N<5 -Consistency of messages about tenure 3.43 N/A N/A N/A N<5 N/A N/A women N<5 +Tenure decisions are performance-based 3.79 N/A N/A N/A N<5 N/A N/A women N<5 +Benchmark: Tenure clarity 3.60 N/A N/A N/A N<5 N/A N/A women N<5 -Clarity of expectations: Scholar 3.33 N/A N/A N/A N<5 N/A N/A women N<5 -Clarity of expectations: Teacher 4.00 N/A N/A N/A N<5 N/A N/A women N<5 -Clarity of expectations: Advisor 3.53 N/A N/A N/A N<5 N/A N/A women N<5 -Clarity of expectations: Colleague 3.73 N/A N/A N/A N<5 N/A N/A women N<5 -Clarity of expectations: Campus citizen 4.13 N/A N/A N/A N<5 N/A N/A women N<5 +Clarity of expectations: Broader community 2.67 N/A N/A N/A N<5 N/A N/A men N<5 -Benchmark: Promotion 4.14 N/A N/A assoc women focReasonable expectations: Promotion 4.24 N/A N/A assoc women focDept. culture encourages promotion 4.14 N/A N/A assoc women focClarity of promotion process 4.28 N/A N/A assoc women foc -Clarity of promotion criteria 4.22 N/A N/A assoc women foc -Clarity of promotion standards 3.96 N/A N/A assoc women foc -Clarity of body of evidence for promotion 4.32 N/A N/A assoc women focClarity of time frame for promotion 4.03 N/A N/A assoc women foc -Clarity of whether I will be promoted 3.07 N/A N/A N/A N/A women foc -
WITHIN CAMPUS DIFFERENCES*
*A group named in the Within Campus Differences rated the survey item lower than its comparison group. Coloration reflects the magnitude (effect size) of the difference. Additional explanation of effect size differences can be found in the “Background and Definitions” section of this report.
30
The Collaborative on Academic Careers in Higher EducationFaculty Job Satisfaction Survey 2015
TENURE AND PROMOTION
Kenyon College
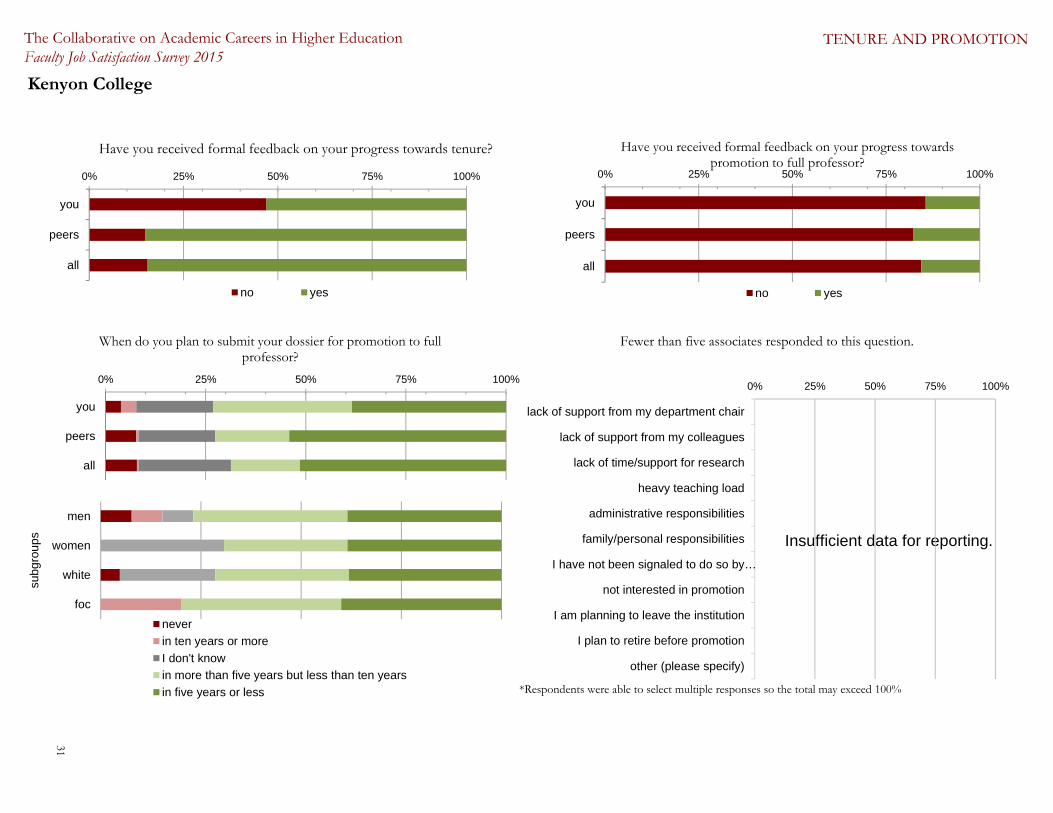
Fewer than five associates responded to this question.
Insufficient data for reporting.
*Respondents were able to select multiple responses so the total may exceed 100%
0% 25% 50% 75% 100%
you
peers
all
neverin ten years or moreI don't knowin more than five years but less than ten yearsin five years or less
men
women
white
foc
subg
roup
s
When do you plan to submit your dossier for promotion to full professor?
0% 25% 50% 75% 100%
lack of support from my department chair
lack of support from my colleagues
lack of time/support for research
heavy teaching load
administrative responsibilities
family/personal responsibilities
I have not been signaled to do so by…
not interested in promotion
I am planning to leave the institution
I plan to retire before promotion
other (please specify)
0% 25% 50% 75% 100%
you
peers
all
no yes
0% 25% 50% 75% 100%
you
peers
all
Have you received formal feedback on your progress towards promotion to full professor?
no yes
Have you received formal feedback on your progress towards tenure?
31

The Collaborative on Academic Careers in Higher Education at the Harvard Graduate School of Education
Your Findings in Context
Leadership: Senior, Divisional, Departmental Guiding Principles Academic leaders—especially the provost, dean, and department chair—play critical roles in shaping the satisfaction or dissatisfaction of faculty members. COACHE research has found that tenured faculty desire from the administration a clearly-articulated institutional mission and vision that do not change in ways that adversely affect faculty work (e.g., increased focus on research over teaching or vice versa; raised expectations for generating funding from outside grants). Faculty also wish for clear and consistent expectations for the mix of research, teaching, and service or outreach; support for research (pre- and post-award) and teaching; and a sense that their work is valued.
Deans and department chairs (or heads) can improve faculty morale through honest communication, and particularly by involving faculty in meaningful decisions that affect them. Deans and chairs are also responsible for ensuring opportunities for faculty input and supporting faculty in adapting to any changes to mission and institutional priorities. Equity and fairness in faculty evaluation are also important factors when assessing department head or chair leadership.
Hallmarks of Successful Models COACHE researchers interviewed leaders from member institutions whose faculty rated items in this theme exceptionally well compared to faculty at other participating campuses. We learned that high-performing institutions do some or all of the following:
Even if the Leadership: Senior marks are low, share them with faculty. Embrace reality, promise change, and be grateful that you have brought to light your faculty’s concerns before a vote of no confidence was called.
Ensure that resources are allocated effectively to support changes in faculty work.
Be careful not to let faculty get caught unaware, unsuspecting, or unprepared for shifts in priorities. For example, guidelines for tenure and promotion should not be changed midstream; commitments (e.g., in a memorandum of understanding) should be honored.
Allow senior faculty members grace periods to adjust to new expectations.
Be transparent: it is almost impossible to over-communicate with faculty about changes to mission, institutional priorities, and resource allocation.
Consistent messaging is pivotal to strong leadership: work diligently to ensure that senior, divisional, and departmental leaders are hearing and communicating the same message about institutional priorities.
Priorities must be communicated via multiple channels, media, and venues. A blanket email or a website update does not adequately ensure broad communication of institutional priorities. Develop a communication plan that considers how the faculty everywhere—even the hard-to-reach—get information.
Provide consistent, well-designed management training and educational sessions for your institutional and departmental leaders. Offer department chairs more than just a one-day tutorial on the job—develop their leadership competencies. When their term as chair concludes, they will return to the faculty as leaders, not merely managers.
Provide chairs with a “Chair Handbook” and a web portal with “one stop shopping” on mentoring strategy, career mapping tools, and access to advice from peers.
Create opportunities for chairs to convene—perhaps without a dean or provost present—to discuss best practices, innovations, and shared struggles. Then, invite them to share their take-aways with the deans’ council or other senior administrators.
For practical-minded inspiration from COACHE members with high ratings in leadership, read our Benchmark Best Practices white papers.
32

The Collaborative on Academic Careers in Higher EducationFaculty Job Satisfaction Survey 2015
LEADERSHIP
Kenyon CollegeYOUR RESULTS COMPARED TO PEERS AREAS OF STRENGTH IN GREEN
YOUR RESULTS COMPARED TO COHORT AREAS OF CONCERN IN RED sm. (.1) med (.3) lrg. (.5)
mean overall tenured pre-ten full assoc men women white foc tenure status
tenured ranks gender race 2011
Leadership Items (not included in benchmark scores)Priorities are stated consistently 3.45 tenured assoc women foc +Priorities are acted on consistently 3.24 assoc women focChanged priorities negatively affect my work** 3.61 tenured assoc women white +Benchmark: Leadership: Senior 3.91 tenured assoc women foc +Pres/Chancellor: Pace of decision making 4.01 assoc women foc +Pres/Chancellor: Stated priorities 3.98 tenured assoc women +Pres/Chancellor: Communication of priorities 4.04 tenured assoc women foc +CAO: Pace of decision making 3.91 tenured assoc women foc +CAO: Stated priorities 3.94 assoc women foc +CAO: Communication of priorities 3.85 assoc women +CAO: Ensuring faculty input 3.69 tenured assoc women +Benchmark: Leadership: Divisional N/A N/A N/A N/A N/A N/A N/A N/A N/A N/A N/A N/A N/A N/A N/ADean: Pace of decision making N/A N/A N/A N/A N/A N/A N/A N/A N/A N/A N/A N/A N/A N/A N/ADean: Stated priorities N/A N/A N/A N/A N/A N/A N/A N/A N/A N/A N/A N/A N/A N/A N/ADean: Communication of priorities N/A N/A N/A N/A N/A N/A N/A N/A N/A N/A N/A N/A N/A N/A N/ADean: Ensuring faculty input N/A N/A N/A N/A N/A N/A N/A N/A N/A N/A N/A N/A N/A N/A N/ABenchmark: Leadership: Departmental 3.87 assoc focHead/Chair: Pace of decision making 3.70 assoc focHead/Chair: Stated priorities 3.71 assoc women focHead/Chair: Communication of priorities 3.70 assoc focHead/Chair: Ensuring faculty input 4.19 assoc foc +Head/Chair: Fairness in evaluating work 4.09 assoc women foc
**This item is reverse coded.
WITHIN CAMPUS DIFFERENCES*
*A group named in the Within Campus Differences rated the survey item lower than its comparison group. Coloration reflects the magnitude (effect size) of the difference. Additional explanation of effect size differences can be found in the “Background and Definitions” section of this report.
my dean
my chair/head
Faculty who report that changes in priorities have had a negative impact on their work are then asked if they have received sufficient support to adapt to changes from their
Dean and their Chair.
0% 10% 20% 30% 40% 50% 60% 70% 80% 90% 100%
somewhat or strongly agree neither/nor somewhat or strongly disagree
57%
22%
21%
net disagree neither/nor net agree
In the past five years, my
institution's priorities have
changed in waysthat negatively affect my work.
33

The Collaborative on Academic Careers in Higher Education at the Harvard Graduate School of Education
Your Findings in Context
Department Engagement, Quality, and Collegiality Guiding Principles Faculty are employed by institutions, but they spend most of their time in departments, where culture has perhaps the greatest influence on faculty satisfaction and morale. We have highlighted three broad areas in which faculty judge the departments in which they work: engagement, quality, and collegiality.
Engagement. It is increasingly common to talk about student engagement, but less so faculty engagement. Yet, it is difficult to imagine an engaged student population without an engaged faculty. COACHE and the Faculty Survey of Student Engagement (FSSE) complement one another in that FSSE considers the faculty-student connection, while COACHE measures faculty engagement with one another—by their professional interactions and their departmental discussions about undergraduate and graduate learning, pedagogy, the use of technology, and research methodologies.
Quality. Departmental quality is a function of the intellectual vitality of faculty, the scholarship that is produced, the effectiveness of teaching, how well the department recruits and retains excellent faculty, and whether and how poor faculty performance is handled.
Collegiality. While many factors comprise faculty members’ opinions about departmental collegiality, COACHE has discovered that faculty are especially cognizant of their sense of “fit” among their colleagues, their personal interactions with colleagues, whether their colleagues “pitch in” when needed, and colleague support for work/life balance. There is no substitute for a collegial department when it comes to faculty satisfaction, and campus leaders—both faculty and administrators—can create opportunities for more and better informal engagement.
Hallmarks of Successful Models As arbiters of departmental culture, chairs especially are well-served to pay attention to departmental collegiality.
They should keep their doors open so faculty can stop in and chat about departmental issues. Likewise, chairs should drop in to offer help, perhaps to intervene.
Be especially conscious that those who are in the minority—whether by gender, race/ethnicity, age, subfield, political views or another factor—are not marginalized in the department; what you might think of as respecting autonomy might be perceived by another as isolation.
Create forums for faculty to play together: schedule some social activities and ensure everyone knows about important milestones in each other’s lives. Celebrate! All institutions in our related Benchmark Best Practices report foster departmental engagement, quality, and collegiality by hosting social gatherings once or twice a month.
Create forums for faculty to work together: convene to discuss research, methodology, interdisciplinary ideas, pedagogy, and technology.
Provide chair training for handling performance feedback for tenure-track faculty members (e.g., annual reviews, mid-probationary period reviews), tenured faculty members (e.g., post-tenure review, annual or merit review, informal feedback); and non-tenure-track faculty members.
Discuss the vitality of the department by using COACHE and other analytical data to keep these matters from becoming overly-personalized.
Be an advocate for faculty participation in activities in the campuses’ center for teaching and learning.
Use department meeting agendas not as a list of chores, but as opportunities for generative thinking. Enlist colleagues to discuss new teaching and research methods or to present case studies to problem-solve. Using this structured time to initiate departmental engagement may encourage continued engagement beyond the meetings. As often as possible, ask department colleagues to take ownership of the meeting by co-presenting.
For practical-minded inspiration from COACHE members with high ratings in department-focused themes, read our Benchmark Best Practices white papers.
34
The Collaborative on Academic Careers in Higher EducationFaculty Job Satisfaction Survey 2015
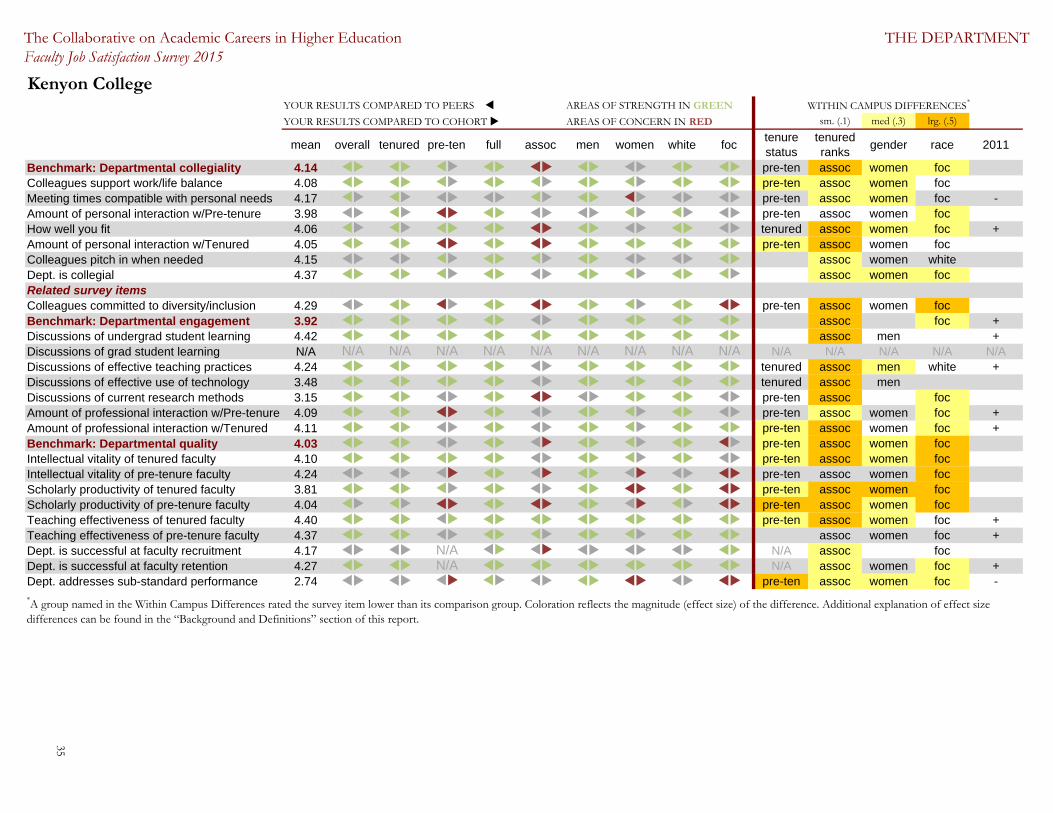
THE DEPARTMENT
Kenyon CollegeYOUR RESULTS COMPARED TO PEERS AREAS OF STRENGTH IN GREEN
YOUR RESULTS COMPARED TO COHORT AREAS OF CONCERN IN RED sm. (.1) med (.3) lrg. (.5)
mean overall tenured pre-ten full assoc men women white foc tenure status
tenured ranks gender race 2011
Benchmark: Departmental collegiality 4.14 pre-ten assoc women focColleagues support work/life balance 4.08 pre-ten assoc women focMeeting times compatible with personal needs 4.17 pre-ten assoc women foc -Amount of personal interaction w/Pre-tenure 3.98 pre-ten assoc women focHow well you fit 4.06 tenured assoc women foc +Amount of personal interaction w/Tenured 4.05 pre-ten assoc women focColleagues pitch in when needed 4.15 assoc women whiteDept. is collegial 4.37 assoc women focRelated survey itemsColleagues committed to diversity/inclusion 4.29 pre-ten assoc women focBenchmark: Departmental engagement 3.92 assoc foc +Discussions of undergrad student learning 4.42 assoc men +Discussions of grad student learning N/A N/A N/A N/A N/A N/A N/A N/A N/A N/A N/A N/A N/A N/A N/ADiscussions of effective teaching practices 4.24 tenured assoc men white +Discussions of effective use of technology 3.48 tenured assoc menDiscussions of current research methods 3.15 pre-ten assoc focAmount of professional interaction w/Pre-tenure 4.09 pre-ten assoc women foc +Amount of professional interaction w/Tenured 4.11 pre-ten assoc women foc +Benchmark: Departmental quality 4.03 pre-ten assoc women focIntellectual vitality of tenured faculty 4.10 pre-ten assoc women focIntellectual vitality of pre-tenure faculty 4.24 pre-ten assoc women focScholarly productivity of tenured faculty 3.81 pre-ten assoc women focScholarly productivity of pre-tenure faculty 4.04 pre-ten assoc women focTeaching effectiveness of tenured faculty 4.40 pre-ten assoc women foc +Teaching effectiveness of pre-tenure faculty 4.37 assoc women foc +Dept. is successful at faculty recruitment 4.17 N/A N/A assoc focDept. is successful at faculty retention 4.27 N/A N/A assoc women foc +Dept. addresses sub-standard performance 2.74 pre-ten assoc women foc -
WITHIN CAMPUS DIFFERENCES*
*A group named in the Within Campus Differences rated the survey item lower than its comparison group. Coloration reflects the magnitude (effect size) of the difference. Additional explanation of effect size differences can be found in the “Background and Definitions” section of this report.
35
The Collaborative on Academic Careers in Higher Education at the Harvard Graduate School of Education
Your Findings in Context
Appreciation & Recognition Guiding Principles Faculty, at all ranks, are just like other employees when it comes to wanting to be appreciated by colleagues and recognized for doing good work. Focus group research conducted by COACHE showed that while many tenured faculty members feel valued by undergraduate and graduate students, with whom research relationships were especially gratifying, they do not receive much recognition from other faculty and upper-level administrators. The degree to which appreciation and recognition themes appeared in our 2010 study of tenured faculty far surpassed their appearance in our pre-tenure faculty research.
In our recent study, tenured faculty (especially at smaller institutions) felt that extramural service that increases the reputation of their colleges, while expected of them, is not recognized and goes unrewarded. Being engaged in the local community or on the board of a nationally-recognized association yields little recognition from senior colleagues or others at their home institutions. This gap between expectations and appreciation discouraged many faculty from external service that increased the reputation of the institution.
Hallmarks of Successful Models Institutions with high marks for appreciating faculty typically understand the following:
The greatest obstacle is simply not knowing what faculty have done that warrants recognition. What mechanisms are in place to ensure that faculty contributions are being shared with deans, provosts, and with their colleagues? Cultivate a culture of recognition by creating ways for students, faculty, and campus leaders to aggregate and to highlight the accomplishments of your faculty. For example, a physical and a virtual drop box allow others to comment on their good work.
The chief academic officer should get to know the faculty in a variety of forums, including brownbag lunches, speakers’ series, workshops, and seminars that
engage faculty members in appealing topics and current issues.
Likewise, deans and chairs should make opportunities to showcase faculty work, share kind words, and offer a “pat on the back” from time to time.
Take note of what faculty are doing and celebrate that work in each school or college at some point every year; such occasions do not have to be costly to be meaningful. We know of two universities where the Provost surprises faculty with a “prize patrol” offering an award or other recognition in what would have been a run-of-the-mill department meeting or class.
Provide department chairs with guidelines to form a nominating committee of two faculty (rotating out annually) responsible for putting forward their colleagues’ names for internal and external awards and honors. These might include recognition from a disciplinary association, institutional teaching awards, or prizes from higher ed associations. Such activities foster awareness of and appreciation for all department colleagues’ work.
For practical-minded inspiration from COACHE members with high ratings in Appreciation and Recognition, read our Benchmark Best Practices white papers.
36

The Collaborative on Academic Careers in Higher EducationFaculty Job Satisfaction Survey 2015
APPRECIATION AND RECOGNITION
Kenyon CollegeYOUR RESULTS COMPARED TO PEERS AREAS OF STRENGTH IN GREEN
YOUR RESULTS COMPARED TO COHORT AREAS OF CONCERN IN RED sm. (.1) med (.3) lrg. (.5)
mean overall tenured pre-ten full assoc men women white foc tenure status
tenured ranks gender race 2011
Benchmark: Appreciation and recognition 3.68 tenured assoc women focRecognition: For teaching 3.79 assoc focRecognition: For advising 3.45 assoc women whiteRecognition: For scholarship 3.67 pre-ten assoc womenRecognition: For service 3.42 tenured assoc women focRecognition: For outreach 3.19 pre-ten assoc women foc -Recognition: From colleagues 3.87 tenured assoc women focRecognition: From CAO 3.54 N/A N/A assoc women white -Recognition: From Dean 3.31 N/A N/A assoc women white -Recognition: From Head/Chair 3.84 tenured assoc focSchool/college is valued by Pres/Provost N/A N/A N/A N/A N/A N/A N/A N/A N/A N/A N/A N/A N/A N/A N/ADept. is valued by Pres/Provost 3.80 N/A N/A assoc women +CAO cares about faculty of my rank 4.15 assoc women +
WITHIN CAMPUS DIFFERENCES*
*A group named in the Within Campus Differences rated the survey item lower than its comparison group. Coloration reflects the magnitude (effect size) of the difference. Additional explanation of effect size differences can be found in the “Background and Definitions” section of this report.
**See the "Background and Definitions" section of the report for a more detailed explanation of Academic Areas.
0%
25%
50%
75%
100%
pre-tenure associate full
The person who serves as my chief academic officer seems to care about the quality of life for faculty of my rank.
somewhat or stronglydisagree
neither/nor
I don't know
somewhat or stronglyagree
1 2 3 4 5
HumanitiesSocial Sciences
Physical SciencesBiological Sciences
Visual & Performing ArtsEngineering/Comp Sci/Math/Stats
Health & Human EcologyAgriculture/Nat Res/Env Sci
BusinessEducation
Medical Schools & Health ProfessionsOther Professions
I feel that my department is valued by this institution's President/Chancellor and Provost by Academic Area.**
(1=Strongly disagree 5=Strongly Agree)
37

The Collaborative on Academic Careers in Higher EducationFaculty Job Satisfaction Survey 2015
RETENTION AND NEGOTIATIONS
Kenyon College
you peers all you peers all you peers all you peers all you peers all you peers all you peers all
base salary 35% 29% 33% 38% 31% 34% 20% 21% 32% 47% 35% 37% 21% 23% 30% 40% 29% 33% 19% 31% 36%supplemental salary 4% 3% 5% 4% 3% 5% 7% 3% 5% 2% 4% 5% 7% 2% 4% 4% 3% 5% 5% 2% 3%tenure clock 0% 1% 1% 0% 1% 0% 0% 3% 3% 0% 0% 1% 0% 2% 1% 0% 1% 1% 0% 2% 1%teaching load (e.g., course release) 19% 31% 22% 16% 30% 22% 33% 37% 24% 17% 26% 18% 21% 37% 27% 21% 32% 23% 14% 27% 19%administrative responsibilities 3% 4% 5% 4% 5% 7% 0% 0% 1% 0% 5% 6% 7% 3% 5% 3% 5% 6% 5% 2% 4%equipment 3% 1% 2% 4% 1% 2% 0% 1% 1% 4% 2% 2% 2% 0% 1% 3% 1% 2% 5% 0% 0%lab/research support 6% 4% 6% 5% 5% 6% 7% 3% 7% 4% 4% 6% 7% 4% 6% 7% 5% 6% 0% 2% 5%employment for spouse/partner 12% 7% 6% 11% 4% 4% 20% 20% 14% 9% 6% 6% 17% 9% 7% 9% 7% 6% 24% 12% 8%sabbatical or other leave time 6% 5% 6% 5% 6% 7% 7% 4% 4% 2% 5% 6% 10% 6% 6% 3% 5% 5% 14% 7% 9%
you peers all you peers all you peers all you peers all you peers all you peers all you peers all
improve your salary/benefits 5% 9% 11% 6% 9% 11% 0% 9% 12% 8% 12% 13% 2% 6% 9% 5% 8% 10% 5% 12% 16%find a more collegial work environment 3% 2% 3% 2% 1% 3% 7% 4% 3% 2% 0% 2% 4% 4% 4% 1% 1% 2% 10% 5% 5%increase resources to support work 3% 7% 7% 2% 6% 7% 7% 8% 8% 0% 6% 6% 7% 7% 8% 1% 6% 6% 10% 8% 10%work at an institution w/ different priorities 3% 9% 9% 4% 7% 9% 0% 13% 12% 4% 10% 10% 2% 7% 9% 1% 8% 9% 10% 13% 12%pursue an admin. position in higher ed 4% 2% 3% 4% 3% 4% 7% 1% 2% 4% 2% 3% 4% 2% 3% 4% 3% 3% 5% 0% 3%pursue a nonacademic job 1% 2% 2% 1% 2% 2% 0% 3% 2% 2% 2% 2% 0% 2% 2% 1% 3% 2% 0% 0% 1%employment opps. for spouse/partner 6% 8% 7% 2% 6% 5% 27% 16% 13% 4% 6% 6% 9% 10% 8% 8% 8% 7% 0% 9% 6%for other family or personal needs 5% 5% 6% 5% 5% 5% 7% 6% 8% 8% 3% 5% 2% 7% 7% 5% 4% 6% 5% 10% 8%improve your quality of life 14% 9% 9% 14% 8% 9% 13% 11% 11% 10% 7% 8% 18% 10% 11% 12% 8% 9% 19% 11% 10%retire 25% 29% 24% 28% 37% 30% 7% 3% 3% 24% 31% 25% 27% 28% 22% 27% 34% 27% 19% 8% 12%move to a preferred geographic location 18% 9% 9% 17% 6% 7% 20% 17% 16% 16% 10% 10% 20% 7% 9% 19% 8% 10% 14% 14% 8%
If you were to choose to leave your institution, what would be your primary reason?
Overall Tenured Pre-tenure Men Women White Faculty of Color
White Faculty of Color
If you could negotiate adjustments to your employment, which one of the following items would you most like to adjust?
Overall Tenured Pre-tenure Men Women
0% 25% 50% 75% 100%
actively sought an outside job offer
received a formal job offer
renegotiated the terms of your employment
In the past five years, have you...
you peers all0%
25%
50%
75%
100%
you peers all
Are outside offers necessary for negotiations?
agree
neither/nor
disagree
38

The Collaborative on Academic Careers in Higher EducationFaculty Job Satisfaction Survey 2015
RETENTION AND NEGOTIATIONS
0% 25% 50% 75% 100%
for no more than five years after earningtenure
more than five years but less than ten
ten years or more
I don't know
Assuming you achieve tenure, how long do you plan to remain at this institution? (Pre-tenure Faculty Only)
you peers all
0% 25% 50% 75% 100%
for no more than five years
more than five years but less than ten
ten years or more
I don't know
How long do you plan to remain at this institution? (Tenured Faculty Only)
you peers all
0% 25% 50% 75% 100%
men
women
white
foc
How long do you plan to remain at this institution? (all faculty at your institution merged)
for no more than five years more than five years but less than ten I don't know ten years or more
39

The Collaborative on Academic Careers in Higher EducationFaculty Job Satisfaction Survey 2015
BEST ASPECTS
Kenyon College
you peerAll
(27) you peerAll
(27) you peerAll
(27) you peerAll
(27) you peerAll
(27) you peerAll
(27) you peerAll
(27)
quality of colleagues 41% 5 25 40% 5 25 47% 4 23 47% 5 25 33% 5 23 47% 5 26 19% 3 16support of colleagues 13% 1 11 11% 0 7 20% 3 19 10% 1 9 16% 0 12 12% 0 9 14% 3 11opportunities to collaborate with colleagues 1% 0 0 0% 0 2 7% 0 0 0% 0 1 2% 0 2 0% 0 1 5% 0 1quality of graduate students 0% 0 0 0% 0 0 0% 0 0 0% 0 0 0% 0 0 0% 0 0 0% 0 0quality of undergraduate students 74% 5 21 73% 5 22 80% 4 17 69% 5 19 80% 5 21 76% 5 21 67% 4 17quality of the facilities 1% 0 1 1% 3 4 0% 0 0 2% 1 3 0% 1 1 1% 3 4 0% 0 1support for research/creative work 1% 1 3 0% 1 2 7% 1 7 0% 1 4 2% 0 4 1% 0 2 0% 1 4support for teaching 15% 2 4 16% 1 4 7% 2 5 14% 1 6 16% 2 8 9% 1 3 33% 3 8support for professional development 0% 0 0 0% 0 0 0% 0 2 0% 0 0 0% 0 2 0% 0 0 0% 0 1assistance for grant proposals 0% 0 0 0% 0 0 0% 0 0 0% 0 0 0% 0 0 0% 0 0 0% 0 0childcare policies/practices 0% 0 0 0% 0 0 0% 0 0 0% 0 0 0% 0 0 0% 0 0 0% 0 0availability/quality of childcare facilities 0% 0 0 0% 0 0 0% 0 0 0% 0 0 0% 0 0 0% 0 0 0% 0 0spousal/partner hiring program 0% 0 0 0% 0 0 0% 0 0 0% 0 0 0% 0 0 0% 0 0 0% 0 0compensation 0% 0 0 0% 0 1 0% 2 2 0% 0 1 0% 0 0 0% 0 0 0% 1 2geographic location 2% 2 10 2% 3 13 0% 1 10 0% 3 11 4% 3 11 3% 1 7 0% 2 13diversity 0% 0 1 0% 0 0 0% 0 1 0% 0 1 0% 0 1 0% 0 0 0% 0 2presence of others like me 0% 0 0 0% 0 0 0% 0 0 0% 0 0 0% 0 0 0% 0 0 0% 0 0my sense of "fit" here 16% 4 20 19% 5 21 0% 3 14 18% 1 16 13% 5 17 20% 5 21 0% 2 10protections from service/assignments 0% 0 0 0% 0 0 0% 0 0 0% 0 0 0% 0 0 0% 0 0 0% 0 0commute 4% 0 0 2% 0 0 13% 0 2 6% 0 0 2% 0 0 4% 0 0 5% 0 0cost of living 6% 0 0 6% 0 0 7% 0 3 4% 0 1 9% 0 0 3% 0 0 19% 1 4teaching load 2% 0 2 2% 0 0 0% 0 3 4% 0 1 0% 0 2 1% 0 1 5% 0 4manageable pressure to perform 7% 0 1 7% 0 1 7% 1 2 6% 0 0 9% 0 4 7% 0 0 10% 1 3academic freedom 8% 2 17 9% 2 16 7% 1 9 12% 2 17 4% 2 14 9% 2 17 5% 1 14t&p clarity or requirements 2% 0 0 2% 0 0 0% 0 1 0% 0 0 4% 0 0 1% 0 0 5% 0 2quality of leadership 1% 0 0 1% 0 0 0% 0 0 2% 0 0 0% 0 0 0% 0 0 5% 0 0other (please specify) 3% 0 0 4% 0 0 0% 1 1 6% 0 1 0% 1 1 4% 0 0 0% 0 0decline to answer 0% 0 0 0% 0 0 0% 0 0 0% 0 0 0% 0 0 0% 0 0 0% 1 3there are no positive aspects 0% 0 0 0% 0 0 0% 0 0 0% 0 0 0% 0 0 0% 0 0 0% 0 0
White Faculty of Color
Faculty were asked to identity the two (and only two) best aspects of working at your institution. The top four responses for your institution are shown in red and disaggregated by tenure status, gender, and race. The columns labeled Peer show the total number of times an item appeared as a top four item amongst any of your five peer institutions. The All column reflects the number of times an item appeared in the top four at any of the institutions in the current cohort. When a best aspect at your institution is also shown as a best aspect for your peers and/or the cohort, the issue may be seen as common in the faculty labor market. Best aspects that are unique to your campus are market differentiators for your institution which can be highlighted in recruitment and retention efforts.
Overall Tenured Pre-tenure Men Women
40

The Collaborative on Academic Careers in Higher EducationFaculty Job Satisfaction Survey 2015
WORST ASPECTS
Kenyon College
you peerAll
(27) you peerAll
(27) you peerAll
(27) you peerAll
(27) you peerAll
(27) you peerAll
(27) you peerAll
(27)
quality of colleagues 1% 0 0 1% 0 3 0% 0 1 0% 0 2 2% 0 0 1% 0 1 0% 0 2support of colleagues 3% 0 1 4% 0 1 0% 0 0 2% 2 1 4% 0 3 3% 1 2 5% 0 1opportunities to collaborate with colleagues 1% 0 0 0% 0 0 7% 0 1 0% 0 0 2% 0 0 0% 0 0 5% 0 0quality of graduate students 0% 0 0 0% 0 0 0% 0 1 0% 0 0 0% 0 1 0% 0 0 0% 0 0quality of undergraduate students 0% 0 5 0% 0 5 0% 0 4 0% 0 7 0% 0 4 0% 0 5 0% 0 3quality of the facilities 4% 1 2 4% 1 3 7% 0 3 4% 1 2 4% 1 3 4% 1 4 5% 0 3lack of support for research/creative work 10% 3 10 10% 3 8 13% 1 8 6% 1 11 16% 2 11 9% 3 7 14% 2 12lack of support for teaching 0% 0 0 0% 0 0 0% 0 1 0% 0 0 0% 0 0 0% 0 0 0% 0 0lack of support for professional development 2% 0 0 2% 0 0 0% 0 0 0% 0 0 4% 0 2 1% 0 0 5% 0 1lack of assistance for grant proposals 7% 0 0 9% 0 0 0% 0 0 8% 0 0 7% 0 0 8% 0 0 5% 0 0childcare policies/practices (or lack of) 1% 0 0 1% 0 0 0% 0 5 2% 0 3 0% 0 1 0% 0 1 5% 0 1availability/quality of childcare facilities 0% 0 2 0% 0 2 0% 0 4 0% 0 1 0% 0 2 0% 0 3 0% 0 3spousal/partner hiring program (or lack of) 17% 2 7 16% 1 5 20% 2 10 22% 0 8 11% 2 6 13% 2 6 29% 1 6compensation 21% 3 18 25% 4 20 0% 4 15 25% 3 22 16% 4 17 24% 3 20 10% 3 14geographic location 31% 2 8 31% 2 8 33% 4 13 31% 2 8 31% 1 7 29% 2 8 38% 2 10lack of diversity 7% 0 4 6% 0 5 13% 3 12 4% 0 4 11% 1 9 8% 0 3 5% 3 15absence of others like me 3% 0 0 4% 0 0 0% 1 4 6% 0 1 0% 0 0 3% 0 0 5% 0 8my lack of "fit" here 1% 0 1 1% 0 0 0% 0 1 0% 0 3 2% 0 1 1% 1 0 0% 0 4too much service/too many assignments 19% 5 22 20% 5 24 13% 3 14 12% 5 21 27% 5 23 20% 5 25 14% 5 13commute 6% 0 0 5% 1 2 13% 0 2 8% 0 1 4% 1 0 5% 0 0 10% 0 1cost of living 0% 0 7 0% 0 6 0% 0 8 0% 0 6 0% 0 7 0% 0 9 0% 0 7teaching load 6% 4 14 4% 4 13 20% 4 13 6% 5 11 7% 3 15 5% 5 12 10% 4 11unrelenting pressure to perform 8% 0 1 7% 0 1 13% 1 7 4% 0 2 13% 1 2 9% 0 1 5% 0 2academic freedom 0% 0 0 0% 0 0 0% 0 0 0% 0 0 0% 0 0 0% 0 0 0% 0 0t&p clarity or requirements 2% 0 1 1% 0 1 7% 1 4 4% 0 1 0% 0 2 1% 0 1 5% 0 4quality of leadership 3% 1 6 4% 1 7 0% 0 3 0% 1 7 7% 1 5 4% 1 6 0% 1 5other (please specify) 15% 0 2 14% 1 4 20% 1 5 18% 1 6 11% 0 3 17% 1 5 5% 0 4decline to answer 4% 0 0 5% 0 0 0% 1 2 6% 0 0 2% 0 0 3% 0 0 10% 0 3there are no negative aspects 3% 0 0 4% 0 1 0% 0 0 4% 2 1 2% 0 0 4% 0 0 0% 0 2
Faculty were asked to identity the two (and only two) worst aspects of working at your institution. The top four responses for your institution are shown in red and disaggregated by tenure status, gender, and race. The columns labeled Peer show the total number of times an item appeared as a top four item at any of your five peer institutions. The All column shows the number of times an item appeared in the top four at any of the institutions in the current cohort. When a worst aspect at your institution is also shown as a worst aspect by your peers and/or the cohort, the issue may be seen as common in the faculty labor market. More attention should be paid to the worst aspects that are unique to your institution. These distinctions cast the institution in a negative light.
Overall Tenured Pre-tenure Men Women White Faculty of Color
41

The Collaborative on Academic Careers in Higher EducationFaculty Job Satisfaction Survey 2015
CODED RESPONSES TO Q270
Kenyon CollegeThe final question in the COACHE Survey asks faculty to describe the one thing your institution can do to improve the workplace for faculty. COACHE analysts assigned all responses to one or more common themes. The Excel version of this report (found in the Report Portfolio) includes the full comments and more detailed coding.
0%
25%
50%
75%
Appreciation andrecognition
Collaboration andinterdisciplinary
work
Compensation,benefits, facilities
and otherresources
The Department Senior, divisional,departmental
leadership
Mentoring Research,teaching, service
Promotion andtenure
Work andpersonal life
balance
What is the number one thing your institution can do to improve the workplace for faculty?
Kenyon College all comparable institutions
42