america’s rental housing -...
TRANSCRIPT
AMERICA’S RENTAL HOUSINGE X P A N D I N G O P T I O N S F O R D I V E R S E A N D G R O W I N G D E M A N D
Joint Center for Housing Studies of Harvard University
31685-15_R15 cover Av2.indd 2 11/27/15 9:15 AM
JOINT CENTER FOR HOUSING STUDIES OF HARVARD UNIVERSITY
HARVARD GRADUATE SCHOOL OF DESIGN
HARVARD KENNEDY SCHOOL
Funding for this report was provided by the John D. and
Catherine T. MacArthur Foundation and the Policy Advisory Board
of the Joint Center for Housing Studies.
©2015 President and Fellows of Harvard College.
The opinions expressed in America’s Rental Housing—Expanding Options for Diverse and Growing Demand do not necessarily represent the views of Harvard University, the Policy Advisory Board of the Joint Center for Housing Studies, or the MacArthur Foundation.
31685-15_R15 cover Av2.indd 3 11/27/15 9:15 AM
Rental housing is home to a growing
share of the nation’s increasingly diverse
households. But even with the strong
rebound in multifamily construction, tight
rental markets make it difficult for low- and
moderate-income renters to find housing
they can afford. As a result, the number
of cost-burdened renters set another
record last year. Addressing the challenge
of affordability in a time of rising overall
demand will require greater efforts from
both the public and private sectors to
expand the range of rental housing options.
RECORD-SETTING GROWTH IN DEMAND
The decade-long surge in rental demand is unprecedented.
In mid-2015, 43 million families and individuals lived in rent-
al housing, up nearly 9 million from 2005—the largest gain in
any 10-year period on record. In addition, the share of all US
households that rent rose from 31 percent to 37 percent, its
highest level since the mid-1960s.
A number of factors have fueled soaring demand. The burst-
ing of the housing bubble played an important role, with
nearly 8 million homes lost to foreclosure since the home-
ownership rate peaked in 2004. Household incomes have
also fallen back to 1995 levels and access to mortgage credit
has tightened, making the transition to homeownership
more difficult for many who might otherwise buy homes.
The sharp downturn in both the economy and housing market
has renewed appreciation of the benefits that renting offers. In
particular, renters incur much lower moving costs than own-
ers, enabling them to respond more easily to recent changes
in employment and housing market conditions. Renters also
face far less financial risk by not having a significant share of
their wealth tied up in a single investment whose value can
swing dramatically. And finally, renters are relieved of respon-
sibility for and the expense of property maintenance.
Demographic trends have made their own contribution to
the growing popularity of renting. The aging of the millennial
generation (born 1985–2004) has lifted the number of adults
in their 20s, the stage of life when renting is most common.
In addition, millennials are slower to marry and have children
than previous generations, thus delaying the life events that
typically precede first-time homeownership. Indeed, the num-
ber of renters would be even higher today if the Great Recession
had not kept many young adults living in their parents’ homes.
In combination, these trends have boosted the numbers of
renters in all age, income, and household categories (Figure 1). The millennials pushed up the number of renters under age
I N T R O D U C T I O N A N D S U M M A R Y
1J O I N T C E N T E R F O R H O U S I N G S T U D I E S O F H A R V A R D U N I V E R S I T Y
31685-15_R15_4_Production_TextV3.indd 1 12/1/15 2:20 PM

2 AMERICA’S RENTAL HOUSING—EXPANDING OPTIONS FOR DIVERSE AND GROWING DEMAND2 AMERICA’S RENTAL HOUSING—EXPANDING OPTIONS FOR DIVERSE AND GROWING DEMAND
30 by nearly 1 million over the past decade, while members
of generation X (born 1965–1984) added 3 million to the ranks
of renters in their 30s and 40s, even though the population
in this age range declined. The largest increase, however, was
a 4.3 million jump in the number of renters in their 50s and
60s. This growth reflects the aging of baby-boomer renters
(born 1946–1964) as well as declines in homeownership rates
among this generation. While households in their 20s make
up the single largest share, households aged 40 and over now
account for a majority of all renters.
By income, the largest increase in renters—4.0 million—was
among households earning less than $25,000 annually, both
because low-income households are much more likely to
rent and because their numbers had swelled following the
recession. But growth in the number of renters earning
$50,000 or more was nearly as large, at 3.3 million, including
an increase of 1.6 million earning $100,000 or more. While
such high-income households still represent a relatively
small share of renters, the rate of growth in this segment has
far outpaced that of other income groups and testifies to the
growing appeal of renting among households with substan-
tial financial means.
Meanwhile, single persons living alone, the most common
renter household type, have accounted for 2.9 million new
renters since 2005. Families with children, including those
headed by both married couples and single parents, are
the second-most common type of renter household, with
their numbers increasing by 2.2 million over the decade.
While the conventional image of renters is groups of young
unrelated adults living together, these types of non-family
households make up a relatively small share of all renters
and their numbers have grown only modestly in the past
10 years.
THE DYNAMIC RENTAL HOUSING STOCK
In response to record growth in demand, the rental housing
stock expanded by approximately 8.2 million units in 2005–
2015. While new multifamily construction was responsible
for roughly a fifth of this increase, conversions of single-fam-
ily homes from owner-occupancy and other uses accounted
for the lion’s share of growth.
While always a sizable portion of the rental stock, the
single-family share (including mobile homes) has increased
dramatically since 2005, from 34 percent to 40 percent. This
growth is notable not only because it is so substantial, but
also because institutional investors have taken a much
more active role in this market than in the past. By creating
large portfolios of homes across many markets, large-scale
investors are testing the waters for a new model of owning
and operating scattered-site properties that could expand
the range of housing options available to renters.
To date, however, the total holdings of the seven largest
single-family real estate investment trusts (REITs) are
Note: Household counts are three-year trailing averages and define children as under age 18 only. Source: JCHS tabulations of US Census Bureau, Current Population Surveys.
2005 2015
Age Group Income Household Type
The Decade-Long Increase in Renter Households Has Been Broad-BasedRenter Households (Millions)
FIGURE 1
18
16
14
12
10
8
6
4
2
0Under 30 30–39 40–49 50–59 60–69 70 and
OverUnder $25,000
$25,000–49,999
$50,000–99,999
$100,000and Over
SinglePerson
Familieswith
Children
MarriedwithoutChildren
Other Family Non-Family
Note: Income category cutoffs align with rent category cutoffs at the 30% of income affordability standard.Sources: US Census Bureau, 2015 Survey of Market Absorption and 2015 Current Population Survey.
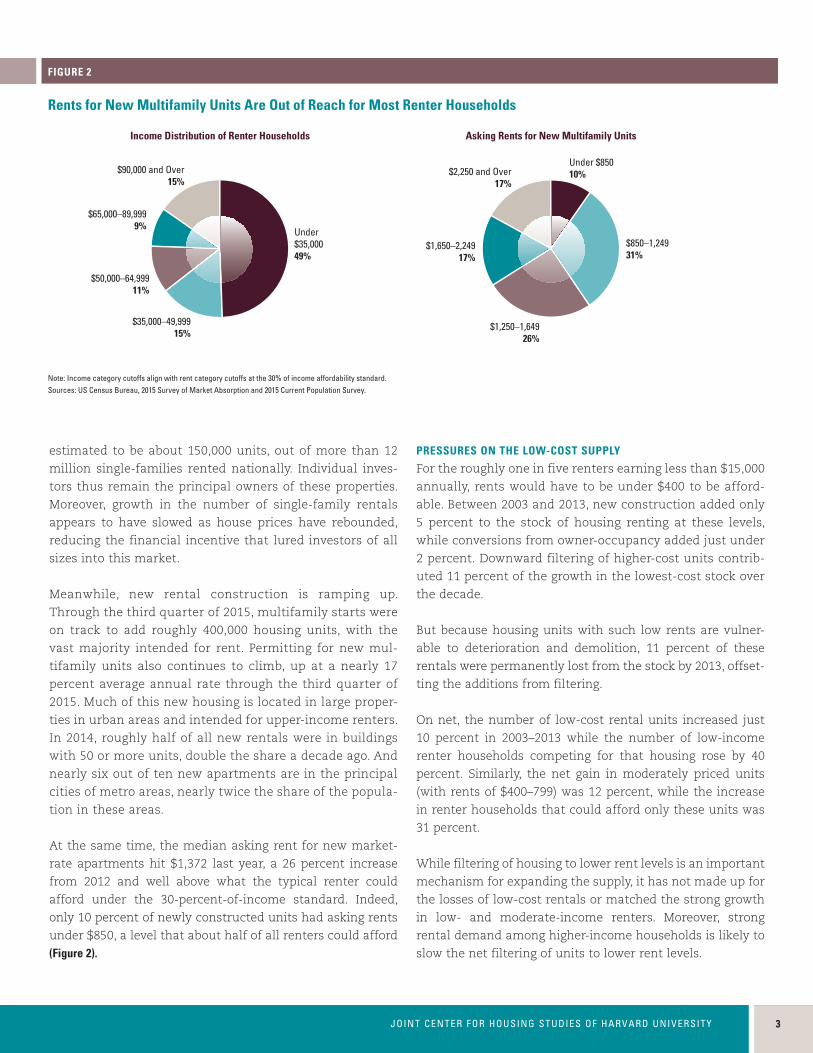
Income Distribution of Renter Households Asking Rents for New Multifamily Units
$1,650–2,24917%
$35,000–49,99915%
$50,000–64,99911%
$65,000–89,9999%
$90,000 and Over15%
Under $85010%
$850–1,24931%
$1,250–1,64926%
$2,250 and Over17%
Under$35,00049%
Rents for New Multifamily Units Are Out of Reach for Most Renter Households
FIGURE 2
31685-15_R15_4_Production_TextV3.indd 2 12/1/15 2:20 PM
213JOINT CENTER FOR HOUSING STUDIES OF HARVARD UNIVERSITY
213JOINT CENTER FOR HOUSING STUDIES OF HARVARD UNIVERSITY
estimated to be about 150,000 units, out of more than 12
million single-families rented nationally. Individual inves-
tors thus remain the principal owners of these properties.
Moreover, growth in the number of single-family rentals
appears to have slowed as house prices have rebounded,
reducing the financial incentive that lured investors of all
sizes into this market.
Meanwhile, new rental construction is ramping up.
Through the third quarter of 2015, multifamily starts were
on track to add roughly 400,000 housing units, with the
vast majority intended for rent. Permitting for new mul-
tifamily units also continues to climb, up at a nearly 17
percent average annual rate through the third quarter of
2015. Much of this new housing is located in large proper-
ties in urban areas and intended for upper-income renters.
In 2014, roughly half of all new rentals were in buildings
with 50 or more units, double the share a decade ago. And
nearly six out of ten new apartments are in the principal
cities of metro areas, nearly twice the share of the popula-
tion in these areas.
At the same time, the median asking rent for new market-
rate apartments hit $1,372 last year, a 26 percent increase
from 2012 and well above what the typical renter could
afford under the 30-percent-of-income standard. Indeed,
only 10 percent of newly constructed units had asking rents
under $850, a level that about half of all renters could afford
(Figure 2).
PRESSURES ON THE LOW-COST SUPPLY
For the roughly one in five renters earning less than $15,000
annually, rents would have to be under $400 to be afford-
able. Between 2003 and 2013, new construction added only
5 percent to the stock of housing renting at these levels,
while conversions from owner-occupancy added just under
2 percent. Downward filtering of higher-cost units contrib-
uted 11 percent of the growth in the lowest-cost stock over
the decade.
But because housing units with such low rents are vulner-
able to deterioration and demolition, 11 percent of these
rentals were permanently lost from the stock by 2013, offset-
ting the additions from filtering.
On net, the number of low-cost rental units increased just
10 percent in 2003–2013 while the number of low-income
renter households competing for that housing rose by 40
percent. Similarly, the net gain in moderately priced units
(with rents of $400–799) was 12 percent, while the increase
in renter households that could afford only these units was
31 percent.
While filtering of housing to lower rent levels is an important
mechanism for expanding the supply, it has not made up for
the losses of low-cost rentals or matched the strong growth
in low- and moderate-income renters. Moreover, strong
rental demand among higher-income households is likely to
slow the net filtering of units to lower rent levels.
Note: Income category cutoffs align with rent category cutoffs at the 30% of income affordability standard.Sources: US Census Bureau, 2015 Survey of Market Absorption and 2015 Current Population Survey.
Income Distribution of Renter Households Asking Rents for New Multifamily Units
$1,650–2,24917%
$35,000–49,99915%
$50,000–64,99911%
$65,000–89,9999%
$90,000 and Over15%
Under $85010%
$850–1,24931%
$1,250–1,64926%
$2,250 and Over17%
Under$35,00049%
Rents for New Multifamily Units Are Out of Reach for Most Renter Households
FIGURE 2
31685-15_R15_4_Production_TextV3.indd 3 12/1/15 2:20 PM
4 AMERICA’S RENTAL HOUSING—EXPANDING OPTIONS FOR DIVERSE AND GROWING DEMAND4 AMERICA’S RENTAL HOUSING—EXPANDING OPTIONS FOR DIVERSE AND GROWING DEMAND
Notes: Cost-burdened households pay more than 30% of income for housing. Households with zero or negative income are assumed to have cost burdens, while households paying no cash rent are assumed to be without burdens.Source: JCHS tabulations of US Census Bureau, 2014 American Community Survey.
■ Under $15,000 ■ $30,000–44,999
While Most Lowest-Income Households Have Cost Burdens, the Cost-Burdened Share of Moderate-Income Renters Varies Widely Across MarketsShare of Renters with Cost Burdens (Percent)
FIGURE 4
100
90
80
70
60
50
40
30
20
10
0DallasLos
AngelesHoustonWashington
DCDetroitSeattleMiamiNew
YorkMinneapolisChicagoBoston PhoenixAtlantaSan
FranciscoPhiladelphia
Household Income
PERSISTENT MARKET TIGHTENING
After the Great Recession took hold in 2007, the national
vacancy rate soared to record highs and, for the first time in
decades, brought nominal rent increases to a near standstill
in 2010. Since then, however, the rental market has steadily
tightened as growth in demand has outpaced additions to
supply. With vacancy rates now at their lowest point since
1985, rents are rising 3.5 percent annually in real terms—the
fastest pace in nearly 30 years.
Rental market tightening is evident across the country (Figure 3). MPF Research reports that the rental vacancy rate
for professionally managed apartments in the third quarter
of 2015 was below 5 percent in nearly three-quarters of the
nation’s 50 largest markets and above 7 percent in only one.
Rent increases are similarly widespread, with 21 of the 50
largest metros posting real gains of 5 percent or more, and
38 of these metros posting gains of at least 3 percent. At
the high end, rents in San Francisco, Portland, and Denver
were up 10 percent or more. At the low end, rent increases
in Baltimore, Virginia Beach, Pittsburgh, and Washington,
DC, were under 2 percent.
With vacancy rates down and rents up, net income from
rental properties has increased sharply and helped to push
up apartment property values. After undergoing a boom and
bust similar in magnitude to single-family home prices, rent-
al property values now top their previous high by 33 percent.
This strong rebound has brought private lenders back into
the multifamily finance market, with banks and thrifts lead-
ing the way. Lending by life insurance companies and other
institutional investors, as well as through commercial mort-
gage backed securities (CMBS), has also picked up, helping
to lift total multifamily originations in 2014 almost a third
above the 2007 peak. With the increase in private lending,
the government-backed share of originations shrank from
nearly two-thirds in 2009 to 36 percent in 2014.
The multifamily construction boom raises the specter of
overbuilding in at least some metro areas. So far, though,
growth in supply in most markets seems generally in line
with increases in occupied apartment units, although rent
increases in Washington, DC—one of the first metros to see
a strong rebound in construction—have slowed. And with
the pipeline still expanding, the possibility of overbuilding
in the next few years remains. Record-high rental property
values also bear watching, since a sharp correction would be
highly disruptive at a time when there is strong demand for
multifamily financing.
AFFORDABILITY CHALLENGES AT RECORD LEVELS
Between 2001 and 2014, real rents rose 7 percent while
household incomes fell by 9 percent. In combination, these
trends pushed the number of cost-burdened renters (paying
more than 30 percent of income for housing) up from 14.8
million to a new high of 21.3 million. Even worse, the number
of these households with severe burdens (paying more than
half of income for housing) jumped from 7.5 million to 11.4
million, also setting a record.
Notes: Estimates are based on a sample of investment-grade properties. Data for 2010 are from the fourth quarter. Data for 2015 are as of the third quarter.Source: JCHS tabulations of MPF Research data.
2010 2015
Vacancy Rates Have Fallen Sharply in Markets Across the CountryRental Vacancy Rate (Percent)
FIGURE 3
12
10
8
6
4
2
0Atlanta Dallas Los AngelesHouston Washington
DCDetroit Seattle New YorkDenver MinneapolisChicago BostonPhoenix San DiegoPhiladelphia
31685-15_R15_4_Production_TextV3.indd 4 12/1/15 2:20 PM

215JOINT CENTER FOR HOUSING STUDIES OF HARVARD UNIVERSITY
215JOINT CENTER FOR HOUSING STUDIES OF HARVARD UNIVERSITY
While the shares of cost-burdened renters have declined
slightly from their 2011 peaks, this improvement resulted
from an increase in the share of high-income households
opting to rent rather than a reduction in the number of
renters with cost burdens. Overall, 49 percent of renters
were burdened in 2014, including 26 percent with severe
burdens. Both of these shares have increased substantially
since 2001, when they stood at 41 percent and 20 percent,
respectively.
Although most common among lowest-income households,
cost burdens are an increasing concern for moderate-income
renters. Some 84 percent of renters earning under $15,000 a
year were cost burdened in 2014, up slightly from 80 percent
in 2001. Of these lowest-income households, 72 percent had
severe burdens. Among those earning $15,000–29,999, how-
ever, the cost-burdened share rose from 69 percent in 2001 to
77 percent in 2014, with a 10 percentage-point increase in the
incidence of severe burdens accounting for all of the change.
The increase in cost-burdened shares among households
earning $30,000–44,999 was even larger, from 37 percent to
48 percent, although only 10 percent of these households
had severe burdens in 2014.
While very large shares of lowest-income households are
cost-burdened in all markets, the situation of moderate-
income households varies across metros. For example, about
85 percent of renters with incomes under $15,000 living
in Detroit and 83 percent of those living in Washington,
DC, have cost burdens. However, more than 80 percent of
Washington renters earning $30,000–44,999 are also cost
burdened, compared with 45 percent of Detroit renters with
similar incomes (Figure 4).
Meanwhile, the households most likely to be severely cost
burdened have dependent children and/or rely on a single
income, including 38 percent of single-parent families and
32 percent of persons living alone. By age group, renters aged
75 and over have the highest incidence of severe burdens,
at 33 percent. Large shares of minorities are also severely
burdened, including 33 percent of blacks and 30 percent of
Hispanics, compared with 23 percent of whites.
The consequences of severe cost burdens are far-reaching.
In 2014, households in the lowest expenditure quartile
(a proxy for low income) who paid more than half their
incomes for housing spent 38 percent less on food and 55
percent less on healthcare. Working-age renters in the low-
est expenditure quartile also put 42 percent less toward
retirement savings than otherwise similar renters living in
affordable housing.
Moreover, one out of every eight housing units that rent for
under $600 a month—within range for lowest-income rent-
Notes: Cost-burdened households pay more than 30% of income for housing. Households with zero or negative income are assumed to have cost burdens, while households paying no cash rent are assumed to be without burdens.Source: JCHS tabulations of US Census Bureau, 2014 American Community Survey.
■ Under $15,000 ■ $30,000–44,999
While Most Lowest-Income Households Have Cost Burdens, the Cost-Burdened Share of Moderate-Income Renters Varies Widely Across MarketsShare of Renters with Cost Burdens (Percent)
FIGURE 4
100
90
80
70
60
50
40
30
20
10
0DallasLos
AngelesHoustonWashington
DCDetroitSeattleMiamiNew
YorkMinneapolisChicagoBoston PhoenixAtlantaSan
FranciscoPhiladelphia
Household Income
31685-15_R15_4_Production_TextV3.indd 5 12/1/15 2:20 PM

6 AMERICA’S RENTAL HOUSING—EXPANDING OPTIONS FOR DIVERSE AND GROWING DEMAND6 AMERICA’S RENTAL HOUSING—EXPANDING OPTIONS FOR DIVERSE AND GROWING DEMAND
ers—is physically inadequate, forcing a tradeoff between
affordability and housing quality. There is also growing evi-
dence that households lacking stable, decent-quality hous-
ing are more vulnerable to health problems and develop-
mental delays among children, with obvious spillover effects
for the healthcare and educational systems.
Given that the Great Recession contributed so profoundly to
the spread of housing cost burdens, the question naturally
arises whether the current economic recovery and rental
housing expansion will ultimately improve affordability.
Projections suggest that demographic forces alone are likely
to increase the number of severely cost-burdened renters
by 1.3 million over the next decade—due largely to rapid
growth in the number of older households and Hispanic
households. Even under the most optimistic economic con-
ditions (assuming that incomes grow one percentage point
faster than rents each year), the number of severely cost-
burdened renters would decline by only 170,000 households
by 2025. But if rent increases outpace income growth by that
same amount, the number of cost-burdened renters would
increase by some 3 million over today’s record levels.
HOUSING POLICY CONSIDERATIONS
While program criteria differ, very low-income households
(earning up to 50 percent of the median household income
in the area where they live) are generally eligible for federal
housing assistance. But because housing assistance is not an
entitlement, just over one in four income-eligible households
actually benefit from these programs.
Following the Great Recession, the number of renter
households with incomes under $30,000 shot up from 15.5
million in 2007 to 19.1 million in 2013 (Figure 5). While the
number of assisted families and individuals did rise over
this period, the increase was a modest 393,000. The US
Department of Housing and Urban Development (HUD)
estimates that 56 percent of income-eligible but unassist-
ed renters with very low incomes have worst case needs,
i.e., pay more than half their incomes for housing and/or
live in severely inadequate units. The number of renters
living in these circumstances thus grew from 5.9 million
to 7.7 million over this period.
The failure of housing assistance to keep up with need
partly reflects the caps on nondefense discretionary spend-
ing imposed under the 2011 Budget Control Act, which have
left real funding for HUD’s three largest rental assistance
programs unchanged since 2008. The Low Income Housing
Tax Credit (LIHTC) program remains the principal means of
both expanding and preserving the affordable rental supply.
As a tax expenditure rather than a budget line item, LIHTC
funding has not been subject to the same cutbacks as other
federal programs and so has increased modestly over the
last seven years. Still, the LIHTC program has supported only
76,000 additional affordable units annually on average in
recent years, with about half of its funding going to acquisi-
tion and rehabilitation of existing subsidized developments
and half to new construction.
The HOME program, which funds a range of state and local
housing programs, has been subject to draconian cuts, with
funding down by more than half from FY2010 to FY2015 in
real terms. The latest Congressional budget proposals call for
further substantial reductions. Since HOME funding is often
used in conjunction with tax credits to help subsidize hous-
ing for very low-income households, these cutbacks also
undermine the LIHTC program’s ability to support develop-
ment and preservation of affordable rentals.
Despite its success over the years, the LIHTC program has
been criticized for its relatively shallow subsidies, which do
not produce housing affordable to the neediest households
Notes: Household incomes are adjusted for inflation using the CPI-U for All Items. Household counts by income are based on three-year trailing averages. Very low-income renter households have incomes up to 50% of local area medians. Sources: JCHS tabulations of US Census Bureau, Current Population Surveys; US Department of Housing and Urban Development, Worst Case Housing Needs Reports to Congress.
2007 2009 2011 2013
Under $15,000 $15,000–29,999 Very Low-Income Households with Assistance
0.0
2.5
5.0
7.5
10.0
12.5
15.0
17.5
20.0
Growth in the Number of Lowest-Income Renters Far Outstrips Increases in Assisted HouseholdsRenter Households (Millions)
FIGURE 5
Household Income
31685-15_R15_4_Production_TextV3.indd 6 12/1/15 2:20 PM
217JOINT CENTER FOR HOUSING STUDIES OF HARVARD UNIVERSITY
217JOINT CENTER FOR HOUSING STUDIES OF HARVARD UNIVERSITY
(earning up to 30 percent of area median incomes) without
additional rental assistance. To meet this concern, HUD and
others have proposed that the LIHTC program allow income
averaging that would balance the portion of units reserved
for extremely low-income tenants with a larger share for
slightly higher-income tenants. This approach holds prom-
ise for addressing the need for affordable housing across a
broader spectrum of incomes in high-cost markets.
The LIHTC program has also come under scrutiny for
contributing to the concentration of assisted housing in
racially segregated, high-poverty neighborhoods. However,
larger subsidies are needed to develop affordable housing
in areas with higher land costs. In addition, the LIHTC
program must balance the goal of expanding housing in
communities that are thriving against the goal of improv-
ing conditions in poor neighborhoods. Nevertheless, state
allocating agencies must be more attuned to opportuni-
ties to expand access to affordable housing in low-poverty
communities, particularly through the incentives and cri-
teria outlined in their Qualified Allocation Plans.
The tax credits have also been an important vehicle for pre-
serving subsidized rentals at risk of conversion to market-
rate housing. The Urban Institute has estimated that one out
of every six assisted housing units whose subsidy contracts
expire in the next two years are in areas with poverty rates
under 10 percent, while another quarter are in neighbor-
hoods with poverty rates of 10–20 percent. Preserving the
affordability of these developments would be a cost-effective
means of maintaining housing options for low-income rent-
ers in higher-opportunity neighborhoods.
Along with tax credits, housing choice vouchers have been
the principal vehicle for expanding housing assistance in
recent decades. Vouchers allow recipients to search for hous-
ing among the broad range of choices offered by the private
rental stock. As with the LIHTC program, however, voucher
holders often end up living in high-poverty neighborhoods
for a variety of reasons—the barriers to searching for hous-
ing across many neighborhoods, landlords’ reluctance to
accept vouchers, users’ poor credit histories and limited sav-
ings for security deposits, and the tight supply and higher
cost of housing in higher-income neighborhoods. A HUD pilot
program that sets rent limits at the zip code level (rather
than applying one limit throughout a metro area) has had
success in fostering moves away from high-poverty areas.
Counseling voucher users about rental opportunities would
also be useful, as would offering landlords greater incentives
to participate in the program.
While additional federal funding is vital, state and local
governments have critical roles to play because they make
key decisions about how funds are put to use. Nonfederal
revenues can also be used for gap financing to extend the
reach of federal programs. Perhaps most important, though,
state and local governments establish the land use regula-
tions that shape the opportunities for and costs of building
different types of rental housing. As it is, many suburban
areas restrict the construction of higher-density, and there-
fore lower-cost, housing. It is absolutely essential to remove
unnecessary obstacles that prevent the private sector from
providing a full range of rental housing options in all types
of communities.
THE OUTLOOK
The increase in renting is evident across all types of
American households, regardless of age and income.
Despite the conversion of millions of single-family homes
to rentals and an upsurge in multifamily construction,
the supply has not responded fully to the rising tide of
demand. As a result, rents have climbed at the same time
that household incomes have yet to recover from substan-
tial declines over the past decade. Together these trends
have led to record numbers of renters paying excessive
amounts of income for housing, with little prospect for
meaningful improvement.
The challenge now facing the country is to ensure that
a sufficient and appropriate supply of rental housing is
available for a diversity of households and in a diversity
of locations. While the private market has proven capable
of expanding the higher-end rental stock, developers have
only limited opportunities to meet the needs of lowest-
income households without subsidies that close the large
gap between construction costs and what these renters can
afford to pay. In many high-cost markets, moderate-income
households face affordability challenges as well.
Policymakers urgently need to consider the extent and form
of housing assistance that can stem the rapid growth in cost-
burdened households. Beyond affordability, they also need to
promote development of a wider range of housing options so
that more renter households can find homes that suit their
needs and in communities offering good schools and access
to jobs. It will take concerted efforts by all levels of govern-
ment to capitalize on the capabilities of the private and not-
for-profit sectors to reach this goal.
31685-15_R15_4_Production_TextV3.indd 7 12/1/15 2:20 PM
8 AMERICA’S RENTAL HOUSING—EXPANDING OPTIONS FOR DIVERSE AND GROWING DEMAND8 AMERICA’S RENTAL HOUSING—EXPANDING OPTIONS FOR DIVERSE AND GROWING DEMAND
Demand for rental housing continues
to surge, driven by a combination of
demographic, economic, and lifecycle
trends. As millennials and immigrants
form millions of new households, they
are increasing the diversity of demand.
At the same time, rentership rates
among gen-Xers and baby boomers
are also rising, changing the traditional
profile of the renter population. With
homeownership rates already at historic
lows, however, the pace of renter
household growth is likely to slow.
GROWTH IN RENTER HOUSEHOLDS
The number of renter households has climbed steadily for
a decade (Figure 6). As measured by the Housing Vacancy
Survey, renter growth soared by roughly 9 million house-
holds between 2005 and the third quarter of 2015—marking
the largest increase over any 10-year period dating back to
1965 and bringing the total number of renters to 42.6 mil-
lion. And with growth accelerating in recent years, the 2010s
are on track to be the strongest decade of renter growth ever
recorded, with the addition of 1.05 million net new house-
holds per year so far. This is nearly double the pace of growth
in the 1970s when the baby boomers came of age.
Renting has increased among all age groups, household types,
and income groups. Population growth on both ends of the age
spectrum has driven up the numbers of both younger and older
renters, while significant declines in homeownership rates
have lifted the number of middle-aged renters. As a result, the
number of renter households aged 50 and over jumped from 10
million to 15 million, accounting for more than half of renter
growth over the decade. The number of middle-aged renters
30–49 years old climbed from 15 million to 18 million, contrib-
uting a third of the growth in renters. At the other end of the
age distribution, the number of renter households under 30
years old rose from 10 million to 11 million, representing about
11 percent of renter growth in 2005–2015.
With the aging of the population, single persons and married
couples without dependent children made up large shares of
renter household growth over the decade (33 percent and 18
percent, respectively). The number of renter households with
children, including married couples and single-parent families,
also accounted for a combined 25 percent of renter growth.
And unlike in the 1990s and early 2000s when foreign-born
and minority households drove all of the increase in renter
households, native-born whites were responsible for 34 per-
cent of growth in 2005–2015. Even so, foreign-born and minor-
ity households still contributed nearly two-thirds of renter
household growth—foreign-born households were responsible
Note: Data for 2015 are as of the third quarter. Source: US Census Bureau, Housing Vacancy Surveys.
■ Renter Households ■ Homeownership Rate
2012 2013 2014 20151990 1991 1992 1993 1994 1995 1996 1997 1998 1999 2000 2001 2002 2003 2004 2005 2006 2007 2008 2009 2010 2011
44
42
40
38
36
34
32
30
74
72
70
68
66
64
62
60
Renter Household Growth Has Surged with the Drop in HomeownershipRenter Households (Millions) Homeownership Rate (Percent)
FIGURE 6
Note: Growth estimates are based on annual data that are three-year trailing averages.Source: JCHS tabulations of US Census Bureau, Current Population Surveys.
■ Due to Increase in Households ■ Due to Increase in Rentership Rates ■ Total
Under 30
Millennial Generation X
30–49 50–69 70 and Over
Baby Boom Pre-Baby Boom5
4
3
2
1
0
-1
Gen-Xers and Baby Boomers Have Driven Most of the Recent Growth in Renter HouseholdsRenter Household Growth, 2005–15 (Millions)
FIGURE 7
Age Group
R E N T A L H O U S I N G D E M A N D
31685-15_R15_4_Production_TextV3.indd 8 12/1/15 2:20 PM
219JOINT CENTER FOR HOUSING STUDIES OF HARVARD UNIVERSITY 9
for 23 percent while native-born minorities accounted for 43
percent. Among all minorities, Hispanics had the highest share,
accounting for 29 percent of renter growth over the decade.
In another departure from previous trends, growth in renter
households in 2005–2015 occurred across all income groups
rather than primarily among those with lower incomes. In
fact, growth was distributed about evenly across income
groups, thanks in part to rapid increases among higher-income
households. Indeed, the number of renters in the top income
decile rose fully 61 percent—far faster than the growth rates
among renter households in the bottom five income deciles.
DYNAMICS OF GROWTH
Several of the trends behind the recent growth in renters
are playing out differently along generational lines (Figure 7).Millennials (born 1985–2004) are coming of age in record num-
bers, boosting the ranks of adults in their 20s—the prime ages
for renting. Meanwhile, members of generation X are remain-
ing renters longer, pushing up the rates for 30–49 year olds.
And finally, the baby boomers are driving up the population
aged 50 and over, while also renting at higher rates than the
previous generation.
Among millennials, population growth is the major factor.
Today, 45 million members of this generation are in their
20s, fully 2 million more than when the baby boomers were
similarly aged. This is the stage in life when young adults
typically form independent households and the share living
on their own rises from about one in seven to one in two.
But even though the millennials formed 11 million new renter
households over the past decade, the number of renters in the
under-30 age group increased by only 1 million. The impact
of the millennials on rental markets would have been even
larger, if not for the sharp drop in their household forma-
Note: Data for 2015 are as of the third quarter. Source: US Census Bureau, Housing Vacancy Surveys.
■ Renter Households ■ Homeownership Rate
2012 2013 2014 20151990 1991 1992 1993 1994 1995 1996 1997 1998 1999 2000 2001 2002 2003 2004 2005 2006 2007 2008 2009 2010 2011
44
42
40
38
36
34
32
30
74
72
70
68
66
64
62
60
Renter Household Growth Has Surged with the Drop in HomeownershipRenter Households (Millions) Homeownership Rate (Percent)
FIGURE 6
Note: Growth estimates are based on annual data that are three-year trailing averages.Source: JCHS tabulations of US Census Bureau, Current Population Surveys.
■ Due to Increase in Households ■ Due to Increase in Rentership Rates ■ Total
Under 30
Millennial Generation X
30–49 50–69 70 and Over
Baby Boom Pre-Baby Boom5
4
3
2
1
0
-1
Gen-Xers and Baby Boomers Have Driven Most of the Recent Growth in Renter HouseholdsRenter Household Growth, 2005–15 (Millions)
FIGURE 7
Age Group
31685-15_R15_4_Production_TextV3.indd 9 12/1/15 2:20 PM

10 AMERICA’S RENTAL HOUSING—EXPANDING OPTIONS FOR DIVERSE AND GROWING DEMAND10 AMERICA’S RENTAL HOUSING—EXPANDING OPTIONS FOR DIVERSE AND GROWING DEMAND
tion rates following the Great Recession. Indeed, many young
adults who would otherwise have become renters continued
to live in their parents’ homes or with others. As a result, while
the number of adults aged 20–29 jumped 11 percent over the
past decade, the number of households headed by adults in
this age group rose only 2 percent. If household formation
rates had remained constant, population growth would have
added another 1 million renter households in this age group.
In contrast, growth in the number of renters aged 30–49
resulted entirely from higher rentership rates. In fact, the
number of households in this age range actually declined
over the past 10 years as the larger baby-boom generation
moved into their 50s. The fact that 30–49 year-olds accounted
for such a large share of renter household growth reflects the
nearly 10 percentage-point decline in their homeownership
rates in 2005–2015. On net, less than 2 percent of gen-X house-
holds made the transition from renting to owning over the
decade. By comparison, more than 11 percent of baby-boomer
households became homeowners when they were at a similar
stage of life in 1984–1994. As a result, there are more than 3.0
million more renters in their 30s and 40s today than a decade
ago, even though there are fewer households in this age group.
Although declines in homeownership rates also helped to drive
growth in the number of renters aged 50 and over, population
growth accounted for more than half of the boost in renting
among this age group. With the youngest baby boomers turn-
ing 50 over the last decade, this age group made up fully 5 mil-
lion of the 9 million increase in the number of renters.
Given that the likelihood of an own-to-rent transition
increases with age while the likelihood of a rent-to-own
transition declines with age, today’s relatively high rent-
ership rates among households in their 40s and 50s may
well persist. Research suggests, however, that former
homeowners that rent frequently return to owning. As a
result, some of today’s older renters may buy homes in
the future. For younger households, though, the question
remains whether there is a true cultural shift away from
homeowning or, if incomes and credit conditions improve,
whether their homeownership rates will eventually catch
up with those of previous generations.
DEMOGRAPHIC PROFILE OF RENTERS
Representing well over a third of all US households, renters
are a highly diverse group with constantly evolving demo-
graphic characteristics. But renters differ somewhat from
homeowners in certain ways (Figure 8). For instance, given
that renting is generally the first step toward independent
living, renter households are generally younger than owners,
Note: Estimates are based on annual data that are three-year trailing averages and define children as under age 18 only. Source: JCHS tabulations of US Census Bureau, 2013–15 Current Population Surveys.
Age of Household Head
Under 35 35–54 55 and Over
Household Type
Single Person Married with Children Single Parent Married without Children All Other
Household Income
Under $25,000 $50,000–99,999 $25,000–49,999 $100,000 and Over
Renters Owners
100
90
80
70
60
50
40
30
20
10
0
Renters Owners
100
90
80
70
60
50
40
30
20
10
0
Renters Owners
100
90
80
70
60
50
40
30
20
10
0
Renters Reflect the Diversity of US Households, But Are More Likely than Owners to be Young, Low-Income, and SingleShare of Households (Percent)
FIGURE 8
Note: Estimates are based on annual data that are three-year trailing averages and define children as under age 18 only. Source: JCHS tabulations of US Census Bureau, 2013–15 Current Population Surveys.
■ Married without Children ■ Married with Children ■ All Households ■ Single Person ■ Single Parent
25–29Under 25 30–34 35–39 40–44 45–49 50–54 55–59 60–64 65–69 70–74 75 and Over
Age Group
90
80
70
60
50
40
30
20
10
0
Renting Remains an Important Housing Option Throughout the Life CycleRentership Rate (Percent)
FIGURE 9
31685-15_R15_4_Production_TextV3.indd 10 12/1/15 2:20 PM
2111JOINT CENTER FOR HOUSING STUDIES OF HARVARD UNIVERSITY
2111JOINT CENTER FOR HOUSING STUDIES OF HARVARD UNIVERSITY
with a median age of 40 compared with 55. In addition, just
under half of renters are minorities, compared with less than
a quarter of homeowners. Nationwide, black and Hispanic
households each account for about 20 percent of renters,
compared with just 8–9 percent of homeowners.
Households that rent are also more likely to have lower
incomes than those that own their homes. According to the
2015 Current Population Survey, the median income for rent-
ers was $35,000—about half of the $67,900 median income
for homeowners. Renters make up 56 percent of all house-
holds in the bottom income quartile and just 17 percent of
those in the top income quartile. The fact that renters tend
to be younger explains part of this disparity, although the
gap remains even after controlling for age.
Finally, renter households are smaller on average than owner
households. Renting is often a good option for these house-
holds, given their generally lower incomes and more modest
space needs. Single persons living alone make up 35 percent
of renter households, while single-parent families account for
another 16 percent. Despite their higher homeownership rates,
married couples with children represent one in seven renter
households. Indeed, households that include children make
up an even larger share of renters (31 percent) than owners (27
percent). All in all, about a third of renter households are single
persons, a third are families with children, and a third are cou-
ples without children and individuals sharing living quarters.
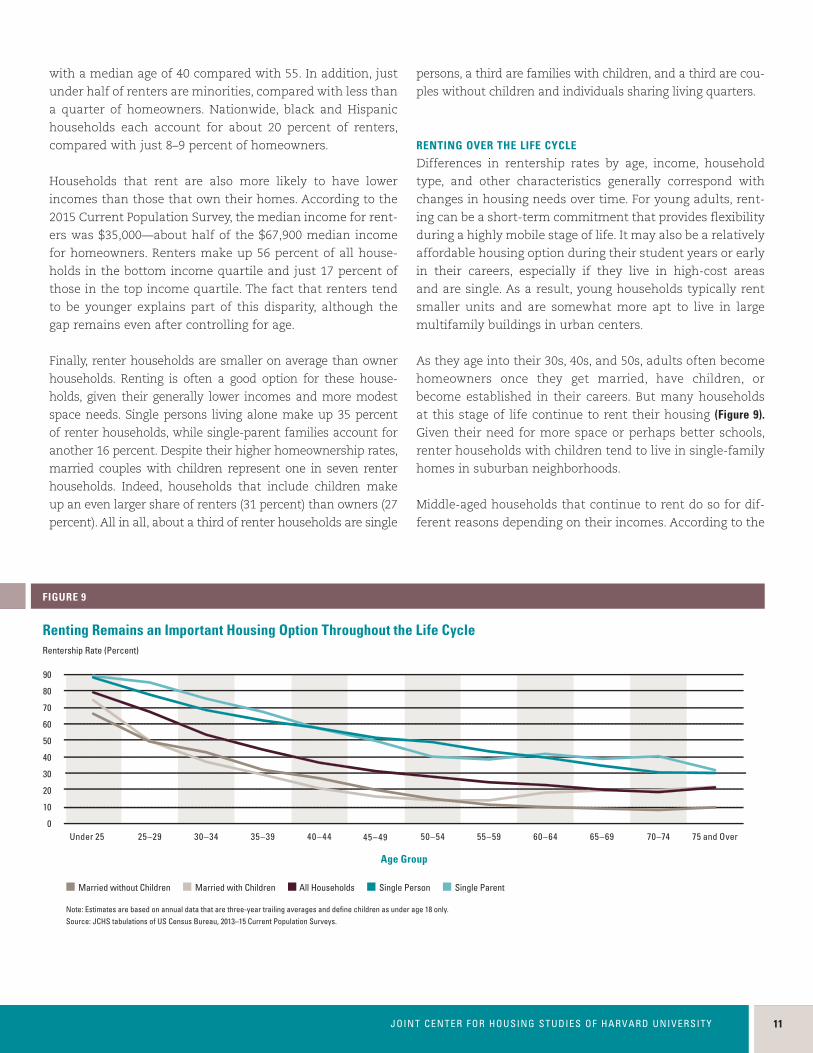
RENTING OVER THE LIFE CYCLE
Differences in rentership rates by age, income, household
type, and other characteristics generally correspond with
changes in housing needs over time. For young adults, rent-
ing can be a short-term commitment that provides flexibility
during a highly mobile stage of life. It may also be a relatively
affordable housing option during their student years or early
in their careers, especially if they live in high-cost areas
and are single. As a result, young households typically rent
smaller units and are somewhat more apt to live in large
multifamily buildings in urban centers.
As they age into their 30s, 40s, and 50s, adults often become
homeowners once they get married, have children, or
become established in their careers. But many households
at this stage of life continue to rent their housing (Figure 9).Given their need for more space or perhaps better schools,
renter households with children tend to live in single-family
homes in suburban neighborhoods.
Middle-aged households that continue to rent do so for dif-
ferent reasons depending on their incomes. According to the
Note: Estimates are based on annual data that are three-year trailing averages and define children as under age 18 only. Source: JCHS tabulations of US Census Bureau, 2013–15 Current Population Surveys.
■ Married without Children ■ Married with Children ■ All Households ■ Single Person ■ Single Parent
25–29Under 25 30–34 35–39 40–44 45–49 50–54 55–59 60–64 65–69 70–74 75 and Over
Age Group
90
80
70
60
50
40
30
20
10
0
Renting Remains an Important Housing Option Throughout the Life CycleRentership Rate (Percent)
FIGURE 9
31685-15_R15_4_Production_TextV3.indd 11 12/1/15 2:20 PM
12 AMERICA’S RENTAL HOUSING—EXPANDING OPTIONS FOR DIVERSE AND GROWING DEMAND12 AMERICA’S RENTAL HOUSING—EXPANDING OPTIONS FOR DIVERSE AND GROWING DEMAND
Fannie Mae National Housing Survey, households earning
more than $100,000 often choose to rent because it provides
flexibility and involves less stress for upkeep than owning. In
contrast, those with incomes below $25,000 rent because it is
affordable and/or because they are preparing to buy.
By the time they reach their 60s, homeowners may make
the transition to renting when they are no longer able or
willing to dedicate time and effort to home maintenance.
And by age 75, when the chances of having a disability and
of living alone increase, rentals can provide single-floor liv-
ing and other accessibility features that make it possible
to age safely in place. For these reasons, increasing shares
of renters in the oldest age groups live in large multifamily
buildings with elevators and other amenities, typically in
urban areas.
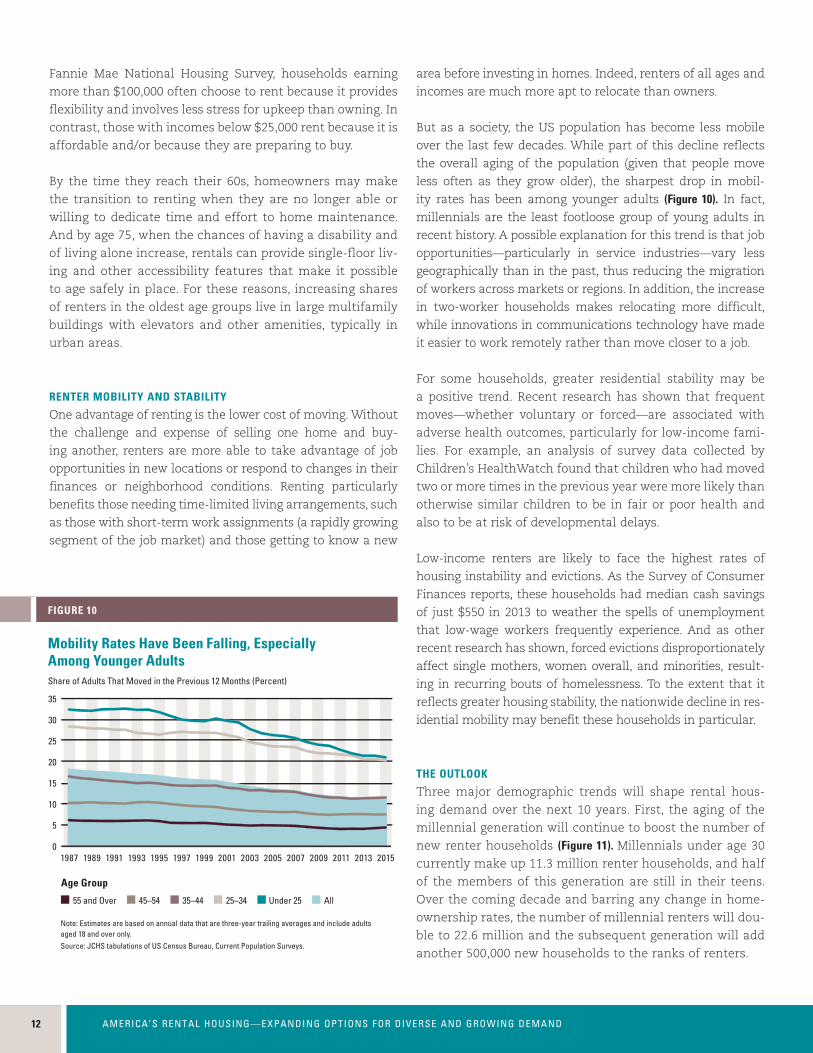
RENTER MOBILITY AND STABILITY
One advantage of renting is the lower cost of moving. Without
the challenge and expense of selling one home and buy-
ing another, renters are more able to take advantage of job
opportunities in new locations or respond to changes in their
finances or neighborhood conditions. Renting particularly
benefits those needing time-limited living arrangements, such
as those with short-term work assignments (a rapidly growing
segment of the job market) and those getting to know a new
area before investing in homes. Indeed, renters of all ages and
incomes are much more apt to relocate than owners.
But as a society, the US population has become less mobile
over the last few decades. While part of this decline reflects
the overall aging of the population (given that people move
less often as they grow older), the sharpest drop in mobil-
ity rates has been among younger adults (Figure 10). In fact,
millennials are the least footloose group of young adults in
recent history. A possible explanation for this trend is that job
opportunities—particularly in service industries—vary less
geographically than in the past, thus reducing the migration
of workers across markets or regions. In addition, the increase
in two-worker households makes relocating more difficult,
while innovations in communications technology have made
it easier to work remotely rather than move closer to a job.
For some households, greater residential stability may be
a positive trend. Recent research has shown that frequent
moves—whether voluntary or forced—are associated with
adverse health outcomes, particularly for low-income fami-
lies. For example, an analysis of survey data collected by
Children’s HealthWatch found that children who had moved
two or more times in the previous year were more likely than
otherwise similar children to be in fair or poor health and
also to be at risk of developmental delays.
Low-income renters are likely to face the highest rates of
housing instability and evictions. As the Survey of Consumer
Finances reports, these households had median cash savings
of just $550 in 2013 to weather the spells of unemployment
that low-wage workers frequently experience. And as other
recent research has shown, forced evictions disproportionately
affect single mothers, women overall, and minorities, result-
ing in recurring bouts of homelessness. To the extent that it
reflects greater housing stability, the nationwide decline in res-
idential mobility may benefit these households in particular.
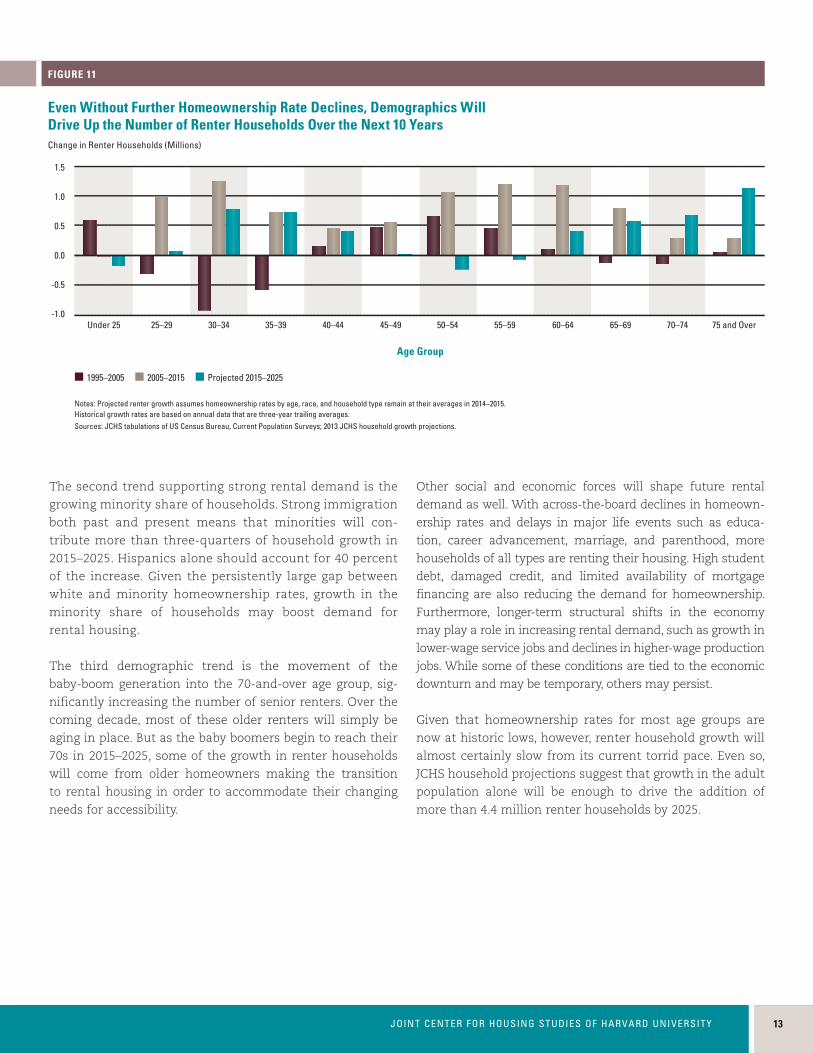
THE OUTLOOK
Three major demographic trends will shape rental hous-
ing demand over the next 10 years. First, the aging of the
millennial generation will continue to boost the number of
new renter households (Figure 11). Millennials under age 30
currently make up 11.3 million renter households, and half
of the members of this generation are still in their teens.
Over the coming decade and barring any change in home-
ownership rates, the number of millennial renters will dou-
ble to 22.6 million and the subsequent generation will add
another 500,000 new households to the ranks of renters.
201519891987 1991 1993 1995 1997 1999 2001 2003 20092005 2011 20132007
35
30
25
20
15
10
5
0
Age Group
Note: Estimates are based on annual data that are three-year trailing averages and include adults aged 18 and over only.Source: JCHS tabulations of US Census Bureau, Current Population Surveys.
■ 55 and Over ■ 45–54 ■ 35–44 ■ 25–34 ■ Under 25 ■ All
Mobility Rates Have Been Falling, Especially Among Younger AdultsShare of Adults That Moved in the Previous 12 Months (Percent)
FIGURE 10
Notes: Projected renter growth assumes homeownership rates by age, race, and household type remain at their averages in 2014–2015. Historical growth rates are based on annual data that are three-year trailing averages.Sources: JCHS tabulations of US Census Bureau, Current Population Surveys; 2013 JCHS household growth projections.
■ 1995–2005 ■ 2005–2015 ■ Projected 2015–2025
Age Group
Even Without Further Homeownership Rate Declines, Demographics Will Drive Up the Number of Renter Households Over the Next 10 Years Change in Renter Households (Millions)
FIGURE 11
Under 25 25–29 30–34 35–39 40–44 45–49 50–54 55–59 60–64 65–69 70–74 75 and Over-1.0
-0.5
0.0
0.5
1.0
1.5
31685-15_R15_4_Production_TextV3.indd 12 12/1/15 2:20 PM
2113JOINT CENTER FOR HOUSING STUDIES OF HARVARD UNIVERSITY
2113JOINT CENTER FOR HOUSING STUDIES OF HARVARD UNIVERSITY
The second trend supporting strong rental demand is the
growing minority share of households. Strong immigration
both past and present means that minorities will con-
tribute more than three-quarters of household growth in
2015–2025. Hispanics alone should account for 40 percent
of the increase. Given the persistently large gap between
white and minority homeownership rates, growth in the
minority share of households may boost demand for
rental housing.
The third demographic trend is the movement of the
baby-boom generation into the 70-and-over age group, sig-
nificantly increasing the number of senior renters. Over the
coming decade, most of these older renters will simply be
aging in place. But as the baby boomers begin to reach their
70s in 2015–2025, some of the growth in renter households
will come from older homeowners making the transition
to rental housing in order to accommodate their changing
needs for accessibility.
Other social and economic forces will shape future rental
demand as well. With across-the-board declines in homeown-
ership rates and delays in major life events such as educa-
tion, career advancement, marriage, and parenthood, more
households of all types are renting their housing. High student
debt, damaged credit, and limited availability of mortgage
financing are also reducing the demand for homeownership.
Furthermore, longer-term structural shifts in the economy
may play a role in increasing rental demand, such as growth in
lower-wage service jobs and declines in higher-wage production
jobs. While some of these conditions are tied to the economic
downturn and may be temporary, others may persist.
Given that homeownership rates for most age groups are
now at historic lows, however, renter household growth will
almost certainly slow from its current torrid pace. Even so,
JCHS household projections suggest that growth in the adult
population alone will be enough to drive the addition of
more than 4.4 million renter households by 2025.
Notes: Projected renter growth assumes homeownership rates by age, race, and household type remain at their averages in 2014–2015. Historical growth rates are based on annual data that are three-year trailing averages.Sources: JCHS tabulations of US Census Bureau, Current Population Surveys; 2013 JCHS household growth projections.
■ 1995–2005 ■ 2005–2015 ■ Projected 2015–2025
Age Group
Even Without Further Homeownership Rate Declines, Demographics Will Drive Up the Number of Renter Households Over the Next 10 Years Change in Renter Households (Millions)
FIGURE 11
Under 25 25–29 30–34 35–39 40–44 45–49 50–54 55–59 60–64 65–69 70–74 75 and Over-1.0
-0.5
0.0
0.5
1.0
1.5
31685-15_R15_4_Production_TextV3.indd 13 12/1/15 2:20 PM
14 AMERICA’S RENTAL HOUSING—EXPANDING OPTIONS FOR DIVERSE AND GROWING DEMAND14 AMERICA’S RENTAL HOUSING—EXPANDING OPTIONS FOR DIVERSE AND GROWING DEMAND
Rental housing is diverse, located in a
range of building types across metropolitan
areas. Since the housing market crash,
conversions of owner-occupied single-
family homes to rentals have accounted
for much of the growth in the stock. With
new multifamily construction serving
the high end of the market and stock
losses concentrated at the low end, the
supply of rentals affordable to lower- and
moderate-income households remains tight.
Meanwhile, demographic shifts are driving
up the need for a greater variety of low-cost
rental options.
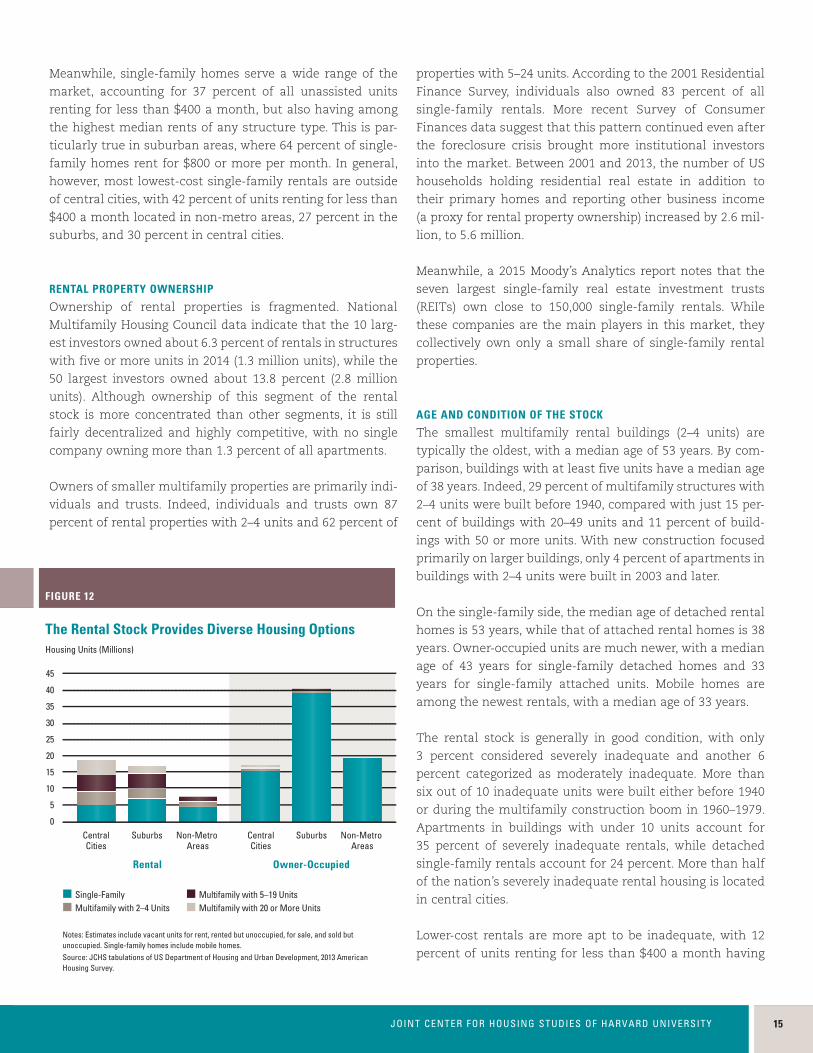
COMPOSITION OF THE STOCK
As of 2013, fully 61 percent of the nation’s 44 million rental
units were in multifamily buildings. Nearly a fifth of all rent-
als were in small structures with 2–4 units and a quarter
in mid-sized buildings with 5–19 units. Contrary to popular
perceptions, large rental buildings (with 20 or more units)
accounted for only 18 percent of the overall stock and just 25
percent of the rental supply in central cities (Figure 12).
The remainder are single-family homes. The single-family
share of the stock has risen steadily since the housing mar-
ket crash resulted in the conversion of millions of owner-
occupied homes to rentals. Early in the crisis, owners often
opted to rent their homes rather than sell in a depressed
market; later in the downturn, many homes were converted
to rentals after foreclosure.
While more than 40 percent of single-family rentals are
located in the suburbs, a third are in central cities. Indeed,
they account for a slightly larger share (27 percent) of the
rental stock in central cities than units in large multifamily
buildings with 20 or more units. Nearly a quarter of single-
family rentals are located in rural areas. Mobile homes make
up just 4 percent of the total rental stock, and are predomi-
nantly located in suburban and non-metropolitan areas.
They are most commonly found in the South, where they
account for 7 percent of the rental stock, compared with 2
percent in other regions of the country.
Units that are older and those in smaller buildings are typi-
cally less expensive than rentals in large multifamily build-
ings. More than a third (38 percent) of apartments in build-
ings with 2–4 units rent for less than $600 a month. In sharp
contrast, 27 percent of units located in buildings with 50 or
more units charge rents this low.
Notes: Estimates include vacant units for rent, rented but unoccupied, for sale, and sold but unoccupied. Single-family homes include mobile homes. Source: JCHS tabulations of US Department of Housing and Urban Development, 2013 American Housing Survey.
■ Single-Family ■ Multifamily with 5–19 Units■ Multifamily with 2–4 Units ■ Multifamily with 20 or More Units
Rental Owner-Occupied
CentralCities
Suburbs Non-Metro Areas
CentralCities
Suburbs Non-Metro Areas
45
40
35
30
25
20
15
10
5
0
The Rental Stock Provides Diverse Housing OptionsHousing Units (Millions)
FIGURE 12
R E N T A L H O U S I N G S U P P L Y
31685-15_R15_4_Production_TextV3.indd 14 12/1/15 2:20 PM
2115JOINT CENTER FOR HOUSING STUDIES OF HARVARD UNIVERSITY
Meanwhile, single-family homes serve a wide range of the
market, accounting for 37 percent of all unassisted units
renting for less than $400 a month, but also having among
the highest median rents of any structure type. This is par-
ticularly true in suburban areas, where 64 percent of single-
family homes rent for $800 or more per month. In general,
however, most lowest-cost single-family rentals are outside
of central cities, with 42 percent of units renting for less than
$400 a month located in non-metro areas, 27 percent in the
suburbs, and 30 percent in central cities.
RENTAL PROPERTY OWNERSHIP
Ownership of rental properties is fragmented. National
Multifamily Housing Council data indicate that the 10 larg-
est investors owned about 6.3 percent of rentals in structures
with five or more units in 2014 (1.3 million units), while the
50 largest investors owned about 13.8 percent (2.8 million
units). Although ownership of this segment of the rental
stock is more concentrated than other segments, it is still
fairly decentralized and highly competitive, with no single
company owning more than 1.3 percent of all apartments.
Owners of smaller multifamily properties are primarily indi-
viduals and trusts. Indeed, individuals and trusts own 87
percent of rental properties with 2–4 units and 62 percent of
properties with 5–24 units. According to the 2001 Residential
Finance Survey, individuals also owned 83 percent of all
single-family rentals. More recent Survey of Consumer
Finances data suggest that this pattern continued even after
the foreclosure crisis brought more institutional investors
into the market. Between 2001 and 2013, the number of US
households holding residential real estate in addition to
their primary homes and reporting other business income
(a proxy for rental property ownership) increased by 2.6 mil-
lion, to 5.6 million.
Meanwhile, a 2015 Moody’s Analytics report notes that the
seven largest single-family real estate investment trusts
(REITs) own close to 150,000 single-family rentals. While
these companies are the main players in this market, they
collectively own only a small share of single-family rental
properties.
AGE AND CONDITION OF THE STOCK
The smallest multifamily rental buildings (2–4 units) are
typically the oldest, with a median age of 53 years. By com-
parison, buildings with at least five units have a median age
of 38 years. Indeed, 29 percent of multifamily structures with
2–4 units were built before 1940, compared with just 15 per-
cent of buildings with 20–49 units and 11 percent of build-
ings with 50 or more units. With new construction focused
primarily on larger buildings, only 4 percent of apartments in
buildings with 2–4 units were built in 2003 and later.
On the single-family side, the median age of detached rental
homes is 53 years, while that of attached rental homes is 38
years. Owner-occupied units are much newer, with a median
age of 43 years for single-family detached homes and 33
years for single-family attached units. Mobile homes are
among the newest rentals, with a median age of 33 years.
The rental stock is generally in good condition, with only
3 percent considered severely inadequate and another 6
percent categorized as moderately inadequate. More than
six out of 10 inadequate units were built either before 1940
or during the multifamily construction boom in 1960–1979.
Apartments in buildings with under 10 units account for
35 percent of severely inadequate rentals, while detached
single-family rentals account for 24 percent. More than half
of the nation’s severely inadequate rental housing is located
in central cities.
Lower-cost rentals are more apt to be inadequate, with 12
percent of units renting for less than $400 a month having
Notes: Estimates include vacant units for rent, rented but unoccupied, for sale, and sold but unoccupied. Single-family homes include mobile homes. Source: JCHS tabulations of US Department of Housing and Urban Development, 2013 American Housing Survey.
■ Single-Family ■ Multifamily with 5–19 Units■ Multifamily with 2–4 Units ■ Multifamily with 20 or More Units
Rental Owner-Occupied
CentralCities
Suburbs Non-Metro Areas
CentralCities
Suburbs Non-Metro Areas
45
40
35
30
25
20
15
10
5
0
The Rental Stock Provides Diverse Housing OptionsHousing Units (Millions)
FIGURE 12
31685-15_R15_4_Production_TextV3.indd 15 12/1/15 2:20 PM
16 AMERICA’S RENTAL HOUSING—EXPANDING OPTIONS FOR DIVERSE AND GROWING DEMAND
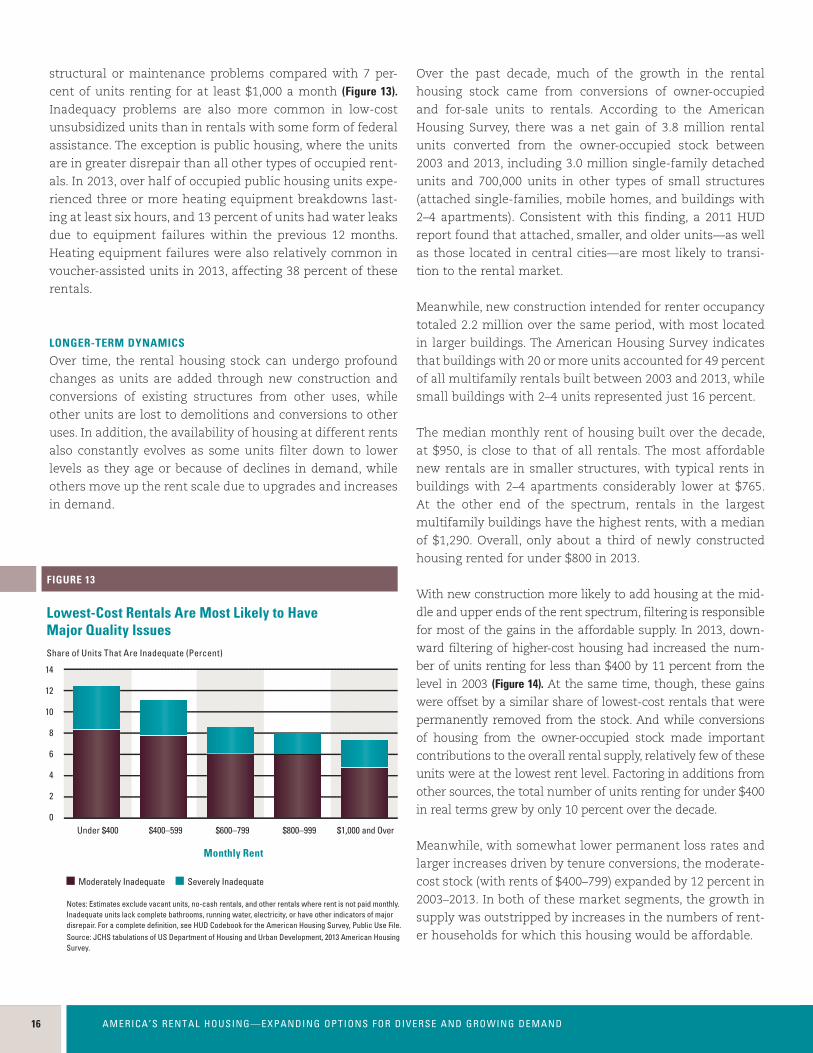
structural or maintenance problems compared with 7 per-
cent of units renting for at least $1,000 a month (Figure 13).Inadequacy problems are also more common in low-cost
unsubsidized units than in rentals with some form of federal
assistance. The exception is public housing, where the units
are in greater disrepair than all other types of occupied rent-
als. In 2013, over half of occupied public housing units expe-
rienced three or more heating equipment breakdowns last-
ing at least six hours, and 13 percent of units had water leaks
due to equipment failures within the previous 12 months.
Heating equipment failures were also relatively common in
voucher-assisted units in 2013, affecting 38 percent of these
rentals.
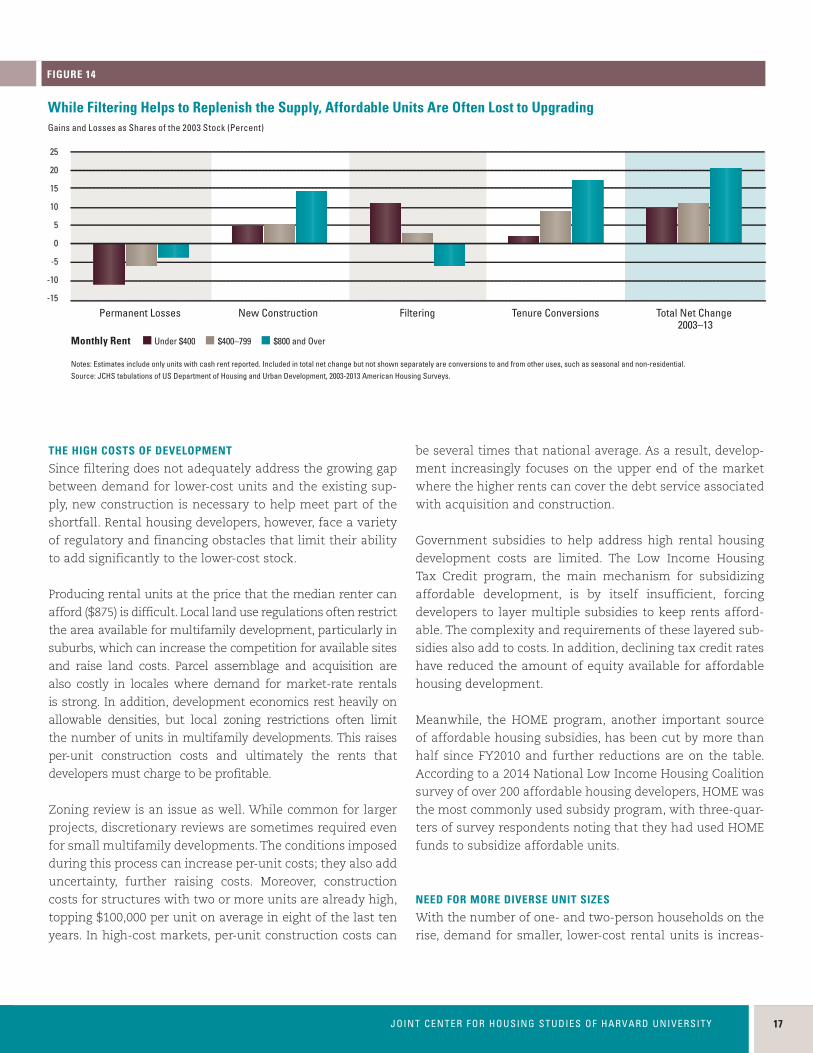
LONGER-TERM DYNAMICS
Over time, the rental housing stock can undergo profound
changes as units are added through new construction and
conversions of existing structures from other uses, while
other units are lost to demolitions and conversions to other
uses. In addition, the availability of housing at different rents
also constantly evolves as some units filter down to lower
levels as they age or because of declines in demand, while
others move up the rent scale due to upgrades and increases
in demand.
Over the past decade, much of the growth in the rental
housing stock came from conversions of owner-occupied
and for-sale units to rentals. According to the American
Housing Survey, there was a net gain of 3.8 million rental
units converted from the owner-occupied stock between
2003 and 2013, including 3.0 million single-family detached
units and 700,000 units in other types of small structures
(attached single-families, mobile homes, and buildings with
2–4 apartments). Consistent with this finding, a 2011 HUD
report found that attached, smaller, and older units—as well
as those located in central cities—are most likely to transi-
tion to the rental market.
Meanwhile, new construction intended for renter occupancy
totaled 2.2 million over the same period, with most located
in larger buildings. The American Housing Survey indicates
that buildings with 20 or more units accounted for 49 percent
of all multifamily rentals built between 2003 and 2013, while
small buildings with 2–4 units represented just 16 percent.
The median monthly rent of housing built over the decade,
at $950, is close to that of all rentals. The most affordable
new rentals are in smaller structures, with typical rents in
buildings with 2–4 apartments considerably lower at $765.
At the other end of the spectrum, rentals in the largest
multifamily buildings have the highest rents, with a median
of $1,290. Overall, only about a third of newly constructed
housing rented for under $800 in 2013.
With new construction more likely to add housing at the mid-
dle and upper ends of the rent spectrum, filtering is responsible
for most of the gains in the affordable supply. In 2013, down-
ward filtering of higher-cost housing had increased the num-
ber of units renting for less than $400 by 11 percent from the
level in 2003 (Figure 14). At the same time, though, these gains
were offset by a similar share of lowest-cost rentals that were
permanently removed from the stock. And while conversions
of housing from the owner-occupied stock made important
contributions to the overall rental supply, relatively few of these
units were at the lowest rent level. Factoring in additions from
other sources, the total number of units renting for under $400
in real terms grew by only 10 percent over the decade.
Meanwhile, with somewhat lower permanent loss rates and
larger increases driven by tenure conversions, the moderate-
cost stock (with rents of $400–799) expanded by 12 percent in
2003–2013. In both of these market segments, the growth in
supply was outstripped by increases in the numbers of rent-
er households for which this housing would be affordable.
Notes: Estimates exclude vacant units, no-cash rentals, and other rentals where rent is not paid monthly. Inadequate units lack complete bathrooms, running water, electricity, or have other indicators of major disrepair. For a complete definition, see HUD Codebook for the American Housing Survey, Public Use File.Source: JCHS tabulations of US Department of Housing and Urban Development, 2013 American Housing Survey.
Under $400 $400–599 $600–799 $800–999 $1,000 and Over
Moderately Inadequate Severely Inadequate
Monthly Rent
Lowest-Cost Rentals Are Most Likely to Have Major Quality IssuesShare of Units That Are Inadequate (Percent)
FIGURE 13
14
12
10
8
6
4
2
0
Notes: Estimates include only units with cash rent reported. Included in total net change but not shown separately are conversions to and from other uses, such as seasonal and non-residential.Source: JCHS tabulations of US Department of Housing and Urban Development, 2003-2013 American Housing Surveys.
■ Under $400 ■ $400–799 ■ $800 and Over
Permanent Losses New Construction Filtering Tenure Conversions
Monthly Rent
Total Net Change 2003–13
25
20
15
10
5
0
-5
-10
-15
While Filtering Helps to Replenish the Supply, Affordable Units Are Often Lost to UpgradingGains and Losses as Shares of the 2003 Stock (Percent)
FIGURE 14
31685-15_R15_4_Production_TextV3.indd 16 12/1/15 2:20 PM
2117JOINT CENTER FOR HOUSING STUDIES OF HARVARD UNIVERSITY
THE HIGH COSTS OF DEVELOPMENT
Since filtering does not adequately address the growing gap
between demand for lower-cost units and the existing sup-
ply, new construction is necessary to help meet part of the
shortfall. Rental housing developers, however, face a variety
of regulatory and financing obstacles that limit their ability
to add significantly to the lower-cost stock.
Producing rental units at the price that the median renter can
afford ($875) is difficult. Local land use regulations often restrict
the area available for multifamily development, particularly in
suburbs, which can increase the competition for available sites
and raise land costs. Parcel assemblage and acquisition are
also costly in locales where demand for market-rate rentals
is strong. In addition, development economics rest heavily on
allowable densities, but local zoning restrictions often limit
the number of units in multifamily developments. This raises
per-unit construction costs and ultimately the rents that
developers must charge to be profitable.
Zoning review is an issue as well. While common for larger
projects, discretionary reviews are sometimes required even
for small multifamily developments. The conditions imposed
during this process can increase per-unit costs; they also add
uncertainty, further raising costs. Moreover, construction
costs for structures with two or more units are already high,
topping $100,000 per unit on average in eight of the last ten
years. In high-cost markets, per-unit construction costs can
be several times that national average. As a result, develop-
ment increasingly focuses on the upper end of the market
where the higher rents can cover the debt service associated
with acquisition and construction.
Government subsidies to help address high rental housing
development costs are limited. The Low Income Housing
Tax Credit program, the main mechanism for subsidizing
affordable development, is by itself insufficient, forcing
developers to layer multiple subsidies to keep rents afford-
able. The complexity and requirements of these layered sub-
sidies also add to costs. In addition, declining tax credit rates
have reduced the amount of equity available for affordable
housing development.
Meanwhile, the HOME program, another important source
of affordable housing subsidies, has been cut by more than
half since FY2010 and further reductions are on the table.
According to a 2014 National Low Income Housing Coalition
survey of over 200 affordable housing developers, HOME was
the most commonly used subsidy program, with three-quar-
ters of survey respondents noting that they had used HOME
funds to subsidize affordable units.
NEED FOR MORE DIVERSE UNIT SIZES
With the number of one- and two-person households on the
rise, demand for smaller, lower-cost rental units is increas-
Notes: Estimates include only units with cash rent reported. Included in total net change but not shown separately are conversions to and from other uses, such as seasonal and non-residential.Source: JCHS tabulations of US Department of Housing and Urban Development, 2003-2013 American Housing Surveys.
■ Under $400 ■ $400–799 ■ $800 and Over
Permanent Losses New Construction Filtering Tenure Conversions
Monthly Rent
Total Net Change 2003–13
25
20
15
10
5
0
-5
-10
-15
While Filtering Helps to Replenish the Supply, Affordable Units Are Often Lost to UpgradingGains and Losses as Shares of the 2003 Stock (Percent)
FIGURE 14
31685-15_R15_4_Production_TextV3.indd 17 12/1/15 2:20 PM
18 AMERICA’S RENTAL HOUSING—EXPANDING OPTIONS FOR DIVERSE AND GROWING DEMAND18 AMERICA’S RENTAL HOUSING—EXPANDING OPTIONS FOR DIVERSE AND GROWING DEMAND
ing. “Micro” units are one solution that is gaining traction.
These units, often just a few hundred square feet in size, are
generally targeted to younger professionals willing to trade
off space for location, but they may have appeal for older
single-person and two-person households as well. Since
land use regulations often pose impediments to construction
of these small units, several cities are experimenting with
regulatory relief, including reduced parking requirements or
waivers on minimum unit size.
As New York University’s Furman Center points out, how-
ever, even though their overall rents are lower, micro units
in many cities often have higher rents per square foot than
larger units. Given that single-person households have
among the lowest median incomes of any renter household
type, it remains to be seen whether new micro units will be
a lower-cost alternative for this market.
Accessory dwelling units (ADUs)—apartments added to single-
family properties—are another lower-cost rental option intend-
ed for smaller households. While many communities still pro-
hibit or restrict ADUs, some are taking steps to reform zoning to
reduce barriers to their construction. Other municipalities are
considering how to legalize existing units that violate building
or zoning codes. As a 2011 study from the Berkeley Institute
of Urban and Regional Development found, illegal ADUs may
account for 2–10 percent of the housing stock in some densely
occupied communities on the East and West Coasts.
Meanwhile, nearly a third of renters are parents with chil-
dren and thus require more space. Not surprisingly, close
to half of these households rent single-family homes,
which typically have more bedrooms than multifamily
units and are more likely to be located in suburban com-
munities. But as noted earlier, single-family homes have
among the highest median rents of any type of rental
housing and are therefore beyond the means of many
lower-income families.
The other half of parent-child households live in multifam-
ily housing. Apartments in buildings with five or more units
tend to be smaller than single-family rentals: only 14 percent
have at least 1,200 square feet, compared with 66 percent of
single-family rentals. Similarly, just 9 percent of apartments
in buildings with five or more units have at least three bed-
rooms, compared with 65 percent of single-family rentals.
Multifamily buildings with 2–4 units tend to be more family-
friendly than larger structures, offering more bedrooms and
lower rents (Figure 15). But these units are older and at higher
risk of loss from the housing stock. In addition, in some loca-
tions like Boston, these units are often occupied by groups of
roommates who are able to pay higher rents than families.
Several cities are considering financing and zoning mecha-
nisms to encourage development of at least some larger
rental units. The common concern for developers, however,
is that these units are less economical to build. For residents
of some suburban communities, the fear is that building
larger apartments will attract more renter households with
children and thus overburden local schools.
SHORTFALL IN ACCESSIBLE UNITS
According to the 2011 American Housing Survey, more than
7 million renter households have at least one member with
a disability related to hearing, vision, cognition, mobility, self-
care, or independent living. Some 4.3 million of these renter
households have someone at home who has serious difficulty
walking or climbing stairs. The incidence of disabilities increas-
es sharply with age: among those aged 80 and over, fully 65
percent of renter households have at least one disability. With
the aging of the baby-boom generation, the number of renters
with disabilities is thus set to rise sharply in the years ahead.
Even so, less than 1.0 percent of US rentals—roughly 365,800
units—include five basic universal design features: no-step
entry, single-floor living, lever-style door handles, accessible
electrical controls, and extra-wide doors and hallways. With
its older stock, the Northeast has the least accessible rental
housing inventory in the country. And in the nation as a whole,
the recent conversion of many single-family homes to rentals
raises additional accessibility concerns, given that these units—
particularly attached single-families—tend to have fewer uni-
versal design features, especially single-floor living.
Although rentals in newer and larger multifamily buildings
are more apt to include some universal design features, few
offer all five of the basic features listed above. Indeed, just 6
percent of units in buildings constructed in 2003 and later,
and 11 percent of units in buildings with 20 or more units,
do so. Although the Fair Housing Act requires that buildings
with four or more units constructed after 1991 include some
accessibility features, these regulations do not guarantee that
rental units will be accessible to all persons with disabilities.
In addition, existing legal protections related to accessibility
better serve older renters living in multifamily buildings than
those who rent single-family homes: unless the units receive
federal subsidies, Fair Housing Act standards and other acces-
sibility guidelines do not apply to single-family detached rent-
als or units in two- and three-family structures.Notes: Estimates include vacant units. Monthly rent calculations exclude no-cash rentals and other rentals where rent is not paid monthly.Source: JCHS tabulations of US Department of Housing and Urban Development, 2013 American Housing Survey.
Size
■ 0–1 Bedrooms ■ 2 Bedrooms ■ 3 or More Bedrooms
Rent
■ Under $400 ■ $400–599 ■ $600–799 ■ $800–999 ■ $1,000 and Over
Single-Family Multifamily with 2–4 Units
Multifamily with5 or More Units
Single-Family Multifamily with 2–4 Units
Multifamily with5 or More Units
100
90
80
70
60
50
40
30
20
10
0
100
90
80
70
60
50
40
30
20
10
0
Small Buildings Play a Key Role in Providing Low-Cost, Family-Sized Units Distribution of Rental Units by Size (Percent) Distribution of Rental Units by Rent (Percent)
FIGURE 15
31685-15_R15_4_Production_TextV3.indd 18 12/1/15 2:20 PM
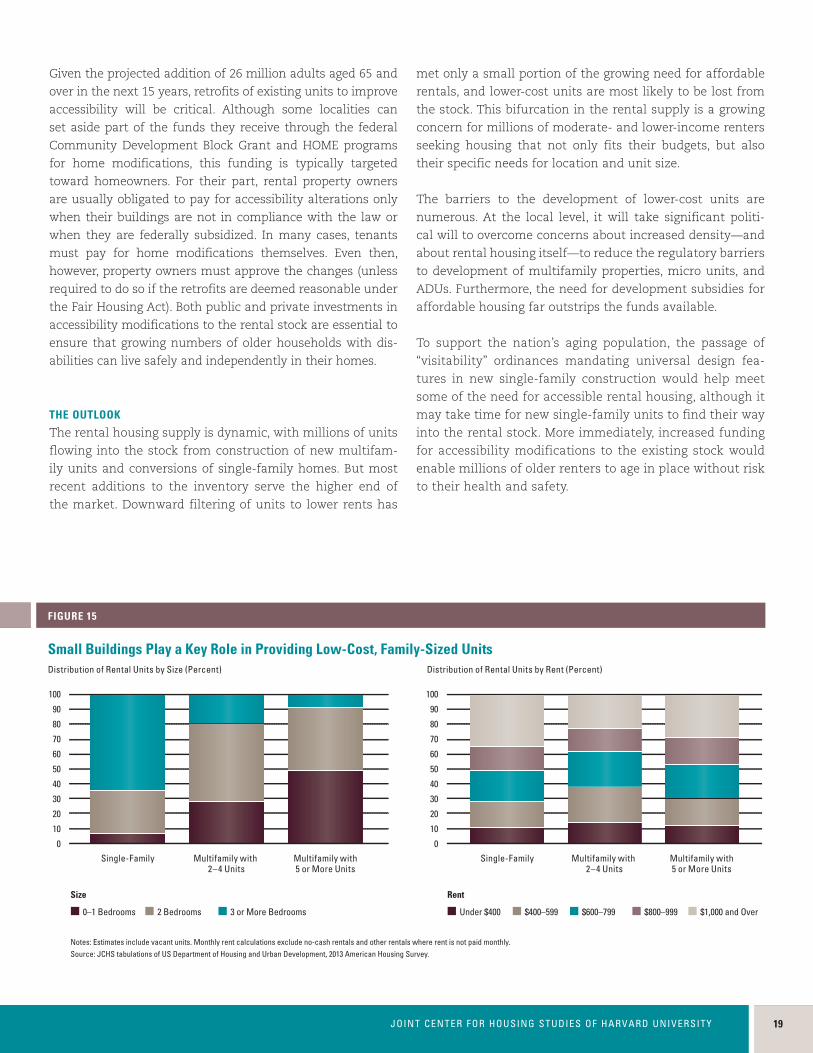
2119JOINT CENTER FOR HOUSING STUDIES OF HARVARD UNIVERSITY
2119JOINT CENTER FOR HOUSING STUDIES OF HARVARD UNIVERSITY
Given the projected addition of 26 million adults aged 65 and
over in the next 15 years, retrofits of existing units to improve
accessibility will be critical. Although some localities can
set aside part of the funds they receive through the federal
Community Development Block Grant and HOME programs
for home modifications, this funding is typically targeted
toward homeowners. For their part, rental property owners
are usually obligated to pay for accessibility alterations only
when their buildings are not in compliance with the law or
when they are federally subsidized. In many cases, tenants
must pay for home modifications themselves. Even then,
however, property owners must approve the changes (unless
required to do so if the retrofits are deemed reasonable under
the Fair Housing Act). Both public and private investments in
accessibility modifications to the rental stock are essential to
ensure that growing numbers of older households with dis-
abilities can live safely and independently in their homes.
THE OUTLOOK
The rental housing supply is dynamic, with millions of units
flowing into the stock from construction of new multifam-
ily units and conversions of single-family homes. But most
recent additions to the inventory serve the higher end of
the market. Downward filtering of units to lower rents has
met only a small portion of the growing need for affordable
rentals, and lower-cost units are most likely to be lost from
the stock. This bifurcation in the rental supply is a growing
concern for millions of moderate- and lower-income renters
seeking housing that not only fits their budgets, but also
their specific needs for location and unit size.
The barriers to the development of lower-cost units are
numerous. At the local level, it will take significant politi-
cal will to overcome concerns about increased density—and
about rental housing itself—to reduce the regulatory barriers
to development of multifamily properties, micro units, and
ADUs. Furthermore, the need for development subsidies for
affordable housing far outstrips the funds available.
To support the nation’s aging population, the passage of
“visitability” ordinances mandating universal design fea-
tures in new single-family construction would help meet
some of the need for accessible rental housing, although it
may take time for new single-family units to find their way
into the rental stock. More immediately, increased funding
for accessibility modifications to the existing stock would
enable millions of older renters to age in place without risk
to their health and safety.
Notes: Estimates include vacant units. Monthly rent calculations exclude no-cash rentals and other rentals where rent is not paid monthly.Source: JCHS tabulations of US Department of Housing and Urban Development, 2013 American Housing Survey.
Size
■ 0–1 Bedrooms ■ 2 Bedrooms ■ 3 or More Bedrooms
Rent
■ Under $400 ■ $400–599 ■ $600–799 ■ $800–999 ■ $1,000 and Over
Single-Family Multifamily with 2–4 Units
Multifamily with5 or More Units
Single-Family Multifamily with 2–4 Units
Multifamily with5 or More Units
100
90
80
70
60
50
40
30
20
10
0
100
90
80
70
60
50
40
30
20
10
0
Small Buildings Play a Key Role in Providing Low-Cost, Family-Sized Units Distribution of Rental Units by Size (Percent) Distribution of Rental Units by Rent (Percent)
FIGURE 15
31685-15_R15_4_Production_TextV3.indd 19 12/1/15 2:20 PM
20 AMERICA’S RENTAL HOUSING—EXPANDING OPTIONS FOR DIVERSE AND GROWING DEMAND20 AMERICA’S RENTAL HOUSING—EXPANDING OPTIONS FOR DIVERSE AND GROWING DEMAND
R E N T A L M A R K E T C O N D I T I O N S
Rising rents, low and declining vacancy
rates, and double-digit growth in
multifamily construction all point to strong
rental markets. Multifamily property prices
are also soaring, attracting new capital
from investors and private lenders. For
renter households, however, increasingly
tight market conditions have meant even
more limited availability of housing that
they can afford.
RENTS RISING ACROSS THE NATION
Perhaps the clearest sign of rental market strength is the
widespread rise in rents. Indeed, the consumer price index
(CPI) for contract rents (a broad and therefore conservative
measure) indicates that rents are climbing at an accelerating
rate. After increasing by an average of 2.7 percent annually
since 2011, nominal rents were up 3.5 percent during the 12
months ending September 2015 (Figure 16). With overall infla-
tion slowing to just 0.4 percent, the real increase in rents in
the preceding 24 months was larger than in any other two-
year period since 1987.
Other rent indexes confirm this trend. In fact, data from
MPF Research, which cover professionally managed apart-
ments and tend to be more responsive to changing market
conditions than the CPI for rent, show an even larger jump.
According to MPF’s same-store measure, nominal apart-
ment rents were up at a 5.6 percent annual rate in the third
quarter of 2015, with some markets—including Portland, San
Francisco, Fort Myers, and Denver—reporting increases of 10
percent or more.
Rents for newly constructed units are rising especially rap-
idly. The Survey of Market Absorption indicates that the
median asking rent for a newly completed apartment hit
$1,372 in 2014—nearly 50 percent above the US median
rent of $934. This marked a 7 percent increase in new-unit
median rents last year and a 26 percent increase over the
previous two years.
Nationwide, rent gains in all of the 94 metro areas tracked by
MPF Research exceeded overall inflation in the third quarter
of 2015. Year-over-year increases in markets in the South
and West were especially large, with real rents in 32 metros
in those regions climbing 5.0 percent or more. Increases
were more modest in metros of the Northeast (3.8 percent)
and Midwest (3.5 percent). Meanwhile, rents in Des Moines,
Pittsburgh, and Toledo edged up by less than 2.0 percent in
the third quarter. Other metros with similarly small rent
Source: JCHS tabulations of US Bureau of Labor Statistics and MPF Research data.
■ Rents for Professionally Managed Apartments ■ Prices for All Consumer Items■ Rent Index for Primary Residence
200720062005
2006
2008 2009 201320122010 2014 20152011
6543210
-1-2-3-4-5-6
Rent Increases Continue to Outpace InflationAnnual Change (Percent)
FIGURE 16
Note: Estimates are four-quarter rolling averages. Data for 2015 are as of the third quarter. Source: JCHS tabulations of US Census Bureau, Housing Vacancy Surveys via Moody’s economy.com and MPF Research data.
■ Professionally Managed Apartments ■ All Rentals
2000 2001 2002 2003 2004 2005 2006 2007 2008 2009 2010 2011 2012 2013 2014 2015
12
10
8
6
4
2
0
FIGURE 17
Rental Markets Continue to Tighten Vacancy Rate (Percent)
31685-15_R15_4_Production_TextV3.indd 20 12/1/15 2:20 PM
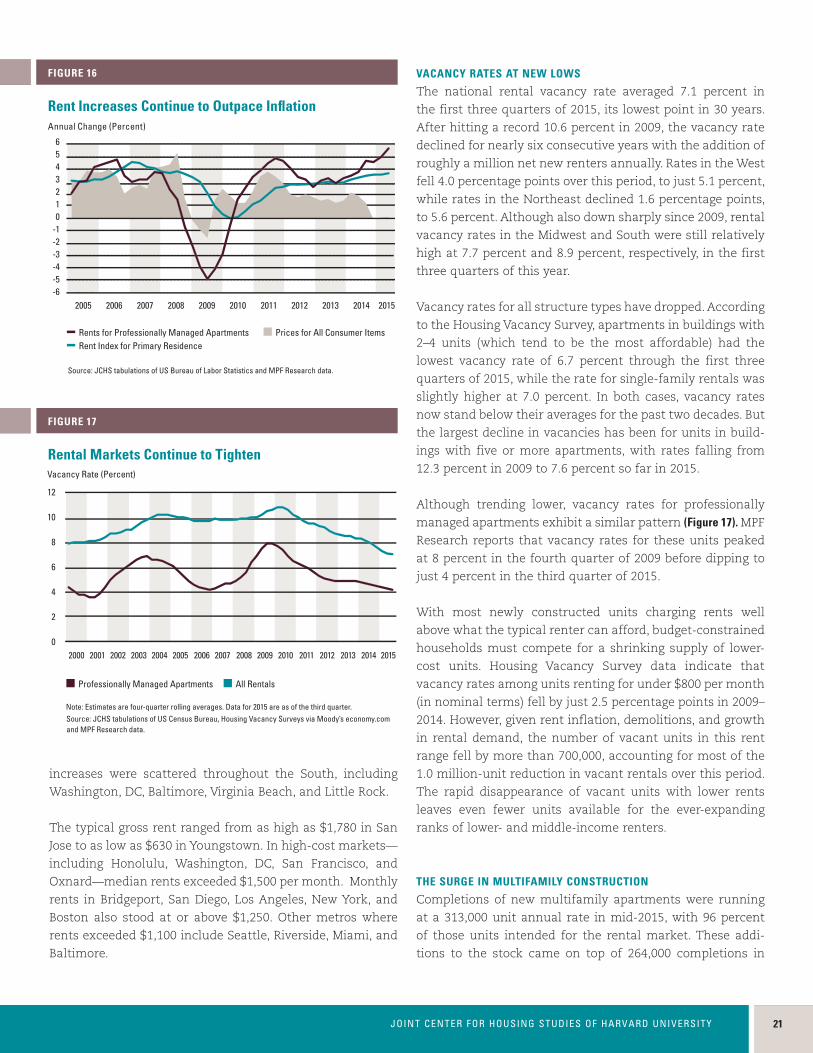
2121JOINT CENTER FOR HOUSING STUDIES OF HARVARD UNIVERSITY
2121JOINT CENTER FOR HOUSING STUDIES OF HARVARD UNIVERSITY
increases were scattered throughout the South, including
Washington, DC, Baltimore, Virginia Beach, and Little Rock.
The typical gross rent ranged from as high as $1,780 in San
Jose to as low as $630 in Youngstown. In high-cost markets—
including Honolulu, Washington, DC, San Francisco, and
Oxnard—median rents exceeded $1,500 per month. Monthly
rents in Bridgeport, San Diego, Los Angeles, New York, and
Boston also stood at or above $1,250. Other metros where
rents exceeded $1,100 include Seattle, Riverside, Miami, and
Baltimore.
VACANCY RATES AT NEW LOWS
The national rental vacancy rate averaged 7.1 percent in
the first three quarters of 2015, its lowest point in 30 years.
After hitting a record 10.6 percent in 2009, the vacancy rate
declined for nearly six consecutive years with the addition of
roughly a million net new renters annually. Rates in the West
fell 4.0 percentage points over this period, to just 5.1 percent,
while rates in the Northeast declined 1.6 percentage points,
to 5.6 percent. Although also down sharply since 2009, rental
vacancy rates in the Midwest and South were still relatively
high at 7.7 percent and 8.9 percent, respectively, in the first
three quarters of this year.
Vacancy rates for all structure types have dropped. According
to the Housing Vacancy Survey, apartments in buildings with
2–4 units (which tend to be the most affordable) had the
lowest vacancy rate of 6.7 percent through the first three
quarters of 2015, while the rate for single-family rentals was
slightly higher at 7.0 percent. In both cases, vacancy rates
now stand below their averages for the past two decades. But
the largest decline in vacancies has been for units in build-
ings with five or more apartments, with rates falling from
12.3 percent in 2009 to 7.6 percent so far in 2015.
Although trending lower, vacancy rates for professionally
managed apartments exhibit a similar pattern (Figure 17). MPF
Research reports that vacancy rates for these units peaked
at 8 percent in the fourth quarter of 2009 before dipping to
just 4 percent in the third quarter of 2015.
With most newly constructed units charging rents well
above what the typical renter can afford, budget-constrained
households must compete for a shrinking supply of lower-
cost units. Housing Vacancy Survey data indicate that
vacancy rates among units renting for under $800 per month
(in nominal terms) fell by just 2.5 percentage points in 2009–
2014. However, given rent inflation, demolitions, and growth
in rental demand, the number of vacant units in this rent
range fell by more than 700,000, accounting for most of the
1.0 million-unit reduction in vacant rentals over this period.
The rapid disappearance of vacant units with lower rents
leaves even fewer units available for the ever-expanding
ranks of lower- and middle-income renters.
THE SURGE IN MULTIFAMILY CONSTRUCTION
Completions of new multifamily apartments were running
at a 313,000 unit annual rate in mid-2015, with 96 percent
of those units intended for the rental market. These addi-
tions to the stock came on top of 264,000 completions in
Source: JCHS tabulations of US Bureau of Labor Statistics and MPF Research data.
■ Rents for Professionally Managed Apartments ■ Prices for All Consumer Items■ Rent Index for Primary Residence
200720062005
2006
2008 2009 201320122010 2014 20152011
6543210
-1-2-3-4-5-6
Rent Increases Continue to Outpace InflationAnnual Change (Percent)
FIGURE 16
Note: Estimates are four-quarter rolling averages. Data for 2015 are as of the third quarter. Source: JCHS tabulations of US Census Bureau, Housing Vacancy Surveys via Moody’s economy.com and MPF Research data.
■ Professionally Managed Apartments ■ All Rentals
2000 2001 2002 2003 2004 2005 2006 2007 2008 2009 2010 2011 2012 2013 2014 2015
12
10
8
6
4
2
0
FIGURE 17
Rental Markets Continue to Tighten Vacancy Rate (Percent)
31685-15_R15_4_Production_TextV3.indd 21 12/1/15 2:20 PM
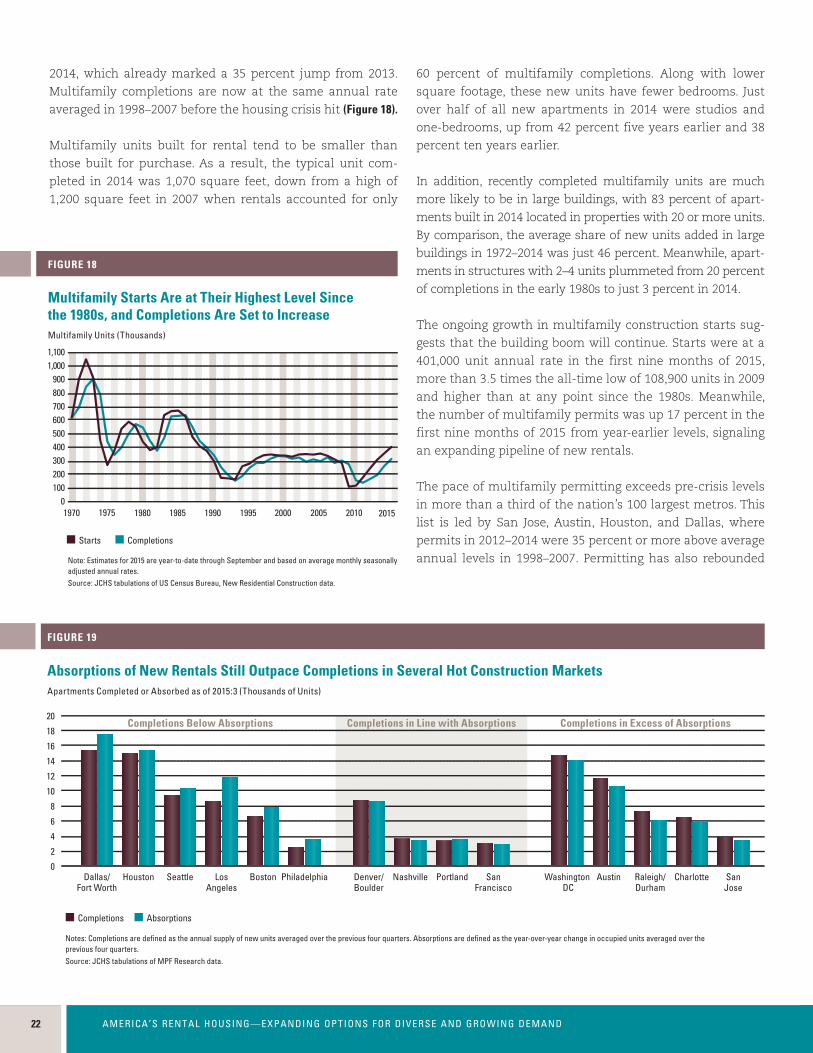
22 AMERICA’S RENTAL HOUSING—EXPANDING OPTIONS FOR DIVERSE AND GROWING DEMAND
2014, which already marked a 35 percent jump from 2013.
Multifamily completions are now at the same annual rate
averaged in 1998–2007 before the housing crisis hit (Figure 18).
Multifamily units built for rental tend to be smaller than
those built for purchase. As a result, the typical unit com-
pleted in 2014 was 1,070 square feet, down from a high of
1,200 square feet in 2007 when rentals accounted for only
60 percent of multifamily completions. Along with lower
square footage, these new units have fewer bedrooms. Just
over half of all new apartments in 2014 were studios and
one-bedrooms, up from 42 percent five years earlier and 38
percent ten years earlier.
In addition, recently completed multifamily units are much
more likely to be in large buildings, with 83 percent of apart-
ments built in 2014 located in properties with 20 or more units.
By comparison, the average share of new units added in large
buildings in 1972–2014 was just 46 percent. Meanwhile, apart-
ments in structures with 2–4 units plummeted from 20 percent
of completions in the early 1980s to just 3 percent in 2014.
The ongoing growth in multifamily construction starts sug-
gests that the building boom will continue. Starts were at a
401,000 unit annual rate in the first nine months of 2015,
more than 3.5 times the all-time low of 108,900 units in 2009
and higher than at any point since the 1980s. Meanwhile,
the number of multifamily permits was up 17 percent in the
first nine months of 2015 from year-earlier levels, signaling
an expanding pipeline of new rentals.
The pace of multifamily permitting exceeds pre-crisis levels
in more than a third of the nation’s 100 largest metros. This
list is led by San Jose, Austin, Houston, and Dallas, where
permits in 2012–2014 were 35 percent or more above average
annual levels in 1998–2007. Permitting has also reboundedNote: Estimates for 2015 are year-to-date through September and based on average monthly seasonally adjusted annual rates.Source: JCHS tabulations of US Census Bureau, New Residential Construction data.
■ Starts ■ Completions
19751970 1980 1985 1990 201020051995 20152000
1,1001,000
900800700600500400300200100
0
Multifamily Starts Are at Their Highest Level Since the 1980s, and Completions Are Set to IncreaseMultifamily Units (Thousands)
FIGURE 18
Note: Estimates for 2015 are through September. Sources: CoreLogic, US National Home Price Index; Moody’s Investors Service and Real Capital Analytics, Commercial Property Price Index for Apartments.
■ Apartment Property Price Index ■ Single-Family Home Price Index
20072006
2006
2008 2009 201320122010 2014 20152011
260
240
220
200
180
160
140
120
100
Prices for Apartment Properties Have Rebounded Well Beyond Their Previous PeakPrice Index (December 2000=100)
FIGURE 20
Notes: Completions are defined as the annual supply of new units averaged over the previous four quarters. Absorptions are defined as the year-over-year change in occupied units averaged over the previous four quarters.Source: JCHS tabulations of MPF Research data.
Completions Absorptions
Absorptions of New Rentals Still Outpace Completions in Several Hot Construction MarketsApartments Completed or Absorbed as of 2015:3 (Thousands of Units)
FIGURE 19
20
18
16
14
12
10
8
6
4
2
0Dallas/
Fort WorthSeattle Los
AngelesHouston Washington
DCDenver/Boulder
Raleigh/Durham
Nashville Portland Austin CharlotteBoston SanJose
SanFrancisco
Philadelphia
Completions Below Absorptions Completions in Line with Absorptions Completions in Excess of Absorptions
31685-15_R15_4_Production_TextV3.indd 22 12/1/15 2:20 PM
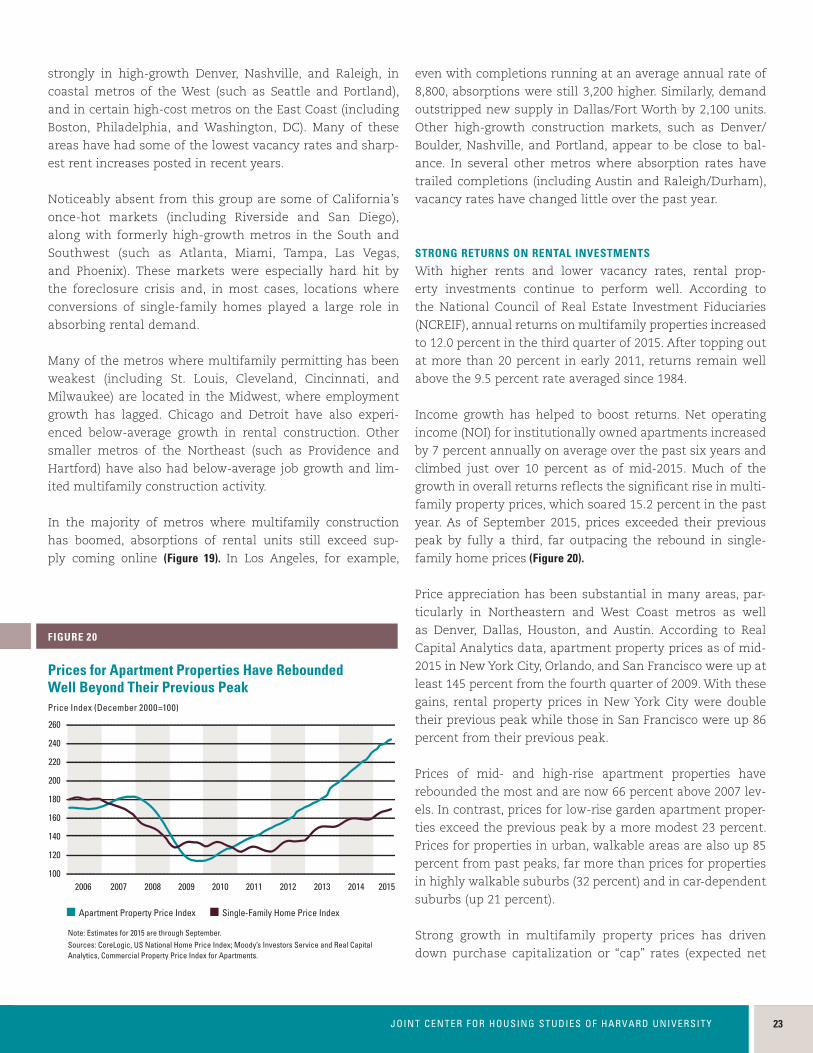
2123JOINT CENTER FOR HOUSING STUDIES OF HARVARD UNIVERSITY
strongly in high-growth Denver, Nashville, and Raleigh, in
coastal metros of the West (such as Seattle and Portland),
and in certain high-cost metros on the East Coast (including
Boston, Philadelphia, and Washington, DC). Many of these
areas have had some of the lowest vacancy rates and sharp-
est rent increases posted in recent years.
Noticeably absent from this group are some of California’s
once-hot markets (including Riverside and San Diego),
along with formerly high-growth metros in the South and
Southwest (such as Atlanta, Miami, Tampa, Las Vegas,
and Phoenix). These markets were especially hard hit by
the foreclosure crisis and, in most cases, locations where
conversions of single-family homes played a large role in
absorbing rental demand.
Many of the metros where multifamily permitting has been
weakest (including St. Louis, Cleveland, Cincinnati, and
Milwaukee) are located in the Midwest, where employment
growth has lagged. Chicago and Detroit have also experi-
enced below-average growth in rental construction. Other
smaller metros of the Northeast (such as Providence and
Hartford) have also had below-average job growth and lim-
ited multifamily construction activity.
In the majority of metros where multifamily construction
has boomed, absorptions of rental units still exceed sup-
ply coming online (Figure 19). In Los Angeles, for example,
even with completions running at an average annual rate of
8,800, absorptions were still 3,200 higher. Similarly, demand
outstripped new supply in Dallas/Fort Worth by 2,100 units.
Other high-growth construction markets, such as Denver/
Boulder, Nashville, and Portland, appear to be close to bal-
ance. In several other metros where absorption rates have
trailed completions (including Austin and Raleigh/Durham),
vacancy rates have changed little over the past year.
STRONG RETURNS ON RENTAL INVESTMENTS
With higher rents and lower vacancy rates, rental prop-
erty investments continue to perform well. According to
the National Council of Real Estate Investment Fiduciaries
(NCREIF), annual returns on multifamily properties increased
to 12.0 percent in the third quarter of 2015. After topping out
at more than 20 percent in early 2011, returns remain well
above the 9.5 percent rate averaged since 1984.
Income growth has helped to boost returns. Net operating
income (NOI) for institutionally owned apartments increased
by 7 percent annually on average over the past six years and
climbed just over 10 percent as of mid-2015. Much of the
growth in overall returns reflects the significant rise in multi-
family property prices, which soared 15.2 percent in the past
year. As of September 2015, prices exceeded their previous
peak by fully a third, far outpacing the rebound in single-
family home prices (Figure 20).
Price appreciation has been substantial in many areas, par-
ticularly in Northeastern and West Coast metros as well
as Denver, Dallas, Houston, and Austin. According to Real
Capital Analytics data, apartment property prices as of mid-
2015 in New York City, Orlando, and San Francisco were up at
least 145 percent from the fourth quarter of 2009. With these
gains, rental property prices in New York City were double
their previous peak while those in San Francisco were up 86
percent from their previous peak.
Prices of mid- and high-rise apartment properties have
rebounded the most and are now 66 percent above 2007 lev-
els. In contrast, prices for low-rise garden apartment proper-
ties exceed the previous peak by a more modest 23 percent.
Prices for properties in urban, walkable areas are also up 85
percent from past peaks, far more than prices for properties
in highly walkable suburbs (32 percent) and in car-dependent
suburbs (up 21 percent).
Strong growth in multifamily property prices has driven
down purchase capitalization or “cap” rates (expected net
Note: Estimates for 2015 are through September. Sources: CoreLogic, US National Home Price Index; Moody’s Investors Service and Real Capital Analytics, Commercial Property Price Index for Apartments.
■ Apartment Property Price Index ■ Single-Family Home Price Index
20072006
2006
2008 2009 201320122010 2014 20152011
260
240
220
200
180
160
140
120
100
Prices for Apartment Properties Have Rebounded Well Beyond Their Previous PeakPrice Index (December 2000=100)
FIGURE 20
31685-15_R15_4_Production_TextV3.indd 23 12/1/15 2:20 PM

24 AMERICA’S RENTAL HOUSING—EXPANDING OPTIONS FOR DIVERSE AND GROWING DEMAND24 AMERICA’S RENTAL HOUSING—EXPANDING OPTIONS FOR DIVERSE AND GROWING DEMAND
operating income as a share of the purchase price). NCREIF
reports that cap rates for investment-grade apartment
properties declined to just under 5 percent in mid-2015, a
level not seen since the peak of the housing bubble. Indeed,
the extremely low cap rates in some of the tightest, highest-
cost markets—such as Manhattan and San Francisco—
leave little spread with Treasury yields. Such low cap rates
suggest that investors are sticking to major markets that
they consider less risky.
The rise in rental property values also reflects increased
investments to maintain and upgrade the stock. Indeed, total
spending on improvements, maintenance, and repairs to the
rental stock has picked up with the rise in prices, increasing
from just under $50 billion in 2010 to nearly $60 billion in
2014. According to a recent National Apartment Association
survey, nominal per-unit expenditures on apartments in
large, professionally managed properties rose from an aver-
age of $1,070 to $1,520 over this period.
FALLING DELINQUENCY RATES
Rising rental property prices and incomes have helped drive
down delinquency rates for most types of multifamily loans.
The share of multifamily loans held by FDIC-insured institu-
tions that were at least 90 days past due or in non-accrual
status stood at just 0.34 percent in the second quarter of
2015, compared with 4.65 percent at the peak in 2010. The
60-day delinquency rates for commercial/multifamily loans
held by life insurance companies (0.06 percent), Freddie Mac
(0.01 percent), and Fannie Mae (0.05 percent) remained low
throughout this period.
In contrast, delinquency rates for multifamily loans held in
commercial mortgage backed securities (CMBS) rose more
sharply during the recession and have been slower to recover.
Moody’s Delinquency Tracker shows that the share of CMBS
loans that were 60 or more days past due, in foreclosure, or
in the lender’s possession peaked at nearly 16 percent in
early 2011 before steadily retreating to just under 8 percent
in September 2015. While this more inclusive measure of
delinquencies is naturally higher than that for other types of
multifamily loans, the delinquent share of CMBS loans is still
well above its pre-crisis level of less than 1.0 percent.
TRENDS IN MULTIFAMILY FINANCE
Given the strong financial performance of multifamily
rental properties, lending activity has increased sharply. The
Mortgage Bankers Association reports that the volume of
multifamily loans outstanding (including both originations
and repayment/write-offs of existing loans) expanded by
another $65 billion in 2014 and hit $1 trillion in 2015. In
nominal terms, balances grew by 17 percent between 2011
and 2014. In sharp contrast, the balance of single-family
mortgage debt outstanding was essentially flat in 2014 and
stood 3 percent below its 2011 level. Indeed, while multi-
family mortgage debt outstanding is at a new high that far
exceeds mid-2000s levels, single-family balances remain 13
percent below their 2008 peak.
Source: Mortgage Bankers Association of America.
■ Fannie Mae and Freddie Mac ■ Banks and Thrifts ■ CMBS ■ FHA ■ Insurance Companies ■ Other Private Investors
Private Lenders Have Ramped Up Multifamily Lending, Reducing the Government’s Footprint in the Market Multifamily Loan Originations (Billions of dollars)
FIGURE 21
140
120
100
80
60
40
20
02009 2010 2011 2012 2013 2014
31685-15_R15_4_Production_TextV3.indd 24 12/1/15 2:20 PM

2125JOINT CENTER FOR HOUSING STUDIES OF HARVARD UNIVERSITY
2125JOINT CENTER FOR HOUSING STUDIES OF HARVARD UNIVERSITY
The private sector has jumped back into the multifamily
lending market, significantly reducing the agency and gov-
ernment sponsored enterprise (GSE) share of these loans
(Figure 21). From 2012 to 2014, multifamily lending by banks
and thrifts, insurance companies, CMBS, and all other inves-
tors was up a combined 68 percent. At the same time, lend-
ing backed by Fannie Mae and Freddie Mac increased by just
5 percent, and lending by FHA fell 29 percent. As a result,
the combined government share of multifamily originations
dropped from 65 percent at the height of the credit crisis in
2009 to about half in 2012, and then to 36 percent in 2014.
Even so, the total volume of government-backed originations
more than doubled over this period.
The market for multifamily loans—particularly small loans—
includes thousands of lenders. Some 2,876 lenders made 14
multifamily loans on average in 2014, with 1,884 lenders
reporting an average loan size under $1 million. Overall, 24
percent of multifamily loans last year were for $1 million or
less, and 65 percent were for $3 million or less. By volume,
however, small loans make up only a small share (3 percent)
of a market where the average multifamily loan in 2014 was
$4.8 million.
Despite recent increases in multifamily lending, concerns
remain about the availability of capital in traditionally
underserved and hard-to-serve markets, including small
metros, economically disadvantaged communities, low-
income neighborhoods, and rental properties with 5–50
units. A variety of factors make it difficult to serve these
segments. For example, underwriting for multifamily loans
is done at the property level, entailing certain fixed costs
that can be expensive on a per-unit basis for small prop-
erty owners. Lenders also recognize that maintenance and
repairs keep profit margins tight for these owners, and
fewer units mean that a single vacancy can have a sig-
nificant impact on rental income. In addition, the unique
characteristics of smaller properties and the diversity of
underwriting standards that lenders use make small mul-
tifamily loans difficult to bundle into securities that can be
sold on the secondary market.
Some changes are being made to address these concerns. In
particular, the Federal Housing Finance Agency (FHFA) and
HUD recently proposed several new products and initiatives
to encourage more lending to small multifamily property
owners. In 2014, FHFA excluded small multifamily loans
from the caps on multifamily purchases and proposed a
new purchase goal for the GSEs in 2015–2017. In addition,
Freddie Mac launched a Small Balance Loan initiative last
year to buy and securitize multifamily loans in the $1–5 mil-
lion range. And in July 2015, FHA introduced a new lending
platform called the Section 542 Small Building Risk Sharing
Initiative, partnering with high-capacity lenders such as
community development financial institutions to provide
long-term, fixed-rate loans of up to $5 million to property
owners in high-cost areas.
THE OUTLOOK
Rising rents and low vacancy rates have yielded solid income
gains for property owners, double-digit growth in property
prices, and a surge in construction of and investment in
multifamily rental buildings. Indeed, with 412,000 permits
issued and 355,000 units started in 2014, annual completions
of multifamily units in 2015 are on track to top the 313,000
level averaged in the decade before the downturn. Although
these additions to the rental stock should help to slow mar-
ket tightening, demand continues to outpace supply in most
metros, keeping pressure on rents and vacancy rates.
Today’s relatively easy access to capital may be masking
unsolved problems related to traditionally underserved mar-
kets. Federal regulations remain up in the air, along with the
fate of Freddie Mac and Fannie Mae—two major players in
multifamily finance. With low interest rates fueling the cur-
rent growth in multifamily construction, it is also unclear
whether rates will rise before the rental supply expands
enough to alleviate market tightness. At the same time,
though, the strong expansion of multifamily lending could
lead to future overbuilding in some markets, given the long
construction pipeline and the sharp growth in permitting in
most metropolitan areas.
31685-15_R15_4_Production_TextV3.indd 25 12/1/15 2:20 PM
26 AMERICA’S RENTAL HOUSING—EXPANDING OPTIONS FOR DIVERSE AND GROWING DEMAND26 AMERICA’S RENTAL HOUSING—EXPANDING OPTIONS FOR DIVERSE AND GROWING DEMAND
R E N T A L H O U S I N G A F F O R D A B I L I T Y
With income growth lagging behind the
persistent rise in rents, the number of renter
households spending disproportionate
shares of their incomes for housing hit
a new high in 2014. Cost burdens are a
longstanding condition of low-income
renters, but are now an increasing concern
for moderate-income households—
particularly renters living in the nation’s
high-cost metros. Meanwhile, the stock
of units affordable to very low-income
households falls far short of growing need.
DIVERGING INCOMES AND HOUSING COSTS
Over the past decade and a half, median rental housing costs
climbed from $869 per month in 2001 to $934 in 2014, an
increase of 7 percent in real terms. After holding relatively
stable over the past six years, an uptick in 2014 brought costs to
a new high. Meanwhile, renter incomes have still not recovered
from the recessions that began in 2001 and in 2007. Even after
three years of gains, the real median income of renter house-
holds only edged up from a low of $31,600 in 2011 to $34,000
in 2014—slightly below the 2008 level and fully 9 percent below
the 2001 level. This small rebound, however, was largely driven
by strong growth in the number of higher-income renters.
Indeed, households with incomes of at least $75,000 accounted
for nearly 60 percent of renter household growth in 2011–2014,
and provided much of the lift in median income.
The divergence between rental housing costs and renter
household incomes since the early 2000s is evident at all
income levels. While lower-income renters saw the sharp-
est drop in real incomes, higher-income renters faced the
largest increases in housing costs. For example, the median
household income for renters in the bottom quintile fell 9.9
percent between 2001 and 2014, while their median monthly
housing costs rose 6.2 percent. In contrast, the median
income for households in the top quintile was up 3.1 per-
cent, but their median monthly housing costs jumped 19.8
percent over this period.
These patterns mean that increasing numbers of renter
households across the income spectrum are housing cost
burdened (paying more than 30 percent of income for hous-
ing). In fact, the number of cost-burdened renter households
rose from 14.8 million in 2001 to a new record of 21.3 million
in 2014. Of these households, 11.4 million had severe bur-
dens (paying more than 50 percent of income for housing),
well above the 7.5 million recorded in 2001.
Meanwhile, the share of cost-burdened renters remains
near its all-time high of 51 percent (Figure 22). Estimates
Notes: Median housing costs and household incomes are adjusted to 2014 dollars using the CPI-U for All Items. Housing costs include cash rent and utilities. Cost-burdened households pay more than 30% of income for housing. Households with zero or negative income are assumed to have severe burdens, while households paying no cash rent are assumed to be without burdens.Source: JCHS tabulations of US Census Bureau, American Community Surveys.
■ Median Renter Income ■ Median Housing Costs ■ Housing Cost Burden
20072006 2008 2009 20132012201020022001 2003 2004 2005 20142011
115
110
105
100
95
90
85
80
52
50
48
46
44
42
40
38
The Share of Renter Households Facing Cost Burdens Remains High as Income Growth LagsIndexed Housing Costs and Incomes Cost-Burdened Share (Percent)
FIGURE 22
31685-15_R15_4_Production_TextV3.indd 26 12/1/15 2:20 PM
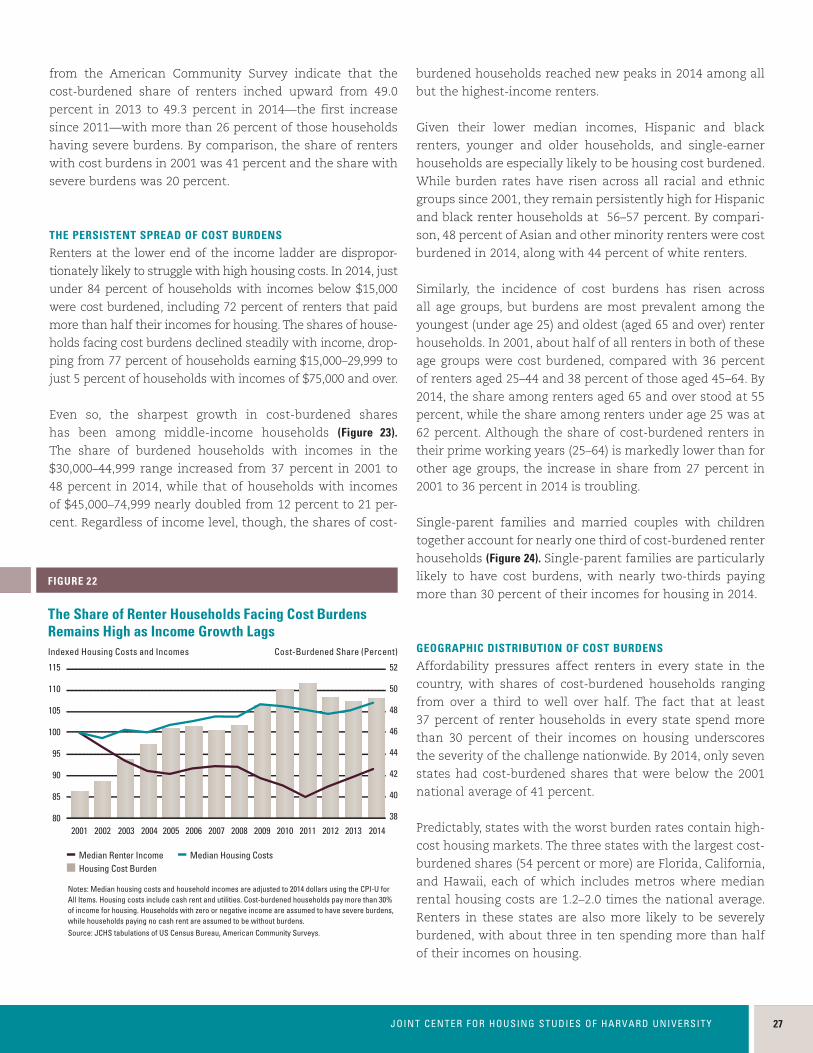
2127JOINT CENTER FOR HOUSING STUDIES OF HARVARD UNIVERSITY
2127JOINT CENTER FOR HOUSING STUDIES OF HARVARD UNIVERSITY
from the American Community Survey indicate that the
cost-burdened share of renters inched upward from 49.0
percent in 2013 to 49.3 percent in 2014—the first increase
since 2011—with more than 26 percent of those households
having severe burdens. By comparison, the share of renters
with cost burdens in 2001 was 41 percent and the share with
severe burdens was 20 percent.
THE PERSISTENT SPREAD OF COST BURDENS
Renters at the lower end of the income ladder are dispropor-
tionately likely to struggle with high housing costs. In 2014, just
under 84 percent of households with incomes below $15,000
were cost burdened, including 72 percent of renters that paid
more than half their incomes for housing. The shares of house-
holds facing cost burdens declined steadily with income, drop-
ping from 77 percent of households earning $15,000–29,999 to
just 5 percent of households with incomes of $75,000 and over.
Even so, the sharpest growth in cost-burdened shares
has been among middle-income households (Figure 23). The share of burdened households with incomes in the
$30,000–44,999 range increased from 37 percent in 2001 to
48 percent in 2014, while that of households with incomes
of $45,000–74,999 nearly doubled from 12 percent to 21 per-
cent. Regardless of income level, though, the shares of cost-
burdened households reached new peaks in 2014 among all
but the highest-income renters.
Given their lower median incomes, Hispanic and black
renters, younger and older households, and single-earner
households are especially likely to be housing cost burdened.
While burden rates have risen across all racial and ethnic
groups since 2001, they remain persistently high for Hispanic
and black renter households at 56–57 percent. By compari-
son, 48 percent of Asian and other minority renters were cost
burdened in 2014, along with 44 percent of white renters.
Similarly, the incidence of cost burdens has risen across
all age groups, but burdens are most prevalent among the
youngest (under age 25) and oldest (aged 65 and over) renter
households. In 2001, about half of all renters in both of these
age groups were cost burdened, compared with 36 percent
of renters aged 25–44 and 38 percent of those aged 45–64. By
2014, the share among renters aged 65 and over stood at 55
percent, while the share among renters under age 25 was at
62 percent. Although the share of cost-burdened renters in
their prime working years (25–64) is markedly lower than for
other age groups, the increase in share from 27 percent in
2001 to 36 percent in 2014 is troubling.
Single-parent families and married couples with children
together account for nearly one third of cost-burdened renter
households (Figure 24). Single-parent families are particularly
likely to have cost burdens, with nearly two-thirds paying
more than 30 percent of their incomes for housing in 2014.
GEOGRAPHIC DISTRIBUTION OF COST BURDENS
Affordability pressures affect renters in every state in the
country, with shares of cost-burdened households ranging
from over a third to well over half. The fact that at least
37 percent of renter households in every state spend more
than 30 percent of their incomes on housing underscores
the severity of the challenge nationwide. By 2014, only seven
states had cost-burdened shares that were below the 2001
national average of 41 percent.
Predictably, states with the worst burden rates contain high-
cost housing markets. The three states with the largest cost-
burdened shares (54 percent or more) are Florida, California,
and Hawaii, each of which includes metros where median
rental housing costs are 1.2–2.0 times the national average.
Renters in these states are also more likely to be severely
burdened, with about three in ten spending more than half
of their incomes on housing.
Notes: Median housing costs and household incomes are adjusted to 2014 dollars using the CPI-U for All Items. Housing costs include cash rent and utilities. Cost-burdened households pay more than 30% of income for housing. Households with zero or negative income are assumed to have severe burdens, while households paying no cash rent are assumed to be without burdens.Source: JCHS tabulations of US Census Bureau, American Community Surveys.
■ Median Renter Income ■ Median Housing Costs ■ Housing Cost Burden
20072006 2008 2009 20132012201020022001 2003 2004 2005 20142011
115
110
105
100
95
90
85
80
52
50
48
46
44
42
40
38
The Share of Renter Households Facing Cost Burdens Remains High as Income Growth LagsIndexed Housing Costs and Incomes Cost-Burdened Share (Percent)
FIGURE 22
31685-15_R15_4_Production_TextV3.indd 27 12/1/15 2:20 PM
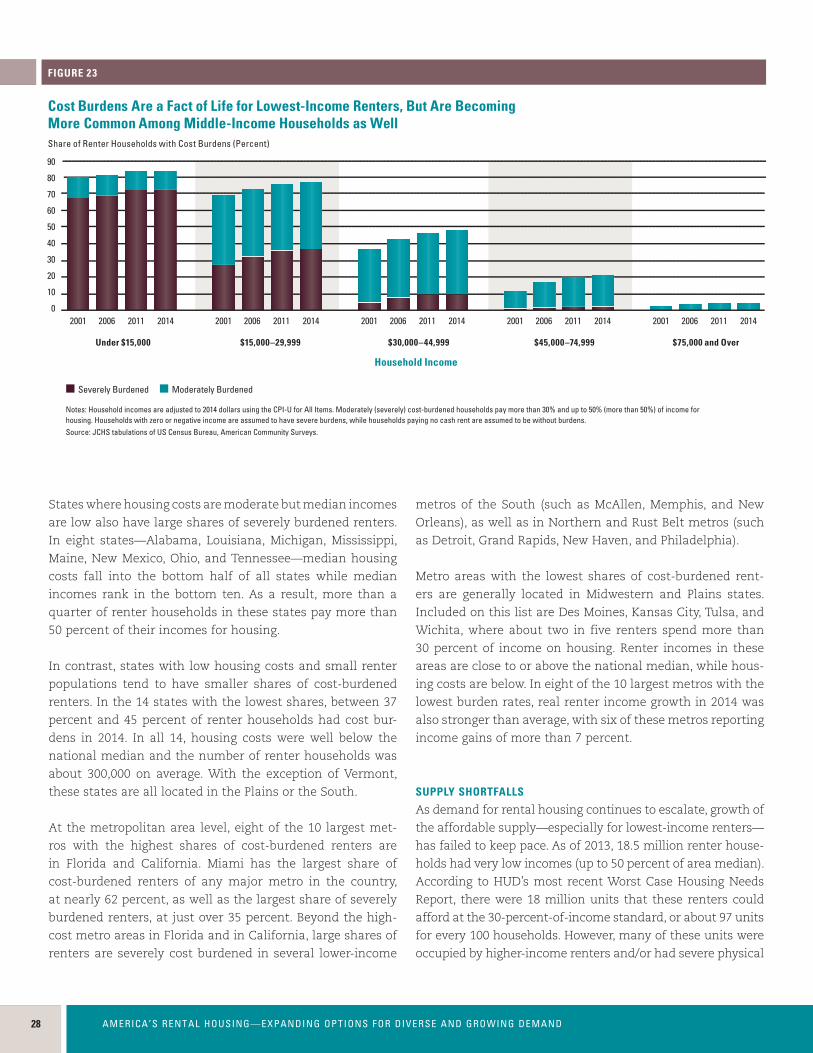
28 AMERICA’S RENTAL HOUSING—EXPANDING OPTIONS FOR DIVERSE AND GROWING DEMAND28 AMERICA’S RENTAL HOUSING—EXPANDING OPTIONS FOR DIVERSE AND GROWING DEMAND
States where housing costs are moderate but median incomes
are low also have large shares of severely burdened renters.
In eight states—Alabama, Louisiana, Michigan, Mississippi,
Maine, New Mexico, Ohio, and Tennessee—median housing
costs fall into the bottom half of all states while median
incomes rank in the bottom ten. As a result, more than a
quarter of renter households in these states pay more than
50 percent of their incomes for housing.
In contrast, states with low housing costs and small renter
populations tend to have smaller shares of cost-burdened
renters. In the 14 states with the lowest shares, between 37
percent and 45 percent of renter households had cost bur-
dens in 2014. In all 14, housing costs were well below the
national median and the number of renter households was
about 300,000 on average. With the exception of Vermont,
these states are all located in the Plains or the South.
At the metropolitan area level, eight of the 10 largest met-
ros with the highest shares of cost-burdened renters are
in Florida and California. Miami has the largest share of
cost-burdened renters of any major metro in the country,
at nearly 62 percent, as well as the largest share of severely
burdened renters, at just over 35 percent. Beyond the high-
cost metro areas in Florida and in California, large shares of
renters are severely cost burdened in several lower-income
metros of the South (such as McAllen, Memphis, and New
Orleans), as well as in Northern and Rust Belt metros (such
as Detroit, Grand Rapids, New Haven, and Philadelphia).
Metro areas with the lowest shares of cost-burdened rent-
ers are generally located in Midwestern and Plains states.
Included on this list are Des Moines, Kansas City, Tulsa, and
Wichita, where about two in five renters spend more than
30 percent of income on housing. Renter incomes in these
areas are close to or above the national median, while hous-
ing costs are below. In eight of the 10 largest metros with the
lowest burden rates, real renter income growth in 2014 was
also stronger than average, with six of these metros reporting
income gains of more than 7 percent.
SUPPLY SHORTFALLS
As demand for rental housing continues to escalate, growth of
the affordable supply—especially for lowest-income renters—
has failed to keep pace. As of 2013, 18.5 million renter house-
holds had very low incomes (up to 50 percent of area median).
According to HUD’s most recent Worst Case Housing Needs
Report, there were 18 million units that these renters could
afford at the 30-percent-of-income standard, or about 97 units
for every 100 households. However, many of these units were
occupied by higher-income renters and/or had severe physical
Notes: Household incomes are adjusted to 2014 dollars using the CPI-U for All Items. Moderately (severely) cost-burdened households pay more than 30% and up to 50% (more than 50%) of income for housing. Households with zero or negative income are assumed to have severe burdens, while households paying no cash rent are assumed to be without burdens.Source: JCHS tabulations of US Census Bureau, American Community Surveys.
■ Severely Burdened ■ Moderately Burdened
Under $15,000
Household Income
$15,000–29,999 $30,000–44,999 $45,000–74,999 $75,000 and Over
Cost Burdens Are a Fact of Life for Lowest-Income Renters, But Are Becoming More Common Among Middle-Income Households as WellShare of Renter Households with Cost Burdens (Percent)
FIGURE 23
2001 2006 2011 2014 2001 2006 2011 2014 2001 2006 2011 2014 2001 2006 2011 2014 2001 2006 2011 2014
90
80
70
60
50
40
30
20
10
0
Notes: Affordable is defined as costing no more than 30% of income for households with extremely low incomes (up to 30% of area median). Adequate units have complete bathrooms, running water, and electricity, and no indicators of major disrepair. Available units are not occupied by higher income renter households. Source: JCHS tabulations of Urban Institute, Mapping America’s Rental Housing Crisis 2011–13.
20,000–99,999
100,000–249,999
250,000–499,999
500,000–1,499,999
1,500,000 and Over
County Population
■ Federally Assisted Units ■ Units without Federal Assistance
40
35
30
25
20
15
10
5
0
Lowest-Income Renters Far Outnumber the Affordable, Adequate, and Available Rental SupplyAverage Number of Units per 100 Extremely Low-Income Renter Households
FIGURE 25
Notes: Cost-burdened households pay more than 30% of income for housing. Households with zero or negative income are assumed to have severe burdens, while households paying no cash rent are assumed to be without burdens.Source: JCHS tabulations of US Census Bureau, 2014 American Community Survey.
Other Non-Family8%
Other Family9%
Single Parent21%
Married with Children12%
Married without Children9%
Share of Renter Households with Cost Burdens
Single Person41%
About a Third of Cost-Burdened RentersAre Families with Children
FIGURE 24
31685-15_R15_4_Production_TextV3.indd 28 12/1/15 2:20 PM
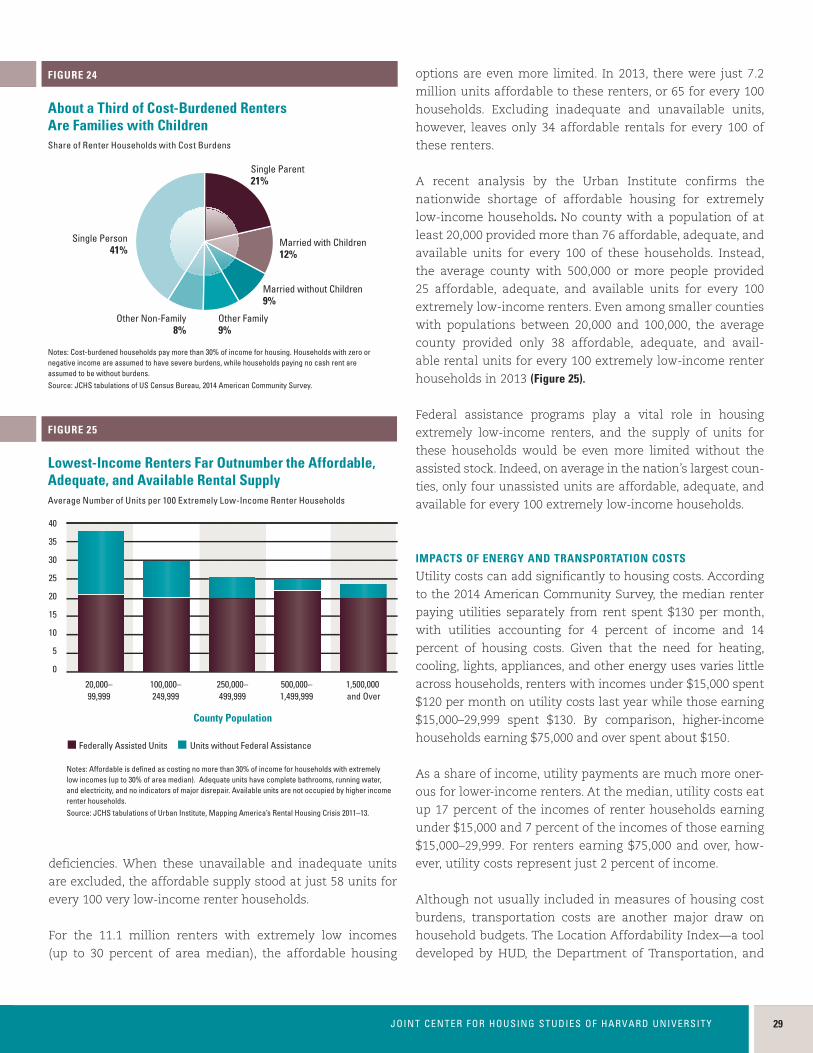
2129JOINT CENTER FOR HOUSING STUDIES OF HARVARD UNIVERSITY
deficiencies. When these unavailable and inadequate units
are excluded, the affordable supply stood at just 58 units for
every 100 very low-income renter households.
For the 11.1 million renters with extremely low incomes
(up to 30 percent of area median), the affordable housing
options are even more limited. In 2013, there were just 7.2
million units affordable to these renters, or 65 for every 100
households. Excluding inadequate and unavailable units,
however, leaves only 34 affordable rentals for every 100 of
these renters.
A recent analysis by the Urban Institute confirms the
nationwide shortage of affordable housing for extremely
low-income households. No county with a population of at
least 20,000 provided more than 76 affordable, adequate, and
available units for every 100 of these households. Instead,
the average county with 500,000 or more people provided
25 affordable, adequate, and available units for every 100
extremely low-income renters. Even among smaller counties
with populations between 20,000 and 100,000, the average
county provided only 38 affordable, adequate, and avail-
able rental units for every 100 extremely low-income renter
households in 2013 (Figure 25).
Federal assistance programs play a vital role in housing
extremely low-income renters, and the supply of units for
these households would be even more limited without the
assisted stock. Indeed, on average in the nation’s largest coun-
ties, only four unassisted units are affordable, adequate, and
available for every 100 extremely low-income households.
IMPACTS OF ENERGY AND TRANSPORTATION COSTS
Utility costs can add significantly to housing costs. According
to the 2014 American Community Survey, the median renter
paying utilities separately from rent spent $130 per month,
with utilities accounting for 4 percent of income and 14
percent of housing costs. Given that the need for heating,
cooling, lights, appliances, and other energy uses varies little
across households, renters with incomes under $15,000 spent
$120 per month on utility costs last year while those earning
$15,000–29,999 spent $130. By comparison, higher-income
households earning $75,000 and over spent about $150.
As a share of income, utility payments are much more oner-
ous for lower-income renters. At the median, utility costs eat
up 17 percent of the incomes of renter households earning
under $15,000 and 7 percent of the incomes of those earning
$15,000–29,999. For renters earning $75,000 and over, how-
ever, utility costs represent just 2 percent of income.
Although not usually included in measures of housing cost
burdens, transportation costs are another major draw on
household budgets. The Location Affordability Index—a tool
developed by HUD, the Department of Transportation, and
Notes: Affordable is defined as costing no more than 30% of income for households with extremely low incomes (up to 30% of area median). Adequate units have complete bathrooms, running water, and electricity, and no indicators of major disrepair. Available units are not occupied by higher income renter households. Source: JCHS tabulations of Urban Institute, Mapping America’s Rental Housing Crisis 2011–13.
20,000–99,999
100,000–249,999
250,000–499,999
500,000–1,499,999
1,500,000 and Over
County Population
■ Federally Assisted Units ■ Units without Federal Assistance
40
35
30
25
20
15
10
5
0
Lowest-Income Renters Far Outnumber the Affordable, Adequate, and Available Rental SupplyAverage Number of Units per 100 Extremely Low-Income Renter Households
FIGURE 25
Notes: Cost-burdened households pay more than 30% of income for housing. Households with zero or negative income are assumed to have severe burdens, while households paying no cash rent are assumed to be without burdens.Source: JCHS tabulations of US Census Bureau, 2014 American Community Survey.
Other Non-Family8%
Other Family9%
Single Parent21%
Married with Children12%
Married without Children9%
Share of Renter Households with Cost Burdens
Single Person41%
About a Third of Cost-Burdened RentersAre Families with Children
FIGURE 24
31685-15_R15_4_Production_TextV3.indd 29 12/1/15 2:20 PM
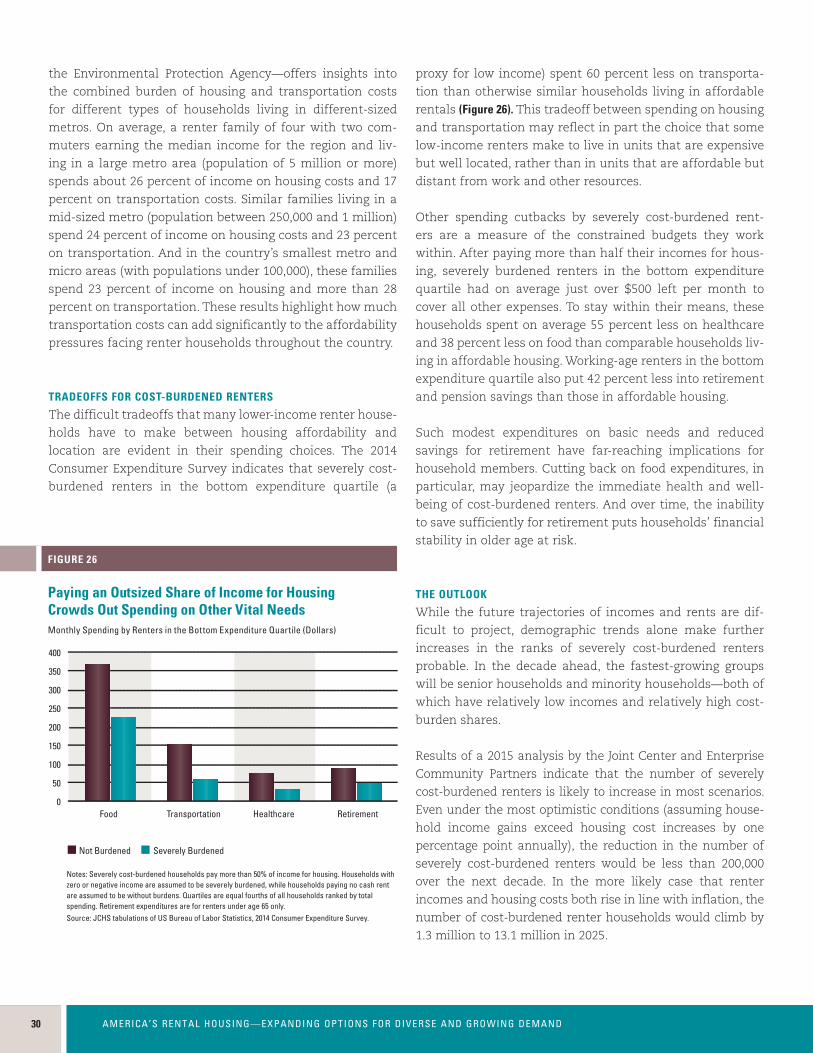
30 AMERICA’S RENTAL HOUSING—EXPANDING OPTIONS FOR DIVERSE AND GROWING DEMAND30 AMERICA’S RENTAL HOUSING—EXPANDING OPTIONS FOR DIVERSE AND GROWING DEMAND
the Environmental Protection Agency—offers insights into
the combined burden of housing and transportation costs
for different types of households living in different-sized
metros. On average, a renter family of four with two com-
muters earning the median income for the region and liv-
ing in a large metro area (population of 5 million or more)
spends about 26 percent of income on housing costs and 17
percent on transportation costs. Similar families living in a
mid-sized metro (population between 250,000 and 1 million)
spend 24 percent of income on housing costs and 23 percent
on transportation. And in the country’s smallest metro and
micro areas (with populations under 100,000), these families
spend 23 percent of income on housing and more than 28
percent on transportation. These results highlight how much
transportation costs can add significantly to the affordability
pressures facing renter households throughout the country.
TRADEOFFS FOR COST-BURDENED RENTERS
The difficult tradeoffs that many lower-income renter house-
holds have to make between housing affordability and
location are evident in their spending choices. The 2014
Consumer Expenditure Survey indicates that severely cost-
burdened renters in the bottom expenditure quartile (a
proxy for low income) spent 60 percent less on transporta-
tion than otherwise similar households living in affordable
rentals (Figure 26). This tradeoff between spending on housing
and transportation may reflect in part the choice that some
low-income renters make to live in units that are expensive
but well located, rather than in units that are affordable but
distant from work and other resources.
Other spending cutbacks by severely cost-burdened rent-
ers are a measure of the constrained budgets they work
within. After paying more than half their incomes for hous-
ing, severely burdened renters in the bottom expenditure
quartile had on average just over $500 left per month to
cover all other expenses. To stay within their means, these
households spent on average 55 percent less on healthcare
and 38 percent less on food than comparable households liv-
ing in affordable housing. Working-age renters in the bottom
expenditure quartile also put 42 percent less into retirement
and pension savings than those in affordable housing.
Such modest expenditures on basic needs and reduced
savings for retirement have far-reaching implications for
household members. Cutting back on food expenditures, in
particular, may jeopardize the immediate health and well-
being of cost-burdened renters. And over time, the inability
to save sufficiently for retirement puts households’ financial
stability in older age at risk.
THE OUTLOOK
While the future trajectories of incomes and rents are dif-
ficult to project, demographic trends alone make further
increases in the ranks of severely cost-burdened renters
probable. In the decade ahead, the fastest-growing groups
will be senior households and minority households—both of
which have relatively low incomes and relatively high cost-
burden shares.
Results of a 2015 analysis by the Joint Center and Enterprise
Community Partners indicate that the number of severely
cost-burdened renters is likely to increase in most scenarios.
Even under the most optimistic conditions (assuming house-
hold income gains exceed housing cost increases by one
percentage point annually), the reduction in the number of
severely cost-burdened renters would be less than 200,000
over the next decade. In the more likely case that renter
incomes and housing costs both rise in line with inflation, the
number of cost-burdened renter households would climb by
1.3 million to 13.1 million in 2025.
Notes: Severely cost-burdened households pay more than 50% of income for housing. Households with zero or negative income are assumed to be severely burdened, while households paying no cash rent are assumed to be without burdens. Quartiles are equal fourths of all households ranked by total spending. Retirement expenditures are for renters under age 65 only.Source: JCHS tabulations of US Bureau of Labor Statistics, 2014 Consumer Expenditure Survey.
RetirementHealthcareTransportationFood
■ Not Burdened ■ Severely Burdened
400
350
300
250
200
150
100
50
0
Paying an Outsized Share of Income for Housing Crowds Out Spending on Other Vital NeedsMonthly Spending by Renters in the Bottom Expenditure Quartile (Dollars)
FIGURE 26
31685-15_R15_4_Production_TextV3.indd 30 12/1/15 2:20 PM

2131JOINT CENTER FOR HOUSING STUDIES OF HARVARD UNIVERSITY
2131JOINT CENTER FOR HOUSING STUDIES OF HARVARD UNIVERSITY
P O L I C Y C H A L L E N G E S
With growing numbers of renter households
facing cost burdens, funding for housing
assistance is falling even further behind
need. As a result, production of new
affordable units and preservation of
the aging assisted stock are becoming
increasingly urgent. To make the most
of limited government dollars, it is also
essential to develop new strategies to link
housing assistance with supportive services
for the nation’s most vulnerable populations.
GAPS BETWEEN ASSISTANCE AND NEED
While substandard housing conditions were the initial ratio-
nale for public intervention in housing markets, affordability
issues have largely replaced quality problems as the pri-
mary focus of rental housing policy. And in a decade where
housing costs have risen faster than incomes, questions of
housing displacement and economic inclusion in America’s
communities are becoming even more pressing.
While rising housing costs have affected households of all
incomes, the consequences are most severe for those at
the low end of the economic ladder. These households face
the difficult choice of paying larger shares of their limited
incomes for housing, crowding into smaller or lower-quality
units, or moving to less expensive areas. For very low-income
households (earning up to 50 percent of the area median
income or AMI), federal rental assistance programs are the
primary source of relief from high housing costs.
But housing assistance is currently not an entitlement.
Indeed, just over one in four (26 percent) eligible households
received assistance in 2013. To receive assistance, house-
holds must apply to individual programs and wait for a unit
or housing choice voucher to become available. In 2013, the
average wait time for a public housing unit was 13 months
and the average wait time for a voucher was 23 months.
Since public housing authorities often close waiting lists
when demand greatly exceeds availability, wait times in
high-cost locations can be significantly longer.
Despite an 18 percent jump in the number of very low-
income households from 15.9 million in 2007 to 18.5 mil-
lion in 2013, real funding for the largest HUD programs
remains below 2008 levels. Although the number of vouchers
increased from under 2.1 million in 2004 to about 2.2 million
in 2014, this increase was more than offset by the loss of
105,700 public housing units and 145,600 units with project-
based rental assistance.
31685-15_R15_4_Production_TextV3.indd 31 12/1/15 2:20 PM
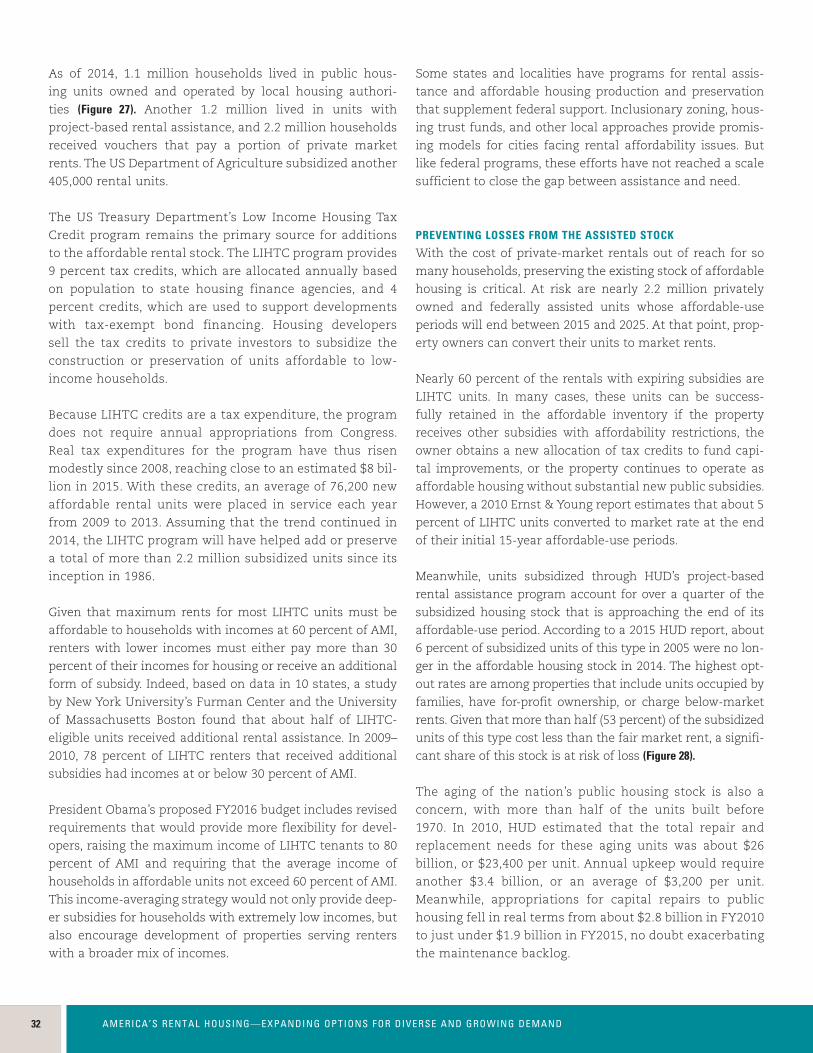
32 AMERICA’S RENTAL HOUSING—EXPANDING OPTIONS FOR DIVERSE AND GROWING DEMAND32 AMERICA’S RENTAL HOUSING—EXPANDING OPTIONS FOR DIVERSE AND GROWING DEMAND
As of 2014, 1.1 million households lived in public hous-
ing units owned and operated by local housing authori-
ties (Figure 27). Another 1.2 million lived in units with
project-based rental assistance, and 2.2 million households
received vouchers that pay a portion of private market
rents. The US Department of Agriculture subsidized another
405,000 rental units.
The US Treasury Department’s Low Income Housing Tax
Credit program remains the primary source for additions
to the affordable rental stock. The LIHTC program provides
9 percent tax credits, which are allocated annually based
on population to state housing finance agencies, and 4
percent credits, which are used to support developments
with tax-exempt bond financing. Housing developers
sell the tax credits to private investors to subsidize the
construction or preservation of units affordable to low-
income households.
Because LIHTC credits are a tax expenditure, the program
does not require annual appropriations from Congress.
Real tax expenditures for the program have thus risen
modestly since 2008, reaching close to an estimated $8 bil-
lion in 2015. With these credits, an average of 76,200 new
affordable rental units were placed in service each year
from 2009 to 2013. Assuming that the trend continued in
2014, the LIHTC program will have helped add or preserve
a total of more than 2.2 million subsidized units since its
inception in 1986.
Given that maximum rents for most LIHTC units must be
affordable to households with incomes at 60 percent of AMI,
renters with lower incomes must either pay more than 30
percent of their incomes for housing or receive an additional
form of subsidy. Indeed, based on data in 10 states, a study
by New York University’s Furman Center and the University
of Massachusetts Boston found that about half of LIHTC-
eligible units received additional rental assistance. In 2009–
2010, 78 percent of LIHTC renters that received additional
subsidies had incomes at or below 30 percent of AMI.
President Obama’s proposed FY2016 budget includes revised
requirements that would provide more flexibility for devel-
opers, raising the maximum income of LIHTC tenants to 80
percent of AMI and requiring that the average income of
households in affordable units not exceed 60 percent of AMI.
This income-averaging strategy would not only provide deep-
er subsidies for households with extremely low incomes, but
also encourage development of properties serving renters
with a broader mix of incomes.
Some states and localities have programs for rental assis-
tance and affordable housing production and preservation
that supplement federal support. Inclusionary zoning, hous-
ing trust funds, and other local approaches provide promis-
ing models for cities facing rental affordability issues. But
like federal programs, these efforts have not reached a scale
sufficient to close the gap between assistance and need.
PREVENTING LOSSES FROM THE ASSISTED STOCK
With the cost of private-market rentals out of reach for so
many households, preserving the existing stock of affordable
housing is critical. At risk are nearly 2.2 million privately
owned and federally assisted units whose affordable-use
periods will end between 2015 and 2025. At that point, prop-
erty owners can convert their units to market rents.
Nearly 60 percent of the rentals with expiring subsidies are
LIHTC units. In many cases, these units can be success-
fully retained in the affordable inventory if the property
receives other subsidies with affordability restrictions, the
owner obtains a new allocation of tax credits to fund capi-
tal improvements, or the property continues to operate as
affordable housing without substantial new public subsidies.
However, a 2010 Ernst & Young report estimates that about 5
percent of LIHTC units converted to market rate at the end
of their initial 15-year affordable-use periods.
Meanwhile, units subsidized through HUD’s project-based
rental assistance program account for over a quarter of the
subsidized housing stock that is approaching the end of its
affordable-use period. According to a 2015 HUD report, about
6 percent of subsidized units of this type in 2005 were no lon-
ger in the affordable housing stock in 2014. The highest opt-
out rates are among properties that include units occupied by
families, have for-profit ownership, or charge below-market
rents. Given that more than half (53 percent) of the subsidized
units of this type cost less than the fair market rent, a signifi-
cant share of this stock is at risk of loss (Figure 28).
The aging of the nation’s public housing stock is also a
concern, with more than half of the units built before
1970. In 2010, HUD estimated that the total repair and
replacement needs for these aging units was about $26
billion, or $23,400 per unit. Annual upkeep would require
another $3.4 billion, or an average of $3,200 per unit.
Meanwhile, appropriations for capital repairs to public
housing fell in real terms from about $2.8 billion in FY2010
to just under $1.9 billion in FY2015, no doubt exacerbating
the maintenance backlog.
Notes: FMR (fair market rent) includes rent plus tenant-paid utility costs. Project-based rental assistance refers to units subsidized through project-based Section 8, Rent Supplement Program, Rental Assistance Payments, and Project Rental Assistance Contracts for Section 202 and Section 811 programs. Source: JCHS tabulations of National Housing Preservation Database.
20162015 2017 2018 20202019 2021 2022 2023 2024 2025
700
600
500
400
300
200
100
0
Rent Below FMR Rent Equal to or Above FMR
More than Half of Affordable Units with Expiring Subsidies Charge Below-Market RentsCumulative Project-Based Assistance Units with Expiring Affordability (Thousands)
FIGURE 28
Notes: Units can be assisted through more than one program. The count of LIHTC units is cumulative and the 2014 estimate is the annual average number of units placed in service in 2009–13. Project-based rental assistance refers to units subsidized through project-based Section 8, Rent Supplement Program, Rental Assistance Payments, and Project Rental Assistance Contracts for Section 202 and Section 811 programs.Sources: US Department of Housing and Urban Development, FY1999–2014 Annual Performance Reports and LIHTC Database.
LIHTC Units Public Housing
Project-Based Rental Assistance Housing Choice Vouchers
1999 2001 2003 2005 2007 2009 2011 2013
0
0.5
1.0
1.5
2.0
2.5
Over Time, Tax Credits Have Joined Vouchers as the Largest Forms of Rental AssistanceAssisted Rental Units (Millions)
FIGURE 27
31685-15_R15_4_Production_TextV3.indd 32 12/1/15 2:20 PM
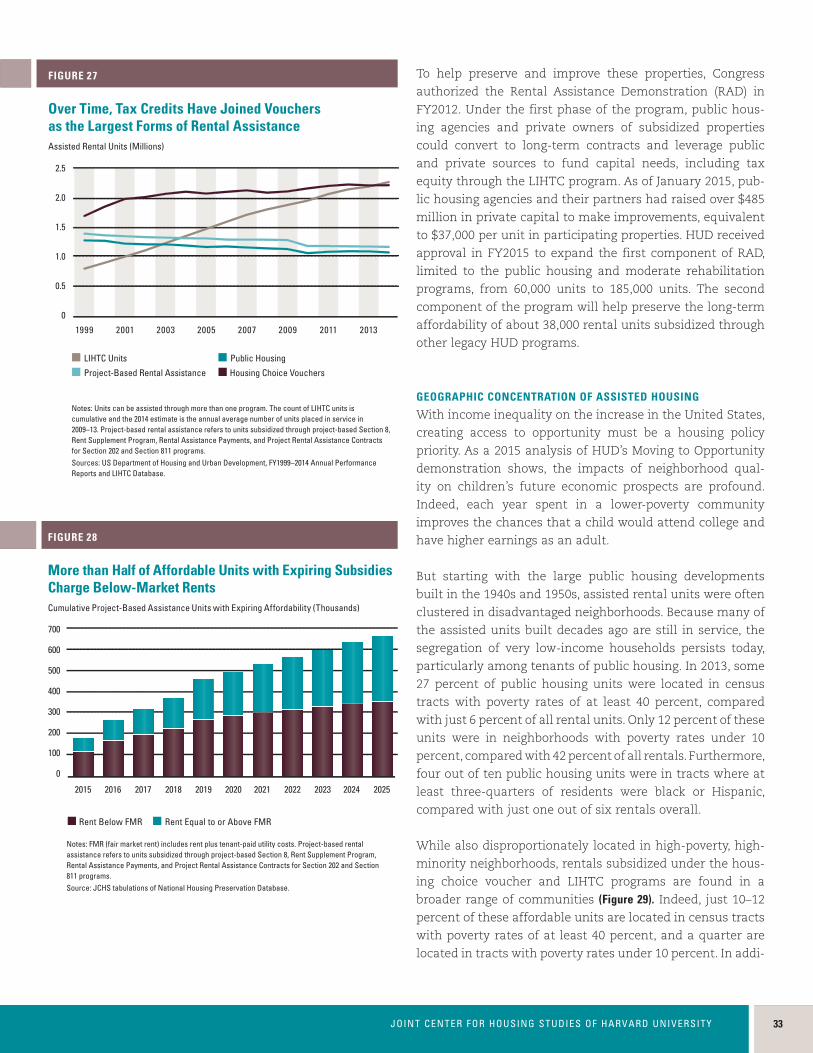
2133JOINT CENTER FOR HOUSING STUDIES OF HARVARD UNIVERSITY
2133JOINT CENTER FOR HOUSING STUDIES OF HARVARD UNIVERSITY
To help preserve and improve these properties, Congress
authorized the Rental Assistance Demonstration (RAD) in
FY2012. Under the first phase of the program, public hous-
ing agencies and private owners of subsidized properties
could convert to long-term contracts and leverage public
and private sources to fund capital needs, including tax
equity through the LIHTC program. As of January 2015, pub-
lic housing agencies and their partners had raised over $485
million in private capital to make improvements, equivalent
to $37,000 per unit in participating properties. HUD received
approval in FY2015 to expand the first component of RAD,
limited to the public housing and moderate rehabilitation
programs, from 60,000 units to 185,000 units. The second
component of the program will help preserve the long-term
affordability of about 38,000 rental units subsidized through
other legacy HUD programs.
GEOGRAPHIC CONCENTRATION OF ASSISTED HOUSING
With income inequality on the increase in the United States,
creating access to opportunity must be a housing policy
priority. As a 2015 analysis of HUD’s Moving to Opportunity
demonstration shows, the impacts of neighborhood qual-
ity on children’s future economic prospects are profound.
Indeed, each year spent in a lower-poverty community
improves the chances that a child would attend college and
have higher earnings as an adult.
But starting with the large public housing developments
built in the 1940s and 1950s, assisted rental units were often
clustered in disadvantaged neighborhoods. Because many of
the assisted units built decades ago are still in service, the
segregation of very low-income households persists today,
particularly among tenants of public housing. In 2013, some
27 percent of public housing units were located in census
tracts with poverty rates of at least 40 percent, compared
with just 6 percent of all rental units. Only 12 percent of these
units were in neighborhoods with poverty rates under 10
percent, compared with 42 percent of all rentals. Furthermore,
four out of ten public housing units were in tracts where at
least three-quarters of residents were black or Hispanic,
compared with just one out of six rentals overall.
While also disproportionately located in high-poverty, high-
minority neighborhoods, rentals subsidized under the hous-
ing choice voucher and LIHTC programs are found in a
broader range of communities (Figure 29). Indeed, just 10–12
percent of these affordable units are located in census tracts
with poverty rates of at least 40 percent, and a quarter are
located in tracts with poverty rates under 10 percent. In addi-
Notes: FMR (fair market rent) includes rent plus tenant-paid utility costs. Project-based rental assistance refers to units subsidized through project-based Section 8, Rent Supplement Program, Rental Assistance Payments, and Project Rental Assistance Contracts for Section 202 and Section 811 programs. Source: JCHS tabulations of National Housing Preservation Database.
20162015 2017 2018 20202019 2021 2022 2023 2024 2025
700
600
500
400
300
200
100
0
Rent Below FMR Rent Equal to or Above FMR
More than Half of Affordable Units with Expiring Subsidies Charge Below-Market RentsCumulative Project-Based Assistance Units with Expiring Affordability (Thousands)
FIGURE 28
Notes: Units can be assisted through more than one program. The count of LIHTC units is cumulative and the 2014 estimate is the annual average number of units placed in service in 2009–13. Project-based rental assistance refers to units subsidized through project-based Section 8, Rent Supplement Program, Rental Assistance Payments, and Project Rental Assistance Contracts for Section 202 and Section 811 programs.Sources: US Department of Housing and Urban Development, FY1999–2014 Annual Performance Reports and LIHTC Database.
LIHTC Units Public Housing
Project-Based Rental Assistance Housing Choice Vouchers
1999 2001 2003 2005 2007 2009 2011 2013
0
0.5
1.0
1.5
2.0
2.5
Over Time, Tax Credits Have Joined Vouchers as the Largest Forms of Rental AssistanceAssisted Rental Units (Millions)
FIGURE 27
31685-15_R15_4_Production_TextV3.indd 33 12/1/15 2:20 PM

34 AMERICA’S RENTAL HOUSING—EXPANDING OPTIONS FOR DIVERSE AND GROWING DEMAND
tion, only 27–30 percent of voucher and LIHTC units are in
neighborhoods where at least three-quarters of residents are
black or Hispanic.
In an effort to clarify and strengthen the regulatory land-
scape for fair housing, HUD recently ruled that all local and
state governments that receive HUD funds—as well as all
public housing agencies—must conduct an Assessment of
Fair Housing that identifies patterns of segregation and then,
based on local input, set priorities for addressing disparities
in housing needs and access to opportunity. While this pro-
cess will spur greater local attention to fair housing issues,
the impacts of the rule will depend on the goals established
by the grantees, the criteria for HUD review and acceptance,
and the extent to which the findings are used in planning
processes.
The Supreme Court’s recent ruling in Texas Department of
Housing and Community Affairs vs. Inclusive Communities Project
may similarly alter the future location of LIHTC properties.
In June 2015, the court affirmed that discrimination claims
under the Fair Housing Act can be supported by evidence
of disparate impact, allowing challenges to practices that
adversely affect minorities without direct racial discrimina-
tion. With this decision, the Inclusive Communities Project’s
challenge to the allocation of LIHTC tax credits in the Dallas
metropolitan area can proceed, clearing the way for similar
challenges in other cities. Again, however, the full implica-
tions of this ruling will be known only as these cases are
decided in the coming years.
GROWING NEED FOR INTEGRATED SERVICES
Rental subsidies alone may not address the underlying
causes of housing instability among very low-income house-
holds, particularly older adults with chronic health condi-
tions or disabilities; working-age adults that lack living-wage
jobs, skills training, and/or access to affordable childcare;
and formerly homeless individuals with a history of domes-
tic violence, substance abuse, or mental illness. For these
households, rental assistance programs offer an effective
platform for delivering supportive services.
Households headed by elderly adults (aged 62 and over) and
adults with disabilities make up a sizable share of those receiv-
ing rental assistance (Figure 30). Limited mobility is a common
age-related disability. Indeed, the 2011 American Housing
Survey indicates that 46 percent of assisted renters in this age
group have serious difficulty walking or climbing stairs.
HUD’s Section 202 program is currently the only federal
program focused on providing affordable housing with sup-
Note: Poverty rate refers to share of families in census tract with incomes below the federal poverty level in 2013.Source: JCHS tabulations of US Census Bureau, 2009–13 Five-Year American Community Surveys and US Department of Housing and Urban Development, 2013 Picture of Subsidized Households and LIHTC database.
Under 10 10–19 20–39 40 and Over Under 10 10–49 50–74 75 and Over
Public Housing
Project-Based Rental
Assistance
Housing Choice
Vouchers
LIHTCAll Rental Units
Public Housing
Project-Based Rental
Assistance
Housing Choice
Vouchers
LIHTCAll Rental Units
100
90
80
70
60
50
40
30
20
10
0
100
90
80
70
60
50
40
30
20
10
0
Poverty Rate in Census Tract (Percent) Black and Hispanic Population Share in Census Tract (Percent)
Compared with Public Housing, LIHTC and Voucher Units Are Less Concentrated in High-Poverty, High-Minority AreasDistribution of Units (Percent) Distribution of Units (Percent)
FIGURE 29
Notes: Elderly adults are aged 62 and over, the cutoff for age-restricted units. Adults with disabilities are under age 62. Household counts include those assisted by Housing Choice Vouchers, Public Housing, Project-Based Section 8, Section 202, Section 811, Rent Supplement, Rental Assistance Program, McKinney-Vento Permanent Supportive Housing, Housing for Persons with AIDS, and USDA Section 521. Source: Center on Budget and Policy Priorities, Federal Rental Assistance Factsheet.
Elderly Adults34%
Adults with Disabilities20%
Adults with Children30%
Adults with Disabilitieswith Children
5%
Adults without Children11%
Rental Assistance Predominantly Serves Adults Who Are Elderly, Have Disabilities, or Care for Children
FIGURE 30
Share of Assisted Households
31685-15_R15_4_Production_TextV3.indd 34 12/1/15 2:20 PM
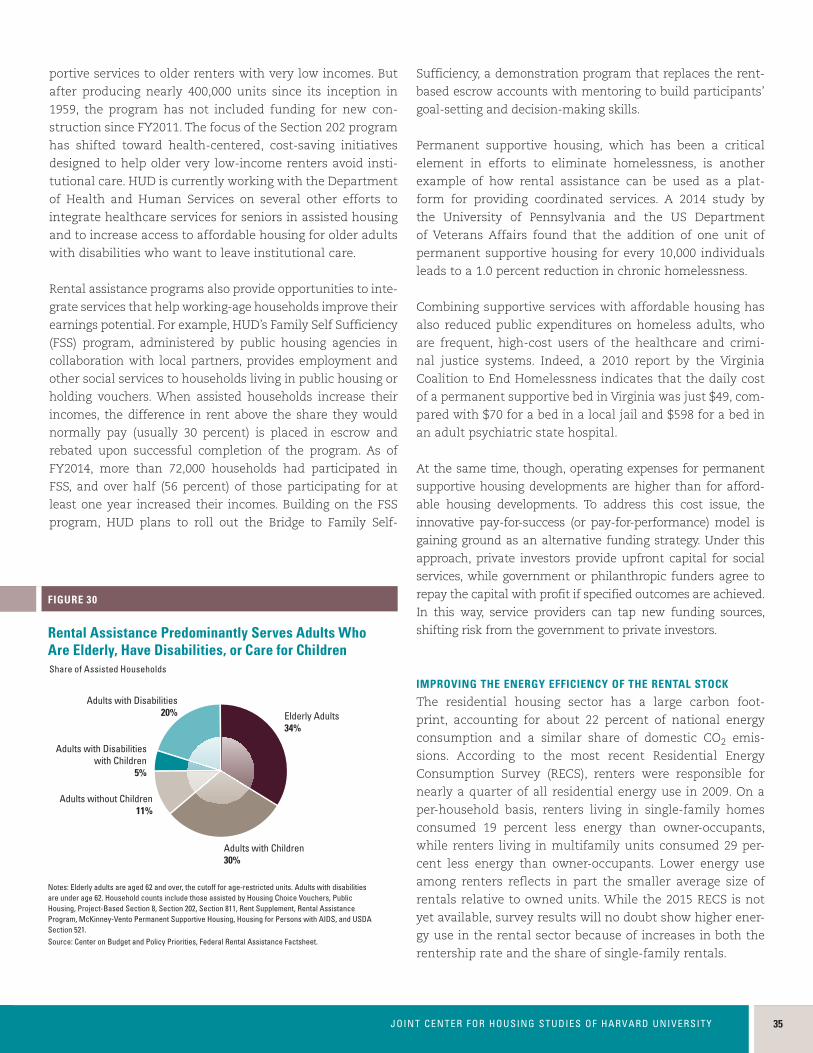
2135JOINT CENTER FOR HOUSING STUDIES OF HARVARD UNIVERSITY
portive services to older renters with very low incomes. But
after producing nearly 400,000 units since its inception in
1959, the program has not included funding for new con-
struction since FY2011. The focus of the Section 202 program
has shifted toward health-centered, cost-saving initiatives
designed to help older very low-income renters avoid insti-
tutional care. HUD is currently working with the Department
of Health and Human Services on several other efforts to
integrate healthcare services for seniors in assisted housing
and to increase access to affordable housing for older adults
with disabilities who want to leave institutional care.
Rental assistance programs also provide opportunities to inte-
grate services that help working-age households improve their
earnings potential. For example, HUD’s Family Self Sufficiency
(FSS) program, administered by public housing agencies in
collaboration with local partners, provides employment and
other social services to households living in public housing or
holding vouchers. When assisted households increase their
incomes, the difference in rent above the share they would
normally pay (usually 30 percent) is placed in escrow and
rebated upon successful completion of the program. As of
FY2014, more than 72,000 households had participated in
FSS, and over half (56 percent) of those participating for at
least one year increased their incomes. Building on the FSS
program, HUD plans to roll out the Bridge to Family Self-
Sufficiency, a demonstration program that replaces the rent-
based escrow accounts with mentoring to build participants’
goal-setting and decision-making skills.
Permanent supportive housing, which has been a critical
element in efforts to eliminate homelessness, is another
example of how rental assistance can be used as a plat-
form for providing coordinated services. A 2014 study by
the University of Pennsylvania and the US Department
of Veterans Affairs found that the addition of one unit of
permanent supportive housing for every 10,000 individuals
leads to a 1.0 percent reduction in chronic homelessness.
Combining supportive services with affordable housing has
also reduced public expenditures on homeless adults, who
are frequent, high-cost users of the healthcare and crimi-
nal justice systems. Indeed, a 2010 report by the Virginia
Coalition to End Homelessness indicates that the daily cost
of a permanent supportive bed in Virginia was just $49, com-
pared with $70 for a bed in a local jail and $598 for a bed in
an adult psychiatric state hospital.
At the same time, though, operating expenses for permanent
supportive housing developments are higher than for afford-
able housing developments. To address this cost issue, the
innovative pay-for-success (or pay-for-performance) model is
gaining ground as an alternative funding strategy. Under this
approach, private investors provide upfront capital for social
services, while government or philanthropic funders agree to
repay the capital with profit if specified outcomes are achieved.
In this way, service providers can tap new funding sources,
shifting risk from the government to private investors.
IMPROVING THE ENERGY EFFICIENCY OF THE RENTAL STOCK
The residential housing sector has a large carbon foot-
print, accounting for about 22 percent of national energy
consumption and a similar share of domestic CO2 emis-
sions. According to the most recent Residential Energy
Consumption Survey (RECS), renters were responsible for
nearly a quarter of all residential energy use in 2009. On a
per-household basis, renters living in single-family homes
consumed 19 percent less energy than owner-occupants,
while renters living in multifamily units consumed 29 per-
cent less energy than owner-occupants. Lower energy use
among renters reflects in part the smaller average size of
rentals relative to owned units. While the 2015 RECS is not
yet available, survey results will no doubt show higher ener-
gy use in the rental sector because of increases in both the
rentership rate and the share of single-family rentals.
Notes: Elderly adults are aged 62 and over, the cutoff for age-restricted units. Adults with disabilities are under age 62. Household counts include those assisted by Housing Choice Vouchers, Public Housing, Project-Based Section 8, Section 202, Section 811, Rent Supplement, Rental Assistance Program, McKinney-Vento Permanent Supportive Housing, Housing for Persons with AIDS, and USDA Section 521. Source: Center on Budget and Policy Priorities, Federal Rental Assistance Factsheet.
Elderly Adults34%
Adults with Disabilities20%
Adults with Children30%
Adults with Disabilitieswith Children
5%
Adults without Children11%
Rental Assistance Predominantly Serves Adults Who Are Elderly, Have Disabilities, or Care for Children
FIGURE 30
Share of Assisted Households
31685-15_R15_4_Production_TextV3.indd 35 12/1/15 2:20 PM
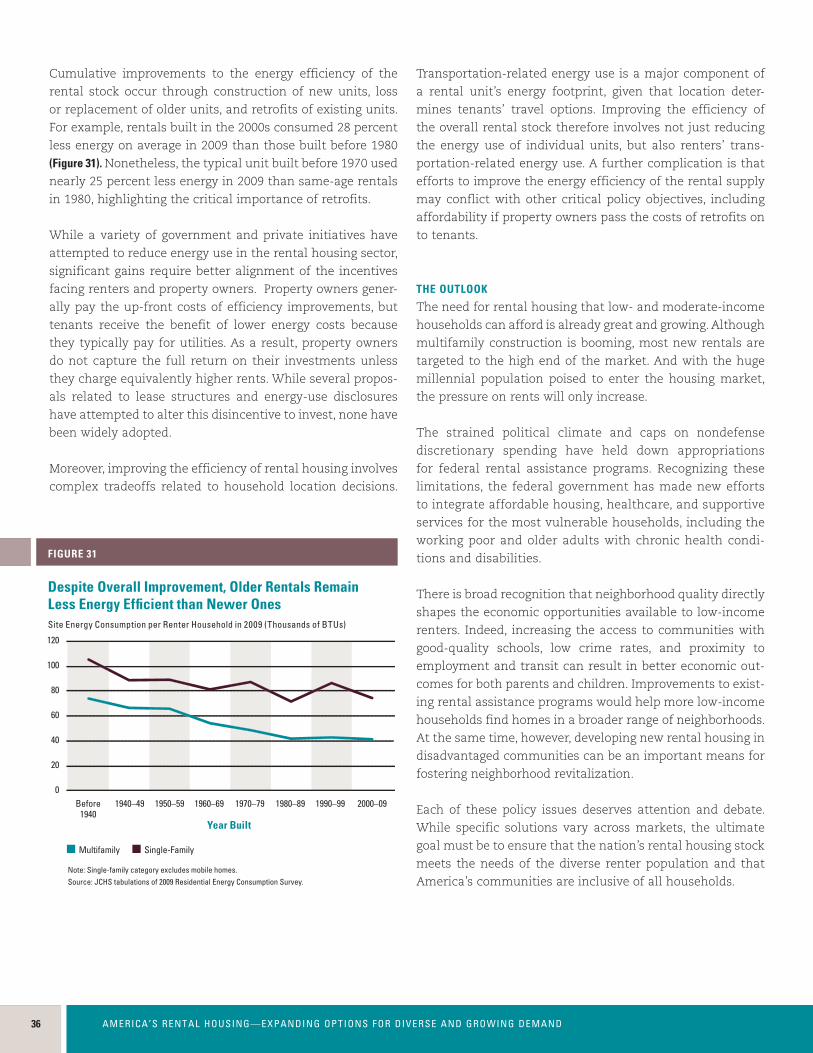
36 AMERICA’S RENTAL HOUSING—EXPANDING OPTIONS FOR DIVERSE AND GROWING DEMAND36 AMERICA’S RENTAL HOUSING—EXPANDING OPTIONS FOR DIVERSE AND GROWING DEMAND
Cumulative improvements to the energy efficiency of the
rental stock occur through construction of new units, loss
or replacement of older units, and retrofits of existing units.
For example, rentals built in the 2000s consumed 28 percent
less energy on average in 2009 than those built before 1980
(Figure 31). Nonetheless, the typical unit built before 1970 used
nearly 25 percent less energy in 2009 than same-age rentals
in 1980, highlighting the critical importance of retrofits.
While a variety of government and private initiatives have
attempted to reduce energy use in the rental housing sector,
significant gains require better alignment of the incentives
facing renters and property owners. Property owners gener-
ally pay the up-front costs of efficiency improvements, but
tenants receive the benefit of lower energy costs because
they typically pay for utilities. As a result, property owners
do not capture the full return on their investments unless
they charge equivalently higher rents. While several propos-
als related to lease structures and energy-use disclosures
have attempted to alter this disincentive to invest, none have
been widely adopted.
Moreover, improving the efficiency of rental housing involves
complex tradeoffs related to household location decisions.
Transportation-related energy use is a major component of
a rental unit’s energy footprint, given that location deter-
mines tenants’ travel options. Improving the efficiency of
the overall rental stock therefore involves not just reducing
the energy use of individual units, but also renters’ trans-
portation-related energy use. A further complication is that
efforts to improve the energy efficiency of the rental supply
may conflict with other critical policy objectives, including
affordability if property owners pass the costs of retrofits on
to tenants.
THE OUTLOOK
The need for rental housing that low- and moderate-income
households can afford is already great and growing. Although
multifamily construction is booming, most new rentals are
targeted to the high end of the market. And with the huge
millennial population poised to enter the housing market,
the pressure on rents will only increase.
The strained political climate and caps on nondefense
discretionary spending have held down appropriations
for federal rental assistance programs. Recognizing these
limitations, the federal government has made new efforts
to integrate affordable housing, healthcare, and supportive
services for the most vulnerable households, including the
working poor and older adults with chronic health condi-
tions and disabilities.
There is broad recognition that neighborhood quality directly
shapes the economic opportunities available to low-income
renters. Indeed, increasing the access to communities with
good-quality schools, low crime rates, and proximity to
employment and transit can result in better economic out-
comes for both parents and children. Improvements to exist-
ing rental assistance programs would help more low-income
households find homes in a broader range of neighborhoods.
At the same time, however, developing new rental housing in
disadvantaged communities can be an important means for
fostering neighborhood revitalization.
Each of these policy issues deserves attention and debate.
While specific solutions vary across markets, the ultimate
goal must be to ensure that the nation’s rental housing stock
meets the needs of the diverse renter population and that
America’s communities are inclusive of all households.Note: Single-family category excludes mobile homes.Source: JCHS tabulations of 2009 Residential Energy Consumption Survey.
Multifamily Single-Family
Year Built
Before1940
2006
1950–591940–49 1990–991970–791960–69 1980–89 2000–09
120
100
80
60
40
20
0
Despite Overall Improvement, Older Rentals Remain Less Energy Efficient than Newer OnesSite Energy Consumption per Renter Household in 2009 (Thousands of BTUs)
FIGURE 31
31685-15_R15_4_Production_TextV3.indd 36 12/1/15 2:20 PM
2137JOINT CENTER FOR HOUSING STUDIES OF HARVARD UNIVERSITY
2137JOINT CENTER FOR HOUSING STUDIES OF HARVARD UNIVERSITY
Table A-1 Renter Households and Household Growth: 1995, 2005, and 2015
Table A-2 Characteristics of the Rental Housing Stock: 2013
Table A-3 Housing Cost-Burdened Renters by Demographic Characteristics: 2001, 2013, and 2014
Table A-4 Multifamily Housing Market Indicators: 1980–2014
Table A-5 Shares of Housing Cost-Burdened Renters by State: 2014
Table A-6 Counts of Housing Cost-Burdened Renters by State: 2014
Table A-7 Assisted Rental Units with Expiring Affordable-Use Periods: 2015–2025
Additional tables can be downloaded in Microsoft Excel format at www.jchs.harvard.edu.
A P P E N D I X TA B L E S
31685-15_R15_4_Production_TextV3.indd 37 12/1/15 2:20 PM
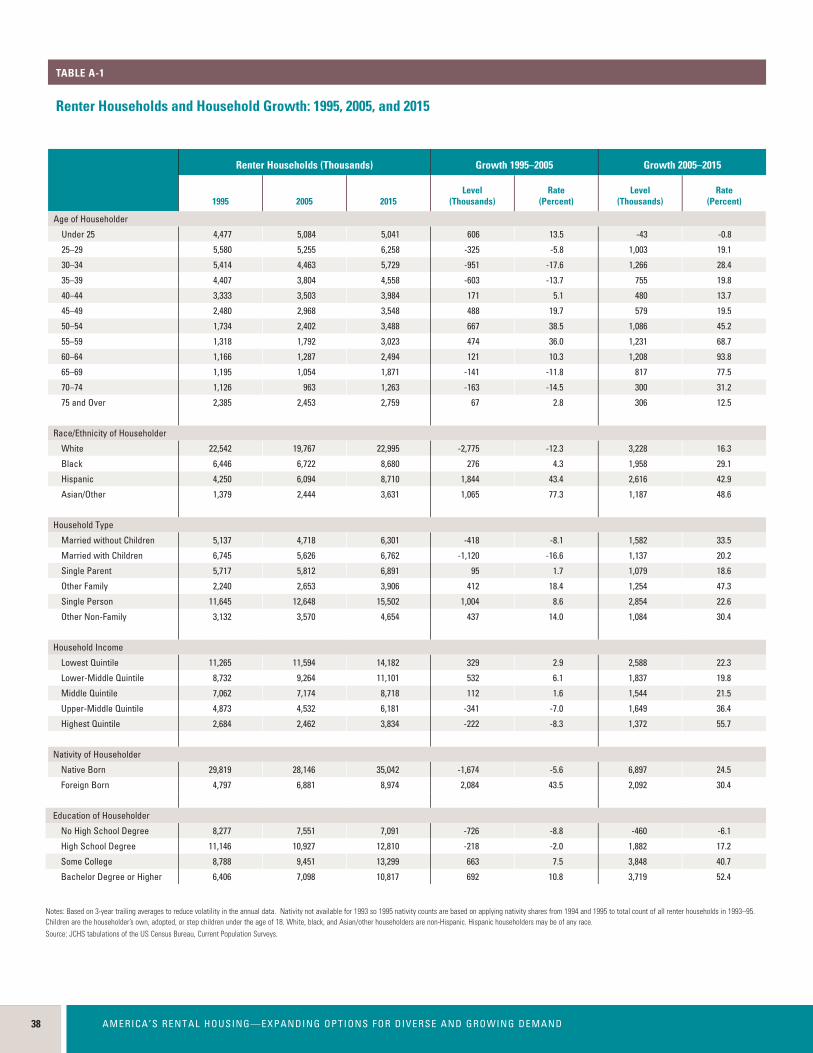
38 AMERICA’S RENTAL HOUSING—EXPANDING OPTIONS FOR DIVERSE AND GROWING DEMAND38 AMERICA’S RENTAL HOUSING—EXPANDING OPTIONS FOR DIVERSE AND GROWING DEMAND
Renter Households and Household Growth: 1995, 2005, and 2015Measure Here
TABLE A-1
Renter Households (Thousands) Growth 1995–2005 Growth 2005–2015
1995 2005 2015Level
(Thousands)Rate
(Percent)Level
(Thousands)Rate
(Percent)
Age of Householder
Under 25 4,477 5,084 5,041 606 13.5 -43 -0.8
25–29 5,580 5,255 6,258 -325 -5.8 1,003 19.1
30–34 5,414 4,463 5,729 -951 -17.6 1,266 28.4
35–39 4,407 3,804 4,558 -603 -13.7 755 19.8
40–44 3,333 3,503 3,984 171 5.1 480 13.7
45–49 2,480 2,968 3,548 488 19.7 579 19.5
50–54 1,734 2,402 3,488 667 38.5 1,086 45.2
55–59 1,318 1,792 3,023 474 36.0 1,231 68.7
60–64 1,166 1,287 2,494 121 10.3 1,208 93.8
65–69 1,195 1,054 1,871 -141 -11.8 817 77.5
70–74 1,126 963 1,263 -163 -14.5 300 31.2
75 and Over 2,385 2,453 2,759 67 2.8 306 12.5
Race/Ethnicity of Householder
White 22,542 19,767 22,995 -2,775 -12.3 3,228 16.3
Black 6,446 6,722 8,680 276 4.3 1,958 29.1
Hispanic 4,250 6,094 8,710 1,844 43.4 2,616 42.9
Asian/Other 1,379 2,444 3,631 1,065 77.3 1,187 48.6
Household Type
Married without Children 5,137 4,718 6,301 -418 -8.1 1,582 33.5
Married with Children 6,745 5,626 6,762 -1,120 -16.6 1,137 20.2
Single Parent 5,717 5,812 6,891 95 1.7 1,079 18.6
Other Family 2,240 2,653 3,906 412 18.4 1,254 47.3
Single Person 11,645 12,648 15,502 1,004 8.6 2,854 22.6
Other Non-Family 3,132 3,570 4,654 437 14.0 1,084 30.4
Household Income
Lowest Quintile 11,265 11,594 14,182 329 2.9 2,588 22.3
Lower-Middle Quintile 8,732 9,264 11,101 532 6.1 1,837 19.8
Middle Quintile 7,062 7,174 8,718 112 1.6 1,544 21.5
Upper-Middle Quintile 4,873 4,532 6,181 -341 -7.0 1,649 36.4
Highest Quintile 2,684 2,462 3,834 -222 -8.3 1,372 55.7
Nativity of Householder
Native Born 29,819 28,146 35,042 -1,674 -5.6 6,897 24.5
Foreign Born 4,797 6,881 8,974 2,084 43.5 2,092 30.4
Education of Householder
No High School Degree 8,277 7,551 7,091 -726 -8.8 -460 -6.1
High School Degree 11,146 10,927 12,810 -218 -2.0 1,882 17.2
Some College 8,788 9,451 13,299 663 7.5 3,848 40.7
Bachelor Degree or Higher 6,406 7,098 10,817 692 10.8 3,719 52.4
Notes: Based on 3-year trailing averages to reduce volatility in the annual data. Nativity not available for 1993 so 1995 nativity counts are based on applying nativity shares from 1994 and 1995 to total count of all renter households in 1993–95. Children are the householder’s own, adopted, or step children under the age of 18. White, black, and Asian/other householders are non-Hispanic. Hispanic householders may be of any race. Source: JCHS tabulations of the US Census Bureau, Current Population Surveys.
31685-15_R15_4_Production_TextV3.indd 38 12/1/15 2:20 PM
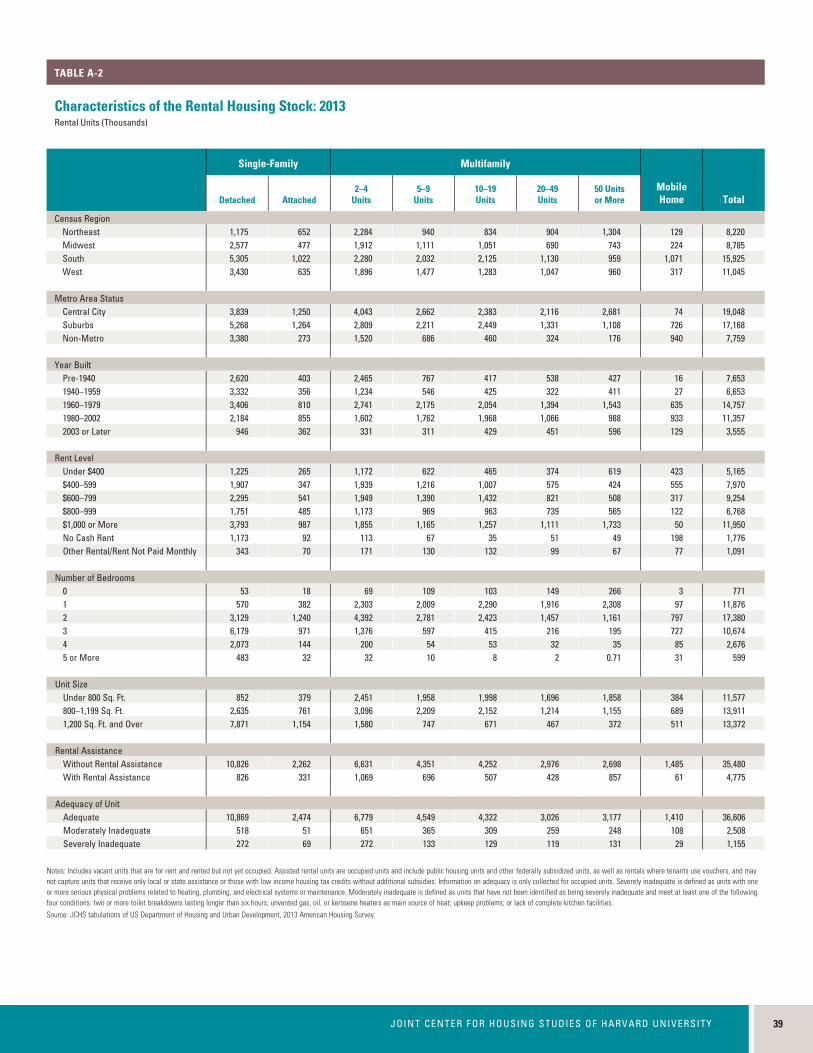
2139JOINT CENTER FOR HOUSING STUDIES OF HARVARD UNIVERSITY
2139JOINT CENTER FOR HOUSING STUDIES OF HARVARD UNIVERSITY
Renter Households and Household Growth: 1995, 2005, and 2015Measure Here
TABLE A-1
Characteristics of the Rental Housing Stock: 2013 Rental Units (Thousands)
TABLE A-2
Single-Family Multifamily
Mobile Home TotalDetached Attached
2–4 Units
5–9 Units
10–19 Units
20–49 Units
50 Units or More
Census RegionNortheast 1,175 652 2,284 940 834 904 1,304 129 8,220Midwest 2,577 477 1,912 1,111 1,051 690 743 224 8,785South 5,305 1,022 2,280 2,032 2,125 1,130 959 1,071 15,925West 3,430 635 1,896 1,477 1,283 1,047 960 317 11,045
Metro Area StatusCentral City 3,839 1,250 4,043 2,662 2,383 2,116 2,681 74 19,048Suburbs 5,268 1,264 2,809 2,211 2,449 1,331 1,108 726 17,168Non-Metro 3,380 273 1,520 686 460 324 176 940 7,759
Year BuiltPre-1940 2,620 403 2,465 767 417 538 427 16 7,6531940–1959 3,332 356 1,234 546 425 322 411 27 6,6531960–1979 3,406 810 2,741 2,175 2,054 1,394 1,543 635 14,7571980–2002 2,184 855 1,602 1,762 1,968 1,066 988 933 11,3572003 or Later 946 362 331 311 429 451 596 129 3,555
Rent LevelUnder $400 1,225 265 1,172 622 465 374 619 423 5,165$400–599 1,907 347 1,939 1,216 1,007 575 424 555 7,970$600–799 2,295 541 1,949 1,390 1,432 821 508 317 9,254$800–999 1,751 485 1,173 969 963 739 565 122 6,768$1,000 or More 3,793 987 1,855 1,165 1,257 1,111 1,733 50 11,950No Cash Rent 1,173 92 113 67 35 51 49 198 1,776Other Rental/Rent Not Paid Monthly 343 70 171 130 132 99 67 77 1,091
Number of Bedrooms0 53 18 69 109 103 149 266 3 7711 570 382 2,303 2,009 2,290 1,916 2,308 97 11,8762 3,129 1,240 4,392 2,781 2,423 1,457 1,161 797 17,3803 6,179 971 1,376 597 415 216 195 727 10,6744 2,073 144 200 54 53 32 35 85 2,6765 or More 483 32 32 10 8 2 0.71 31 599
Unit SizeUnder 800 Sq. Ft. 852 379 2,451 1,958 1,998 1,696 1,858 384 11,577800–1,199 Sq. Ft. 2,635 761 3,096 2,209 2,152 1,214 1,155 689 13,9111,200 Sq. Ft. and Over 7,871 1,154 1,580 747 671 467 372 511 13,372
Rental AssistanceWithout Rental Assistance 10,826 2,262 6,631 4,351 4,252 2,976 2,698 1,485 35,480With Rental Assistance 826 331 1,069 696 507 428 857 61 4,775
Adequacy of UnitAdequate 10,869 2,474 6,779 4,549 4,322 3,026 3,177 1,410 36,606Moderately Inadequate 518 51 651 365 309 259 248 108 2,508Severely Inadequate 272 69 272 133 129 119 131 29 1,155
Notes: Includes vacant units that are for rent and rented but not yet occupied. Assisted rental units are occupied units and include public housing units and other federally subsidized units, as well as rentals where tenants use vouchers, and maynot capture units that receive only local or state assistance or those with low income housing tax credits without additional subsidies. Information on adequacy is only collected for occupied units. Severely inadequate is defined as units with one or more serious physical problems related to heating, plumbing, and electrical systems or maintenance. Moderately inadequate is defined as units that have not been identified as being severely inadequate and meet at least one of the following four conditions: two or more toilet breakdowns lasting longer than six hours; unvented gas, oil, or kerosene heaters as main source of heat; upkeep problems; or lack of complete kitchen facilities.Source: JCHS tabulations of US Department of Housing and Urban Development, 2013 American Housing Survey.
31685-15_R15_4_Production_TextV3.indd 39 12/1/15 2:21 PM
40 AMERICA’S RENTAL HOUSING—EXPANDING OPTIONS FOR DIVERSE AND GROWING DEMAND40 AMERICA’S RENTAL HOUSING—EXPANDING OPTIONS FOR DIVERSE AND GROWING DEMAND
Housing Cost-Burdened Renters by Demographic Characteristics: 2001, 2013, and 2014Households (Thousands)
TABLE A-3
Renter Characteristics
2001 2013 2014
Moderately Burdened
Severely Burdened Total
Moderately Burdened
Severely Burdened Total
Moderately Burdened
Severely Burdened Total
All Renter Households 7,335 7,457 14,792 9,549 11,216 20,764 9,854 11,418 21,271
Age of Householder
Under 25 1,086 1,475 2,561 895 1,559 2,454 906 1,513 2,419
25–44 3,512 3,078 6,590 4,451 4,669 9,120 4,562 4,721 9,282
45–64 1,620 1,603 3,223 2,753 3,230 5,983 2,860 3,342 6,202
65 and Over 1,117 1,300 2,417 1,449 1,758 3,207 1,526 1,842 3,368
Race/Ethnicity of Householder
White 4,118 3,924 8,043 4,921 5,383 10,304 4,999 5,343 10,342
Black 1,436 1,705 3,141 1,902 2,655 4,557 1,996 2,717 4,713
Hispanic 1,291 1,226 2,517 2,042 2,270 4,311 2,122 2,391 4,513
Asian/Other 491 602 1,092 684 908 1,592 737 966 1,703
Household Type
Married without Children 680 451 1,131 1,030 741 1,772 1,074 767 1,841
Married with Children 1,037 606 1,643 1,425 1,067 2,492 1,388 1,072 2,460
Single Parent 1,553 1,851 3,403 1,816 2,701 4,518 1,850 2,698 4,548
Other Family 546 455 1,001 884 904 1,787 955 927 1,882
Single Person 2,927 3,511 6,438 3,537 4,896 8,432 3,716 5,051 8,766
Non-Family 592 583 1,176 857 906 1,764 870 904 1,774
Household Income
Under $15,000 933 4,921 5,854 1,096 6,973 8,069 1,109 6,943 8,052
$15,000–29,999 3,218 2,101 5,320 3,921 3,352 7,272 3,851 3,517 7,368
$30,000–44,999 2,098 321 2,419 2,680 683 3,363 2,859 732 3,590
$45,000–74,999 900 102 1,002 1,504 197 1,701 1,652 211 1,863
$75,000 and Over 186 12 198 349 10 359 383 16 398
Education of Householder
No High School Degree 1,906 2,307 4,213 1,696 2,408 4,104 1,708 2,458 4,166
High School Degree 2,118 2,048 4,166 2,687 3,218 5,905 2,757 3,326 6,083
Some College 2,143 2,074 4,217 3,271 3,769 7,040 3,393 3,779 7,172
Bachelor Degree or Higher 1,168 1,028 2,196 1,896 1,820 3,716 1,995 1,856 3,850
Weeks Worked in Last 12 Months by Householder
Fully Employed 3,887 1,790 5,677 5,340 3,199 8,539 5,640 3,385 9,025
Short-Term Unemployed 928 874 1,802 873 1,152 2,025 871 1,132 2,003
Long-Term Unemployed 582 1,444 2,026 572 1,478 2,050 532 1,423 1,955
Fully Unemployed 71 223 293 183 675 858 145 578 723
Not in Labor Force 1,867 3,126 4,993 2,581 4,711 7,292 2,666 4,900 7,566
Notes: Moderately (severely) cost-burdened pay more than 30% and up to 50% (more than 50%) of household income for housing. Households with zero or negative income are assumed to be severely burdened, while households paying no cash rent are assumed to be unburdened. Income cutoffs are in 2014 dollars adjusted for inflation using the CPI-U for All Items. White, black, and Asian/other householders are non-Hispanic. Hispanic householders may be of any race. Children are the householder’s own, adopted, or step-children under the age of 18. Fully employed householders worked for at least 48 weeks during the previous 12 months, short-term unemployed for 27–47 weeks, and long-term unemployed for 1–26 weeks. Fully unemployed householders did not work in the previous 12 months but were in the labor force. Householders not in the labor force include those under the age of 16.Source: JCHS tabulations of US Census Bureau, American Community Surveys.
31685-15_R15_4_Production_TextV3.indd 40 12/1/15 2:21 PM
2141JOINT CENTER FOR HOUSING STUDIES OF HARVARD UNIVERSITY
2141JOINT CENTER FOR HOUSING STUDIES OF HARVARD UNIVERSITY
Housing Cost-Burdened Renters by Demographic Characteristics: 2001, 2013, and 2014Households (Thousands)
TABLE A-3
Multifamily Housing Market Indicators: 1980–2014Thousands
TABLE A-4
YearPermits 1
(Thousands)Starts 2
(Thousands)
Completions 3Size of New
Units 3(Median sq. ft.)
Rental Vacancy Rates 4
(Percent)
Value Put in Place: New
Units 5(Millions of 2014 dollars)
For Sale (Thousands)
For Rent (Thousands)
1980 480 440 174 371 915 6.4 48,000
1981 421 379 164 283 930 6.0 45,500
1982 454 400 148 226 925 6.2 38,100
1983 704 635 152 314 893 6.7 53,400
1984 759 665 197 430 871 7.0 64,300
1985 777 669 184 447 882 7.9 62,800
1986 692 626 133 503 876 9.2 67,000
1987 510 474 134 412 920 9.7 53,000
1988 462 407 117 329 940 9.8 44,600
1989 407 373 90 307 940 9.2 42,600
1990 317 298 76 266 955 9.0 34,900
1991 195 174 56 197 980 9.4 26,300
1992 184 170 44 150 985 9.4 22,100
1993 213 162 44 109 1,005 9.4 17,700
1994 303 259 49 138 1,015 9.0 22,500
1995 335 278 51 196 1,040 9.0 27,800
1996 356 316 50 234 1,030 9.3 30,700
1997 379 340 54 230 1,050 9.0 33,700
1998 425 346 55 260 1,020 9.0 35,700
1999 417 339 55 279 1,041 8.7 39,000
2000 394 338 60 272 1,039 8.7 38,800
2001 401 329 75 240 1,104 8.9 40,500
2002 415 346 63 260 1,070 9.7 43,400
2003 428 349 56 236 1,092 10.7 45,200
2004 457 345 72 238 1,105 10.9 50,100
2005 473 353 97 199 1,143 10.0 57,300
2006 461 336 127 198 1,172 9.8 62,000
2007 419 309 116 169 1,197 10.0 55,900
2008 330 284 101 200 1,122 10.4 48,800
2009 142 109 66 208 1,113 11.3 31,500
2010 157 116 30 125 1,110 11.1 15,900
2011 206 178 16 123 1,124 10.0 15,800
2012 311 245 11 155 1,098 9.3 23,200
2013 370 307 11 184 1,059 8.8 32,000
2014 412 355 13 252 1,073 7.9 41,800
Notes: Value put in place is adjusted for inflation using the US Bureau of Labor Statistics Consumer Price Index for All Urban Consumers (CPI-U) for All Items. Web links confirmed as of November 2015.Sources:1. US Census Bureau, New Privately Owned Housing Units Authorized by Building Permits, http://www.census.gov/construction/nrc/xls/permits_cust.xls2. US Census Bureau, New Privately Owned Housing Units Started, www.census.gov/construction/nrc/xls/starts_cust.xls3. US Census Bureau, New Privately Owned Housing Units Completed in the United States, by Purpose and Design, http://www.census.gov/construction/nrc/xls/quar_co_purpose_cust.xls4. US Census Bureau, Housing Vacancy Survey, http://www.census.gov/housing/hvs/data/histtabs.html. Data are for units in structures with 2 or more units.5. US Census Bureau, Annual Value of Private Construction Put in Place, http://www.census.gov/construction/c30/historical_data.html
31685-15_R15_4_Production_TextV3.indd 41 12/1/15 2:21 PM

42 AMERICA’S RENTAL HOUSING—EXPANDING OPTIONS FOR DIVERSE AND GROWING DEMAND42 AMERICA’S RENTAL HOUSING—EXPANDING OPTIONS FOR DIVERSE AND GROWING DEMAND
Shares of Housing Cost-Burdened Renters by State: 2014Share of Households (Percent)
TABLE A-5
Moderately Burdened
Severely Burdened
Alabama 21.0 25.6
Alaska 27.2 23.2
Arizona 22.1 25.0
Arkansas 21.8 20.9
California 25.2 30.0
Colorado 24.4 24.8
Connecticut 23.2 28.5
Delaware 22.6 24.8
Florida 25.2 30.4
Georgia 23.3 26.7
Hawaii 24.7 29.2
Idaho 23.0 22.6
Illinois 21.4 26.9
Indiana 21.7 24.8
Iowa 18.1 21.3
Kansas 19.3 22.4
Kentucky 20.8 24.2
Louisiana 20.5 27.5
Maine 21.2 25.8
Maryland 24.7 25.0
Massachusetts 22.5 25.5
Michigan 22.0 28.7
Minnesota 21.7 24.0
Mississippi 20.3 25.5
Missouri 20.8 24.2
Montana 21.2 23.5
Moderately Burdened
Severely Burdened
Nebraska 19.9 18.4
Nevada 24.0 23.6
New Hampshire 23.2 22.4
New Jersey 23.3 28.2
New Mexico 21.2 26.4
New York 22.7 29.8
North Carolina 22.9 24.8
North Dakota 17.9 19.7
Ohio 20.8 25.1
Oklahoma 20.1 20.6
Oregon 25.5 27.3
Pennsylvania 21.6 26.9
Rhode Island 23.4 28.1
South Carolina 22.4 24.3
South Dakota 19.1 17.7
Tennessee 21.9 25.6
Texas 22.8 24.0
Utah 24.4 19.9
Vermont 24.4 20.1
Virginia 22.4 24.7
Washington 24.1 24.0
Washington, DC 19.9 26.1
West Virginia 17.5 21.6
Wisconsin 22.0 23.9
Wyoming 20.1 19.6
US Total 22.8 26.4
Notes: Moderately (severely) cost-burdened households pay more than 30% and up to 50% (more than 50%) of household income for housing. Households with zero or negative income are assumed to be severely burdened, while households paying no cash rent are assumed to be unburdened.Source: JCHS tabulations of US Census Bureau, 2014 American Community Survey.
31685-15_R15_4_Production_TextV3.indd 42 12/1/15 2:21 PM
2143JOINT CENTER FOR HOUSING STUDIES OF HARVARD UNIVERSITY
2143JOINT CENTER FOR HOUSING STUDIES OF HARVARD UNIVERSITY
Shares of Housing Cost-Burdened Renters by State: 2014Share of Households (Percent)
TABLE A-5
Counts of Housing Cost-Burdened Renters by State: 2014Number of Households (Thousands)
TABLE A-6
Moderately Burdened
Severely Burdened
Alabama 125 153
Alaska 25 21
Arizona 209 237
Arkansas 84 81
California 1,484 1,769
Colorado 179 182
Connecticut 105 130
Delaware 23 26
Florida 662 800
Georgia 315 360
Hawaii 48 57
Idaho 43 42
Illinois 350 440
Indiana 171 195
Iowa 64 75
Kansas 71 83
Kentucky 122 142
Louisiana 125 168
Maine 33 40
Maryland 182 184
Massachusetts 219 249
Michigan 251 328
Minnesota 129 144
Mississippi 72 91
Missouri 162 188
Montana 28 31
Moderately Burdened
Severely Burdened
Nebraska 50 46
Nevada 113 111
New Hampshire 36 35
New Jersey 272 330
New Mexico 53 66
New York 775 1,019
North Carolina 310 336
North Dakota 21 23
Ohio 331 398
Oklahoma 102 105
Oregon 153 164
Pennsylvania 334 416
Rhode Island 40 47
South Carolina 131 142
South Dakota 21 19
Tennessee 185 216
Texas 820 864
Utah 68 56
Vermont 18 15
Virginia 240 263
Washington 246 245
Washington, DC 33 43
West Virginia 36 44
Wisconsin 168 182
Wyoming 15 15
US Total 9,854 11,418
Notes: Moderately (severely) cost-burdened households pay more than 30% and up to 50% (more than 50%) of household income for housing. Households with zero or negative income are assumed to be severely burdened, while households paying no cash rent are assumed to be unburdened.Source: JCHS tabulations of US Census Bureau, 2014 American Community Survey.
31685-15_R15_4_Production_TextV3.indd 43 12/1/15 2:21 PM
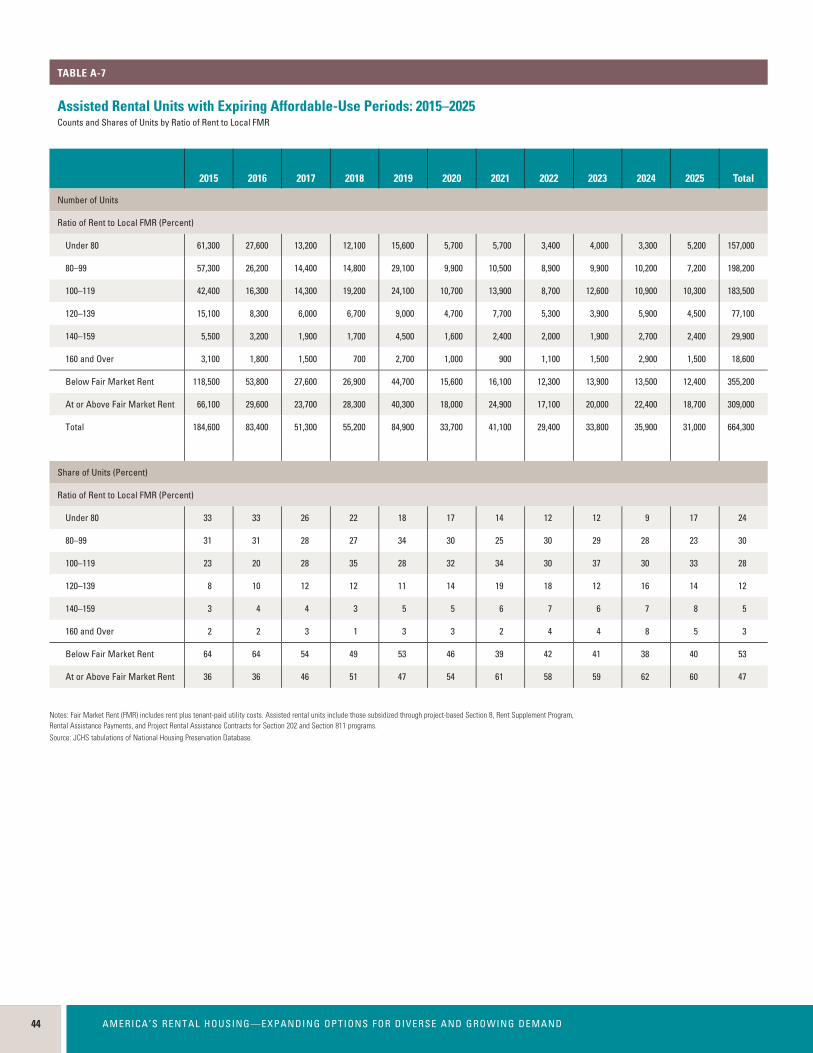
44 AMERICA’S RENTAL HOUSING—EXPANDING OPTIONS FOR DIVERSE AND GROWING DEMAND44 AMERICA’S RENTAL HOUSING—EXPANDING OPTIONS FOR DIVERSE AND GROWING DEMAND
Assisted Rental Units with Expiring Affordable-Use Periods: 2015–2025Counts and Shares of Units by Ratio of Rent to Local FMR
TABLE A-7
2015 2016 2017 2018 2019 2020 2021 2022 2023 2024 2025 Total
Number of Units
Ratio of Rent to Local FMR (Percent)
Under 80 61,300 27,600 13,200 12,100 15,600 5,700 5,700 3,400 4,000 3,300 5,200 157,000
80–99 57,300 26,200 14,400 14,800 29,100 9,900 10,500 8,900 9,900 10,200 7,200 198,200
100–119 42,400 16,300 14,300 19,200 24,100 10,700 13,900 8,700 12,600 10,900 10,300 183,500
120–139 15,100 8,300 6,000 6,700 9,000 4,700 7,700 5,300 3,900 5,900 4,500 77,100
140–159 5,500 3,200 1,900 1,700 4,500 1,600 2,400 2,000 1,900 2,700 2,400 29,900
160 and Over 3,100 1,800 1,500 700 2,700 1,000 900 1,100 1,500 2,900 1,500 18,600
Below Fair Market Rent 118,500 53,800 27,600 26,900 44,700 15,600 16,100 12,300 13,900 13,500 12,400 355,200
At or Above Fair Market Rent 66,100 29,600 23,700 28,300 40,300 18,000 24,900 17,100 20,000 22,400 18,700 309,000
Total 184,600 83,400 51,300 55,200 84,900 33,700 41,100 29,400 33,800 35,900 31,000 664,300
Share of Units (Percent)
Ratio of Rent to Local FMR (Percent)
Under 80 33 33 26 22 18 17 14 12 12 9 17 24
80–99 31 31 28 27 34 30 25 30 29 28 23 30
100–119 23 20 28 35 28 32 34 30 37 30 33 28
120–139 8 10 12 12 11 14 19 18 12 16 14 12
140–159 3 4 4 3 5 5 6 7 6 7 8 5
160 and Over 2 2 3 1 3 3 2 4 4 8 5 3
Below Fair Market Rent 64 64 54 49 53 46 39 42 41 38 40 53
At or Above Fair Market Rent 36 36 46 51 47 54 61 58 59 62 60 47
Notes: Fair Market Rent (FMR) includes rent plus tenant-paid utility costs. Assisted rental units include those subsidized through project-based Section 8, Rent Supplement Program, Rental Assistance Payments, and Project Rental Assistance Contracts for Section 202 and Section 811 programs. Source: JCHS tabulations of National Housing Preservation Database.
31685-15_R15_4_Production_TextV3.indd 44 12/1/15 2:21 PM

The Joint Center for Housing Studies of Harvard University advances understanding of housing issues and informs policy. Through its research, education, and public outreach programs, the Center helps leaders in government, business, and the civic sectors make decisions that effectively address the needs of cities and communities. Through graduate and executive courses, as well as fellowships and internship opportunities, the Joint Center also trains and inspires the next generation of housing leaders.
STAFF
Kermit Baker
Pamela Baldwin
Heidi Carrell
James Chaknis
Angela Flynn
Christopher Herbert
Elizabeth La Jeunesse
Mary Lancaster
Irene Lew
Ellen Marya
Daniel McCue
Jennifer Molinsky
Jonathan Spader
Alexander von Hoffman
Abbe Will
FELLOWS
Barbara Alexander
William Apgar
Michael Berman
Rachel Bratt
Michael Carliner
Kent Colton
Dan Fulton
Aaron Gornstein
George Masnick
Shekar Narasimhan
Nicolas Retsinas
Mark Richardson
For additional copies, please contact
Joint Center for Housing Studies of Harvard University
1 Bow Street, Suite 400
Cambridge, MA 02138
www.jchs.harvard.edu | twitter: @Harvard_JCHS
Editor
Marcia Fernald
Designer
John Skurchak
31685-15_R15 cover Av2.indd 4 11/27/15 9:15 AM
Joint Center for Housing Studies of Harvard University
1 Bow Street, Suite 400 Cambridge, MA 02138
www.jchs.harvard.edu
31685-15_R15 cover Av2.indd 1 11/27/15 9:15 AM