aswath damodaran1 loose ends in valuation… stop the garnishing aswath damodaran
Post on 20-Dec-2015
235 views
TRANSCRIPT
Aswath Damodaran 1
Loose Ends in Valuation…Stop the Garnishing
Aswath Damodaran
www.damodaran.com
Aswath Damodaran 2
Some Overriding Thoughts
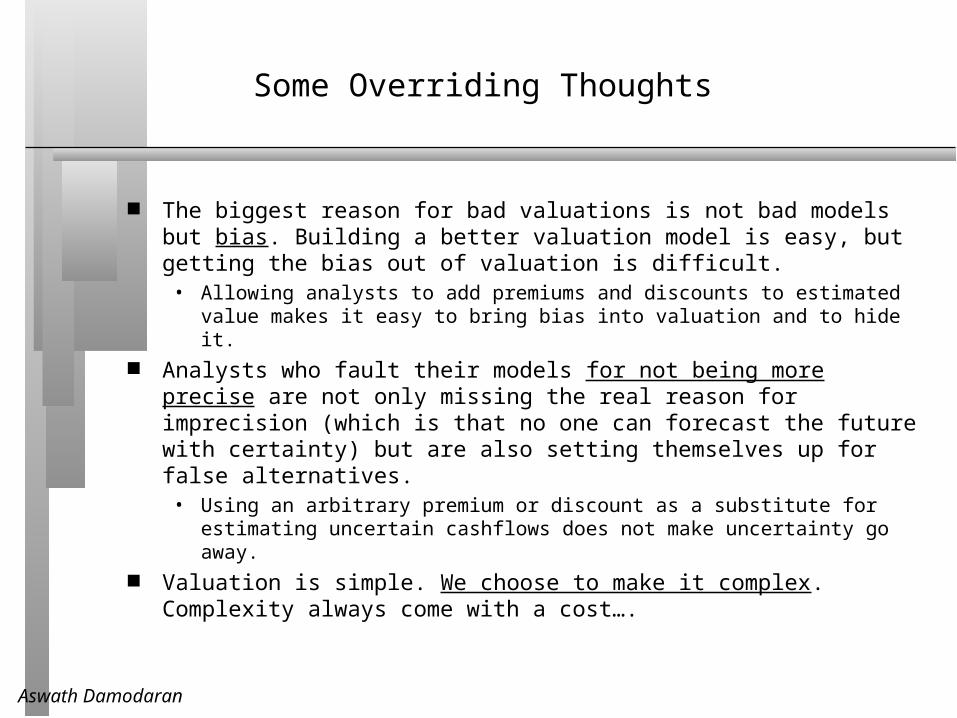
The biggest reason for bad valuations is not bad models but bias. Building a better valuation model is easy, but getting the bias out of valuation is difficult.
• Allowing analysts to add premiums and discounts to estimated value makes it easy to bring bias into valuation and to hide it.
Analysts who fault their models for not being more precise are not only missing the real reason for imprecision (which is that no one can forecast the future with certainty) but are also setting themselves up for false alternatives.
• Using an arbitrary premium or discount as a substitute for estimating uncertain cashflows does not make uncertainty go away.
Valuation is simple. We choose to make it complex. Complexity always come with a cost….
Aswath Damodaran 3
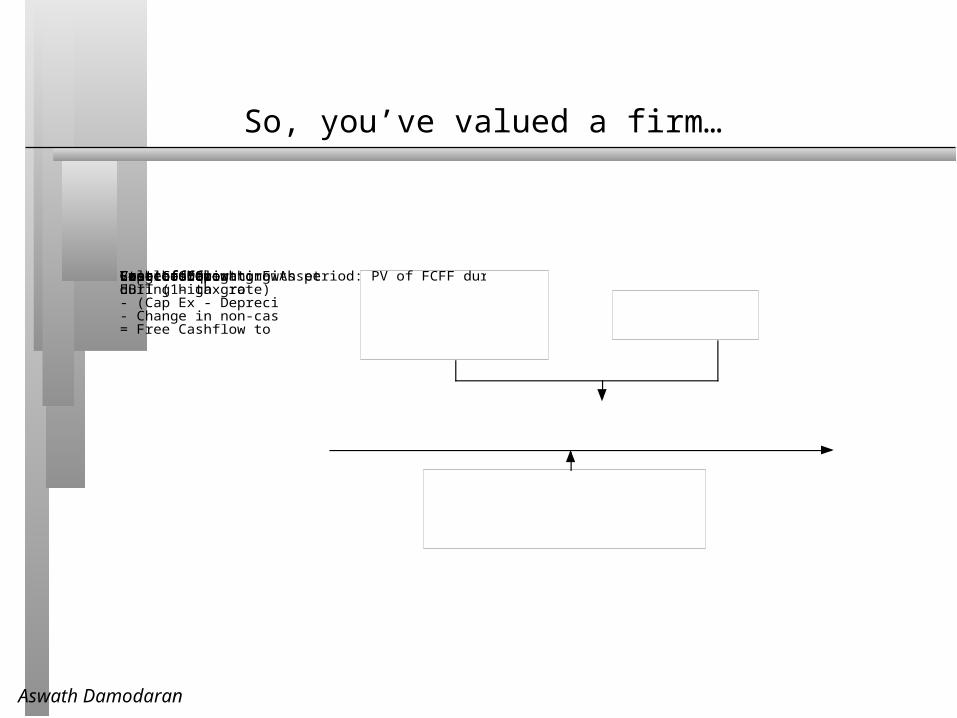
So, you’ve valued a firm…
Free Cashflow to FirmEBIT (1- tax rate)- (Cap Ex - Depreciation)- Change in non-cash WC= Free Cashflow to firm
Cost of CapitalCost of EquityCost of DebtExpected Growth during high growthLength of high growth period: PV of FCFF during high growthStable GrowthValue of Operating Assets today

Aswath Damodaran 4
But what comes next?
Aswath Damodaran 5
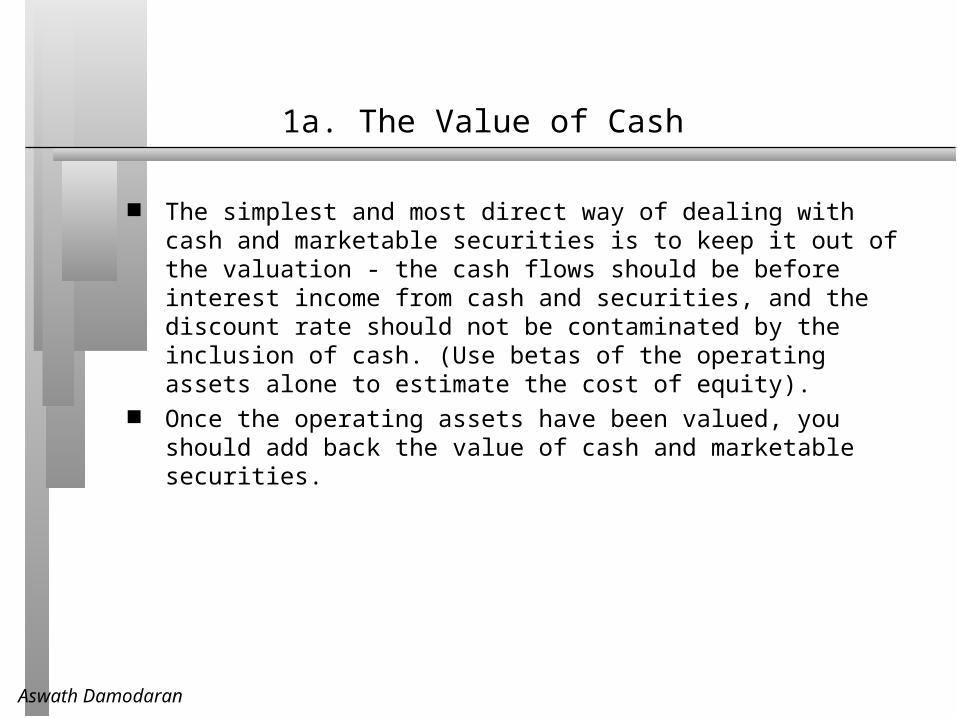
1a. The Value of Cash
The simplest and most direct way of dealing with cash and marketable securities is to keep it out of the valuation - the cash flows should be before interest income from cash and securities, and the discount rate should not be contaminated by the inclusion of cash. (Use betas of the operating assets alone to estimate the cost of equity).
Once the operating assets have been valued, you should add back the value of cash and marketable securities.
Aswath Damodaran 6
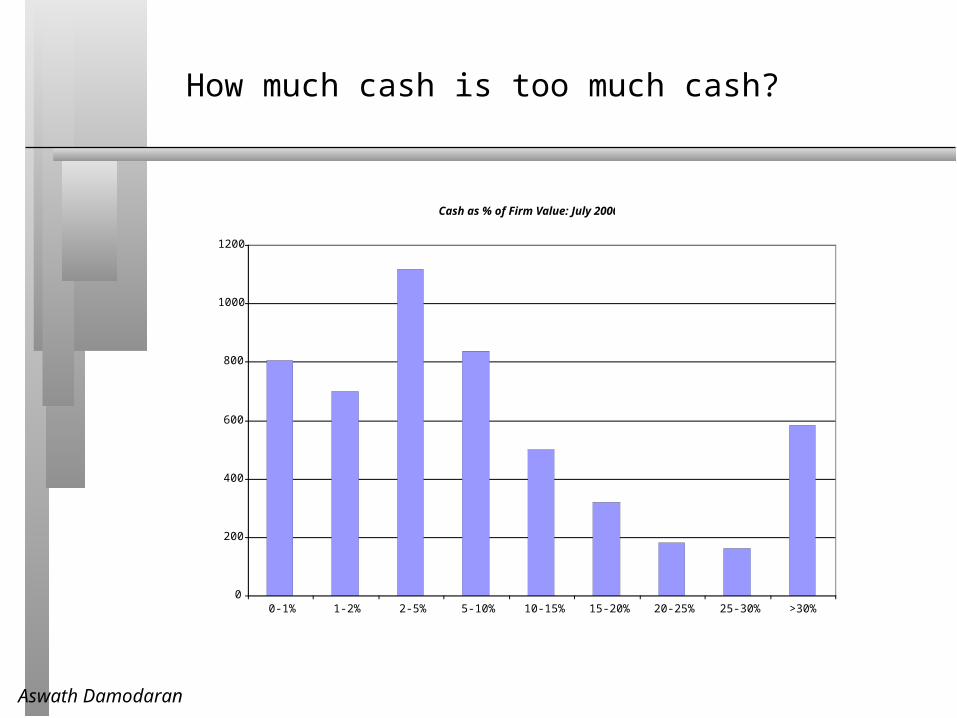
How much cash is too much cash?
Cash as % of Firm Value: July 2000
0
200
400
600
800
1000
1200
0-1% 1-2% 2-5% 5-10% 10-15% 15-20% 20-25% 25-30% >30%
Aswath Damodaran 7
Should you ever discount cash for its low returns?
There are some analysts who argue that companies with a lot of cash on their balance sheets should be penalized by having the excess cash discounted to reflect the fact that it earns a low return.
• Excess cash is usually defined as holding cash that is greater than what the firm needs for operations.
• A low return is defined as a return lower than what the firm earns on its non-cash investments.
This is the wrong reason for discounting cash. If the cash is invested in riskless securities, it should earn a low rate of return. As long as the return is high enough, given the riskless nature of the investment, cash does not destroy value.
There is a right reason, though, that may apply to some companies…
Aswath Damodaran 8
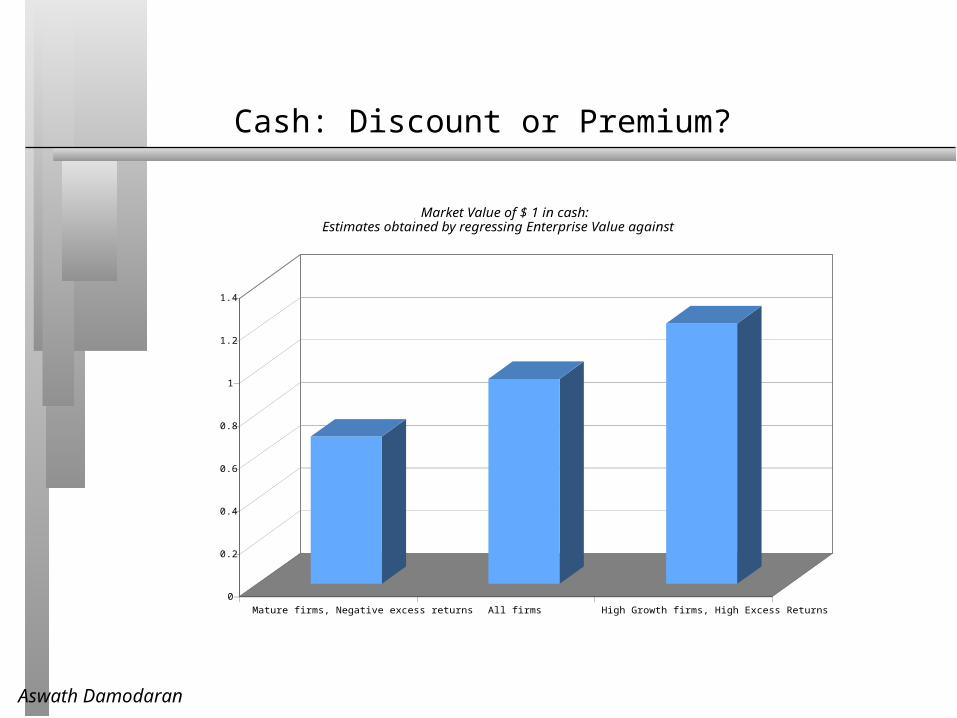
Cash: Discount or Premium?
0
0.2
0.4
0.6
0.8
1
1.2
1.4
Mature firms, Negative excess returns All firms High Growth firms, High Excess Returns
Market Value of $ 1 in cash:Estimates obtained by regressing Enterprise Value against Cash
Aswath Damodaran 9
1b. Dealing with Holdings in Other firms
Holdings in other firms can be categorized into• Minority passive holdings, in which case only the dividend from the holdings is
shown in the balance sheet
• Minority active holdings, in which case the share of equity income is shown in the income statements
• Majority active holdings, in which case the financial statements are consolidated.
Aswath Damodaran 10
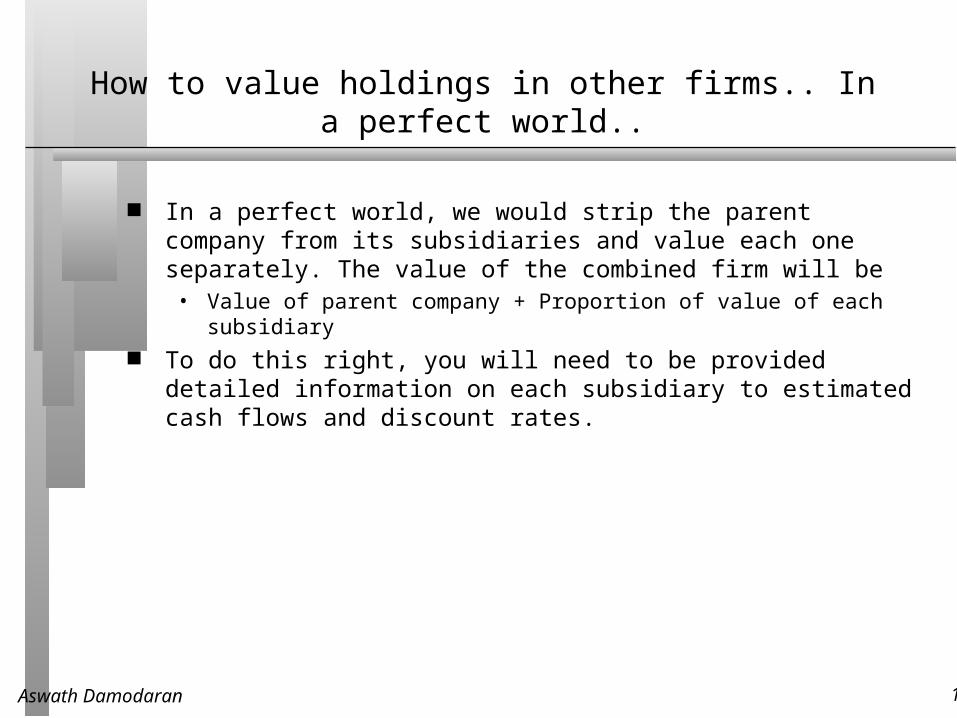
How to value holdings in other firms.. In a perfect world..
In a perfect world, we would strip the parent company from its subsidiaries and value each one separately. The value of the combined firm will be
• Value of parent company + Proportion of value of each subsidiary To do this right, you will need to be provided detailed information on each
subsidiary to estimated cash flows and discount rates.
Aswath Damodaran 11
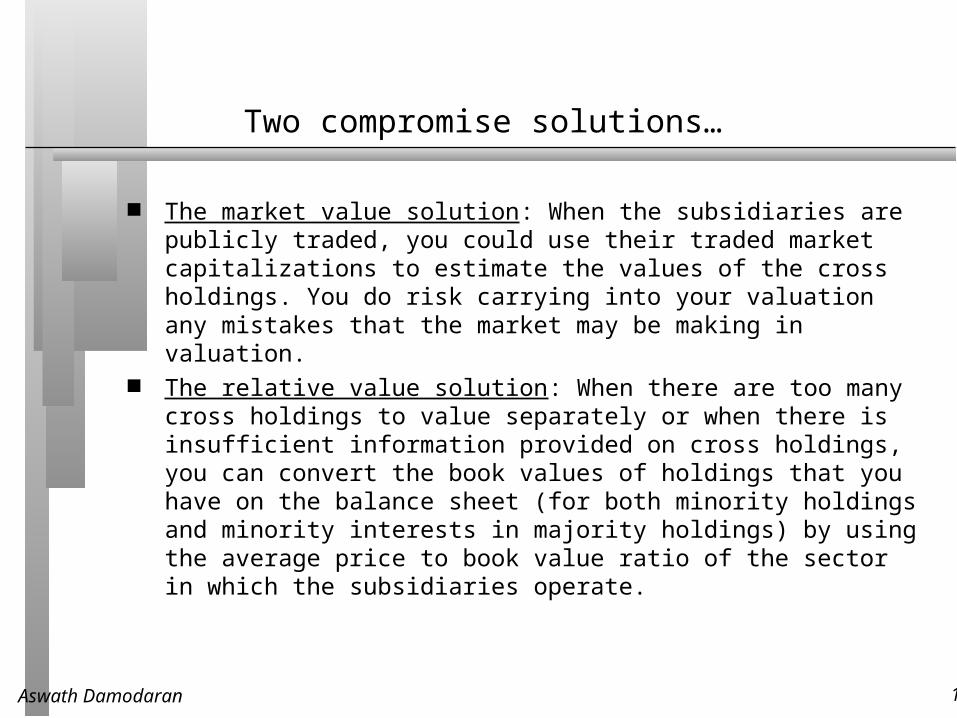
Two compromise solutions…
The market value solution: When the subsidiaries are publicly traded, you could use their traded market capitalizations to estimate the values of the cross holdings. You do risk carrying into your valuation any mistakes that the market may be making in valuation.
The relative value solution: When there are too many cross holdings to value separately or when there is insufficient information provided on cross holdings, you can convert the book values of holdings that you have on the balance sheet (for both minority holdings and minority interests in majority holdings) by using the average price to book value ratio of the sector in which the subsidiaries operate.
Aswath Damodaran 12
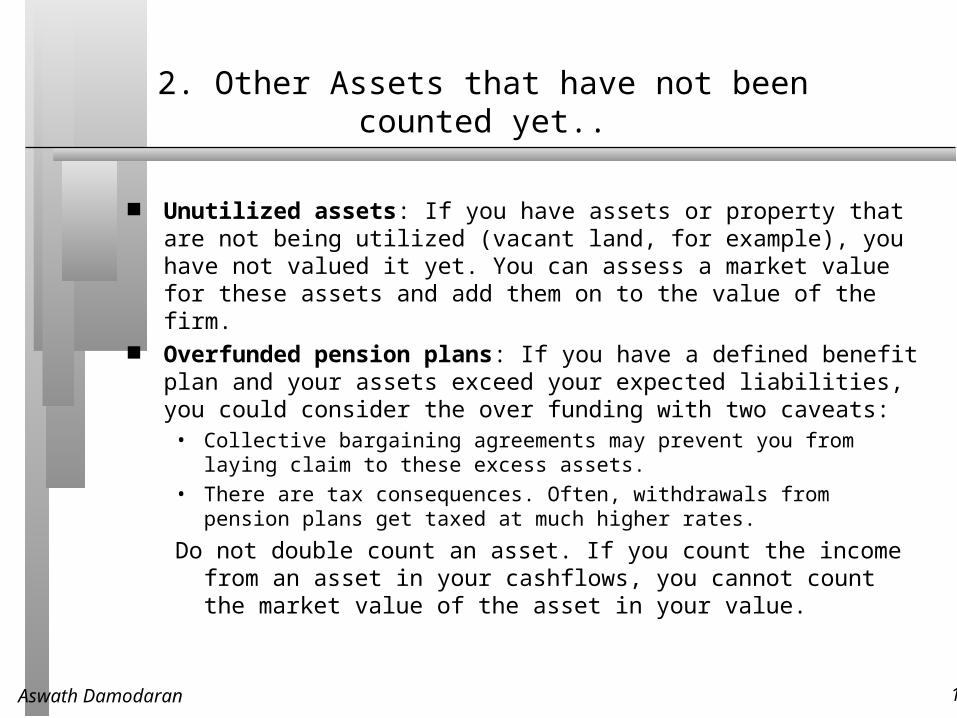
2. Other Assets that have not been counted yet..
Unutilized assets: If you have assets or property that are not being utilized (vacant land, for example), you have not valued it yet. You can assess a market value for these assets and add them on to the value of the firm.
Overfunded pension plans: If you have a defined benefit plan and your assets exceed your expected liabilities, you could consider the over funding with two caveats:
• Collective bargaining agreements may prevent you from laying claim to these excess assets.
• There are tax consequences. Often, withdrawals from pension plans get taxed at much higher rates.
Do not double count an asset. If you count the income from an asset in your cashflows, you cannot count the market value of the asset in your value.
Aswath Damodaran 13
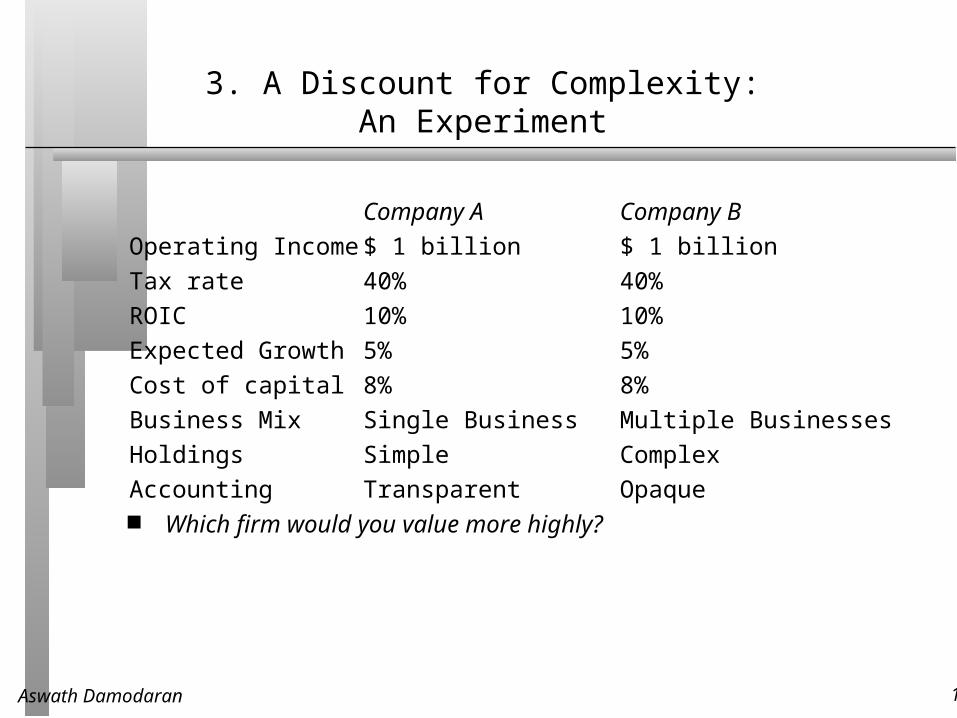
3. A Discount for Complexity:An Experiment
Company A Company B
Operating Income $ 1 billion $ 1 billion
Tax rate 40% 40%
ROIC 10% 10%
Expected Growth 5% 5%
Cost of capital 8% 8%
Business Mix Single Business Multiple Businesses
Holdings Simple Complex
Accounting Transparent Opaque Which firm would you value more highly?
Aswath Damodaran 14
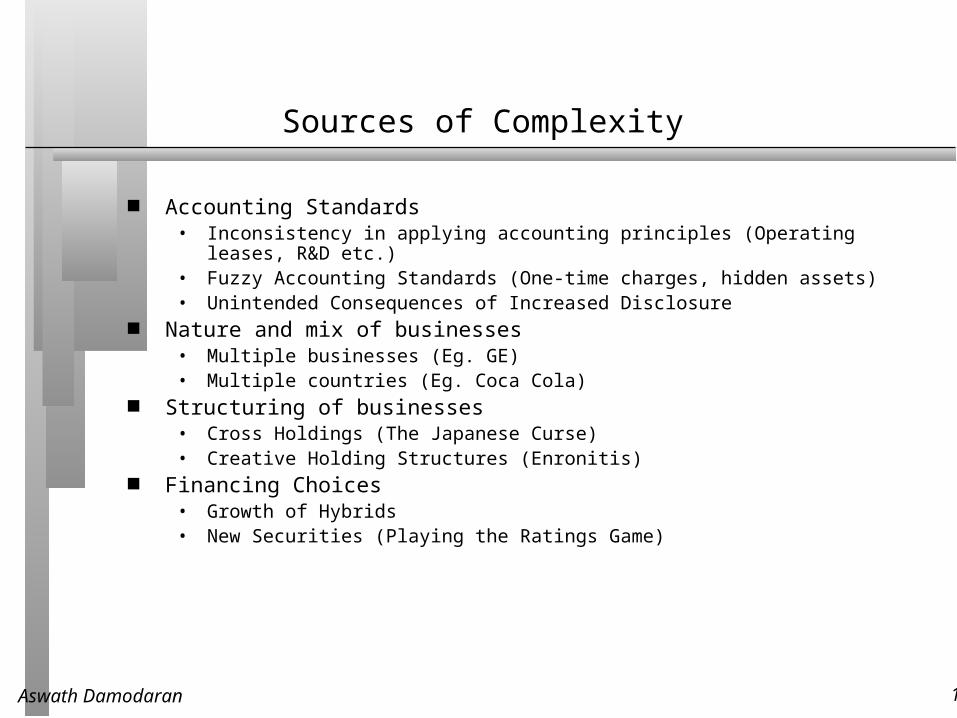
Sources of Complexity
Accounting Standards• Inconsistency in applying accounting principles (Operating leases, R&D etc.)• Fuzzy Accounting Standards (One-time charges, hidden assets)• Unintended Consequences of Increased Disclosure
Nature and mix of businesses• Multiple businesses (Eg. GE)• Multiple countries (Eg. Coca Cola)
Structuring of businesses• Cross Holdings (The Japanese Curse)• Creative Holding Structures (Enronitis)
Financing Choices• Growth of Hybrids• New Securities (Playing the Ratings Game)
Aswath Damodaran 15
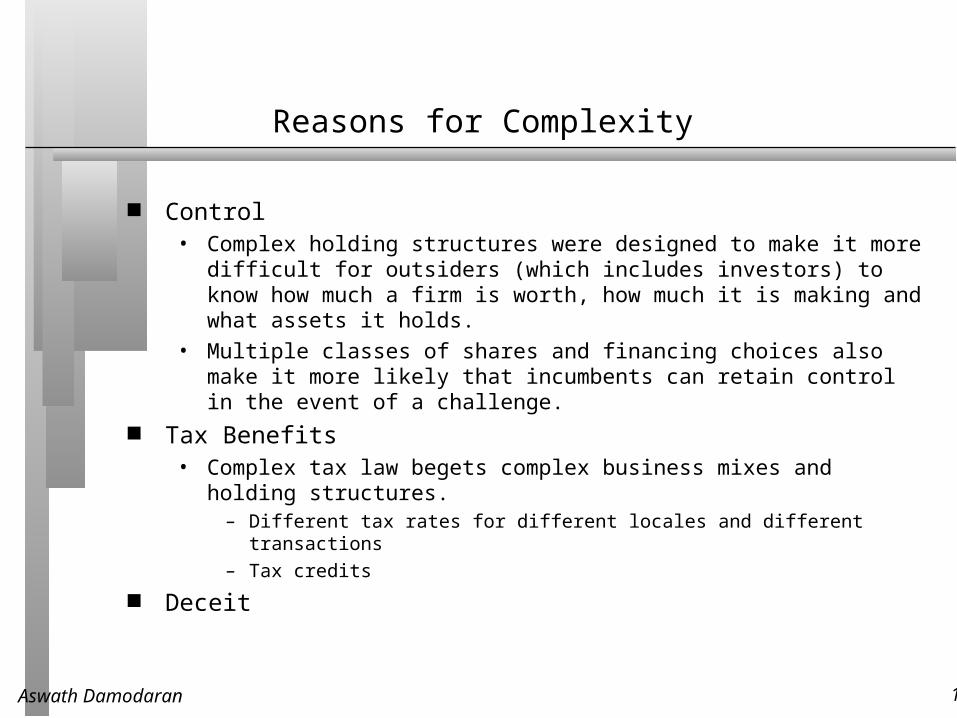
Reasons for Complexity
Control• Complex holding structures were designed to make it more difficult for outsiders
(which includes investors) to know how much a firm is worth, how much it is making and what assets it holds.
• Multiple classes of shares and financing choices also make it more likely that incumbents can retain control in the event of a challenge.
Tax Benefits• Complex tax law begets complex business mixes and holding structures.
– Different tax rates for different locales and different transactions
– Tax credits
Deceit
Aswath Damodaran 16
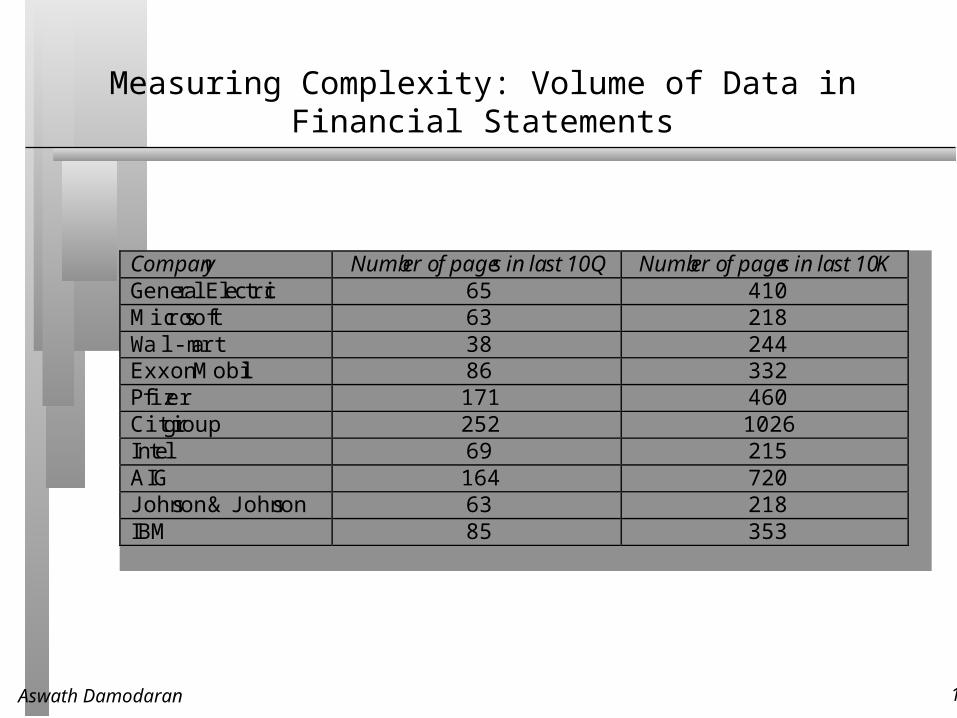
Measuring Complexity: Volume of Data in Financial Statements
Company Number of pages in last 10Q Number of pages in last 10KGeneral Electric 65 410Microsoft 63 218Wal-mart 38 244Exxon Mobil 86 332Pfizer 171 460Citigroup 252 1026Intel 69 215AIG 164 720Johnson & Johnson 63 218IBM 85 353
Aswath Damodaran 17
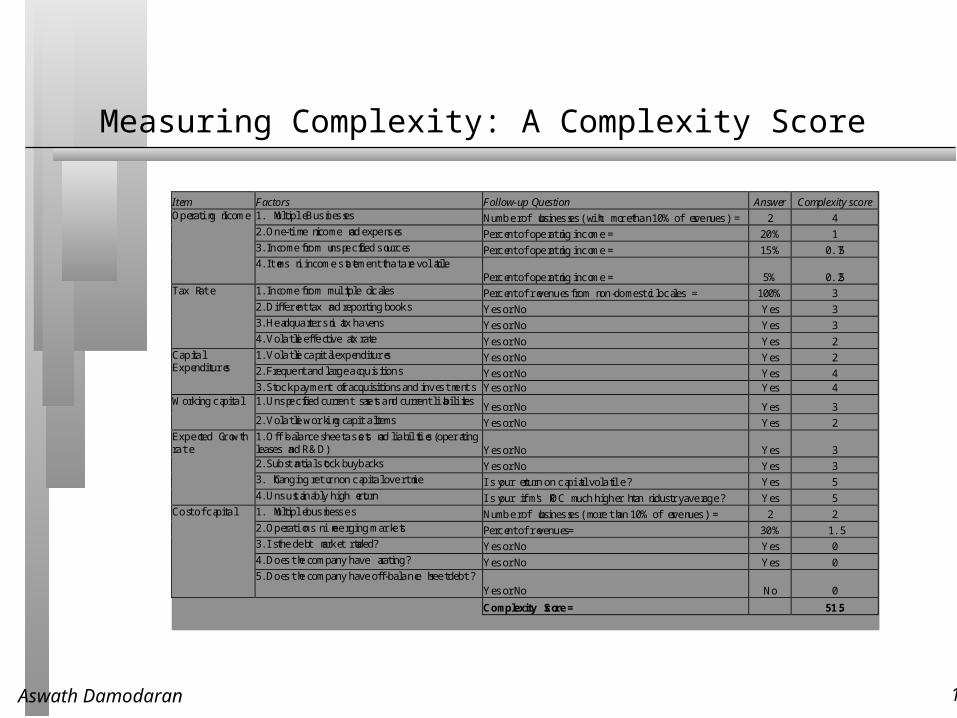
Measuring Complexity: A Complexity Score
Item Factors Follow-up Question Answer Complexity score1. Multiple Businesses Number of businesses (with more than 10% of revenues) = 2 42. One-time income and expenses Percent of operating income = 20% 13. Income from unspecified sources Percent of operating income = 15% 0.75
Operating Income
4. Items in income statement that are volatilePercent of operating income = 5% 0.25
1. Income from multiple locales Percent of revenues from non-domestic locales = 100% 32. Different tax and reporting books Yes or No Yes 33. Headquarters in tax havens Yes or No Yes 3
Tax Rate
4. Volatile effective tax rate Yes or No Yes 21. Volatile capital expenditures Yes or No Yes 22. Frequent and large acquisitions Yes or No Yes 4
CapitalExpenditures
3. Stock payment for acquisitions and investments Yes or No Yes 41. Unspecified current assets and current liabilities
Yes or No Yes 3Working capital
2. Volatile working capital items Yes or No Yes 21. Off-balance sheet assets and liabilities (operatingleases and R&D) Yes or No Yes 32. Substantial stock buybacks Yes or No Yes 33. Changing return on capital over time Is your return on capital volatile? Yes 5
Expected Growthrate
4. Unsustainably high return Is your firm's ROC much higher than industry average? Yes 51. Multiple businesses Number of businesses (more than 10% of revenues) = 2 22. Operations in emerging markets Percent of revenues= 30% 1.53. Is the debt market traded? Yes or No Yes 04. Does the company have a rating? Yes or No Yes 0
Cost of capital
5. Does the company have off-balance sheet debt?Yes or No No 0
Complexity Score = 51.5
Aswath Damodaran 18
Dealing with Complexity
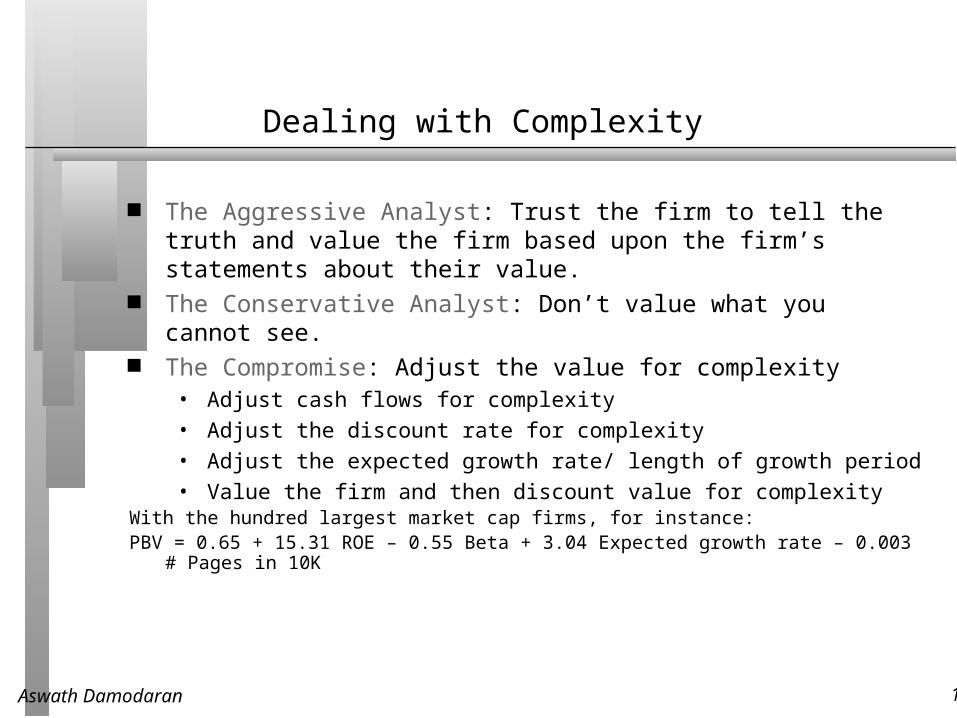
The Aggressive Analyst: Trust the firm to tell the truth and value the firm based upon the firm’s statements about their value.
The Conservative Analyst: Don’t value what you cannot see. The Compromise: Adjust the value for complexity
• Adjust cash flows for complexity
• Adjust the discount rate for complexity
• Adjust the expected growth rate/ length of growth period
• Value the firm and then discount value for complexityWith the hundred largest market cap firms, for instance:PBV = 0.65 + 15.31 ROE – 0.55 Beta + 3.04 Expected growth rate – 0.003 # Pages in 10K
Aswath Damodaran 19
4. The Value of Synergy
Synergy can be valued. In fact, if you want to pay for it, it should be valued. To value synergy, you need to answer two questions:
(a) What form is the synergy expected to take? Will it reduce costs as a percentage of sales and increase profit margins (as is the case when there are economies of scale)? Will it increase future growth (as is the case when there is increased market power)? )
(b) When can the synergy be reasonably expected to start affecting cashflows? (Will the gains from synergy show up instantaneously after the takeover? If it will take time, when can the gains be expected to start showing up? )
If you cannot answer these questions, you need to go back to the drawing board…
Aswath Damodaran 20
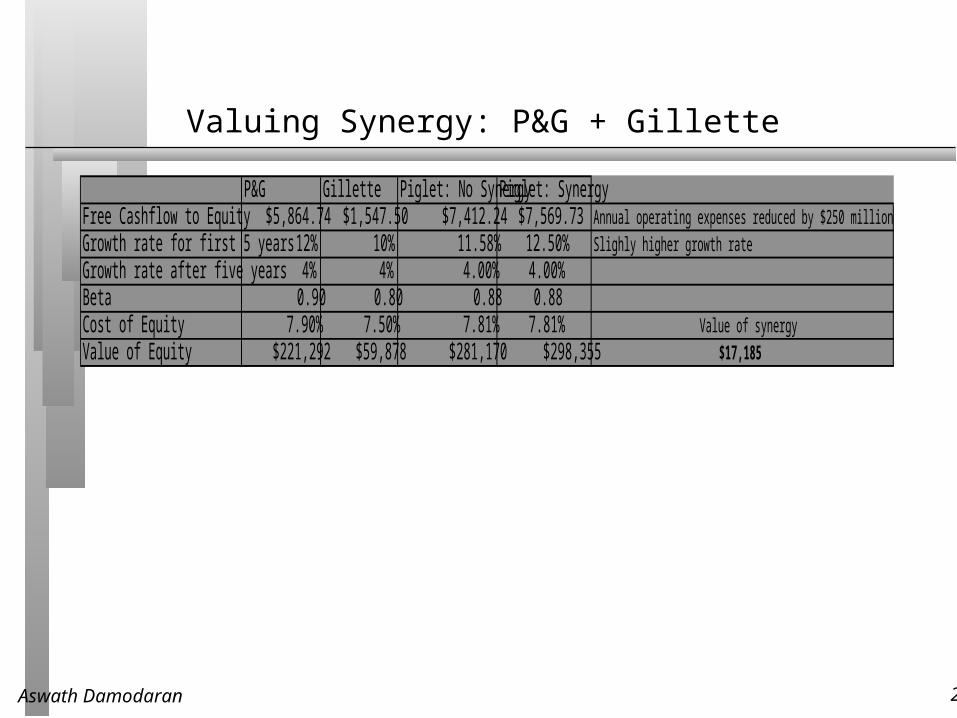
A procedure for valuing synergy
(1) the firms involved in the merger are valued independently, by discounting expected cash flows to each firm at the weighted average cost of capital for that firm.
(2) the value of the combined firm, with no synergy, is obtained by adding the values obtained for each firm in the first step.
(3) The effects of synergy are built into expected growth rates and cashflows, and the combined firm is re-valued with synergy.
Value of Synergy = Value of the combined firm, with synergy - Value of the combined firm, without synergy
Aswath Damodaran 21
Sources of Synergy
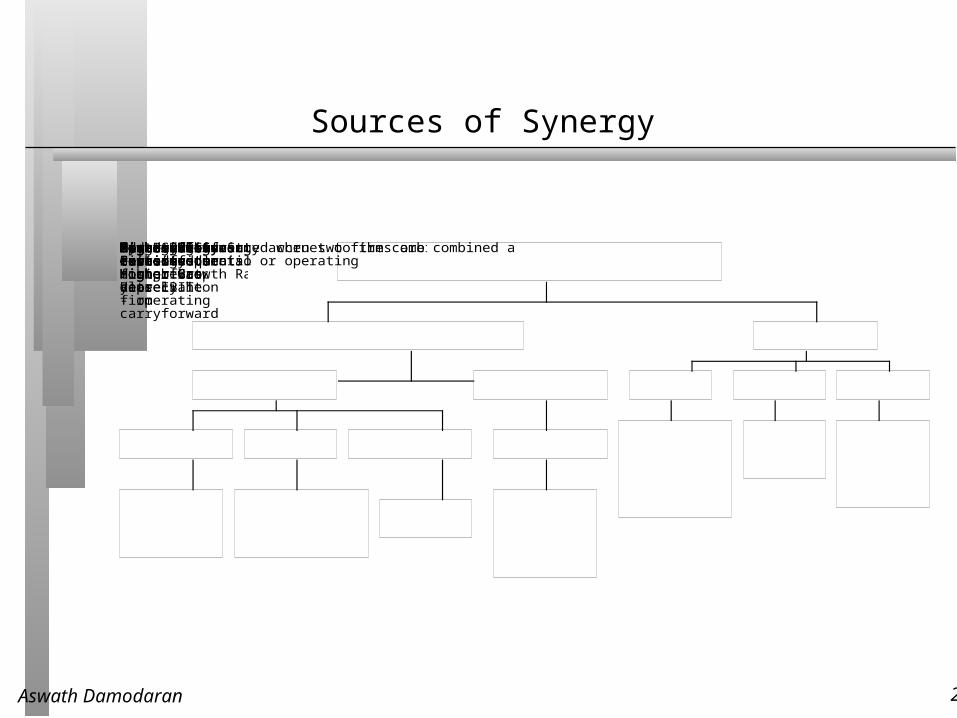
Synergy is created when two firms are combined and can be either financial or operatingOperating Synergy accrues to the combined firm asFinancial SynergyHigher returns on new investmentsMore newInvestmentsCost Savings in current operationsTax BenefitsAdded Debt CapacityDiversification?Higher ROC
Higher Growth Rate
Higher Reinvestment
Higher Growth Rate
Higher Margin
Higher Base-year EBIT
Strategic AdvantagesEconomies of ScaleLonger GrowthPeriodMore sustainableexcess returnsLower taxes on earnings due to - higher depreciaiton- operating loss carryforwards
Higher debt raito and lower cost of capital
May reducecost of equity for private or closely heldfirm
Aswath Damodaran 22
Valuing Synergy: P&G + Gillette
P&G Gillette Piglet: No Synergy Piglet: SynergyFree Cashflow to Equity $5,864.74 $1,547.50 $7,412.24 $7,569.73 Annual operating expenses reduced by $250 millionGrowth rate for first 5 years 12% 10% 11.58% 12.50% Slighly higher growth rateGrowth rate after five years 4% 4% 4.00% 4.00%Beta 0.90 0.80 0.88 0.88Cost of Equity 7.90% 7.50% 7.81% 7.81% Value of synergyValue of Equity $221,292 $59,878 $281,170 $298,355 $17,185
Aswath Damodaran 23
5. Brand name, great management, superb product …Are we short changing the intangibles?
There is often a temptation to add on premiums for intangibles. Among them are
• Brand name
• Great management
• Loyal workforce
• Technological prowess There are two potential dangers:
• For some assets, the value may already be in your value and adding a premium will be double counting.
• For other assets, the value may be ignored but incorporating it will not be easy.
Aswath Damodaran 24
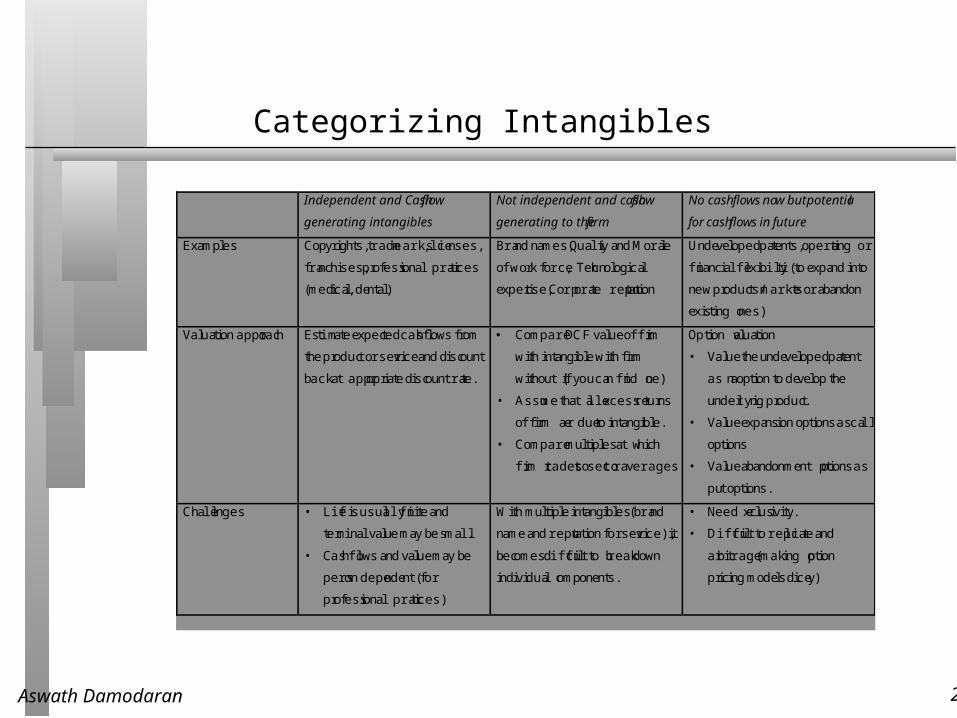
Categorizing Intangibles
Independent and Cash flow
generating intangibles
Not independent and cash flow
generating to the firm
No cash flows now but potential
for cashflows in future
Examples Copyrights, trademarks, licenses,
franchises, professional practices
(medical, dental)
Brand names, Quality and Morale
of work force, Technological
expertise, Corporate reputation
Undeveloped patents, operating or
financial flexibility (to expand into
new products/markets or abandon
existing ones)
Valuation approach Estimate expected cashflows from
the product or service and discount
back at appropriate discount rate.
• Compare DCF value of fi rm
with intangible with firm
without (if you can find one)
• Assume that all excess returns
of firm are due to intangible.
• Compare multiples at which
fi rm trades to sector averages.
Option valuation
• Value the undeveloped patent
as an option to develop the
underlying product.
• Value expansion options as call
options
• Value abandonment options as
put options.
Challenges • Life is usually finite and
terminal value may be small .
• Cashflows and value may be
person dependent (for
professional practices)
With multiple intangibles (brand
name and reputation for service), it
becomes diffi cult to break down
individual components.
• Need exclusivity.
• Diffi cult to repli cate and
arbitrage (making option
pricing models dicey)
Aswath Damodaran 25
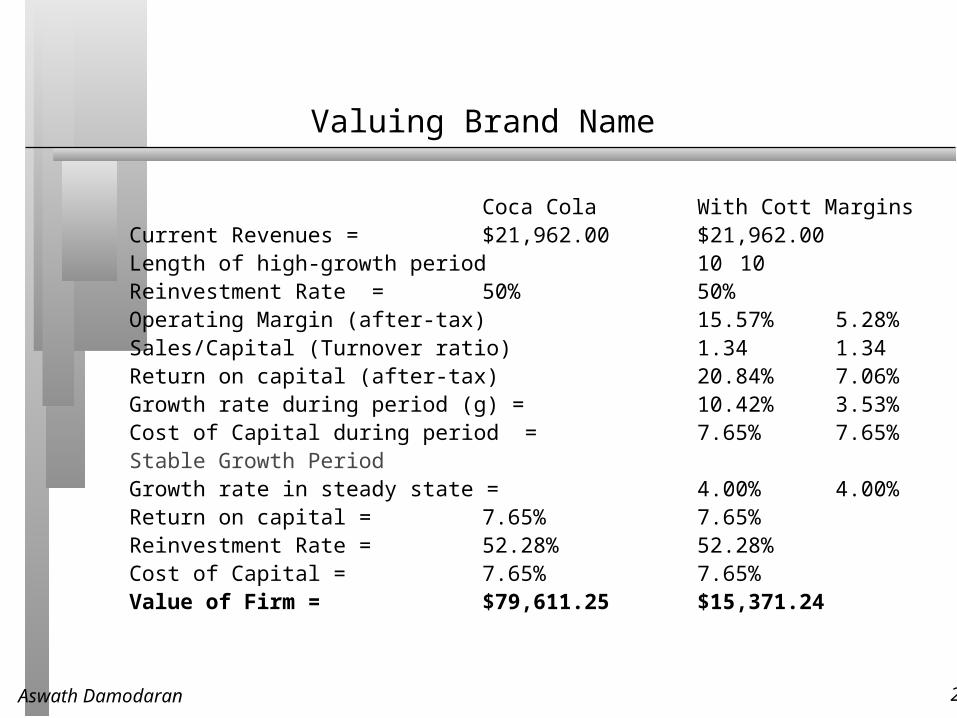
Valuing Brand Name
Coca Cola With Cott MarginsCurrent Revenues = $21,962.00 $21,962.00 Length of high-growth period 10 10Reinvestment Rate = 50% 50%Operating Margin (after-tax) 15.57% 5.28%Sales/Capital (Turnover ratio) 1.34 1.34Return on capital (after-tax) 20.84% 7.06%Growth rate during period (g) = 10.42% 3.53%Cost of Capital during period = 7.65% 7.65%Stable Growth PeriodGrowth rate in steady state = 4.00% 4.00%Return on capital = 7.65% 7.65%Reinvestment Rate = 52.28% 52.28%Cost of Capital = 7.65% 7.65%Value of Firm = $79,611.25 $15,371.24
Aswath Damodaran 26
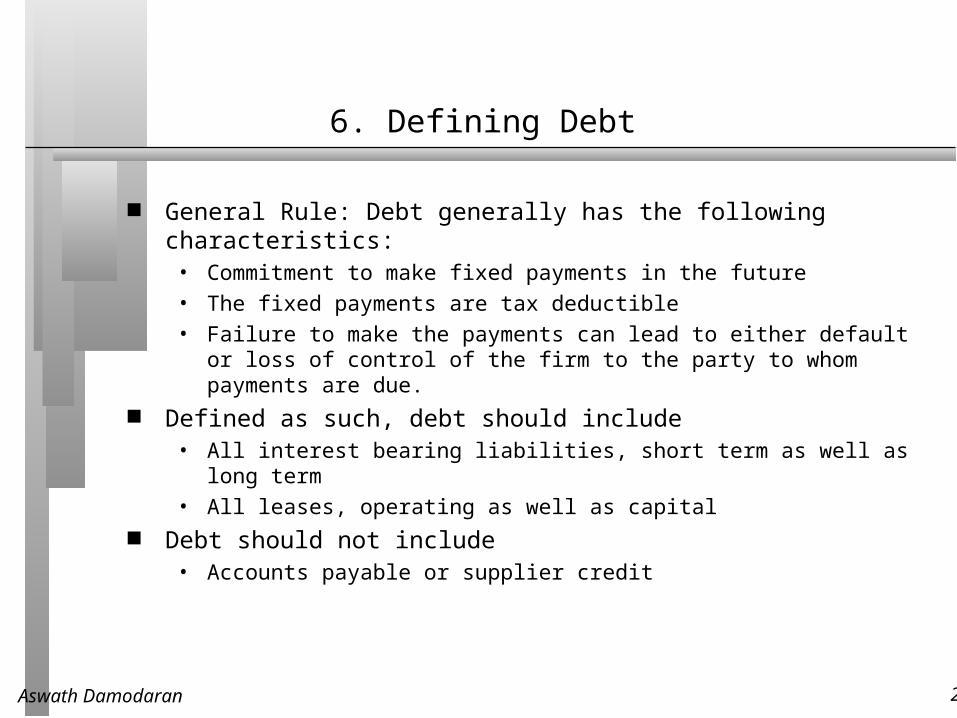
6. Defining Debt
General Rule: Debt generally has the following characteristics:• Commitment to make fixed payments in the future
• The fixed payments are tax deductible
• Failure to make the payments can lead to either default or loss of control of the firm to the party to whom payments are due.
Defined as such, debt should include • All interest bearing liabilities, short term as well as long term
• All leases, operating as well as capital Debt should not include
• Accounts payable or supplier credit
Aswath Damodaran 27
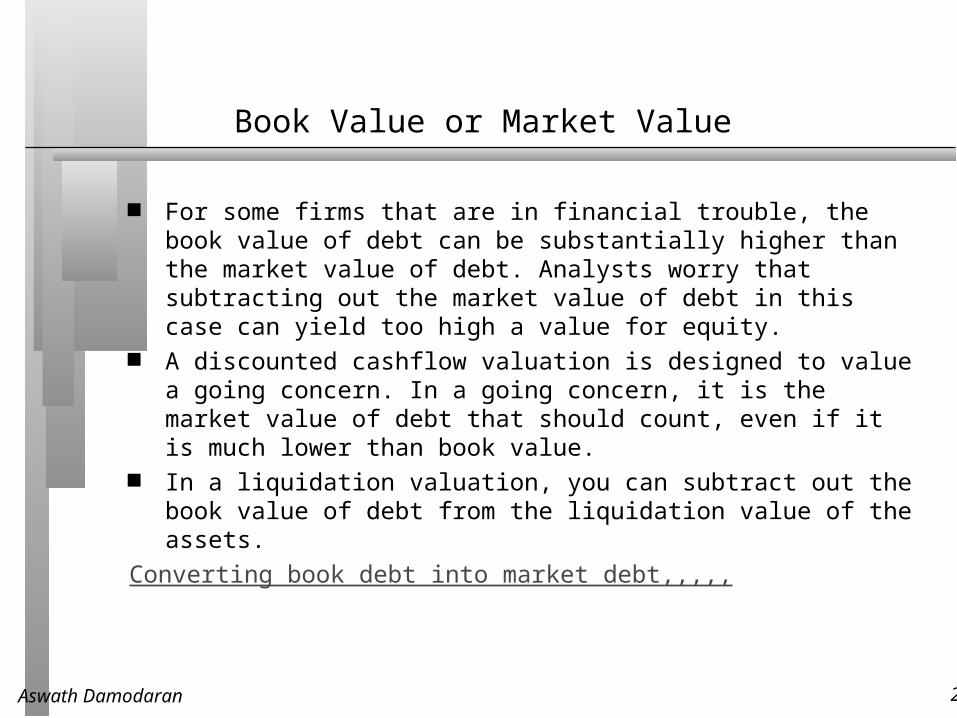
Book Value or Market Value
For some firms that are in financial trouble, the book value of debt can be substantially higher than the market value of debt. Analysts worry that subtracting out the market value of debt in this case can yield too high a value for equity.
A discounted cashflow valuation is designed to value a going concern. In a going concern, it is the market value of debt that should count, even if it is much lower than book value.
In a liquidation valuation, you can subtract out the book value of debt from the liquidation value of the assets.
Converting book debt into market debt,,,,,
Aswath Damodaran 28
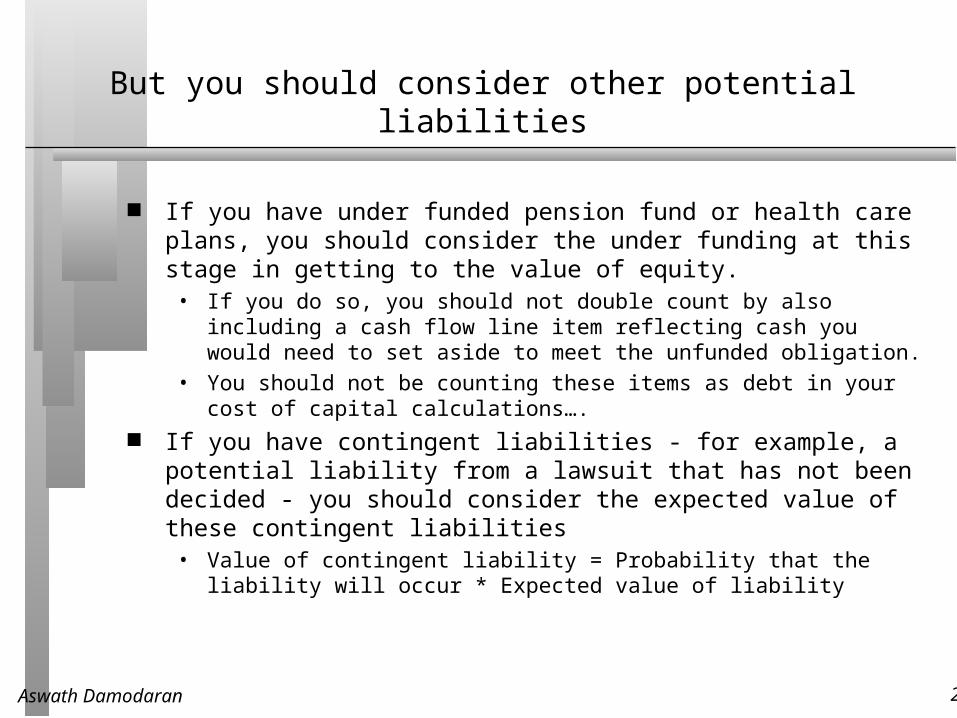
But you should consider other potential liabilities
If you have under funded pension fund or health care plans, you should consider the under funding at this stage in getting to the value of equity.
• If you do so, you should not double count by also including a cash flow line item reflecting cash you would need to set aside to meet the unfunded obligation.
• You should not be counting these items as debt in your cost of capital calculations….
If you have contingent liabilities - for example, a potential liability from a lawsuit that has not been decided - you should consider the expected value of these contingent liabilities
• Value of contingent liability = Probability that the liability will occur * Expected value of liability
Aswath Damodaran 29
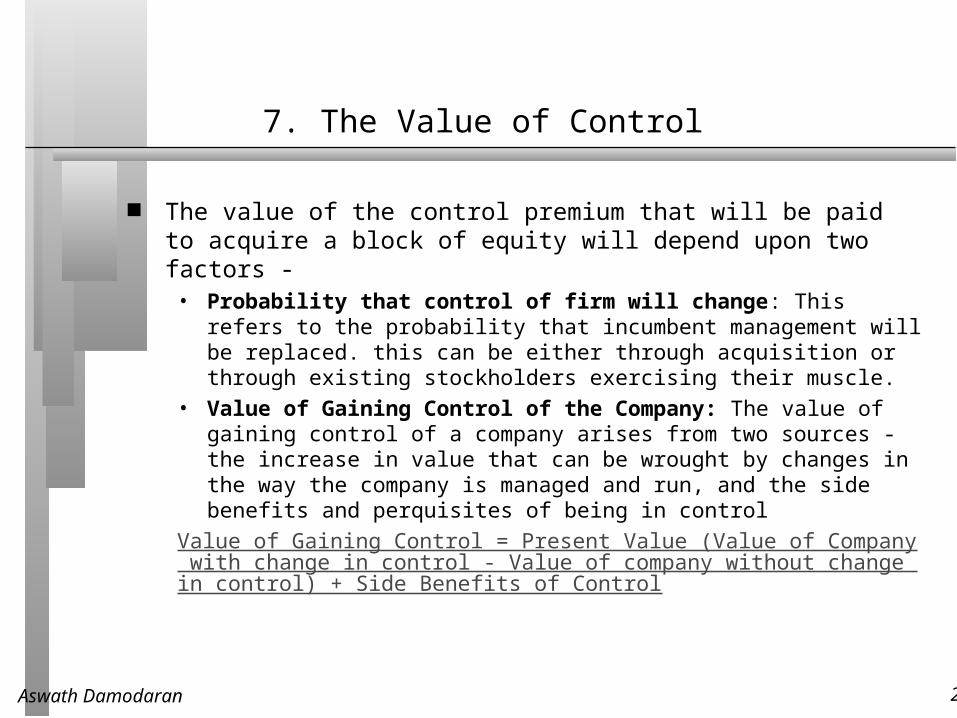
7. The Value of Control
The value of the control premium that will be paid to acquire a block of equity will depend upon two factors -
• Probability that control of firm will change: This refers to the probability that incumbent management will be replaced. this can be either through acquisition or through existing stockholders exercising their muscle.
• Value of Gaining Control of the Company: The value of gaining control of a company arises from two sources - the increase in value that can be wrought by changes in the way the company is managed and run, and the side benefits and perquisites of being in control
Value of Gaining Control = Present Value (Value of Company with change in control - Value of company without change in control) + Side Benefits of Control
Aswath Damodaran 30
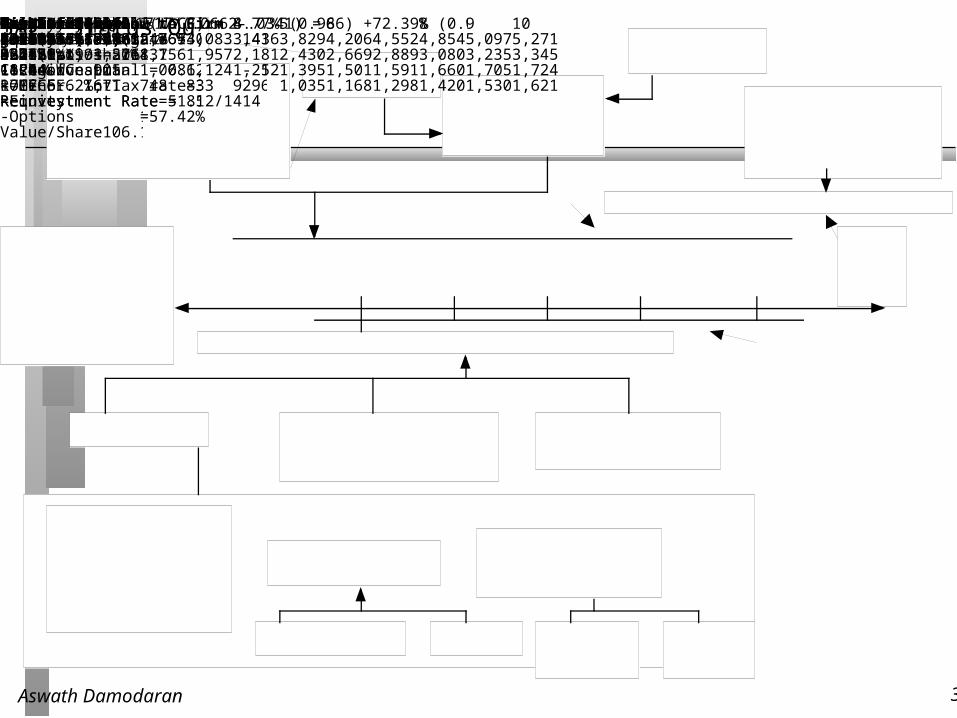
Current Cashflow to FirmEBIT(1-t) : 1414- Nt CpX 831 - Chg WC - 19= FCFF 602Reinvestment Rate = 812/1414
=57.42%
Expected Growth in EBIT (1-t).5742*.1993=.114411.44 %
Stable Growthg = 3.41%; Beta = 1.00;Debt Ratio= 20%Cost of capital = 6.62% ROC= 6.62%; Tax rate=35%Reinvestment Rate=51.54%
Terminal Value10= 1717/(.0662-.0341) = 53546Cost of Equity8.77%Cost of Debt(3.41%+..35%)(1-.3654)= 2.39%
WeightsE = 98.6% D = 1.4%Cost of Capital (WACC) = 8.77% (0.986) + 2.39% (0.014) = 8.68%Op. Assets 31,615+ Cash: 3,018- Debt 558- Pension Lian 305- Minor. Int. 55=Equity 34,656-Options 180Value/Share106.12
Riskfree Rate :Euro riskfree rate = 3.41%+Beta 1.26XRisk Premium4.25%Unlevered Beta for Sectors: 1.25Mature riskpremium4%
Country Equity Prem0.25%
SAP: Status Quo Reinvestment Rate 57.42%Return on Capital19.93%Term Yr5451354318261717
Avg Reinvestment rate = 36.94%On May 5, 2005, SAP was trading at 122 Euros/share
First 5 yearsGrowth decreases gradually to 3.41%Debt ratio increases to 20%Beta decreases to 1.00Year 1 2 3 4 5 6 7 8 9 10EBIT 2,483 2,767 3,083 3,436 3,829 4,206 4,552 4,854 5,097 5,271EBIT(1-t) 1,576 1,756 1,957 2,181 2,430 2,669 2,889 3,080 3,235 3,345 - Reinvestm 905 1,008 1,124 1,252 1,395 1,501 1,591 1,660 1,705 1,724 = FCFF 671 748 833 929 1,035 1,168 1,298 1,420 1,530 1,621
Aswath Damodaran 31
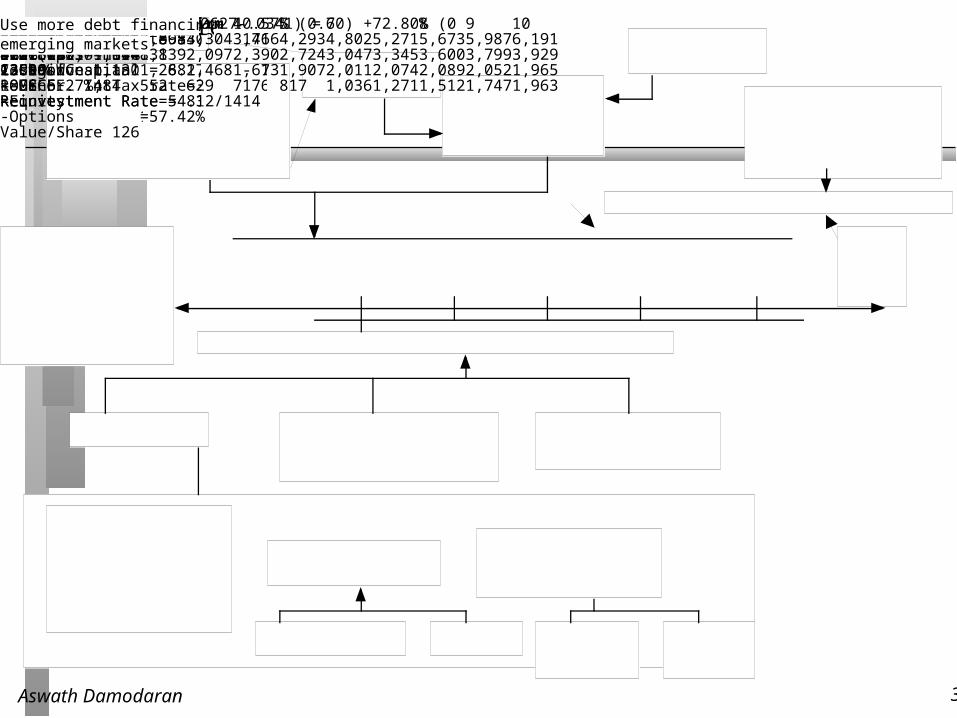
Current Cashflow to FirmEBIT(1-t) : 1414- Nt CpX 831 - Chg WC - 19= FCFF 602Reinvestment Rate = 812/1414
=57.42%
Expected Growth in EBIT (1-t).70*.1993=.114413.99 %
Stable Growthg = 3.41%; Beta = 1.00;Debt Ratio= 30%Cost of capital = 6.27% ROC= 6.27%; Tax rate=35%Reinvestment Rate=54.38%
Terminal Value10= 1898/(.0627-.0341) = 66367Cost of Equity10.57%Cost of Debt(3.41%+1.00%)(1-.3654)= 2.80%
WeightsE = 70% D = 30%Cost of Capital (WACC) = 10.57% (0.70) + 2.80% (0.30) = 8.24%Op. Assets 38045+ Cash: 3,018- Debt 558- Pension Lian 305- Minor. Int. 55=Equity 40157-Options 180Value/Share 126.51
Riskfree Rate :Euro riskfree rate = 3.41%+Beta 1.59XRisk Premium4.50%Unlevered Beta for Sectors: 1.25Mature riskpremium4%
Country Equity Prem0.5%
SAP: Restructured Reinvestment Rate70%Return on Capital19.93%Term Yr6402416122631898
Avg Reinvestment rate = 36.94%On May 5, 2005, SAP was trading at 122 Euros/share
First 5 yearsGrowth decreases gradually to 3.41%Year 1 2 3 4 5 6 7 8 9 10EBIT 2,543 2,898 3,304 3,766 4,293 4,802 5,271 5,673 5,987 6,191EBIT(1-t) 1,614 1,839 2,097 2,390 2,724 3,047 3,345 3,600 3,799 3,929 - Reinvest 1,130 1,288 1,468 1,673 1,907 2,011 2,074 2,089 2,052 1,965 = FCFF 484 552 629 717 817 1,036 1,271 1,512 1,747 1,963
Reinvest more in Reinvest more in emerging marketsemerging marketsUse more debt financing.Use more debt financing.
Aswath Damodaran 32
Minority Discounts and Voting Shares
Assume that a firm has a value of $ 100 million run by incumbent managers and $ 150 million run optimally.
Proposition 1: The market price will reflect the expected value of control• The firm has 10 million voting shares outstanding. • Since the potential for changing management is created by this offering, the value per share
will fall between $10 and $15, depending upon the probability that is attached to the management change. Thus, if the probability of the management change is 60%, the value per share will be $13.00.
Value/Share = (150*.6+100*.4)/10 = $13
Proposition 2: If you have shares with different voting rights, the voting shares will get a disproportionate share of the value of control…
Proposition 3: The value of a minority interest (49%) of a private business will be significantly lower then the value of a majority stake in the same business if control has value.
Aswath Damodaran 33
8. Distress and the Going Concern Assumption
Traditional valuation techniques are built on the assumption of a going concern, i.e., a firm that has continuing operations and there is no significant threat to these operations.
• In discounted cashflow valuation, this going concern assumption finds its place most prominently in the terminal value calculation, which usually is based upon an infinite life and ever-growing cashflows.
• In relative valuation, this going concern assumption often shows up implicitly because a firm is valued based upon how other firms - most of which are healthy - are priced by the market today.
When there is a significant likelihood that a firm will not survive the immediate future (next few years), traditional valuation models may yield an over-optimistic estimate of value.
Aswath Damodaran 34
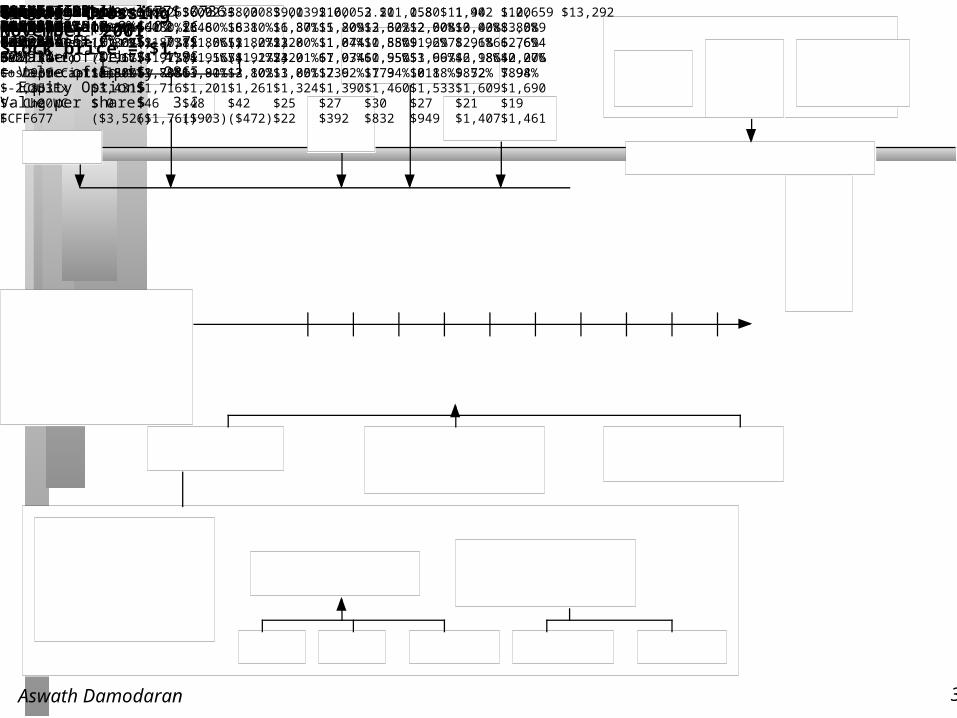
ForeverTerminal Value= 677(.0736-.05)=$ 28,683Cost of Equity16.80%Cost of Debt4.8%+8.0%=12.8%Tax rate = 0% -> 35%
WeightsDebt= 74.91% -> 40%Value of Op Assets $ 5,530+ Cash & Non-op $ 2,260= Value of Firm $ 7,790- Value of Debt $ 4,923= Value of Equity $ 2867- Equity Options $ 14Value per share $ 3.22
Riskfree Rate :T. Bond rate = 4.8%+Beta3.00> 1.10XRisk Premium4%Internet/RetailOperating LeverageCurrent D/E: 441%Base EquityPremiumCountry RiskPremiumCurrentRevenue$ 3,804
CurrentMargin:-49.82%
Revenue Growth:13.33%
EBITDA/Sales -> 30%Stable GrowthStableRevenueGrowth: 5%
StableEBITDA/Sales 30%
Stable ROC=7.36%Reinvest 67.93%
EBIT-1895mNOL:2,076m$13,902$ 4,187$ 3,248$ 2,111$ 939$ 2,353$ 20$ 677
Term. Year24315689107Global CrossingNovember 2001Stock price = $1.86
Cap ex growth slows and net cap ex decreases
Beta 3.00 3.00 3.00 3.00 3.00 2.60 2.20 1.80 1.40 1.00Cost of Equity 16.80% 16.80% 16.80% 16.80% 16.80% 15.20% 13.60% 12.00% 10.40% 8.80%Cost of Debt 12.80% 12.80% 12.80% 12.80% 12.80% 11.84% 10.88% 9.92% 8.96% 6.76%Debt Ratio 74.91% 74.91% 74.91% 74.91% 74.91% 67.93% 60.95% 53.96% 46.98% 40.00%Cost of Capital 13.80% 13.80% 13.80% 13.80% 13.80% 12.92% 11.94% 10.88% 9.72% 7.98%
Revenues $3,804 $5,326 $6,923 $8,308 $9,139 $10,053 $11,058 $11,942 $12,659 $13,292 EBITDA ($95) $ 0 $346 $831 $1,371 $1,809 $2,322 $2,508 $3,038 $3,589 EBIT ($1,675) ($1,738) ($1,565) ($1,272) $320 $1,074 $1,550 $1,697 $2,186 $2,694 EBIT (1-t) ($1,675) ($1,738) ($1,565) ($1,272) $320 $1,074 $1,550 $1,697 $2,186 $2,276 + Depreciation $1,580 $1,738 $1,911 $2,102 $1,051 $736 $773 $811 $852 $894 - Cap Ex $3,431 $1,716 $1,201 $1,261 $1,324 $1,390 $1,460 $1,533 $1,609 $1,690 - Chg WC $ 0 $46 $48 $42 $25 $27 $30 $27 $21 $19 FCFF ($3,526) ($1,761) ($903) ($472) $22 $392 $832 $949 $1,407 $1,461
Aswath Damodaran 35
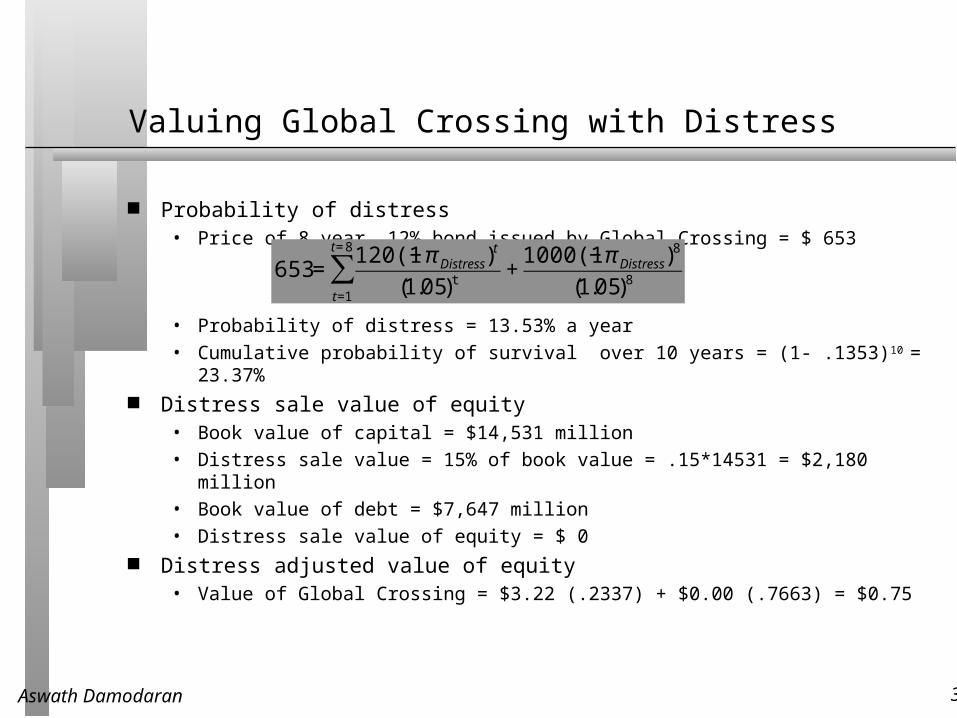
Valuing Global Crossing with Distress
Probability of distress• Price of 8 year, 12% bond issued by Global Crossing = $ 653
• Probability of distress = 13.53% a year
• Cumulative probability of survival over 10 years = (1- .1353)10 = 23.37% Distress sale value of equity
• Book value of capital = $14,531 million
• Distress sale value = 15% of book value = .15*14531 = $2,180 million
• Book value of debt = $7,647 million
• Distress sale value of equity = $ 0 Distress adjusted value of equity
• Value of Global Crossing = $3.22 (.2337) + $0.00 (.7663) = $0.75
€
653 =120(1− π Distress)
t
(1.05)tt=1
t= 8
∑ +1000(1− π Distress)
8
(1.05)8
Aswath Damodaran 36
9. Equity to Employees: Effect on Value
In recent years, firms have turned to giving employees (and especially top managers) equity option packages as part of compensation. These options are usually
• Long term
• At-the-money when issued
• On volatile stocks Are they worth money? And if yes, who is paying for them? Two key issues with employee options:
• How do options granted in the past affect equity value per share today?
• How do expected future option grants affect equity value today?
Aswath Damodaran 37
Equity Options and Value
Options outstanding• Step 1: List all options outstanding, with maturity, exercise price and vesting status.
• Step 2: Value the options, taking into accoutning dilution, vesting and early exercise considerations
• Step 3: Subtract from the value of equity and divide by the actual number of shares outstanding (not diluted or partially diluted).
Expected future option and restricted stock issues• Step 1: Forecast value of options that will be granted each year as percent of
revenues that year. (As firm gets larger, this should decrease)
• Step 2: Treat as operating expense and reduce operating income and cash flows
• Step 3: Take present value of cashflows to value operations or equity.
Aswath Damodaran 38
10. Analyzing the Effect of Illiquidity on Value
Investments which are less liquid should trade for less than otherwise similar investments which are more liquid.
The size of the illiquidity discount should depend upon• Type of Assets owned by the Firm: The more liquid the assets owned by the firm,
the lower should be the liquidity discount for the firm
• Size of the Firm: The larger the firm, the smaller should be size of the liquidity discount.
• Health of the Firm: Stock in healthier firms should sell for a smaller discount than stock in troubled firms.
• Cash Flow Generating Capacity: Securities in firms which are generating large amounts of cash from operations should sell for a smaller discounts than securities in firms which do not generate large cash flows.
• Size of the Block: The liquidity discount should increase with the size of the portion of the firm being sold.
Aswath Damodaran 39
Empirical Evidence on Illiquidity Discounts: Restricted Stock
Restricted securities are securities issued by a company, but not registered with the SEC, that can be sold through private placements to investors, but cannot be resold in the open market for a two-year holding period, and limited amounts can be sold after that. Restricted securities trade at significant discounts on publicly traded shares in the same company.
• Maher examined restricted stock purchases made by four mutual funds in the period 1969-73 and concluded that they traded an average discount of 35.43% on publicly traded stock in the same companies.
• Moroney reported a mean discount of 35% for acquisitions of 146 restricted stock issues by 10 investment companies, using data from 1970.
• In a recent study of this phenomenon, Silber finds that the median discount for restricted stock is 33.75%.
Aswath Damodaran 40
An Alternate Approach to the Illiquidity Discount: Bid Ask Spread
The bid ask spread is the difference between the price at which you can buy a security and the price at which you can sell it, at the same point. In other words, it is the illiqudity discount on a publicly traded stock.
Studies have tied the bid-ask spread to• the size of the firm
• the trading volume on the stock
• the degree Regressing the bid-ask spread against variables that can be measured for a
private firm (such as revenues, cash flow generating capacity, type of assets, variance in operating income) and are also available for publicly traded firms offers promise.
Aswath Damodaran 41
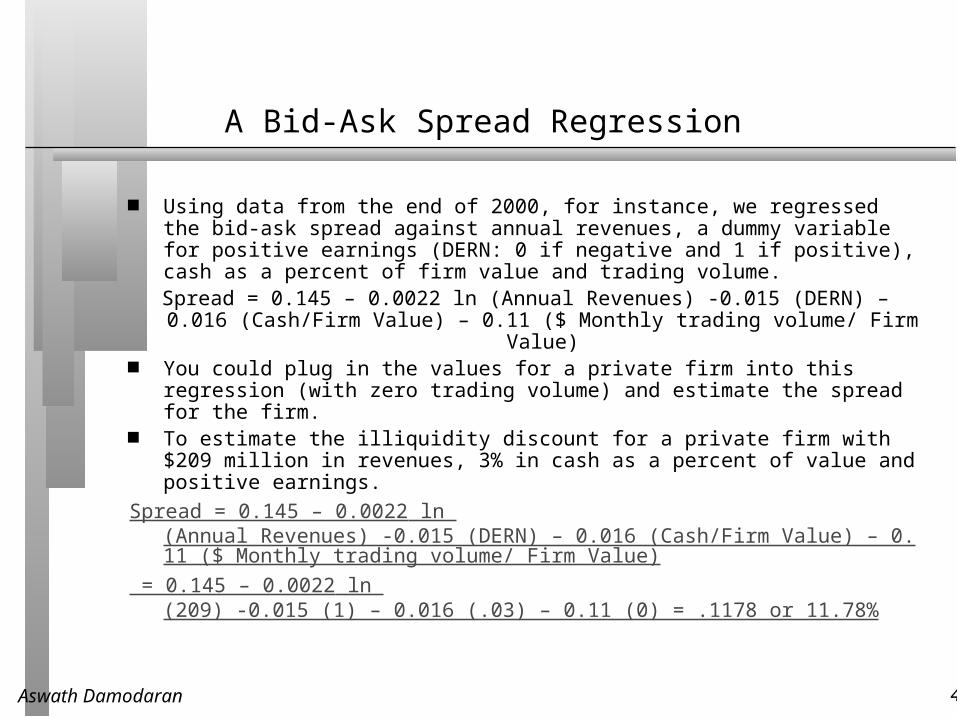
A Bid-Ask Spread Regression
Using data from the end of 2000, for instance, we regressed the bid-ask spread against annual revenues, a dummy variable for positive earnings (DERN: 0 if negative and 1 if positive), cash as a percent of firm value and trading volume.
Spread = 0.145 – 0.0022 ln (Annual Revenues) -0.015 (DERN) – 0.016 (Cash/Firm Value) – 0.11 ($ Monthly trading volume/ Firm Value)
You could plug in the values for a private firm into this regression (with zero trading volume) and estimate the spread for the firm.
To estimate the illiquidity discount for a private firm with $209 million in revenues, 3% in cash as a percent of value and positive earnings.
Spread = 0.145 – 0.0022 ln (Annual Revenues) -0.015 (DERN) – 0.016 (Cash/Firm Value) – 0.11 ($ Monthly trading volume/ Firm Value)
= 0.145 – 0.0022 ln (209) -0.015 (1) – 0.016 (.03) – 0.11 (0) = .1178 or 11.78%

Aswath Damodaran 42
Returning to the beginning…