astronomy c eso 2012 astrophysics - e-prints...
TRANSCRIPT

A&A 543, A146 (2012)DOI: 10.1051/0004-6361/201219167c© ESO 2012
Astronomy&
Astrophysics
Magnetic activity and differential rotation in the young Sun-likestars KIC 7985370 and KIC 7765135�
H.-E. Fröhlich1, A. Frasca2, G. Catanzaro2, A. Bonanno2, E. Corsaro2 ,3, J. Molenda-Zakowicz4,A. Klutsch5, and D. Montes5
1 Leibniz Institute for Astrophysics Potsdam (AIP), An der Sternwarte 16, 14482 Potsdam, Germanye-mail: [email protected]
2 INAF, Osservatorio Astrofisico di Catania, via S. Sofia, 78, 95123 Catania, Italy3 Università di Catania, Dipartimento di Fisica e Astronomia, via S. Sofia, 78, 95123 Catania, Italy4 Astronomical Institute, Wrocław University, ul. Kopernika 11, 51-622 Wrocław, Poland5 Departamento de Astrofísica y Ciencias de la Atmósfera, Universidad Complutense de Madrid, 28040 Madrid, Spain
Received 5 March 2012 / Accepted 15 May 2012
ABSTRACT
Aims. We present a detailed study of the two Sun-like stars KIC 7985370 and KIC 7765135, to determine their activity level, spotdistribution, and differential rotation. Both stars were previously discovered by us to be young stars and were observed by the NASAKepler mission.Methods. The fundamental stellar parameters (v sin i, spectral type, Teff , log g, and [Fe/H]) were derived from optical spectroscopy bycomparison with both standard-star and synthetic spectra. The spectra of the targets allowed us to study the chromospheric activitybased on the emission in the core of hydrogen Hα and Ca ii infrared triplet (IRT) lines, which was revealed by the subtraction ofinactive templates. The high-precision Kepler photometric data spanning over 229 days were then fitted with a robust spot model.Model selection and parameter estimation were performed in a Bayesian manner, using a Markov chain Monte Carlo method.Results. We find that both stars are Sun-like (of G1.5 V spectral type) and have an age of about 100–200 Myr, based on their lithiumcontent and kinematics. Their youth is confirmed by their high level of chromospheric activity, which is comparable to that displayedby the early G-type stars in the Pleiades cluster. The Balmer decrement and flux ratio of their Ca ii-IRT lines suggest that the formationof the core of these lines occurs mainly in optically thick regions that are analogous to solar plages. The spot model applied to theKepler photometry requires at least seven persistent spots in the case of KIC 7985370 and nine spots in the case of KIC 7765135 toprovide a satisfactory fit to the data. The assumption of the longevity of the star spots, whose area is allowed to evolve with time, isat the heart of our spot-modelling approach. On both stars, the surface differential rotation is Sun-like, with the high-latitude spotsrotating slower than the low-latitude ones. We found, for both stars, a rather high value of the equator-to-pole differential rotation(dΩ ≈ 0.18 rad d−1), which disagrees with the predictions of some mean-field models of differential rotation for rapidly rotating stars.Our results agree instead with previous works on solar-type stars and other models that predict a higher latitudinal shear, increasingwith equatorial angular velocity, that can vary during the magnetic cycle.
Key words. stars: activity – starspots – stars: rotation – stars: chromospheres – stars: individual: KIC 7985370 –stars: individual: KIC 7765135
1. Introduction
In the Sun, magnetic activity is thought to be produced by aglobal-scale dynamo action arising from the coupling of convec-tion and rotation (Parker 1955; Steenbeck et al. 1966). YoungSun-like stars rotate faster than the Sun and display a muchhigher level of magnetic activity in all atmospheric layers,which is likely due to a stronger dynamo action. They alsodisplay different types of activity from the Sun, such as largerand longer lasting spots in their photospheres, active longitudebelts, the absence or different behaviour of their activity cy-cles, highly energetic flares, etc. These differences are likelyrelated to the dynamo mechanism, which operates in rather
� Based on public Kepler data, on observations made with the ItalianTelescopio Nazionale Galileo (TNG) operated by the Fundación GalileoGalilei – INAF at the Observatorio del Roque del los Muchachos,La Palma (Canary Islands), on observations collected at the 2.2-m tele-scope of the Centro Astronómico Hispano Alemán (CAHA) at CalarAlto (Almería, Spain), operated jointly by the Max-Planck-Institut fürAstronomie and the Instituto de Astrofísica de Andalucía (CSIC), andon observations collected at the Catania Astrophysical Observatory(Italy).
different conditions in young stars mainly in terms of their rota-tion rate and internal structure. Understanding the properties ofyoung suns and, particularly, their activity and rotation, is cru-cial to tracing the Sun and its environment back to their initialevolutionary stages.
The properties of the magnetoconvection in these stars seemsto be strongly influenced by the Ω-effect that produces charac-teristic “wreaths” on large scales (Nelson et al. 2011). Althoughstrong latitudinal variations in the differential rotation can be ob-tained by means of the combined role of thermal wind balanceand geostrophy, the results of numerical simulations seem to de-pend strongly on the Reynolds number of the flow. This situationis at variance with the dynamo action in main sequence solar-type stars, where the role of the tachocline is instead essential inproducing the α effect (Dikpati & Gilman 2001; Bonanno et al.2002; Bonanno 2012).
It is still unclear whether a strong latitudinal differential ro-tation is common among rapidly rotating stars. Marsden et al.(2011) reported values of the absolute differential rotation dΩ inthe range 0.08−0.45 rad d−1 for a sample of rapid rotators similarto and slightly more massive than the Sun. Despite the spread in
Article published by EDP Sciences A146, page 1 of 16

A&A 543, A146 (2012)
values, it seems that dΩ is in any case larger than in the Sun. Themeasures of absolute differential rotation in a large sample of F-and early G-type stars based on the Fourier transform technique(Reiners & Schmitt 2003; Reiners 2006) show no indication ofa decrease in this parameter with the rotation period, the highestvalues of dΩ instead being encountered for periods between twoand three days. On the other hand, some calculations predict amoderate differential rotation, comparable to that of the Sun, fora Sun-like star rotating 20 times faster (e.g., Küker et al. 2011).
In addition, dΩ also seems to be a function of the stellar massfor main-sequence stars, increasing with their effective temper-ature, as shown, e.g., by Barnes et al. (2005). One of the largestvalues of differential rotation for a star noticeably cooler thanthe Sun was found by our research group (Frasca et al. 2011,hereafter Paper I) for KIC 8429280, a 50 Myr-old K2-type star,from the analysis of the light curve collected by the NASAKepler spacecraft.
The highly precise photometry of Kepler (Borucki et al.2010; Koch et al. 2010) coupled with a long and virtually un-interrupted coverage make these data unique for the study of thephotospheric activity and differential rotation of late-type stars,as we demonstrated in our first work based on the analysis ofKepler data of spotted stars (Paper I).
However, whether star spots are indeed the most suited trac-ers of the surface rotation is still a matter of debate (for adifferent point of view, see Korhonen & Elstner 2011).
As for KIC 8429280 (Paper I), the two new targetsKIC 7985370 (HD 189210 = 2MASS J19565974+4345083 =TYC 3149-1571-1) and KIC 7765135 (2MASS J19425057+4324486 = TYC 3148-2163-1) were selected as active starsbased on their optical variability and the cross-correlation ofthe ROSAT All-Sky Survey (RASS; Voges et al. 1999, 2000)with Tycho and Hipparcos catalogues (Perryman et al. 1997).With V = 10.m0 and 11.m8, respectively, both stars are relativelybright ones in the Kepler field of view. Both of them werereported as variable by Pigulski et al. (2009), who searchedfor bright variable stars in the Kepler field of view with theASAS3-North station. According to Uytterhoeven et al. (2011),the variability of KIC 7985370 could be due to a rotational mod-ulation inferred from the first two quarters of Kepler data. TheKepler light curves readily show that these stars are rotationallyvariable with a period of about 2−3 days, which is typical ofG-type stars in the Pleiades cluster (age ≈ 130 Myr, Barradoy Navascués et al. 2004). The estimates of their atmosphericparameters reported in the Kepler Input Catalog (KIC), whichare based on Sloan photometry (for a revised temperature scalecf. Pinsonneault et al. 2012), suggested to us that these objectswere similar to the Sun.
The analysis of the optical spectra collected by us confirmedthat the stars are nearly identical to the Sun, but much youngerand as such merit a detailed investigation. Applying the sametechniques as in Paper I, we determined the basic stellar param-eters (Sect. 3.1), the chromospheric activity (Sect. 3.2), and el-ement abundances (Sect. 3.3). The kinematics of these stars isbriefly discussed in Sect. 3.5. The Bayesian approach to spotmodelling applied to the Kepler light curves is described inSect. 4 and our results are presented and discussed in Sect. 5with a particular focus on differential rotation.
2. Ground-based observations and data reduction
2.1. Spectroscopy
Two spectra of KIC 7985370 with a signal-to-noise ratio (S/N)of about 60−70 were collected at the M. G. Fracastoro station
Table 1. Radial/rotational velocity standard stars.
Name Sp. type RV v sin ic Notesd
(km s−1) (km s−1)
HD 10307 G1.5 V 4.0b ∗ 2.1 v sin iHD 10700 G8 V −17.1b 0.9 v sin iHD 157214 G0 V −79.2b 1.6 v sin iHD 182572 G8 IV −100.35a 1.9 RV, v sin iHD 187691 F8 V 0.0a 2.8 RV
Notes. (a) Udry et al. (1999). (b) Nordström et al. (2004). (c) Glebocki& Gnacinski (2005). (d) RV = radial velocity standard star; v sin i =standard for rotational velocity. (∗) Variable?
(Serra La Nave, Mt. Etna, 1750 m a.s.l.) of the OsservatorioAstrofisico di Catania (OAC, Italy) in July and October 2009.The 91-cm telescope of the OAC was equipped with FRESCO,a fiber-fed échelle spectrograph that, with the 300-lines/mmcross-disperser, covers the spectral range 4300−6800 Å with aresolution R = λ/Δλ ≈ 21 000.
Another spectrum of KIC 7985370 with S/N ≈ 120 was takenwith SARG, the échelle spectrograph at the Italian TelescopioNazionale Galileo (TNG, La Palma, Spain) on 2009 August 12with the red grism and a slit width of 0.′′8. This spectrum, cov-ering the 5500−11 000 Å wavelength range, has a resolutionR ≈ 57 000.
The spectrum of KIC 7765135 was taken on 2009 October 3with the Fiber Optics Cassegrain Échelle Spectrograph (FOCES;Pfeiffer et al. 1998) at the 2.2-m telescope of the CalarAlto Astronomical Observatory (CAHA, Almería, Spain). The2048× 2048 charged coupled device (CCD) detector Site#1d(pixel size = 24 μm) and the slit width of 400 μm give rise toa resolution R ≈ 28 000 and a S/N ≈ 100 in the red wavelengthregion with a 30-min exposure time.
Spectra of radial (RV) and rotational velocity (v sin i) stan-dard stars (Table 1), as well as bias, flat-field, and arc-lamp ex-posures were acquired during each observing run and used forthe data reduction and analysis.
The data reduction was performed with the Echelle task ofthe IRAF1 package (see, e.g., Frasca et al. 2010; Catanzaro et al.2010, for details).
2.2. Photometry
We used the focal-reducer CCD camera at the 91-cm telescopeof OAC, on 2009 December 10, to perform standard photometryin the Johnson-Cousins B, V , RC, and IC bands. The data werereduced following standard steps of overscan region subtraction,master-bias subtraction, and division by average twilight flat-field images. The BVRCIC magnitudes were extracted from thecorrected images by means of aperture photometry performedwith DAOPHOT by using the IDL2 routine APER. Standardstars in the cluster NGC 7790 and the field of BL Lac (Stetson2000) were used to calculate the zero points and the transfor-mation coefficients to the Johnson-Cousins system. Photometric
1 IRAF is distributed by the National Optical Astronomy Observatory,which is operated by the Association of the Universities for Researchin Astronomy, inc. (AURA) under cooperative agreement with theNational Science Foundation.2 IDL (Interactive Data Language) is a registered trademark of ITTVisual Information Solutions.
A146, page 2 of 16
H.-E. Fröhlich et al.: Magnetic activity and differential rotation in two young suns
Table 2. Stellar parameters.
KIC 7985370 KIC 7765135
RA (J2000) 19h56m59.s74 19h42m50.s58Dec (J2000) +43◦45′08.′′3 +43◦24′48.′′7X-ray counta [ct/s] 0.033 ± 0.008 . . .Jb 8.789 ± 0.020 10.414 ± 0.025Hb 8.507 ± 0.063 10.113 ± 0.020Ks
b 8.419 ± 0.033 10.028 ± 0.014B 10.59 ± 0.09 12.50 ± 0.09V 9.98 ± 0.08 11.82 ± 0.08RC 9.57 ± 0.06 11.28 ± 0.06IC 9.33 ± 0.06 10.97 ± 0.06Sp. type G1.5 V G1.5 VTeff [K] 5815 ± 95 5835 ± 95log g 4.24 ± 0.12 4.34 ± 0.12[Fe/H] −0.05 ± 0.10 0.04 ± 0.05v sin ic [km s−1] 18.2 ± 1.3 21.4 ± 1.1v sin id [km s−1] 17.9 ± 1.3 21.9 ± 1.3RV [km s−1] −24.0 ± 0.3 −20.0 ± 0.2W(Li) [mÅ] 155 ± 20 160 ± 20log N(Li)e 2.87 ± 0.10 2.93 ± 0.10Age [Myr] 100 − 200 100 − 200Mass [M�] 1.15 ± 0.10 1.15 ± 0.10Distance [pc] 113 ± 15 245 ± 30U [km s−1] −8.63 ± 0.86 −5.61 ± 1.73V [km s−1] −22.03 ± 0.37 −18.14 ± 0.57W [km s−1] −6.74 ± 0.84 −7.86 ± 1.93
Notes. The data of the upper part is from the literature. (a) Fromthe ROSAT All-Sky Survey Faint Source Catalogue (Voges et al.2000). (b) JHKs magnitudes are from 2MASS catalogue (Cutri et al.2003). (c) From ROTFIT code. (d) From FWHM-v sin i calibration.(e) Calculated by means of a spectral synthesis based on ATLAS9atmospheric models (Sect. 3.3).
data derived in this work and JHKs magnitudes from 2MASS(Cutri et al. 2003) are summarized in Table 2.
3. Target characterization from ground-basedobservations
3.1. Astrophysical parameters
The analysis of the high-resolution spectra was designed to mea-sure the radial (RV) and projected rotational velocities (v sin i),perform the MK spectral classification, and derive basic stellarparameters such as effective temperature (Teff), gravity (log g),and metallicity ([Fe/H]).
We computed the cross-correlation functions (CCFs) withthe IRAF task fxcor by adopting spectra of late-F and G-typeslowly rotating stars (Table 1), which had been acquired withthe same setups and during the same observing nights as ourtargets. These stellar spectra were used for both the measureof RV and the determination of v sin i by calibrating the full-width at half maximum (FWHM) of the CCF peak as a func-tion of the v sin i of their artificially broadened spectra (see, e.g.,Guillout et al. 2009; Martínez-Arnáiz et al. 2010). We averagedthe results from individual échelle orders as described, e.g., inFrasca et al. (2010) to get the final RV and v sin i of our youngSun-like stars.
For KIC 7985370, we measured, within the errors, thesame RV in the FRESCO spectra taken on 2009 July 10 (RV =−23.9 ± 0.4 km s−1) and 2009 October 4 (RV = −24.2 ±0.4 km s−1), while a value of RV = −21.8 ± 0.2 km s−1 wasderived from the SARG spectrum of 2009 August 12. This might
be indicative of a true RV variation that is just above the 3-σ con-fidence level. However, much more spectra are needed to proveor disprove this RV variation and to ensure that the star is asingle-lined spectroscopic binary.
For KIC 7765135, we only acquired one spectrum fromwhich we derived an RV of −20.0 ± 0.2 km s−1.
Since we found no indication of binarity (visual or spectro-scopic) in the literature for either star, we consider them as be-ing single stars or, at most, single-lined spectroscopic binariesfor which the putative companions are too faint to provide a sig-nificant contribution to either the optical spectrum or the Keplerphotometry.
For the SARG spectrum, we used the ROTFIT code (Frascaet al. 2003, 2006) to evaluate Teff, log g, [Fe/H], and re-determine v sin i, adopting a library of ELODIE Archive spec-tra of standard stars, as described in Paper I. To match thelower resolution (RFOCES = 28 000) of the FOCES spectrum,the ELODIE templates (RELODIE = 42 000) were convolved with
a Gaussian kernel of FWHM = λ√
1/R2FOCES − 1/R2
ELODIE Åbefore running ROTFIT. We applied the ROTFIT code onlyto the échelle orders with a fairly good S/N, which spanthe ranges 5600−6700 Å and 4300−6800 Å for the SARGand FOCES spectra, respectively. The spectral regions heavilyaffected by telluric lines were excluded from the analysis. Theadopted estimates for the stellar parameters and the associateduncertainties come from a weighted mean of the values derivedfor all the individual orders, as described in Paper I. We alsoapplied this procedure to the FRESCO spectra of KIC 7985370,obtaining stellar parameters in very close agreement with thosederived from the SARG spectrum.
ROTFIT also allowed us to measure v sin i by fitting to theobserved spectrum the spectra of slowly rotating standard starsartificially broadened at an increasing v sin i and finding the min-imum of χ2. For this purpose, we used the standard stars listedin Table 1 because their spectra were acquired with the sameinstrumental setup as that used for our targets, avoiding the intro-duction of any systematic error caused by a different resolution.
We obtained nearly the same values of the astrophysical pa-rameters for both targets. They turn out to be very similar to theSun, in terms of both spectral type and effective temperature, butconsiderably younger, as testified by the high lithium content intheir photospheres (Sect. 3.3). Their average values and standarderrors are reported in Table 2.
On the basis of these parameters and age estimates(Sects. 3.3 and 3.5), which are compatible with those of zero-age main-sequence (ZAMS) stars, we can roughly estimate theirmass and radius as M = 1.15 ± 0.10 M� and R = 1.1 ± 0.1 R�from evolutionary tracks (e.g., Siess et al. 2000).
3.2. Chromospheric activity
The high level of magnetic activity in the chromosphere is dis-played by the Ca ii IRT and Hα lines, which are strongly filled-inby emission (Figs. 1 and 2). The He i D3 (λ 5876 Å) absorp-tion line is clearly visible in the spectra of our two young suns(Figs. 1 and 2). This is indicative of an upper chromospherebecause a temperature of at least 10 000 K is required for itsformation.
We estimated the chromospheric emission level with the“spectral subtraction” technique (see, e.g., Frasca & Catalano1994; Montes et al. 1995). This procedure is based on the sub-traction of a reference “non-active” template compiled from ob-served spectra of slowly rotating stars of the same spectral type
A146, page 3 of 16

A&A 543, A146 (2012)
Fig. 1. Top of each panel: observed, continuum-normalized SARG spectrum of KIC 7985370 (solid line) in the He i D3, Hα, and Ca ii IRT regionstogether with the non-active stellar template (dotted red line). Bottom of each panel: difference between observed and template spectra. The residualHα profile is plotted shifted downwards by 0.2 for the sake of clarity. The hatched areas represent the excess emission (absorption for He i) thathave been integrated to get the net equivalent widths.
Fig. 2. As Fig. 1, but for the FOCES spectrum of KIC 7765135.
as the investigated active stars, but with a negligible level ofchromospheric activity and an undetectable lithium line. Theequivalent width of the lithium and helium absorption lines (WLiand WHe, respectively) and the net equivalent width (Wem) ofthe Ca ii IRT and Hα lines were measured from the spectrumobtained after subtracting the non-active template from the tar-get and by then integrating the residual emission (absorption forthe lithium and helium line) profile, which is represented by thehatched areas in Figs. 1 and 2.
We noted a significant variation in the Hα emission in thethree spectra of KIC 7985370, with Wem
Hα ranging from 160 mÅto 264 mÅ (Table 3).
The radiative losses in the chromospheric lines were evalu-ated by multiplying the average Wem by the continuum surfaceflux at the wavelength of the line, in the same way as in Frascaet al. (2010). The net equivalent widths and the chromosphericfluxes are reported in Table 3.
The Hβ net equivalent width could be measured only forKIC 7765135 because the SARG spectrum of KIC 7985370 doesnot include that wavelength region. In the FRESCO spectra,it is impossible to apply the subtraction technique, owing to thevery low S/N in that spectral region, which prevented us fromdetecting such a tiny filling of the line.
For KIC 7765135, we measured a Balmer decrementFHα/FHβ = 4.3 ± 2.5 that is slightly larger than the valuesin the range 2−3 found by us for both KIC 8429280 (Paper I)and HD 171488 (Frasca et al. 2010). Accounting for the er-ror, this ratio is however still compatible with optically thick
Table 3. Line equivalent widths and chromospheric fluxes.
Line Date UTmid Wem Error Flux(yyyy/mm/dd) (hh:mm) (mÅ) (mÅ) (erg cm−2 s−1)
KIC 7985370
Hα 2009/07/10 22:29 160 40 1.23 × 10⁶
” 2009/08/12 04:18 264 30 2.02 × 10⁶
” 2009/10/03 19:17 202 35 1.55 × 10⁶
He i D3 2009/08/12 04:18 −50a 20 ...Ca ii λ8498 ” ” ” ” 263 55 1.33 × 10⁶
Ca ii λ8542 ” ” ” ” 439 55 2.16 × 10⁶
Ca ii λ8662 ” ” ” ” 337 60 1.66 × 10⁶
KIC 7765135
Hα 2009/10/03 20:15 326 60 2.48 × 10⁶
Hβ ” ” ” ” 54 30 0.58 × 10⁶
He i D3 ” ” ” ” −60a 25 ...Ca ii λ8498 ” ” ” ” 258 45 1.28 × 10⁶
Ca ii λ8542 ” ” ” ” 366 45 1.76 × 10⁶
Ca ii λ8662 ” ” ” ” 328 65 1.58 × 10⁶
Notes. (a) The minus sign for the Wem indicates a residual absorption(He i line).
emission by atmospheric features similar to solar and stel-lar plages (e.g., Buzasi 1989; Chester 1991) rather than toprominence-like structures, for which a Balmer decrement of theorder of 10 is expected (e.g., Landman & Mongillo 1979; Hall& Ramsey 1992).
A146, page 4 of 16

H.-E. Fröhlich et al.: Magnetic activity and differential rotation in two young suns
Fig. 3. Observed spectra (dots) of KIC 7985370 and KIC 7765135(shifted downwards by 0.4) in the Li i λ 6707.8 Å region together withthe synthetic spectra (full lines).
The Ca ii-IRT flux ratio, F8542/F8498 = 1.4 ± 0.9, is in-dicative of high optical depths and is in the range of the val-ues found by Chester (1991) in solar plages. The optically thinemission from solar prominences gives rise instead to valuesof F8542/F8498 ∼ 9. We measured a value of F8542/F8498 =1.6 ± 1.0 for KIC 7985370, which is almost the same as thatfor KIC 7765135.
The chromospheric emission in both stars thus appears tooriginate mainly in surface regions similar to solar plages,while the quiet chromosphere and eventual prominences play amarginal role.
Our adopted subtraction technique also allowed us to mea-sure the lithium equivalent width cleaned of the contaminationof the Fe i λ 6707.4 Å line, which is strongly blended with thenearby Li i line (Fig. 3). The lithium equivalent widths measuredfor KIC 7985370 (WLi = 155 ± 20 mÅ) and for KIC 7765135(WLi = 160±20 mÅ), which are immediately above the Pleiadesupper envelope (Soderblom et al. 1993a), translates into a veryhigh lithium abundance, log N(Li) = 3.0 ± 0.1, for both stars,based on the calibrations of Pavlenko & Magazzù (1996). Thedetermination of the lithium abundance was refined in Sect. 3.3by means of a spectral synthesis based on ATLAS9 atmosphericmodels (Kurucz 1993).
3.3. Abundance analysis
Since the spectral features of our two stars are relativelybroad, it is difficult to find unblended lines for which equiva-lent widths can be reliably measured. To overcome this prob-lem, the photospheric abundances were thus estimated bymatching a rotationally broadened synthetic spectrum to theobserved one. For this purpose, we divided each spectruminto 50 Å-wide segments, which were analysed separately. Thespectral ranges 4450−8650 Å and 5600−7300 Å were used forthe spectra of KIC 7765135 and KIC 7985370, respectively. Thesynthetic line profiles were computed with SYNTHE (Kurucz &Avrett 1981) using ATLAS9 (Kurucz 1993) atmospheric models.
Table 4. Abundances inferred for our two stars expressed in the formlog N/Ntot.
Elem. KIC 7985370 KIC 7765135Li −9.10 ± 0.10 −9.04 ± 0.10C −3.67 ± 0.10 −3.29 ± 0.14O ... −3.10 ± 0.10Na −5.77 ± 0.16 −5.68 ± 0.12Mg −4.67 ± 0.11 −4.77 ± 0.13Al −5.48 ± 0.17 −5.64 ± 0.19Si −4.51 ± 0.17 −4.48 ± 0.14Ca −5.70 ± 0.09 −5.42 ± 0.14Ti −7.12 ± 0.16 −6.88 ± 0.15V −8.00 ± 0.16 −7.87 ± 0.14Cr −6.20 ± 0.16 −6.40 ± 0.10Mn −6.74 ± 0.20 −6.52 ± 0.17Fe −4.68 ± 0.18 −4.65 ± 0.11Co −6.95 ± 0.13 −6.82 ± 0.09Ni −5.94 ± 0.12 −5.92 ± 0.12Cu −8.11 ± 0.06 −8.13 ± 0.17Ba −10.28 ± 0.12 −10.11 ± 0.15
All models were calculated using the solar opacity distributionfunction and a microturbulence velocity ξ = 2 km s−1. For eachsegment, the abundance was determined by χ2 minimization. Weused the spectral line list and atomic parameters from Castelli &Hubrig (2004), which is an update of the original list of Kurucz& Bell (1995).
The error in the abundance of one particular element wastaken as the standard deviation of the mean of the abundancescalculated for each segment. For elements whose lines occurredin only one or two segments, the error in the abundance wasevaluated by varying the effective temperature and gravity withintheir uncertainties (as given in Table 2) and computing the abun-dance for Teff and log g values within these ranges. We founda variation of ≈0.1 dex in abundance due to temperature varia-tion, but no significant variation when log g was varied. Thus,the uncertainty in temperature is probably the main source of er-ror in the abundance estimation. In Fig. 3, we show an exampleof the matching between synthetic and observed spectra. To de-termine the Li abundance, we used the Li i λ6707 Å line, takinginto account the hyperfine structure (Andersen et al. 1984). Theabundances are given in Table 4.
Figure 4 compares the abundances derived for our targetsand the solar values of Grevesse et al. (2010). With the ex-ception of lithium, all other abundances are rather similar tothose measured for the solar photosphere. In particular, we notethat KIC 7765135 is ≈0.3 dex more metallic than the Sun, whichconfirms the results of ROTFIT (Table 2).
As far as the lithium is concerned, we converted theabundance from log N/Ntot to log N/N(H) on a scale wherelog N(H) = 12, finding log N(Li) = 2.93 ± 0.10 and 2.87 ± 0.10for KIC 7765135 and KIC 7985370, respectively. These valuesare smaller than, but marginally consistent with, those obtainedfrom the equivalent widths and the calibrations of Pavlenko &Magazzù (1996) and reported in Sect. 3.2.
For early G-type stars, such as our targets, the lithium abun-dance does not provide a very strong constraint on their age.Their log N(Li) remains close to the initial lithium abundancefor Population I stars (log N(Li) = 3.1−3.3) during their earlylife. It has been shown that stars with temperatures in therange Teff = 5900 ± 150 K display a significant lithium de-pletion (log N(Li) = 2.9) only after about 150 Myr (see, e.g.,Sestito & Randich 2005). Thus, we can estimate an age of the
A146, page 5 of 16

A&A 543, A146 (2012)
Fig. 4. Abundances found for KIC 7765135 (open circles) and forKIC 7985370 (filled circles) related to the solar ones.
order of 100−200 Myr for both stars with a lower limit ofroughly 30−50 Myr, the lithium abundance being below the up-per envelope of the αPer (age ≈ 50 Myr) and IC 2602 (age ≈30 Myr) clusters (Montes et al. 2001b; Sestito & Randich 2005).Moreover, the absence of a strong near-infrared (near-IR) excessin their spectral energy distributions (SEDs) (see Sect. 3.4) andof accretion signatures in the spectrum, allows us to exclude anage of a few million years for both stars that should already bein a post-T Tauri phase (age ≥ 10−20 Myr).
3.4. Spectral energy distributions
Our SEDs extending from the optical to the near-IR domainwere obtained by merging our standard UBVRCIC photometry(Table 2) with JHKs magnitudes from the 2MASS catalogue(Cutri et al. 2003).
We used the grid of NextGen low-resolution synthetic spec-tra, with log g = 4.0 and 4.5 and solar metallicity by Hauschildtet al. (1999), to perform a fit to the SEDs. The effective tem-perature (Teff) was kept fixed to the value derived with ROTFIT(Table 2) for each target. The interstellar extinction (AV) wasevaluated from the distance according to the rate of 0.8 mag/kpcfound by Mikolajewska & Mikolajewski (1980) for the sky re-gion around CI Cyg (very close to our targets). The Cardelli et al.(1989) extinction law with RV = 3.1 was used to evaluate the ex-tinction in the other bands. Finally, the angular diameter (φ) thatscales the synthetic surface flux over the stellar flux at Earth, wasallowed to vary. The best-fit solution was found by minimizingthe χ2 of the fit to the BVRCICJ data, which are dominated bythe photospheric flux of the star and are not normally signifi-cantly affected by infrared (IR) excesses. The angular diameterderived for KIC 7985370, φ = 0.0895 mas, implies a distanced = 113±15 pc, if we adopt a ZAMS radius of 1.1 R� (Sect. 3.1).For KIC 7765135, we found φ = 0.0413 mas, which correspondsto d = 245 ± 30 pc, adopting again 1.1 R�. The error in the dis-tance is estimated taking into account both a 0.1-R� uncertainty
Fig. 5. Spectral energy distributions (dots) for KIC 7985370 (top panel)and KIC 7765135 (bottom panel). The NextGen synthetic spectrum atTeff = 5800 K scaled to the star distance is overplotted with continuouslines in each box.
in the stellar radius and the temperature error of about 100 K(see Table 2).
As apparent in Fig. 5, the SEDs are well-reproduced bythe synthetic spectrum until the Ks band both for KIC 7985370and KIC 7765135 and no excess is visible at near-IR wave-lengths. This strengthens the spectroscopic determination of theeffective temperature and ensures that these stars have certainlygone through the T Tauri phase, during which a thick and denseaccretion disk gives rise to a conspicuous IR excess. The absenceof mid- and far-IR data does not allow us to exclude the presenceof thinner “debris” disks, similar to those found in a few Pleiadessolar-type stars (Stauffer et al. 2005; Gorlova et al. 2006).
3.5. Kinematics
We used the radial velocities determined in Sect. 3.1 andthe distances estimated in Sect. 3.4 together with measure-ments of proper motions taken from the Tycho-2 catalogue(Høg et al. 2000), to calculate Galactic space-velocity compo-nents (U, V , W), following the procedures described in Monteset al. (2001a). The values, listed in Table 2, are given in aright-handed coordinate system (which is positive towards theGalactic anti-centre, in the Galactic rotation direction, and to-wards the north Galactic pole, respectively). In the (U, V) and(W, V) Bottlinger diagrams (Fig. 6), we plotted the locus of ourtargets. Different symbols represent the central position given inthe literature (see Montes et al. 2001a) of the five youngest and
A146, page 6 of 16

H.-E. Fröhlich et al.: Magnetic activity and differential rotation in two young suns
Fig. 6. (U, V) and (W, V) planes of our two young suns. We plotted the average position of each young stellar kinematic group with differentsymbols. The dotted line in the left panel demarcates the locus of the young-disk population (age < 2 Gyr) in the solar neighborhood, as definedby Eggen (1984, 1989).
most well-documented moving groups (MGs) and superclus-ters (SCs): namely the Local Association (LA) or Pleiades MG(20−150 Myr), the IC 2391 SC (35−55 Myr), the Castor MG(200 Myr), the Ursa Major (UMa) MG or Sirius supercluster(300 Myr), and the Hyades SC (600 Myr).
The space velocities of these two Sun-like stars are consis-tent with those of the young-disk population (Fig. 6). On thebasis of two different statistical methods (for further informa-tion, see Klutsch et al. 2010; Klutsch et al., in prep.), we de-termined their membership probability to each of the five afore-mentioned young stellar kinematic groups. Both KIC 7985370and KIC 7765135 fall in the Local Association (LA) locus. Witha probability of more than 70%, they turn out to be highly likelymembers of this moving group. Furthermore, such a result com-pletely agrees with the age derived from the lithium abundance(Sect. 3.3).
4. Spot modelling of the Kepler light curves
4.1. Photometric data
All publicly available Kepler long-cadence time-series (Δt ≈30 min, Jenkins et al. 2010), spanning from 2009 May 2to 2009 December 16, were analysed. These cover altogether229 days and corresponds to the observing quarters 0−3(Q0−Q3), with the largest gap, about 4.5 days, appearingbetween Q1 and Q2.
To remove systematic trends in the Kepler light curves as-sociated with the spacecraft, detector, and environment, and toprepare them for the analysis of star spots that we describebelow, we used the software kepcotrend3. This procedure isbased on cotrending basis vectors (CBV) that are calculated(and ranked) by means of singular value decomposition anddescribe the systematic trends present in the ensemble fluxdata for each CCD channel. We used the first two basis vec-tors for Q0 data, adopting between three and five CBV for thecorrection of longer data sets such as Q1, Q2, and Q3.
3 http://keplergo.arc.nasa.gov/ContributedSoftwareKepcotrend.shtml
Fig. 7. Cleaned periodograms of the Kepler Q0+Q1+Q2+Q3 timeseries for KIC 7985370 (upper panel) and KIC 7765135 (lower panel).
To check how the data rectification accomplished withkepcotrend is reflected in the outcome, the spot modelling hasbeen done twice: with the rectified data (case A) as well as withthe original data (case B).
The power spectra of the Kepler time-series, cleaned bythe spectral window according to Roberts et al. (1987), aredisplayed in Fig. 7. The lower panel of Fig. 7 clearly showstwo main peaks for KIC 7765135, which are close in fre-quency (0.391 d−1 and 0.414 d−1). The corresponding periods are2.560± 0.015 days and 2.407±0.014 days, respectively. The pe-riod errors are inferred from the FWHM of the spectral window.The low-amplitude peaks at a frequency of ≈0.8 d−1 are over-tones of the two main peaks. As visible from the upper panel ofFig. 7, the structure of the peaks for KIC 7985370 is more com-plex, with the maximum corresponding to 2.856 ± 0.019 daysand a second peak, blended with the first one on its low fre-quency side, at 2.944 days. A third small peak corresponding toP = 3.090 days is also visible.
A146, page 7 of 16

A&A 543, A146 (2012)
Such a double- or multiple-peaked periodogram is evidenceof differential rotation. As Lanza et al. (1994) predicted, a photo-metric time series, if sufficiently accurate (ΔF/F = 10−5−10−6),may reveal a Sun-like latitudinal differential rotation.
An estimate of the inclination of the rotation axis with re-spect to the line of sight is very useful in constraining the spotmodel. When v sin i, stellar radius R, and rotation period P areall known, the inclination of the rotation axis follows from
sin i =(v sin i) · P
2πR· (1)
In the absence of an accurate parallax value, the stellar radiuscannot be derived from the effective temperature and luminos-ity. When we adopt the radius of a ZAMS star with the sameeffective temperature as our targets (Teff = 5800 K), R ≈ 1.1 R�,we get sin i = 0.967 (i = 75◦ ± 15◦) for both stars. However,as stated in Sect. 3.3, the lithium content cannot provide a firmlower limit to the ages of these stars, which might also be asyoung as a few 10 Myr (post-T Tauri phase). In the case ofsuch a young age, a Teff = 5800 K would be reached by a starof 1.5 M� at 10 Myr with a radius of about 2 R� according to theevolutionary tracks by Siess et al. (2000), and an inclination ofabout 30◦ deduced.
4.2. Bayesian photometric imaging
Our imaging method is basically that of Paper I. However, asthe duration of the light curves are now significantly longer, theintroduction of additional free parameters is inevitable. The lati-tudinal dependence of the rotation frequencyΩ(β) (Eq. (2)) nowcontains a sin4 β-term and, more importantly, the prescription forspot area evolution is much more detailed. Furthermore, the like-lihood function (Eq. (3)) is generalized by taking into account anunknown linear trend in the data. To tackle the problem of strongcorrelations between some parameters, an essential new ingredi-ent is the usage of an orthogonalized parameter space, where thesteered random walk of the Markov chains is performed. For thesake of clarity and owing to these new features, the basics ofthe method are explained in this section, although they can alsobe found in Paper I. A full account of the method is deferred toa forthcoming Paper (Fröhlich, in prep.).
A light-curve fitting that represents spots as dark and circu-lar regions has the advantage of reducing the dimensionality ofthe problem and promptly provides us with average parameters(area, flux contrast, position, etc.) for each photospheric activeregion. There are, of course, other techniques, which are basedon different assumptions, to reconstruct surface features photo-metrically as the inversion of Kepler light curves (cf., e.g. Brownet al. 2011).
Our aim is to present a low-dimensional spot model, withonly a few spots that fits reasonably well the data regardless ofvery low-amplitude details that require a high degree of com-plexity. In a Bayesian context, this claim could be even quanti-fied. One should ideally estimate the so-called evidence, namelythe integral over the posterior probability distribution. This pro-vides a measure of the probability of a n-spot model and, there-fore, allows one to constrain the number of spots n that arereally needed. For numerical reasons, we are compelled to re-sort instead to the less demanding Bayesian information crite-rion (BIC) of Schwarz (1978). This or any other related criterionexpresses Occam’s razor in mathematical terms without the needto compute numerically the integral over the posterior probabil-ity distribution. Unfortunately, we have to admit that – owing tothe unprecedentedly high accuracy of the Kepler data – we could
not constrain n by applying the BIC. There is obviously moreinformation in the data than our most elaborate model is able toaccount for.
Dorren’s (1987) analytical star-spot model, generalized to aquadratic limb-darkening law, was used. The two coefficientswere taken from the tables of Claret & Bloemen (2011) for amicroturbulence velocity of ξ = 2 km s−1 and used for both theunperturbed photosphere and the spots.
Four parameters describe the star as a whole: one is the co-sine of the inclination angle i. Three parameters (A, B, and C) de-scribe the latitudinal dependence of the angular velocity. With βbeing the latitude value, the angular velocity Ω is parameterizedby a series expansion using Legendre polynomials
Ω(β) = A + 3B(5 sin2 β − 1
)/2
+ C(315 sin4 β − 210 sin2 β + 15
)/8. (2)
The equatorial angular velocity is Ωeq = A − 3B/2 + 15C/8 andthe equator-to-pole differential rotation dΩ = 15B/2 + 105C/8.In the case of the equator rotating faster than the poles, dΩ isnegative. In what follows, the minus sign is suppressed, and onlythe absolute value |dΩ| is given. Both stars are definitely rotatinglike the Sun.
As in Paper I, all star spots have the same intensity κ rela-tive to the unspotted photosphere and are characterized by twoposition coordinates (latitude and initial longitude) and by theirradius. All these are free parameters in the model. Other spotparameters are the rotation period, which defines the spot lon-gitude at any time and is tied to the latitude via Eq. (2). Thehemisphere, to which a spot belongs to, is to be found by trialand error. Further parameters describe the spot area evolution.
As our photometric analysis is designed mainly to estimatethe level of surface differential rotation, our focus is on long-lived spots, i.e. longevity of star spots is at the heart of our ap-proach. To obtain, in view of the extraordinary length of the timeseries, a satisfying fit, more flexibility has been given to spot areaevolution with respect to Paper I. It is now parameterized by upto eight parameters.
The spot area is given in units of the star’s cross-section.Area evolution is assumed to proceed basically linearly withtime. The underlying physical reason for this is that, at least inthe case of a decaying spot, the slope of the area-time relationis somehow related to the turbulent magnetic diffusivity. Withthe aim of enhancing flexibility and to describe the waxing andwaning of a spot, three consecutive slope values are considered.The time derivative of the spot area is then a mere step functionover time, and the step height measures the increase/decrease inarea per day. Hence, there are six free parameters: three slopevalues, two dates of slope change, and the logarithm of spot areaat some point of the time series. An additional feature is that toprevent sharp bends in the spot area evolution, some smoothingis introduced. Each date where the slope changes is replaced bya time interval to which we assign a slope that is the linear inter-polation of the two adjacent values. This ensures that the secondorder time derivative of spot area is a mere step function of time,described by six parameters. To get the integrated area itself asfunction of time, two constants of integration enter, thus bringingthe number of free parameters to describe a spot’s area evolutionto a total of eight.
In addition to the free parameters of the model, there are theones derived. An example is the rotational period, which followsfrom the longitudes of the spot centre at the beginning of thetime series and at its end.
A146, page 8 of 16

H.-E. Fröhlich et al.: Magnetic activity and differential rotation in two young suns
Fig. 8. Kepler light curve with best fit (solid red line, second case-A solution of Table 5) overplotted. The residuals, shown at the top, are±2.14 mmag and obviously inhomogeneous from one part of the light curve to another.
All parameters are estimated in a Bayesian manner, i.e. theirmean values as well as the corresponding uncertainties followstraightforwardly from the data alone. To maintain a flat priordistribution in parameter space, all dimensional parameters suchas the periods or spot radii must actually be described by theirlogarithms. Only then will the posterior probability distributionfor a period be consistent with that of a frequency and likewisethe posterior for a radius with that of an area, i.e. it does notmatter whether one considers periods instead of frequencies orradii instead of areas.
The likelihood function (Eq. (3)) assumes that the measure-ment errors have a Gaussian distribution in the magnitude do-main. This is justified as long as the S/N does not vary withchanging magnitude, as in the case of our data that span a fullvariation range smaller than 0.1 mag. This has the invaluableadvantage that the likelihood function can be analytically in-tegrated over the measurement error σ, offset c0, and lineartrend d0. To perform the integration over σ, one has to useJeffreys’ 1/σ-prior (cf. Kass & Wassermann 1996). The result-ing mean likelihood depends on only the spot-modelling param-eters p1 . . . pM. This takes into account all possible error val-ues, offsets, and linear trends. By multiplying this with the prior,which is assumed to be constant in parameter space, one gets theposterior density distribution. All interesting quantities, like pa-rameter averages and confidence intervals, are then obtained bymarginalization.
With the N magnitude values di measured at times ti, theirstandard deviations σi, the model magnitudes f0(ti, p1 . . . pM),offset c0, and trend d0, the likelihood function is given by
Λ (σ, c0, d0, p1 . . . pM; di) =N∏
i=1
1√2πσi
exp
⎛⎜⎜⎜⎜⎝− (di − f0 (ti, p1...M) − c0 − d0 · (ti − t0))2
2σ2i
⎞⎟⎟⎟⎟⎠ ·(3)
We set σi = si · σ, with relative errors si being normalizedaccording to
∑Ni=1 1/s2
i = N.By sampling the parameter space, we estimated the param-
eters using the Markov chain Monte Carlo (MCMC) method(cf. Press et al. 2007).
Often parameter values are highly correlated. As MCMCperforms best in an orthogonalized parameter space, we con-verted all parameters using a principal component analysis basedon singular value decomposition (cf. Press et al. 2007). Each pa-rameter in this abstract space is linearly dependent on all of the
Fig. 9. Determination of the stellar inclination from Kepler photometry.Mean and 68-per-cent confidence interval are indicated by vertical lines(case A only). Dashed: the corresponding marginal distribution for theoriginal data with linear trends removed (case B).
original parameters. The reconstruction of the original parame-ter values can be done by exploiting a subspace of this orthog-onalized parameter space. The dimension of this subspace, i.e.the number of degrees of freedom, is then found to be lowerby roughly one third or even more than the number of originalparameters.
4.3. Results
4.3.1. KIC 7985370
We identified 11 gaps longer than an hour and 2 additional smalljumps in the light curve (Fig. 8). The data set was accordinglydivided into 14 parts. Each part was assigned its individual errorlevel, offset, and, in case B (i.e. non-rectified data), linear trend.Hence, the likelihood (Eq. (3)) is the product of 14 independentcontributions.
KIC 7985370’s inclination value i was – to be honest – ill-defined by the spot model applied to the Kepler photometry.With only six spots, the MCMC indeed identified very dark spots(κ ≈ 0) at very low inclination (i ≈ 10◦). However, even forthese unrealistic solutions the equator-to-pole differential rota-tions was 0.18 rad d−1. Only with seven spots and allowing forsufficient amount of spot evolution did we arrive at acceptableinclination values (Fig. 9) and spot intensities (Fig. 10). Whenthe inclination is fixed to the spectroscopically derived value of
A146, page 9 of 16

A&A 543, A146 (2012)
Table 5. Three seven-spot solutions for KIC 7985370.
Parametera Case Ab Case Ab Case Bb
inclination i 75◦.0 fixed 41◦.4 +0.5−0.5 32◦.6 +0.7
−0.9
1st latitude β1 34◦.0 +0.1−0.1 29◦.4 +0.4
−0.4 22◦.6 +0.5−0.6
2nd latitude β2 −10◦.0 +0.6−0.9 −6◦.9 +0.9
−0.9 3◦.3c +0.1−0.1
3rd latitude β3 32◦.2 +0.2−0.2 29◦.9 +0.3
−0.3 27◦.7 +0.4−0.4
4th latitude β4 86◦.8 +0.1−0.1 87◦.5 +0.1
−0.1 87◦.8 +0.1−0.1
5th latitude β5 53◦.8 +0.1−0.1 53◦.6 +0.1
−0.1 51◦.1 +0.2−0.2
6th latitude β6 35◦.8 +0.2−0.2 35◦.8 +0.3
−0.2 33◦.0 +0.3−0.3
7th latitude β7 29◦.6 +0.3−0.2 19◦.9 +0.9
−0.9 10◦.0 +0.5−0.6
1st period P1 2.8581 +0.0001−0.0001 2.8563 +0.0001
−0.0001 2.8572 +0.0001−0.0001
2nd period P2 2.8350 +0.0003−0.0003 2.8428 +0.0007
−0.0006 2.8475 +0.0002−0.0002
3rd period P3 2.8541 +0.0004−0.0004 2.8572 +0.0004
−0.0005 2.8644 +0.0007−0.0005
4th period P4 3.0895 +0.0001−0.0001 3.0898 +0.0001
−0.0001 3.0888 +0.0001−0.0001
5th period P5 2.9382 +0.0002−0.0002 2.9421 +0.0002
−0.0002 2.9417 +0.0003−0.0002
6th period P6 2.8629 +0.0003−0.0004 2.8700 +0.0004
−0.0003 2.8754 +0.0005−0.0004
7th period P7 2.8490 +0.0003−0.0002 2.8460 +0.0002
−0.0002 2.8487 +0.0002−0.0002
spot intensity κ 0.437 +0.005−0.004 0.396 +0.006
−0.006 0.406 +0.012−0.012
equ. period Peq 2.8347 +0.0003−0.0003 2.8427 +0.0007
−0.0006 2.8474 +0.0003−0.0002
deviation C/B 0.28 0.28 0.21
diff. rotation dΩ 0.1839 +0.0002−0.0002 0.1774 +0.0004
−0.0005 0.1729 +0.0002−0.0002
residuals ±2.46 ±2.14 ±2.12
Notes. Listed are expectation values and 1-σ confidence limits. (a) Latitudes β are derived from the assumed law of differential rotation (Eq. (2)).Periods P are given in days, and the spot intensity κ in units of the intensity of the unspotted surface. The ratio C/B measures the deviation froma pure sin2-law of differential rotation. The differential rotation dΩ (rad d−1) is the equator-to-pole value of the shear. Residuals are in mmag.(b) Case A refers to rectified data, and case B to non-rectified one. To derive the case-B solution, the case-A solution has been taken as a startingpoint for the MCMC parameter estimation. In the first case-A solution, the inclination is fixed to i = 75◦. (c) The second spot is near the equator,therefore, the hemisphere that it belongs to is doubtful.
Fig. 10. Spot intensity related to the unspotted photosphere. Mean and68-per-cent confidence interval are indicated by vertical lines (case Aonly). Dashed: the corresponding marginal distribution for the originaldata with linear trends removed (case B).
i = 75◦, the residuals are rather high, ±2.46 mmag, exceed-ing the residuals of our best-fit solution (±2.14 mmag) by far.Nevertheless, the details of the solution with fixed inclinationare also included in Table 5, where the results are presented.
Improving the seven-spot solution by adding an eighth spotformally leads to a tighter fit. As the new spot proves to be
Fig. 11. All seven marginal distributions (case A) of the spot frequen-cies. The three frequencies (0.324, 0.340, and 0.350 d−1) seen in thelow-resolution Fourier spectrum (Fig. 7) are confirmed by the results ofour spot model.
ephemeral, lasting only six rotations, it neither constrains the dif-ferential rotation nor adds any significant insight (one can alwaysget a better result by adding short-lived features).
The marginal distributions of all spot frequencies (case Aonly), combined into one plot, are shown in Fig. 11.
A146, page 10 of 16
H.-E. Fröhlich et al.: Magnetic activity and differential rotation in two young suns
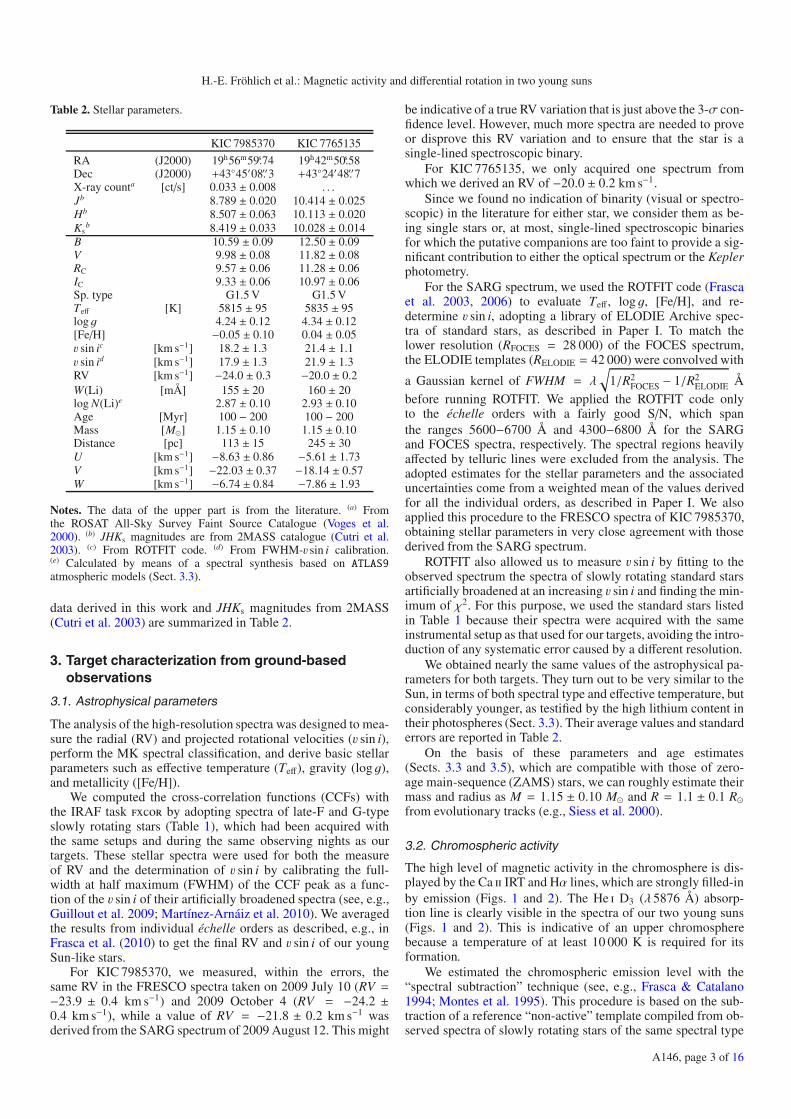
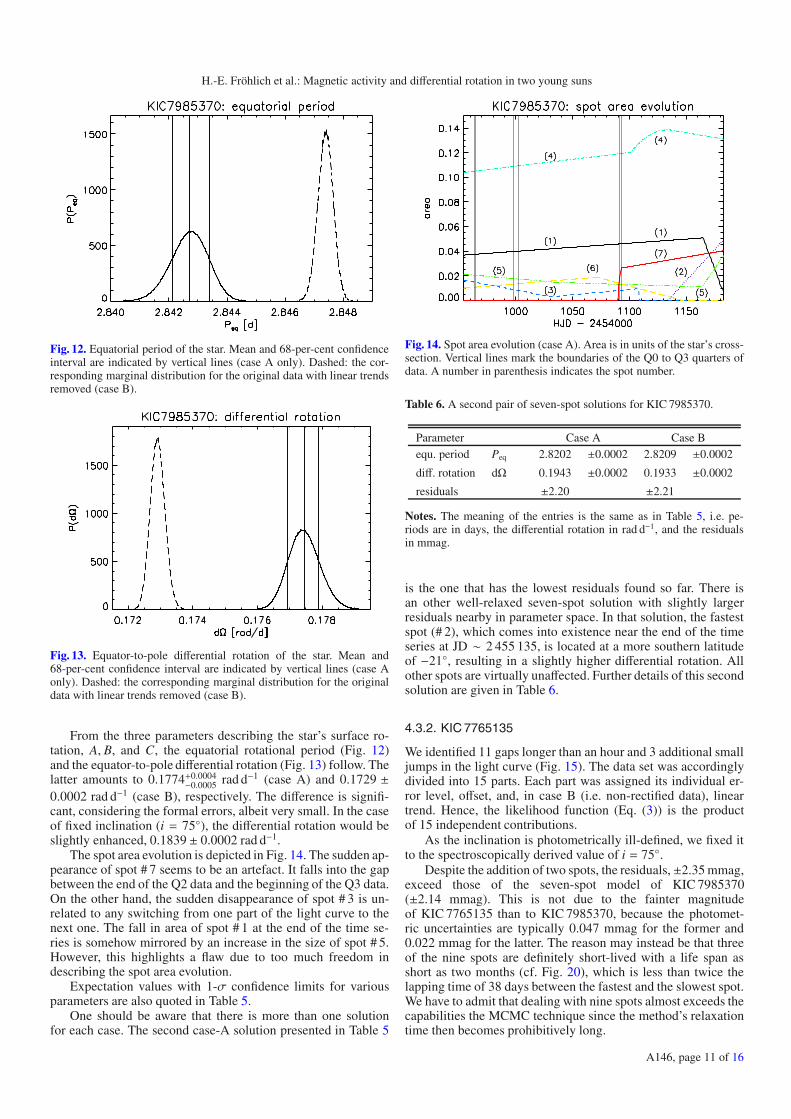
Fig. 12. Equatorial period of the star. Mean and 68-per-cent confidenceinterval are indicated by vertical lines (case A only). Dashed: the cor-responding marginal distribution for the original data with linear trendsremoved (case B).
Fig. 13. Equator-to-pole differential rotation of the star. Mean and68-per-cent confidence interval are indicated by vertical lines (case Aonly). Dashed: the corresponding marginal distribution for the originaldata with linear trends removed (case B).
From the three parameters describing the star’s surface ro-tation, A, B, and C, the equatorial rotational period (Fig. 12)and the equator-to-pole differential rotation (Fig. 13) follow. Thelatter amounts to 0.1774+0.0004
−0.0005 rad d−1 (case A) and 0.1729 ±0.0002 rad d−1 (case B), respectively. The difference is signifi-cant, considering the formal errors, albeit very small. In the caseof fixed inclination (i = 75◦), the differential rotation would beslightly enhanced, 0.1839 ± 0.0002 rad d−1.
The spot area evolution is depicted in Fig. 14. The sudden ap-pearance of spot # 7 seems to be an artefact. It falls into the gapbetween the end of the Q2 data and the beginning of the Q3 data.On the other hand, the sudden disappearance of spot # 3 is un-related to any switching from one part of the light curve to thenext one. The fall in area of spot # 1 at the end of the time se-ries is somehow mirrored by an increase in the size of spot # 5.However, this highlights a flaw due to too much freedom indescribing the spot area evolution.
Expectation values with 1-σ confidence limits for variousparameters are also quoted in Table 5.
One should be aware that there is more than one solutionfor each case. The second case-A solution presented in Table 5
Fig. 14. Spot area evolution (case A). Area is in units of the star’s cross-section. Vertical lines mark the boundaries of the Q0 to Q3 quarters ofdata. A number in parenthesis indicates the spot number.
Table 6. A second pair of seven-spot solutions for KIC 7985370.
Parameter Case A Case Bequ. period Peq 2.8202 ±0.0002 2.8209 ±0.0002
diff. rotation dΩ 0.1943 ±0.0002 0.1933 ±0.0002
residuals ±2.20 ±2.21
Notes. The meaning of the entries is the same as in Table 5, i.e. pe-riods are in days, the differential rotation in rad d−1, and the residualsin mmag.
is the one that has the lowest residuals found so far. There isan other well-relaxed seven-spot solution with slightly largerresiduals nearby in parameter space. In that solution, the fastestspot (# 2), which comes into existence near the end of the timeseries at JD ∼ 2 455 135, is located at a more southern latitudeof −21◦, resulting in a slightly higher differential rotation. Allother spots are virtually unaffected. Further details of this secondsolution are given in Table 6.
4.3.2. KIC 7765135
We identified 11 gaps longer than an hour and 3 additional smalljumps in the light curve (Fig. 15). The data set was accordinglydivided into 15 parts. Each part was assigned its individual er-ror level, offset, and, in case B (i.e. non-rectified data), lineartrend. Hence, the likelihood function (Eq. (3)) is the productof 15 independent contributions.
As the inclination is photometrically ill-defined, we fixed itto the spectroscopically derived value of i = 75◦.
Despite the addition of two spots, the residuals,±2.35 mmag,exceed those of the seven-spot model of KIC 7985370(±2.14 mmag). This is not due to the fainter magnitudeof KIC 7765135 than to KIC 7985370, because the photomet-ric uncertainties are typically 0.047 mmag for the former and0.022 mmag for the latter. The reason may instead be that threeof the nine spots are definitely short-lived with a life span asshort as two months (cf. Fig. 20), which is less than twice thelapping time of 38 days between the fastest and the slowest spot.We have to admit that dealing with nine spots almost exceeds thecapabilities the MCMC technique since the method’s relaxationtime then becomes prohibitively long.
A146, page 11 of 16

A&A 543, A146 (2012)
Fig. 15. Kepler light curve with best fit (solid red line, case-A solution of Table 7) overplotted. The residuals, shown at the top, are ±2.35 mmagand obviously inhomogeneous from one part of the light curve to another, hence, the stated ±2.35 mmag is to be considered an overall average.
Fig. 16. Same as Fig. 10, for KIC 7765135.
Fig. 17. Marginal distributions of the frequency for all the nine spots.The frequency values group around the two principal frequencies (0.391and 0.414 d−1) seen already in the Fourier spectrum (Fig. 7), whichis the reason for the obvious “beating” phenomenon in Fig. 15 witha period of 40 days. The shortest and the longest frequency are asuperposition of two frequencies.
The marginal distribution of the spot rest intensity is shownin Fig. 16.
The marginal distributions of the nine spot frequencies(case A only), combined into one plot, are shown in Fig. 17.
Fig. 18. Same as Fig. 12, for KIC 7765135.
Fig. 19. Same as Fig. 13, for KIC 7765135.
From the three parameters describing the star’s sur-face rotation, A, B, and C, the equatorial rotational period(Fig. 18) and the equator-to-pole differential rotation (Fig. 19)follows. The latter amounts to 0.1760 ± 0.0003 rad d−1
(case A) and 0.1774+0.0003−0.0004 rad d−1 (case B), respectively. As
for KIC 7985370, the difference is small, but neverthelesssignificant.
A146, page 12 of 16

H.-E. Fröhlich et al.: Magnetic activity and differential rotation in two young suns
Fig. 20. Same as Fig. 14, for KIC 7765135. Three of the nine spots(# 4, # 7, and # 9) are short-lived ones. Note the change in scale in theupper part!
The level of differential rotation does not depend on the num-ber of spots considered. Neglecting the three short-lived spots,i.e. considering a six-spot model, would result in an equator-to-pole shear of 0.1777 ± 0.0006 rad d−1.
The inclination does not significantly affect dΩ. Decreasingthe inclination from the adopted value of i = 75◦ to 45◦ wouldindeed result in a marginally higher differential rotation by threeto four per cent. This is quite understandable: inclination affectslatitudes, but hardly periods.
A cursory glance cast at the beating pattern (Fig. 15) revealsa lapping time Pbeat ∼ 40 days, which is nearly exactly the lap-ping time of 40.3 days from the two peaks of the cleaned pe-riodogram (Fig. 7). From these 40.3 days, one is already ableto estimate the minimum value of the differential rotation as2π/Pbeat ∼ 0.156 rad d−1, which is not far from that derived bythe model.
The spot area evolution (case A) is depicted in Fig. 20. Theoverwhelmingly large southern spot – at the beginning it fills alarge extent of the southern hemisphere – may be an artefact.Owing to its southern location, its contribution to the light curveis rather modest. Perhaps it is actually a feature in the northernhemisphere, a non-circular extension of spot # 2. To prevent spotoverlap, spot # 8 had to be moved to the southern hemisphere.The reader should be aware that even in the case of a large spot,the whole spot region has been assigned the angular velocity ofits centre. Differential rotation is, to be exact, incompatible witha fixed circular shape. This is a shortcoming of our simple model.
In the case of KIC 7765135, we cannot exclude that spot areaevolution is partly driven by the need to avoid the overlappingof spots.
Expectation values with 1-σ confidence limits for variousparameters are compiled in Table 7.
5. Discussion
5.1. Chromospheric and coronal activity
To compare with the chromospheric activity of stars similar toour targets, we considered 18 stars in the Pleiades cluster amongthose investigated by Soderblom et al. (1993b), that have anearly-G spectral type or an effective temperature close to thoseof our targets and a v sin i between 4 km s−1 and 18 km s−1.With a spectral subtraction analysis, they found values of thenet Hα emission between 100 mÅ and 500 mÅ and surface
Table 7. Two nine-spot solutions for KIC 7765135 with inclinationbeing fixed to i = 75◦.
Parametera Case Ab Case Bb
inclination i 75◦.0 fixed 75◦.0 fixed
1st latitude β1 20◦.4 +0.1−0.1 20◦.0 +0.1
−0.1
2nd latitude β2 76◦.3 +0.2−0.2 75◦.1 +0.2
−0.2
3rd latitude β3 1◦.9 +0.2−0.1 0◦.8 +0.2
−0.2
4th latitude β4 21◦.1 +0.3−0.3 20◦.5 +0.3
−0.3
5th latitude β5 0◦.9 +0.3−0.4 0◦.7 +0.3
−0.2
6th latitude β6 12◦.1 +0.1−0.1 11◦.7 +0.1
−0.1
7th latitude β7 16◦.3 +0.3−0.3 17◦.2 +0.3
−0.3
8th latitude β8 −75◦.9 +0.2−0.2 −74◦.4 +0.2
−0.2
9th latitude β9 60◦.2 +0.4−0.4 59◦.4 +0.4
−0.4
1st period P1 2.4223 +0.0001−0.0001 2.4222 +0.0001
−0.0001
2nd period P2 2.5651 +0.0001−0.0001 2.5653 +0.0001
−0.0001
3rd period P3 2.4020 +0.0001−0.0001 2.4022 +0.0001
−0.0001
4th period P4 2.4237 +0.0004−0.0004 2.4231 +0.0005
−0.0005
5th period P5 2.4019 +0.0001−0.0001 2.4022 +0.0001
−0.0001
6th period P6 2.4092 +0.0001−0.0001 2.4092 +0.0001
−0.0001
7th period P7 2.4151 +0.0004−0.0005 2.4172 +0.0005
−0.0005
8th period P8 2.5645 +0.0001−0.0001 2.5641 +0.0001
−0.0001
9th period P9 2.5313 +0.0010−0.0010 2.5311 +0.0009
−0.0009
spot intensity κ 0.671 +0.003−0.003 0.700 +0.003
−0.003
equ. period Peq 2.4018 +0.0001−0.0001 2.4022 +0.0001
−0.0001
deviation C/B −0.008 −0.008
diff. rotation dΩ 0.1760 +0.0003−0.0003 0.1774 +0.0003
−0.0004
residuals ±2.35 ±2.29
Notes. Listed are expectation values and 1-σ confidence limits. (a,b) Themeaning of the superscripts is the same as in Table 5.
fluxes ranging from 1.0 × 10⁶ to 2.9 × 10⁶ erg cm−2 s−1. Thenet emission filling the core of the Ca ii-λ8542 line rangesfrom about 300 mÅ to 600 mÅ and the corresponding flux isin the range 1.0−2.7 × 10⁶ erg cm−2 s−1. The values of theseactivity indicators for our two targets are within all of theseranges, suggesting an activity level comparable to the Pleiadesstars (age ∼ 130 Myr). The X-ray luminosity of these Pleiadesmembers, as evaluated by Stauffer et al. (1994) and Marinoet al. (2003), is in the range log LX = 28.7−29.7, which isjust below the saturation threshold of log LX = 30.0 foundby Pizzolato et al. (2003) for Sun-like stars. Moreover, ac-cording to the works of Pizzolato et al. (2003) and Soderblomet al. (1993b), the saturation would occur for rotation periodsshorter than about 2.0 days. Another helpful study of the chro-mospheric activity in stars belonging to the young open clus-ters IC 2391 and IC 2602 (age ≈ 30−50 Myr) shows that thechromospheric flux measured in the core of Ca ii−λ8542 linesaturates at a value of log(R′8542) = log(F′8542/σT 4
eff) ≈ −4.2(Marsden et al. 2009). A similar behaviour was previously foundfor the Pleiades by Soderblom et al. (1993b). The log(R′8542)values of −4.5 and −4.6 that can be derived for KIC 7985370and KIC 7765135, respectively, are lower than, but not very farfrom, this saturation level. From the ROSAT X-ray count and thedistance quoted in Table 2, we evaluated the X-ray luminosityof KIC 7985370 using the relation proposed by Fleming et al.(1995), LX = 4πd2(8.31 + 5.30 HR1) × 10−12 erg s−1, where
A146, page 13 of 16

A&A 543, A146 (2012)
the hardness ratio is HR1 = 0.23 (Voges et al. 2000). Thevalue of log LX = 29.68+0.15
−0.20 confirms the non-saturated regimefor KIC 7985370.
5.2. General considerations on the spot model
Despite both stars being very active and exhibiting filled-in ab-sorption of several chromospheric activity indicators, our pho-tometric analysis is performed only in terms of dark surfacefeatures. Allowing for bright ones too, would usually makethe MCMC approach unstable. In all cases, photometry aloneseems to be unable to discriminate even between dark and brightspots (e.g., Lüftinger et al. 2010).
As a comparison of the two cases A and B reveals, the resultsof our spot modelling are hardly influenced by the rectificationprocedure. The smaller residuals for non-rectified data (case B)are very likely caused by the case B likelihood function (Eq. (3))also taking into account a linear trend in the data, individuallyfor each part of the light curve. This allows for more freedom infitting the data and results in a slightly better fit.
The reader should be aware that the estimated parameter val-ues and their often surprisingly small errors are those of themodel constrained by the data. Error bars indicate the “elbowroom” of the model, nothing more.
5.3. Frequencies
It is remarkable that the frequencies that stand out in the powerspectrum of the light curves (Fig. 7) represent the distributionof spot frequencies (Figs. 11 and 17) astonishingly well. Thelapping time, as a measure of the lower limit to the surface dif-ferential rotation, already follows from the periodogram analy-sis! However, to get an estimate of the full equator-to-pole spanof the latitudinal shear, including its sign, one needs latitudinalinformation.
5.4. Inclination
Combining the inclination value from photometry, i ≈ 40◦,with the spectroscopically measured projected rotational ve-locity v sin i (Table 2) allowed us to determine the radiusof KIC 7985370. Taking the shortest rotational period (Peq), onearrives at R = 1.42−1.44 R�. This (minimal) radius is larger thanthe ZAMS value of R ≈ 1.1 R�, but smaller than R ≈ 2 R� fora star of 1.5 M� at 10 Myr. Hence, the photometrically derivedradius is within the expected range. In the case of KIC 7765135,as stated in Sect. 4.3.2, the photometric inclination is poorly de-fined. Therefore, the inclination was fixed to i = 75◦, assumingthe radius to have its ZAMS value.
5.5. Spot contrast and longevity
Although both stars have the same spectral type and age, thereare differences among the spots. The spots of KIC 7985370 seemto be darker and longer-living than those of KIC 7765135.
We recall that a “spot” may in fact be a group of smaller spotsthat together form an active region, which could also includebright features.
For KIC 7765135, the spot contrast, κ ≈ 0.7, looksrather normal, and is similar to the previously studied caseof KIC 8429280 (Paper I). The corresponding temperature con-trast, given by the ratio of spot to photospheric tempera-ture Tsp/Tph, is 0.9, assuming that the “white-light” Kepler fluxmatches the bolometric conditions. The much darker spots, κ ≈0.4, in the case of KIC 7985370 defy a simple explanation. There
is no need for exceptionally small (and therefore dark) spots toprevent spot overlap.
Apart from a few late F-type stars of low or moderate activ-ity observed by CoRoT (Mosser et al. 2009) where spots seemto be short-lived, there is strong evidence that spots in very ac-tive stars such as our targets have rather long lifes compared tothe stellar rotation. Active longitudes lasting for either months oryears have been observed in young stars (e.g., Collier Cameron1995; Hatzes 1995; Barnes et al. 1998; Huber et al. 2009; Lanzaet al. 2011) and in the evolved components of close binary sys-tems, such as II Peg (e.g. Rodonò et al. 2000; Lindborg et al.2011). This does not exclude that the individual unresolved spotsforming the active region, have shorter evolution times, but thephotospheric active region seen as an entity persists for a verylong time in such cases.
Unlike KIC 7985370, the mid-latitude spots (30−50◦) inthe case of KIC 7765135 are missing. This is reminiscent ofthe spot distribution of two rapidly rotating early G dwarfs,He 520 and He 699, of the α Persei cluster studied by Barneset al. (1998). Despite there being a clear distinction betweenthe near-equator and near-pole spots, in terms of the spot life-times, no correlation seems to exist between the lifetime andlatitude, which is in contrast to the case of the rapidly rotatingyoung AB Dor (Collier Cameron 1995), where only low- andintermediate-latitude spots are long-lived.
The sudden appearance of a full-grown spot at the beginningof a new quarter of data is suspicious and is most likely to be anartefact (Fig. 14).
5.6. Differential rotation
Both stars exhibit low-latitude spots as well as high-latitude onesat the time of observation, making them suitable for studyingthe latitudinal shear. The most robust and important result of thepresent work is the high degree of surface differential rotationfound for both stars of dΩ = 0.18 rad d−1, which exceeds thesolar value by a factor of three.
This estimate is rather robust, because any spot model with afew long-lasting spots able to reproduce the beating of the lightcurve must provide a value of equator-to-pole differential rota-tion that exceeds the lower limit of 2π/Pbeat, irrespective of thenumber of spots used.
Varying the model inclination has a marginal effect for theperiods recovered in the light curve.
We remark that the high value of dΩ relies on the assumptionof spot longevity. It is always possible to get an excellent fit withmany short-lived spots, even for rigid rotation.
Very different values of differential rotation have been foundfor HD 171488 (V889 Her), a young (∼50 Myr) Sun. For thisstar, which rotates more rapidly (P = 1.33 days) than our targets,a very high solar-type differential rotation dΩ ≈ 0.4−0.5 rad d−1,with the equator lapping the poles every 12−16 days, was foundby both Marsden et al. (2006) and Jeffers & Donati (2008). Muchweaker values (dΩ ≈ 0.04) were instead derived for the samestar by Järvinen et al. (2008) and Kovári et al. (2011). Huberet al. (2009) even claimed that their data is consistent with nodifferential rotation.
Marsden et al. (2011) reported values of dΩ in the range0.08−0.45 rad d−1 for a sample of stars similar to and slightlymore massive than the Sun. Among these stars, HD 141943,a 1.3-M� star that is still in the PMS phase (age ∼ 17 Myr),displays values of dΩ ranging from about 0.23 rad d−1
to 0.44 rad d−1 in different epochs. A solar-type differential ro-tation, dΩ ≈ 0.2 rad d−1, was also found by Waite et al. (2011)
A146, page 14 of 16

H.-E. Fröhlich et al.: Magnetic activity and differential rotation in two young suns
for HD 106506, a G1 V-type star (Teff = 5900 K) that is verysimilar to our targets, but rotates more rapidly (Peq = 1.39 days).Moreover, the Fourier transform technique applied to high-resolution spectra of a large sample of F- and early G-type starsindicates that differential rotation is frequently found (Reiners& Schmitt 2003; Reiners 2006). In their data, there is no cleardependence on the rotation period, but the strongest differen-tial rotation, up to ∼1.0 rad d−1, occurs for periods between 2and 3 days and values as high as ∼0.7 rad d−1 are encountereddown to P ∼ 0.5 days.
From ground-based photometry, which has focused primar-ily on cooler stars, a different behaviour, i.e. a differential rota-tion decreasing with the rotation period, seems to emerge (e.g.,Messina & Guinan 2003). However, the precision of the ground-based light curves does not allow us to draw firm conclusionsand accurate photometry from space, as well as Doppler imag-ing, is needed to settle this point.
For mid-G to M dwarfs, weaker values of the latitudinalshears are generally found. In particular, Barnes et al. (2005)analysed with the Doppler imaging technique a small sampleof active stars in the spectral range G2−M2, identifying a trendtowards decreasing surface differential rotation with decreas-ing temperature. This suggests that the stellar mass must alsoplay a significant role. The largest values for stars as cool asabout 5000 K are dΩ = 0.27 rad d−1 found by us in Paper Ifor KIC 8429280 (K2 V, P = 1.16 days) and dΩ = 0.20 rad d−1
found by Donati et al. (2003) for LQ Hya (K2 V, P = 1.60 days).The slowly rotating (Peq = 11.2 d) and mildly active K2 V starε Eri exhibits only little differential surface rotation (0.017 ≤dΩ ≤ 0.056 rad d−1), as a Bayesian reanalysis of the MOST lightcurve (Croll 2006; Croll et al. 2006) revealed (Fröhlich 2007).
Thus, there is an indication that a high differential rotationgoes along with a high rotation rate.
The high differential rotations that we found forKIC 7985370 and KIC 7765135 disagree with the hydro-dynamical model of Küker et al. (2011), which instead predictsa rather low value of dΩ ≈ 0.08 for an evolved solar-mass starrotating with a period as short as 1.3 days.
Surface differential rotation may even vary during the ac-tivity cycle. Certain mean-field dynamo models for rapidly ro-tating cool stars with deep convection zones predict torsionaloscillations with variations of several percent in differential ro-tation (Covas et al. 2005). This cannot, of course, explain suchextreme cases as LQ Hya where at times the surface rotation issolid body. According to Lanza (2006), to maintain the strongshear (∼0.2 rad d−1) observed for LQ Hya in the year 2000 wouldimply a dissipated power exceeding the star’s luminosity.
The differential rotation of rapidly rotating solar-like starswas investigated on theoretical grounds by Hotta & Yokoyama(2011). They found that differential rotation approaches theTaylor-Proudman state, i.e. the iso-rotation surfaces tend to be-come cylinders parallel to the rotation axis, when stellar rotationis faster than the solar one. In this case, the differential rotation isconcentrated at relatively low latitudes with large stellar angularvelocity. They show that the latitudinal shear (between the equa-tor and latitude β = 45◦) increases with the angular velocity, inline with our results and the recent literature.
6. Conclusions
We have studied two Sun-like stars, KIC 7985370 andKIC 7765135, by means of high-resolution spectroscopy andhigh-precision Kepler photometry.
The high-resolution spectra allowed us to derive, for the firsttime, their spectral type, astrophysical parameters (Teff, log g,[Fe/H]), rotational and heliocentric radial velocities, and lithiumabundance. All this information, combined with the analysis ofthe SED and proper motions, has enabled us to infer their dis-tance and kinematics, and to estimate that the age of both stars isin the range 100−200 Myr, although we cannot exclude that theycould be as young as 50 Myr. Thus, these two sources shouldalready be in the post-T Tauri phase.
As expected from their young age, both stars werefound to be chromospherically active, displaying filled-in Hα,Hβ, and Ca ii IRT lines, as well as He i D3 absorption.The surface chromospheric fluxes and the X-ray luminosity(for KIC 7985370), within the ranges found for stars with simi-lar Teff and v sin i in the Pleiades cluster, are just below the sat-uration level (Soderblom et al. 1993b). The flux ratio of twoCa ii IRT lines and the Balmer decrement (for KIC 7765135only) suggest that the chromospheric emission is mainly due tooptically thick surface regions analogous to solar plages.
We have applied a robust spot model, based on a Bayesianapproach and a MCMC method, to the Kepler light curves,which span nearly 229 days and have an unprecedent preci-sion (≈10−5 mag). While seven long-lived spots were neededto perform a reasonable fit (at a 2-mmag level) to the lightcurve of KIC 7985370, we fitted up to nine spots in the caseof KIC 7765135 owing to the shorter lifetimes of its spots.Because of the exceptional precision of the Kepler photometry,it is impossible to reach the Bayesian noise floor defined by, e.g.,the BIC (Schwarz 1978) without significantly increasing the de-grees of freedom and, consequently, the non-uniqueness of thesolution. Provided spots are indeed long-lived, the equator-to-pole value of the shear amounts for both stars to 0.18 rad d−1.This is inconsistent with the theoretical models of Küker et al.(2011) that predict a moderate solar-type differential rotationeven for fast-rotating main-sequence stars, unless the convec-tion zone is shallower than predicted by the stellar models. Ourresults are instead in line with the scenario proposed by othermodellers of a differential rotation that increases with the an-gular velocity (Hotta & Yokoyama 2011) and that can be alsosubject to changes along the activity cycle (Covas et al. 2005;Lanza 2006).
Acknowledgements. We would like to thank the Kepler project and the teamwho created the MAST Kepler web site and search interfaces. We also thankan anonymous referee for helpful and constructive comments. This work hasbeen partly supported by the Italian Ministero dell’Istruzione, Università eRicerca (MIUR), which is gratefully acknowledged. JMZ acknowledges thePolish Ministry grant No. N N203 405139. D.M. and A.K. acknowledge theUniversidad Complutense de Madrid (UCM), the Spanish Ministerio de Cienciae Innovación (MCINN) under grants AYA2008-000695 and AYA2011-30147-C03-02, and the Comunidad de Madrid under PRICIT project S2009/ESP-1496(AstroMadrid). This research made use of SIMBAD and VIZIER databases,operated at the CDS, Strasbourg, France. This publication makes use of dataproducts from the Two Micron All Sky Survey, which is a joint project ofthe University of Massachusetts and the Infrared Processing and AnalysisCenter/California Institute of Technology, funded by the National Aeronauticsand Space Administration and the National Science Foundation.
ReferencesAndersen, J., Gustafson, B., & Lambert, D. L. 1984, A&A, 136, 65Barnes, J. R., Collier Cameron, A., Unruh, Y. C., Donati, J.-F., & Hussain,
G. A. J. 1998, MNRAS, 299, 904Barnes, J. R., Collier Cameron, A., Donati, J.-F., et al. 2005, MNRAS, 357, L1Barrado y Navascués, D., Stauffer, J. R., & Jayawardhana, R. 2004, ApJ, 614,
386Bonanno, A. 2012, Geophysical & Fluid Dynamics, in press
A146, page 15 of 16

A&A 543, A146 (2012)
Bonanno, A., Elstner, D., Rüdiger, G., & Belvedere, G. 2002, A&A, 390, 673Borucki, W. J., Koch, D., Basri, G., et al. 2010, Science, 327, 977Brown, A., Korhonen, H., Berdyugina, S., et al. 2011, AAS Meeting Abstracts
#218, 205.02Buzasi, D. L. 1989, Ph.D. Thesis, Pennsylvania State Univ.Cardelli, J. A., Clayton, G. C., & Mathis, J. S. 1989, ApJ, 345, 245Castelli, F., & Hubrig, S. 2004, A&A, 425, 263Catanzaro, G., Frasca, A., Molenda-Zakowicz, J., & Marilli, E. 2010, A&A, 517,
A3Chester, M. M. 1991, Ph.D. Thesis, Pennsylvania State Univ.Claret, A., & Bloemen, S. 2011, A&A, 529, 75Collier Cameron, A. 1995, MNRAS, 275, 534Covas, E., Moss, D., & Tavakol, R. 2005, A&A, 429, 657Croll, B. 2006, PASP, 118, 1351Croll, B., Walker, G. A. H., Kuschnig, R., et al. 2006, ApJ, 648, 607Cutri, R. M., Skrutskie, M. F., van Dyk, S., et al. 2003, 2MASS All-Sky Catalog
of Point Sources, University of Massachusetts and Infrared Processing andAnalysis Center (IPAC/California Institute of Technology)
Dikpati, M., & Gilman, P. A. 2001, ApJ, 559, 428Donati, J.-F., Collier Cameron, A., & Petit, P. 2003, MNRAS, 345, 1187Dorren, J. D. 1987, ApJ, 320, 756Eggen, O. J. 1984, ApJS, 55, 597Eggen, O. J. 1989, PASP, 101, 366Fleming, T. A., Molendi, S., Maccacaro, T., & Wolter, A. 1995, ApJS, 99, 701Frasca, A., & Catalano, S. 1994, A&A, 284, 883Frasca, A., Alcalá, J. M., Covino, E., et al. 2003, A&A, 405, 149Frasca, A., Guillout, P., Marilli, E., et al. 2006, A&A, 454, 301Frasca, A., Biazzo, K., Kovári, Zs., Marilli, E., & Çakırlı, Ö. 2010, A&A, 518,
A48Frasca, A., Fröhlich, H.-E., Bonanno, A., et al. 2011, A&A, 532, A81 (Paper I)Fröhlich, H.-E. 2007, Astron. Nachr., 328, 1037Glebocki, R., & Gnacinski, P. 2005, The Catalogue of Rotational Velocities of
Stars, ESA, SP-560, 571Gorlova, N., Rieke, G. H., Muzerolle, J., et al. 2006, ApJ, 649, 1028Grevesse, N., Asplund, M., Sauval, A. J., & Scott, P. 2010, Ap&SS, 328, 179Guillout, P., Klutsch, A., Frasca, A., et al. 2009, A&A, 504, 829Hall, J. C., & Ramsey, L. W. 1992, AJ, 104, 1942Hatzes, A. P. 1995, ApJ, 451, 784Hauschildt, P. H., Allard, F., & Baron, E. 1999, ApJ, 512, 377Høg, E., Fabricius, C., Makarov, V. V., et al. 2000, A&A, 355, L27Hotta, H., & Yokoyama, T. 2011, ApJ, 740, 12Huber, K. F., Wolter, U., Czesla, S., et al. 2009, A&A, 501, 715Järvinen, S. P., Korhonen, H., Berdyugina, S. V., et al. 2008, A&A, 488, 1047Jeffers, S. D., & Donati, J.-F. 2008, MNRAS, 390, 635Jenkins, J. M., Caldwell, D. A., Chandrasekaran, H., et al. 2010, ApJ, 713, L120Kass, R. E., & Wassermann, L. 1996, J. Am. Stat. Assoc., 91, 1343Klutsch, A., Guillout, P., Frasca, A., et al. 2010, in Highlights of Spanish
Astrophysics VI, Proc. IX Scientific Meeting of the Spanish AstronomicalSociety, eds. M. R. Zapatero Osorio, J. Gorgas, J. Maíz Apellániz, J. R. Pardo,& A. Gil de Paz, 534
Koch, D. G., Borucki, W. J., Basri, G., et al. 2010, ApJ, 713, L79Korhonen, H., & Elstner, D. 2011, A&A, 532, 106Kovári, Zs., Frasca, A., Biazzo, K., et al. 2011, Physics of Sun and Star Spots,
eds. D. P. Choudhary, & K. G. Strassmeier (Cambridge Univ. Press), Proc.IAU Symp., 273, 121
Küker, M., Rüdiger, G., & Kitchatinov, L. L. 2011, A&A, 530, A48Kurucz, R. L. 1993, A new opacity-sampling model atmosphere program for
arbitrary abundances, in Peculiar versus normal phenomena in A-type andrelated stars, IAU Colloq., 138, eds. M. M. Dworetsky, F. Castelli, & R.Faraggiana, ASP Conf. Ser., 44, 87
Kurucz, R. L., & Avrett, E. H. 1981, SAO Spec. Rep., 391
Kurucz, R. L., & Bell, B. 1995, Kurucz CD-ROM No. 23, Cambridge, Mass.:Smithsonian Astrophysical Observatory
Landman, D. A., & Mongillo, M. 1979, ApJ, 230, 581Lanza, A. F. 2006, MNRAS, 373, 819Lanza, A. F., Rodonò, M., & Zappala, R. A. 1994, A&A, 290, 861Lanza, A. F., Bonomo, A. S., Pagano, I., et al. 2011, A&A, 525, A14Lindborg, M., Korpi, M. J., Hackman, T., et al. 2011, A&A, 526, A44Lüftinger, T., Fröhlich, H.-E., Weiss, W. W., et al. 2010, A&A, 509, A43Marino, A., Micela, G., Peres, G., & Sciortino, S. 2003, A&A, 406, 629Marsden, S. C., Donati, J.-F., Semel, M., Petit, P., & Carter, B. D. 2006, MNRAS,
370, 468Marsden, S. C., Carter, B. D., & Donati, J.-F. 2009, MNRAS, 399, 888Marsden, S. C., Jardine, M. M., Ramírez Vélez, J. C., et al. 2011, MNRAS, 413,
1939Martínez-Arnáiz, R., Maldonado, J., Montes, D., Eiroa, C., & Montesinos, B.
2010, A&A, 520, A79Messina, S., & Guinan, E. F. 2003, A&A, 409, 1017Mikolajewska, J., & Mikolajewski, M. 1980, Acta Astron., 30, 347Montes, D., Fernández-Figueroa, M. J., De Castro, E., & Cornide, M. 1995,
A&AS, 109, 135Montes, D., López-Santiago, J., Gálvez, M. C., et al. 2001a, MNRAS, 328, 45Montes, D., López-Santiago, J., Fernández-Figueroa, M. J., & Gálvez, M. C.
2001b, A&A, 379, 976Mosser, B., Baudin, F., Lanza, A. F., et al. 2009, A&A, 506, 245Nelson, N. J., Brown, B. P., Brun, S., Miesch, M. S., & Toomre, J. 2011, 217th
AAS Meeting, #155.12, BAAS, 43Nordström, B., Mayor, M., Andersen, J., et al. 2004, A&A, 418, 989Parker, E. N. 1955, ApJ, 122, 293Pavlenko, Y. V., & Magazzù, A. 1996, A&A, 311, 961Perryman, M. A. C., Lindegren, L., Kovalevsky, J., et al. 1997, A&A, 323, L49Pfeiffer, M. J., Frank, C., Baumueller, D., et al. 1998, A&AS, 130, 381Pigulski, A., Pojmanski, G., Pilecki, B., & Szczygieł, D. M. 2009, Acta Astron.,
59, 33Pinsonneault, M. H., An, D., Molenda-Zakowicz, J., et al. 2012, ApJS, 199, 30Pizzolato, N., Maggio, A., Micela, G., Sciortino, S., & Ventura, P. 2003, A&A,
397, 147Press, W. H., Teulkolsky, S. A., Vetterling, W. T., & Flannery, B. P. 2007,
Numerical Recipes, 3rd edn. (Cambridge: Cambridge Univ. Press)Reiners, A. 2006, A&A, 446, 267Reiners, A., & Schmitt, J. H. M. M. 2003, A&A, 398, 647Roberts, D. H., Lehar, J., & Dreher, J. W. 1987, AJ, 93, 968Rodonò, M., Messina, S., Lanza, A. F., Cutispoto, G., & Teriaca, L. 2000, A&A,
358, 624Schwarz, G. 1978, The Annals of Statistics, 6, 461Sestito, P., & Randich, S. 2005, A&A, 442, 615Siess, L., Dufour, E., & Forestini, M. 2000, A&A, 358, 593Soderblom, D. R., Jones, B. F., Balachandran, S., et al. 1993a, AJ, 106, 1059Soderblom, D. R., Stauffer, J. R., Hudon, J. D., & Jones, B. F. 1993b, ApJS, 85,
315Stauffer, J. R., Caillault, J.-P., Gagne, M., Prosser, C. F., & Hartmann, L. W.
1994, ApJS, 91, 625Stauffer, J. R., Rebull, L. M., Carpenter, J., et al. 2005, AJ, 130, 1834Steenbeck, M., Krause, F., & Rädler, K.-H. 1966, Z. Naturforsch. 21a, 369Stetson, P. B. 2000, PASP, 112, 925Udry, S., Mayor, M., & Queloz, D. 1999, Precise Stellar Radial Velocities, in
IAU Colloq., 170, eds. J. B. Hearnshaw, & C. D. Scarfe, ASP Conf. Ser., 185,367
Uytterhoeven, K., Moya, A., Grigahcène, A., et al. 2011, A&A, 534, A125Voges, W., Aschenbach, B., Boller, T., et al. 1999, A&A, 349, 389Voges, W., Aschenbach, B., Boller, T., et al. 2000, IAU Circ., 7432Waite, I. A., Marsden, S. C., Carter, B. D., et al. 2011, MNRAS, 413, 1949
A146, page 16 of 16