astronomy c eso 2005 astrophysics - astrochemistry pah charge state ... po box 299, 2200 ag...
TRANSCRIPT

A&A 432, 515–529 (2005)DOI: 10.1051/0004-6361:20040331c© ESO 2005
Astronomy&
Astrophysics
PAH charge state distribution and DIB carriers: Implicationsfrom the line of sight toward HD 147889�,��
R. Ruiterkamp1, N. L. J. Cox2, M. Spaans3, L. Kaper2, B. H. Foing4, F. Salama5, and P. Ehrenfreund2
1 Leiden Observatory, PO Box 9513, 2300 RA Leiden, The Netherlandse-mail: [email protected]
2 Institute Anton Pannekoek, Kruislaan 403, 1098 SJ Amsterdam, The Netherlands3 Kapteyn Astronomical Institute, PO Box 800, 9700 AV Groningen, The Netherlands4 ESA Research and Scientific Support Department, PO Box 299, 2200 AG Noordwijk, The Netherlands5 Space Science Division, NASA Ames Research Center, Mail Stop 245-6, Moffett Field, California 94035, USA
Received 25 February 2004 / Accepted 29 September 2004
Abstract. We have computed physical parameters such as density, degree of ionization and temperature, constrained by alarge observational data set on atomic and molecular species, for the line of sight toward the single cloud HD 147889. Diffuseinterstellar bands (DIBs) produced along this line of sight are well documented and can be used to test the PAH hypothesis.To this effect, the charge state fractions of different polycyclic aromatic hydrocarbons (PAHs) are calculated in HD 147889as a function of depth for the derived density, electron abundance and temperature profile. As input for the construction ofthese charge state distributions, the microscopic properties of the PAHs, e.g., ionization potential and electron affinity, aredetermined for a series of symmetry groups. The combination of a physical model for the chemical and thermal balance ofthe gas toward HD 147889 with a detailed treatment of the PAH charge state distribution, and laboratory and theoretical dataon specific PAHs, allow us to compute electronic spectra of gas phase PAH molecules and to draw conclusions about therequired properties of PAHs as DIB carriers. We find the following. 1) The variation of the total charge state distribution of eachspecific class (series) of PAH in the translucent cloud toward HD 147889 (and also of course for any other diffuse/translucentcloud) depends strongly on the molecular symmetry and size (number of π electrons). This is due to the strong effects ofthese parameters on the ionization potential of a PAH. 2) Different wavelength regions in the DIB spectrum are populatedpreferentially by different PAH charge states depending on the underlying PAH size distribution. 3) The PAH size distributionfor HD 147889 is constrained by the observed DIB spectrum to be Gaussian with a mean of 50 carbon atoms. 4) For the givenPAH size distribution it is possible to constrain the total small catacondensed PAH column density along the line of sight toHD 147889 to 2.4 × 1014 cm−2 by comparing the total observed UV extinction to the strong UV absorptions of neutral PAHsin the 2000−3000 Å region. 5) Catacondensed PAHs with sizes above some 40 C-atoms are expected to show strong DIBSlongward of 10 000 Å. Large condensed PAHs in the series, pyrene, coronene, ovalene, .... , on the other hand, mainly absorbbetween 4000 and 10 000 Å but extrapolation to even larger pericondensed PAHs in this series also shows strong absorptionslongward of 10 000 Å. 6) Only the weak DIBs in HD 147889 could be reproduced by a mix of small catacondensed PAHs(<50 C atoms) while for large pericondensed PAHs (50 < C atoms < 100) the intermediate DIBs are well reproduced. Smallcatacondensed PAHs cannot contribute more than 50% of the total observed equivalent width toward HD 147889. Strong DIBscan only be reproduced by addition of very specific PAH molecules or homologue series to the sample set (i.e., a small numberof PAHs with high oscillator strength or a large number of PAHs with a low oscillator strength). An outline is provided for amore general application of this method to other lines of sight, which can be used as a pipeline to compute the spectroscopicresponse of a PAH or group of PAHs in a physical environment constrained by independent (non-DIB) observations.
Key words. ISM: clouds – ISM: abundances – ISM: individual objects: HD 147889 – ISM: molecules
� Based on observations made at the European SouthernObservatory, Paranal, Chile (ESO programs 67.C-0281 and64.H-0224).�� Appendices A–C are only available in electronic form athttp://www.edpsciences.org
1. Introduction
1.1. General considerations
The properties and nature of the carrier(s) of diffuse in-terstellar bands (DIBs) have so far resisted unambiguousidentification (Herbig 1995). An important step forward hasbeen the PAH hypothesis (Leger & d’Hendecourt 1985;
516 R. Ruiterkamp et al.: PAH charge state distribution and DIB carriers: HD 147889
van der Zwet & Allamandola 1985; Salama et al. 1996), inwhich large polycyclic aromatic hydrocarbons (PAHs) are re-sponsible for (at least some) of the many DIB features that areobserved toward many diffuse and translucent clouds. In thispaper we try to test this hypothesis for the line of sight towardHD 147889.
The DIB phenomenon can be roughly divided into twoseparate lines of research. First, laboratory experiments pro-vide ionization potentials, electron affinities, absorption bandstrengths and wavelengths, etc. for possible carrier molecules,such as PAHs, fullerenes or carbon chains. Second, any givencandidate will contribute to the global DIB spectrum depend-ing on its abundance as well as ionization and hydrogenationstate which in turn is determined by the overall chemical andthermal balance of the interstellar cloud under consideration.
Hence, in order to apply the laboratory results, one needsaccurate information on the physical characteristics of inter-stellar gas. In this work we try to combine experimental data ona number of PAHs with an accurate description of the physicalstate of an interstellar cloud, e.g., density, electron abundance,and temperature. By constraining the physical parameters ofthe line of sight as well as possible we can draw conclusionson the required microscopic properties of DIB carriers, suchas ionization potential, molecular structure, and number ofπ electrons.
1.2. Model constraints on DIB properties
There are thus two ways in which we can constrain the prop-erties of DIB carriers. In the specific case of HD 147889 alarge observational data set is modeled. Computed physicalproperties of the cloud, e.g., molecular content, temperature,density, internal UV flux, and degree of ionization; all as afunction of extinction, can be used to determine the charge bal-ance of PAH molecules along the line of sight. If PAH cationsare responsible for (some of) the DIB features (Leger &d’Hendecourt 1985; van der Zwet & Allamandola 1985) thenwe would expect their ionization balance to be crucial in theexplanation of DIB properties.
A more general approach is to model the strength of theinternal UV field for a wide range of radiative models that en-compass all diffuse and translucent clouds in terms of extinc-tion and mean density, temperature, and electron abundance.Subsequently, we can compute the ionization stages of PAHsand other putative carriers for which ionization potentials andelectron affinities are known (based on group symmetric prop-erties) in a statistical manner. In this work we will concentrateexclusively on the former approach since an excellent data setis available for the line of sight toward HD 147889 that allowsus to constrain the physical properties of the cloud quite welland to compute electronic spectra.
1.3. Ionization fraction in diffuse clouds
Over the last decades many authors have worked on the chal-lenges involved in calculating the reaction rates for grainand PAH chemistry in the ISM. It has become evident that
PAHs constitute an important part of the complex ensemble ofmolecules in the many different astronomical environments ob-served, like HII regions, reflection nebulae, molecular, and dif-fuse clouds. Omont (1986), via infra-red emission, estimatedthe PAH abundance in the ISM to be of the order of 10−7
(per H atom). PAHs are estimated to be the most abundantmolecules in the ISM after H2 and CO.
From previous studies (e.g., Le Page et al. 2003; Allainet al. 1996a,b; Bakes & Tielens 1994; Omont 1986, and ref-erences therein) it is clear that hydrogenation and ionizationare important for interstellar PAH chemistry. The PAH ion-ization fraction, or more extensively, the PAH charge state(cation, neutral and anion) distribution is important for theproposition put forward by van der Zwet & Allamandola(1985) and Leger & d’Hendecourt (1985) that the positivelycharged PAHs could be the carriers of the visible DIBs. Omont(1986) noted that for diffuse and translucent clouds the typi-cal values for the UV radiation field (χ in units of 108 pho-tons cm−2 ster−1 s−1 or IUV in units of the Draine field), theelectron density ne, and the gas temperature T yield environ-mental conditions that are favorable to the ionization of PAHs(i.e., if χ/ne ≤ 104/T1/2). Therefore, in diffuse and translu-cent clouds, small effects in the environmental parameters canhave significant consequences for the specific PAH charge statedistribution. In these photoionization-dominated regions, thePAH charge is mostly positive, and also limited to a single el-ementary charge e. Nevertheless, we feel that it is prudent toinclude the negatively charged PAHs. In Sect. 4 we will derivethe 3-charge state distribution for PAHs in the translucent cloudHD 147889.
In the remainder of this paper we will only discuss the ef-fects of cloud parameters and PAH characteristics on the chargestate distribution. Therefore, for simplicity and clarity, we re-frain from implementing the hydrogenation processes. Notethat, although hydrogenation is important in the carbon chem-istry of the ISM, it does not greatly alter the calculations for thecharge state distribution.
This paper is organized as follows. Section 2 summarizesthe observations available for HD 147889. In Sect. 3 we presenta model that reproduces most of the atomic and molecular linedata for HD 147889 and thus constrains the ambient physicalparameters. The PAH charge balance in HD 147889 for variouspoint groups is discussed in Sect. 4. We refer the reader to theAppendix for the details on the adopted reaction rates and theionization potential derivations. Section 5 presents electronicPAH spectra for HD 147889 based on the results of the pre-vious sections and for various PAH size distributions. The ba-sic PAH data set and the condensed homologue series for thecations of pyrene, ovalene and coronene are considered. Thesemodel spectra are compared to the available DIB observationsof HD 147889 in Sect. 6. Section 7 summarizes and discussesour results.
2. The translucent cloud toward HD 147889
HD 147889 is a B2V star, with a luminosity L� ≈ 5300 L�,V = 7.9, B − V = 0.83, distance d = 136 pc, and an effec-tive temperature of 22 000 K (Liseau et al. 1999). HD 147889

R. Ruiterkamp et al.: PAH charge state distribution and DIB carriers: HD 147889 517
Table 1. Properties of HD 147889 and telluric standard.
Target Ra (J2000) Dec (J2000) V (mag) B (mag) E(B−V) Vrad Sp. type
HD 147889 16 25 24.3167 –24 27 56.568 7.95 8.66 1.09 –4 B2III/IV
HD 166934 18 13 40.8 –18 49 30 8.8 8.6 0.06 +16 B2IV/V
Table 2. LSR velocities (VLSR), temperatures (TA) and integrated temperatures (∫
TA dV) of observed radio lines toward HD 147889. Forreferences see footnote of Table 3. The rightmost column gives the values from our model as described in Sect. 3.
Element Line VLSR TA
∫TA dV Ref. Modela
(km s−1) (K) (K km s−1) (K km s−1)12CO (1–0) 2.9 10.2 22.1 1,2 22.912CO (2–1) 14.0 1 14.812CO (3–2) 2.8 4.3 10.1 1 10.413CO (1–0) 2.9/3.3 1.5 2.3 1/2 2.2
C18O (1–0) 3.2 0.075 0.12 2 0.10
C2 Excitation 55 ± 15 1 64 K
nH > 500 cm−3 1200 cm−2
a Model (abundance) values for∫
TA dV , except for model values for T (K) and nH for the C2 excitation.
illuminates the western edge of the ρ Oph cloud. It is situatedin a cavity in its surroundings created by its own eroding UVradiation. The translucent cloud toward HD 147889 has a red-dening of E(B−V) = 1.09 mag Federman & Lambert (1988)quote for HD 147889: nH = 1000 cm−3 and T = 25 K. Thisrenders this line of sight quite opaque so that we expect the in-ternal UV radiation field and hence also the abundances of thePAH charge states to vary significantly with depth . The gasphase carbon abundance toward HD 147889 is assumed to be≈1.4×10⁻⁴, the typical diffuse ISM value (Cardelli et al. 1996).Our own cloud model for HD 147889 (Sect. 3) gives slightlydifferent values for the physical parameters. This star is locatedsuch that only a single cloud component is in the line of sight,giving the unique opportunity to easily model the density andradiation environment in the cloud.
2.1. Observational overview
The region toward HD 147889 has been observed ubiquitouslyby many authors (cf. Tables 3 and 6). Recently, in September2001, HD 147889 was also observed with the Very LargeTelescope (VLT) using the ultra-violet echelle spectrograph(UVES) as well as, in April 1999, with the ESO 1.52-m tele-scope with the fiber-fed extended range optical spectrograph(FEROS). In Table 1 we list some basic properties of the target(HD 147889) and the unreddened standard star that is used tocorrect for telluric lines. With the FEROS instrument we ob-tained spectra with a signal-to-noise (S/N) up to 160, and a res-olution R of about 75 000. Complementary and partly overlap-ping UVES spectra have S/N ∼ 200−300, and R ∼ 115 000.Unfortunately, for the spectral range longwards of 6500 Å theUVES spectra suffer significantly from small scale fringing.This fringing effect is known to appear in UVES red arm expo-sures of bright objects. Most of the region degraded by fring-ing was also covered with FEROS, for which the spectra do not
show any such fringing. In addition, there are numerous telluriclines longwards of 7000 Å. For most of the spectral range thetelluric lines could be removed successfully through divisionby the unreddened reference star. Lines that were obscured be-fore suddenly appear, although the achieved S/N is lower.
In Tables 2 and 3 we list literature values for abundances(and/or equivalent widths) of a large number of species ob-served in the translucent cloud toward HD 147889. We re-measured the strongest DIBs in the spectrum and listed theequivalent widths (including those from the literature) inTable 6.
3. Physical and chemical models for the lineof sight toward HD 147889
Models for the chemical and thermal balance of HD 147889were constructed using the Monte Carlo code as describedin Spaans (1996) and Spaans & van Dishoeck (1997). Thereader is referred to these papers for a detailed description.Here a summary is provided of the physical processes included.The chemical network is based on the UMIST compilation(cf. Le Teuff et al. 2000) and is driven by ion-molecule re-actions, typical of diffuse and translucent clouds. The self-shielding transitions of H2 and CO (as well as their iso-topes) have been included in detail (van Dishoeck & Black1988). Heating is provided by photo-electric emission fromdust grains (Bakes & Tielens 1994) and cosmic rays. Coolingby fine-structure lines of [C ] 609, [C ] 158 and [O ] 63 µmas well as rotational lines of CO has been included under statis-tical equilibrium with optical depth effects treated according toan escape probability formalism (Spaans et al. 1994). The mostrecent, but historically always uncertain, H+3 recombination rateof McCall et al. (2003) has been used.
The parameters of the models considered here are the to-tal hydrogen density, assumed to be constant and given bynH = n(H)+2n(H2), the strength of the impinging UV radiation

518 R. Ruiterkamp et al.: PAH charge state distribution and DIB carriers: HD 147889
Table 3. Abundances of species observed toward HD 147889. Foreach of the observed species we list the central wavelength of the linein air (λ line), equivalent width (EW) and the observed and predictedcolumn densities (N). The rightmost column gives the values from ourmodel as described in Sect. 3 (see footnote a).
Element λ line EW log N Ref. log Na
(Å) (mÅ) (cm−2) (cm−2)
C I 1560.310 79 ± 40 16.2 3 15.9
C II 1334.532 240 ± 40 17.1 3 17.0
Mg I 2852.127 225 ± 25 14.7 3 14.4
Mg II 2802.704 457 ± 25 15.8 3 15.9
Al II 1670.787 275 ± 40 15.3 3 15.4
Si II 1808.012 90 ± 27 15.5 3 15.6
S I 1807.341 38 ± 25 15.0 3 14.8
S II 1259.520 96 ± 40 16.9 3 17.0
Fe I 3020.643 <34 <13.5 3 12.3
Fe II 2599.395 276 ± 55 15.6 3 15.8
CN 3874.608 26.8 ± 0.6 13.46 4 13.49
CN N(0) 13.28 ± 0.01 8
CN N(1) 12.97 ± 0.01 8
CN Ntotal 13.45 ± 0.02 8
CH 3886.410 20.7 ± 0.7 14.18 4 14.15
CH 4300.3 14.0 ± 0.04 5, 7
CH 4300.3 13.99 8
CH+ 4232.548 25.8 ± 0.4 13.59 4 12.51
CH+ 4232.54 13.55 8
C3 4051.5 12.6 4 12.5
C3 4051.6 <12.4 5
C2 (2-0) 14.3 ± 0.05 5, 7 14.20
OH ≥14.30 13.75
H2 J = 0 20.48 ± 0.15 6 20.44
H2 J = 1 19.85 ± 0.15 6 19.91
References:1 van Dishoeck et al. (1991).2 Gredel et al. (1994).3 Snow & Joseph (1985).4 Haffner & Meyer (1995).5 Oka et al. (2003).6 Savage et al. (1977).7 Thorburn et al. (2003).8 Cardelli & Wallerstein (1986).a Modeled abundances for several key species in the cloud as de-scribed in Sect. 3. A few of the observed exotic metals are not pre-dicted by our model, and hence not included in this table.
field in units of the Draine radiation field, IUV, the abundancesof metals and PAHs, the total visual extinction, AV, dust proper-ties (opacity, albedo en phase function) and the geometry of thecloud. In all cases the Henyey-Greenstein phase function andgrain parameters have been adopted (Roberge et al. 1991). ForHD 147889 an observed extinction curve (Karl Gordon, privatecommunication) is available with RV = 4.22. Note that the ob-served RV value is substantially different from the generic valueof 3.1. The observed dust properties are used for the detailed
Fig. 1. Normalized UVES spectra of the Na I (D1 and D2) and K I(7698.98 Å) interstellar lines toward HD 147889. The Na I line is sat-urated (from the D1 and D2 line ratio) but the K I line is not. Bothlines show only one narrow velocity component, indicative of a singlecloud structure in this line of sight.
radiative transfer model. The model clouds are assumed to behomogeneous and symmetric, and have a total visual extinctionof 4.6 mag, i.e., 2.3 mag to the center.
Observational data suggest that the line of sight towardHD 147889 is a single cloud that has a fairly simple kinematicstructure, i.e., it has one velocity component, based on Na I andK I (see Fig. 1) and CO measurements (van Dishoeck et al.1991; Gredel et al. 1994). Therefore, the assumed model prop-erties of the cloud are justified.
In order to assess the goodness of the model fit a grid ofmodels is constructed for different values of nH and IUV. Theconstraints for the fit are provided by the observed intensitiesof 12CO, 13CO and C18O, as well as CH and CN (see Tables 3and 6, and references therein). The quality of the fit is computedby normalization of the sum of the squared deviations. It isfound that the UV radiation field and the ambient density areconstrained quite well, within 20%. In all, given the large bodyof data that can be reproduced quite well, with the exception ofthe generally anomalous CH+ abundance, our characterizationof the physical conditions toward HD 147889 is reliable.
In Tables 3 and 6 we compare the observed and mod-eled abundances for some key species present in the cloud.The agreement is quite good for HD 147889 and our modelgives: nH = 1200 ± 200 cm−3, IUV = 11 ± 2. The temper-ature (Tgas) and electron density (xe) gradients are shown inFig. 2. These values will be adopted in our charge state distri-bution calculations for HD 147889 (Sect. 4 and onwards) andwe believe them to be accurate enough to draw conclusions onthe PAH charge state balance along the line of sight towardHD 147889.
4. The PAH charge state distribution in HD 147889
In our model we calculate the charge state distribution (frac-tions of anions, neutrals and cations) of a particular PAHthroughout a diffuse or translucent cloud with a given ex-tinction AV, electron fraction structure and geometry (slab orsphere). We select the appropriate formalisms (e.g., for reaction

R. Ruiterkamp et al.: PAH charge state distribution and DIB carriers: HD 147889 519
0 0.5 1 1.5 2 2.5
Extinction in cloud (from edge to center)
0
5e-05
0.0001
0.00015
x(e)
x(e) in HD147889
0 0.5 1 1.5 2 2.5
Extinction in cloud (from edge to center)
0
50
100
150
Tem
pera
ture
(K
)
Gas temperature gradient in HD147889 cloud
Fig. 2. Temperature T (solid line) and electron abundance xe (dottedline) as a function of optical depth AV (to the center of the cloud).
rates) from Le Page et al. (2001, 2003), Allain et al. (1996b),Salama et al. (1996), Bakes & Tielens (1994), Allamandolaet al. (1989) and Omont (1986).
The charge state distribution is calculated via the differentreaction rates, which in turn are a function of PAH charge Z,extinction in the cloud AV, total extinction of the cloud AVtotal,total hydrogen density nH (i.e., related to electron density ne
through xe), gas temperature Tgas and specific PAH. The choiceof the PAH determines the ionization potential IPZ , electronaffinity EA, UV absorption cross section σUV and electronsticking coefficient s(e). We will use s(e) = 1 in the remain-der of this paper, unless explicitly stated otherwise. The elec-tron fraction is given by the electron density distribution of themodeled cloud HD 147889 (Sect. 3), and is shown in Fig. 2. Werun our model for the predicted total hydrogen density and in-terstellar radiation field range derived for HD 147889 in Sect. 3.
In effect, choosing a specific PAH (i.e., adopting valuesfor IPZ , NC, s(e)) directly limits the number of free parame-ters. Thus, for a specific PAH, the charge state distribution de-pends only on the photon flux N(E), the electron density ne andthe gas temperature Tgas. For the diffuse interstellar radiationfield we use an extension of the Draine field (Draine 1978) byAllain et al. (1996a), who provide an analytical (polynomial)expression.
This approximation of the interstellar radiation fieldslightly overestimates the average interstellar radiation fieldas measured by Gondhalekar et al. (1980). It is evident thatthis uncertainty in the exact radiation field affects the chargestate distribution calculations. However, since the UV radiationfield IUV derived from the model for HD 147889 is expressedin units of the Draine field, with an error of 10%; this effect isnegligible compared to the uncertainties in the reaction rates asdiscussed in Appendix A. For a general diffuse cloud we wouldhave no a priori knowledge of the interstellar radiation field.Fortunately, for the computation of accurate absolute valuesfor f (Z), detailed chemical and physical constraints were ob-tained for HD 147889 (Sect. 3). The derived diffuse UV field isthen multiplied with the radiative transfer grid for this specificcloud (see Sect. 3). The radiative transfer grid varies with AV,
0 10 20 30 40 50 60 70 80 90 100
Number of carbon atoms
0
0.1
0.2
0.3
0.4
0.5
0.6
0.7
tota
l cha
rge
stat
e fr
actio
n
PG 4Z = 0
Z = +1
Z = -1
PG 3
PG 15
Fig. 3. Total integrated charge fraction of the cation, neutral and anioncharge fractions for a given PAH molecule as a function of its numberof π electrons, i.e., number of carbon atoms (NC), for the translucentcloud toward HD 147889 with nH = 1200 cm−3. For clarity only theresults for three point groups are displayed; solid lines for PG 4 (D2h
acene series), dashed lines for PG 3 (D2 ovalenes), and thin solid linesfor PG 15 (Cs benzo-acenes) (see also Table C.1). Other point groupshave intermediate values. Temperature and electron density gradientsare as in Fig. 2. Figure 4 shows the effects on the charge state fractionsof changes in nH and IUV and Fig. 5 the effects of a different cloudgeometry.
and so does the diffuse UV field passing through the cloud, andthus also the charge state distribution.
For these calculations we will assume that the PAH distri-bution in the cloud does not perturb the parameters that char-acterize the cloud. This means that the reaction rates remainunchanged in the calculations. We also assume that the averagetime for destruction of the PAH is at least an order of magnitudelarger than the time needed to reach a charge state equilibrium.In Appendix A we describe how we calculate the necessary re-action rates and how these are used to derive the charge statedistribution. Furthermore, we will show in Appendix B thederivation of ionization potentials as a function of point groupand number of carbon atoms. The point group of a molecule isdefined in group theory as the characteristic set of symmetryoperations for that molecule.
It is important to realize that all rates and ionization poten-tials are uniquely determined for each type of PAH (i.e., pointgroup), and thus require separate calculations. The results ofthese calculations (Appendix A) with the different values for IP(Appendix B) are presented next.
In Figs. 3 to 5 we look at variations in the charge state dis-tribution f (Z) due to changes in the choice of point group, thehydrogen density, the UV radiation field and the cloud geom-etry, respectively. Figure 3 shows the relationship between thethe integrated cation, neutral and anion charge fraction and thenumber of carbon atoms in the PAH for three different pointgroups (3, 4 and 15, see Table B.1). All other PAH point groupshave charge state fraction curves that lie between those shownin Fig. 3. For all point groups, the cation fraction increaseswith size while the neutral and anion fractions decrease. Withineach point group, as the size of the PAH increases, the valueof the first ionization potential decreases. As a result, larger

520 R. Ruiterkamp et al.: PAH charge state distribution and DIB carriers: HD 147889
0 10 20 30 40 50 60 70 80 90 100
Number of carbon atoms
0
0.1
0.2
0.3
0.4
0.5
0.6
0.7
tota
l cha
rge
stat
e fr
actio
n
PG 4
Z = 0
Z = +1
Z = -1
nH1000
1200
1400
0 10 20 30 40 50 60 70 80 90 100
Number of carbon atoms
0
0.1
0.2
0.3
0.4
0.5
0.6
0.7
tota
l cha
rge
stat
e fr
actio
n
PG 4
Z = 0
Z = +1
Z = -1
Iuv
9
11
13
Fig. 4. Effect of variation in hydrogen density and IUV on the total integrated cation, neutral and anion fractions for the HD 147889 cloud(1/2 AV = 2.3 mag) as a function of the number of carbon atoms in point group 4. Temperature and electron density gradients as in Fig. 2.The top panel shows the fractions for three different hydrogen densities (nH = 1000, 1200 and 1400 cm−3), but with IUV = 11 kept fixed. Inthe bottom panel the situation is reversed. We fix nH = 1200 cm−3 and vary the interstellar radiation field (IUV = 9, 11 and 13 eV). In bothpanels the solid lines represent the derived model parameters, and the dashed or dotted lines the derived values plus or minus their associateduncertainties. It is evident that the errors in IUV and nH have a significant impact on the charge state distribution, making the distinction withother point groups less clear.
PAHs are more easily positively charged. The differences be-tween the different point groups are most pronounced for thecations and neutrals; the total fraction of cations can change bya factor 0.2 between different point groups. The propagationsof the uncertainty of the values for the cloud parameters nH
and IUV is shown in Fig. 4. The uncertainties (about 20%) in-troduced by nH and IUV (Sect. 3) give variations in the chargestate distribution of 15% or less. An increase in hydrogen den-sity (e.g., increased recombination rate) has a similar effect asa decrease of the UV radiation field (decreased ionization rate),and vice versa. For HD 147889 the choice of geometry (slab orsphere) affects the charge state distribution very little, i.e., lessthan 10% (Fig. 5). The density, radiation field and point groupshave similar quantitative effects on the charge state distribution.
5. Electronic spectroscopy of selected PAHs
The charge state fractions for each point group that were ob-tained from the modelling of PAHs toward HD 147889 wereused to calculate electronic spectra. Electronic (laboratory)spectra of gas phase PAH molecules are still not available forlarge PAH molecules. Matrix Isolation Spectroscopy resultsand quantum-mechanical calculations on PAH molecules willprovide us here with the information needed for the calculationof synthetic PAH spectra.
Weisman et al. (2003) and Halasinski et al. (2003) havecalculated the electronic transition symmetries and oscillatorstrength for a few specific neutral and monovalent PAHs us-ing elaborate computational routines (time dependent densityfunctional theory, TDDFT). In this study, where the focus ison the size and charge state distribution of a very large setof PAHs rather than on the energy resolution of a few spe-cific species, we have adopted a semi-empirical calculationroutine that permits a large set of data without using exten-sive computing capabilities. This routine, although not specif-ically suited for large molecular systems, has been used to
0 0.5 1 1.5 2
Extinction Av (mag)
0
0.2
0.4
0.6
char
ge s
tate
fra
ctio
n f(
Z)
Z = 0
Z = +1
Z = -1
Fig. 5. Cation, neutral and anion charge state distribution of a gen-eral PAH (Nc = 50 and IP = 7 eV) as a function of extinction towardHD 147889 for both slab (dashed) and sphere (solid) geometry. Thetraces shift vertically almost linearly with increasing/decreasing num-ber of carbon atoms. A change in Nc of 6 C atoms will result in a ver-tical shift of up to 0.1. This effects is largest for smaller PAHs sincethe ionization potential drops faster for small values of Nc. For largerPAHs, where the decrease in ionization potential is much smaller forincreasing Nc, the effect of further increasing the size is less apparent.
obtain UV/Visual spectroscopy information for a large numberof PAH molecules. The risk of missing some energy states byoversimplification inherent in this routine is not considered tobe a problem since only the lowest transition states were takeninto account. The choice of PAHs used here is predominantlybased on the availability of data on their ionization potential.
5.1. Semi-empirical calculations on neutraland ionized PAHs
Input coordinates for each of the PAHs given in Fig. C.1 weregeometrically optimized with a semi-empirical PM3 routineusing a Polak-Ribiere conjugate gradient method. Geometries
R. Ruiterkamp et al.: PAH charge state distribution and DIB carriers: HD 147889 521
of neutral PAHs and monovalent PAH ions were optimizedseparately. Following geometry optimization, electronic spec-tra were calculated with the semi-empirical ZINDO (Zerner’sIntermediate Neglect of Differential Overlap) routine. Thiselectronic structure routine has been parameterized for spectro-scopic properties of molecules. Calculations were performedwith the Restricted Hartree-Fock method with orbital over-lap weighting factors of 1.267 for σ−σ bonds and 0.510 forπ−π bonds and singly excited configuration interaction with10 occupied and 10 unoccupied molecular orbitals. We haveobtained the two lowest-energy allowed transitions for thefirst 10 benzene moieties in 12 homologue series of PAHs.We define a homologue series as a series of PAH moleculesthat differ only in respect to the number of benzene moi-eties but that all belong to the same point group. As an ex-ample note the progression in the acene homologue seriesbelonging to the D2h point group: benzene (C6H6), naphtha-lene (C10H8), anthracene (C14H10), ... Note that more thanone homologue series can belong to the same point group.As an example the acene homologue series and the con-densed PAH homologue perylene series: perylene (C20H12),tribenzo[de,kl,rst]pentaphene (C30H16), benzo[1,2,3-cd:4,5,6-c’d’]diperylene (C40H20),... both belong to the D2h point group.The PAH sample set consists of 15 different homologueseries divided over 7 point groups: D6h(1), D3h(1), D2(1),D2h(4), C2h(2), C2v(5) and Cs(1), where the number in paren-theses is the number of homologue series per point group.Calculated transition energies and oscillator strengths are givenin Table C.1.
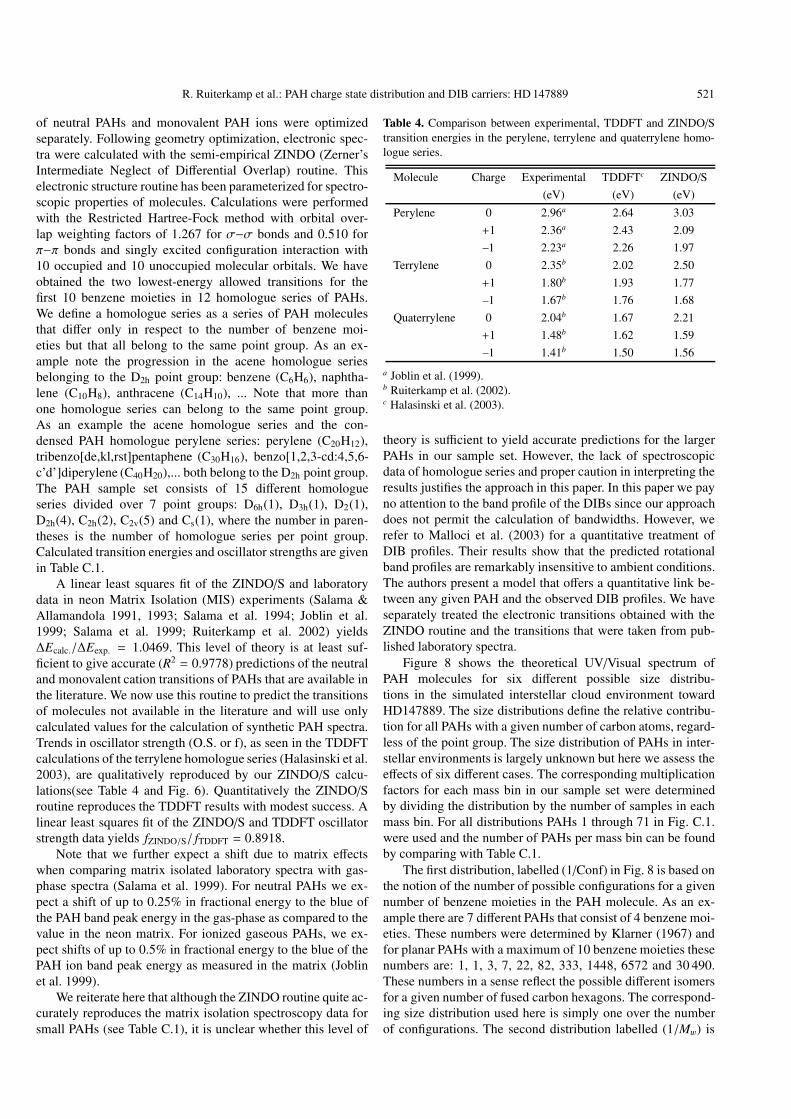
A linear least squares fit of the ZINDO/S and laboratorydata in neon Matrix Isolation (MIS) experiments (Salama &Allamandola 1991, 1993; Salama et al. 1994; Joblin et al.1999; Salama et al. 1999; Ruiterkamp et al. 2002) yields∆Ecalc./∆Eexp. = 1.0469. This level of theory is at least suf-ficient to give accurate (R2 = 0.9778) predictions of the neutraland monovalent cation transitions of PAHs that are available inthe literature. We now use this routine to predict the transitionsof molecules not available in the literature and will use onlycalculated values for the calculation of synthetic PAH spectra.Trends in oscillator strength (O.S. or f), as seen in the TDDFTcalculations of the terrylene homologue series (Halasinski et al.2003), are qualitatively reproduced by our ZINDO/S calcu-lations(see Table 4 and Fig. 6). Quantitatively the ZINDO/Sroutine reproduces the TDDFT results with modest success. Alinear least squares fit of the ZINDO/S and TDDFT oscillatorstrength data yields fZINDO/S/ fTDDFT = 0.8918.
Note that we further expect a shift due to matrix effectswhen comparing matrix isolated laboratory spectra with gas-phase spectra (Salama et al. 1999). For neutral PAHs we ex-pect a shift of up to 0.25% in fractional energy to the blue ofthe PAH band peak energy in the gas-phase as compared to thevalue in the neon matrix. For ionized gaseous PAHs, we ex-pect shifts of up to 0.5% in fractional energy to the blue of thePAH ion band peak energy as measured in the matrix (Joblinet al. 1999).
We reiterate here that although the ZINDO routine quite ac-curately reproduces the matrix isolation spectroscopy data forsmall PAHs (see Table C.1), it is unclear whether this level of
Table 4. Comparison between experimental, TDDFT and ZINDO/Stransition energies in the perylene, terrylene and quaterrylene homo-logue series.
Molecule Charge Experimental TDDFTc ZINDO/S
(eV) (eV) (eV)
Perylene 0 2.96a 2.64 3.03
+1 2.36a 2.43 2.09
–1 2.23a 2.26 1.97
Terrylene 0 2.35b 2.02 2.50
+1 1.80b 1.93 1.77
–1 1.67b 1.76 1.68
Quaterrylene 0 2.04b 1.67 2.21
+1 1.48b 1.62 1.59
–1 1.41b 1.50 1.56
a Joblin et al. (1999).b Ruiterkamp et al. (2002).c Halasinski et al. (2003).
theory is sufficient to yield accurate predictions for the largerPAHs in our sample set. However, the lack of spectroscopicdata of homologue series and proper caution in interpreting theresults justifies the approach in this paper. In this paper we payno attention to the band profile of the DIBs since our approachdoes not permit the calculation of bandwidths. However, werefer to Malloci et al. (2003) for a quantitative treatment ofDIB profiles. Their results show that the predicted rotationalband profiles are remarkably insensitive to ambient conditions.The authors present a model that offers a quantitative link be-tween any given PAH and the observed DIB profiles. We haveseparately treated the electronic transitions obtained with theZINDO routine and the transitions that were taken from pub-lished laboratory spectra.
Figure 8 shows the theoretical UV/Visual spectrum ofPAH molecules for six different possible size distribu-tions in the simulated interstellar cloud environment towardHD147889. The size distributions define the relative contribu-tion for all PAHs with a given number of carbon atoms, regard-less of the point group. The size distribution of PAHs in inter-stellar environments is largely unknown but here we assess theeffects of six different cases. The corresponding multiplicationfactors for each mass bin in our sample set were determinedby dividing the distribution by the number of samples in eachmass bin. For all distributions PAHs 1 through 71 in Fig. C.1.were used and the number of PAHs per mass bin can be foundby comparing with Table C.1.
The first distribution, labelled (1/Conf) in Fig. 8 is based onthe notion of the number of possible configurations for a givennumber of benzene moieties in the PAH molecule. As an ex-ample there are 7 different PAHs that consist of 4 benzene moi-eties. These numbers were determined by Klarner (1967) andfor planar PAHs with a maximum of 10 benzene moieties thesenumbers are: 1, 1, 3, 7, 22, 82, 333, 1448, 6572 and 30 490.These numbers in a sense reflect the possible different isomersfor a given number of fused carbon hexagons. The correspond-ing size distribution used here is simply one over the numberof configurations. The second distribution labelled (1/Mw) is

522 R. Ruiterkamp et al.: PAH charge state distribution and DIB carriers: HD 147889
Fig. 6. ZINDO-calculated wavelength as function of number of carbon atoms in the PAH molecule. For clarity each panel shows an exampleof the structure of a PAH in each homologue series as well as the spectral range where DIBs are found (shaded regions, ∼4000−10 000 Å).Squares indicate absorptions for PAH anions, circles for neutral PAHs and triangles for cation PAHs. The figure illustrates that for largermolecules (>40 C atoms) the lowest energy transitions fall outside the DIB range. Note that only for the picene homologue series (panel f)) dothe absorptions of cations and anions of larger PAHs (>50 C atoms) in this series still fall inside the DIB range.
the inverse of the molecular mass for each PAH per distribu-tion bin. All other cases are based on normalized Gaussiandistributions labelled (Gauss x/y) with x the center peak po-sition in number of carbon atoms and y the full width at halfmaximum (FWHM) in number of carbon atoms. Black bars inFig. 8 are associated with transition wavelengths of the neutralmolecules, red for negatively charged molecules (anions) andblue for positively charged PAHs (cations).
Note from Fig. 8 that the neutral absorptions of our PAHsbetween 3000 and 4000 Å dominate the spectrum. It is clearthat for a given column density of PAHs we expect a majorcontribution of the absorptions between 3000 and 4000 Å tothe UV spectrum of HD 147889. Only a hand full of DIBsare known below 4430 Å but we note that the spectral regionbetween 3000 and 4000 Å in our synthetic spectrum showsso many (neutral) PAH transitions in this spectral region thatwe can sum discrete contributions to a continuum band. Bycomparing the integrated optical depth of the UV extinctioncurve for HD 147889 (kindly provided by K. Gordon) in the3000−4000 Å region and the integrated optical depth of ourPAH transitions we could determine an upper limit for the con-tribution of our PAHs to the extinction curve. We expressed thePAH spectrum in terms of the optical depth (τλ) through:
τλ =π e2
me cf λ N (1)
where ( f ) is the oscillator strength (see Table C.1) of a tran-sition with center wavelength λ (Å) and N (cm−2) is thecolumn density of the molecule that shows this transition
(Spitzer 1978a). The constant π e2
me c = 2.654× 10⁻² cm2 s−1. Wehave assumed a peak profile that is simply a line at peak center(λ Å) and height f . When we assume that the total extinctionfor HD 147889 in this spectral region (3000−4000 Å) is com-pletely due to these PAHs we find an upper limit on the columndensity of the PAH molecules in our data set per distribution.
We can now draw general conclusions (see Sect. 6), on theeffects of the size distribution on the overall appearance of thesimulated spectrum compared to the measured DIB spectra to-ward HD 147889. All distributions in Fig. 8 were determinedfrom the maximum column density allowed when compared tothe extinction curve in the 3000−4000 Å range. The effects ofthe size (1/Configurations) distribution show (Fig. 8) that thesteepest declining distribution underestimates the contributionof larger PAHs. The DIB range is dominated by electronic ab-sorptions of only the smallest PAHs such as the anions of ben-zene, naphthalene, phenanthrene and anthracene. These smallPAHs are, however, expected to be less stable under the condi-tions in the diffuse interstellar medium. Hence, we do not con-sider this a realistic situation for the PAH size distribution to-ward HD 147889. The results for the 1/mass distribution showa similar result (Fig. 8), but with slightly higher contributionsfrom larger PAHs. However, this distribution still predicts thatlarge PAHs are not contributing and we discard it as a viablecandidate distribution too. Of all the Gaussian size distributionsthe one centered around 50 carbon atoms and FWHM of 25 car-bon atoms (Fig. 8) reproduces the observed DIB spectrum, (seethe top panel of Fig. 9) best although the agreement is not con-vincing to the eye.

R. Ruiterkamp et al.: PAH charge state distribution and DIB carriers: HD 147889 523
Table 5. Contributions of the ionization states to the total EW of the synthetic PAH spectrum.
Fraction 1/Conf 1/Mw Gauss25/25 Gauss50/25 Gauss50/50 Gauss100/50
Anion 0.22 0.30 0.29 0.37 0.34 0.37
Neutral 0.75 0.54 0.51 0.45 0.46 0.47
Cation 0.03 0.16 0.20 0.18 0.20 0.16
b
a
Fig. 7. Transition wavelength as a function of the number of carbonatoms for condensed series of PAHs. For clarity each panel shows anexample of the structure of a PAH in each homologue series as well asthe spectral range where DIBs are found (boxed regions). Squares in-dicate absorptions for PAH anions, circles for neutral PAHs and trian-gles for cation PAHs. For the condensed pyrene, coronene and ovaleneseries (panel b)) data were taken from Weisman et al. (2003) and showonly cation absorptions. The figure shows that for the condensed PAHsall transitions fall inside the spectral region where DIBs are found.We extrapolated the trend that is also apparent in the condensed seriesto include circumcircumcircumcoronene (C150H30) to show the maxi-mum size of PAHs within this homologue series.
We used the obtained column density to calculate a syn-thetic PAH spectrum for the Gauss(50/25) size distribution,shown in Fig. 9. For the size distribution with a Gaussian pro-file centered at 50 C atoms and with a FWHM of 25 C atomswe calculated a column density of 2.4 × 1014 cm−2 (seeEq. (1); f values have been taken from Table C.1). For this
column density these PAHs then contribute half of the observedEW (≥3.8 Å per unit reddening) for DIBs toward HD 147889.Thus, the UV absorption limits the column density of catacon-densed PAHs to less than 2.4 × 1014 cm−2 and such low col-umn densities result in less than 50% contribution to the visi-ble DIBs. Hence, catacondensed PAHs could not constitute thebulk of the DIBs. On the other hand they could still be a majorcontributor to the DIBs observed toward HD 147889.
Table 5 shows the contribution of the different chargestates for the chosen size distributions to the total EW of thePAH spectrum. These values show that even though the totalcation fraction can be close to 50% (see Fig. 3) the contribu-tion of these cations to the total EW is only 20%. It is impor-tant to keep in mind that our PAH sample set does not includeany molecules with more than 42 carbon atoms. However, evenfor the Gaussian size distribution centered at 100 carbon atomsthere is a non-zero contribution of small PAHs (<42 C atoms)to the total EW.
5.2. Matrix Isolation Spectroscopy and TDDFT results
To fully exploit the presented model we have entered pub-lished electronic spectra of large PAHs into our model forHD 147889 (Salama & Allamandola 1991; Ehrenfreund et al.1992; Salama & Allamandola 1993; Salama et al. 1994;Joblin et al. 1999; Salama et al. 1999; Halasinski et al. 2000;Ruiterkamp et al. 2002). These laboratory spectra were takenat low temperatures (∼4 K) in inert neon matrices and thespectra closely resemble the gas phase values of the elec-tronic transitions. Recently published TDDFT calculations(Weisman et al. 2003; Halasinski et al. 2003) were alsoentered into our routine. These homologue series comprisethe coronene (C24H12 [72]), circumcoronene (C54H18 [74])and circumcircumcoronene (C96H24 [75]) series; the ovalene(C32H14 [73]), and circumovalene (C66H20 [76]) series; thepyrene (C16H10 [22]), circumpyrene (C42H16 [77]) and cir-cumcircumpyrene (C80H22 [78]) condensed series of PAHs;and the perylene (C20H12 [14]), terrylene (C30H16 [15]) andquaterrylene (C40H20 [16]) condensed series. Individual entriesof PAHs are naphthalene (C10H8 [5]), anthracene (C14H10 [6]),phenanthrene (C14H10 [36]), pentacene (C22H14 [8]), decacy-clene (C36H18 [79]), Dibenzo[a, jk]phenanthro[8,9,10,12-cdefgh]pyranthrene (C44H20 [80]) and dicoronylene(C48H20 [81]). For each entry the corresponding numberin Fig. C.1 is given in brackets. Figure 10 shows the resultsfor these PAHs in our model for HD 147889 with a Gaussiansize distribution with center at 50 C atoms and a width of50 C atoms. The treatment of these data is identical to thetreatment used for the ZINDO results except that we scaledthe total EW of these PAHs to match the total EW of the

524 R. Ruiterkamp et al.: PAH charge state distribution and DIB carriers: HD 147889
Table 6. Equivalent widths (mÅ) for the strongest DIBs inHD 147889. Where appropriate the spectrum was corrected for tel-luric lines with a standard star spectrum (see also Sect. 2.1). Crosses(x) indicate that part of the spectrum was not covered or not of suffi-cient quality (e.g., fringing or telluric lines) to derive values or upperlimits for DIBs. Dashes (–) indicate that the DIB was not detected, be-cause it was too weak or the S/N was not high enough. The 5780/5797ratio is ∼2.3.
FEROSb UVESc Literature
DIB EW (mÅ) EW (mÅ) EW (mÅ) Ref.d
4066 – –
4180 – –
4430 1400 ± 140
4501 99 ± 6 77 ± 6
4595 – –
4665 – –
4726 118 ± 11 x
4728 88 ± 9 x
4762 25 ± 5 x 46 ± 4 1
4963a 55 ± 5 55 ± 3 55 ± 2 1
4984a 26 ± 3 22 ± 3 25 ± 1 1
5170 x 14 ± 3
5175a 33 ± 1 32 ± 3 25 ± 1 1
5512a 26 ± 1 21 ± 2 19 ± 1 1
5544 28 ± 1 x 22 ± 1 1
5705 58 ± 4 x 97 ± 4 1
5720 32 ± 3 x
5769a 15 ± 5 x 17.5 ± 1.5 1
5780 350 ± 10 x 377 ± 8 1
5797 120 ± 20 x 163 ± 5 1
5844 16 ± 4 x
5850 90 ± 10 78 ± 2
6011 x 20 ± 5
6090 x 19 ± 3
6113 18 ± 7 15 ± 3 16 ± 1 1
6196 40 ± 4 40 ± 2 46 ± 2 1
6203+6204 93 ± 8 100 ± 6 95 ± 7 1
6270 ≤52 60 ± 15 56 ± 3 1
6284 ≥250 430 ± 40 530 ± 50 1
6353 x 14 ± 6
6376 30 ± 5 x 64 ± 2 1
6379 68 ± 5 81 ± 3 93 ± 2 1
6425 – x 7.5 ± 1 2
6613 165 ± 10 181 ± 2 180 ± 5 1
6660 x 30 ± 1
6729a 20 ± 3 26 ± 8 17.5 ± 1 1
6993 ≤30 20 ± 5
7224 ≤60 35 ± 6
8026 x ≤8
9577 x ≤44 C+60
9632 x ≤70 C+60
Table 6. continued.
FEROSb UVESc Literature
DIB EW (mÅ) EW (mÅ) EW (mÅ) Ref.d
11 798 x x
13 175 x x
Interstellar
CaII K 98 ± 5 76 43.5 ± 0.7 3
CaII H 37 ± 4 x 36.1 ± 0.8 3
CaI 4226. 11 ± 3 (8.5 ± 0.3) 7.3 ± 0.4 3
CH+ 4232.22 25 ± 3 (26 ± 1) 25.8 ± 0.4 3
CH 4299.995 44 ± 3 (45 ± 2) 48.8 ± 0.4 3
Na I D1 253 ± 5 221 ± 10 290 2
Na I D2 188 ± 5 193 ± 10 210 2
K I 7664.33 95 ± 6 93 ± 3
K I 7698.39 78 ± 4 81 ± 3
a C2 DIBs (Thorburn et al. 2003).b DIB EW values from our FEROS spectra.c DIB EW values from our VLT/UVES spectra.d Reference literature values taken from:1 Thorburn et al. (2003).2 Cohen (1973).3 Haffner & Meyer (1995).
DIB range (4000−8000 Å) toward HD 147889. Since wehave no information on the oscillator strengths of neutralpericondensed PAH transitions we cannot scale the columndensity for large PAHs to the extinction curve (as discussedin Sect. 5.1). Figure 10 shows a comparison of PAH tran-sitions at two different scales while the top panel showsthe equivalent widths of diffuse interstellar bands measuredtoward HD 147889. Since we used published matrix isolationspectroscopy data and quantum-mechanical computations wecannot compare the peak positions in a straightforward way.
6. Results: Properties of the synthetic PAH spectra
As presented in Figs. 9 and 10 our model reproduces thegeneral features of the DIB spectrum for HD 147889 onlypoorly. For the semi-empirical calculations on PAHs depictedin Fig. 8 we can identify three regions. The short-wavelengthpart (2000−4000 Å) is dominated by neutral PAH transi-tions that strongly contribute to the total absorption for mostof the considered size distributions. The next wavelengthrange (4000−10 000 Å) shows minor contributions from neu-tral PAH molecules but predominantly cation transitions withsome strong contributions from PAH anions. The last wave-length range longwards of 10 000 Å shows predominantly an-ion contributions with a large number of cation contributions.Observations in this spectroscopic region are severely hinderedby absorption lines due to the Earth’s atmosphere. Althoughcurrently no space based observatory is available for this spec-tral region we expect that in the future a large number of newDIBs will be found longwards of 10 000 Å with high resolutionspectrographs in the near-IR.

R. Ruiterkamp et al.: PAH charge state distribution and DIB carriers: HD 147889 525
Fig. 8. Comparison of the effects of different size distributions on the calculated UV/Visual spectrum of the 71 PAHs listed in Table C.1, forall transitions between 2000 and 14 000 Å for HD 147889. Black bars indicate electronic transitions of the neutral molecule, red bars indicateelectronic transitions of anions and blue bars indicate electronic transitions of cations calculated with the semi-empirical ZINDO/S routine. Thepanels show different size distributions: 1/Conf is based on the notion of different configurations of PAHs for a given number of carbon atoms;1/Mw is a size distribution based on molecular mass; Gauss x/y indicates a Gaussian size distribution with center position x and width y innumber of carbon atoms. We conclude from this selection of size distributions that the Gauss 50/25 distribution is the most likely one. Detailsare explained in Sect. 5.1.
The strongest absorptions in the calculated DIB spectrum(Fig. 9) are from the largest PAHs in the D2h, C2v and Cs pointgroups. That there is such a poor agreement between the ob-served DIB spectrum and our PAH spectrum does not meanthat small PAHs with up to 40 carbon atoms cannot contributeat all to the DIBs. In fact we probe only a small portion of thepossible PAH molecules with up to 40 carbon atoms. We seethat specific PAH point groups and PAH sizes could give riseto strong DIBs. It is the identification of these special PAH se-ries or species that guides our efforts.
Although we cannot assign any DIBs to specific PAHswe can compare the relative contributions for strong DIBs(EW > 100 mÅ), intermediate DIBs (50 < EW < 100 mÅ)and weak DIBs (EW < 50 mÅ). For HD 147889 we find arelative ratio for the number of strong/intermediate/weak DIBsof 1/1.5/3.3. Note that the detected DIBs only provide a lowerlimit. As much as twice the number of small DIBs is predictedfrom comparing with other sources that have been observed athigher signal to noise ratios. For the semi-empirical calculatedDIB spectrum we find a relative ratio of 1/1.5/70. We see thatthe DIB spectrum has a much smaller contribution of weak fea-tures than the predicted PAH spectrum. The main contributionfrom our PAH sample set could thus be predominantly to theweak DIBs.
The synthetic PAH spectrum for the laboratory data andTDDFT calculations show a similar picture. As noted byWeisman et al. (2003) there is also a clear indication forprogression in the wavelength positions of the homologuecondensed PAHs (as determined by TDDFT calculations andshown in Fig. 7, panel b). When we extrapolate this trend tothe highest wavelengths where DIBs are found (∼10 000 Å),we find that the largest PAH in this homologue series that stillcould contribute to the DIB spectrum is circumcircumcircum-coronene (C150H30). For the catacondensed homologue series,shown in panel (a) of Fig. 7 and calculated with the ZINDOroutine, the larger PAHs will shift the absorption features fur-ther toward the infrared part of the spectrum and outside ofthe DIB range (Fig. 6). Note that only for the picene homo-logue series (panel f) the absorptions of cations and anions oflarger PAHs (>50 C atoms) in this series still fall inside theDIB range. For the condensed homologue series of PAHs thisshift is less prominent, such that even for large PAHs the mainabsorption lies within the known DIB range.
Note, however, that Fig. 4 indicates that the abundance ofcations is larger than 50% in HD 147889 if the size of the PAHsis larger than 50 carbon atoms. This indicates that the cationsin the condensed homologue series may form a dominant partof the DIB spectrum, provided that our choice of electron
526 R. Ruiterkamp et al.: PAH charge state distribution and DIB carriers: HD 147889
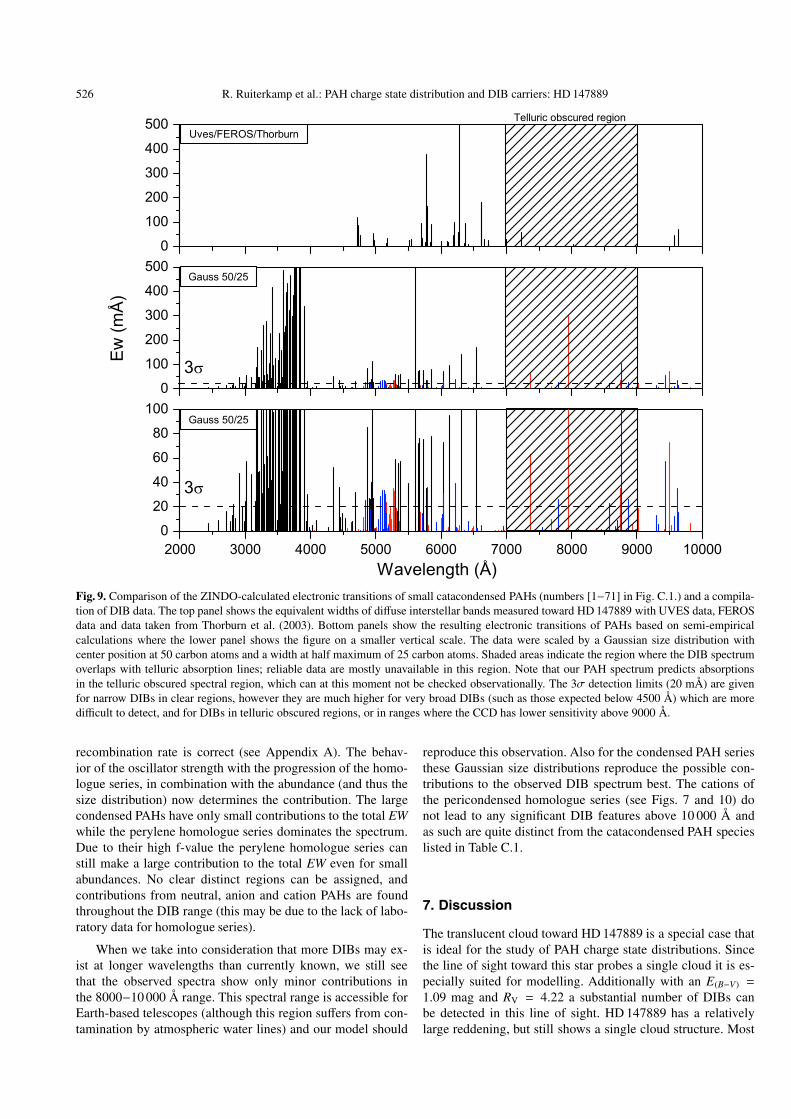
Fig. 9. Comparison of the ZINDO-calculated electronic transitions of small catacondensed PAHs (numbers [1−71] in Fig. C.1.) and a compila-tion of DIB data. The top panel shows the equivalent widths of diffuse interstellar bands measured toward HD 147889 with UVES data, FEROSdata and data taken from Thorburn et al. (2003). Bottom panels show the resulting electronic transitions of PAHs based on semi-empiricalcalculations where the lower panel shows the figure on a smaller vertical scale. The data were scaled by a Gaussian size distribution withcenter position at 50 carbon atoms and a width at half maximum of 25 carbon atoms. Shaded areas indicate the region where the DIB spectrumoverlaps with telluric absorption lines; reliable data are mostly unavailable in this region. Note that our PAH spectrum predicts absorptionsin the telluric obscured spectral region, which can at this moment not be checked observationally. The 3σ detection limits (20 mÅ) are givenfor narrow DIBs in clear regions, however they are much higher for very broad DIBs (such as those expected below 4500 Å) which are moredifficult to detect, and for DIBs in telluric obscured regions, or in ranges where the CCD has lower sensitivity above 9000 Å.
recombination rate is correct (see Appendix A). The behav-ior of the oscillator strength with the progression of the homo-logue series, in combination with the abundance (and thus thesize distribution) now determines the contribution. The largecondensed PAHs have only small contributions to the total EWwhile the perylene homologue series dominates the spectrum.Due to their high f-value the perylene homologue series canstill make a large contribution to the total EW even for smallabundances. No clear distinct regions can be assigned, andcontributions from neutral, anion and cation PAHs are foundthroughout the DIB range (this may be due to the lack of labo-ratory data for homologue series).
When we take into consideration that more DIBs may ex-ist at longer wavelengths than currently known, we still seethat the observed spectra show only minor contributions inthe 8000−10 000 Å range. This spectral range is accessible forEarth-based telescopes (although this region suffers from con-tamination by atmospheric water lines) and our model should
reproduce this observation. Also for the condensed PAH seriesthese Gaussian size distributions reproduce the possible con-tributions to the observed DIB spectrum best. The cations ofthe pericondensed homologue series (see Figs. 7 and 10) donot lead to any significant DIB features above 10 000 Å andas such are quite distinct from the catacondensed PAH specieslisted in Table C.1.
7. Discussion
The translucent cloud toward HD 147889 is a special case thatis ideal for the study of PAH charge state distributions. Sincethe line of sight toward this star probes a single cloud it is es-pecially suited for modelling. Additionally with an E(B−V) =
1.09 mag and RV = 4.22 a substantial number of DIBs canbe detected in this line of sight. HD 147889 has a relativelylarge reddening, but still shows a single cloud structure. Most

R. Ruiterkamp et al.: PAH charge state distribution and DIB carriers: HD 147889 527
Fig. 10. Comparison of electronic transitions obtained from laboratory measurements or TDDFT quantum-mechanical calulations for largepericondensed PAHs (numbers [14−16] and [72−81] in Fig. C.1.) and a compilation of DIB data. The top panel shows the equivalent widthsof diffuse interstellar bands measured toward HD 147889 with UVES data, FEROS data and data taken from Thorburn et al. (2003). Bottompanels show a composite spectrum of PAHs that have been measured in the laboratory where the lower panel shows the figure at a smaller scale(Salama & Allamandola 1991; Salama et al. 1994; Ehrenfreund et al. 1992; Halasinski et al. 2000; Ruiterkamp et al. 2002) or calculated byTDDFT quantum-mechanical methods (Weisman et al. 2003; Halasinski et al. 2003). The 3σ detection limits (20 mÅ) are given for narrowDIBs in clear regions, however they are much higher for very broad DIBs (such as those expected below 4500 Å) which are more difficult todetect, and for DIBs in telluric obscured regions, or in ranges above 9000 Å where the CCD has lower sensitivity.
lines-of-sight with significant reddening (>0.5) show multiplecloud structure that is much more difficult to model.
We find that the charge state of specific PAHs at a certainextinction in the cloud depends on their ionization potentialwhich in turn depends on the molecular size (number of π elec-trons) and the molecular structure. The charge state due to theUV field at a certain extinction in the cloud has been deter-mined as a function of both the molecular size and structure.By integration over the line of sight toward HD 147889 we de-termined the total charge fractions and calculated a syntheticPAH spectrum for this object. We find that different wave-length regions in the DIB spectrum are populated preferentiallyby different PAH charge states. This also strongly depends onthe underlying PAH size distribution and molecular symme-try. For the catacondensed PAH sample set (with 10 to 40 car-bon atoms) we could constrain the distribution for HD 147889by the observed DIB spectrum and found a Gaussian distri-bution with a mean of 50 carbon atoms and a FWHM of25 carbon atoms. From the strong neutral PAH absorptions
between 3000 and 4000 Å we could constrain the total smallcatacondensed PAH abundance along the line of sight towardHD 147889 and found an upper limit of 2.4 × 10⁻⁸ comparedto the column density of hydrogen. Hence the contribution ofthese small catacondensed PAHs can never exceed half of thetotal EW observed in the DIB range along the line of sight to-ward HD 147889.
If the DIBs are traced by the catacondensed andmixed cata/pericondensed PAH homologue series (with 10 <C atoms < 50) then we predict that more DIB features shouldbe present longwards of 10 000 Å. Note that for PAHs smallerthan 40 C we expect a large range of partial dehydrogenation(Vuong & Foing 2000; Le Page et al. 2001). Therefore thesePAHs will appear in a large number of dehydrogenated statesand isomers, and their spectroscopic signature will be spreadover the spectrum in a number of small bands, probably belowthe detection threshold. If we assume that even larger PAHs thatbelong to these homologue series would dominate the distribu-tion, we see that their contributions would be well longwards

528 R. Ruiterkamp et al.: PAH charge state distribution and DIB carriers: HD 147889
of 10 000 Å. Figure 6 clearly shows this observation for the cat-acondensed PAH series (panels a through j). Therefore, if theDIBs are caused by the catacondensed PAHs we investigated,we would conclude that only PAHs up to 40 carbon atomscontribute. Note from panel f that this is not the case for thebenzo(c)picene homologue series. Larger catacondensed PAHcations and anions would have their strongest transitions in theinfrared part of the spectrum. For the mixed cata/pericondensedPAHs (panels k and l in Fig. 6) we find that if the pyrene unitis centered in the molecule, the ion absorptions for moleculesup to 50 carbon atoms still fall inside the DIB range (panel k).For the pericondensed PAHs (>40 C atoms) we find that thespectrum is dominated by the specific PAHs (perylene homo-logue series) while the bulk of the PAHs in the sample sethas contributions in the correct EW range. A mix of PAHscould reproduce the small DIBs (<50 mÅ) in the spectrum butnot the strong features. We summarize that only the weakerDIBs could be reproduced by a mix of small catacondensedand peri/catacondensed PAHs (<50 C atoms) or large pericon-densed PAHs (50 < C atoms < 100), but the strong DIBs canonly be reproduced by adding very specific PAH moleculesor homologue series to the sample set. Though the existenceof small PAHs cannot be excluded (Hudgins & Allamandola1999) their contribution to the DIB spectrum is less than 50%toward HD 147889.
When we compare the band positions with the PAH spec-tra to the DIB spectrum toward HD 147889 we observe thatthere is no direct alignment to any of the strong DIBs. Evenwhen we consider that semi-empirical calculation techniquesare know to over-estimate the energies for electronic transitionswe find that the only strong DIB that could align with a PAHtransition is found at 5780 Å. In this case the DIB at 5780 Åcould align with the strongest neutral transition of quaterrylene(benzo[1,2,3-cd:4,5,6-c’d’]diperylene,number 16 in Table C.1)at 5608 Å. This molecule has been measured in the labora-tory in a neon matrix (Ruiterkamp et al. 2002) and shows thestrongest neutral, cation and anion transitions at 607.9, 833.7and 881.8 nm, respectively. Toward HD 147889 we find noDIBs that match these wavelength positions or relative inten-sities for the neutral, cation and anion bands. This agrees withour previous conclusion (Ruiterkamp et al. 2002) that it is un-likely that quaterrylene contributes to the DIBs. It is clear fromthe expected shifts between calculated and measured absorp-tions that no identification of the small DIBs is possible. Wenote however that from Fig. 6 it is easy to determine whichtransitions of what PAH fall inside the DIB range.
In principle, the procedure used in this work can be appliedto any line of sight, provided that the physical model for thecloud is reliable. This procedure can also be used to generateDIB spectra for alternative molecular carriers such as carbonchains. In order to draw geometry-independent conclusions, alarge number of lines of sight should be modeled, providedthat their impact parameter distribution can be determined. Onewould then have to resort to mean values of the density, electronabundance, and temperature in the physical model which wouldlimit the ability to identify individual features. Nevertheless,this method would lead to statistically more significant conclu-sions as far as the global characteristics of the DIB spectrum
are concerned. High resolution spectra for the spectral regionsthat are currently unaccessible because of telluric contamina-tion are of crucial importance to fully exploit the predictivepower of our procedure since many DIBs may be present atwavelengths longwards 10 000 Å.
Laboratory efforts should focus on homologue series tobetter constrain the quantum-mechanical calculation efforts.As long as gas phase spectroscopic data remain unavailable,Matrix Isolation Spectroscopy experiments are a valuable al-ternative. Our results also indicate that the main focus for lab-oratory spectroscopy should be on larger condensed homo-logue PAH series that represent better candidates for the DIBs.The discrepancy between the increasing oscillator strength withincreasing size in the perylene homologue series (Halasinskiet al. 2003), which dominates the PAH spectrum in both Figs. 9and 10, and the decreasing oscillator strength in the pericon-densed PAH series (Weisman et al. 2003) show the importanceof studying these systems. High values for oscillator strengthsstand out in the simulated PAH spectrum, and since strongDIBs are observed, we predict that specific PAHs or homologueseries of PAHs with high oscillator strengths may be the under-lying carriers for these strong absorptions. Molecules with asmall oscillator strength contribute only to the DIB spectrum iftheir column density is large.
Apart from laboratory reference data there is an equal needfor theoretical quantum-mechanics data of PAH homologueseries for reliable oscillator strengths. The pipeline nature ofour procedure allows us to easily predict the spectroscopic re-sponse of a specific PAH or group of PAHs once these databecome available in the literature. To fully exploit the pipelinenature of our approach we plan to expand our PAH transi-tion database. Once we can use many more PAH transitionsit becomes useful to look for frequency matching betweenPAH transitions and DIBs. The current procedure does not yetincorporate mediating processes on the incorporated moleculessuch as dehydrogenation and destruction rates. This will be im-plemented in future work.
Acknowledgements. This research was conducted under SRONproject MG-049, NWO-VI and ESO programs 67.C-0281 and64.H-0224. The authors thank ESO for using the VLT, as wellas K. Gordon for providing the extinction curve of HD 147889.Furthermore, we thank the referee for his critical comments. Thisresearch has made use of: the SIMBAD database, operated atCDS, Strasbourg, France; and the NIST Chemistry WebBook, NISTStandard Reference Database Number 69, March 2003, ed. P. J.Linstrom and W. G. Mallard. The authors thank the referee, JohnMathis, for his insightfull and constructive comments.
References
Allain, T., Leach, S., & Sedlmayr, E. 1996a, A&A, 305, 602Allain, T., Leach, S., & Sedlmayr, E. 1996b, A&A, 305, 616Allamandola, L. J., Tielens, G. G. M., & Barker, J. R. 1989, ApJS, 71,
733Bakes, E. L. O., & Tielens, A. G. G. M. 1994, ApJ, 427, 822Boschi, R., Clar, E., & Schmidt, W. 1974, J. Chem. Phys., 60, 4406

R. Ruiterkamp et al.: PAH charge state distribution and DIB carriers: HD 147889 529
Boschi, R., Murrell, J. N., & Schmidt, W. 1972, Faraday Discuss.Chem. Soc., 54, 116
Brus, L. E. 1983, J. Chem. Phys., 79, 5566Cardelli, J. A., Meyer, D. M., Jura, M., & Savage, B. D. 1996, ApJ,
467, 334Cardelli, J. A., & Wallerstein, G. 1986, ApJ, 302, 492Clar, E., Robertson, J. M., Schlogl, R., & Schmidt, W. 1981, J. Am.
Chem. Soc., 103, 1320Clar, E., & Schmidt, W. 1975, Tetrahedron, 31, 2263Clar, E., & Schmidt, W. 1978, Tetrahedron, 34, 3219Clar, E., & Schmidt, W. 1979, Tetrahedron, 35, 1027Cockett, M., Ozeki, H., Okuyama, K., & Kimura, K. 1993, J. Chem.
Phys., 98, 7763Cohen, J. G. 1973, ApJ, 186, 149Draine, B. T. 1978, ApJS, 36, 595Ehrenfreund, P., D’Hendencourt, L., Verstraete, L., et al. 1992, A&A,
259, 257Federman, S. R., & Lambert, D. L. 1988, ApJ, 328, 777Gallegos, E. J. 1968, J. Phys. Chem., 72, 3452Gondhalekar, P. M., Phillips, A. P., & Wilson, R. 1980, A&A, 85, 272Gredel, R., van Dishoeck, E. F., & Black, J. H. 1994, A&A, 285, 300Haffner, L. M., & Meyer, D. M. 1995, ApJ, 453, 450Hager, J., & Wallace, S. 1988, Anal. Chem., 60, 4Halasinski, T. M., Hudgins, D. M., Salama, F., Allamandola, L. J., &
Bally, T. 2000, J. Phys. Chem. A, 104, 7484Halasinski, T. M., Weisman, J. L., Ruiterkamp, R., et al. 2003, J. Phys.
Chem. A, 107, 3660Herbig, G. H. 1995, ARA&A, 33, 1974Hudgins, D. M., & Allamandola, L. J. 1999, ApJ, 513, L69Joblin, C., Leger, A., & Martin, P. 1992a, ApJ, 393, L79Joblin, C., Leger, A., Martin, P., & Defourneau, D. 1992b, in
Astrochemistry of Cosmic Phenomena, IAU Symp., 150, 21Joblin, C., Salama, F., & Allamansola, L. J. 1999, J. Chem. Phys., 110,
7287Jochims, H. W., Baumgaertel, H., & Leach, S. 1996, A&A, 314, 1003Klarner, D. A. 1967, Canad. J. Math, 19, 851Le Page, V., Snow, T. P., & Bierbaum, V. M. 2001, ApJS, 132, 233Le Page, V., Snow, T. P., & Bierbaum, V. M. 2003, ApJ, 584, 316Le Teuff, Y. H., Millar, T. J., & Markwick, A. J. 2000, A&As, 146,
157Leger, A., & d’Hendecourt, L. 1985, A&A, 146, 81Liseau, R., White, G. J., Larsson, B., et al. 1999, A&A, 344, 342Malloci, G., Mulas, G., & Benvenuti, P. 2003, A&A, 410, 623McCall, B. J., Huneycutt, A. J., Saykally, R. J., et al. 2003, Nature,
422, 500
Nemeth, G., Selzle, H., & Schlag, E. 1993, Chem. Phys. Lett., 215,151
Oka, T., Thorburn, J. A., McCall, B. J., et al. 2003, ApJ, 582, 823Omont, A. 1986, A&A, 164, 159Roberge, W. G., Jones, D., Lepp, S., & Dalgarno, A. 1991, ApJS, 77,
287Ruiterkamp, R., Halasinski, T., Salama, F., et al. 2002, A&A, 390,
1153Salama, F., & Allamandola, L. J. 1991, J. Chem. Phys., 94, 6964Salama, F., & Allamandola, L. J. 1993, J. Chem. Soc. Faraday Trans.,
89, 2277Salama, F., Bakes, E. L. O., Allamandola, L. J., & Tielens, A. G. G. M.
1996, ApJ, 458, 621Salama, F., Galazutdinov, G. A., Krełowski, J., Allamandola, L. J., &
Musaev, F. A. 1999, ApJ, 526, 265273Salama, F., Joblin, C., & Allamandola, L. J. 1994, J. Chem. Phys.,
101, 10252Savage, B. D., Drake, J. F., Budich, W., & Bohlin, R. C. 1977, ApJ,
216, 291Schmidt, W. 1977, J. Chem. Phys., 66, 828Shahbaz, M., Akiyama, I., & LeBreton, P. 1981, Biochem. Biophys.
Res. Commun., 103, 25Shchuka, M., Motyka, A., & Topp, M. 1989, Chem. Phys. Lett., 165,
87Smith, F. T. 1961, J. Chem. Phys., 34, 793Snow, T. P., & Joseph, C. L. 1985, ApJ, 288, 277Spaans, M. 1996, A&A, 307, 271Spaans, M., Tielens, A. G. G. M., van Dishoeck, E. F., & Bakes,
E. L. O. 1994, ApJ, 437, 270Spaans, M., & van Dishoeck, E. F. 1997, A&A, 323, 953Spitzer, L. 1978a, Physical processes in the interstellar medium
(New York: Wiley-Interscience), 333Spitzer, L. J. 1978b, JRASC, 72, 349Stahl, D., & Maquin, F. 1984, Chem. Phys. Lett., 108, 613Thorburn, J. A., Hobbs, L. M., McCall, B. J., et al. 2003, ApJ, 584,
339van der Zwet, G. P., & Allamandola, L. J. 1985, A&A, 146, 76van Dishoeck, E. F., & Black, J. H. 1988, ApJ, 334, 771van Dishoeck, E. F., Phillips, T. G., Black, J. H., & Gredel, R. 1991,
ApJ, 366, 141Verstraete, L., Leger, A., D’Hendecourt, L., Defourneau, D., & Dutuit,
O. 1990, A&A, 237, 436Vuong, M. H., & Foing, B. H. 2000, A&A, 363, L5Weisman, J. L., Lee, T. J., Salama, F., & Head-Gordon, M. 2003, ApJ,
587, 256

R. Ruiterkamp et al.: PAH charge state distribution and DIB carriers: HD 147889, Online Material p 1
Online Material

R. Ruiterkamp et al.: PAH charge state distribution and DIB carriers: HD 147889, Online Material p 2
Appendix A: The PAH charge state distribution
Adopting a multiple charge model involves solving Eq. (A.8)from Bakes & Tielens (1994) which gives the probability offinding a grain (e.g., PAH) at charge Ze. Since we are onlyinterested in PAH anions, neutrals and cations, i.e., a 3-chargestate distribution, we have:
Z=+1∑
Z=−1
f (Z) = 1. (A.1)
Following the argument of Bakes & Tielens (1994) the contri-bution of the accretion rate of ions is neglected, i.e., it is muchlarger than the photodetachment rate. This then gives
f (1) = f (0)kion
krecand f (−1) = f (0)
ke
kph(A.2)
and we directly obtain f (0) from
f (0) =
(1 +
kion
krec+
ke
kph
)−1
(A.3)
where the four reaction rate coefficients are (in units of s−1):
– kion: the photoionization rate;– krec: the electron recombination rate;– ke: the electron attachment rate;– kph: the photodetachment rate.
If we know these reaction rates, it is then possible to calculate,from Eqs. (A.2) and (A.3), the charge state probability distri-bution. And since the reaction rates depend on AV, AVtotal (i.e.,via N(E, AV)), ne, Tgas and PAH, so does f (Z).
A.1. Rate coefficients of basic processes
In this paper we will adopt from the literature the followingequations for the four reaction rates. We also discuss brieflyour motivation for each choice.
photoionization rate (PAH + hν → PAH+ + e). For the pho-toionization rate (kion) we adopt (Le Page et al. 2001; Allainet al. 1996b):
kion =
∫ 13.6 eV
IPYion(E) σUV(E) NC N(E) dE (s−1) (A.4)
with
Yion(E) = 0.8 exp [−0.00128((14.89− IPcoronene)/
(14.89 − IPPAH)(E − 14.89))4 ] (A.5)
the ionization yield (Le Page et al. 2001; parametrization ofVerstraete et al. 1990), where the IP and E are in units of eV,and IPcoronene = 7.29 eV.
It is evident that laboratory measurements of the UV ab-sorption cross section and the ionization yield (and also elec-tron attachment) would be preferred over a general curve.Unfortunately at this point only limited data are available forindividual PAHs (e.g., Jochims et al. 1996). Therefore, untilmore data are available we will adopt, for consistency,σUV and
Yion curves that are based on studies of PAH mixtures (Joblinet al. 1992b).
The ionization potential is a strong function of the numberof π electrons and the molecular symmetry (Gallegos 1968).For the ionization potentials we use the values derived inAppendix B. The UV absorption cross section σUV(E) is givenper number of carbon atoms, and we adopt the general curvefrom Joblin et al. (1992a).
We agree with the analysis of Le Page et al. (2003) thatit is justified to use the same UV absorption cross section forboth neutrals and cations. Also, instead of considering only thephotons in the energy band 6−13.6 eV, Le Page et al. (2001)incorporate photons with energies ≤5 eV (i.e., they use the ex-tended Draine field), which we adopt here.
Electron recombination rate (PAH+ + e→ products). For theelectron recombination rate (krec) we use the following equa-tion from Le Page et al. (2003) and Salama et al. (1996):
krec = 3 × 10⁻⁷
(300T
)1/2s(e) ne (s−1) (A.6)
= C · N1/2C T−1/2 s(e) ne (s−1), (A.7)
where the constant C is derived from theoretical calculations orlaboratory measurements. For example, Le Page et al. (2003)use 3.5 × 10⁻⁷ for the recombination rate of naphthalene at300 K (3 × 10⁻⁷ s−1) or, instead, that of benzene (1 × 10⁻⁶,at 300 K), whereas other authors use still different values:2.7 × 10⁻⁵ (Omont 1986), 7.1 × 10⁻⁶ (Allain et al. 1996b) and2.4 × 10−5 (Vuong & Foing 2000).
We also adopt Le Page et al.’s conclusion that for smallPAH+ there is no significant evidence of size dependence. Itshould be noted that Vuong & Foing (2000) present an alter-native expression for the electron recombination rate, based onSpitzer (1978b) and Verstraete et al. (1990), that is applicable tolarger, NC > 30−50, PAHs. They point out that the Le Page ex-pression is more applicable to smaller PAHs. Use of the Vuong& Foing (2000) expression in our model for HD 147889 leadsto a PAH charge state distribution with almost no cations atthe edge of the model cloud. Since we find this result unlikely,we have chosen to use the Le Page expression for the electronrecombination rate.
The sticking coefficient s(e) of a PAH greatly depends on itselectron affinity EA (Allamandola et al. 1989). For larger EA(i.e., pericondensed PAHs with more than 20 C atoms) thesticking coefficient s(e) approaches unity (Salama et al. 1996;Allamandola et al. 1989). Allamandola et al. (1989) show s(e)as a function of NC. For smaller compact PAHs, s(e) can besmaller than ∼10−3−10−6. For coronene and pyrene, whichhave low electron affinities ≈ 0.6 eV, Salama et al. (1996)adopt a low sticking coefficient s(e) ≈ 10−3 (Allamandola et al.1989). Pentacene, on the other hand, has a higher electron affin-ity (1.1 eV) and thus a high sticking coefficient (s(e) = 1). Weuse the known electron affinity EA to estimate the sticking co-efficient s(e). For EA ≥ 1 eV we will use s(e) = 1 and forEA ≤ 0.1 we will use s(e) ∼ 10−3. When applying the fit re-sults (see Appendix B) we will adopt EA = 2.0 eV and s(e) = 1.

R. Ruiterkamp et al.: PAH charge state distribution and DIB carriers: HD 147889, Online Material p 3
Fig. B.1. Fit of Eqs. (B.2) or (B.3) to literature data for the ionization potential of specific PAH point groups. Values for fit parameters and χ2
are given in Table B.1.
Electron attachment rate (PAH + e− → PAH−). The elec-tron attachment rate (ke) produces the PAH anions. FollowingAllamandola et al. (1989) and Omont (1986) we also assumethat the electron attaches to the PAH at the Langevin rate.
kL = 2πe(α/me)1/2s(e) (cm3 s−1), (A.8)
where α is the polarizability of the neutral PAH, and e andme the electron charge and mass, respectively. There are differ-ent methods to derive the polarizability α. Omont (1986) givesα = 0.9(NC)3/2 Å3 for pericondensed (circular) PAHs and α =0.1(NC)3 Å3 for catacondensed (n-cenes) PAHs. According toAllamandola et al. (1989) a better estimate would be α =1.5× 10⁻²⁴ NC which gives kL = 1.2× 10⁻⁷N1/2
C s(e) (cm3 s−1).We adopt the Omont approximation of the electron attach-
ment rate ke:
ke = kL ne (s−1) (A.9)
= 9.8 × 10⁻⁸ N3/4C s(e) ne (s−1) (A.10)
Electron photodetachment rate (PAH−+hν→ PAH + e). Theelectron photodetachment rate (kph) is due to the absorption ofvisual or UV photons. Experimental values for σion are not ac-curately known, however; it is common practice to assume thatσneutral = σion ∼ 2 × 10⁻¹⁸ cm−2 per C atom. kph is given as
kph = σion NC Nph (s−1), (A.11)
with Nph the photon flux in the Draine field, between the pho-todetachment threshold (i.e., the electron affinity EA of theneutral) and 13.6 eV. For EA = 2.3 eV, Nph ≈ 1−10 × 108 pho-tons eV−1 cm−2 s−1.
Appendix B: Ionization potential of PAHs
The electronic spectrum of PAH radical ions shows distinctfeatures compared to the neutral spectrum. These features canbe attributed to one-electron excitations involving the occu-pancy of the singly occupied molecular orbital (Halasinskiet al. 2003). It has been proposed that these transitions are re-sponsible for the diffuse interstellar absorption bands (DIBs)(Salama et al. 1999; Allamandola et al. 1989; Bakes & Tielens1994).
The ionization state of interstellar PAHs determines theircontribution to the DIB spectrum.
The classical expression for the ionization potential of aPAH is
IPZ = w +
(Z +
12
)e2
CeV, (B.1)
with w the work function in eV, Z the charge number, e in esuand C the capacitance in cm. In terms of the number of carbonatoms NC for flat (α = 1/2) and spherical (α = 1/3) PAHsBakes & Tielens (1994) give:
IPZ = w +
(Z +
12
)A
NαCeV (B.2)
IPZ = w +
(Z +
12
)A
N13
C
eV (B.3)
were Bakes & Tielens (1994) adopt for the work function wthe value of graphite (4.4 eV Smith 1961). For the constant Athey derive 25.1 and 11.1 for the planar and spherical case,respectively. This is appropriate for an infinite graphite sheet

R. Ruiterkamp et al.: PAH charge state distribution and DIB carriers: HD 147889, Online Material p 4
Table B.1. Results for two-parameter fits of the literature data on PAH ionization potentials to Eqs. (B.2) and (B.3).
w + (Z + 1/2) A
N12
C
w + (Z + 1/2) A
N13
C
w A χ2 w A χ2
P.G. (eV) Err. (eV) Err. (eV) Err. (eV) Err.
1 4.40 0.00 8.22 0.61 0.1753 4.40 0.00 5.78 0.14 0.1750
2 5.03 0.39 8.12 1.34 0.0137 3.85 0.52 7.08 1.03 0.0108
3 4.76 0.14 7.26 0.30 0.0056 3.32 0.37 7.09 0.55 0.0193
4 3.73 0.11 7.11 0.27 0.0050 1.76 0.07 9.11 0.12 0.0001
5 4.14 0.02 8.34 0.01 0.0001 2.49 0.08 8.17 0.14 0.0018
6 5.36 0.28 6.38 0.78 0.0583 4.09 0.41 6.27 0.73 0.0531
7 5.53 0.41 5.92 0.99 0.0708 4.32 0.69 5.82 1.11 0.0909
8 4.92 0.28 7.16 0.72 0.0392 3.39 0.37 7.16 0.61 0.0290
9 5.05 0.28 6.89 0.63 0.0230 3.54 0.32 6.93 0.49 0.0138
10 5.62 0.00 5.92 0.01 0.0001 4.35 0.04 5.93 0.06 0.0001
11 4.84 0.32 7.25 0.80 0.0485 3.31 0.43 7.23 0.71 0.0388
12 5.10 0.13 6.81 0.33 0.0074 3.64 0.13 6.81 0.20 0.0029
13 5.37 0.02 6.32 0.04 0.0001 3.95 0.08 6.41 0.12 0.0070
14 4.96 0.26 7.01 0.67 0.0369 3.49 0.38 6.95 0.65 0.0355
15 4.51 0.34 7.90 0.84 0.0452 2.76 0.44 7.97 0.70 0.0316
(1) D6h coronenes (No. 72); (2) D3h tricyclenes (No. 2...); (3) D2 ovalenes (No. 73), (4) D2h acenes (No. 5...); (5) D2h perylenes (No. 14...);(6) D2h tetrabenzo-acenes (No. 17...); (7) D2h dibenzo-pyrenes (No. 23...); (8) C2h dibenzo-acenes (No. 26...); (9) C2h dibenzo-chrysenes(No. 33...); (10) C2v Picenes (No. 37...); (11) C2v dibenzo-acenes (No. 43...); (12) C2v Phenes (No. 49...); (13) C2v dibenzo-acenes (No. 52...);(14) C2v benzo-pyrenes (No. 59...); (15) Cs benzo-acenes (No. 65...). Numbers in parentheses refer to Table C.1.
but not necessarily for PAH molecules. Additionally, for a ma-terial with finite dielectric constant ε the second term has tobe multiplied by ε − 1/ε (Brus 1983). Table C.2 lists avail-able data for the IP and EA of PAHs arranged according to themolecular symmetry. The value of the ionization energy de-pends strongly on the molecular symmetry and the number ofπ-electrons in the PAH molecule (Gallegos 1968). For a largenumber of PAHs these values are known; for larger PAHs with40 ≤ NC ≤ 120 no data are currently available.
We therefore fitted the available data (Table C.2) for the IPof PAHs for different point groups with Eq. (B.2), where weassume that the work function w of graphite is not necessarilythe proper value for an infinitely large molecule within its pointgroup see Fig. B.1. Since the second term depends on geome-try we will fit this value without reference to the underlyinggeometry of the capacitor, or the dielectric constant. We thusassume that all the PAHs that we consider can be seen as ei-ther flat or spherical capacitors with undetermined geometry.This does not mean, however, that the PAH molecules them-selves are spherical – in fact all are flat un-curved molecules –we just indicate what geometry fits best the available data forthe ionization potential. In Table B.1 we summarize the val-ues of parameters w and A per point group. By assessing theχ2 value for the fit of experimental IP’s to the predicted IP’s
from Eqs. (B.2) and (B.3) we determine the best fit per pointgroup, and subsequently determine the most appropriate geo-metrical representation (smallest χ2).
The fitted values as shown in Table B.1 are used in theionization rate (Eq. (A.4)). They can also be used to obtainthe theoretical IP for PAHs with 50−100 carbon atoms. Theselarger PAHs are more likely to survive the harsh conditions ofinterstellar space. The strong absorption features in the cationand anion electronic spectra shift towards longer wavelengthfor larger molecules (Clar & Schmidt 1975). For each homo-logue series of PAHs (such as the homologue series perylene,terrylene, quaterrylene, ...) the main ionic absorption featureprogressively shifts towards the red. This effect causes the fea-ture to fall outside the spectral range where DIB features aredetected. There exists an upper limit for the size of a PAHper homologue series (and thus point group) that contributesto the DIBs. However, insufficient laboratory data are availableto predict this limit for each series. We also note that for largerPAHs the oscillator strength increases (Halasinski et al. 2003).The fitted IP curves now allow us to predict the IP of largePAHs in specific homologue series or point groups. Note thatSalama et al. (1996) from a survey of experimental data findan upper limit of 250 carbon atoms to the molecular size ofcondensed PAH ions that may contribute to the DIBs.

R. Ruiterkamp et al.: PAH charge state distribution and DIB carriers: HD 147889, Online Material p 5
Appendix C: Tables and PAH geometrical structures
Table C.1. ZINDO-calculated transition wavelengths λ(Å) and oscillator strength f . The numbers in Col. 1 refer to respective geometricalstructures in Fig. C.1. IP values for these PAHs are listed in Table C.2.
Neutral Cation AnionNo. Name Formula λ0 f λ0 f λ0 f
Å Å Å1 Benzene C6H6 1984.4 0.965 4698.3 0.017 7489.0 0.017
2960.0 0.111 3103.3 0.0982 Triphenylene C18H12 2770.0 1.380 6175.1 0.095 8694.0 0.0663 Trinaphthylene C30H18 3270.6 0.778 8491.0 0.112 10 229.1 0.192
3012.9 1.683 7506.8 0.161 7496.7 0.1034 Anthra[2,3-j]heptaphene C42H24 3786.5 0.061 10 478.9 0.150 11 373.6 0.119
3416.6 3.134 10 077.1 0.272 11 356.8 0.1325 Naphthalene C10H8 2949.7 0.127 6620.5 0.075 9415.4 0.063
2432.3 1.565 3864.2 0.106 4065.9 0.1036 Anthracene C14H10 3627.5 0.191 7075.5 0.141 8766.9 0.120
2709.2 2.394 4277.5 0.129 4470.3 0.1507 Naphthacene C18H12 4272.7 0.223 8153.1 0.201 9530.9 0.168
2959.2 3.115 4517.6 0.140 4738.4 0.2018 Pentacene C22H14 4846.1 0.247 9321.8 0.264 10 390.1 0.243
3180.8 3.760 4722.3 0.135 5009.3 0.2219 Hexacene C26H16 5332.5 0.268 10 597.1 0.337 11 423.8 0.309
3364.7 4.401 4875.1 0.137 5189.9 0.25810 Heptacene C30H18 5776.9 0.285 11 857.4 0.405 12 417.9 0.390
3520.8 4.963 4940.8 0.171 5242.9 0.28711 Octacene C34H20 6040.1 0.335 13 155.8 0.471 13 536.1 0.468
3651.6 5.460 4982.0 0.176 5285.6 0.28712 Nonacene C38H22 6313.7 0.367 14 478.7 0.535 14 660.4 0.545
3759.0 5.931 4990.1 0.182 5283.1 0.37813 Decacene C42H24 6537.7 0.400 15 818.7 0.594 15 838.0 0.621
3845.4 6.380 4975.4 0.165 5263.6 0.40114 Perylene C20H12 4095.0 0.716 5915.3 0.432 6290.0 0.44515 Tribenzo[de,kl,rst]pentaphene C30H16 4954.2 1.249 6951.3 0.935 7373.5 0.90516 Benzo[1,2,3-cd:4,5,6-c’d’]diperylene C40H20 5608.4 1.766 7798.4 1.572 7957.6 1.52017 Dibenzo[g,p]chrysene C26H16 3732.8 0.253 6236.2 0.122 8934.5 0.112
2821.7 1.685 5098.5 0.146 6116.5 0.13418 Tetrabenz[a,c,h,j]anthracene C30H18 3254.4 0.358 12 514.3 0.138 15 321.0 0.129
3186.3 1.947 8870.5 0.170 11 002.1 0.13319 Tetrabenzo[a,c,j,l]naphthacene C34H20 3757.5 0.052 11 060.8 0.273 12 367.6 0.235
3379.5 2.718 4916.7 0.220 4805.6 0.19820 Tetrabenzo[a,c,l,n]pentacene C38H22 4201.5 0.139 10 020.1 0.393 10 876.1 0.338
3506.3 3.636 6034.6 0.116 5048.4 0.19321 Tetrabenzo[a,c,n,p]hexacene C42H24 4685.5 0.208 10 432.8 0.467 11 118.8 0.427
3630.6 4.300 5713.9 0.106 5106.3 0.30822 Pyrene C16H10 3500.5 0.436 5747.9 0.174 8974.6 0.050
2584.1 1.599 3995.7 0.026 6252.9 0.18123 Dibenzo[fg,op]naphthacene C24H14 3423.0 0.086 9578.8 0.165 12 493.1 0.123
2795.9 1.418 4000.2 0.158 6835.7 0.03124 Dibenzo[hi,uv]hexacene C32H18 3189.0 3.670 35 464.5 0.124 48 079.6 0.107
2911.8 1.231 5926.3 0.110 7695.0 0.10025 Dibenzo[jk,a‘b’]octacene C40H22 3957.6 0.271 8706.1 0.029 219 842.6 0.061
3413.6 5.007 6213.4 0.261 8756.0 0.19026 Chrysene C18H12 3332.7 0.213 10 283.8 0.126 13 138.0 0.100
2855.5 2.078 6354.1 0.119 6269.5 0.10427 Dibenz[a,h]anthracene C22H14 3502.6 0.214 11 282.7 0.182 14 003.8 0.147
3092.9 2.247 4767.8 0.124 4632.3 0.08928 Dibenzo[a,j]naphthacene C26H16 3945.9 0.177 10 173.5 0.258 11 698.3 0.206
3288.3 3.015 4990.2 0.135 4736.6 0.107

R. Ruiterkamp et al.: PAH charge state distribution and DIB carriers: HD 147889, Online Material p 6
Table C.1. continued.
Neutral Cation AnionNo. Name Formula λ0 f λ0 f λ0 f
Å Å Å29 Dibenzo[a,l]pentacene C30H18 4461.1 0.201 10 121.1 0.336 1130.8 0.291
3458.6 3.632 5040.3 0.182 5149.8 0.14930 Dibenzo[a,n]hexacene C34H20 4924.7 0.242 10 121.1 0.336 11 565.3 0.368
3594.3 4.087 5040.3 0.182 5263.3 0.26331 Dibenzo[a,p]heptacene C38H22 5298.2 0.297 11 704.6 0.464 12 473.7 0.328
3723.3 3.127 5125.1 0.332 5312.7 0.29032 Dibenzo[a,r]octacene C42H24 5653.2 0.336 12 734.9 0.532 13 335.0 0.522
3771.8 5.389 5073.8 0.251 5295.9 0.25733 Dibenzo[b,k]chrysene C26H16 4241.4 0.361 15 168.1 0.277 18 300.9 0.233
3196.4 2.821 8048.2 0.047 8139.5 0.03434 Dinaphtho[b,k]chrysene C34H20 4446.6 0.411 22 892.4 0.395 26 410.5 0.355
3381.5 4.519 9915.2 0.028 9457.6 0.02835 Dianthra[b,k]chrysene C42H24 4866.8 0.537 35 994.2 0.454 39 115.1 0.429
3579.8 5.658 12 063.3 0.020 11 707.5 0.02036 Phenanthrene C14H10 3110.3 0.113 8218.5 0.055 11 056.1 0.059
2706.3 1.526 6110.2 0.118 6872.3 0.05137 Picene C22H14 3401.2 0.282 11 883.8 0.140 14 620.1 0.099
3002.1 2.383 6537.8 0.181 6476.0 0.11538 Benzo[c]picene C26H16 3488.9 0.424 15 297.5 0.217 19 119.3 0.166
3093.4 2.867 6617.3 0.186 6498.3 0.15839 Naphtha[c]picene C30H18 3532.9 0.612 16 096.8 0.192 18 630.0 0.106
3173.5 3.094 6414.9 0.161 6223.1 0.14940 Phenanthro[c]picene C34H20 3573.7 0.872 19 922.4 0.287 24 211.3 0.217
3242.0 3.385 6023.8 0.183 6008.2 0.18841 Dipicene C38H22 3602.8 1.245 20 258.9 0.179 28 440.0 0.155
3279.5 3.424 6036.5 0.239 5772.0 0.25742 Benzo[c]dipicene C42H24 3629.0 1.601 24 141.2 0.327 29 584.3 0.248
3324.1 3.563 5794.5 0.270 5682.5 0.20543 Benzo[b]triphenylene C22H14 3472.7 0.061 12 650.9 0.120 8384.4 0.073
3017.4 2.081 4997.1 0.053 4855.7 0.06744 Dibenzo[a,c]naphthacene C26H16 3982.4 0.134 9580.5 0.209 10 593.5 0.197
3217.7 2.846 5118.9 0.086 4944.9 0.13745 Dibenzo[a,c]pentacene C30H18 4530.2 0.183 9620.0 0.306 10 564.3 0.276
3387.0 3.544 5198.2 0.127 5191.9 0.16146 Dibenzo[a,c]hexacene C34H20 4958.7 0.252 10 444.0 0.380 11 365.3 0.352
3529.1 4.204 5163.7 0.251 5345.3 0.18147 Dibenzo[a,c]heptacene C38H22 5379.1 0.299 11 454.8 0.450 13 031.3 0.035
3650.9 4.829 5143.0 0.279 5205.0 0.21948 Dibenzo[a,c]octacene C42H24 5734.9 0.341 12 576.3 0.522 17 896.6 0.040
3747.9 5.385 5134.1 0.279 13 066.4 0.53049 Pentaphene C22H14 3576.7 0.098 22 049.6 0.047 24 838.8 0.050
3223.4 1.986 5098.3 0.224 5046.4 0.19350 Heptaphene C30H18 4025.6 0.106 9765.4 0.045 9042.6 0.220
3627.6 2.618 4938.9 0.274 5241.1 0.30951 Nonacene C36H22 4342.1 0.399 10 820.3 0.068 11 931.3 0.082
3908.1 3.191 8765.3 0.371 9501.0 0.33552 Benzo[c]phenanthrene C18H12 3371.7 0.019 8104.4 0.132 11 423.9 0.093
3019.8 1.379 4082.9 0.079 4474.1 0.07853 Dibenz[a,j]anthracene C22H14 3487.6 0.050 9334.0 0.198 11 328.5 0.149
3163.8 1.858 4533.0 0.056 4646.6 0.07954 Dibenz[a,h]naphthacene C26H16 3947.8 0.143 13 148.6 0.489 10 354.9 0.193
3356.8 1.893 4818.4 0.122 4985.6 0.16855 Dibenz[a,j]pentacene C30H18 4462.6 0.197 10 461.7 0.220 11 210.2 0.238
3428.6 2.879 5069.7 0.235 5156.9 0.206

R. Ruiterkamp et al.: PAH charge state distribution and DIB carriers: HD 147889, Online Material p 7
Table C.1. continued.
Neutral Cation AnionNo. Name Formula λ0 f λ0 f λ0 f
Å Å Å56 Dibenz[a,l]hexacene C34H20 4897.6 0.256 10 760.2 0.394 11 468.1 0.368
3579.9 4.197 5127.6 0.283 5222.9 0.27957 Dibenz[a,n]heptacene C38H22 5303.7 0.301 13 148.6 0.489 12 224.8 0.449
3695.0 4.900 4843.9 0.291 5600.9 0.07258 Dibenz[a,o]octacene C42H24 5663.1 0.339 12 761.8 0.530 13 302.7 0.530
3785.4 5.443 5098.2 0.315 5167.7 0.37759 Benzo[e]pyrene C20H12 2963.7 1.174 8434.4 0.017 10 682.4 0.085
3455.2 0.233 8384.6 0.10060 Dibenzo[de,qr]naphthacene C24H14 3211.1 1.631 10 324.2 0.072 12 690.8 0.68
3644.8 0.003 8713.3 0.056 7096.5 0.06761 Dibenzo[de,uv]pentacene C28H16 3954.2 0.079 9299.5 0.228 10 300.8 0.212
3408.9 2.176 5466.1 0.090 4534.3 0.14662 Dibenzo[de,yz]hexacene C32H18 4491.9 0.159 9439.9 0.311 10 385.2 0.291
3560.2 2.776 4673.7 0.191 4735.2 0.21063 Dibenzo[de,c’d’]heptacene C36H20 4932.6 0.237 10 335.8 0.396 11 083.6 0.370
3680.0 3.425 4076.7 0.792 4759.0 0.26564 Dibenzo[de,f’g’]octacene C40H22 5353.9 0.288 11 371.8 0.469 11 955.3 0.455
3776.2 4.068 4201.3 0.947 4820.4 0.29365 Benzo[a]anthracene C18H12 3537.4 0.154 8461.5 0.128 10 332.4 0.108
2995.6 1.486 6932.5 0.066 6967.8 0.03566 Benzo[a]naphthacene C22H14 4094.1 0.191 10 721.9 0.039 11 720.8 0.043
3153.4 2.197 8671.1 0.143 9817.5 0.15667 Benzo[a]pentacene C26H16 4646.2 0.221 10 693.7 0.030 10 967.8 0.127
3340.5 3.318 9633.4 0.270 10 620.7 0.15268 Benzo[a]hexacene C30H18 5145.5 0.249 13 078.7 0.029 12 890.1 0.028
3508.2 3.373 10 624.7 0.363 11 475.1 0.34069 Benzo[a]heptacene C34H20 5502.1 0.305 14 256.1 0.035 14 041.3 0.036
3618.3 4.591 11 735.1 0.432 12 417.3 0.41770 Benzo[a]octacene C38H22 5848.0 0.341 16 038.6 0.039 15 951.6 0.038
3738.4 4.076 12 967.3 0.495 13 427.7 0.49571 Benzo[a]nonacene C42H24 6136.0 0.376 18 294.3 0.037 18 187.2 0.038
3825.1 5.382 14 169.8 0.559 14 507.5 0.522

R. Ruiterkamp et al.: PAH charge state distribution and DIB carriers: HD 147889, Online Material p 8
Table C.2. First ionization potential (I.P.) for selected PAHs.
No. Name Symm. Formula I.P. Ref.Group (eV) Err.
1 Benzene D6h C6H6 9.24 <0.01 Nemeth et al. (1993)72 Coronene D6h C24H12 7.29 – Clar et al. (1981)2 Triphenylene D3h C18H12 7.88 0.02 Schmidt (1977)3 Trinaphthylene D3h C30H18 7.35 0.02 Schmidt (1977)4 Anthra[2,3-j]heptaphene D3h C42H24 6.85 0.02 Schmidt (1977)5 Naphthalene D2h C10H8 8.14 <0.01 Cockett et al. (1993)
73 Ovalene D2h C32H14 6.86 0.01 Boschi et al. (1972)6 Anthracene D2h C14H10 7.44 0.01 Hager & Wallace (1988)7 Naphthacene D2h C18H12 6.97 0.05 Stahl & Maquin (1984)8 Pentacene D2h C22H14 6.61 – Stahl & Maquin (1984)9 Hexacene D2h C26H16 6.36 – Clar et al. (1981)
14 Perylene D2h C20H12 6.96 <0.01 Shchuka et al. (1989)15 Tribenzo[de,kl,rst]pentaphene D2h C30H16 6.42 0.02 Clar & Schmidt (1978)
(terrylene)16 Benzo[1,2,3-cd:4,5,6-c’d’]diperylene D2h C40H20 6.11 0.02 Clar & Schmidt (1978)
(quaterrylene)17 Dibenzo[g,p]chrysene D2h C26H16 7.20 0.02 Clar & Schmidt (1978)18 Tetrabenz[a,c,h,j]anthracene D2h C30H18 7.43 0.02 Schmidt (1977)19 Tetrabenzo[a,c,j,l]naphthacene D2h C34H20 7.00 0.02 Schmidt (1977)20 Tetrabenzo[a,c,l,n]pentacene D2h C38H22 6.65 0.02 Schmidt (1977)22 Pyrene D2h C16H10 7.43 <0.01 Hager & Wallace (1988)23 Dibenzo[fg,op]naphthacene D2h C24H14 7.40 0.04 Boschi et al. (1974)24 Dibenzo[hi,uv]hexacene D2h C32H18 7.26 – Clar & Schmidt (1979)26 Chrysene C2h C18H12 7.60 0.03 Shahbaz et al. (1981)27 Dibenz[a,h]anthracene C2h C22H14 7.38 0.02 Schmidt (1977)28 Dibenzo[a,j]naphthacene C2h C26H16 6.99 0.02 Schmidt (1977)29 Dibenzo[a,l]pentacene C2h C30H18 6.64 0.02 Schmidt (1977)33 Dibenzo[b,k]chrysene C2h C26H16 6.98 0.02 Schmidt (1977)38 Benzo[c]picene C2h C26H16 7.36 0.02 Schmidt (1977)36 Phenanthrene C2v C14H10 7.89 <0.01 Hager & Wallace (1988)37 Picene C2v C22H14 7.51 0.02 Clar & Schmidt (1979)43 Benzo[b]triphenylene C2v C22H14 7.39 0.02 Clar & Schmidt (1979)44 Dibenzo[a,c]naphthacene C2v C26H16 6.97 0.02 Clar & Schmidt (1979)45 Dibenzo[a,c]pentacene C2v C30H18 6.62 0.02 Clar & Schmidt (1979)49 Pentaphene C2v C22H14 7.27 0.02 Clar & Schmidt (1979)50 Heptaphene C2v C30H18 6.89 0.02 Schmidt (1977)52 Benzo[c]phenanthrene C2v C18H12 7.60 0.02 Schmidt (1977)53 Dibenz[a,j]anthracene C2v C22H14 7.40 0.02 Schmidt (1977)59 Benzo[e]pyrene C2v C20H12 7.43 0.04 Boschi et al. (1974)60 Dibenzo[de,qr]naphthacene C2v C24H14 7.35 – Clar & Schmidt (1979)61 Dibenzo[de,uv]pentacene C2v C28H16 6.95 – Clar & Schmidt (1979)62 Dibenzo[de,yz]hexacene C2v C32H18 6.60 – Clar & Schmidt (1979)65 Benzo[a]anthracene Cs C18H12 7.46 0.03 Shahbaz et al. (1981)66 Benzo[a]naphthacene Cs C22H14 6.97 0.02 Schmidt (1977)67 Benzo[a]pentacene Cs C26H16 6.61 0.02 Schmidt (1977)

R. Ruiterkamp et al.: PAH charge state distribution and DIB carriers: HD 147889, Online Material p 9
Fig. C.1. Geometrical structures of sample PAHs. Numbers correspond to Table entries. Note that entries 72 and 73 are the structures ofcoronene and ovalene. Explicit hydrogens are not shown.