asst 1 example
TRANSCRIPT

8/8/2019 Asst 1 Example
http://slidepdf.com/reader/full/asst-1-example 1/14

8/8/2019 Asst 1 Example
http://slidepdf.com/reader/full/asst-1-example 2/14

8/8/2019 Asst 1 Example
http://slidepdf.com/reader/full/asst-1-example 3/14

8/8/2019 Asst 1 Example
http://slidepdf.com/reader/full/asst-1-example 4/14
8/8/2019 Asst 1 Example
http://slidepdf.com/reader/full/asst-1-example 5/14
8/8/2019 Asst 1 Example
http://slidepdf.com/reader/full/asst-1-example 6/14

8/8/2019 Asst 1 Example
http://slidepdf.com/reader/full/asst-1-example 7/14

8/8/2019 Asst 1 Example
http://slidepdf.com/reader/full/asst-1-example 8/14
EN 618
Assignment 1
Submitted by: Arun P
Roll No.: 04417001
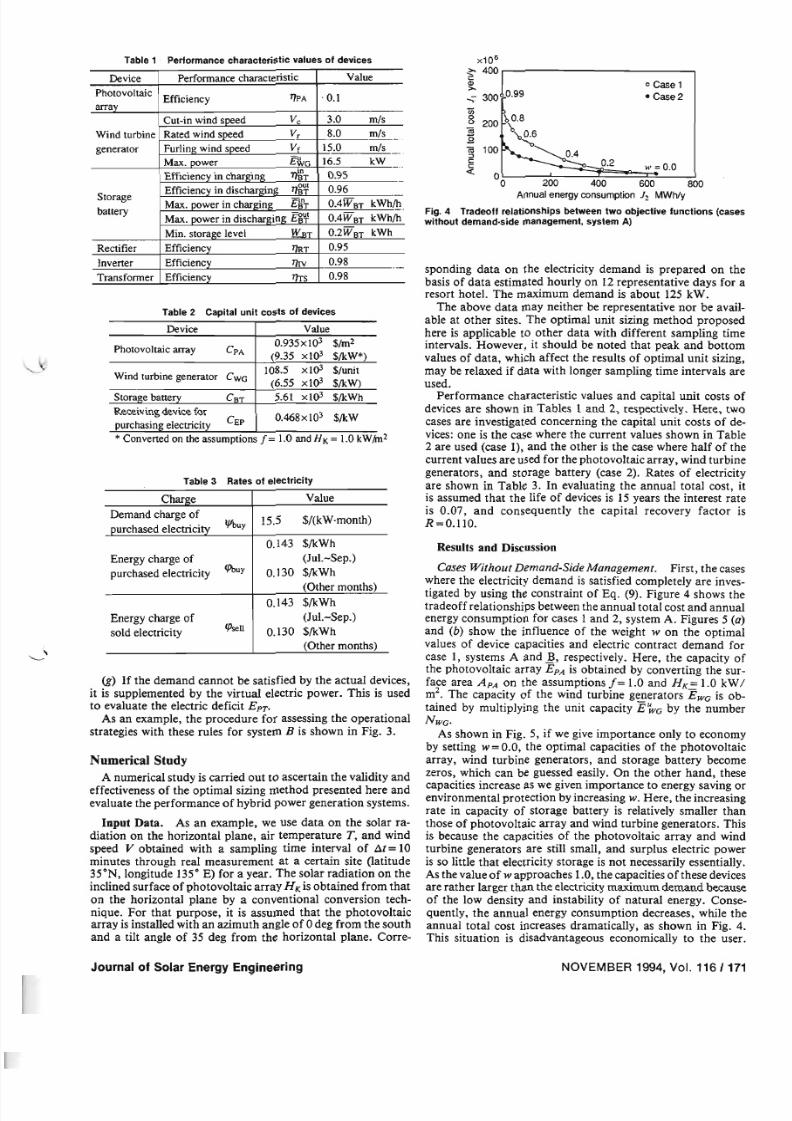
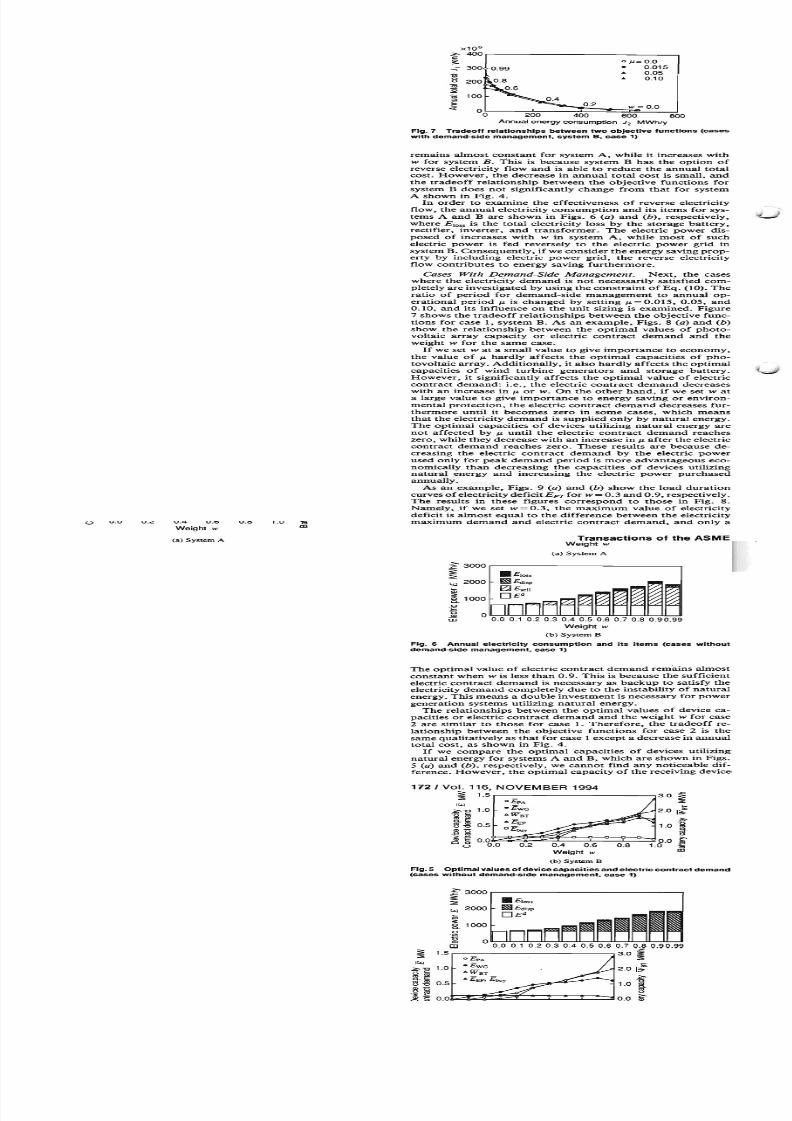
Title of the paper: Multiobjective optimal unit sizing of hybrid power generation systems
utilizing photovoltaic and wind energy
Authors: Ryohei Yokoyama, Koichi Ito, Yoshiro Yuasa
Journal: Journal of Solar Energy Engineering (Vol.116, November 1994)
Objective
The paper proposes a methodology for optimal system sizing of hybrid energy systems
involving photovoltaic and wind generators. An optimisation problem has been
formulated and solved to obtain the combinations of the system components subject to
optimum annual cost and energy consumption.
Decision context
Hybrid energy systems integrate different energy conversion devices which may
include conventional and renewable resources. The optimum design of such systems is
important because of the following factors:
(i) high capital cost and relatively low conversion efficiencies of the renewable energy
components in such systems
(ii) variability of the renewable resource with the weather conditions requires storage
systems to ensure a continuous energy supply
The designer is required to select the optimum component ratings for a given location and
specified load conditions such that the desired objective is satisfied subject to the limiting
constraints involved.
8/8/2019 Asst 1 Example
http://slidepdf.com/reader/full/asst-1-example 9/14
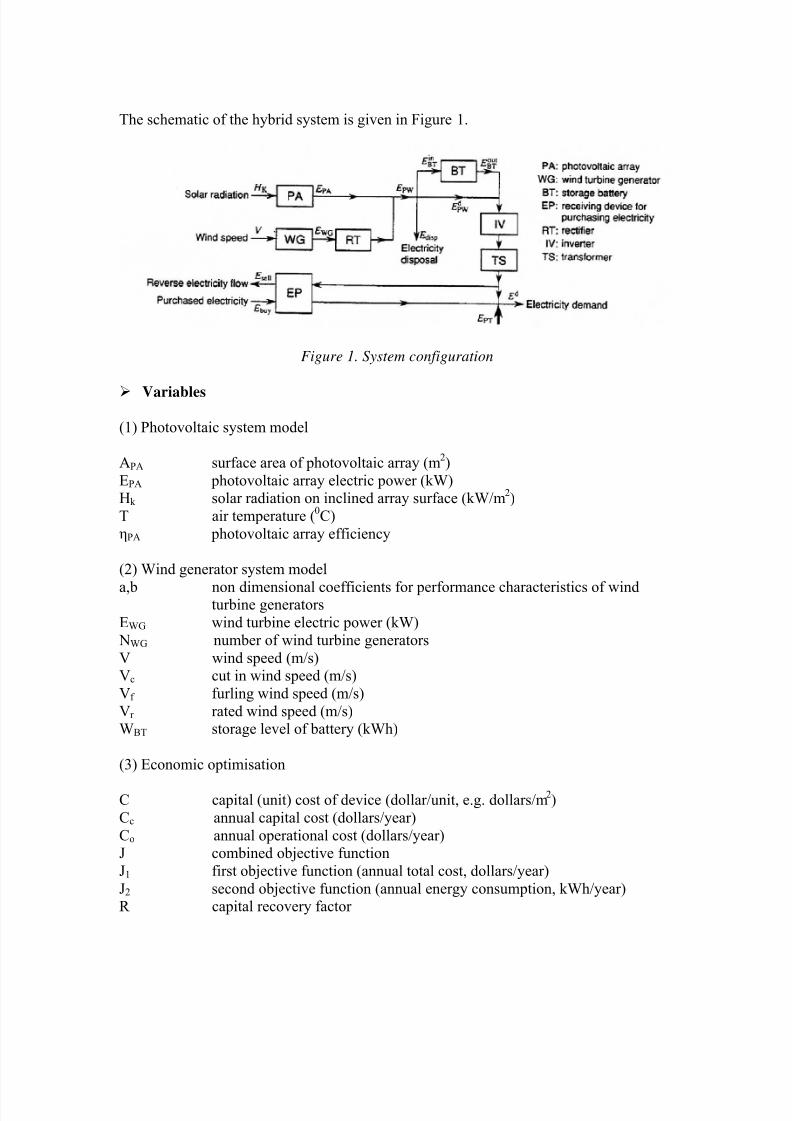
The schematic of the hybrid system is given in Figure 1.
Figure 1. System configuration
Variables
(1) Photovoltaic system model
APA surface area of photovoltaic array (m2)
EPA photovoltaic array electric power (kW)Hk solar radiation on inclined array surface (kW/m
2)
T air temperature (0C)
ηPA photovoltaic array efficiency
(2) Wind generator system model
a,b non dimensional coefficients for performance characteristics of windturbine generators
EWG wind turbine electric power (kW)
NWG number of wind turbine generators
V wind speed (m/s)Vc cut in wind speed (m/s)
Vf furling wind speed (m/s)
Vr rated wind speed (m/s)WBT storage level of battery (kWh)
(3) Economic optimisation
C capital (unit) cost of device (dollar/unit, e.g. dollars/m2)
Cc annual capital cost (dollars/year)
Co annual operational cost (dollars/year)J combined objective function
J1 first objective function (annual total cost, dollars/year)
J2 second objective function (annual energy consumption, kWh/year)R capital recovery factor

8/8/2019 Asst 1 Example
http://slidepdf.com/reader/full/asst-1-example 10/14
w weight for objective functionμ ratio of period of demand side management to annual operational periodφ unit cost of electricity (dollars/kWh)
System modeling
The individual component models are developed to study the performance of the overall
system.
Photovoltaic system
The power output from the photovoltaic array is a modeled as a function of the air
temperature (ToC) and solar radiation on inclined array surface (kW/m
2)
The total array output is given as
PAPAu
PA Ak E k E )()( = (1)
where
PAk PAu
k H k T f k E η )())(()( = (2)
gives the power output from the unit area of the device.
Wind turbine generator
The power output from the wind turbines are modeled as given below.
It is assumed that multiple wind turbine generators of identical capacity are installed
The total power output from N wind turbines given by,
WGWGu
WG N k E k E )()( = (3)
where
the power output from individual turbine is given by
⎪⎪
⎩
⎪⎪
⎨
⎧
≤
<≤
<≤−
<
=
))((0
))((
))(()/)((
))((0
)(
33
k V V
V k V V E
V k V Vc E bV k aV
V k V
k E
f
f r
u
WG
r
u
WGr
c
WGu (4)

8/8/2019 Asst 1 Example
http://slidepdf.com/reader/full/asst-1-example 11/14
Battery storage
The battery storage equations are obtained taking the power conversion efficiencies in
charging and discharging. Storage at any time step is related to that at the previous time
step and the charging/discharging process as
)/)()(()()1( out
BT
out
BT
in
BT
in
BT BT BT k E k E t k W k W η η −Δ+=+ (5)
this is subject to the limits of the minimum and maximum storage levels and the
allowable limits of power in charging/discharging
Receiving device
The power of the receiving device is limited by the following constraints:
The energy purchased from the grid should not exceed the rating of the receiving device
and the contract demand
EPbuy E k E ≤)(
buybuy E k E ≤)( (6)
Further the amount of reverse power (which is sold to the grid) can not exceed the rating
of the receiving device
EPsell E k E ≤)( (7)
Energy balance
Energy balance and supply demand relationships for the overall system based on the
system configuration so that the demand is met at all times is given by
)()()( k E k E k E PW RT WGPA =+ η
)()()()( k E k E k E k E disp
in
BT
d
PW PW ++= (8)
)()()()())()()(( k E k E k E k E k E k E k E d
sellPT buyTS IV disp
out
BT
d
PW +=++++ η η
The model equations are algebraic relations which essentially give an input- output
relation for the components and provide the limits of its operating levels.
8/8/2019 Asst 1 Example
http://slidepdf.com/reader/full/asst-1-example 12/14
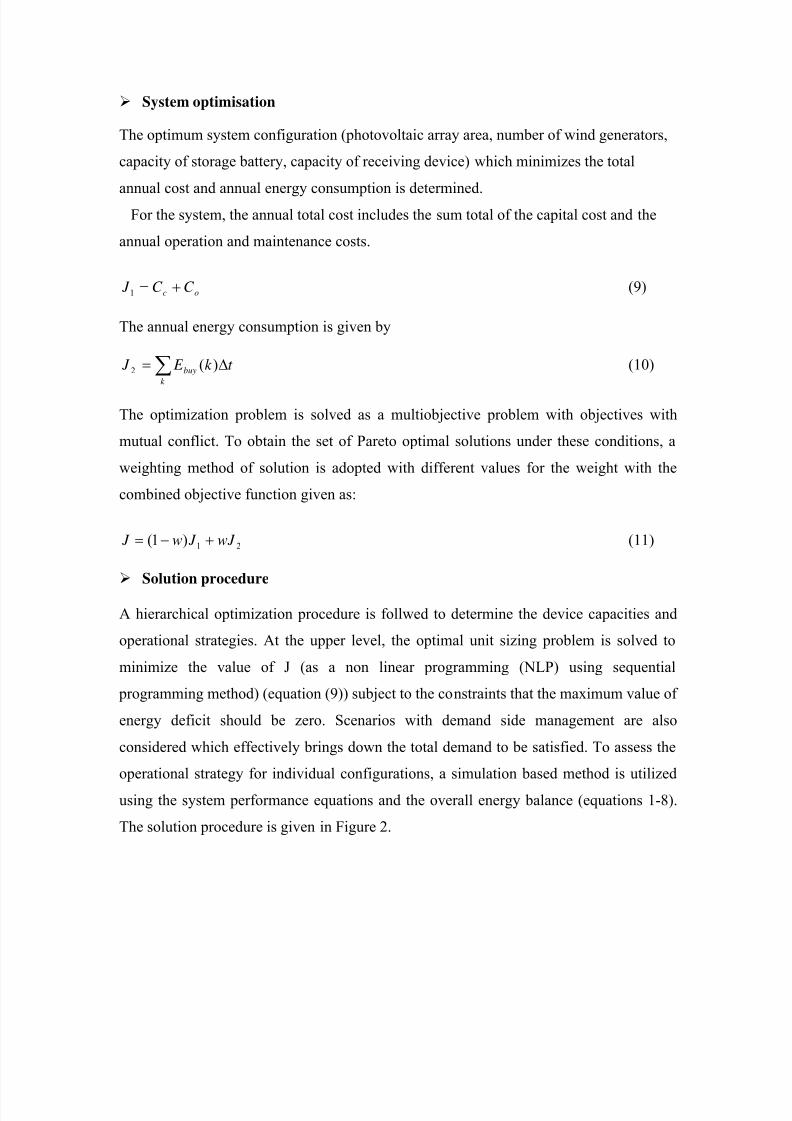
System optimisation
The optimum system configuration (photovoltaic array area, number of wind generators,
capacity of storage battery, capacity of receiving device) which minimizes the total
annual cost and annual energy consumption is determined.
For the system, the annual total cost includes the sum total of the capital cost and the
annual operation and maintenance costs.
oc C C J +=1 (9)
The annual energy consumption is given by
∑ Δ=k
buy t k E J )(2 (10)
The optimization problem is solved as a multiobjective problem with objectives with
mutual conflict. To obtain the set of Pareto optimal solutions under these conditions, a
weighting method of solution is adopted with different values for the weight with the
combined objective function given as:
21)1( wJ J w J +−= (11)
Solution procedure
A hierarchical optimization procedure is follwed to determine the device capacities and
operational strategies. At the upper level, the optimal unit sizing problem is solved to
minimize the value of J (as a non linear programming (NLP) using sequential
programming method) (equation (9)) subject to the constraints that the maximum value of
energy deficit should be zero. Scenarios with demand side management are also
considered which effectively brings down the total demand to be satisfied. To assess the
operational strategy for individual configurations, a simulation based method is utilized
using the system performance equations and the overall energy balance (equations 1-8).
The solution procedure is given in Figure 2.

8/8/2019 Asst 1 Example
http://slidepdf.com/reader/full/asst-1-example 13/14
Figure 2. Solution procedure
Validation
The paper has discussed a sizing methodology with the use of separate models for the
individual components. The validation of the individual models based on
measured/experimental data is not presented but specific references have been cited.
A numerical study is illustrated to show the validity and effectiveness of the optimal
sizing method using the input data for a location specified by the authors (350 N, 135
0E)
with known hourly load distribution for representative days.
Parametric variation
The effect on system sizing with changes in the following have been considered
(i) weight for objective function
(ii) effect of sale of electricity to the grid (system A and B)
Start: Initial values of system capacities, contract
demand
Whether combinedobjective function is
minimized?
Change thevalues of system
capacities,
contractdemand
System
simulation
based oncomponent
characteristicsand energy
balance
Demand
Receive
purchase power fro
grid
Solar insolation
Ambient
temperature
Wind s eed
Optimal values of systemcapacities, contractdemand
Yes No
Optimal unit sizing by
Non linear programming
Operational planning bysimulation

8/8/2019 Asst 1 Example
http://slidepdf.com/reader/full/asst-1-example 14/14
(iii) effect of demand side management
Conclusions
• An approach for multiobjective unit sizing for grid connected hybrid photovoltaic-wind energy system is presented.
• The trade-off relations between cost and energy savings is illustrated by generating a
set of a Pareto optimal solutions.
• Demand side management has an overall positive effect in terms of reduced ratings of
renewable energy based generators and contract demand when the objective function
gives weight to energy savings/environmental protection.
Comments
• The effect of demand side management has been taken in the model based on the
overall duration when it is exercised. It would be of interest if the illustration had
mentioned and described the specific measures in the context of grid connected
hybrid systems. Further the effect on the time of the day when demand side
management is applied and whether that has a significant effect on the system
performance should have been discussed.
• The assumption of the number of wind turbines to be a continuous variable may not
be applicable in practical system planning.
• The objective function being an economic parameter, it would be useful to consider
the sensitivity with respect to the various cost parameters.
• It should be noted that weighting approach can not generate the entire Pareto set for
non-convex problems. It would be of interest to the reader if the motivation for the
choice of weighting method had been presented.