associations between childhood self-regulation and … ro… · · 2015-04-01•conscientiousness...
TRANSCRIPT

SESSION 2:
3. Child development (Symposium) – Relations
between childhood self-control and later life
health and labour market outcomes
CHAIR: Heather Joshi (CBE) (UCL Institute of Education)

Associations between childhood self-regulation and adult socio-economic status:
evidence from the British Cohort Study
Fionnuala O’Reilly, Dr Michael Daly & Prof Liam Delaney

Overview
• Previous work
• Hypotheses
• Data, methods and measurement
• Results
• Summary
• Strengths and Limitations

Previous work
• Studies examining how constructs related to self-control predict later life SES outcomes:
• Time discounting (Golsteyn, Gronqvist & Lindahl, 2014), • Delay of gratification (Mischel, Schoda & Rodriguex, 1989) • Conscientiousness (Judge, Higgins, Thoresen & Barrick, 1999)
• Key study: Moffitt et al., (2011)• Investigates the relationship between childhood self-control and adult
outcomes in health (physical health, substance dependence), wealth (financial planfulness, income, financial struggles) and crime incidence at age 32.

Filling the gaps
Moffitt et al., (2011)
1. Does not examine how self-regulation relates to SES beyond the early career stages (i.e. age 32).
2. Uncertain whether the associations would remain robust to the inclusion of a set of parental SES variables and other traits such as conduct problems.
3. Does not address the prospect of within-person changes in SES over the life course.

Hypotheses
Hypothesis 1: Childhood self-regulation will positively predict each of six SES outcomes at age 30 and again at age 42.
Hypothesis 2: Childhood self-regulation will positively predict SES outcomes at age 42, independent of SES outcomes at age 30 (testing the possibility of within-person social mobility).

The Role of Education
Self-control predicts a number of education related outcomes:
• Hours spent doing homework
• Final grades
• School attendance (Duckworth & Seligman, 2005)
Education is linked to many socioeconomic outcomes:
• Income (Becker, 1975)
• Occupation (Cohn & Addison, 1998)

Hypotheses
• Hypothesis 3: Educational attainment will account for a significant proportion of the association between childhood self-regulation and adult SES.

Data, Measurement and Methods
Data: British Cohort Study (N = 6,700)
• 3 waves; age 10, 30 and 42.
Main Predictor: Self-regulation (age 10)
• 11 item Disorganised Activity scale derived from the Child Development Behaviours Questionnaire
• Cronbach alpha = 0.93
• Convergent validity• Brief Self-Control Scale (Tangney et al., 2004) r = .75, p < .01• Domain-Specific Impulsivity Scale (Tsukayama et al., 2013)
r = .75, p < .01
• Discriminant validity: • SDQ (Goodman, 1997) emotional (r = -.35, p < .01) and peer
problems (r = -.40, p < .01)
Self
-reg
ula
tio
n Daydreaming
Shows perseverance
Easily distracted
Fails to finish tasks
Cannot concentrate

Outcome Variables
Outcome Measure Description
Self-rated Financial Position
How well the participant feels they are performing financially (Scale 1-5)(Age 30: M = 3.98, SD = 0.95. Age 42: M = 3.85, SD = 0.96)
Age at completion of education
Age at which the participant left full-time continuous education (Age 30: M = 17.36, SD = 2.22. Age 42: M = 18.00, SD = 2.95)
Highest Academic Qualification
Highest National Vocational Qualification (NVQ) – academic or vocational (Scale 1-5)(Age 30: M = 2.5, SD = 1.41. Age 42: M = 2.76, SD = 1.46)

Outcome Variables
Outcome Measure Description
Household Income Participant net pay + Partner net pay(Age 30: 6.9 (SD = 1.97) (£15,800 p/a). Age 42: 11.55 (SD = 3.39) (£37,000 p/a)
Social Class British Registrar General’s Scale; based on participant occupation (Scale 1-5)Age 30: M = 3.39, SD = 0.78. Age 42: M = 4.27, SD = 0.96)
Home Ownership Binary variable 1 = Property Ownership (Age 30: 65.10%. Age 42: 74.66%).

Covariates
• Cognitive ability (age 10) – British Ability Scales
• Mental health (age 10) – visit to psychiatrist/psychologist/counsellor
• Conduct, behavioural and emotional problems (age 10)
• Gender
• Parental SES • Social Class at Birth (British Registrar General’s Scale)
• Mother’s age at completion of education
• Property ownership (at birth)
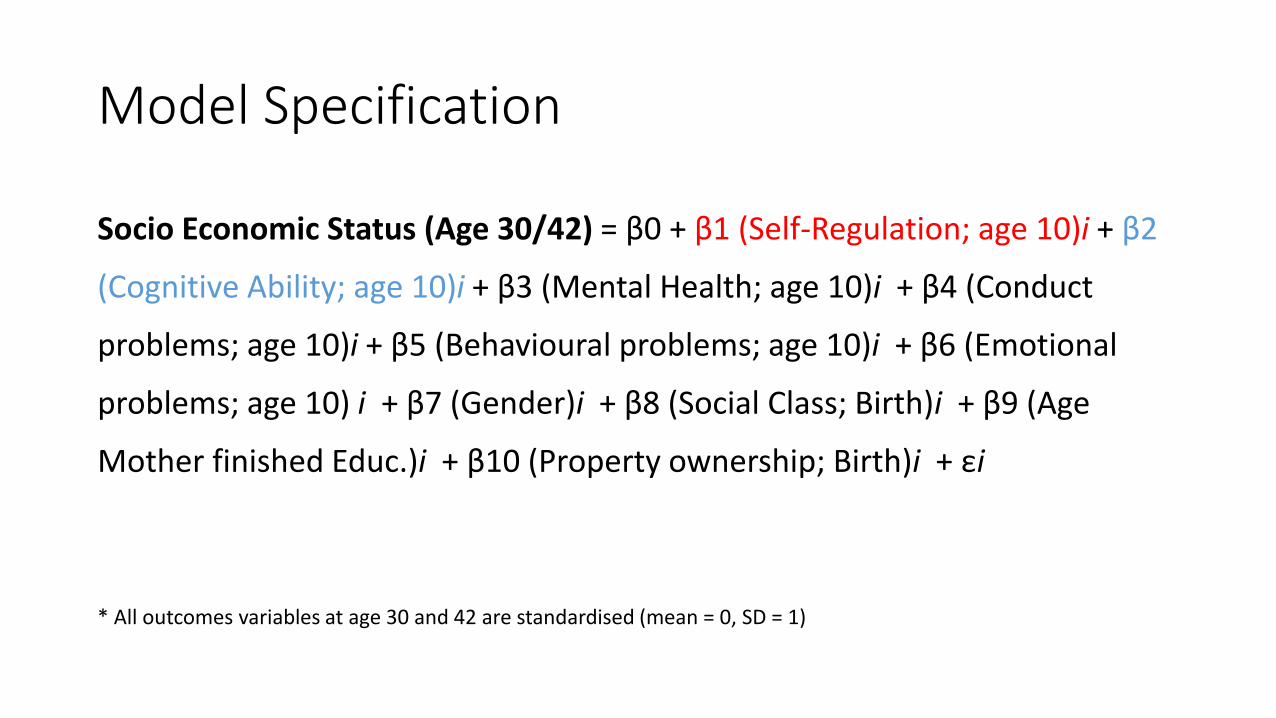
Model Specification
Socio Economic Status (Age 30/42) = β0 + β1 (Self-Regulation; age 10)i + β2
(Cognitive Ability; age 10)i + β3 (Mental Health; age 10)i + β4 (Conduct
problems; age 10)i + β5 (Behavioural problems; age 10)i + β6 (Emotional
problems; age 10) i + β7 (Gender)i + β8 (Social Class; Birth)i + β9 (Age
Mother finished Educ.)i + β10 (Property ownership; Birth)i + εi
* All outcomes variables at age 30 and 42 are standardised (mean = 0, SD = 1)

Results (Age 30)
Self-ratedfinancial position
Age finished education
Highest academic qualification
Household income
Social Class Property ownership
β β β β β β
Self-regulation 0.090*** 0.127*** 0.126*** 0.104*** 0.141*** 1.278***
(0.015) (0.014) (0.014) (0.017) (0.016) (1.196 - 1.365)
Cognitive Ability 0.071*** 0.205*** 0.250*** 0.114*** 0.202*** 1.040
(0.015) (0.014) (0.014) (0.017) (0.016) (0.973 - 1.112)
• p-values/confidence intervals in parentheses. *** p<0.01, ** p<0.05, * p<0.1
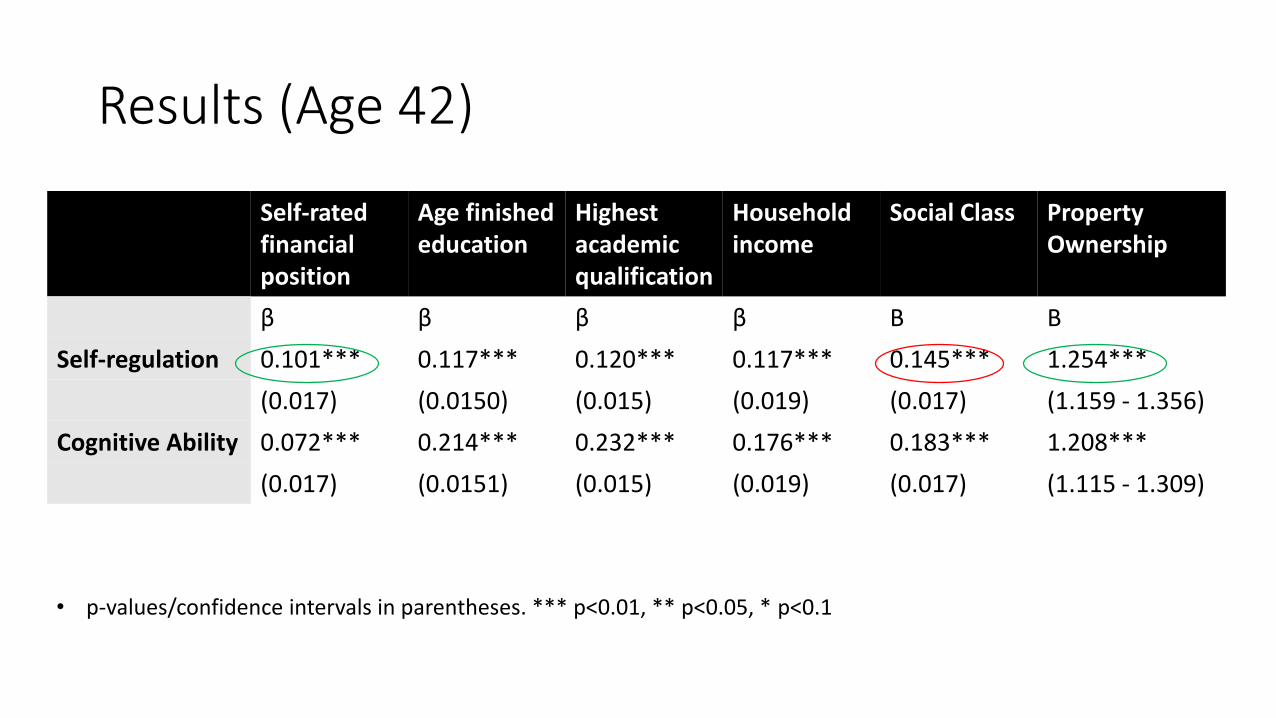
Results (Age 42)
Self-ratedfinancial position
Age finished education
Highest academic qualification
Household income
Social Class Property Ownership
β β β β Β Β
Self-regulation 0.101*** 0.117*** 0.120*** 0.117*** 0.145*** 1.254***
(0.017) (0.0150) (0.015) (0.019) (0.017) (1.159 - 1.356)
Cognitive Ability 0.072*** 0.214*** 0.232*** 0.176*** 0.183*** 1.208***
(0.017) (0.0151) (0.015) (0.019) (0.017) (1.115 - 1.309)
• p-values/confidence intervals in parentheses. *** p<0.01, ** p<0.05, * p<0.1

Results: Within-person social mobility
Social Class Household Income
Self-ratedfinancial position
Property ownership
β β β β
Self-regulation 0.072*** 0.095*** 0.062*** 1.156***
(0.017) (0.019) (0.017) (1.052 - 1.270)
Cognitive ability 0.114*** 0.121*** 0.052*** 1.186***
(0.018) (0.020) (0.017) (1.077 - 1.306)
• p-values/confidence intervals in parentheses. *** p<0.01, ** p<0.05, * p<0.1
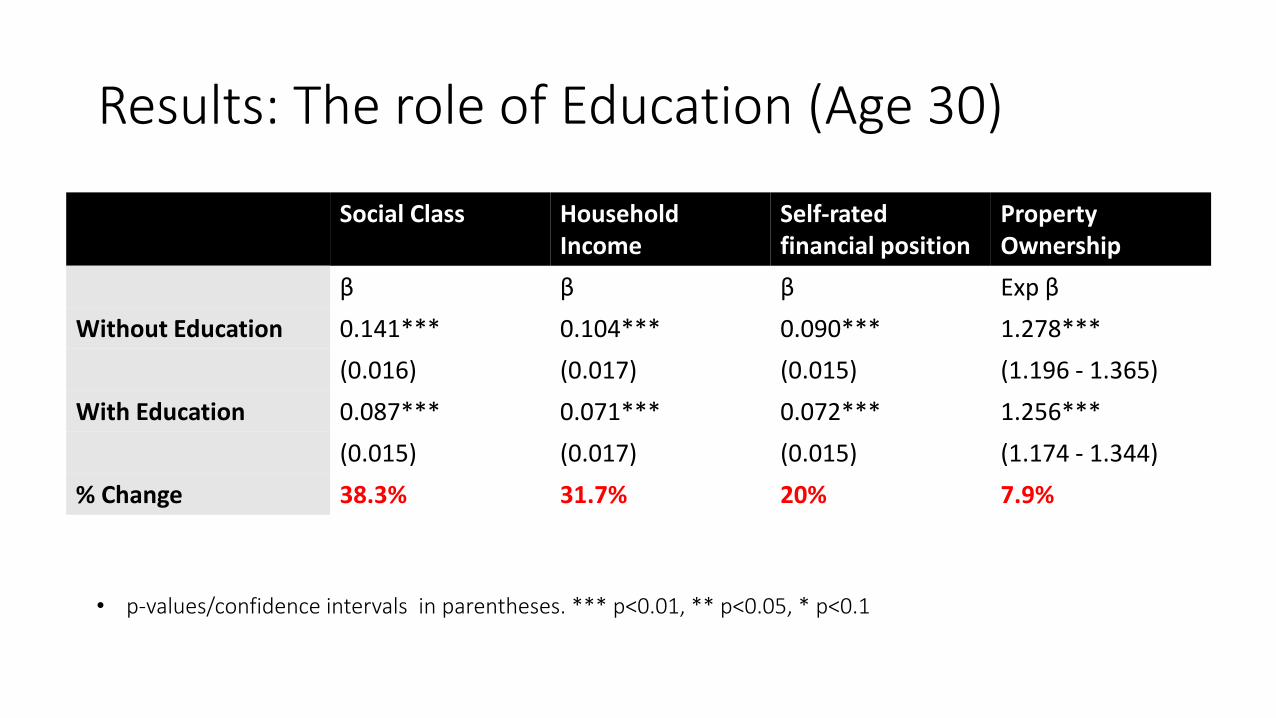
Results: The role of Education (Age 30)
Social Class HouseholdIncome
Self-rated financial position
Property Ownership
β β β Exp β
Without Education 0.141*** 0.104*** 0.090*** 1.278***
(0.016) (0.017) (0.015) (1.196 - 1.365)
With Education 0.087*** 0.071*** 0.072*** 1.256***
(0.015) (0.017) (0.015) (1.174 - 1.344)
% Change 38.3% 31.7% 20% 7.9%
• p-values/confidence intervals in parentheses. *** p<0.01, ** p<0.05, * p<0.1
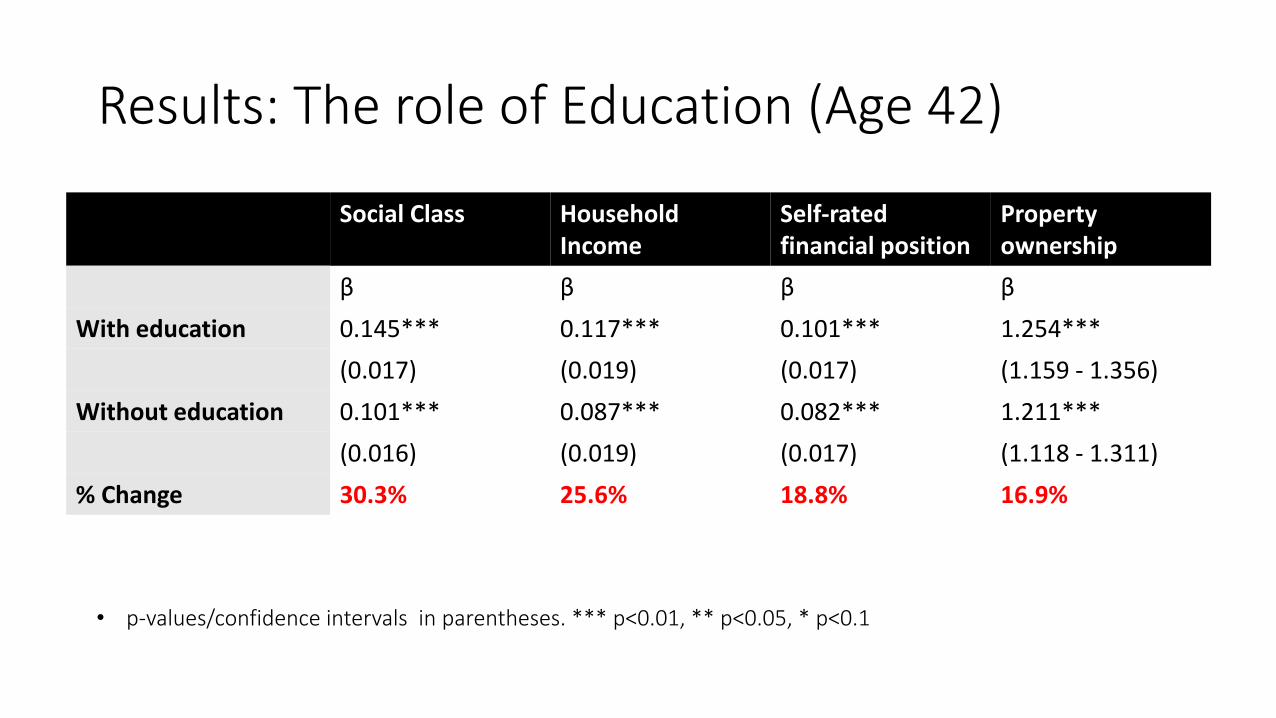
Results: The role of Education (Age 42)
Social Class Household Income
Self-ratedfinancial position
Property ownership
β β β β
With education 0.145*** 0.117*** 0.101*** 1.254***
(0.017) (0.019) (0.017) (1.159 - 1.356)
Without education 0.101*** 0.087*** 0.082*** 1.211***
(0.016) (0.019) (0.017) (1.118 - 1.311)
% Change 30.3% 25.6% 18.8% 16.9%
• p-values/confidence intervals in parentheses. *** p<0.01, ** p<0.05, * p<0.1

Results: Summary
I. 1SD increase in self-regulation at age 10 is associated with a 0.12 increase in SES (across all variables) at age 30 and age 42; an effect 76% the strength of cognitive ability.
II. Strongest associations between self-regulation at age 10 and social class and education.
III. Associations robust to the inclusion of three parental SES variables(inter-generation social mobility).
IV. Associations remain robust at age 42 after controlling for equivalent outcomes at age 30 (within-person social mobility).
V. Associations robust to the inclusion of conduct problems.
VI. Education accounts for 24% approx. of the association between childhood self-regulation and adult SES.

Strengths & Limitations
Strengths
Measure outcomes at two time-points in adulthood
Comprehensive set of socioeconomic indicators (6 in total)
Longitudinal design and large population sample (N = 6,700)
Limitations
Self-regulation measure is teacher reported
Generalizability: UK sample
Only partially measure the subjective component of SES
Income: self-reported net pay

Thank you

Mark Egan
Poor childhood self-control
predicts physiological dysregulation in midlife
Dr Michael Dalya,b, Prof Liam Delaneya,b, &
Prof. Roy Baumeisterc
aStirling Behavioural Science Centre, University of StirlingbUCD Geary Institute, University College DublincDepartment of Psychology, Florida State University

Self-Discipline:
“The capacity to begin tasks and follow through to completion despite
boredom or distractions” (NEO-PI-R)
Basic dimension of temperament (Zenter & Bates, 2008), antecedent of
conscientiousness (Eisenberg et al., 2012)
“The ability to control one’s feelings and overcome one’s weaknesses”
(OED)
Evidence of health benefits of self-discipline largely based on:
(i) laboratory studies (e.g. Hagger et al., 2010)
(ii) cross-sectional studies (e.g. de Ridder et al., 2012)
Why self-discipline?

Self-discipline & health
From Moffitt T E et al. PNAS 2011;108:2693-2698
©2011 by National Academy of Sciences
Established link between childhood
conscientiousness & mortality
(Friedman et al., 1993; Roberts et al.,
2007)
Emerging link between child self-
discipline & objectively assessed
physical health
Self-discipline & subsequent
overweight, poor health, substance use
(Duckworth et al., 2010; Moffitt et al.,
2011; Hampson et al., 2013)

Life span studies
Objective health outcomes
Avoids endogeneity / health => personality? (e.g. Sutin et al.,
2013; Stephan et al., 2014)
Medium sized samples:
Moffitt et al. = 892; Hampson et al. = 753
Small set of control variables:
Moffitt et al. = gender, social class, intelligence
Hampson et al. = gender, ethnicity, parental home
ownership, adult C, other childhood personality traits
Childhood self-control could be acting as a proxy
for an adverse childhood environment or for poor
child health

National Child Development Study (N = 6,878)
Physiological dysregulation
Cardiovascular
Metabolic
Inflammatory
Respiratory functioning
Childhood
Self-discipline (teacher
rated)
Gender (49.4% female)
Ethnicity (98% Caucasian)
Social class (class I to V)
Intelligence (80-item)+ Extensive early
environment & health
controls

Physiological dysregulation index
Hampson et al (2013):
Systolic and diastolic BP (mean of
two measurements),
HDL cholesterol (reversed)
total cholesterol/HDL ratio
triglycerides
blood glucose
body mass index (BMI; kg/m2)
waist/hip ratio
urine protein (log transformed)
taking medications for cholesterol or blood
pressure
Current study (α = .76):
Systolic and diastolic BP (mean of two
measurements),
HDL cholesterol (reversed)
total cholesterol/HDL ratio
triglycerides
HbA1c
body mass index (BMI; kg/m2)
waist/hip ratio
C-reactive protein
Fibrinogen
Von Willebrand factor antigen
Tissue Plasminogen activator antigen
Peak flow
Note: Each measure was standardized and summed to produce the index score

• Age 7 & 11: 13-item scale designed to evaluate “impulsive acting out without
regard for consequences” (Stott, 1969)
• Items assess aspects of self-discipline including attentional control,
persistence, & impulsive behavior:
• 1 Cannot attend or concentrate for long
• 2. Too restless to remember for long
• 3. Doesn’t know what to do with himself, can never stick at anything long
• 4. Sometimes eager, sometimes doesn't bother
• 5. Constantly needs petty correction
• 6. Misbehaves when teacher is out of room….
• Cronbach’s α = 0.87 (validation study)
Correlates 0.74 with Brief Self-Control Scale (Tangney et al. 2004), 0.71 with Domain-Specific
Impusivity Scale (Tsukayama et al. 2013)
Self-discipline measure

Parental & home characteristics
Mother & father age
Marital status
Mother education
Mother’s first language is English
Family difficulties (13 including
death of a parent, parental disability,
divorce/separation, domestic tension, unemployment,
alcoholism)
Number of people in the household
Number of persons per room
Region at birth (9 geographic areas)

Childhood health (infancy / age 7)
Birth weight, breast fed
BMI (objectively recorded)
Diabetes
Asthma
Heart condition
Emotional maladjustment
Epileptic condition
Motor handicap
Intellectual disability
Cerebral palsy
Other C.N.S. condition
Disfiguring condition

1) Show self-discipline is not acting as a proxy for adverse
experiences, home environment, or health
2) If these diminish the self-control – health link we would
consider the variable to be affected by confounding
3) Distal effects of early life conditions on health will be
diminished in a regression model by the inclusion of a
‘downstream’ or ‘intermediary’ variable such as self-discipline
4) Similar to mediation analysis
Rationale for Parent/Home/Health Controls

Childhood self-regulation will be negatively associated with
physiological dysregulation (age 45)
Robust to adjustment for sex, socioeconomic status,
ethnicity, and intelligence
Robust to further adjustment for family difficulties, parental &
home characteristics, geographic locations, baseline medical
conditions including emotional maladjustment and relative
weight at age 7
Predictions

Self-discipline & dysregulation
Females:
r (3,431) = - .13, p < .001
Males:
r (3,448) = - .13, p < .001

Physiological dysregulation: Model 1

Physiological dysregulation: Model 1
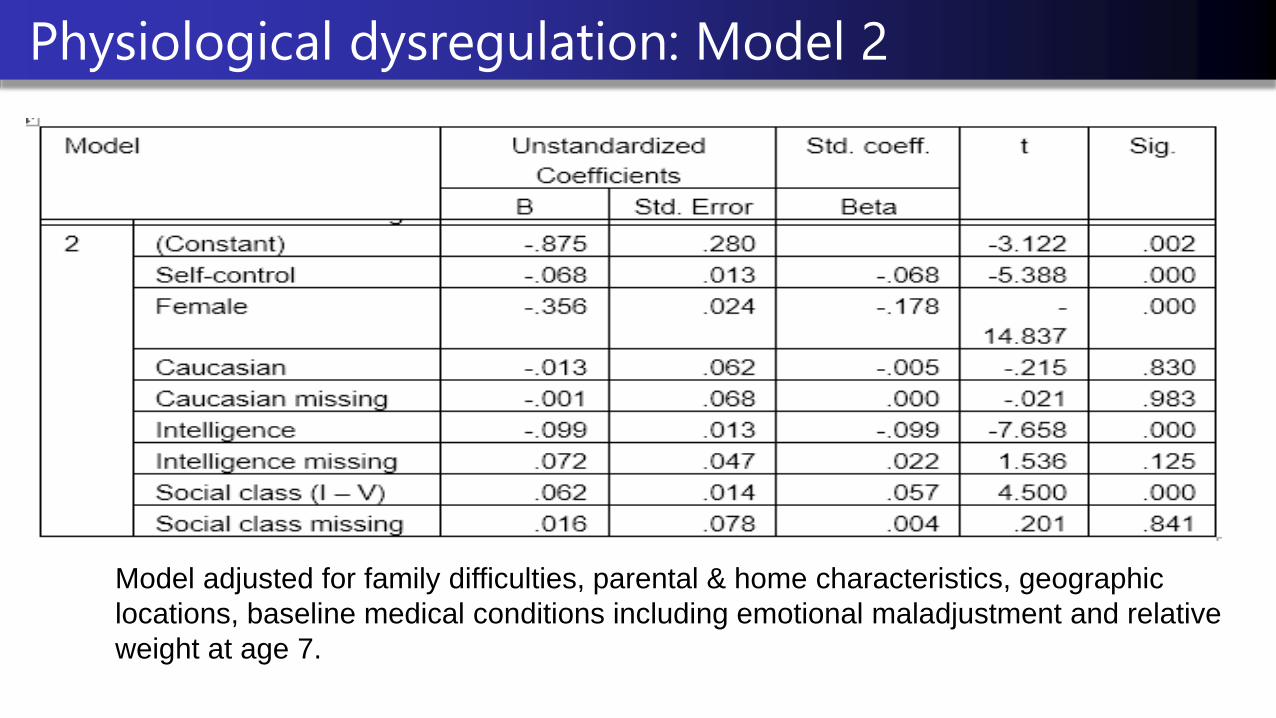
Physiological dysregulation: Model 2
Model adjusted for family difficulties, parental & home characteristics, geographic
locations, baseline medical conditions including emotional maladjustment and relative
weight at age 7.

Physiological dysregulation: Model 2
Model adjusted for family difficulties, parental & home characteristics, geographic
locations, baseline medical conditions including emotional maladjustment and relative
weight at age 7.
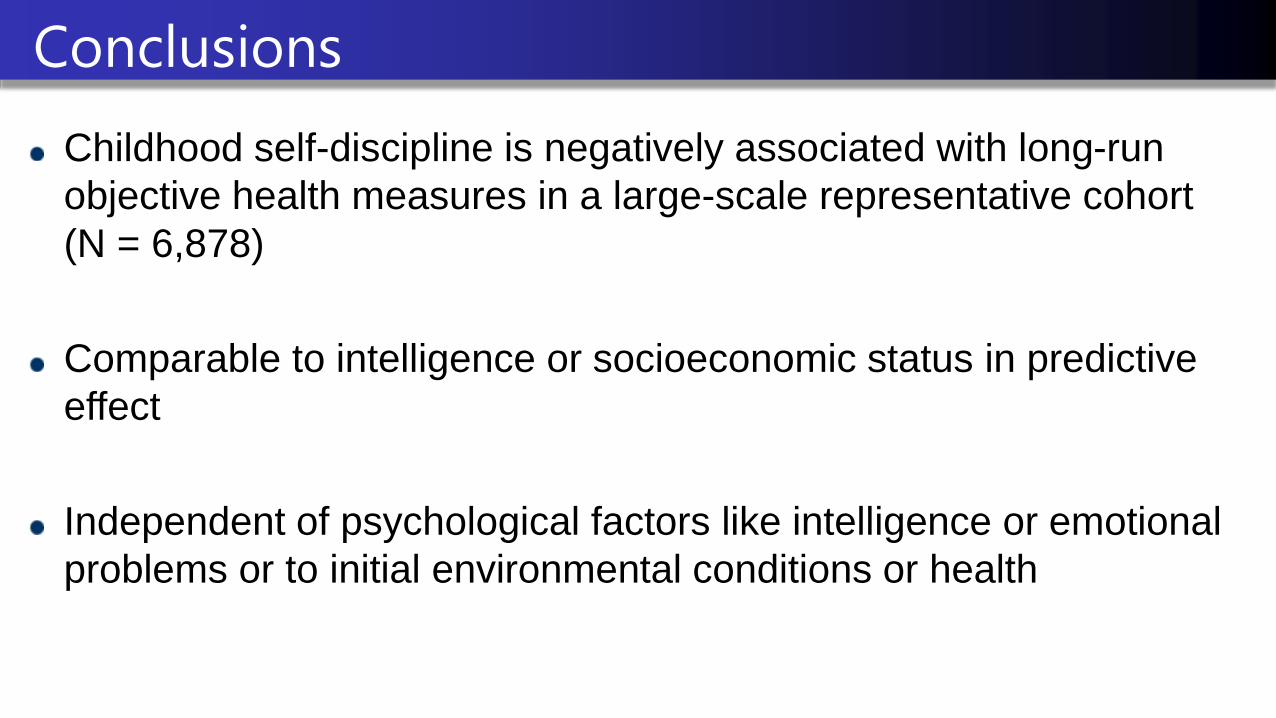
Conclusions
Childhood self-discipline is negatively associated with long-run
objective health measures in a large-scale representative cohort
(N = 6,878)
Comparable to intelligence or socioeconomic status in predictive
effect
Independent of psychological factors like intelligence or emotional
problems or to initial environmental conditions or health

ESRC funded Future Leaders project ‘Childhood self-control &
adult health’
Explore mediating factors (health behaviour, stress,
educational attainment, & socioeconomic events)
Examine disability & mortality across cohort studies
Examine latent ‘allostatic load’ measure
Sibling fixed effects models
Include self-discipline measures in ongoing cohort studies &
intervention studies
Future directions

Thank you for your
attention!
Acknowledgements: We are grateful to The Centre for Longitudinal Studies, Institute of Education
for permitting the use of these data and to the UK Data Archive and Economic and Social Data
Service for making them available. However, they bear no responsibility for the analysis or
interpretation of these data.

Daly, Delaney, Egan & Baumeister
Childhood self-control & unemployment throughout the
lifespan:
evidence from two British cohort studies.
Liam Delaney
Professor of Economics, Stirling University,
Stirling Behavioural Science Centre,
with
Michael Daly, Mark Egan (Stirling)
& Roy Baumeister (Florida State)
March 16th 2015
Childhood Self-Control & Unemployment
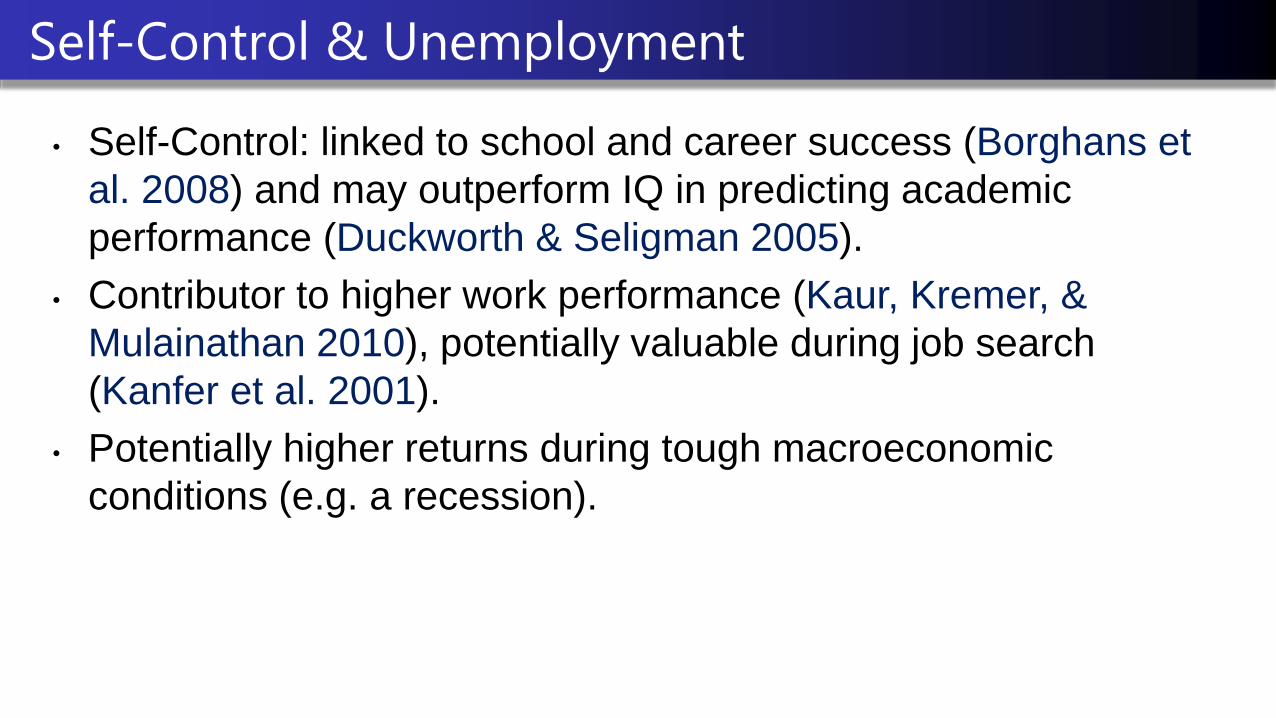
• Self-Control: linked to school and career success (Borghans et
al. 2008) and may outperform IQ in predicting academic
performance (Duckworth & Seligman 2005).
• Contributor to higher work performance (Kaur, Kremer, &
Mulainathan 2010), potentially valuable during job search
(Kanfer et al. 2001).
• Potentially higher returns during tough macroeconomic
conditions (e.g. a recession).
Self-Control & Unemployment

STUDY 1
Data
• 17,000 born in Britain in a week in 1970.
• Self-control measured at 10y.
• Employment data 16-38y.
• N = 6,836

Data & Method
Adult Unemployment
(i) Current employment status
0 = Employed
1 = Unemployed
(ii) Months unemployed 16-38y
(0 – 269 months, 75% have 0 mths)
Childhood
Self-control at 10y
Intelligence at 10y
Gender
SES
British Cohort Study
Birth 10y 21y 26y 30y 34y 38y 42y
1970 ’80 ‘91 ‘96 ‘00 ’04 ‘08 ‘12
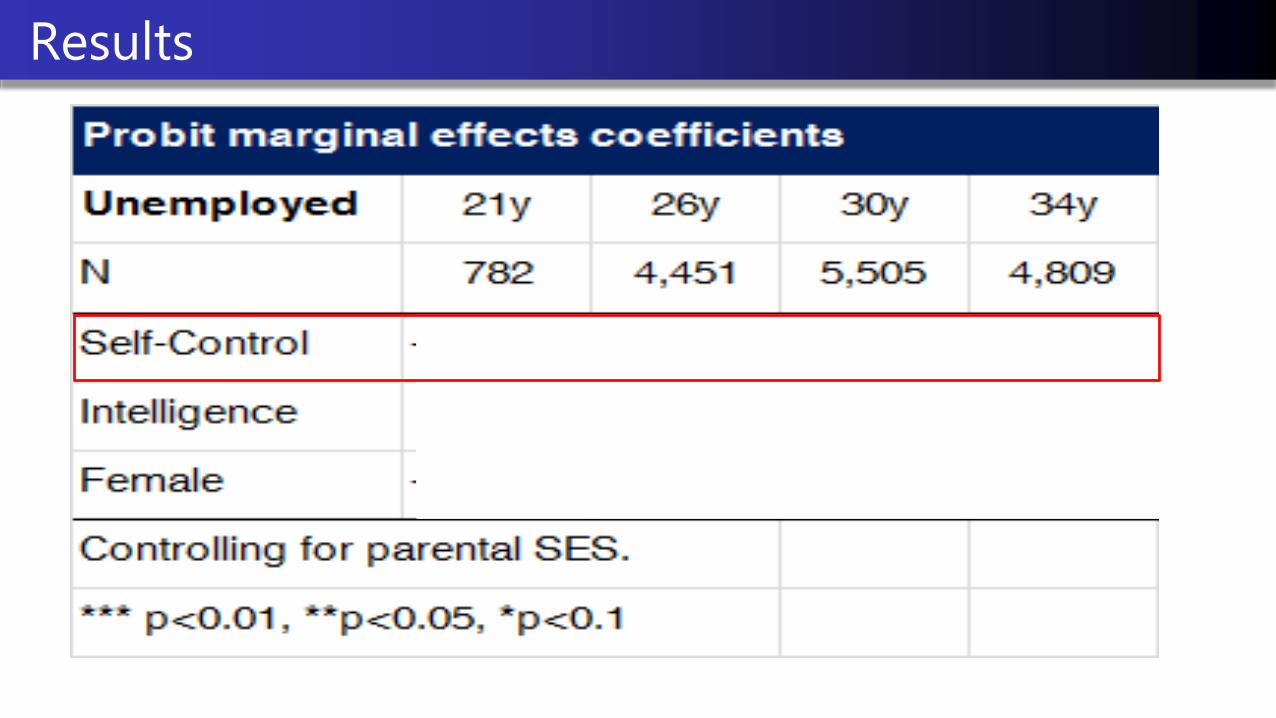
Results

Results

Results

Results
Childhood Self-Control and UnemploymentDaly, Egan, Delaney & Baumeister (2015)

STUDY 2
Data
• 18,000 born in Britain in a week in 1958.
• Self-control measured at 7 &11y.
• Employment data 16-50y.
• N = 10,105
• Extensive control variables.

Data & Method
National Childhood Development Study
Adult Unemployment
Current employment status
0 = Employed
1 = Unemployed
Months unemployed 16-50y
(0 – 341 months, 61% 0mths)
Childhood
Self-control at 7 & 11y
Intelligence at 11y
Gender
SES
Extensive controls

Data & Method – Extended Controls I
Demographic & Regional Controls
Family difficulties in childhood home
Childhood health
Extensive controls

Results

Results

Results

Results
Childhood Self-Control and UnemploymentDaly, Egan, Delaney & Baumeister (2015)

Results – Recession
Childhood Self-Control and UnemploymentDaly, Egan, Delaney & Baumeister (2015)

Evidence from two British cohort studies (N=16,772) finds that self-control has a
significant association with:
(i) unemployment from 16-50 years.
(ii) who becomes unemployed during a recession (generalizability unclear).
After controlling for gender, intelligence & SES:
+ 1 SD in self-control reduced the probability of unemployment by 25%
(1.4 pct pts) across both data-sets.
Low self-control group (-1SD) spent 1.7 times as many months unemployed
than high self-control (+1SD) group across both data-sets.
Conclusion

Daly, Delaney, Egan & Baumeister
Contact
@LiamDelaneyEcon
Acknowledgements
Centre for Longitudinal Studies, ESRC, UK Data Archive, Skills Development Scotland, EC Marie Curie Initiative.
Childhood Self-Control & Unemployment
Questions?

Lunch and postgraduate poster session
LOCATION: Morris Room/Arnold Room/
Brewer & Smith Room
Time: 13.30-14: 20

SESSION 3
4. Health and wellbeing
CHAIR: Emla Fitzsimons (UCL Institute of Education)

Gwyther Rees & Jonathan Bradshaw
CLS Conference
Institute of Education
16/17 March 2015

How a person evaluates / feels about their own life
Subjective well-being
Negativeaffect
Cognitive
Life satisfaction
Satisfaction with various aspects of life
Affective
Positiveaffect

• A number of
• Between country studies based on HBSC, Children’s Worlds
• Within-country studies including the UK, US, Germany, Spain
• Almost exclusively using child-reported data
• Demographic and household economic variables tend only to explain 5%
to 10% of the variation in SWB
• Personality appears to explain more than 20% of variation, (although more
research needed on conceptual overlap)
• Other important factors identified include bullying, family relationships,
choice and autonomy
• However, limitations in relying primarily on self-reported data
• MCS provides a valuable source of information from different perspectives

Cognitive SWB Affective SWB
On a scale from 1 to 7 where ‘1’ means completely happy and ‘7’ means not at all happy, how do you feel about the following parts of your life?
How do you feel about
… your school work
… the school that you go to
… your family
… your friends
… the way that you look
… your life as a whole
In the last four weeks, how often did you
… feel happy
… laugh
… feel sad
… feel afraid or scared
… get angry
… get worried about what would happen to you
Answers on a five-point scale – ‘Never’, ‘Almost never’, ‘Sometimes’, ‘Often’, ‘Always’

Exploratory factor analysis supports the idea of a three-
component model – cognitive SWB, positive affect, negative
affect
Five cognitive domains form a reliable scale (alpha = .776)
However, questions about make-up of this scale – heavy
weighting of school-related issues and absence of key aspects of
life
Affective domains not so straightforward – only two positive items
and both sets of items not clearly conceptualised

Individual examination of eight single-item variables:
Happiness with life as a whole, school work, school, family, friends and
appearance
Frequency of feeling happy and sad in last four weeks
Construction of two composite variables:
Cognitive SWB: Sum of first set of six items above. Some conceptual
problems
Overall SWB: Sum of happiness with life as a whole plus combined
score of affect balance (positive – negative)
All ten variables transformed onto a scale from 0 to 10 where
higher scores represent higher SWB
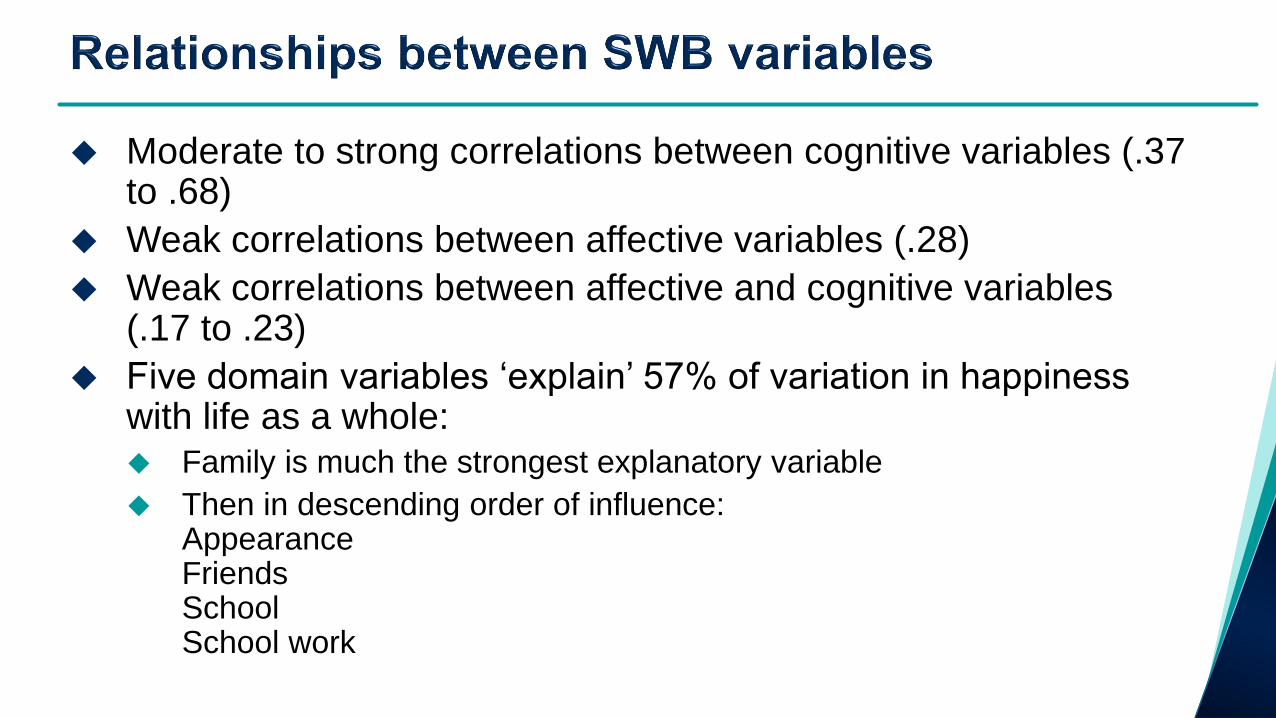
Moderate to strong correlations between cognitive variables (.37 to .68)
Weak correlations between affective variables (.28)
Weak correlations between affective and cognitive variables (.17 to .23)
Five domain variables ‘explain’ 57% of variation in happiness with life as a whole:
Family is much the strongest explanatory variable
Then in descending order of influence: AppearanceFriendsSchool School work

Domains Parent-reported Child-reported
Relationships Family relationships Peer relationships
Family relationships Peer relationships
Education Child experience of school Problems Aspirations
Experiences and views about school
Money Household income Deprivation Subjective
Subjective
Time use Daily/weekly activities Daily/weekly activities
Environment Housing Local area
Housing Local area
Health Health behaviours Physical health Mental health
Health behaviours
Demographics Gender, Ethnicity, Country within UK, Household structure
Very good coverage Good coverage Some coverage No coverage

• Identification of relevant dependent and independent variables
• Bivariate analysis of associations between each independent variable and
each dependent variable
• Basic regression model for each dependent variable, using demographic
characteristics and household economic variables
• Introduction of blocks of parent-reported variables relating to each domain
• Final model including all blocks of parent-reported variables
• Introduction of blocks of child-reported variables relating to each domain
• Final model including all blocks of child-reported variables

Cognitive SWB No gender difference
Some minority ethnic groups have higher SWB
Higher SWB in N Ireland, Scotland and Wales
Lower SWB in some ‘non-intact’ family forms
Lower SWB in families with deprivation / struggling
Adjusted R2 = .027
Overall SWB Boys have higher SWB
Some minority ethnic groups have higher SWB
Higher SWB in N Ireland, Scotland and Wales
Lower SWB in some ‘non-intact’ family forms
Lower SWB in families with deprivation / struggling
Adjusted R2 = .021

Domains Details Cognitive SWB Overall SWB
Relationships Parent-child relationships +1.7% +2.3%
Education School engagement +5.5% +4.1%
Money n/a n/a
Time use Frequency of exercise +0.7% +0.8%
Environment ns ns
Health Mental and physical +5.0% +6.0%
All of above +7.8% +7.8%
Full model Adjusted R2 10.5% 9.7%

Domains Details Cognitive SWB Overall SWB
RelationshipsFamilyFriendshipsBeing bullied
unavailable+3.5%+7.8%
unavailable+5.1%
+13.8%
Education Views of school +17.3% +14.2%
Money Subjective +4.8% +7.1%
Time use Daily / Weekly activities +3.2% +2.1%
Environment Local area safety +2.4% +2.6%
Health None available unavailable unavailable
All of above +21.6% +24.7%
Full model Adjusted R2 24.3% 26.8%

Importance of conceptual clarity in measuring SWB
Demographic and economic variables explain relatively little of variation in child SWB
Parent-reported variables explain some additional variation
Child-reported variables explain much more but there are measurement issues to resolve
Shortage of data on quality of family relationships in MCS Wave 5
Bullying emerges as a key issue in the analysis and effective action on this issue could substantially improve children’s SWB in the UK
School engagement (as reported by parents and children) also has substantial associations with child SWB

Gwyther Rees, Honorary Research Fellow
Social Policy Research Unit, University of York
Professor Jonathan Bradshaw
Social Policy Research Unit, University of York

Affective symptoms across the life course and midlife
cortisol: prospective birth cohort study
Darya Gaysina
School of Psychology
University of Sussex
CLS Conference, London, 2015

Affective disorders
Depression and anxiety are the most common forms of psychopathology in adolescents
and adults
Depression is the 2nd leading cause of disability by 2020 (WHO, 2001)
The prevalence rate is rising among young people (WHO, 2014)
Associated with age-related conditions: e.g., faster cognitive decline, obesity, the
metabolic syndrome, and type 2 diabetes
The hypothalamic-pituitary-adrenal (HPA) axis represents one possible brain circuit that
may mediate the relationship between affective disorders and various age-related
problems

HPA axis
The function of the HPA axis can be altered early in life with long-term effects on
cortisol secretion (Glover et al., 2010; Phillips and Jones, 2006) that affects human
health (Reynolds et al., 2001)
• Cortisol typically follows a diurnal rhythm, with a peak soon after waking in the morning and a gradual decline throughout the day
• Other patterns have been observed: absence, or prolongation of the high awakening level; or rises later in the day

HPA axis and affective symptoms: longitudinal
studies
In children and adolescents, hyperactivity of the HPA-axis (e.g., higher morning
cortisol and higher cortisol awakening response) has been shown to predict onset and
recurrence of affective disorders (Cicchetti and Rogosch, 2001; Goodyer et al., 1997;
Kalmijn et al., 1998; Kaufman, 1991; Kuningas et al., 2007; Ruttle et al., 2011);
although in the most recent and largest study this association was not confirmed
(Carnegie et al., 2014).
In adults, reported associations between affective disorders and cortisol are less
consistent, with both cortisol hyper- and hypo-secretion being associated with
affective disorders (Bremmer et al., 2007; Power et al., 2011; Wardenaar et al., 2011).

HPA-axis and affective symptoms: methodological
issues
There is a variation in salivary collection protocols;
Different measures of cortisol are used (e.g., a single morning cortisol measure, CAR,
or response to a stressor);
The complexity of cortisol regulation is not always considered;
Modest sample sizes combined with a wide range of potential ways to analyse cortisol
may have increased type I errors;
The timing of symptoms (i.e., adolescence or adulthood) and recurrence of affective
symptoms across the life course need to be taken into account:
HPA-axis dysregulation may follow a natural history so that initially hyper-responsiveness
(heightened CAR) may, with greater chronicity, evolve into hypo-responsiveness; attenuated
CAR and smaller diurnal variability over the day (Ben-Shlomo et al., 2013).

Present study: aims
The aims of the present study:
1) to investigate whether affective symptoms at different ages across
the life course were associated with cortisol levels and patterns at
age 60-64 years
2) to explore the cumulative effect of affective symptoms on midlife
cortisol levels and patterns
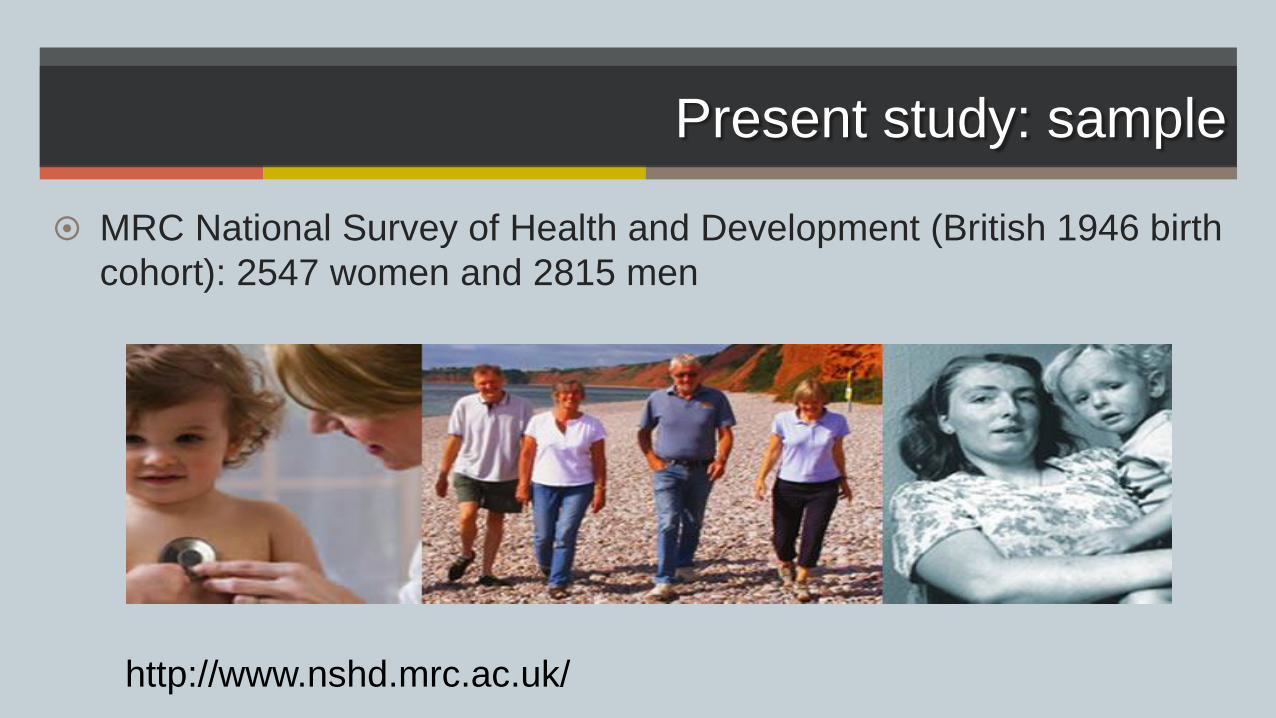
Present study: sample
MRC National Survey of Health and Development (British 1946 birth
cohort): 2547 women and 2815 men
http://www.nshd.mrc.ac.uk/
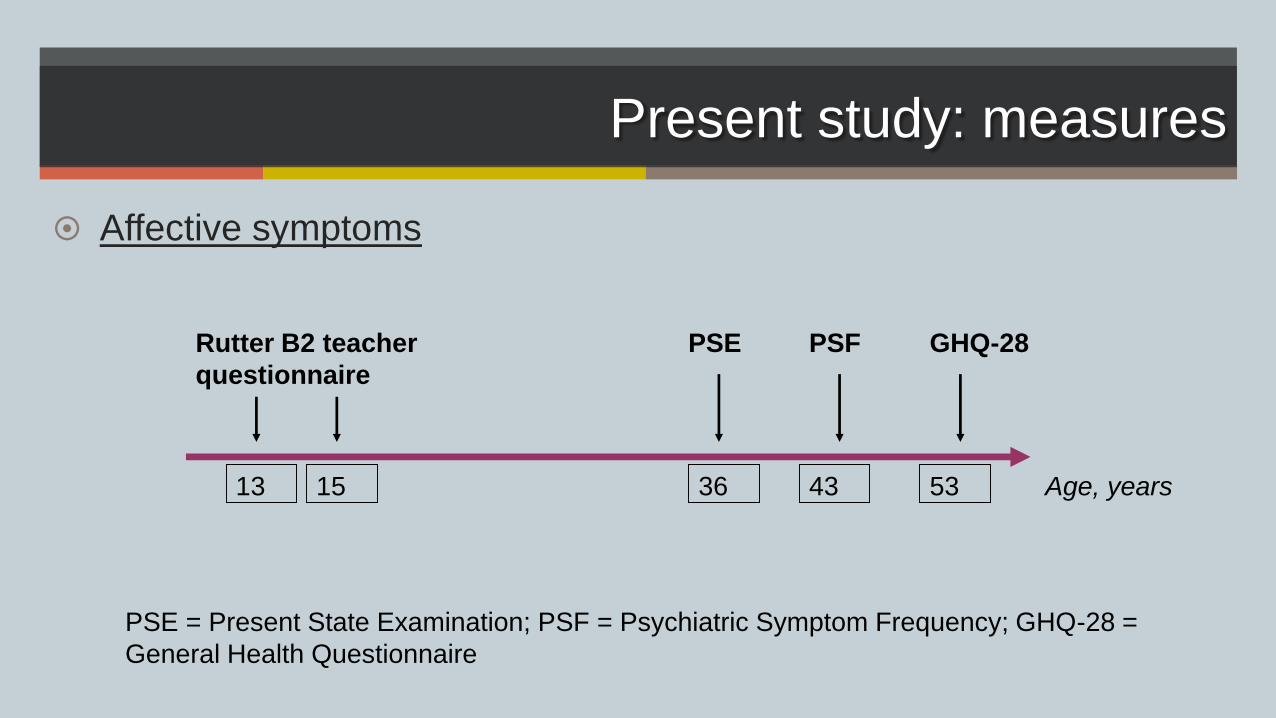
Present study: measures
Affective symptoms
Rutter B2 teacher
questionnaire
PSE PSF GHQ-28
Age, years13 15 36 43 53
PSE = Present State Examination; PSF = Psychiatric Symptom Frequency; GHQ-28 =
General Health Questionnaire

Present study: measures
Cortisol levels and patterns
Gaysina et al, PNEC, 2013
Saliva samples collected :
- at waking (T1)
- 30 minutes after wakening (T2)
- 2100h – 21.30h the same evening (T3)
Plus:
- cortisol awakening response, CAR = (T2-
T1).
- diurnal drop, DD = (T1-T3)
= (T1+T2)/2
T1 T2 T3
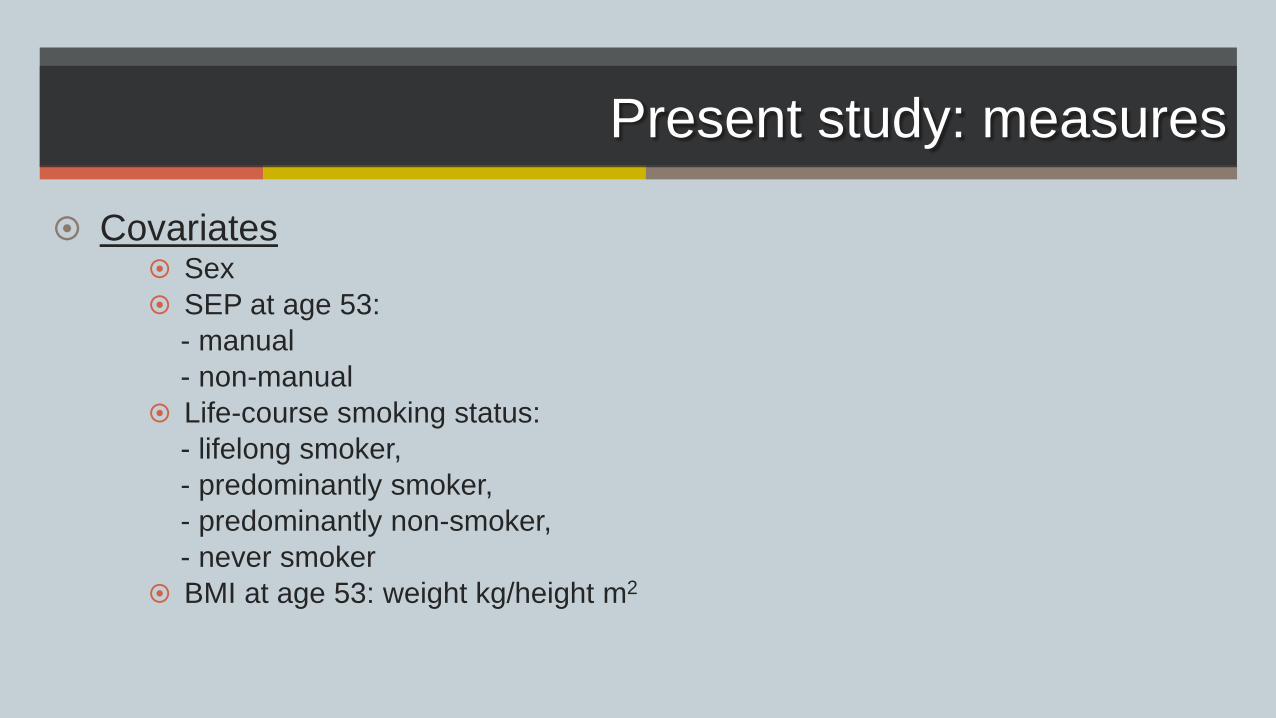
Present study: measures
Covariates Sex
SEP at age 53:
- manual
- non-manual
Life-course smoking status:
- lifelong smoker,
- predominantly smoker,
- predominantly non-smoker,
- never smoker
BMI at age 53: weight kg/height m2
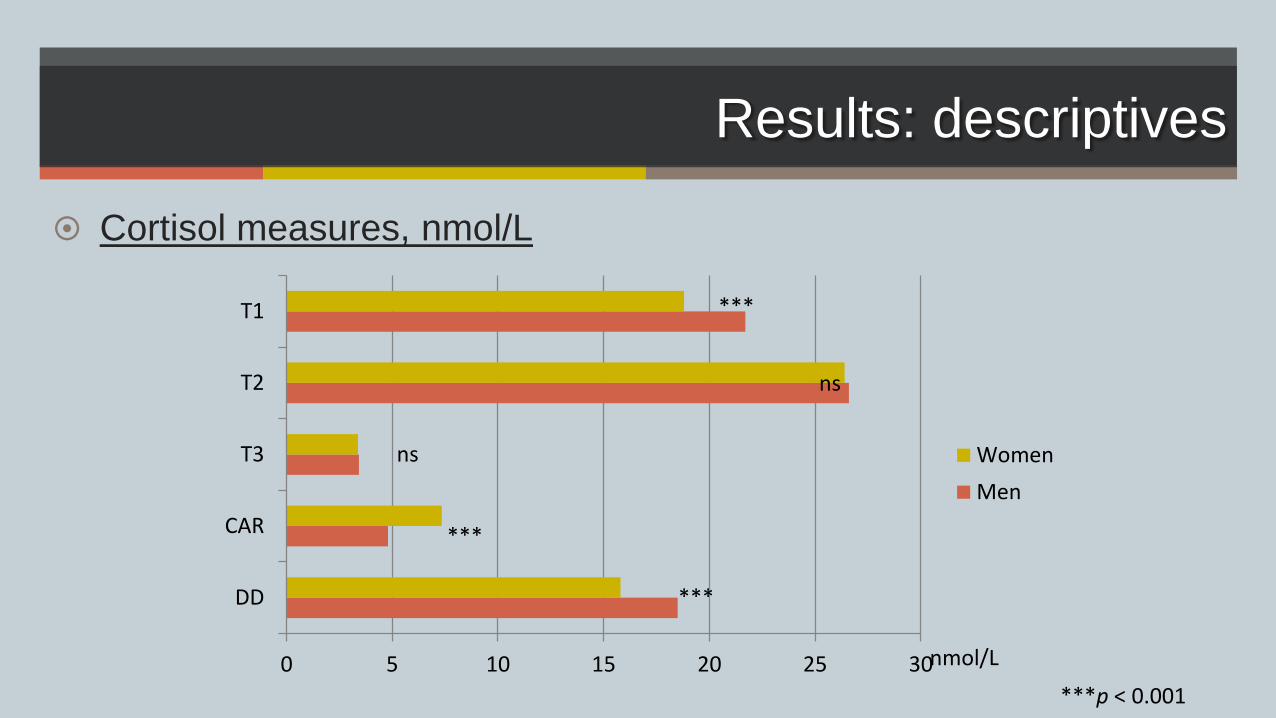
Results: descriptives
Cortisol measures, nmol/L
0 5 10 15 20 25 30
DD
CAR
T3
T2
T1
Women
Men
nmol/L
***p < 0.001
***
***
***
ns
ns

Results: descriptives
Affective caseness at different ages, %
0
5
10
15
20
25
13 15 36 43 53 60-64
Men
Women
%
age, years
**p < 0.01; ***p < 0.001
***
***
***
*****ns

Results: descriptives
Affective caseness cumulative score, %
0
10
20
30
40
50
60
70
80
90
0 1 2 3+
Men
Women
%
cumulative score of affective
caseness
***p < 0.001
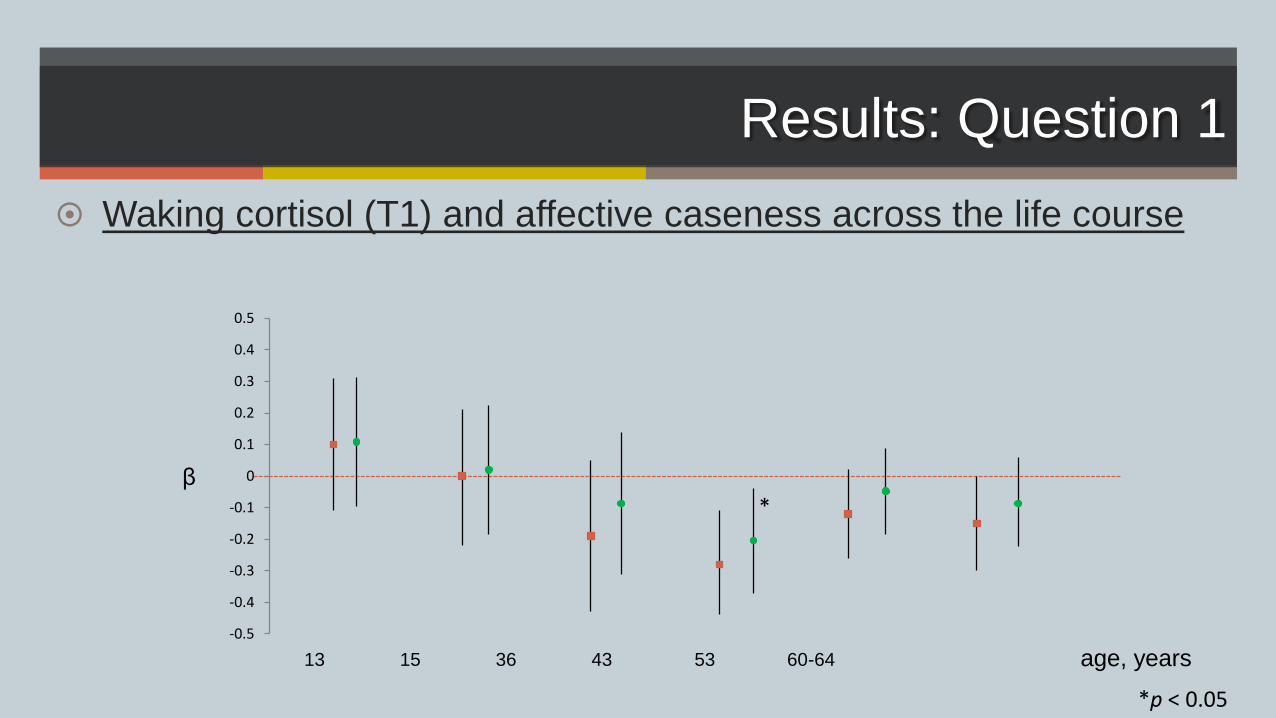
Results: Question 1
Waking cortisol (T1) and affective caseness across the life course
13 15 36 43 53 60-64
β
-0.5
-0.4
-0.3
-0.2
-0.1
0
0.1
0.2
0.3
0.4
0.5
*
age, years
*p < 0.05

Results: Question 1
30 minutes after wakening cortisol (T2) and affective caseness
across the life course
-0.5
-0.4
-0.3
-0.2
-0.1
0
0.1
0.2
0.3
0.4
0.5
-0.5
-0.4
-0.3
-0.2
-0.1
0
0.1
0.2
0.3
0.4
0.5
†
13 15 36 43 53 60-64
β
age, years
†p <0.10

Results: Question 1
Evening cortisol (T3) and affective caseness across the life course
-0.5
-0.4
-0.3
-0.2
-0.1
0
0.1
0.2
0.3
0.4
0.5
-0.5
-0.4
-0.3
-0.2
-0.1
0
0.1
0.2
0.3
0.4
0.5
*
13 15 36 43 53 60-64
β
age, years
*p < 0.05

Results: Question 1
Cortisol awakening response (CAR) and affective caseness across
the life course
13 15 36 43 53 60-64
β
age, years
-0.6
-0.5
-0.4
-0.3
-0.2
-0.1
0
0.1
0.2
0.3
0.4
0.5
0.6

Results: Question 1
Diurnal drop (DD) and affective caseness across the life course
-0.6
-0.5
-0.4
-0.3
-0.2
-0.1
0
0.1
0.2
0.3
0.4
0.5
0.6
-0.6
-0.5
-0.4
-0.3
-0.2
-0.1
0
0.1
0.2
0.3
0.4
0.5
0.6
**
13 15 36 43 53 60-64
β
age, years
**p < 0.01
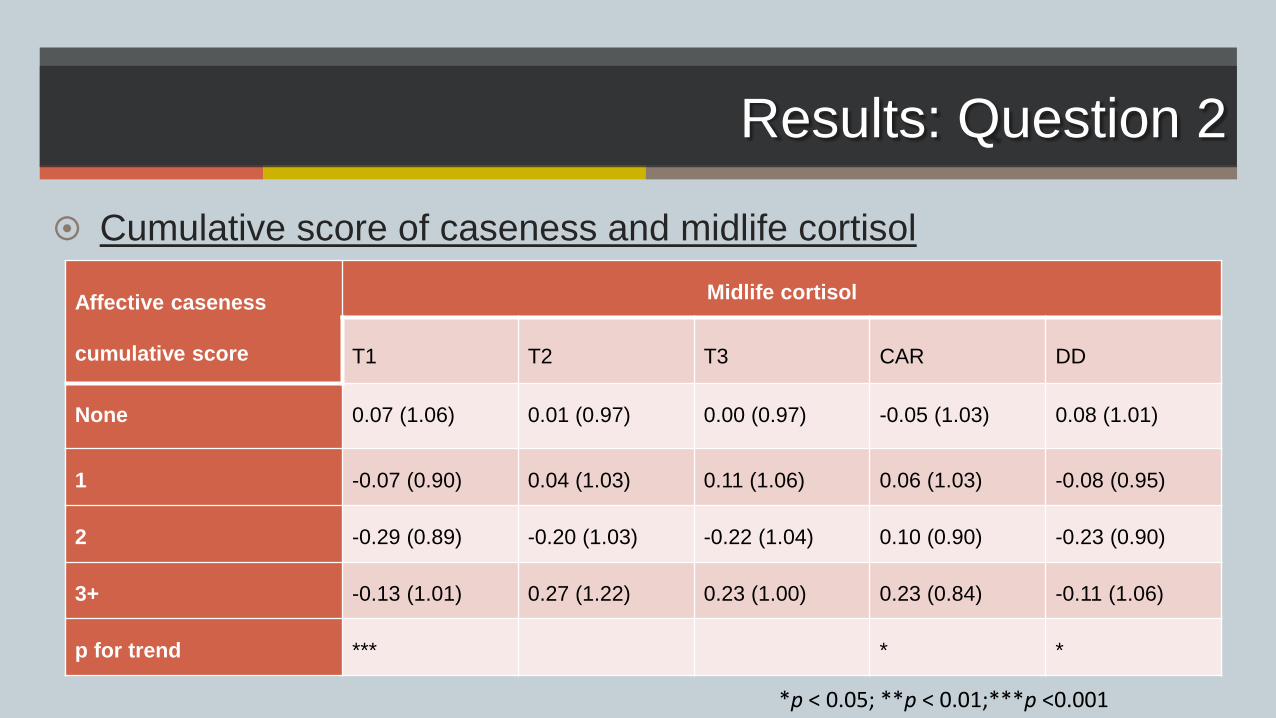
Results: Question 2
Cumulative score of caseness and midlife cortisol
Affective caseness
cumulative score
Midlife cortisol
T1 T2 T3 CAR DD
None 0.07 (1.06) 0.01 (0.97) 0.00 (0.97) -0.05 (1.03) 0.08 (1.01)
1 -0.07 (0.90) 0.04 (1.03) 0.11 (1.06) 0.06 (1.03) -0.08 (0.95)
2 -0.29 (0.89) -0.20 (1.03) -0.22 (1.04) 0.10 (0.90) -0.23 (0.90)
3+ -0.13 (1.01) 0.27 (1.22) 0.23 (1.00) 0.23 (0.84) -0.11 (1.06)
p for trend *** * *
*p < 0.05; **p < 0.01;***p <0.001

Results: Question 2
Cumulative score of caseness and midlife cortisol
T1 cortisol
0 1 2 3+
β
-0.5-0.4-0.3-0.2-0.1
00.10.20.30.40.5
0 1 2 3+
CAR
β
-0.5-0.4-0.3-0.2-0.1
00.10.20.30.40.5
**
-0.5
-0.4
-0.3
-0.2
-0.1
0
0.1
0.2
0.3
0.4
0.5 DD
0 1 2 3+
β
† Models adjusted for sex, SEP, smoking status, and adult BMI; †p <0.10; *p < 0.05; **p < 0.01
†
p for trend * p for trend NS
p for trend †

Conclusions
There was the weak and inconsistent evidence for associations
between affective symptoms across the life course and cortisol in
midlife
Those with case-level affective symptoms at one or more-time
points had lower waking cortisol and flatter diurnal drop than those
with no symptoms
The effects of cortisol on affective symptoms in midlife can depend
on lifetime psychological health, in particular, on adult repeated
symptoms

Acknowledgements
• Marcus Richards
• Diana Kuh
• Rebecca Hardy
• Valerie Tikhonoff
• Yoav Ben-Shlomo
• Mike Gardner

Thank you!