the importance of early conscientiousness
TRANSCRIPT

The Importance of Early Conscientiousness for
Socio-Economic Outcomes*
Tyas Prevoo
Department of Economics, Maastricht University
Bas ter Weel
CPB Netherlands Bureau for Economic Policy Analysis &
Department of Economics, Maastricht University
19 August 2012
Abstract This research estimates models of the importance of conscientiousness for socio-economic
outcomes. We use measures of conscientiousness and other personality traits at age 16 to
explain adult wages and other outcomes, such as crime, health and savings behaviour. We use
several waves from the 1970 British Cohort Study. Our estimates suggest a significant and
sizeable correlation between early conscientiousness and adult outcomes, even after
controlling for other traits, early behavioural problems, the child’s home environment,
educational career, early sociability and occupational sorting. Measurement error in
personality traits is corrected for by applying IV-techniques, errors-in-variables estimators
and structural equation modelling. Investigation of the lower-order structure of
conscientiousness suggests that facets related to reliability, decisiveness and impulse control
are most strongly correlated with outcomes. We also investigate changes in early
conscientiousness and find that persons who experience declines in the personality
distribution between the ages 10 and 16 seem to be worse off in terms of a variety of socio-
economic outcomes.
JEL classification: J24
Keywords: conscientiousness, personality traits, socio-economic outcomes, preferences
* We would like to thank Lex Borghans, Thomas Dohmen, Roel van Elk, Bart Golsteyn, Jim Heckman, Suzanne
Kok, Erik Plug and Dinand Webbink for very useful comments on an earlier version of this paper. Seminar
participants at the CPB, the 2012 ESPE conference in Bern and the University of Groningen provided useful
insights.

1
1. Introduction
For many socio-economic outcomes personality is as predictive as cognition. Economists
have recently been drawing attention to differences in personality as a key consideration to
explaining individual outcomes (e.g., Borghans et al., 2008a and Almlund et al., 2011 for
reviews). Evidence from other academic disciplines, such as the neurosciences, behavioural
genetics and psychology, suggests that differences in personality are important in explaining
a variety of socio-economic outcomes.1 A growing body of evidence from personality
psychology suggests that especially personality measures related to conscientiousness predict
a range of socio-economic outcomes.2 Conscientiousness is broadly defined and referred to as
the propensity to follow socially prescribed norms and rules to be goal-directed, able to delay
gratification and to control impulses (e.g., McCrae and Costa, 1994, John and Srivastava,
1999). Moffitt et al. (2011) present evidence that conscientiousness, which they define as part
of the umbrella of self-control, predicts a range of socio-economic outcomes, such as
physical health, substance dependence, personal finances and criminal offending outcomes.
The pattern they obtain is a gradient in which children with less self-control have worse adult
outcomes. They also show that children who move up the self-control rank (from childhood
to young adulthood) obtain better outcomes as adults.
In this paper we extend the literature in economics by investigating the role of early
conscientiousness in explaining a range of socio-economic outcomes. We do so in an
empirical fashion that builds on the body of literature on personality traits in psychology. The
work is motivated by the observation that conscientiousness predicts a range of outcomes but
that estimation of these relationships is not very careful and informative. Most studies report
correlations between conscientiousness and outcomes. In addition to presenting such
correlations, we apply several strategies to move towards predictions. In particular we deal
with measurement error in traits by using instrumental variables techniques (2SLS), errors-in-
variables (EIV) regressions and structural equation modelling (SEM). Furthermore, it is not
clear which facets of conscientiousness are important for what outcomes. The inputs that
psychologists have used to construct measures of conscientiousness seem to come close to
what economists have defined as measures of time discounting, risk aversion and social
1 See e.g., Cunha et al. (2006), Knudsen et al. (2006), Heckman (2007), Borghans et al. (2008a), Roberts (2009),
Dohmen et al. (2010), Almlund et al. (2011), Lebel and Beaulieu (2011) and Moffitt et al. (2011). 2 See Roberts et al. (2004; 2008) and Jackson et al. (2009) for meta-analyses with a focus on conscientiousness
as a predictor for outcomes. They summarise and review the literature from personality psychology. Almlund et
al. (2011) present an overview of evidence from other academic fields on the importance of conscientiousness as
well.

2
preferences. At this point, empirical knowledge is too limited to judge how conscientiousness
relates to the concepts and parameters economists typically model to predict outcomes, but by
investigating the lower-order structure of conscientiousness we present a set of estimates
constructive to understand differences in socio-economic outcomes and useful to bridge the
gap between economists and psychologists.
We empirically explore the link between early personality indicators and a range of socio-
economic outcomes at age 34. The outcomes are adult wages, savings, indicators of health
(body mass index (BMI), alcoholism, smoking, drug use), involvement in criminal activities,
and a number of indicators for life satisfaction (satisfaction with life so far, the extent to
which people get out of life what they want, and the way in which they are able to run their
lives). The database of the working population is constructed from several waves of the
British Cohort Study (BCS). The BCS is a longitudinal survey that consists of 17,196
individuals at the start of the survey, including all children born in Britain in one particular
week in April 1970. The data include information about measured personality items at age
16. We use these items to build a personality inventory consistent with the Big Five
personality inventory.3 In addition, we decompose conscientiousness to investigate the facets
important in explaining different outcomes. Finally, changes in conscientiousness are used to
shed light on the importance of its development during childhood.
We start by estimating the magnitude and importance of personality traits at age 16 in
explaining socio-economic outcomes. We find that personality traits explain about 3 percent
of the variance in wages at age 34. In addition, when considered in isolation, a one standard
deviation increase in conscientiousness increases hourly wages by 8.6 percent. In our
preferred specification, controlling for cognitive ability and other personality traits, this
estimate drops to 4.1 percent. For other outcomes conscientiousness seems to be important
too. Higher levels of conscientiousness are associated with less unhealthy behaviour and
crime, and with higher savings and life satisfaction. After establishing a correlation between
early conscientiousness and socio-economic outcomes at age 34, a number of different
models are estimated. In these models we control for the child’s home environment,
educational outcomes, other measures of personality (Rutter scores, self-esteem and locus of
control) and social behaviour in school at age 16. In addition, we take into account that
3 The Big Five personality inventory is the most commonly used inventory for measuring personality traits. It
includes five measures: openness, conscientiousness, extraversion, agreeableness and neuroticism (or emotional
stability). See Borghans et al. (2008a) for an elaborate overview of the history, use across disciplines and
potential problems of this way of characterising personality.
3
people with different personality traits sort into different occupations. Our estimates of
conscientiousness and other early personality traits remain similar in terms of significance
and size. This suggests that the estimated differences in outcomes attributed to personality
traits are not the result of differences in the early environment, investments or other
behavioural characteristics.
Second, few economists or psychologists working on the relationship between personality
and outcomes address the issue of causality (e.g., Almlund et al., 2011). They apply — like
we do here — measures of early cognition and personality to predict later outcomes. This
yields endogeneity with errors in variables problems. We deal with measurement error in
three ways. First, we apply instrumental variables techniques (2SLS) in which we instrument
the mother-rated items at age 16 with the items at age 10. This way we deal with possible
correlation between the error term and traits. Second, we use structural equation modelling
(SEM), which is based on maximum likelihood. The main advantage of SEM is that it takes
into account measurement error at the level of the individual items we use to construct our
personality measures. Finally, we apply errors-in-variables (EIV) regressions, which is a
latent variable technique dealing with the fact that we possibly measure personality with
error. After applying these three techniques to deal with measurement errors in our
personality measures, our estimates are by and large similar in terms of both magnitude and
significance.
Next, we explore the lower-order structure of conscientiousness following the decomposition
made by personality psychologists (e.g., Roberts et al., 2004 and Jackson et al., 2009). The
decomposition of conscientiousness in different types or facets is based on the categorisation
that results from meta-analyses. The meta-analyses attempt to structure individual items
across different data sources, countries and age of measurement to dig out facets of the lower-
order structure of conscientiousness. We use the facets of conscientiousness that personality
psychologists generally agree about. These are impulse control (as used by Moffitt et al.,
2011), reliability, decisiveness and orderliness. The estimates for wages suggest that higher
levels of early impulse control, reliability, and decisiveness are facets that are correlated with
adult wages. Orderliness is also correlated with wages, but the pattern is less strong. In
general, the facet of orderliness also has the least relevance for the other socio-economic
outcomes considered. Higher levels of decisiveness are correlated with less unhealthy
behaviours and crime, and with higher savings. The same is true for facets related to impulse
control and reliability.

4
Finally, we examine the policy perspective. Much effort has gone into trying to improve
cognitive ability and a child’s home environment. Our findings suggest that there is also a
gradient of conscientiousness that is worthwhile investigating. Controlling for age-10
personality, persons who face declines in the conscientiousness distribution between the ages
of 10 and 16 end up with significantly less favourable scores on our socio-economic
outcomes. Those experiencing a decline in conscientiousness during childhood are
significantly more likely to be alcohol dependent, to smoke, use cannabis or get arrested as
adults, while also reporting significantly lower life satisfaction and a less healthy body mass
index. A decline in the distribution of conscientiousness by one standard deviation is
associated with 5.5 percent lower hourly wages, and 8.6 and 5.7 percentage point higher
likelihoods to be a smoker or regular cannabis user. On the one hand, these results suggest
that policymakers are most effective in preventing child development from falling behind,
while on the other hand, personality at age 10 in itself has predictive value for socio-
economic outcomes, pointing to the importance of the overall stimulation of the development
of valuable personality traits, and conscientiousness more specifically.
The analysis presented in this paper contributes to a recent literature in economics that has
focused on the distinction between cognitive and non-cognitive skills. It has been triggered
by the outcomes of intervention programmes, in which the most prominent outcome has been
better behaviour, not better cognitive skills (e.g., Schweinhart et al., 2005, Heckman et al.,
2007). Cunha and Heckman (2007, 2008) and Cunha et al. (2010) estimate models of skill
formation with the notion of complementarity between different types of skills. The results
most relevant for our work emphasise the role of personality traits that seem to be important
for later outcomes. We contribute to this literature by presenting estimates of specific facets
of conscientiousness that are important for socio-economic outcomes.
A closely related body of work applies these models more directly to labour-market outcomes
to show the relevance of personality traits. Heckman et al. (2006) show the relevance of and
changes in personality traits (locus of control and self-esteem) over the lifecycle. Mueller and
Plug (2006) estimate the effect of personality on earnings. They find that some personality
traits are penalised whereas others have positive returns. Borghans et al. (2008c), Krueger
and Schkade (2008) and Cobb-Clark and Tan (2009) show the importance of occupational
sorting when measuring the returns to different traits. This has recently also been picked up in
personality psychology by Roberts (2009) who emphasises the importance of different
environments and states in which people perform. Finally, early work by Filer (1983)

5
suggests that personality is important in explaining labour-market outcomes and gender wage
differentials. We also take into account the importance of sorting and add to these approaches
a longitudinal approach and a distinction between types of traits.
Thirdly, economists and psychologists have been trying to link economic preference
parameters to personality traits to predict outcomes.4 Borghans et al. (2008a) and Almlund et
al. (2011) summarise these attempts and suggest models for understanding and building
productive linkages. Becker et al. (2012) empirically explore three datasets to link personality
traits to economic preference parameters and find complementarity between the two.
Borghans et al. (2008b) find that performance motivation, fear of failure, internal locus of
control, curiosity, low discount rates, and risk aversion are positively associated with more
correct answers on a cognition test. Our results are also consistent with experimental
evidence from Sutter et al. (2012), who find that students with higher levels of impulse
control fare better in school and are more likely to obtain good labour-market outcomes. We
use a longitudinal approach to find the predictive power of conscientiousness and relate the
lower-order structure to evidence on economic preference parameters.
Finally, in personality psychology there is a literature on conscientiousness. From meta-
analyses Roberts et al. (2004) and Jackson et al. (2009) obtain that conscientiousness is a
construct of a number of important facets related to industriousness, orderliness, reliability,
decisiveness and impulse control. We obtain estimates suggesting that wages and other
outcomes seem to be related to impulse control, reliability and decisiveness as a child.
We proceed as follows. Section 2 documents the construction of the database from the BCS
and presents descriptive statistics. Section 3 presents a set of basic estimates showing
correlations between early personality traits and adult outcomes. Section 4 deals with the
effects of measurement error. Section 5 explores the anatomy of conscientiousness by
considering the lower-order structure of personality traits. Section 6 discusses the policy
perspective. Section 7 concludes.
4 Unfortunately our database does not contain measures of preference parameters. Nevertheless, impulse control
is related to risk aversion, reliability is related to social preferences, and decisiveness is related to time
preference (e.g., Daly et al., 2009). These three facets are the strongest predictors for the set of outcomes
considered. More precisely, higher scores on impulse control are correlated with higher wages and savings and
lower rates of unhealthy behaviour. This seems consistent with the evidence in economics about risk aversion
(e.g., Dohmen et al., 2010). Similarly, higher levels of decisiveness are correlated with higher wages, less crime
and better health outcomes, which is consistent with the evidence on time discounting (e.g., Frederick et al.,
2002). Finally, higher levels of reliability are correlated with higher scores on life satisfaction, health outcomes
and wages. The facet of reliability is related to social preferences. Reliable persons are more likely to be
trustworthy and are more altruistic (e.g., Fehr, 2009).

6
2. Data
We analyse socio-economic outcomes of employed persons as measured in the 2004 wave of
the British Cohort Study (BCS). The BCS is available from the Centre for Longitudinal
Studies (Institute of Education, University of London). The database contains data on births
and families of all babies born in Great Britain in one particular week in April, 1970. These
children were then followed throughout their lives, and data were collected roughly every 4
to 5 years. The last available wave is from 2008.
The main strength of the BCS is that it follows a complete cohort for a substantial period of
time, which allows for an analysis of adult socio-economic outcomes. The BCS contains a
wide range of items measuring cognitive and personality development. Data on children and
their families were collected when the respondents were aged 0, 5, 10, and 16. The adult
waves at ages 26, 30, 34, and 38 provide a set of outcome variables. In terms of adult
outcomes we use the 2004 wave. There are two reasons. First, at the age of 34, all persons
have left education and have been working for a while. This should yield reliable information
about labour-market outcomes and other social outcomes. Second, we prefer to use the 2004
wave over the 2008 wave, because of the larger sample.
Of the initial 17,196 babies born in 1970, 9,665 respondents remain in 2004. Of this group,
8,013 are employed, of which 6,106 report gross hourly wages. After further selecting
individuals with valid information on childhood ability and personality, we retain a working
sample of 2,934 respondents used for the analyses in this research. Table A1 in the Appendix
lists all variables and the way in which they are constructed or defined. Issues of attrition and
selection are discussed in Section 2.4 and illustrated in Table A2.
2.1. Personality Measures
Personality psychologists have developed measurement systems for personality traits, which
economists have begun to use. Most prominent is the Big Five personality inventory, which
contains five personality traits (OCEAN): openness, conscientiousness, extraversion,
agreeableness and neuroticism (emotional stability).
The Big Five taxonomy of personality allows us to capture the relative importance of
different dimensions of an individual’s personality (e.g., McCrae and John, 1992 and
Goldberg, 1993). The schedule below presents the descriptions of the traits as agreed upon by
the American Psychology Association. The final column presents facets of these five

7
personality traits measured in Child surveys. The BCS offers items on personality and
behaviour from which we are able to construct measures capturing a child’s
conscientiousness, extraversion, agreeableness and emotional stability. It is not possible to
capture openness with the available items.5 We compensate for the lack of a measure of
openness by including cognitive test scores.
Big Five factor American Psychology Association
Dictionary description
Childhood traits
Openness “the tendency to be open to new
aesthetic, cultural, or intellectual
experiences”
Sensory sensitivity, pleasure in
low intensity activities, curiosity
Conscientiousness “the tendency to be organised,
responsible, and hardworking”
Attention, distractibility,
effortful, self control, impulse
control, persistence, activity
Extraversion “an orientation of one’s interests and
energies toward the outer world of
people and things rather than the
inner world of subjective experience;
characterised by positive affect and
sociability”
Social dominance, social
vitality, sensation seeking,
shyness, activity, positive
emotionality,
sociability/affiliation
Agreeableness “the tendency to act in a cooperative,
unselfish manner”
Irritability, aggressiveness,
wilfulness
Neuroticism/
Emotional
Stability
Neuroticism is “a chronic level of
emotional instability and proneness
to psychological distress.”
Emotional stability is “predictability
and consistency in emotional
reactions, with absence of rapid
mood changes.”
Fearfulness, behavioural
inhibition, shyness, irritability,
frustration, sadness
Mothers are asked to rate the behaviour of their child on two sets of 19 items, both at ages 10
and 16. After removing 5 items on motor skills and 11 items on child behaviour, we group
the remaining 22 items into four clusters, representing conscientiousness, extraversion,
agreeableness, and emotional stability. The clustering is consistent with the clustering
obtained by personality psychologists (e.g., Goldberg, 1993), and confirmed by both cluster
analysis and principal component analysis on the set of 22 items. The first four components
5 Personality traits are distinguished from intelligence. Most measures of personality are only weakly correlated
with measures of cognitive ability (e.g., Webb 1915, McCrae and Costa 1994). There are, however, a small
number of exceptions. Most notably, cognitive ability is moderately associated with Openness. The reported
correlations are of the order of 0.3 or lower (e.g., Borghans et al., 2008a for a review). We compensate for the
lack of a measure of openness by including cognitive test scores.
8
of the principal component analysis return eigenvalues larger than one, and after orthogonal
rotation, the items load highly on their respective factors (and not on the other factors). The
results of these analyses are described in the Appendix (Section A1).
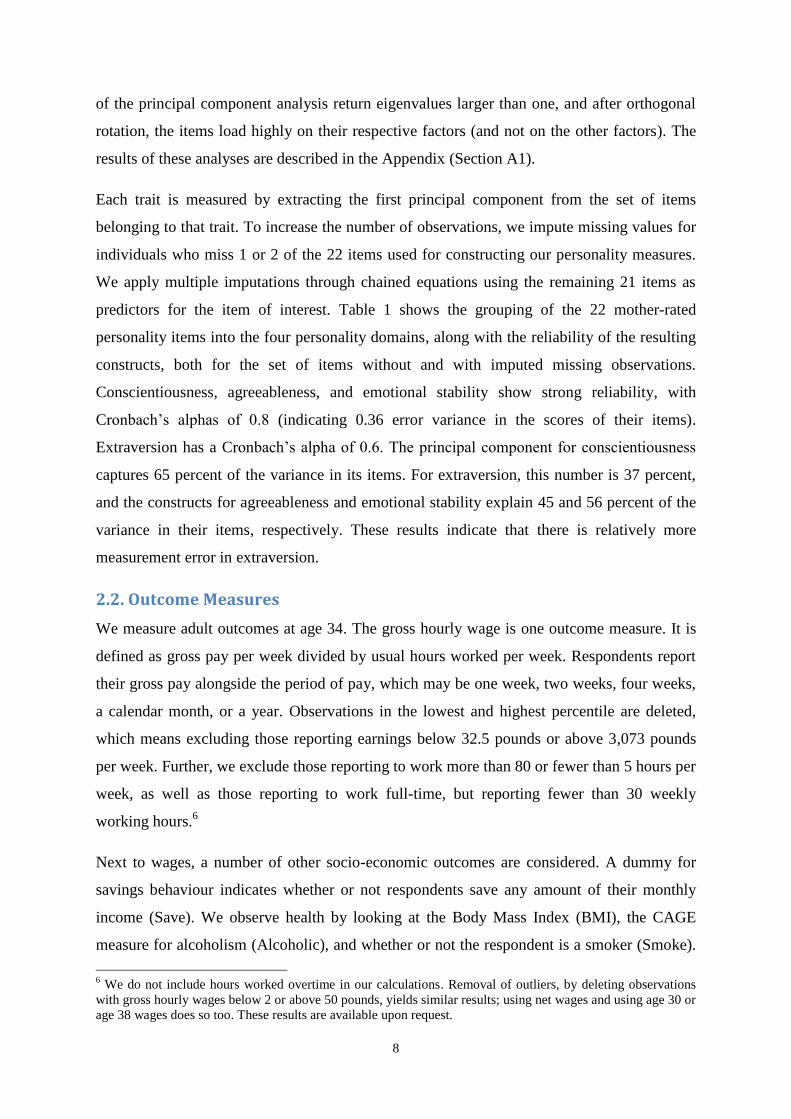
Each trait is measured by extracting the first principal component from the set of items
belonging to that trait. To increase the number of observations, we impute missing values for
individuals who miss 1 or 2 of the 22 items used for constructing our personality measures.
We apply multiple imputations through chained equations using the remaining 21 items as
predictors for the item of interest. Table 1 shows the grouping of the 22 mother-rated
personality items into the four personality domains, along with the reliability of the resulting
constructs, both for the set of items without and with imputed missing observations.
Conscientiousness, agreeableness, and emotional stability show strong reliability, with
Cronbach’s alphas of 0.8 (indicating 0.36 error variance in the scores of their items).
Extraversion has a Cronbach’s alpha of 0.6. The principal component for conscientiousness
captures 65 percent of the variance in its items. For extraversion, this number is 37 percent,
and the constructs for agreeableness and emotional stability explain 45 and 56 percent of the
variance in their items, respectively. These results indicate that there is relatively more
measurement error in extraversion.
2.2. Outcome Measures
We measure adult outcomes at age 34. The gross hourly wage is one outcome measure. It is
defined as gross pay per week divided by usual hours worked per week. Respondents report
their gross pay alongside the period of pay, which may be one week, two weeks, four weeks,
a calendar month, or a year. Observations in the lowest and highest percentile are deleted,
which means excluding those reporting earnings below 32.5 pounds or above 3,073 pounds
per week. Further, we exclude those reporting to work more than 80 or fewer than 5 hours per
week, as well as those reporting to work full-time, but reporting fewer than 30 weekly
working hours.6
Next to wages, a number of other socio-economic outcomes are considered. A dummy for
savings behaviour indicates whether or not respondents save any amount of their monthly
income (Save). We observe health by looking at the Body Mass Index (BMI), the CAGE
measure for alcoholism (Alcoholic), and whether or not the respondent is a smoker (Smoke).
6 We do not include hours worked overtime in our calculations. Removal of outliers, by deleting observations
with gross hourly wages below 2 or above 50 pounds, yields similar results; using net wages and using age 30 or
age 38 wages does so too. These results are available upon request.

9
A value of zero on our smoking dummy includes individuals who have never smoked before,
but also ex-smokers. A value of one includes occasional smokers, as well as respondents
smoking more than 20 cigarettes a day. The CAGE index is an assessment for alcohol
dependence and alcohol abuse using self-reported answers to four yes-or-no questions. We
construct a dummy for alcoholism using a cut-off point of 2 (0 if the score is below 2; 1
otherwise) on the four items of the CAGE questionnaire.7
Criminal behaviour is constructed by applying two dummy variables, indicating whether or
not the individual uses cannabis on a regular basis (Cannabis) and whether or not the
respondent has been arrested between ages 16 and 34 (Arrested). For cannabis use, a value of
zero indicates the respondent either has never tried cannabis, or has used cannabis in the past,
but never uses it nowadays. Values of one include respondents who use cannabis regularly,
be it only on special occasions or on most days. The dummy for arrests equals zero if the
respondent indicated never to have been arrested before and one if he had been arrested at
least once.
Finally, we measure life satisfaction with three different variables. On a scale from 0 to 10,
respondents are asked to indicate how satisfied or dissatisfied they are with the way life has
turned out so far (Satisfaction). In addition to this life satisfaction scale, we use two dummy
indicators that indicate whether respondents feel they get what they want out of life (Life
Get), and whether they feel they can usually run their life more or less as they want to (Life
Run). In both cases, a value of one indicates a positive view to life, whereas a value of zero
indicates, respectively, that respondents feel they never really seem to get out of life what
they want and that they usually find life’s problems just too much to handle.
2.3. Other Measures
Besides the personality measures and outcome measures discussed above, we also extract
information about cognitive ability and various other measures which we use as controls in
our models. We consider a child’s cognitive ability. We construct a measure using test scores
at age 10 because cognitive ability seems to be set at that age (e.g., Lebel and Beaulieu,
2011). Cognitive ability is measured by extracting the first principal component from a set of
eight standardised test scores, all measured at the age of 10. The test scores include the four
British Ability Scales (word definitions, recall of digits, similarities, matrices), as well as the
7 The CAGE questionnaire has been validated as a screening tool in general population samples, using the same
cut-off point of 2 (e.g., King, 1986, Buchsbaum et al., 1991).

10
Shortened Edinburgh Reading Test, the CHES Pictorial Language Comprehension and
Friendly Maths tests, and a spelling test. Cronbach’s alpha on the set of test scores is 0.89 and
the explained variance of the resulting principal component is 58 percent. School
performance, the home environment a child grew up in, social skills as a child, and final
education and occupation are also measured. These other measures are used alongside the Big
Five personality measures to estimate the effects of personality on outcomes, and are
introduced and discussed in Section 3. Table A1 provides the definitions and construction of
the various variables. Table A2 presents descriptive statistics for these variables, both for the
restricted working sample of 2,934 employed respondents with wage information and the
unrestricted sample containing all respondents.
2.4. Selection
When we restrict our sample to employed respondents with valid wage information, the
sample shows significant differences in terms of personality and socio-economic outcomes
compared to the full population of respondents with valid information on these measures (the
unrestricted sample). As Table A2 reveals, the working sample scores about a tenth of a
standard deviation higher on all personality traits. The unrestricted sample shows a higher
share of smokers, cannabis users, and arrests, and is on average less satisfied with life than
when we restrict the sample to the working sample.
The same holds for the different sets of control variables. Parents of the average respondent
in the working sample are more highly educated and have higher social class. Subjects
themselves are also more highly educated and have higher social class, while also displaying
less behavioural problems and higher self-esteem and internal locus of control as a child.
Selection on being employed and reporting wages significantly affects the sample statistics,
and might also influence the estimated relationship between personality and outcomes. While
all analyses in this paper are restricted to the working sample for consistency in the
estimation population, the results are robust to relaxing this selection for the other socio-
economic outcomes.
2.5. Descriptive Statistics
Table 2 shows the correlations between personality traits as well as their correlations with our
outcome measures. This yields a first indication of the relationship between childhood
personality and adult outcomes. Traits correlate significantly with outcomes, and in the
expected direction. One exception is extraversion, which is only significantly correlated with

11
wages and measures of satisfaction. Conscientiousness consistently shows the strongest
correlations. A more detailed picture of the correlation between conscientiousness and
outcomes is presented in Figure 1. It shows mean outcomes by deciles of conscientiousness.
The upper deciles are put together because we cannot discriminate in terms of
conscientiousness. There is a clear gradient in conscientiousness for most outcomes, where
those lower in the distribution of conscientiousness obtain less favourable outcomes than
those higher in the distribution. The bottom ten percent report average gross hourly wages
below 11 pounds, whereas the top forty percent earn over 14 pounds per hour. In terms of
smoking behaviour, the bottom ten percent is twice as likely to smoke compared to the top
forty percent (40 vs. 20 percent). As can be seen from Figure 1, similar patterns are obtained
for other outcomes.
Since we want to explore the relationship between childhood personality and a range of adult
socio-economic outcomes, we need to account for possible confounding relationships.
Cognitive ability, the home environment, sociability and education are all domains that relate
to adult wages and other socio-economic outcomes as well as to childhood personality. They
may therefore also influence estimates of the relationship between personality traits and
socio-economic outcomes. Table A3 in the Appendix compares respondents who score below
average on wages and the four personality traits with those who score above average on each
of these measures. Below and above average scorers are compared in terms of averages on
variables relating to the above mentioned domains. The obtained patterns suggest that there
are sizeable associations between these domains and both wages and personality.
Those ending up earning above average hourly wages by age 34 scored significantly higher
on all personality measures, both at age 10 and age 16. Consistent with the notion that
cognitive ability and education have significant effects on labour-market outcomes, they also
scored significantly higher on ability tests and went on to complete more years of schooling.
Additionally, above average earners had significantly better home environments when
growing up and scored significantly higher on most measures of sociability.
At the same time, these measures are also significantly associated with childhood personality.
Those with above average conscientiousness or agreeableness had better home environments
when growing up. To a lesser extent, the same holds for extraversion and emotional stability.
Above average personality traits are also associated with significantly higher sociability
measures; this applies to all four traits, specifically to agreeableness.

12
When it comes to the association between personality traits and cognitive ability and
educational achievements, the differences between the below- and above-average groups are
significant for conscientiousness and agreeableness, and most pronounced for
conscientiousness. Those with above average conscientiousness score 0.4 of a standard
deviation higher on our cognitive ability measure. Above average conscientiousness is also
associated with completing about 1.2 years more schooling.
Since both outcomes and personality traits are associated with childhood circumstances,
sociability and final educational achievement, it seems important to control for these domains
when estimating the relationship between personality traits and outcomes. Given the sizeable
and significant association between personality traits and ability measures, as observed in
Table A3, it is also important to account for cognitive ability in our models.
3. Personality Traits and Outcomes
Our first task is to show that there is a sizeable correlation between measured personality
traits at age 16 and adult outcomes. This section presents estimates with different sets of
controls.
3.1. Basic Estimates
Table 3 presents estimates of models in which outcomes are explained by measured
personality traits at age 16. Control variables for cognitive ability at age 10, region of birth
and dummies for gender and fulltime employment are added to these models. Investigation of
the four rows in Table 3 reveals that there is a statistically significant correlation between all
adult outcomes and the measure of conscientiousness. Agreeableness is also correlated with
most outcomes, yet to a lesser extent when compared to the correlations for
conscientiousness. The correlations for extraversion are mixed in nature, with higher
childhood extraversion being associated with higher adult satisfaction with life, but also with
less savings, higher rates of tobacco and cannabis use, and higher rates of arrest. The measure
of emotional stability is only significantly correlated with savings and crime. The size of the
coefficients varies. In general, the size of the coefficient on conscientiousness is the largest.
Since our personality measures are standardised to have mean zero and a standard deviation
of one within each regression sample, the coefficients can be interpreted as a ceteris paribus
change in the outcome measure for a one standard deviation increase in the measured
personality traits. Using this way of interpreting the estimates, individuals who have a one

13
standard deviation above average conscientiousness at the age of 16, earn on average 4.1
percent higher gross hourly wages ( ) by the age of 34. Their BMI at that age is
0.22 points lower, and (on a scale from 0 to 10) they rate their life satisfaction 0.11 points
higher. On average, they are also 3.2 percentage points more likely to save, 3.2 percentage
points less likely to be alcoholic, 4.2 percentage points less likely to smoke, and 2 percentage
points less likely to use cannabis on a regular basis. A one standard deviation increase in
conscientiousness is further associated with a 1 percentage point lower likelihood of ever
having been arrested, and with improved feelings of getting out of life what one wants and
feeling one can run one’s life as desired (2.9 and 0.7 percentage points higher, respectively).
The same analysis has been performed for men and women separately. Using data from the
Wisconsin Longitudinal Study, Mueller and Plug (2006) find that the coefficients on the
different traits differ across gender. This merits further analysis because they find that
especially female outcomes are sensitive to differences in conscientiousness. However, we do
not find statistically significant differences between the sexes when we repeat the analysis
presented in Table 3 for men and women separately.8 The effect sizes for males are somewhat
higher and for females they are somewhat lower. The estimated effects on wages (comparable
to Table 3, column (1)) are .0544 for men and .0244 for women. The estimated effects remain
statistically significant. The estimation results are available upon request.
3.2. Extensions
The fact that particularly conscientiousness at age 16 explains outcomes needs further
analysis. We extend the analysis into four directions. First, we investigate the role of parents
and the home environment. A sound home environment and parental inputs are key factors
for child development (e.g., Herrnstein and Murray, 1994 and Shonkoff and Phillips, 2000).
Second, we examine the role of education. Abilities and traits are to a large extent created and
education may help to build these (e.g., Cunha et al., 2010). Third, we add measures of
sociability, self-esteem and locus of control. These covariates help shape a more balanced
personality and are positively correlated with labour-market success (e.g., Persico et al.,
2004, Heckman et al., 2006 and Borghans et al., 2008c). Finally, we conduct analyses in
which we control for the average level of personality traits within one’s occupation. The
reason for doing so is that absolute levels of personality traits could be misleading and that
8 The only exception is regular use of cannabis. The effects of conscientiousness on cannabis use are only
significant for men. When adding interaction terms of personality traits with the male dummy, the differences in
coefficients for men and women are only significant for cannabis use.

14
relative measures determine success (e.g., Gronau, 1974 and Borghans et al., 2008c). Table 4
and Table 5 present the results.9
3.2.1. Home Environment
If it is the home environment that is the key factor influencing adult wages, personality traits
should have no effect on outcomes if we control for parental investments. We add a number
of controls for the child’s home environment to the basic model: dummies for the absence of
the father at birth and for having a teenage mother; years of education of the parents; social
class of the parents measured by whether or not parents had a skilled or professional
occupation when the child was born; parenting styles and parent-child relationships; parents
holding of a liberal worldview; parental beliefs in giving a child some freedom and teaching
the child discipline at age 5; the child’s view on family ties at age 10, and on parental skills at
age 16.10
The variables are documented and defined in Table A1 and descriptive statistics are shown in
Tables A2 and A3 in the Appendix. The descriptive information presented in Table A3
suggests that above average earners grew up in more beneficial home environments. Their
parents completed more years of schooling and had a higher social class. At age 5, their
parents had a more liberal world view and believed less in strict authoritarian childrearing. At
age 10, they experienced stronger family ties than below average earners did at that age. The
first row of Table 4 shows that controlling for the home environment does not substantially
affect the correlation between the measure of early conscientiousness and adult outcomes.
The coefficients are comparable to the ones in Table 3, and remain significant, except for the
coefficients on BMI, alcohol dependence and crime (being arrested). While similar in
magnitude, these coefficients are no longer statistically significant.
3.2.2. Education
The positive relationship between educational achievement and wages is well-known, and is
also apparent from Table A3. If personality is predictive of outcomes because it affects final
9 Whereas Table 4 only reports the coefficient on conscientiousness, Table A4 in the Appendix displays the
estimates for the other three measures of personality in the same way as documented in Table 4. 10
Adding more covariates to the regression models reduces the number of observations. However, the pattern of
results remains similar. Parental social class, childrearing style, and good parent-child relationships do seem to
matter most in terms of explaining outcomes. Additional measures associated with the home environment are
number of younger and older siblings (at ages 5, 10, and 16), being read to as a 5-year old, being in a single
parent family and living with both natural parents (at ages 0, 5, 10, and 16), and having experienced separation,
divorce, and/or death of parent(s) between birth and age 16. When adding these to our models, they do not
significantly affect outcomes, nor do they have an impact on the estimated effects of personality.

15
educational achievement, controlling for education would result in insignificant, or
significantly lower, estimated effects for conscientiousness. To control for educational
attainment, we use completed years of schooling. We also control for social class by adding a
dummy that equals one if the respondent’s job is of a skilled or professional nature. The
second row of Table 4 shows that the results of these analyses do not alter the picture, with
the exception of crime. In general, measured conscientiousness is correlated with measures of
education and social class, but the estimated correlations between conscientiousness and
outcomes are not significantly affected.
The estimated effects of education and social class on wages are relatively large. In a causal
interpretation of the estimates, an additional year of schooling is estimated to yield 1.3
percent higher gross hourly wages. Being employed in a skilled or professional occupation is
associated with about 30 percent higher hourly wages, compared to lower level jobs.
Adjusting for social class at earlier ages (30 and 26) yields similar results.
3.2.3. Early Sociability, Self-esteem and Locus of Control
Another channel through which conscientiousness could affect outcomes is sociability. Being
more sociable and having a better social standing is likely to influence success in school or
the labour market. Since personality measures could be correlated with early sociability, we
incorporate a number of sociability measures into our models.
The Rutter score is a measure of behavioural problems, and is achieved by summing up the
scores on 16 mother-rated items. Self-esteem relates to someone’s sense of self-worth and
confidence. It is constructed by summing up the scores on 12 self-rated items. Locus of
control measures whether respondents see the world as deterministic or that an individual can
alter outcomes through hard work and effort. The measure for locus of control results from
adding up the scores of 15 self-rated items.11
The Rutter, self-esteem, and locus of control
scores are standardised to have mean zero and standard deviation one within each regression
sample. Sociability at age 16 includes a self-rated amount of sports and number-of-friends
indicator, both within and outside school. The Appendix provides details about the individual
items and the construction of the measures applied here. Tables A2 and A3 provide
descriptive statistics for these measures.
11
We use measures of self-esteem and locus of control as measured at the age of 10, but we also derived these
measures at age 16. However, we are only able to construct these measures for a limited number of individuals
at age 16. The sample is reduced to about 1,100. The estimates remain comparable to the ones we present here.

16
The last three rows of Table 4 present the results of these regression models. Controlling for
self-esteem and locus of control does not seem to alter the estimates of measured
conscientiousness for wages and other socio-economic outcomes. Including Rutter scores at
ages 5, 10 and 16 or sociability at age 16 seems to affect the outcomes on the life satisfaction
indicators only.12
Table A4 reports the coefficients on the other three measured personality traits. While the
effects of conscientiousness remain intact after controlling for the home environment, many
of the effects for the three other personality measures reduce and often become insignificant.
In general, the same holds when we add controls for childhood behaviour problems (Rutter)
or sociability at age 16 (Sociability). Controlling for educational achievements or for self-
esteem and locus of control at age 10, however, does not alter the associations with outcomes
for the other personality traits. Thus, the correlation between personality and adult outcomes
is distinct from correlations between these outcomes and education and social class, as well
from the associations between measures of early behavioural problems and outcomes.
3.2.4. Sorting
Different workers flock to different jobs in the sense that personality is likely to influence a
person’s occupational choice. We construct measures of occupations from the Standard
Occupational Classification of 2000 (SOC2000) to determine the possible effects of selection
into different occupations on our estimates.
Table A5 shows the different categories and demonstrates that people in different occupations
differ significantly in terms of personality traits. For example, Science and Technology
Professionals score significantly higher than average conscientiousness, agreeableness, and
emotional stability at age 16. On the other hand, people becoming Mobile Machine Drivers at
age 34 score over half of a standard deviation below average on conscientiousness and
agreeableness. These statistics suggest that there is value in analysing the effects of
occupational differences in personality traits.
12
Other age-10 sociability measures considered in our analyses are teacher rated popularity with peers and
number of friends, as well as teach rated boldness (as opposed to shyness) and cooperativeness. These are
positively associated with wages, but leave our personality estimates unchanged. Other age-16 sociability
measures considered are having any hobbies and number of hours spent on them (at 16), having a very close
friend and ever having had a boy/girlfriend (at 16), ever having been removed from class, suspended from
school, and been in contact with the law (at 16). None of these influence wages if we add them to our main
specification, and they also do not affect our personality estimates. The same holds for controlling for age-16
social outcomes: ever tried cannabis, ever tried cocaine, alcohol consumption, criminal activity and temptation,
and being arrested.

17
Table 5 shows the results of two models in which we control for average personality traits
within occupations. Since the personality of people in different occupations differs, the
correlation between conscientiousness and wages drops.
We explore two sets of equations. The first set adds the average personality traits within
one’s occupation (“Avg Occ. ... (16)”). The second set of estimates does not include the
personality trait itself, but a set of dummy variables indicating whether or not the individual
scores above the occupational average on each personality trait. For example, to arrive at the
dummy “Above Avg Occ. C (16)”, we first subtract the average level of conscientiousness in
the occupation an individual is employed in from his own conscientiousness at age 16. The
dummy indicator is set to one in case the resulting difference is positive, and it is set to zero
otherwise. In addition to our main controls, we further control for number of years on the job
and add social class dummies to the model.13
In column (1) we observe that average occupational personality traits seem to be significant
predictors of wages. The effect of individual conscientiousness is much lower, once average
conscientiousness within one’s occupation is controlled for. The estimate drops from 0.040 in
Table 3 to .016, and is no longer significantly different from zero, at conventional
significance levels. This suggests that much of the estimated wage premium for early
conscientiousness could result from occupational sorting.
The final specification, presented in column (2), compares those with below average
personality traits to those with above average personality traits. Individuals with traits above
the occupational average, in terms of conscientiousness, earn on average 4.4 percent higher
gross hourly wages than those below the average, suggesting that even within one’s
occupation, with a more homogeneous distribution of personality traits, it pays to be more
conscientious. This is, however, not the case for the other traits.
4. Measurement Error
Measurement error in personality traits could bias our estimated effects of personality traits
on outcomes. We deal with possible effects of measurement error in three ways. We re-
estimate the models documented in Table 3 by using 2SLS, errors-in-variables (EIV)
13
We also conducted the analysis using age-10 information on personality traits. The results are qualitatively
similar to the ones presented here.

18
regressions and structural equation modelling (SEM). The results are presented in Table 6;
the first-stage estimates of the 2SLS models are displayed in the Appendix (Table A6).
The OLS regressions presented in Table 3 could be biased because of correlation between the
independent variables and the error term. The most common way to deal with this problem is
to apply an instrumental variables technique. We use the age-10 personality constructs as
instruments for those measured at age 16 (see Table 1 for reliability coefficients). We assume
that measurement error in the mother-rated items at both points in time is uncorrelated, which
seems plausible given the six-year window between the two surveys. The first-stage results
shown in Table A6 look fine and the F-tests well exceed the threshold of 10. The predicted
traits obtained from the first stage are standardised to have mean zero and standard deviation
one, such that the resulting coefficients can be compared with those from the main
specifications reported in Table 3. The second-stage estimates are shown in the top panel of
Table 6. The coefficients for conscientiousness are generally slightly smaller, and estimated
with less precision, which is demonstrated by the lower t-statistics. This is especially true for
the measures of life satisfaction, for which the effects of conscientiousness are no longer
significantly different from zero. The same pattern of changes exists for the other personality
traits. The main exception is the estimated correlation between conscientiousness and wages,
which has become stronger, with a point estimate of .049.
A second concern with our measures of personality is that the reliability of the four traits
differs. A constructed trait less prone to measurement error is more likely to yield significant
estimates, which would lead to flaws in our interpretation. To deal with this possibility we
use EIV regressions in which Cronbach’s alphas (see Table 1) are applied as reliability
measures for the traits. The Cronbach’s alpha associated with cognitive ability at age 10 is
.90, and is also applied. The second panel of Table 6 presents the estimates. Generally, the
coefficients turn out to be similar to the ones presented in Table 3 in terms of statistical
significance. The point estimates are generally slightly larger. For conscientiousness we again
obtain a higher order of magnitude, with a coefficient of .048.
Finally, SEM is a maximum likelihood technique to deal with measurement error. It takes
into account measurement error at the level of the 22 items we use to construct our four
measures of personality traits. More specifically, the errors in the items are part of the
estimation procedure and incorporated in the measurement model. The bottom panel in Table
6 shows the estimation results of correcting for measurement error at the item-level. Once

19
again, the pattern of significance is similar to the results from Table 3, with slightly higher
estimates, which are measured less precisely. The estimated effect on hourly wages of a
standard deviation increase in conscientiousness (.041) is similar to that obtained in Table 3
(.040).
All in all, the predictions in Table 3 do not change substantially when we correct for possible
measurement error in the measured traits. The associations found in Table 3 remain
significant, even with slightly larger point estimates. In the next sections we therefore
continue by using OLS estimators.
5. Decomposing Conscientiousness
The estimation results point towards an important role for conscientious in explaining
outcomes relative to the other personality traits. We continue our analysis with a more
detailed decomposition and investigation of the importance of early conscientiousness in
explaining outcomes at age 34.
5.1. Lower-Order Structure
Our measure of conscientiousness is constructed from a number of items from which we have
constructed the Big Five inventory to relate to the most common way of analysing personality
traits in the literature. Personality psychologists have examined the lower-order structure of
measured conscientiousness and other personality traits. Roberts et al. (2004) and Jackson et
al. (2009) use a psycholexical method to investigate in a large number of databases whether
or not measures of conscientiousness consist of multiple components.14
Roberts et al. (2004)
performed a principal component analysis on 83 items drawn from over 2,000 surveys. It
turns out that measured conscientiousness consists of a number of facets. Roberts et al.
(2004) find nine facets, Jackson et al. (2009) five. The five most important facets of
conscientiousness that appear from these meta-analyses are impulse control, orderliness,
decisiveness, reliability, and industriousness.
Jackson et al. (2009) find that no existing personality measure includes all facets of
conscientiousness identified from the psycholexical search. Roberts et al. (2004) show that
there are good levels of discriminant validity with the remaining traits in the Big Five. This
14
Roberts et al. (2004) and Jackson et al. (2009) present an overview of the relevant literature from which the
lower-order structure of conscientiousness is derived.

20
allows us to add facets of conscientiousness along with the other three traits (extraversion,
agreeableness and neuroticism).
Facet of
conscientiousness
Description BCS item
Impulse control “The propensity to inhibit proportional
responses”
Easily distracted
Orderliness “The propensity to be organised and neat” Difficulty concentrating
Decisiveness “The propensity to make deliberate
decisions”
Cannot settle
Reliability “The propensity to be responsible and
dependable”
Fails to finish things
Industriousness “The propensity to work hard” -
Source: Roberts et al. (2004) and Jackson et al. (2009).
Investigation of the list of 83 items explored by Roberts et al. (2004) suggests that our items
of conscientiousness (see Table 1) can be put into four facets of conscientiousness. The item
“cannot settle” falls into the category of decisiveness; “easily distracted” in impulse control;
“fails to finish things” in reliability; and “difficulty concentrating” in orderliness. Our
database also contains a measure of locus of control, which is related to impulse control.
Table 7 displays correlation coefficients among the four facets of conscientiousness, as well
as their correlations with the measured personality traits and outcome variables. Only those
coefficients that are significant at the 5 percent level are shown. Note that positive correlation
coefficients indicate that better behaviour is positively associated with the variable at hand.
Of these four facets, “fails to finish things” and “easily distracted” show the highest
correlations with the conscientiousness construct, as well as with our outcome measures. This
is consistent with the observation by Jackson et al. (2009) and Roberts et al. (2004), who also
find the strongest outcomes on these two facets of measured conscientiousness in their search
for a lower-order structure of personality traits. Locus of control is also statistically
significantly correlated with conscientiousness and with the four facets. The correlation
coefficients between locus of control and the facets of conscientiousness are much lower
compared to the correlations of the four facets with one another, which is consistent with the
findings in Table 4. Its correlation with measured emotional stability, pointed at in some
other studies, is low, relative to its correlation with conscientiousness (e.g., Almlund et al,
2011).

21
5.2. Returns to Different Items
The next step is to add the individual facets of measured conscientiousness to the regression
models to see what aspects of conscientiousness explain the various outcomes at age 34.
Table 8 reports the estimates for wages with different sets of controls. Table 8 reports the
estimates for the other outcomes for the main specification.
Each column in Table 8 is the result of estimating a specification as shown in Table 4. Each
cell refers to a separate analysis in which we have included the individual facets instead of
measured conscientiousness. For example, when estimating the wage effect of
conscientiousness item “fails to finish things”, we regress adult wages on that item, age-16
personality measures extraversion, agreeableness, and emotional stability, and on other
controls, depending on the specification used; but we do not include the construct of
conscientiousness itself. We have estimated models for the four individual facets of
conscientiousness and for locus of control.
Investigation of the rows in Table 8 suggests that the facets “fails to finish things” and “easily
distracted” and the trait “locus of control” return significant and sizeable effects on wages.
This is true to a lesser extent for the facet “cannot settle”, which is insignificant when we
control for the home environment or early sociability. The facet “difficulty concentrating”,
which is related to orderliness, does not seem to be a significant determinant of wages at age
34.
Table 9 reports the estimates of the facets of conscientiousness on the other socio-economic
outcomes. The estimates support the results from Table 3. Those who have a higher level of
measured conscientiousness at age 16, are significantly more likely to save, more satisfied
with their lives, and less likely to be alcohol dependent, to smoke and to use cannabis.
The facet “cannot settle” is most strongly associated with savings, BMI, smoking and crime.
This suggests that more decisive persons are less likely to make mistakes or behave in an
unhealthy way. The item “fails to finish things”, related to reliability, is significantly
associated with more healthy behaviour and higher life satisfaction. The facet “easily
distracted” and locus of control, related to impulse control, show similar effects.
In terms of what facets of conscientiousness are important for adult wages, we see that
reliability, decisiveness and impulse control when young seem to be relevant. Scoring a
standard deviation higher on locus of control at age 16, is associated with 10 percent higher

22
hourly wages at age 34. The facet of reliability comes close to what personality psychologists
have also identified as social responsibility. Roberts and Bogg (2004) show for example that
this facet of conscientiousness is a good predictor for adult outcomes related to family, work
and substance use. Impulse control is related to the rate of risk aversion used in economics.
People who are better able to imagine the consequences of their behaviour experience better
outcomes (see Borghans et al., 2008a for a discussion). Becker et al. (2012) obtain similar
outcomes for Germany. They show that risk aversion and conscientiousness are correlated,
without investigating individual facets. Decisiveness is related to the rate of time preference
and self-control. In general, persons with a lower discount rate make less mistakes (unhealthy
behaviours, crime) save more and earn higher wages. This is also borne out by the
correlations we obtain in Table 9. Moffitt et al. (2011) confirm this result, by showing that
children with poor self-control were more likely to make mistakes as adolescents, resulting in
poorer health outcomes, a higher probability to become unplanned teenage parents and a
higher probability to commit crime.
6. Policy Perspective
From the point of view of policy our findings are relevant. Many educational programs have
been designed to promote educational equity. There is economic value in equalising
educational opportunities and achievement for all because underdeveloped human potential
burdens economic efficiency. Most programs have been focussing on increasing cognitive
ability of poor and disadvantaged children. Heckman et al. (2007) show for example that,
while the positive effects on cognitive ability are only short-lived, the Perry preschool
program in the United States has produced reductions in teen pregnancy, school dropout,
delinquency and work absenteeism. Above, we have presented similar effects of early
personality traits on wages, savings, unhealthy behaviours and crime.
From a policy point of view it is now interesting to search for a possible gradient of
conscientiousness and its malleability. If a gradient of conscientiousness in outcomes is
present, the policymakers’ interest should be to investigate whether they can intervene and
move people up the gradient. As described in Section 2, Figure 1 plots the averages of the age
34 socio-economic outcomes by the deciles of the age-16 conscientiousness distribution. Less
conscientiousness at the age of 16 is associated with lower wages, less savings and lower
satisfaction with life by age 34. At the same time, respondents who were more conscientious
as children, have a lower body mass index, are less likely to be dependent on alcohol, to

23
smoke or use cannabis regularly, and are less likely to have ever been arrested. These cross-
sectional patterns reveal the existence of a gradient of conscientiousness worth investigating.
Although measured on a different scale, the items we use to construct age-16
conscientiousness, extraversion, agreeableness, and emotional stability are also available at
the age of 10, which allows us to rank respondents on each personality trait at two points in
time. Our data do not include an experimental intervention, but we can explore individual
changes in the distribution of these traits between ages 10 and 16 to predict socio-economic
outcomes. We present two sets of estimates that demonstrate that especially changes in
conscientiousness matter for socio-economic outcomes, and that large declines in the
distribution of conscientiousness are particularly harmful.
Table 10 shows regression results from adding the change in personality traits between 10
and 16 as covariates, along with the levels of these same traits at age 10. Prior to calculating
changes in personality, the factor scores on both age 10 and age 16 personality traits are
standardised to have mean zero and standard deviation one, within the sample of respondents
with enough information to perform the analysis. This way, we avoid changes in averages
and variance in personality due to attrition or selection bias. Besides these personality
measures, we include the same controls as used in our main specification (see Table 3).
The pattern of the coefficients on the age-10 personality traits is consistent with that found in
Table 3, for the age-16 personality traits. Conditional on the level of the personality traits at
age 10, especially changes in conscientiousness between the ages of 10 and 16 are significant
and sizeable explanations for socio-economic outcomes. The change in conscientiousness is
predictive of all outcomes, except body mass index and being arrested; that latter being the
only outcome significantly affected by changes in emotional stability. The change in
extraversion from 10 to 16 is predictive of the same behaviours, and in the same way as age-
16 extraversion in Table 3. The change in the distribution of extraversion between 10 and 16
is positively associated with the three life satisfaction measures, while also being associated
with less saving, more tobacco and cannabis use, and higher rates of arrest.
The estimated effect of a change in conscientiousness on wages .028. This indicates, that a
respondent who improved in conscientiousness, from being average at age 10 to scoring one
standard deviation above average six years later, earns on average 2.8 percent higher gross
hourly wages at age 34 than an individual scoring the same at age 10 and age 16 on
conscientiousness ( ( ) ( ) ). This hypothetical individual then also has a 3.2

24
percentage point lower likelihood of being alcohol dependent, a 3.5 percentage point lower
likelihood to be a smoker, and a 2.2 percentage point lower likelihood to be a regular
cannabis user. The results in Table 10 show that it is not only the stock of personality traits at
one point in time, but also the development in terms of these traits over time that matter for
later life outcomes.
Changes in personality can be both negative and positive, but Table 10 does not allow us to
distinguish the effects of rising or falling in the distribution. Second, the results in Table 10
might understate the importance of changes for a number of reasons. First, given that
personality measures show high levels of correlation, even at young ages (e.g., Roberts and
DelVecchio. 2000), most individuals report only small changes. Even if the distribution of
personality traits remains the same, measurement error in our items might lead to small
observed changes. If it is further the case that only substantial changes matter for outcomes,
the estimates in Table 10 might understate the importance of distributional changes. We
therefore explore the effect of large increases and decreases in personality traits between the
ages of 10 and 16.
Rather than looking at absolute changes in the distribution, we distinguish between risers and
fallers in terms of personality. We consider the top and bottom quartile in terms of changes in
personality traits (i.e., ) as risers and fallers, respectively, with those in the middle
representing respondents relatively stable on the trait at hand. Defining stable individuals as
those reporting absolute changes smaller than half a standard deviation and defining two
dummy variables to indicate either large decreases ( ) or large increases ( ),
fits this approach well, while facilitating comparison and interpretation of coefficients. For
conscientiousness, 56 percent of respondents reports absolute changes smaller than half a
standard deviation. For agreeableness and emotional stability this share is 48 percent, and it is
41 percent for extraversion. For each trait, risers and fallers are equally distributed among the
remaining respondents.
Table 11 presents the estimates of this approach. The estimates suggest that the importance of
changes in personality for adult wages is more likely to be associated with a decrease in
personality during childhood. Only 7 out of 50 rise dummies are significant at the 10 percent
level, which is at chance level. On the other hand, the same holds for 16 out of 50 fall
dummies. For conscientiousness, a large decline in the distribution is significantly associated
with all ten socio-economic outcomes, whereas a rise is not significantly associated with any

25
of these outcomes. Compared to someone stable in terms of all four traits, an individual that
experienced a large decline in conscientiousness between ages 10 and 16 earns 5.5 percent
lower gross hourly wages. The likelihood of being an alcoholic, a smoker, or a cannabis user
is also higher (5.7, 8.3 and 5.5 percentage points higher, respectively), and the individual is
also 3.4 percentage points more likely to have ever been arrested. Given that 18 percent of
our working sample are alcohol dependent, 26 percent are smokers, 15 percent use cannabis
regularly, and 14 percent have been arrested, these effects are quite substantial.
These results suggest that policymakers could be most effective in preventing children from
falling behind. However, personality at age 10 also has predictive value for these same
outcomes, which points to the importance of the overall stimulation of developing personality
traits and conscientiousness more specifically.
7. Conclusion
This research has presented an analysis of correlations between early measures of personality
traits and adult outcomes using data from several waves of the 1970 British Cohort Study.
Our main findings suggest that early conscientiousness is strongly correlated with adult
wages and other socio-economic outcomes. Controlling for a number of measures related to
the childhood home environment, early sociability and educational achievement. In addition,
measurement error does not seem to plague our estimated effects, since three different types
of analyses to deal with measurement error do not substantially change the estimation results.
A substantial share of the conscientiousness wage premium is likely to stem from sorting into
higher paying occupations, while within a single occupation, it still pays to have above
average conscientiousness. Investigating a variety of measures and structures of personality
suggests that impulse control, decisiveness and reliability are among the most important
facets of conscientiousness in explaining outcomes. These facets can be related to economic
parameters such as risk aversion, social preferences and time preference.
Our findings are consistent with previous research that suggests that differences in
personality traits are important in explaining differences in outcomes. We know that
cognitive ability and low social class origins are hard to improve through intervention
programmes (e.g., Heckman et al., 2007). In addition, looking at our gradient of
conscientiousness, it turns out that conscientiousness is heterogeneous and a strong
determinant of socio-economic outcomes. From a policy point of view it seems beneficial to

26
investigate possibilities to improve conscientiousness (e.g., Moffitt et al., 2011), or at least to
prevent children from falling behind in their development throughout childhood.
Further research by economists and psychologists is necessary. Borghans et al. (2008a)
present a research agenda for economists and Roberts (2009) presents suggestions for
improvement for psychologists. This paper has taken up a small part of this agenda, but a
deeper understanding of the interactions between early traits and adult outcomes seems
relevant. Also, the interplay with the home environment, school and different states of a child
and his later outcomes is not well-understood. Finally, dealing with measurement error in
traits remains an important direction for improvement and further research. Both theoretical
and empirical effort is required to make progress and to be able to design effective
interventions.
References Becker, A., Deckers, T., Dohmen, T., Falk, A. & Kosse, F. (2012). The Relationship Between
Economic Preferences and Psychological Personality Measures. IZA Discussion Paper
No. 6470.
Borghans, L., Duckworth, A. L., Heckman, J. J., & ter Weel, B. (2008a). The Economics and
Psychology of Personality Traits. Journal of Human Resources, 43(4), 972-1059.
Borghans, L., Meijers, H., & ter Weel, B. (2008b). The Role of Noncognitive Skills in
Explaining Cognitive Test Scores. Economic Inquiry, 46(1), 2-12.
Borghans, L., ter Weel, B. & Weinberg, B. A. (2008c). Interpersonal Styles and Labor
Market Outcomes. Journal of Human Resources, 43(4), 815-858.
Buchsbaum, D., Buchanan, R., Centor, R., Schnoll, S. & Lawton, M. (1991).
Screening for alcohol abuse using CAGE scores and likelihood ratios. Annals of
Internal Medicine, 115(10), 774-777.
Cunha, F., & Heckman, J. (2007). The Technology of Skill Formation. American Economic
Review, 97(2), 31-47.
Cunha, F., & Heckman, J. J. (2008). Formulating, Identifying and Estimating the Technology
of Cognitive and Noncognitive Skill Formation. Journal of Human Resources, 43(4),
738-782.
Cunha, F., Heckman, J. J., Lochner, L., & Masterov, D. (2006). Interpreting the Evidence on
Life Cycle Skill Formation. In E. Hanushek and F. Welch (eds.): Handbook of the
Economics of Education (pp. 697-812).
Cunha, F., Heckman, J. J., & Schennach, S. M. (2010). Estimating the Technology of
Cognitive and Noncognitive Skill Formation. Econometrica, 78(3), 883-931.
Daly, M., Delaney, L. and Harmon, C. P. (2009). Psychological and Biological Foundations
of Time Preferences. Journal of the European Economic Association, 7(2-3), 659-669.
Dohmen T., Falk A., Huffman D. & Sunde U. (2010). Are Risk Aversion and Impatience
Related to Cognitive Ability? American Economic Review, 100(4), 1238-1260.
Doyle, O., Harmon, C. P., Heckman, J. J., & Tremblay, R. E. (2009). Investing in Early
Human Development: Timing and Economic Efficiency. Economics and Human
Biology, 7(1), 1-6.

27
Fehr, E. (2009) On the Economics and Biology of Trust. Journal of the European Economic
Association, 7(1), 235-266.
Filer, R. K. (1983). Sexual Differences in Earnings: The Role of Individual Personalities and
Tastes. Journal of Human Resources, 18(1), 82-99.
Frederick S., Loewenstein G. & O’Donoghue T. (2002). Time Discounting and Time
Preference: A Critical Review. Journal of Economic Literature, 40(2), 351-401.
Goldberg, L. R. (1993). The Structure of Phenotypic Personality Traits. American
Psychologist, 48(1), 26-34.
Gronau, R. (1974). Wage Comparisons: A Selectivity Bias. Journal of Political Economy,
82(6), 1119-1143.
Heckman, J. J. (2007). The Economics, Technology, and Neuroscience of Human Capability
Formation. Proceedings of the National Academy of Sciences of the United States of
America, 104(33), 13250-13255.
Heckman, J. J., Malofeeva, L., Pinto, R. R. & Savelyev, P. (2007). The Effect of the Perry
Preschool Program on the Cognitive and Noncognitive Skills of its Participants.
University of Chicago, Working Paper.
Heckman, J. J., Stixrud, J., & Urzua, S. (2006). The Effects of Cognitive and Noncognitive
Abilities on Labor Market Outcomes and Social Behavior. Journal of Labor
Economics, 24(3), 411-482.
Herrnstein, R. J., & Murray, C. A. (1994). The Bell Curve: Intelligence and Class Structure
in American Life. New York, NY US: Free Press.
Jackson, J. J., Bogg, T., Walton, K. E., Wood, D., Harms, P. D., Lodi-Smith, J., et al. (2009).
Not All Conscientiousness Scales Change Alike: A Multimethod, Multisample Study of
Age Differences in the Facets of Conscientiousness. Journal of Personality and Social
Psychology, 96(2), 446-459.
John, O. P., & Srivastava, S. (1999). The Big Five Trait Taxonomy: History, Measurement,
and Theoretical Perspectives. In L. A. Pervin & O. P. John (Eds.), Handbook of
personality: Theory and research (2nd ed.). (pp. 102-138). New York, NY US:
Guilford Press.
King, M. (1986). At risk drinking among general practice attenders: validation of the CAGE
questionnaire. Psychological Medicine, 16(1), 213-217.
Knudsen, E. I., Heckman, J. J., Cameron, J. L., & Shonkoff, J. P. (2006). Economic,
neurobiological, and Behavioral Perspectives on Building America’s Future Workforce.
Proceedings of the National Academy of Sciences of the United States of America,
103(27), 10155-10162.
Krueger, A. B., & Schkade, D. (2008). Sorting in the Labor Market. Journal of Human
Resources, 43(4), 859-883.
Lebel, C., & Beaulieu, C. (2011). Longitudinal Development of Human Brain Wiring
Continues from Childhood into Adulthood. The Journal of Neuroscience, 31(30),
10937-10947.
McCrae, R. R., & Costa, P. T. (1994). The Stability of Personality: Observation and
Evaluations. Current Directions in Psychological Science, 3(6), 173-175.
McCrae, R. R., & John, O. P. (1992). An Introduction to the Five-Factor Model and its
Applications. Journal of Personality, 60(2), 175-215.
Moffitt, T. E., Arseneault, L., Belsky, D., Dickson, N., Hancox, R. J., Harrington, H., et al.
(2011). A Gradient of Childhood Self-Control Predicts Health, Wealth, and Public
Safety. Proceedings of the National Academy of Sciences of the United States of
America, 108(7), 2693-2698.
Mueller, G., & Plug, E. (2006). Estimating the Effect of Personality on Male and Female
Earnings. Industrial and Labor Relations Review, 60(1), 3-22.

28
Persico, N., Postlewaite, A., & Silverman, D. (2004). The Effect of Adolescent Experience on
Labor Market Outcomes: The Case of Height. Journal of Political Economy, 112(5),
1019-1053.
Roberts, B. W. (2009). Back to the Future: Personality and Assessment and Personality
Development. Journal of Research in Personality, 43(2), 137-145.
Roberts, B. W., & Bogg, T. (2004). A Longitudinal Study of the Relationships Between
Conscientiousness and the Social- Environmental Factors and Substance-Use Behaviors
That Influence Health. Journal of Personality, 72(2), 325-353.
Roberts, B. W., Bogg, T., Walton, K. E., Chernyshenko, O. S., & Stark, S. E. (2004). A
Lexical Investigation of the Lower-Order Structure of Conscientiousness. Journal of
Research in Personality, 38(2), 164-178.
Roberts, B. W., & DelVecchio, W. F. (2000). The Rank-Order Consistency of Personality
Traits From Childhood to Old Age: A Quantitative Review of Longitudinal Studies.
Psychological Bulletin, 126(1), 3-25.
Roberts, B. W., Wood, D., & Caspi, A. (2008). The Development of Personality Traits in
Adulthood. In O. P. John, R. W. Robins & L. A. Pervin (Eds.), Handbook of
personality: Theory and research (3rd ed.). (pp. 375-398). New York, NY US:
Guilford Press.
Schweinhart, L.J., Montie, J., Xiang, Z., Barnett, W.S., Belfield, C.R., & Nores, M. (2005).
Lifetime Effects: The High/Scope Perry Preschool Study through Age 40. Ypsilanti, MI:
High/Scope Press.
Shonkoff, J. P., & Phillips, D. A. (2000). From Neurons to Neighborhoods: The Science of
Early Childhood Development. Washington, DC US: National Academy Press.
Webb, E. (1915). Character and Intelligence. British Journal of Psychology, 1(3).

29
Table 1. Personality Items and Constructs
Conscientiousness Extraversion Agreeableness Emotional Stability
Items cannot settle not much liked destroys belongings irritable
easily distracted worried fights with others miserable/distressed
fails to finish things solitary takes others' things requests must be met
difficulty concentrating afraid of new disobedient sullen or sulky
fussy/over-particular tells lies changes mood quickly
bullies others outbursts of temper
interferes with others
Age 10 (N=12,666)(No imputed values)
Explained variance: 66.07% 37.84% 48.12% 53.48%
Cronbach's alpha: 0.83 0.58 0.81 0.82
Age 10 (N=13,301)(Imputed values if missing 1 or 2 out of 22 items)
Explained variance: 65.89% 37.64% 48.00% 53.28%
Cronbach's alpha: 0.82 0.58 0.81 0.82
Age 16 (N=7,669)(No imputed values)
Explained variance: 65.17% 37.39% 44.66% 56.49%
Cronbach's alpha: 0.81 0.57 0.77 0.84
Age 16 (N=8,566)(Imputed values if missing 1 or 2 out of 22 items)
Explained variance: 65.41% 37.38% 45.35% 56.53%
Cronbach's alpha: 0.81 0.57 0.78 0.84
All personality items are answered by the parent (in most cases the mother) of the child. At age 10, the items are
scored on a scale from 1 through 100, 1 indicating “certainly” and 100 indicating “does not apply”. At age 16,
the scoring is 1 “certainly applies, 2 ”applies somewhat”, 3 “doesn’t apply”. Explained variance indicates the
proportion of variance explained by the first principal component extracted from each set of items. For
individuals that miss 1 or 2 of the 22 items, we apply multiple imputations through chained equations to impute
missing values, using the remaining 21 items as predictors for the item of interest.

30
Table 2. Correlations of Personality with Socio-Economic Outcomes
C E A N
Personality
(C) Conscientiousness (16) . .26 .48 .49
(E) Extraversion (16) .26 1.00 .24 .43
(A) Agreeableness (16) .48 .24 . .55
(N) Emotional Stability (16) .49 .43 .55 .
Outcomes
Wage .15 .05 .11 .12
Save .12 . .09 .09
BMI -.09 . -.08 -.04
Alcoholic -.05 . . .
Smoke -.17 . -.17 -.11
Cannabis -.08 . -.09 -.04
Arrested -.13 .04 -.15 -.07
Satisfaction .12 .10 .10 .10
Life Get .16 .12 .11 .11
Life Run .11 .09 .10 .08
Note: Correlation coefficients. Only those significant at the 5 percent level or higher are
reported. The sample applied is our working sample of 2,934 individuals with valid
information on adult wages, age-10 cognitive ability, and age-16 personality.

31
Figure 1. Socio-Economic Outcomes by Deciles of Conscientiousness
Note: Averages and 95 percent confidence intervals of socio-economic outcomes by deciles of age-16
conscientiousness; The upper deciles 4 and 5, and 6 through 10, are grouped together since we cannot
discriminate between them due to the limited range of the scale on conscientiousness. The sample applied is our
working sample of 2,934 individuals with valid information on adult wages, age-10 cognitive ability, and age-16
personality.

32
Table 3. The Returns to Personality on Socio-Economic Outcomes, Main Specification
Wage Save BMI Alcoholic Smoke Cannabis Arrested Satisfaction Life Get Life Run
Conscientiousness (16) .0400*** .0319*** -.223** -.0321*** -.0421*** -.0201*** -.0104* .111*** .0288*** .00678**
(3.84) (3.15) (-2.06) (-3.83) (-4.38) (-2.70) (-1.65) (2.70) (3.88) (2.36)
Extraversion (16) .001 -.0320*** .103 .011 .0377*** .0224*** .0282*** .109*** .0268*** .00762***
(0.14) (-3.33) (1.03) (1.41) (4.10) (3.10) (4.46) (3.23) (3.83) (2.74)
Agreeableness (16) .0196* .011 -.139 -.006 -.0477*** -.0216*** -.0197*** .059 .009 .00479*
(1.81) (1.10) (-1.18) (-0.66) (-4.87) (-2.94) (-3.19) (1.38) (1.19) (1.75)
Emotional Stability (16) -.002 .0308*** -.144 .009 -.011 -.009 -.0227*** .022 .001 .000
(-0.16) (2.71) (-1.24) (0.95) (-0.98) (-1.02) (-3.16) (0.51) (0.15) (-0.03)
n 2,934 2,933 2,864 2,902 2,933 2,932 2,932 2,932 2,932 2,932
Note: OLS regression coefficients for “Wage”, “BMI”, and “Satisfaction”. Marginal effects of probit regressions for other outcomes. * Significant at 10%, ** Significant at
5%, *** Significant at 1%. Robust t-values in parentheses. Each column represents one single specification. All specifications control for age-10 cognitive ability, gender, a
fulltime dummy, region of birth dummies, and a general intercept (results omitted).

33
Table 4. The Returns to Conscientiousness on Socio-Economic Outcomes, All Specifications
Controls Wage Save BMI Alcoholic Smoke Cannabis Arrested Satisfaction Life Get Life Run
Home beta .0455*** .0336** -.233 -.017 -.0283** -.0187** -.009 .116** .0228** .00328*
t-value (3.14) (2.49) (-1.54) (-1.52) (-2.32) (-2.04) (-1.29) (2.16) (2.49) (1.95)
n 1,577 1,576 1,538 1,561 1,577 1,576 1,576 1,576 1,576 1,576
Education beta .0320*** .0283*** -.209* -.0323*** -.0381*** -.0210*** -.007 .107*** .0270*** .00619**
t-value (3.13) (2.74) (-1.93) (-3.83) (-3.95) (-2.82) (-1.12) (2.58) (3.63) (2.19)
n 2,928 2,927 2,859 2,897 2,928 2,927 2,927 2,927 2,927 2,927
Rutter beta .0373*** .0250** -.157 -.0345*** -.0328*** -.0273*** -.011 .073 .0238*** .003
t-value (3.12) (2.22) (-1.35) (-3.74) (-3.13) (-3.31) (-1.51) (1.61) (2.93) (1.09)
n 2,539 2,538 2,478 2,514 2,539 2,538 2,538 2,538 2,538 2,538
SE+LOC beta .0363*** .0300*** -.232** -.0293*** -.0395*** -.0214*** -.0107* .109*** .0286*** .00652**
t-value (3.46) (2.91) (-2.13) (-3.45) (-4.09) (-2.87) (-1.68) (2.66) (3.88) (2.28)
n 2,892 2,891 2,823 2,860 2,891 2,890 2,890 2,890 2,890 2,890
Social at 16 beta .0491*** .0394*** -.415** -.0200* -.0316** -.0179* -.010 .127** .016 .003
t-value (3.06) (2.86) (-2.38) (-1.75) (-2.44) (-1.83) (-1.45) (2.36) (1.58) (1.51)
n 1,393 1,392 1,358 1,380 1,392 1,392 1,392 1,392 1,392 1,392
Note: OLS regression coefficients on age-16 conscientiousness for “Wage”, “BMI”, and “Satisfaction”. Probit marginal effects of age-16 conscientiousness for other
outcomes. * Significant at 10%, ** Significant at 5%, *** Significant at 1%. Robust t-values in parentheses. Each cell represents one single specification. Each row pertains
to a specific set of controls, but each specification includes the Main controls, which are age-10 cognitive ability, age-16 personality, gender, a fulltime dummy, region of
birth dummies, and a general intercept (results omitted). Additional sets of controls are as follows. Home: no dad at birth dummy, mom teenage mother dummy, years of
schooling of mother and of father, social class of parents at birth (skilled/professional dummy), parental views on "liberal worldview" and "child to be left free" and "child to
be controlled", and self-rated family ties at age 10, "don't get on with parents" (at 16), and "parents are free, not strict" (at 16). Education: years of schooling, social class at
34 (skilled/professional dummy). Rutter: Rutter behaviour scores at ages 5, 10, and 16. SE+LOC: self-esteem and locus of control at age 10. Social at 16: amount of sports
inside and outside school, and number of friends inside and outside school.

34
Table 5. The Returns to Personality on Wages, Controlling for Occupational Sorting
(1) (2)
Conscientiousness (16) .016
(1.63)
Extraversion (16) .008
(0.87)
Agreeableness (16) .008
(0.79)
Emotional Stability (16) -.002
(-0.13)
Avg Occ. Conscientiousness (16) .573***
(5.93)
Avg Occ. Extraversion (16) .147
(1.57)
Avg Occ. Agreeableness (16) -.357***
(-3.21)
Avg Occ. Emotional Stability (16) .267***
(3.02)
Above Avg Occ. C (16)
.0430**
(2.19)
Above Avg Occ. E (16)
.026
(1.41)
Above Avg Occ. A (16)
-.008
(-0.37)
Above Avg Occ. N (16)
-.008
(-0.40)
n 2,913 2,913
R-squared 0.338 0.321
Note: OLS regression coefficients with log hourly wage at age 34 as the dependent variable. * Significant at
10%, ** Significant at 5%, *** Significant at 1%. Robust t-values in parentheses. All specifications control for
age-10 cognitive ability, gender, a fulltime dummy, tenure in current job, social class dummies, region of birth
dummies, and a general intercept (results omitted). Respondents are grouped in occupations using the first two
digits of the SOC2000. Column (1) uses averages of age-16 personality traits by occupation alongside
individual scores on the same traits. Column (2) uses four dummy variables, one for each trait, indicating
whether an individual scores above or below his/her occupation average on that trait.

35
Table 6. Adjusting for Measurement Error: 2SLS, EIV regression and SEM
Wage Save BMI Alcoholic Smoke Cannabis Arrested Satisfaction Life Get Life Run
2SLS
Conscientiousness (16) .0491*** .0259* -.586*** -.0211* -.0263** -.017 -.0166* .063 .006 .001
(3.20) (1.77) (-3.78) (-1.72) (-1.96) (-1.55) (-1.80) (1.25) (0.49) (0.04)
Extraversion (16) .008 -.0306** .365** .006 .0233* .0246** .0187** .056 .012 .011**
(0.55) (-2.25) (2.56) (0.53) (1.82) (2.36) (2.00) (1.23) (1.05) (2.42)
Agreeableness (16) -.010 -.030 .211 .017 -.0358* .016 -.0265** -.056 -.003 .010
(-0.48) (-1.51) (1.01) (1.04) (-1.95) (1.21) (-2.16) (-0.83) (-0.39) (1.45)
Emotional Stability (16) .005 .0569*** -.41* -.007 .007 -.025 .007 .065 .008 -.008
(0.21) (2.67) (-1.79) (-0.40) (0.37) (-1.61) (0.45) (0.87) (0.58) (-0.99)
n 2,782 2,781 2,716 2,753 2,781 2,780 2,780 2,780 2,780 2,780
EIV regressions
Conscientiousness (16) .0476*** .0462*** -.287* -.0471*** -.0543*** -.0314*** -.016 .140** .0466*** .0136**
(2.89) (2.99) (-1.78) (-3.59) (-3.70) (-2.62) (-1.39) (2.56) (3.81) (2.27)
Extraversion (16) .004 -.0803*** .279 .024 .0844*** .0507*** .0790*** .234*** .0661*** .0234***
(0.19) (-3.67) (1.22) (1.29) (4.07) (3.00) (4.98) (3.03) (3.82) (2.76)
Agreeableness (16) .026 .001 -.156 -.006 -.0711*** -.0322** -.0410*** .084 .019 .0160**
(1.31) (0.03) (-0.81) (-0.36) (-4.03) (-2.24) (-3.04) (1.28) (1.28) (2.23)
Emotional Stability (16) -.017 .0574*** -.185 .010 -.018 -.014 -.0423*** -.077 -.0310* -.0142*
(-0.73) (2.59) (-0.80) (0.51) (-0.83) (-0.82) (-2.63) (-0.98) (-1.77) (-1.65)
n 2,934 2,933 2,864 2,902 2,933 2,932 2,932 2,932 2,932 2,932
SEM
Conscientiousness (16) .0411*** .0418*** -.233 -.0428*** -.0451*** -.0290*** -.011 .113** .0405*** .0106*
(2.73) (2.94) (-1.58) (-3.58) (-3.34) (-2.64) (-1.03) (2.26) (3.60) (1.93)
Extraversion (16) .004 -.0524*** .149 .015 .0510*** .0298*** .0485*** .167*** .0479*** .0164***
(0.26) (-3.50) (0.95) (1.22) (3.57) (2.58) (4.41) (3.17) (4.04) (2.83)
Agreeableness (16) .026 .000 -.163 -.005 -.0778*** -.0327** -.0409*** .119* .0244* .0181***
(1.36) (-0.01) (-0.88) (-0.35) (-4.54) (-2.35) (-3.12) (1.88) (1.71) (2.60)
Emotional Stability (16) -.018 .0448** -.109 .011 .005 -.001 -.0275* -.091 -.0316** -.0140*
(-0.87) (2.27) (-0.54) (0.68) (0.26) (-0.06) (-1.91) (-1.31) (-2.02) (-1.83)
n 2,934 2,933 2,864 2,902 2,933 2,932 2,932 2,932 2,932 2,932
Note: Coefficients corrected for measurement error. * Significant at 10%, ** Significant at 5%, *** Significant at 1%. T-values in parentheses. All specifications control for
age-10 cognitive ability, gender, a fulltime dummy, and a general intercept (results omitted). The top panel reports results a 2SLS approach, using the same measures at age-
10 as instruments for the age-16 personality traits. The F-statistics for the first stage range between 93 and 120. The middle panel reports results using errors-in-variables
regressions, using the Cronbach's alpha of the personality traits and age-10 ability as reliability measures: (C) .81 (E) .57 (A) .78 (N) .84 (Ability) .90. The bottom panel
shows results from a structural equation modeling approach, using the individual items as measures of the four age-16 personality traits, and the individual test scores as
measures of age-10 ability, where the latent constructs were set to have variance of one, to allow for comparability of results with linear regression estimates.

36
Table 7. Correlations of Conscientiousness Items with Personality and Socio-Economic Outcomes
(C1) (C2) (C3) (C4) (loc)
Conscientiousness items
(C1) fails to finish things (reliability) . .57 .57 .52 .21
(C2) easily distracted (impulse control) .57 . .49 .47 .28
(C3) difficulty concentrating (orderliness) .57 .49 . .47 .19
(C4) cannot settle (decisiveness) .52 .47 .47 . .19
(loc) Locus of control (16) (impulse control) .21 .28 .19 .19 .
Personality constructs (C) Conscientiousness (16) .84 .80 .79 .76 .28
(E) Extraversion (16) .17 .20 .22 .23 .09
(A) Agreeableness (16) .39 .42 .32 .40 .22
(N) Emotional Stability (16) .40 .40 .37 .38 .23
Outcomes Wage .14 .14 .10 .11 .32
Save -.07 -.08 -.05 -.10 -.10
BMI .11 .09 .09 .10 .19
Alcoholic .11 .11 .08 .10 .15
Smoke -.06 -.04 -.04 . .
Cannabis -.16 -.16 -.08 -.13 -.19
Arrested -.09 -.08 -.05 -.04 .
Satisfaction -.10 -.13 -.08 -.11 -.12
Life Get .15 .12 .11 .11 .16
Life Run .09 .08 .10 .08 .10
Note: Correlation coefficients. Only those significant at the 5 percent level or higher are reported.
Although formulated negatively, each item is scaled such that higher scores are more desirable. Locus of
control is standardised (mean 0, st.dev. 1) and higher scores indicate higher internal locus of control. The
sample applied is our working sample of 2,934 individuals with valid information on adult wages, age-10
cognitive ability, and age-16 personality.

37
Table 8. The Returns to Conscientiousness Items on Wages, All Specifications
Controls Main Home Education Rutter SE+LOC Social at 16
(C1) fails to finish things .0624*** .0940*** .0529*** .0647*** .0576*** .0929***
(reliability) (4.12) (3.94) (3.52) (3.77) (3.77) (3.56)
R-squared 0.215 0.231 0.248 0.214 0.224 0.236
(C2) easily distracted .0470*** .0654*** .0348** .0493*** .0415*** .0669***
(impulse control) (3.25) (3.10) (2.45) (3.06) (2.83) (2.95)
R-squared 0.214 0.227 0.246 0.212 0.222 0.233
(C3) difficulty concentrating .019 .011 .016 .004 .016 .028
(orderliness) (1.12) (0.43) (0.92) (0.21) (0.89) (1.02)
R-squared 0.211 0.222 0.244 0.209 0.22 0.228
(C4) cannot settle .0547*** .040 .0426** .0488* .0521** .038
(decisiveness) (2.65) (1.37) (2.11) (1.80) (2.49) (1.19)
R-squared 0.212 0.223 0.245 0.21 0.221 0.228
n 2,934 1,577 2,928 2,539 2,892 1,393
(loc) Locus of control (16) .0967*** .0849*** .0774*** .0970*** .0864*** .0918***
(impulse control) (7.75) (6.10) (6.32) (7.30) (6.83) (6.35)
n 1,634 1,336 1,631 1,423 1,610 1,219
R-squared 0.244 0.248 0.28 0.243 0.25 0.253
Note: OLS regression coefficients with log hourly wage at age 34 as the dependent variable. * Significant at
10%, ** Significant at 5%, *** Significant at 1%. Robust t-values in parentheses. Each cell represents one
single specification. Each row reports results of using that item, rather than the construct of conscientiousness,
in the set of personality traits. Although formulated negatively, each item is scaled such that higher scores are
more desirable: 1 "totally applies", 2 "applies somewhat", 3 "does not apply". Locus of control is standardised
(mean 0, st.dev. 1) within each regression sample and higher scores indicate higher internal locus of control.
Each column pertains to a specific set of controls, but each specification includes the Main controls, which are
age-10 cognitive ability, age-16 extraversion, agreeableness, and emotional stability, gender, a fulltime dummy,
region of birth dummies, and a general intercept (results omitted). Additional sets of controls are as follows.
Home: no dad at birth dummy, mom teenage mother dummy, years of schooling of mother and of father, social
class of parents at birth (skilled/professional dummy), parental views on "liberal worldview" and "child to be
left free" and "child to be controlled", and self-rated family ties at age 10, "don't get on with parents" (at 16),
and "parents are free, not strict" (at 16). Education: years of schooling, social class at 34 (skilled/professional
dummy). Rutter: Rutter behaviour scores at ages 5, 10, and 16. SE+LOC: self-esteem and locus of control at
age 10. Social at 16: amount of sports inside and outside school, and number of friends inside and outside
school.

38
Table 9. The Returns to Conscientiousness Items on Socio-Economic Outcomes, Main Specification
Wage Save BMI Alcoholic Smoke Cannabis Arrested Satisfaction Life Get Life Run
(C1) fails to finish things .0624*** .0364** -.212 -.0429*** -.0579*** -.0310*** -.005 .152*** .0457*** .00781*
(reliability) (4.12) (2.56) (-1.35) (-3.63) (-4.31) (-2.99) (-0.57) (2.71) (4.49) (1.87)
(C2) easily distracted .0470*** .0351*** -.176 -.0279** -.0553*** -.0253** -.013 .061 .0231** .005
(impulse control) (3.25) (2.60) (-1.19) (-2.49) (-4.29) (-2.55) (-1.49) (1.20) (2.30) (1.37)
(C3) difficulty concentrating .019 .027 -.055 -.0440*** -.014 -.0243** -.007 .126* .0299** .0107**
(orderliness) (1.12) (1.55) (-0.30) (-3.13) (-0.86) (-1.99) (-0.66) (1.84) (2.44) (2.35)
(C4) cannot settle .0547*** .0562*** -.753*** -.0341* -.0700*** -.006 -.0298** .201** .0358** .009
(decisiveness) (2.65) (2.59) (-3.26) (-1.91) (-3.40) (-0.39) (-2.18) (2.15) (2.27) (1.43)
n 2,934 2,933 2,864 2,902 2,933 2,932 2,932 2,932 2,932 2,932
(loc) Locus of control (16) .0967*** .0454*** -.335** -.013 -.0661*** -.0155* -.0261*** .288*** .0489*** .0102***
(impulse control) (7.75) (3.71) (-2.53) (-1.23) (-5.89) (-1.72) (-3.78) (6.67) (5.41) (3.37)
n 1,634 1,633 1,592 1,616 1,633 1,633 1,633 1,633 1,633 1,633
Note: OLS regression coefficients on conscientiousness items for “Wage”, “BMI”, and “Satisfaction”. Probit marginal effects of conscientiousness items for other outcomes.
* Significant at 10%, ** Significant at 5%, *** Significant at 1%. Robust t-values in parentheses. Each cell represents one single specification. Each row reports results of
using that item, rather than the construct of conscientiousness, in the set of personality traits. Although formulated negatively, each item is scaled such that higher scores are
more desirable: 1 "totally applies", 2 "applies somewhat", 3 "does not apply". Locus of control is standardised (mean 0, st.dev. 1) within each regression sample and higher
scores indicate higher internal locus of control. Each specification includes the Main controls, which are age-10 cognitive ability, age-16 extraversion, agreeableness, and
emotional stability, gender, a fulltime dummy, region of birth dummies, and a general intercept (results omitted).

39
Table 10. The Effects of Change in Personality Traits on Socio-Economic Outcomes
Wage Save BMI Alcoholic Smoke Cannabis Arrested Satisfaction Life Get Life Run
Age 10 Conscientiousness (C10) .0554*** .0348*** -.543*** -.0373*** -.0461*** -.0254*** -.0172** .102** .0234** .005
(4.30) (2.71) (-3.85) (-3.54) (-3.81) (-2.70) (-2.24) (1.99) (2.50) (1.26)
Age 10 Extraversion (E10) .008 -.0365*** .300** .007 .0460*** .0278*** .0370*** .140*** .0297*** .0112***
(0.65) (-2.98) (2.46) (0.73) (3.84) (3.06) (4.51) (3.18) (3.33) (3.37)
Age 10 Agreeableness (A10) .013 -.001 -.035 .003 -.0592*** -.008 -.0278*** .021 .005 .00738**
(0.89) (-0.05) (-0.21) (0.28) (-4.48) (-0.81) (-3.25) (0.38) (0.45) (2.02)
Age 10 Emotional Stability (N10) .003 .0460*** -.308** .010 .000 -.013 -.0183* .045 .005 -.001
(0.18) (3.22) (-1.98) (0.81) (-0.03) (-1.22) (-1.93) (0.79) (0.43) (-0.32)
C16-C10 .0280** .0277** -.149 -.0324*** -.0349*** -.0216*** -.005 .0939** .0317*** .00674**
(2.45) (2.50) (-1.27) (-3.54) (-3.33) (-2.63) (-0.69) (2.11) (3.99) (2.25)
E16-E10 -.004 -.0276*** .014 .009 .0274*** .0177** .0226*** .102*** .0246*** .00613**
(-0.35) (-2.71) (0.13) (1.04) (2.73) (2.33) (3.23) (2.80) (3.32) (2.25)
A16-A10 .0242** .016 -.076 -.011 -.0424*** -.0201*** -.0127* .075 .011 .00437*
(2.08) (1.40) (-0.59) (-1.18) (-3.96) (-2.59) (-1.85) (1.60) (1.38) (1.70)
N16-N10 -.007 .017 -.062 .016 -.004 -.005 -.0259*** .011 .001 .001
(-0.53) (1.40) (-0.51) (1.52) (-0.38) (-0.62) (-3.27) (0.23) (0.16) (0.19)
n 2,782 2,781 2,716 2,753 2,781 2,780 2,780 2,780 2,780 2,780
Note: OLS regression coefficients for “Wage”, “BMI”, and “Satisfaction”. Probit marginal effects for other outcomes. * Significant at 10%, ** Significant at 5%, ***
Significant at 1%. Robust t-values in parentheses. Each column represents one single specification. Each specification includes the Main controls, which are age-10 cognitive
ability, gender, a fulltime dummy, region of birth dummies, and a general intercept (results omitted). Change in a trait is measured by subtracting the standardised score on
that trait at age 10 from the standardised score on that trait at age 16 (i.e. C16-C10).

40
Table 11. The Effects of Large Decreases and Increases in Personality Traits on Socio-Economic Outcomes
Wage Save BMI Alcoholic Smoke Cannabis Arrested Satisfaction Life Get Life Run
Age 10 Conscientiousness (C10) .0476*** .0224* -.511*** -.0180* -.0344*** -.0182* -.0145* .053 .007 .001
(3.72) (1.76) (-3.70) (-1.68) (-2.83) (-1.91) (-1.85) (1.08) (0.70) (0.31)
Age 10 Extraversion (E10) .002 -.0247** .245** .005 .0349*** .0207** .0332*** .125*** .0255*** .00856***
(0.14) (-2.10) (2.10) (0.51) (3.07) (2.32) (4.17) (2.95) (2.98) (2.74)
Age 10 Agreeableness (A10) .000 -.004 .074 -.003 -.0528*** -.007 -.0251*** .056 .008 .00616**
(-0.02) (-0.31) (0.48) (-0.27) (-4.17) (-0.68) (-3.05) (1.14) (0.82) (1.97)
Age 10 Emotional Stability (N10) .023 .0433*** -.330** .004 .000 -.011 -.011 .045 .008 .003
(1.61) (3.33) (-2.35) (0.36) (-0.01) (-1.06) (-1.27) (0.91) (0.84) (0.83)
C16-C10 <-.5 -.0565** -.0589** .565** .0567*** .0829*** .0551*** .0341** -.268*** -.0905*** -.0218***
dummy (-2.33) (-2.49) (2.19) (2.83) (3.63) (2.99) (2.08) (-3.25) (-4.88) (-2.82)
C16-C10 >.5 .016 .000 -.043 .010 -.010 -.004 .015 -.042 -.019 -.006
dummy (0.55) (-0.01) (-0.16) (0.41) (-0.38) (-0.21) (0.83) (-0.44) (-0.86) (-0.68)
E16-E10 <-.5 -.016 .024 -.147 -.007 -.020 -.007 -.009 -.107 -.017 -.005
dummy (-0.68) (1.10) (-0.61) (-0.39) (-0.95) (-0.41) (-0.66) (-1.41) (-1.01) (-0.69)
E16-E10 >.5 -.039 -.007 -.347 .008 .013 .013 .0403** .151* .0411** .006
dummy (-1.52) (-0.30) (-1.49) (0.40) (0.54) (0.68) (2.43) (1.77) (2.24) (0.81)
A16-A10 <-.5 -.0393* .003 -.310 .022 .0668*** .0398** .014 -.026 .002 .000
dummy (-1.66) (0.14) (-1.37) (1.17) (2.99) (2.28) (0.91) (-0.32) (0.14) (0.04)
A16-A10 >.5 -.005 .019 .077 -.028 -.0414* -.015 -.012 .266*** .031 .007
dummy (-0.18) (0.76) (0.29) (-1.41) (-1.73) (-0.78) (-0.71) (3.07) (1.64) (1.13)
N16-N10 <-.5 .0517** -.018 .160 -.020 -.004 .003 .0265* -.041 -.008 -.0174**
dummy (2.12) (-0.78) (0.66) (-1.05) (-0.20) (0.19) (1.67) (-0.50) (-0.45) (-2.42)
N16-N10 >.5 .0707*** .028 -.180 .010 -.005 -.001 -.0312* .012 .014 .010
dummy (2.67) (1.08) (-0.68) (0.47) (-0.20) (-0.07) (-1.92) (0.13) (0.71) (1.38)
n 2,782 2,781 2,716 2,753 2,781 2,780 2,780 2,780 2,780 2,780
Note: OLS regression coefficients for “Wage”, “BMI”, and “Satisfaction”. Probit marginal effects for other outcomes. * Significant at 10%, ** Significant at 5%, ***
Significant at 1%. Robust t-values in parentheses. Each column represents one single specification. Each specification includes the Main controls, which are age-10 cognitive
ability, gender, a fulltime dummy, region of birth dummies, and a general intercept (results omitted). Change in a trait is measured by two dummy variables indicating large
decreases or increases: one of them equal to 1 if the difference between the standardised score on that trait at age 10 and the standardised score on that trait at age 16 is
smaller than -.5 (i.e. C16-C10<-.5), and the other equal to 1 is that difference is larger than +.5 (i.e. C16-C10>.5).

41
Appendix This appendix presents supporting materials. All data come from the 1970 British Cohort
Study. The 1970 British Cohort Study began by collecting data on births and families of all
children born in Great Britain in a particular week in April of 1970. These
children/respondents were then followed and re-interviewed roughly every 4 or 5 years over
the course of their life. Of the initial 17,196 babies born in 1970, 9,665 respondents remain in
2004. After selecting employed individuals with valid information on wages, childhood
ability and personality, we retain a working sample of 2,937 respondents used for the
analyses in this research. In Section A1 we show the details of the cluster analysis and
principal component analysis used to construct the personality measures related to the Big
Five inventory. Section A2 provides details on the items used to construct our sociability
measures: the Rutter behaviour scores, self-esteem, and locus of control.
Table A1 describes the core variables used in this study. The table consists of six sets of
variables. First, the outcome variables at age 34 are presented. The next set consists of our
personality measures (covered in more detail in the next section), and is followed by sets of
variables relating to the home environment, educational achievement, early sociability, and
occupational sorting. The variables in Table A2 and Table A3 are set up in the same order.
Table A2 presents a number of descriptive statistics for these sets of variables, both for the
working sample used in all analyses in this paper, as well as for the unrestricted sample.
Table A3 provides averages for all variables for those scoring above and below average on
our age-16 personality measures. Table A4 provides the coefficients for the traits
extraversion, agreeableness, and emotional stability that belong to the analyses reported on in
Table 4. Table A5 displays the grouping of respondents in occupations and associated
average personality traits, which is used for the analysis reported on in Table 5.

42
A1 Personality Measures A Big Five-type taxonomy of personality would allow us to capture the relative importance
of different dimensions of an individual’s personality. The BCS70 offers a number of
alternatives, although these sets of items do not offer items to capture openness. Hence, we
are able to construct measures capturing a child’s conscientiousness, extraversion,
agreeableness, and emotional stability (neuroticism).
At age 10, the teachers of the respondents are asked to complete a set of 53 items on the
child’s developmental behaviours, of which we retain 27 items to construct a teacher rated
Big 4 taxonomy of personality. At age 16, respondents themselves fill in a set of 27 items
under the heading “Knowing Myself”, 18 of which can be used to construct measures for
each of the Big 5, although the strength of the construct for openness is rather weak. Since
these two sets of items are not the same, and rated by different people, we prefer a third set of
items that the BCS70 offers: a set of 38 parent-rated items, available at age 10 as well as age
16. A cluster analysis of a subsample of 22 of these items (excluding items related to fine and
gross motor skills) shows the expected grouping of items into four clusters, representing
conscientiousness, extraversion, agreeableness, and emotional stability (See Figure A1).
An additional benefit of using the set of mother-rated items is that this set contains more valid
observations, both at ages 10 and 16. To further increase the number of observations, we
impute missing values for individuals that miss 1 or 2 of the 22 items used for constructing
our personality measures. We apply multiple imputation through chained equations using the
remaining 21 items as predictors for the item of interest. By doing so, we increase the number
of observations with valid age-10 personality measures by over 5 percent (from 6,493 to
6,845), and by as much as 12 percent for age-16 personality (from 3,751 to 4,205).
For each of the 22 items i, we estimate the following model to predict missing values:
∑
This process starts with the item with least amount of missing observations. Missing
observations are then imputed, and the process continues to the item with next fewest missing
observations. At age 10, the items are scored on a scale from 1 through 100, 1 indicating
“certainly” and 100 indicating “does not apply”. We thus apply the above model using linear
regression. Imputed values below 1 are set to 1, and those above 100 are set to 100. For the
age-16 items we use multinomial logit regression to impute missing values, since the items
are scored 1 “certainly applies, 2 “applies somewhat”, 3 “doesn’t apply”.
Figure A1 shows a dendrogram of the clustering of the 22 items measured at age 16
(including imputed values). The grouping of items is as expected and is also confirmed by the
table below. After extracting four factors from the same set of 22 items using principal
component analysis, and applying orthogonal rotation to the loadings, the table below shows
the factor loadings and the unexplained variance of the 22 items used to construct our four
personality measures (conscientiousness, extraversion, agreeableness, and emotional
stability). Only loadings larger than 0.2 are reported. The resulting four factors explain 52.3
percent of the variance among the items.

43
Figure A 1. Clustering of Age-16 Personality Items into Four Big Five Traits
C E A N Unexplained
fails to finish things (C) .513
.274
easily distracted (C) .468
.357
difficulty concentrating (C) .496
.362
cannot settle (C) .410
.433
fussy/over-particular (E)
.292
.702
solitary (E)
.417
.644
afraid of new (E)
.522
.479
worried (E)
.548
.415
not much liked (E)
.248 .327
.635
bullies others (A)
.394
.510
fights with others (A)
.378
.516
tells lies (A)
.337
.486
disobedient (A)
.200 .212 .484
takes others' things (A)
.435
.475
destroys belongings (A)
.435
.517
interferes with others (A)
.611
outbursts of temper (N)
.419 .341
changes mood quickly (N)
.430 .319
irritable (N)
.412 .395
requests must be met (N)
.368 .444
sullen or sulky (N)
.355 .514
miserable/distressed (N) .244 .221 .575

44
A2 Rutter, Self-esteem, and Locus of control In Section 4 we apply a number of other personality measures to control for early sociability.
These measures include Rutter scores at various ages, indicative of behavioural problems,
and measures for self-esteem and locus of control, measuring respondents’ sense of self-
worth and believe in the importance of trying hard.
At ages 5, 10, and 16, the respondents’ parents, usually the mother, are asked to indicate to
what extent a certain description applies to the respondent. At ages 5 and 16, the items are
scaled 0 "does not apply" 1 "applies somewhat" 2 "certainly applies". The age-10 items are
scaled 1 through 100, where 1 indicates "does not apply" and 100 indicates "certainly
applies". Higher scores indicate more severe behavioural problems.
The table below shows the inter-item correlations or covariances for the 16 items, and the
Cronbach’s alpha statistic for the scale formed from them. The three Rutter scores, at ages 5,
10, and 16, are constructed by summing the scores on the 16 mother-rated items, and then
standardising the resulting score to have mean zero and standard deviation one.
Self-esteem assesses respondents’ self-esteem with reference to teachers, peers and parents
and consists of 12 items, while locus of control measures children’s perceived achievement
control with a list of 15 items. Items are scaled 0 "yes" 1 "don't know" 2 "no", except the first
self-esteem item "Parent like to hear about ideas" and the locus of control item "Believe in
planning ahead", which are reversely coded. Higher scores thus indicate higher self-esteem
and higher internal locus of control. The table below shows the inter-item correlations or
covariances for these sets of items, and the Cronbach’s alpha statistic for the scale formed
from them, both for ages 10 and 16. The self-esteem and locus of control scores are
constructed by summing the scores on the set of 12/15 items, and then standardising the
resulting score to have mean zero and standard deviation one.
Age 5 (n=12,965) Age 10 (n=13,337) Age 16 (n=8,609)
Item
-tes
t
corr
elat
ion
Item
-res
t
corr
elat
ion
Inte
r-it
em
cov
aria
nce
Alp
ha
Item
-tes
t
corr
elat
ion
Item
-res
t
corr
elat
ion
Inte
r-it
em
cov
aria
nce
Alp
ha
Item
-tes
t
corr
elat
ion
Item
-res
t
corr
elat
ion
Inte
r-it
em
cov
aria
nce
Alp
ha
Rutter
.06 .76
124.17 .80
.05 .80
restless .57 .43 .05 .74 .54 .41 119.58 .80 .48 .38 .05 .79
squirmy/fidgety .55 .42 .05 .74 .57 .46 118.53 .79 .50 .40 .05 .79
destroys belongings .50 .40 .06 .74 .51 .45 128.94 .79 .46 .40 .05 .79
fights with others .51 .41 .05 .74 .54 .46 124.75 .79 .53 .45 .05 .79
not much liked by others .32 .25 .06 .75 .46 .38 129.16 .80 .42 .35 .05 .80
worried .38 .26 .06 .75 .50 .38 121.94 .80 .52 .39 .05 .79
solitary, does things on own .37 .23 .06 .76 .42 .28 126.97 .80 .46 .31 .05 .80
irritable .58 .47 .05 .73 .61 .51 115.65 .79 .66 .54 .04 .78
miserable, tearful, distressed .47 .37 .06 .74 .56 .48 124.68 .79 .56 .48 .05 .79
takes others’ things .42 .32 .06 .75 .48 .42 129.97 .80 .48 .41 .05 .79
disobedient .60 .50 .05 .73 .62 .53 118.20 .79 .64 .54 .04 .78
cannot settle .55 .44 .05 .74 .57 .47 120.09 .79 .58 .49 .05 .78
afraid of new things/situations .33 .19 .06 .76 .42 .29 127.36 .80 .45 .33 .05 .80
fussy or over-particular .37 .22 .06 .76 .40 .27 127.90 .80 .42 .28 .05 .80
tells lies .49 .40 .06 .74 .56 .48 123.85 .79 .56 .48 .05 .79
bullies others .46 .38 .06 .75 .52 .46 129.13 .79 .48 .42 .05 .79
Note: Sample includes all respondents with valid information on the individual items, as well as imputed values for respondents with 1 or 2 missing values in the set of 16 rutter items. Values are imputed using multiple imputation through chained equations using the remaining items as regressors. Age 5 and 16 items are scaled 0 "does not apply" 1 "applies somewhat" 2 "certainly applies". Age 10 items are scaled 1 through 100, where 1 indicates "does not apply" and 100 indicates "certainly applies". Higher scores thus indicate more severe behavioural problems.

45
Age 10 (n=12,624 for self-
esteem and 12,560 for
locus of control)
Age 16 (n=4,439 for self-
esteem and 5,479 for
locus of control)
Item
-tes
t
corr
elat
ion
Item
-res
t
corr
elat
ion
Inte
r-it
em
cov
aria
nce
Alp
ha
Item
-tes
t
corr
elat
ion
Item
-res
t
corr
elat
ion
Inte
r-it
em
cov
aria
nce
Alp
ha
Self-esteem .10 .69 .09 .70
1. Parents like to hear about ideas .26 .12 .11 .69 .38 .23 .09 .70
2. Feel lonely at school .47 .35 .10 .67 .52 .42 .09 .68
3. Others fall out with you .59 .42 .09 .65 .49 .37 .09 .68
4. Others say nasty things about you .55 .40 .09 .65 .57 .43 .08 .67
5. Feel shy in front of teachers .45 .27 .10 .68 .59 .42 .08 .67
6. Feel sad because nobody to play/talk with .55 .40 .09 .65 .48 .32 .09 .69
7. Like to change lots of things about self .49 .31 .10 .67 .48 .30 .09 .69
8. Feel foolish talking to peers .47 .31 .10 .67 .52 .32 .08 .69
9. Feel foolish talking to teacher .44 .31 .10 .67 .58 .44 .08 .67
10. Often have to find new friends .56 .39 .09 .66 .53 .33 .09 .69
11. Feel foolish talking to parents .28 .20 .11 .68 .33 .23 .10 .70
12. Others think you tell lies .52 .39 .10 .66 .43 .29 .09 .69
Locus of control .06 .63 .08 .71
1. Not worth trying hard .48 .35 .06 .60 .53 .42 .08 .68
2. Wishing makes good things happen .29 .12 .07 .63 .30 .15 .09 .71
3. People good to you no matter what .18 .02 .07 .65 .29 .14 .09 .71
4. Useless to try in school, others cleverer .50 .39 .06 .59 .52 .43 .08 .68
5. High mark just a matter of luck .57 .42 .05 .58 .61 .50 .07 .67
6. Tests just a lot of guess work .47 .34 .06 .60 .58 .48 .07 .67
7. Blamed for things not your fault .43 .25 .06 .61 .45 .28 .08 .70
8. Believe in planning ahead .19 .01 .07 .65 .36 .20 .08 .71
9. Bad things someone else's fault .38 .22 .06 .62 .39 .25 .08 .70
10. Someone angry, impossible to make friend again .40 .23 .06 .62 .32 .19 .09 .71
11. Nice things only good luck .55 .40 .06 .59 .50 .38 .08 .68
12. Arguments other person's fault .26 .11 .07 .63 .29 .15 .09 .71
13. Surprised when teacher says done well .47 .32 .06 .60 .51 .36 .08 .69
14. Low marks even when study hard .54 .41 .06 .59 .59 .47 .07 .67
15. Studying for tests is waste of time .32 .22 .07 .62 .48 .37 .08 .69
Note: Sample includes all individuals with valid information on the individual items, as well as imputed values
for individuals with 1 or 2 missing values in the set of self-esteem or locus of control items. Values are imputed
using multiple imputation through chained equations using the remaining items as regressors. Items are scaled 0
"yes" 1 "don't know" 2 "no", except the first self-esteem item "Parent like to hear about ideas" and locus of
control item "Believe in planning ahead", which are reversely coded. Higher scores thus indicate higher self-
esteem and higher internal locus of control.
The samples used to construct Rutter scores, self-esteem and locus of control measures
include respondents with valid observations on all items, as well as individuals with missing
values for 1 or 2 items within each set of items (i.e. with only 13 of 15 age-16 locus of
control items). The missing values have been imputed for these individuals. We apply
multiple imputations through chained equations using the remaining items as predictors for
the item of interest. By doing so, we increase the number of observations with valid
observations drastically. For the Rutter scores, as well as for the self-esteem and locus of
control measures, the resulting alphas are almost identical, whether or not we make use of
imputed values, so to retain a large a sample as possible, we use the set of items that include
imputed values to construct Rutter scores, as well as measures for self-esteem and locus of
control.

46
Similar to the imputation applied for personality items, for each item i within each set of
Rutter/self-esteem/locus of control items, we estimate the following model to predict missing
values:
∑
This process starts with the item with least amount of missing observations. Missing
observations are then imputed, and the process continues to the item with next fewest missing
observations. For the age-10 Rutter score we apply the above model using linear regression,
since the items are scaled from 1 through 100. Imputed values below 1 are set to 1, and those
above 100 are set to 100. For the age-5 and age-16 Rutter scores, and the age-10 and age-16
self-esteem and locus of control scores, we use multinomial logit regression to impute
missing values.

47
Table A 1. Description of Variables
Variable Description
Socio-economic Outcomes
Gross hourly wage (34) Gross pay per week divided by usual hours worked per week. Gross pay per week
constructed using reported gross pay and reporting period (one week, two weeks,
four weeks, one calendar month, one year). Respondent excluded if reported weekly
hours is below 5 or exceeds 80, and if pay per week is below 32.5 pounds (1%) or
above 3073 pounds (1%).
Log gross hourly wage
(34)
Log of Gross hourly wage (34)
Save "Do you save any amount of your income?". Dummy variable. 0 "No" 1 "Yes".
BMI (Body Mass Index) Standard Body Mass Index (Weight in kilos/(Length in meters^2)).
Alcoholic (CAGE>=2)
Dummy variable equal to one if respondent answered yes to two, three or all four
questions from the CAGE (Cutting down, Annoyance by criticism, Guilty feeling and
Eye-openers) questionnaire. Equal to zero is answered zero or one of the questions
with yes. It indicates potential alcohol dependence or abuse.
Smoke Dummy variable equal to one if respondent smokes (from occasionally to more than
20 cigarettes daily). Equal to zero if respondent has never smoked or is an ex-smoker.
(Use) Cannabis Dummy variable equal to one if respondent uses cannabis (from occasionally to on
most days). Equal to zero if respondent never tried cannabis or never uses cannabis
nowadays.
(Ever) Arrested "Have you been arrested by a police officer and taken to a police station? (Type in
number of times)" Dummy variable. 0 "0" 1 "1-9".
Satisfaction
(with life (0-10))
"How satisfied or dissatisfied are you with the way life has turned out so far?" Scaled
0 through 10. 0 "Completely dissatisfied" to 10 "Completely satisfied".
Life Get (I get what I
want out of life)
Dummy variable. "Which of these two statements is more true for you?" 0 "I never
really seem to get what I want out of life." 1 "I usually get what I want out of life."
Life Run (I can run life as
I want)
Dummy variable. "Which of these two statements is more true for you?" 0 "I usually
find life's problems just too much for me." 1 "Usually I can run my life more or less
as I want to."
Personality
Conscientiousness (10) Standardized Principal Component of 4 age-10 items related to Conscientiousness.
See Table 1 and Appendix for details.
Extraversion (10) Standardized Principal Component of 5 age-10 items related to Extraversion. See
Table 1 and Appendix for details.
Agreeableness (10) Standardized Principal Component of 7 age-10 items related to Agreeableness. See
Table 1 and Appendix for details.
Emotional Stability (10) Standardized Principal Component of 6 age-10 items related to Emotional Stability.
See Table 1 and Appendix for details.
Conscientiousness (16) Standardized Principal Component of 4 age-16 items related to Conscientiousness.
See Table 1 and Appendix for details.
Extraversion (16) Standardized Principal Component of 5 age-16 items related to Extraversion. See
Table 1 and Appendix for details.
Agreeableness (16) Standardized Principal Component of 7 age-16 items related to Agreeableness. See
Table 1 and Appendix for details.
Emotional Stability (16) Standardized Principal Component of 6 age-16 items related to Emotional Stability.
See Table 1 and Appendix for details.
Home Environment
No dad at birth Dummy variable equal to one if father absent in household at birth of respondent,
zero if father present.
Mom teenage mother Dummy variable equal to one if mother's age at first birth was below 20, and zero if
age at first birth was 20 or higher.
Yrs of schooling mom Age mother left full-time education minus six
Yrs of schooling dad Age father left full-time education minus six
Parent skilled/prof. (0) Social class at birth: fathers occupation (or mothers if missing). Dummy variable. 0 if
student, unskilled, or partly skilled. 1 if skilled (non-)manual, managerial/technical,
or professional.

48
Variable Description
Liberal worldview (5) Principal component of 5 mother-rated items at age 5. Higher score indicates more
liberal views.
Child to be left free (5) Principal component of 13 mother-rated items at age 5. Higher score indicates
disagreement with authoritarian childrearing.
Child to be controlled (5) Principal component of 7 mother-rated items at age 5. Higher score indicates
disagreement with the opinion that children should be allowed to be themselves.
Strong family ties (10) Average score on 7 family activities (go for walks, outings, holidays, go shopping, go
to restaurants, have meals, have talks together), each scaled 1 "rarely/never" 2
"sometimes" 3 "often" (Cronbach's alpha 0.66)
Don't get on with parents
(16)
Average score on 11 self-rated items about how parents treat respondent
(overprotective, treat me like a child, don't understand me, are strict/bossy), each
scaled 0 "no" 1 "yes" (Cronbach's alpha 0.73)
Parents are free, not strict
(16)
"Some parents are very strict, and others give lots of freedom. What about yours?"
Scaled 1 "very strict through 7 "very free".
Educational Achievement
Cognitive Ability We construct a measure using test scores at age 10 because cognitive ability seems to
be set at that age (e.g., Lebel and Beaulieu, 2011). Cognitive ability is measured by
extracting the first principal component from a set of 8 standardized test scores, all
measured at the age of 10. The resulting score is standardized to have zero mean and
a standard deviation of one. The test scores include the four British Ability Scales
(word definitions, recall of digits, similarities, matrices), as well as the Shortened
Edinburgh Reading Test, the CHES Pictorial Language Comprehension and Friendly
Maths tests, and a spelling test. Cronbach’s alpha on the set of test scores is 0.89 and
the explained variance of the resulting principal component is 58 percent.
Years of schooling (34) Age left full-time education minus six
Skilled/prof. (34) Social class at age 34, from occupation. Dummy variable. 0 if unskilled, or partly
skilled. 1 if skilled (non-)manual, managerial/technical, or professional.
Sociability
Rutter score (5) Standardized sum of scores on 16 mother-rated age-5 items on behaviour problems
(mean 0, st.dev. 1). Missing values are imputed for respondents with 1 or 2 missings
out of 16 items. See Appendix for details on items.
Rutter score (10) Standardized sum of scores on 16 mother-rated age-10 items on behaviour problems
(mean 0, st.dev. 1). Missing values are imputed for respondents with 1 or 2 missings
out of 16 items. See Appendix for details on items.
Rutter score (16) Standardized sum of scores on 16 mother-rated age-16 items on behaviour problems
(mean 0, st.dev. 1). Missing values are imputed for respondents with 1 or 2 missings
out of 16 items. See Appendix for details on items.
Self-esteem (10) Standardized sum of scores on 12 self-rated age 10 self-esteem items (mean 0, st.dev.
1). Missing values are imputed for respondents with 1 or 2 missings out of 12 items.
See Appendix for details on items.
Locus of control (10) Standardized sum of scores on 15 self-rated age 10 locus of control items (mean 0,
st.dev. 1). Missing values are imputed for respondents with 1 or 2 missings out of 15
items. See Appendix for details on items.
Self-esteem (16) Standardized sum of scores on 12 self-rated age 16 self-esteem items (mean 0, st.dev.
1). Missing values are imputed for respondents with 1 or 2 missings out of 12 items.
See Appendix for details on items.
Locus of control (16) Standardized sum of scores on 15 self-rated age 16 locus of control items (mean 0,
st.dev. 1). Missing values are imputed for respondents with 1 or 2 missings out of 15
items. See Appendix for details on items.
Sports in school "During the past year, which of the following sports did you play when they were in
season?" Count of sports indicated to have played in school in the past year
Sports outside school "During the past year, which of the following sports did you play when they were in
season?" Count of sports indicated to have played out of school in the past year
No. friends in school "How many other close friends have you got at your school or outside?" Ranging
from 0 "0" to 9 "9 or more".
No. friends outside
school
"How many other close friends have you got at your school or outside?" Ranging
from 0 "0" to 9 "9 or more".

49
Variable Description
Occupational Sorting
Avg Occ.
Conscientiousness (16)
Average score on age 16 conscientiousness, by age 34 occupation. See Table A5 for
list of occupations and averages.
Avg Occ.
Extraversion (16)
Average score on age 16 extraversion, by age 34 occupation. See Table A5 for list of
occupations and averages.
Avg Occ.
Agreeableness (16)
Average score on age 16 agreeableness, by age 34 occupation. See Table A5 for list
of occupations and averages.
Avg Occ.
Emotional Stability (16)
Average score on age 16 emotional stability, by age 34 occupation. See Table A5 for
list of occupations and averages.
Above Avg Occ.
Conscientiousness (16)
Dummy equal to 1 if respondents age-16 conscientiousness is larger than the average
age-16 conscientiousness of men in the same age 34 occupation
Above Avg Occ.
Extraversion (16)
Dummy equal to 1 if respondents age-16 extraversion is larger than the average age-
16 extraversion of men in the same age 34 occupation
Above Avg Occ.
Agreeableness (16)
Dummy equal to 1 if respondents age-16 agreeableness is larger than the average
age-16 agreeableness of men in the same age 34 occupation
Above Avg Occ.
Emotional Stability (16)
Dummy equal to 1 if respondents age-16 emotional stability is larger than the average
age-16 emotional stability of men in the same age 34 occupation
Social class dummies Social class at age 34, from occupation. 6 categories: professional,
managerial/technical, skilled non-manual, skilled manual, partly skilled, unskilled
Years in current job Constructed using year and month of interview alongside year and month started
current main job
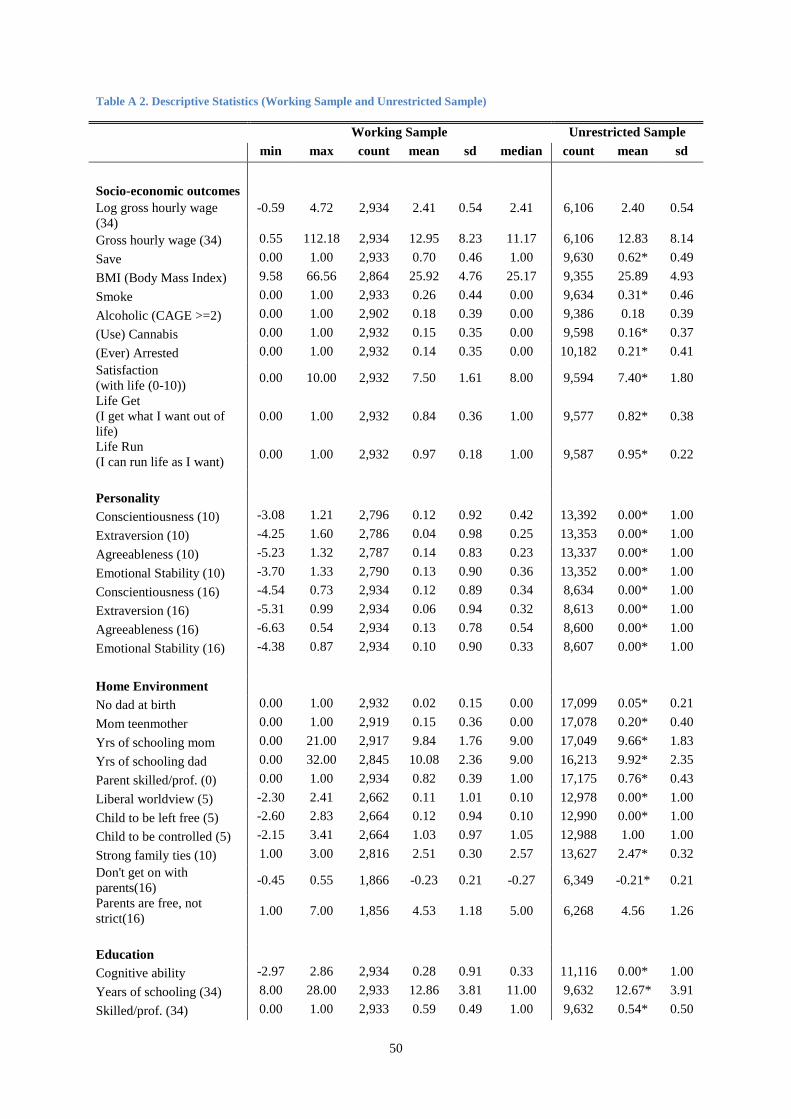
50
Table A 2. Descriptive Statistics (Working Sample and Unrestricted Sample)
Working Sample Unrestricted Sample
min max count mean sd median count mean sd
Socio-economic outcomes
Log gross hourly wage
(34)
-0.59 4.72 2,934 2.41 0.54 2.41 6,106 2.40 0.54
Gross hourly wage (34) 0.55 112.18 2,934 12.95 8.23 11.17 6,106 12.83 8.14
Save 0.00 1.00 2,933 0.70 0.46 1.00 9,630 0.62* 0.49
BMI (Body Mass Index) 9.58 66.56 2,864 25.92 4.76 25.17 9,355 25.89 4.93
Smoke 0.00 1.00 2,933 0.26 0.44 0.00 9,634 0.31* 0.46
Alcoholic (CAGE >=2) 0.00 1.00 2,902 0.18 0.39 0.00 9,386 0.18 0.39
(Use) Cannabis 0.00 1.00 2,932 0.15 0.35 0.00 9,598 0.16* 0.37
(Ever) Arrested 0.00 1.00 2,932 0.14 0.35 0.00 10,182 0.21* 0.41
Satisfaction
(with life (0-10)) 0.00 10.00 2,932 7.50 1.61 8.00 9,594 7.40* 1.80
Life Get
(I get what I want out of
life)
0.00 1.00 2,932 0.84 0.36 1.00 9,577 0.82* 0.38
Life Run
(I can run life as I want) 0.00 1.00 2,932 0.97 0.18 1.00 9,587 0.95* 0.22
Personality
Conscientiousness (10) -3.08 1.21 2,796 0.12 0.92 0.42 13,392 0.00* 1.00
Extraversion (10) -4.25 1.60 2,786 0.04 0.98 0.25 13,353 0.00* 1.00
Agreeableness (10) -5.23 1.32 2,787 0.14 0.83 0.23 13,337 0.00* 1.00
Emotional Stability (10) -3.70 1.33 2,790 0.13 0.90 0.36 13,352 0.00* 1.00
Conscientiousness (16) -4.54 0.73 2,934 0.12 0.89 0.34 8,634 0.00* 1.00
Extraversion (16) -5.31 0.99 2,934 0.06 0.94 0.32 8,613 0.00* 1.00
Agreeableness (16) -6.63 0.54 2,934 0.13 0.78 0.54 8,600 0.00* 1.00
Emotional Stability (16) -4.38 0.87 2,934 0.10 0.90 0.33 8,607 0.00* 1.00
Home Environment
No dad at birth 0.00 1.00 2,932 0.02 0.15 0.00 17,099 0.05* 0.21
Mom teenmother 0.00 1.00 2,919 0.15 0.36 0.00 17,078 0.20* 0.40
Yrs of schooling mom 0.00 21.00 2,917 9.84 1.76 9.00 17,049 9.66* 1.83
Yrs of schooling dad 0.00 32.00 2,845 10.08 2.36 9.00 16,213 9.92* 2.35
Parent skilled/prof. (0) 0.00 1.00 2,934 0.82 0.39 1.00 17,175 0.76* 0.43
Liberal worldview (5) -2.30 2.41 2,662 0.11 1.01 0.10 12,978 0.00* 1.00
Child to be left free (5) -2.60 2.83 2,664 0.12 0.94 0.10 12,990 0.00* 1.00
Child to be controlled (5) -2.15 3.41 2,664 1.03 0.97 1.05 12,988 1.00 1.00
Strong family ties (10) 1.00 3.00 2,816 2.51 0.30 2.57 13,627 2.47* 0.32
Don't get on with
parents(16) -0.45 0.55 1,866 -0.23 0.21 -0.27 6,349 -0.21* 0.21
Parents are free, not
strict(16) 1.00 7.00 1,856 4.53 1.18 5.00 6,268 4.56 1.26
Education
Cognitive ability -2.97 2.86 2,934 0.28 0.91 0.33 11,116 0.00* 1.00
Years of schooling (34) 8.00 28.00 2,933 12.86 3.81 11.00 9,632 12.67* 3.91
Skilled/prof. (34) 0.00 1.00 2,933 0.59 0.49 1.00 9,632 0.54* 0.50

51
Working Sample Unrestricted Sample
min max count mean sd median count mean sd
Sociability
Rutter score (5) -1.69 4.80 2,662 -0.10 0.94 -0.18 12,965 0.00* 1.00
Rutter score (10) -2.02 3.81 2,784 -0.13 0.92 -0.19 13,337 0.00* 1.00
Rutter score (16) -1.08 7.95 2,930 -0.12 0.86 -0.37 8,609 0.00* 1.00
Self-esteem (10) 2.00 24.00 2,909 16.78 4.45 17.00 12,624 16.39* 4.54
Locus of control (10) 2.00 30.00 2,899 18.53 4.64 19.00 12,560 17.85* 4.75
Sports in school 0.00 57.00 1,496 9.34 8.20 8.00 5,265 9.20 8.30
Sports outside school 0.00 60.00 1,496 8.88 7.76 7.00 5,265 8.91 8.11
No. friends in school 0.00 9.00 1,827 5.68 2.85 5.00 6,093 5.61 2.90
No. friends outside school 0.00 9.00 1,792 4.83 3.21 4.00 5,967 4.90 3.19
Occupational Sorting
Avg Occ.Conscient.(16) -0.30 0.53 2,929 0.09 0.21 0.12 7,989 0.07* 0.21
Avg Occ.Extrav.(16) -0.27 0.38 2,929 0.05 0.10 0.05 7,989 0.05 0.11
Avg Occ.Agreeabl.(16) -0.35 0.43 2,929 0.10 0.14 0.13 7,989 0.09* 0.15
Avg Occ.Emot.Stab.(16) -0.15 0.40 2,929 0.09 0.12 0.12 7,989 0.09 0.12
Above Avg Occ. C (16) 0.00 1.00 2,929 0.69 0.46 1.00 5,011 0.67 0.47
Above Avg Occ. E (16) 0.00 1.00 2,929 0.57 0.50 1.00 4,993 0.57 0.50
Above Avg Occ. A (16) 0.00 1.00 2,929 0.72 0.45 1.00 4,991 0.70 0.46
Above Avg Occ. N (16) 0.00 1.00 2,929 0.62 0.49 1.00 4,994 0.61 0.49
Note: Unrestricted sample gives count, mean, and standard deviation of each variable of interest. So the
complete set of individuals for which that single variable is measured. The same information is stated for the
working sample (as well as minimum and maximum). The working sample only contains the 2,934 individuals
with valid data on age 34 gross hourly wages, age-10 cognitive ability, age-16 personality (conscientiousness,
extraversion, agreeableness, and emotional stability), and region of birth. * Indicates unrestricted mean is
significantly different from working mean at the 10 percent level (2-sided t-test).

52
Table A 3. Means for Individuals Below and Above Average Wages and Personality
Gross hourly
wage
Conscientious-
ness Extraversion Agreeableness
Emotional
Stability
≤ avg. > avg. ≤ avg. > avg. ≤ avg. > avg. ≤ avg. > avg. ≤ avg. > avg.
Socio-economic outcomes
Log gross hourly wage (34) 2.09 2.93* 2.32 2.46* 2.38 2.44* 2.32 2.46* 2.35 2.45*
Gross hourly wage (34) 8.55 19.93* 11.56 13.61* 12.56 13.28* 11.69 13.56* 12.22 13.39*
Save 0.64 0.80* 0.63 0.73* 0.70 0.70 0.64 0.73* 0.65 0.73*
BMI (Body Mass Index) 26.07 25.69* 26.50 25.64* 25.97 25.88 26.51 25.64* 26.21 25.75*
Smoke 0.31 0.19* 0.36 0.22* 0.26 0.27 0.38 0.21* 0.31 0.24*
Alcoholic (CAGE >=2) 0.16 0.22* 0.20 0.17* 0.17 0.19 0.19 0.18 0.18 0.18
(Use) Cannabis 0.14 0.16 0.19 0.13* 0.14 0.15 0.19 0.13* 0.16 0.14
(Ever) Arrested 0.16 0.13* 0.21 0.11* 0.13 0.15 0.22 0.11* 0.17 0.13*
Satisfaction
(with life (0-10)) 7.34 7.74* 7.23 7.62* 7.32 7.65* 7.28 7.60* 7.38 7.57*
Life Get (I get what
I want out of life) 0.79 0.92* 0.78 0.87* 0.80 0.88* 0.78 0.87* 0.81 0.86*
Life Run (I can run
life as I want) 0.96 0.98* 0.95 0.98* 0.95 0.98* 0.95 0.98* 0.95 0.98*
Personality
Conscientiousness (10) 0.01 0.30* -0.36 0.35* 0.02 0.21* -0.17 0.27* -0.05 0.23*
Extraversion (10) 0.00 0.11* -0.07 0.10* -0.29 0.32* -0.03 0.08* -0.14 0.15*
Agreeableness (10) 0.08 0.25* -0.12 0.27* 0.07 0.21* -0.18 0.30* -0.08 0.28*
Emotional Stability (10) 0.05 0.25* -0.13 0.25* -0.08 0.30* -0.18 0.27* -0.25 0.35*
Conscientiousness (16) 0.02 0.28* -0.92 0.61* -0.08 0.29* -0.43 0.38* -0.31 0.38*
Extraversion (16) 0.02 0.12* -0.23 0.20* -0.76 0.76* -0.22 0.20* -0.36 0.32*
Agreeableness (16) 0.07 0.24* -0.29 0.33* -0.02 0.26* -0.64 0.51* -0.26 0.37*
Emotional Stability (16) 0.04 0.21* -0.39 0.34* -0.23 0.38* -0.53 0.41* -0.82 0.66*
Home Environment
No dad at birth 0.03 0.01* 0.03 0.02 0.03 0.02 0.03 0.02 0.03 0.02
Mom teenage mother 0.18 0.10* 0.19 0.13* 0.17 0.13* 0.20 0.12* 0.19 0.13*
Yrs of schooling mom 9.57 10.27* 9.72 9.90* 9.80 9.87 9.65 9.93* 9.81 9.86
Yrs of schooling dad 9.76 10.59* 9.96 10.14* 10.05 10.11 9.75 10.24* 9.95 10.16*
Parent skilled/prof. (0) 0.78 0.89* 0.81 0.82 0.80 0.83 0.77 0.84* 0.79 0.84*
Liberal worldview (5) -0.01 0.30* 0.02 0.15* 0.02 0.19* -0.02 0.17* 0.04 0.16*
Child to be left free (5) 0.03 0.27* 0.06 0.15* 0.08 0.16* 0.04 0.16* 0.12 0.13
Child to be controlled (5) 0.99 1.08* 0.98 1.05 0.97 1.07* 0.97 1.05* 0.94 1.08*
Strong family ties (10) 2.49 2.55* 2.46 2.53* 2.49 2.53* 2.45 2.54* 2.46 2.54*
Don't get on with
parents(16) -0.22 -0.24 -0.19 -0.24* -0.22 -0.24* -0.18 -0.25* -0.18 -0.25*
Parents are free, not
strict(16) 4.59 4.46* 4.56 4.53 4.47 4.59* 4.60 4.51 4.52 4.54
Education
Cognitive ability 0.04 0.66* 0.01 0.40* 0.20 0.34* 0.03 0.40* 0.15 0.36*
Years of schooling (34) 12.16 13.96* 12.05 13.24* 12.73 12.97 12.18 13.19* 12.54 13.05*
Skilled/prof. (34) 0.50 0.74* 0.47 0.65* 0.59 0.59 0.48 0.64* 0.53 0.63*

53
Gross hourly
wage
Conscientious-
ness Extraversion Agreeableness
Emotional
Stability
≤ avg. > avg. ≤ avg. > avg. ≤ avg. > avg. ≤ avg. > avg. ≤ avg. > avg.
Sociability
Rutter score (5) -0.03 -0.20* 0.21 -0.24* 0.12 -0.28* 0.27 -0.27* 0.20 -0.28*
Rutter score (10) -0.04 -0.27* 0.20 -0.29* 0.11 -0.33* 0.19 -0.28* 0.18 -0.32*
Rutter score (16) -0.04 -0.26* 0.43 -0.39* 0.41 -0.58* 0.59 -0.47* 0.50 -0.50*
Self-esteem (10) 16.23 17.67* 15.91 17.19* 16.31 17.18* 16.03 17.15* 16.24 17.11*
Locus of control (10) 17.61 20.00* 17.35 19.09* 18.06 18.93* 17.60 18.98* 17.95 18.89*
Sports in school 9.33 9.36 9.58 9.25 9.32 9.37 10.30 8.96* 9.60 9.20
Sports outside school 8.63 9.23 9.39 8.67 8.79 8.95 9.65 8.57* 9.01 8.80
No. friends in school 5.57 5.84* 5.72 5.67 5.57 5.78 5.82 5.62 5.45 5.81*
No. friends outside school 4.93 4.69 5.27 4.65* 4.72 4.92 5.39 4.60* 4.98 4.75
Occupational Sorting
Avg Occ.Conscient.(16) 0.02 0.20* 0.03 0.12* 0.09 0.09 0.04 0.12* 0.07 0.10*
Avg Occ.Extrav.(16) 0.03 0.09* 0.05 0.05 0.04 0.06* 0.04 0.05* 0.04 0.05*
Avg Occ.Agreeabl.(16) 0.06 0.17* 0.06 0.12* 0.10 0.10 0.06 0.12* 0.09 0.11*
Avg Occ.Emot.Stab.(16) 0.05 0.16* 0.07 0.10* 0.09 0.09* 0.06 0.10* 0.07 0.10*
Above Avg Occ. C (16) 0.66 0.73* 0.08 0.97* 0.59 0.76* 0.45 0.80* 0.50 0.80*
Above Avg Occ. E (16) 0.55 0.59 0.44 0.63* 0.06 1.00* 0.45 0.62* 0.38 0.68*
Above Avg Occ. A (16) 0.70 0.74* 0.50 0.82* 0.64 0.79* 0.18 0.98* 0.49 0.86*
Above Avg Occ. N (16) 0.60 0.64 0.40 0.72* 0.46 0.75* 0.32 0.76* 0.03 0.98*
Max. Observations 1,800 1,134 944 1,990 1,346 1,588 958 1,976 1,111 1,823
Note: Average levels of variables (rows) by below or above average wages or personality (columns) for the
working sample of 2,934 working men with valid data on age 34 gross hourly wages, age-10 cognitive ability,
and age-16 personality (conscientiousness, extraversion, agreeableness, and emotional stability). * indicates that
the above average mean is significantly different from the below average mean, at the 5 percent level. Number
of observations shows maximum sample size of below and above average groups.

54
Table A 4. Returns to Extraversion, Agreeableness and Emotional Stability on Socio-Economic Outcomes, All Specifications
Controls Trait Wage Save BMI Alcoholic Smoke Cannabis Arrested Satisfaction Life Get Life Run
Home Extraversion (16) .005 -.0249* .113 -.004 .0256** .009 .0169** .144*** .0291*** .00562***
(0.40) (-1.96) (0.84) (-0.43) (2.17) (1.05) (2.26) (3.20) (3.43) (3.72)
Agreeableness (16) -.001 -.008 -.252 -.011 -.0304** -.010 -.0157** .021 -.008 .003
(-0.08) (-0.61) (-1.42) (-1.03) (-2.50) (-1.23) (-2.28) (0.34) (-0.88) (1.52)
Emotional Stability (16) .002 .021 -.224 .0242** -.016 .006 -.007 -.063 -.005 .000
(0.11) (1.44) (-1.46) (1.97) (-1.15) (0.59) (-0.83) (-1.12) (-0.52) (0.07)
n 1,577 1,576 1,538 1,561 1,577 1,576 1,576 1,576 1,576 1,576
Education Extraversion (16) .006 -.0306*** .088 .011 .0345*** .0230*** .0261*** .112*** .0277*** .00773***
(0.70) (-3.21) (0.88) (1.41) (3.66) (3.30) (4.09) (3.29) (3.98) (3.00)
Agreeableness (16) .015 .009 -.144 -.005 -.0464*** -.0213*** -.0188*** .054 .007 .00438*
(1.42) (0.82) (-1.20) (-0.62) (-4.63) (-2.95) (-3.01) (1.27) (0.95) (1.69)
Emotional Stability (16) .001 .0355*** -.119 .008 -.010 -.010 -.0233*** .027 .004 .000
(0.04) (3.10) (-1.02) (0.81) (-0.92) (-1.17) (-3.21) (0.63) (0.47) (0.13)
n 2,928 2,927 2,859 2,897 2,928 2,927 2,927 2,927 2,927 2,927
Rutter Extraversion (16) -.007 -.0367** .169 .001 .0685*** .0249** .0250** .172*** .0248** .007
(-0.44) (-2.28) (0.97) (0.04) (4.46) (2.09) (2.36) (2.96) (2.10) (1.46)
Agreeableness (16) .011 .007 -.103 -.009 -.017 -.011 -.0245*** .0979* .008 .004
(0.78) (0.48) (-0.59) (-0.75) (-1.24) (-1.06) (-2.59) (1.65) (0.75) (0.93)
Emotional Stability (16) -.001 .0245* -.101 .008 .007 -.003 -.0245*** .052 -.001 .000
(-0.06) (1.89) (-0.76) (0.77) (0.55) (-0.35) (-2.81) (1.03) (-0.13) (-0.06)
n 2,539 2,538 2,478 2,514 2,539 2,538 2,538 2,538 2,538 2,538
SE+LOC Extraversion (16) .000 -.0310*** .109 .012 .0398*** .0214*** .0283*** .0970*** .0260*** .00666***
(-0.03) (-3.24) (1.09) (1.51) (4.21) (3.04) (4.30) (2.88) (3.75) (2.59)
Agreeableness (16) .0195* .012 -.124 -.006 -.0487*** -.0215*** -.0194*** .050 .008 .004
(1.78) (1.17) (-1.04) (-0.75) (-4.74) (-2.93) (-3.00) (1.17) (1.06) (1.60)
Emotional Stability (16) -.004 .0266** -.142 .009 -.008 -.008 -.0231*** .023 -.001 .000
(-0.31) (2.33) (-1.22) (0.92) (-0.71) (-0.96) (-3.07) (0.55) (-0.10) (0.14)
n 2,892 2,891 2,823 2,860 2,891 2,890 2,890 2,890 2,890 2,890

55
Controls Trait Wage Save BMI Alcoholic Smoke Cannabis Arrested Satisfaction Life Get Life Run
Social at 16 Extraversion (16) .004 -.0323** .232 -.004 .018 .004 .0224*** .075 .0228** .00598***
(0.27) (-2.39) (1.50) (-0.33) (1.43) (0.38) (2.90) (1.57) (2.49) (3.18)
Agreeableness (16) .013 .001 -.256 -.017 -.0385*** -.014 -.0205*** .091 .001 .002
(0.81) (0.10) (-1.38) (-1.58) (-2.93) (-1.47) (-3.12) (1.39) (0.05) (1.12)
Emotional Stability (16) .007 .0295* -.169 .0316** -.008 .009 -.009 .034 .002 .000
(0.40) (1.93) (-1.00) (2.40) (-0.50) (0.85) (-1.10) (0.59) (0.13) (0.21)
n 1,393 1,392 1,358 1,380 1,392 1,392 1,392 1,392 1,392 1,392
Note: OLS regression coefficients on for “Wage”, “BMI”, and “Satisfaction”. Probit marginal effects of age-16 conscientiousness for other outcomes. * Significant at 10%,
** Significant at 5%, *** Significant at 1%. Robust t-values in parentheses. Each cell represents one single specification. Each panel pertains to a specific set of controls,
but each specification includes the Main controls, which are age-10 cognitive ability, age-16 conscientiousness, gender, a fulltime dummy, region of birth dummies, and a
general intercept (results omitted). Additional sets of controls are as follows. Home: no dad at birth dummy, mom teenage mother dummy, years of schooling of mother and
of father, social class of parents at birth (skilled/professional dummy), parental views on "liberal worldview" and "child to be left free" and "child to be controlled", and self-
rated family ties at age 10, "don't get on with parents" (at 16), and "parents are free, not strict" (at 16). Education: years of schooling, social class at 34 (skilled/professional
dummy). Rutter: Rutter behaviour scores at ages 5, 10, and 16. SE+LOC: self-esteem and locus of control at age 10. Social at 16: amount of sports inside and outside
school, and number of friends inside and outside school.

56
Table A 5. Mean Personality Traits by 2-digit SOC2000
Description SOC2000 n Share
of men C E A N
Corporate Managers 11 457 .62 .11*** .07 .05 .04
(.02) (.04) (.05) (.04) (.05)
Managers and Proprietors in
Agriculture and Services
12 67 .63 -.02 .00 .06 .11
(.06) (.10) (.11) (.10) (.08)
Science and Technology
Professionals
21 143 .82 .26*** .08 .20*** .21***
(.03) (.06) (.07) (.06) (.06)
Health Professionals 22 27 .59 .41*** -.01 .36*** .40***
(.10) (.13) (.17) (.06) (.13)
Teaching and Research
Professionals
23 147 .31 .22*** -.07 .25*** .09
(.04) (.07) (.08) (.07) (.08)
Business and Public Service
Professionals
24 141 .46 .46*** -.04 .27*** .17**
(.04) (.05) (.09) (.05) (.08)
Science and Technology
Associate Professionals
31 94 .79 .07 -.19* .15** .12
(.04) (.08) (.11) (.07) (.09)
Health and Social Welfare
Associate Professionals
32 139 .16 .11 .12 .07 -.03
(.03) (.08) (.08) (.09) (.08)
Protective Service Occupations 33 71 .76 -.11 .29*** -.14 .03
(.05) (.12) (.10) (.12) (.12)
Culture, Media and Sports
Occupations
34 45 .38 .27** -.07 .11 .27***
(.07) (.11) (.15) (.13) (.10)
Business and Public Service
Associate Professionals
35 208 .45 .16*** .01 .10* .05
(.03) (.06) (.07) (.05) (.07)
Administrative Occupations 41 325 .23 -.02 -.09 -.01 -.07
(.02) (.06) (.05) (.06) (.06)
Secretarial and Related
Occupations
42 79 .06 -.01 -.06 -.02 -.23*
(.03) (.10) (.10) (.11) (.13)
Skilled Agricultural Trades 51 17 .94 -.49 .28 .01 .37***
(.06) (.31) (.17) (.20) (.13)
Skilled Metal and Electrical
Trades
52 138 .98 -.11 -.03 -.15 .00
(.01) (.09) (.09) (.10) (.08)
Skilled Construction and
Building Trades
53 66 1.00 -.20 .14 -.15 .12
(.00) (.12) (.12) (.17) (.10)
Textiles, Printing and Other
Skilled Trades
54 49 .65 -.61*** -.22 -.20 -.17
(.07) (.20) (.17) (.16) (.16)
Caring Personal Service
Occupations
61 138 .06 -.07 -.02 .04 -.07
(.02) (.10) (.09) (.07) (.09)
Leisure and Other Personal
Service Occupations
62 35 .23 .20* .07 .30*** -.04
(.07) (.11) (.14) (.05) (.15)
Sales Occupations 71 106 .22 -.23* -.13 -.17 -.21*
(.04) (.12) (.11) (.13) (.12)
Customer Service Occupations 72 36 .08 .02 .03 -.09 -.34**
(.05) (.18) (.15) (.15) (.17)
Process, Plant and Machine
Operatives
81 117 .76 -.38*** -.09 -.18* -.03
(.04) (.11) (.10) (.11) (.11)
Transport and Mobile Machine
Drivers and Operatives
82 80 .89 -.52*** .12 -.64*** -.27**
(.04) (.13) (.09) (.17) (.12)
Elementary Trades, Plant and
Storage Related Occupations
91 73 .85 -.22* .11 -.25 .14
(.04) (.13) (.13) (.15) (.10)
Elementary Administration and
Service Occupations
92 131 .44 -.39*** -.01 -.32*** -.33***
(.04) (.11) (.09) (.11) (.11)
n 2,929 2,929 2,929 2,929 2,929 2,929
Entries are mean age-16 personality traits by 2-digit 2000 Standard Occupational Classification (SOC2000).
Stars indicate the mean is significantly different from the average of zero: * Significant at 10%, ** Significant
at 5%, *** Significant at 1%. Standard errors in parentheses. The sample applied is our working sample of
2,934 individuals with valid information on adult wages, age-10 cognitive ability, and age-16 personality.

57
A3 First-stage results for 2SLS reported in Section 4 As reported in section 4, the OLS regressions presented in Table 3 could be biased because of
correlation between the independent variables and the error term. Below, in Table A5, we
show the first-stage results of the 2SLS results reported in Table 6. Both when the respondent
was 10 years of age and 16 years of age, their mothers reported on the same set of personality
items used to construct our personality traits. We use the resulting age-10 personality
constructs as instruments for those measured at age 16 (See Table 1 for reliability
coefficients). We assume that measurement error in the mother-rated items at both points in
time is uncorrelated, which seems plausible given the six-year window between the two
surveys.
The first-stage results are strong, and the F-tests for each of the constructs well exceed the
threshold of 10, ranging from 94 for age-16 agreeableness to 119 for age-16 emotional
stability (N(16)). The second-stage estimates for all socio-economic outcomes are shown in
the first panel of Table 6 in section 4. While the first-stage results here pertain to the
regression sample for age-34 wages, the first-stage results for the other socio-economic
outcomes are almost identical, and are therefore not reported.
Table A 6. First-stage results for 2SLS results in Section 4, Table 6
C(16) E(16) A(16) N(16)
Conscientiousness (10) .336*** -.013 .033 .003
(16.27) (-0.61) (1.55) (0.16)
Extraversion (10) -.0444** .324*** -.104*** -.003
(-2.29) (16.18) (-5.23) (-0.13)
Agreeableness (10) .0544** -.0467** .277*** .0480**
(2.50) (-2.07) (12.35) (2.17)
Emotional Stability (10) .0699*** .103*** .122*** .353***
(3.09) (4.41) (5.24) (15.42)
Age 10 ability .112*** .021 .0840*** .0538***
(6.24) (1.13) (4.54) (2.95)
Male dummy -.005 .054 -.005 .200***
(-0.13) (1.33) (-0.12) (5.02)
Fulltime dummy .022 -.019 -.021 .0942*
(0.45) (-0.37) (-0.42) (1.91)
Constant -.015 -.013 .019 -.176***
(-0.39) (-0.32) (0.49) (-4.56)
n 2,782 2,782 2,782 2,782
F-test 116.9 105.1 94.24 119.4
R-squared .190 .134 .141 .168
Note: First-stage regression results for 2SLS estimates reported for age-34 wage in Table 6. * Significant at
10%, ** Significant at 5%, *** Significant at 1%. T-values in parentheses. All specifications control for age-10
cognitive ability, gender, a fulltime dummy, region of birth dummies (results omitted), and a general intercept
(Constant).