association of oil pipe lines - home page - aopl · association of oil pipe lines (aopl) represents...
TRANSCRIPT

AOPL Association of Oil Pipe Lines
®
U.S. Liquids Pipeline Usage & Mileage Report
October 2014
energy

ASSOCIATION OF OIL PIPE LINES (AOPL) represents liquids pipeline owners and operators transporting crude oil, petroleum products like gasoline, diesel, jet fuel, and home heating oil and industrial products like propane and ethane.
AMERICAN PETROLEUM INSTITUTE (API) is the only national trade association that represents all aspects of America’s oil and natural gas industry. For more information on this report or how liquids pipelines are meeting our energy transportation needs, please contact: John Stoody with the Association of Oil Pipe Lines at [email protected] or visit www.aopl.org

U.S. Liquids Pipeline Usage & Mileage Are Growing October 2014
Pipelines make life better for American consumers and workers. Liquids pipelines deliver U.S. consumers the gasoline, home heating oil, propane and jet fuel they need to get to work, heat their homes and travel. Liquids pipelines deliver U.S. workers the raw materials like ethane they use for good-paying manufacturing jobs. Liquids pipelines deliver U.S. farmers the propane they need to dry their crops after harvest and keep their livestock warm through the winter. The United States and all of North America are in the midst of an energy production renaissance. Technologies such as horizontal drilling and hydraulic fracturing are yielding new supplies of crude oil and natural gas liquids like propane and ethane. The nation’s pipeline operators are busy providing the infrastructure needed to deliver these new supplies from where they are produced to where they are processed, refined and then delivered to American workers and consumers. Similarly, pipeline operators are expanding existing pipelines and repurposing underused pipelines to uses more in demand.
This report provides data and analysis on liquids pipelines, the volume of crude oil and petroleum products they are transporting, and the miles they are traveling. Compiled from operator and government sources, the role of pipelines in supplying the liquid energy needs of America is clear.
AOPL Association of Oil Pipe Lines
® energy

2013 U.S. LIQUIDS PIPELINE USAGE & MILEAGE SUMMARY Liquid pipeline operators delivered 14.948 billion barrels of crude oil and petroleum products by U.S. transmission pipeline in 2013 Total crude oil and petroleum products delivered by U.S transmission liquids pipeline rose 6.2% from 2012 to 2013 Liquids pipeline operators delivered 8.306 billion barrels of crude oil by U.S. transmission pipeline in 2013 Crude oil barrels delivered by U.S. transmission pipeline rose 11.3% from 2012 to 2013 Over the last 5 years, crude oil barrels delivered by U.S. transmission pipeline rose 1.351 billion barrels or 19.4% U.S. liquids pipeline mileage totaled 192,396 miles in 2013 Over the last 5 years, total U.S. liquids pipeline mileage increased 16,431 miles or 9.3% Over the last 10 years, total U.S. liquids pipeline mileage increased 25,727 miles or 15.4% Pipeline operators operated 60,911 miles of U.S. crude oil pipeline in 2013 Over the last 5 years, U.S. crude oil pipeline mileage increased 8,174 miles or 15.5% Over the last 10 years, U.S. crude oil pipeline mileage increased 11,647 miles or 23.6%
8.3 Billion Barrels
14.9 Billion Barrels
192,396 Miles
+11.3%
+1.4 Billion Barrels
+6.2%
+16,431 Miles
+25,727 Miles
60,911 Miles
+8,174 Miles
+11,647 Miles
Transmission pipelines include interstate or other large intrastate, main- or trunk-line pipelines
0
4,000,000,000
8,000,000,000
12,000,000,000
16,000,000,000
2009 2010 2011 2012 2013
Crude Oil Refined Products (Gasoline, Diesel, Jet Fuel, etc) & Natural Gas Liquids (Propane, Ethane, etc)
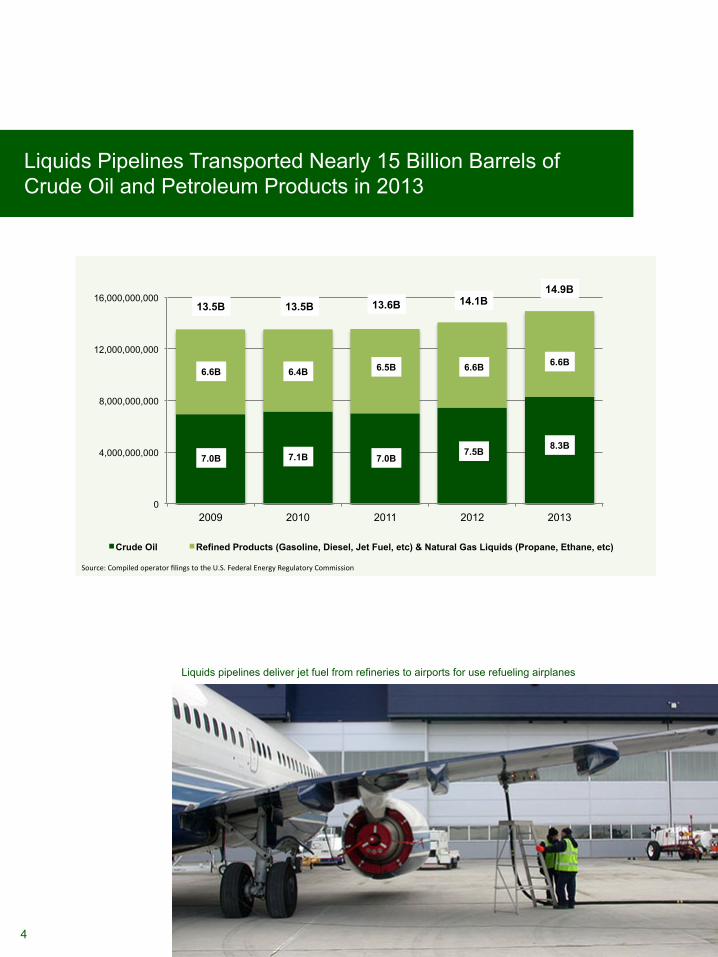
14.1B 13.6B 13.5B 13.5B 14.9B
6.6B 6.4B 6.5B 6.6B 6.6B
7.5B 7.0B 7.1B 7.0B
8.3B
Liquids Pipelines Transported Nearly 15 Billion Barrels of Crude Oil and Petroleum Products in 2013
Liquids pipelines deliver jet fuel from refineries to airports for use refueling airplanes
Source: Compiled operator filings to the U.S. Federal Energy Regulatory Commission
4

• In 2013, U.S. transmission liquids pipelines delivered 8.306 billion barrels of crude oil, an 11.3% increase over 2012
• In 2013, U.S. transmission liquids pipelines delivered 6.642 billion barrels of petroleum products such as refined products (gasoline, diesel, jet fuel, etc) and natural gas liquids (propane, ethane, butane, etc), a 0.4% increase over 2012
• In total, U.S. transmission pipelines delivered 14.948 billion barrels of crude oil and petroleum products in 2013, a 6.2% increase over 2012
• Over the 5 years from 2009 to 2013, U.S. transmission pipeline deliveries of crude oil rose 1.351 billion barrels, a 19.4% increase
• During the same 5 year time period, other petroleum products delivered by U.S. transmission pipeline increased 80.8 million barrels or 1.2%
• Transmission pipelines include interstate pipelines or other large intrastate, main- or trunk-line pipelines
• AOPL assembled this data from annual filings pipeline operators made to the U.S. Federal Energy Regulatory Commission1
Liquids Pipeline Delivery Data
5
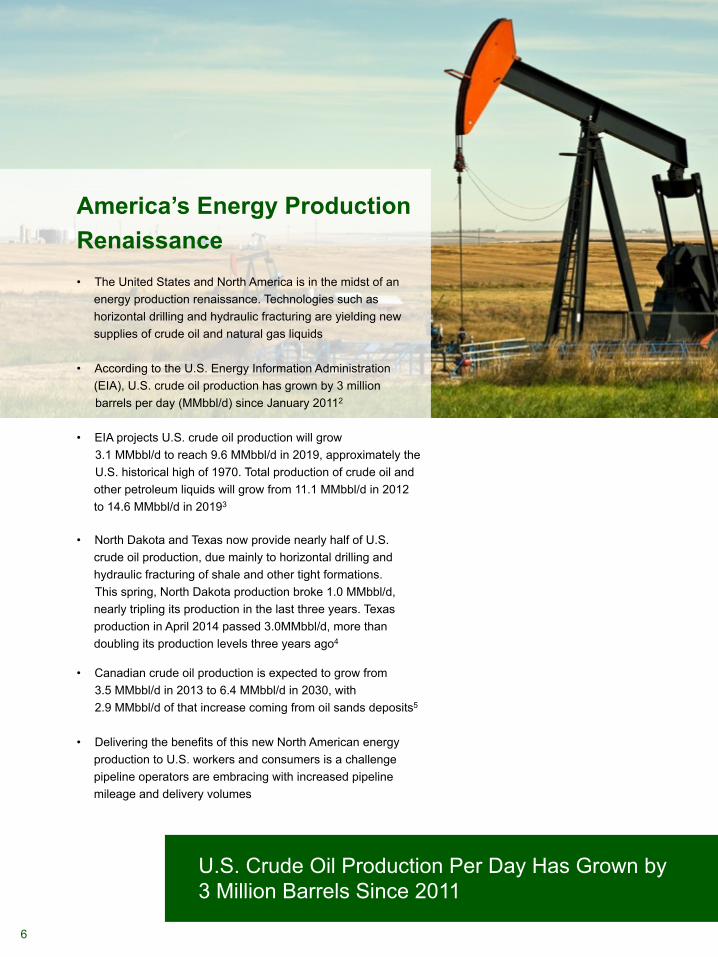
America’s Energy Production Renaissance • The United States and North America is in the midst of an
energy production renaissance. Technologies such as horizontal drilling and hydraulic fracturing are yielding new supplies of crude oil and natural gas liquids
• According to the U.S. Energy Information Administration
(EIA), U.S. crude oil production has grown by 3 million barrels per day (MMbbl/d) since January 20112
• EIA projects U.S. crude oil production will grow 3.1 MMbbl/d to reach 9.6 MMbbl/d in 2019, approximately the U.S. historical high of 1970. Total production of crude oil and other petroleum liquids will grow from 11.1 MMbbl/d in 2012 to 14.6 MMbbl/d in 20193
• North Dakota and Texas now provide nearly half of U.S.
crude oil production, due mainly to horizontal drilling and hydraulic fracturing of shale and other tight formations. This spring, North Dakota production broke 1.0 MMbbl/d, nearly tripling its production in the last three years. Texas production in April 2014 passed 3.0MMbbl/d, more than doubling its production levels three years ago4
• Canadian crude oil production is expected to grow from 3.5 MMbbl/d in 2013 to 6.4 MMbbl/d in 2030, with 2.9 MMbbl/d of that increase coming from oil sands deposits5
• Delivering the benefits of this new North American energy
production to U.S. workers and consumers is a challenge pipeline operators are embracing with increased pipeline mileage and delivery volumes
U.S. Crude Oil Production Per Day Has Grown by 3 Million Barrels Since 2011
6

0
50,000
100,000
150,000
200,000
2004 2005 2006 2007 2008 2009 2010 2011 2012 2013
Crude Oil Natural Gas Liquids Refined Products
Liquids Pipeline Mileage Up Over 25,000 Miles Since 2004
192,396 mi.
166,669 mi.
• In 2013, pipeline operators reported 192,396 miles of liquids pipeline in operation in the United States, with 60,911 miles devoted to crude oil, 63,532 miles transporting refined petroleum products (gasoline, diesel, jet fuel, etc), and 62,742 miles delivering natural gas liquids (propane, ethane, butane, etc)6
• Total U.S. pipeline mileage of 192,396 miles in 2013 reflected a 6,187 mile or 3.3% increase over 2012, a 16,431 mile or 9.3% increase over the last 5 years, and a 25,727 mile or 15.4% increase over the last 10 years
• Crude oil pipelines stretched 60,911 miles across the U.S. in 2013, up 3,448 miles or 6.0% over 2012, a 8,174 mile or 15.5% increase over the last 5 years, and a 11,647 mile or 23.6% increase over the last 10 years
• Refined petroleum product pipeline mileage of 63,532 miles in 2013 was a 497 mile or 0.8% decrease from 2012, a 1,729 mile or 2.8% increase over 5 years ago, and a 1,141 mile or 1.8% increase over 10 years ago
• U.S. pipelines carrying natural gas liquids totaled 62,742 miles in 2013, 2,881 miles or 4.8% above 2012 mileage, 5,509 miles or 9.6% above 2009 levels, and 10,948 miles or 21.1% above 2004 mileage
Pipe-‐laying cranes lower secKons of a new pipeline into place
7

American Consumers Benefit from Pipeline Deliveries
Crude oil pipelines deliver crude oil from producKon
locaKons to refineries.
Products pipelines deliver refined
petroleum products from refineries to regional tank farms. Trucks complete the
journey bringing gasoline and diesel
fuel to local service staKons
8

2013 Liquids Pipeline Mileage
TOTAL – 192,396 Miles
Crude Oil 60,911 Mi.
Products 63,532 Mi.
NGLs 62,742 Mi.
Crude oil pipeline growth has accelerated over the last 10 years
9

Citations 1. Annual Pipeline Operator Form 6 Filings to the U.S. Federal
Energy Regulatory Commission.
2. Today In Energy, U.S. Liquid Fuels Production Growth More Than Offsets Unplanned Supply Disruptions, U.S. Energy Information Administration, Aug. 27, 2014.
3. Annual Energy Outlook 2014, U.S. Energy Information Administration, Apr. 2014.
4. Today in Energy, North Dakota and Texas Now Provide Nearly Half of U.S. Crude Oil Production, U.S. Energy Information Administration, Jul. 2014.
5. Crude Oil Forecast, Markets and Transportation, Canadian Association of Petroleum Producers, Jun. 9, 2014.
6. Annual Report Mileage for Hazardous Liquid Systems, U.S. Pipeline and Hazardous Materials Safety Administration, Sep. 2014.
7. Today In Energy, Rail Deliveries of U.S. Oil Continue to Increase in 2014, U.S. Energy Information Administration, Sep. 2, 2014.
10

