associated earth sciences, inc
TRANSCRIPT

www.aesgeo.com
Associated Earth Sciences, Inc.

www.aesgeo.com
April 23, 2013
Presented by:Matthew A. Miller, PE
Associated Earth Sciences, Inc.

www.aesgeo.com
How & Where does infiltration work? Context: Summary of Geologic History
Constraints/benefits for different geologic units
Key geologic and groundwater flow parameters critical to site planning/engineering
Brief Project Example◦ Lakewood Crossing

www.aesgeo.comReference: D. Molenaar, 1987

www.aesgeo.com
Typical Puget Sound Stratigraphy Recessional outwash:
Bedded and sorted sand, gravel. River deposits flowing from wasting and retreating ice
Till: Unsorted mixture of clay, silt, sand, gravel, cobbles – nature’s concrete 5 to 30 feet thick on average Compacted beneath ice sheet
Advance outwash: Bedded and sorted gravel and sand at top: River deposits flowing from advancing ice; well-bedded clay and silt at base: deposits of lakes (or salt water) farther in front of the ice.

www.aesgeo.com
In the Lowland: Vashon till is the most
abundant material by surface area, but commonly a thin veneer
Vashon advance outwash is the majority by volume of the Vashon-age
glacial material
GeoMapNW
Puget SoundArea Geology
http://geomapnw.ess.washington.edu/index.php
Map Source:Geologic Map of King County Compiled by Booth, Troost, and Wisher, May 2006

www.aesgeo.com
Recessional Outwash Constraints
◦ Thin
Removed during grading
Shallow ground water
Downslope impacts (slope stability, springs, wetland hydrology
Benefits
◦ High permeability
◦ Dispersed infiltration options

www.aesgeo.com
Lodgement Till
Constraints◦ Thin weathered horizon removed during
grading◦ Very low permeability parent material
◦ Good for earthen dams/berms
◦ In-situ amendments not feasible
◦ Ground water mounding◦ 1 to 1-1/2 inches/month of recharge through
till◦ 0.001 to 0.002 inches/hour

www.aesgeo.com
Storm Water Flow on Till Site
www.aesgeo.com

www.aesgeo.com
Recessional Deposit, Underlain by Till

www.aesgeo.com
Advance Outwash Constraints◦ Depth
◦ Variable receptor soil characteristics
◦ Downslope impacts (slope stability)
Benefits◦ Adequate receptor soil
◦ Recharges aquifer system
◦ Only viable solution at many sites
www.aesgeo.com
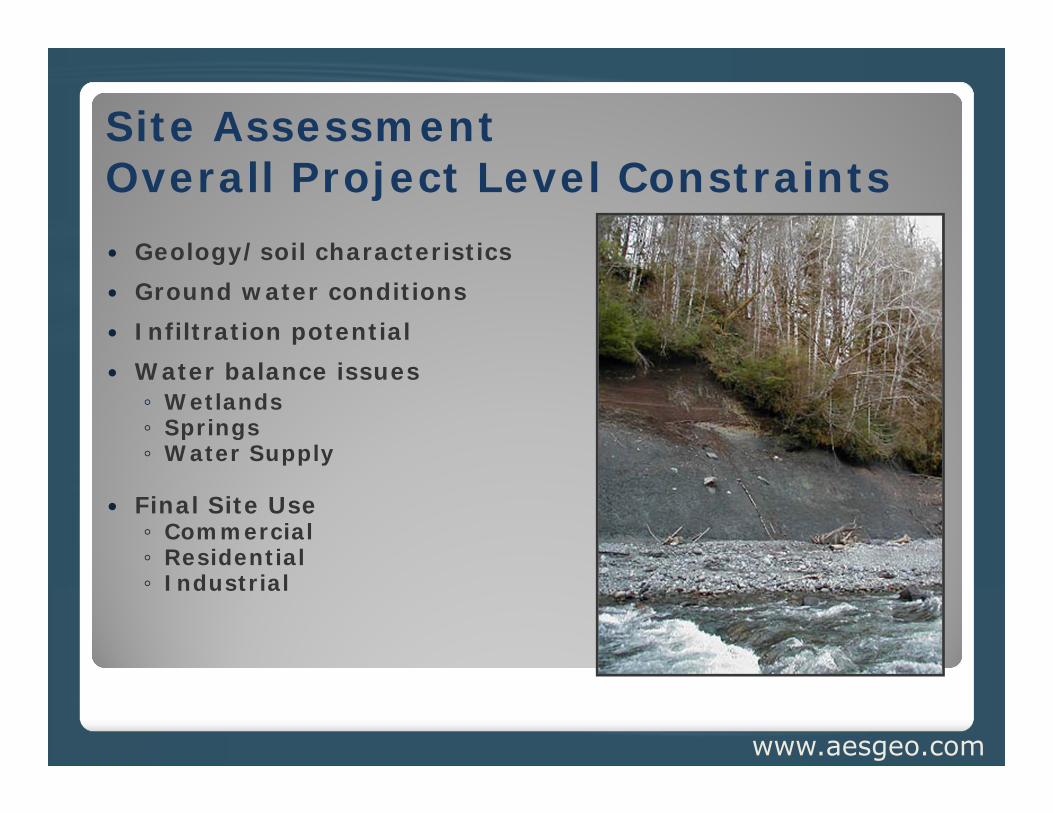
Site AssessmentOverall Project Level Constraints Geology/soil characteristics Ground water conditions Infiltration potential Water balance issues◦ Wetlands◦ Springs◦ Water Supply
Final Site Use◦ Commercial◦ Residential◦ Industrial

www.aesgeo.comwww.aesgeo.com
Exploration ◦ Exploration pits◦ Deep exploration borings
Testing Modeling
Site Analysis

www.aesgeo.comwww.aesgeo.com
Readily Available Resources
USGS and DNR Geologic Maps
USDA Maps In House Previous
Work
www.aesgeo.comwww.aesgeo.com
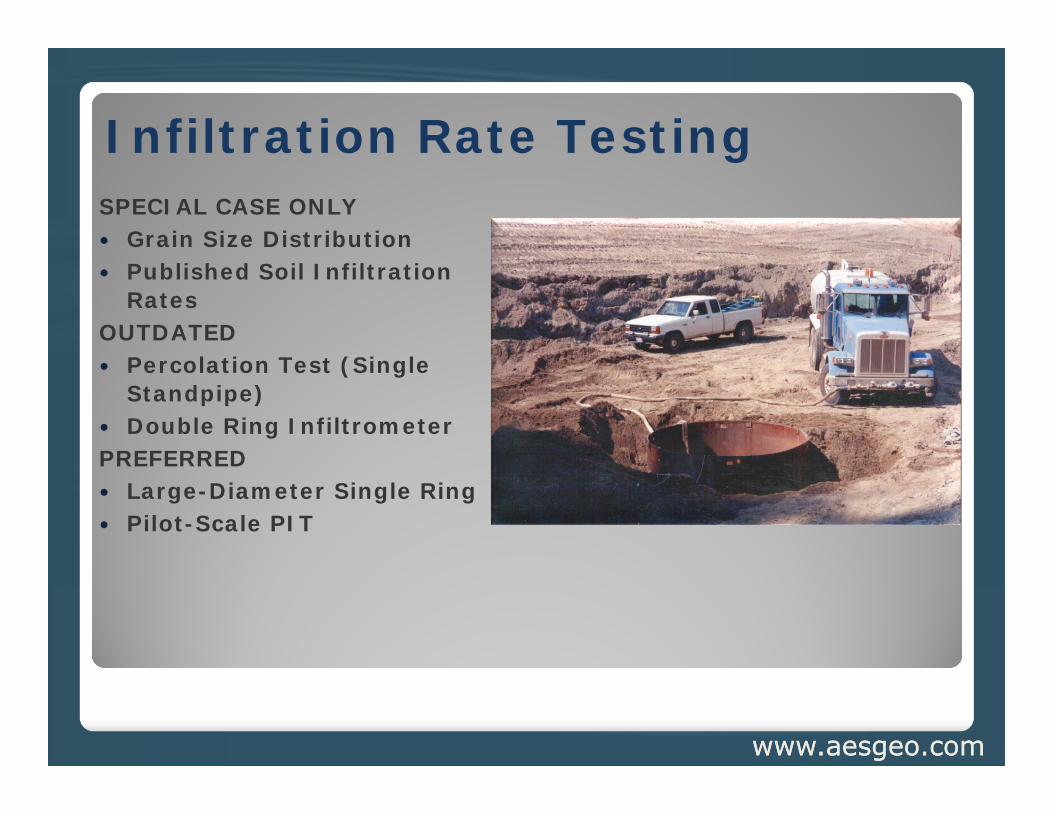
Infiltration Rate TestingSPECIAL CASE ONLY Grain Size Distribution Published Soil Infiltration
RatesOUTDATED Percolation Test (Single
Standpipe) Double Ring InfiltrometerPREFERRED Large-Diameter Single Ring Pilot-Scale PIT

www.aesgeo.com
US STANDARD SIEVE NOS.
0
20
40
60
80
100
0.010.1110100
Grain Size, mm
Perc
ent F
iner
Infiltration Rate DeterminationEcology 2012, Sieve Analysis (USDA/ASTM)Recessional Outwash or Holocene only
#200 sieveSilt/Clay

www.aesgeo.com
USDA Method, Ecology 2005Removed from Ecology 2012
Table 3.7—Recommended Infiltration Rates based on USDA Soil Textural Classification
*Short-Term Infiltration Rate
(in/hr)
Correction Factor
Estimated Long-Term (Design)
Infiltration Rate (in/hr)
Clean sandy gravels and gravelly sands
20 2 10
Sand 8 4 2
Loamy Sand 2 4 0.5
Sandy Loam 4 4 0.25
Loam 0.5 4 0.13

www.aesgeo.com
Falling Head Test (EPA)
Old School Infiltration
Double Ring Test

www.aesgeo.comwww.aesgeo.com
Small Scale Infiltration• Pilot Infiltration Test (PIT)

www.aesgeo.com
Large Scale Infiltration•Pilot Infiltration Test (PIT)
www.aesgeo.com
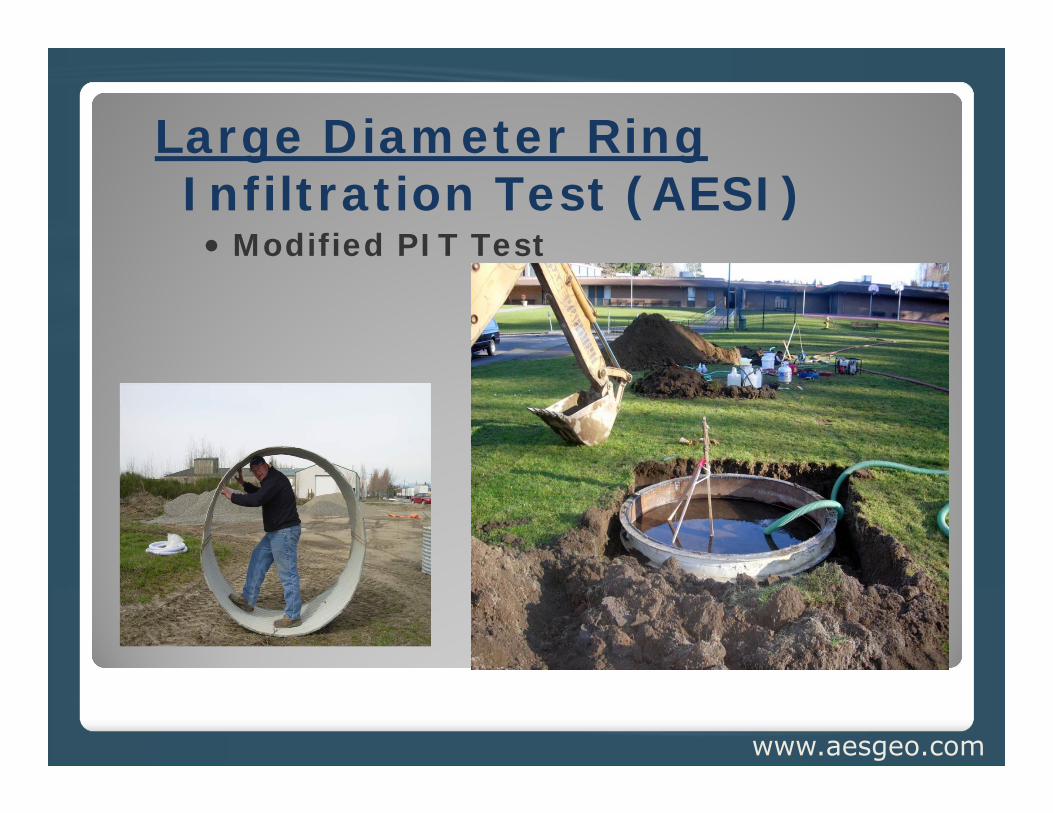
Large Diameter RingInfiltration Test (AESI)• Modified PIT Test

www.aesgeo.com
Testing Frequency2012 Ecology Manual
Commercial Sites◦ 1 test per 5,000 sq. ft.◦ Groundwater thru wet season
Residential Sites◦ 1 Test per 200 feet of road and every lot◦ Groundwater thru wet season

www.aesgeo.com
Scale of Infiltration Tests
PIT
www.aesgeo.com
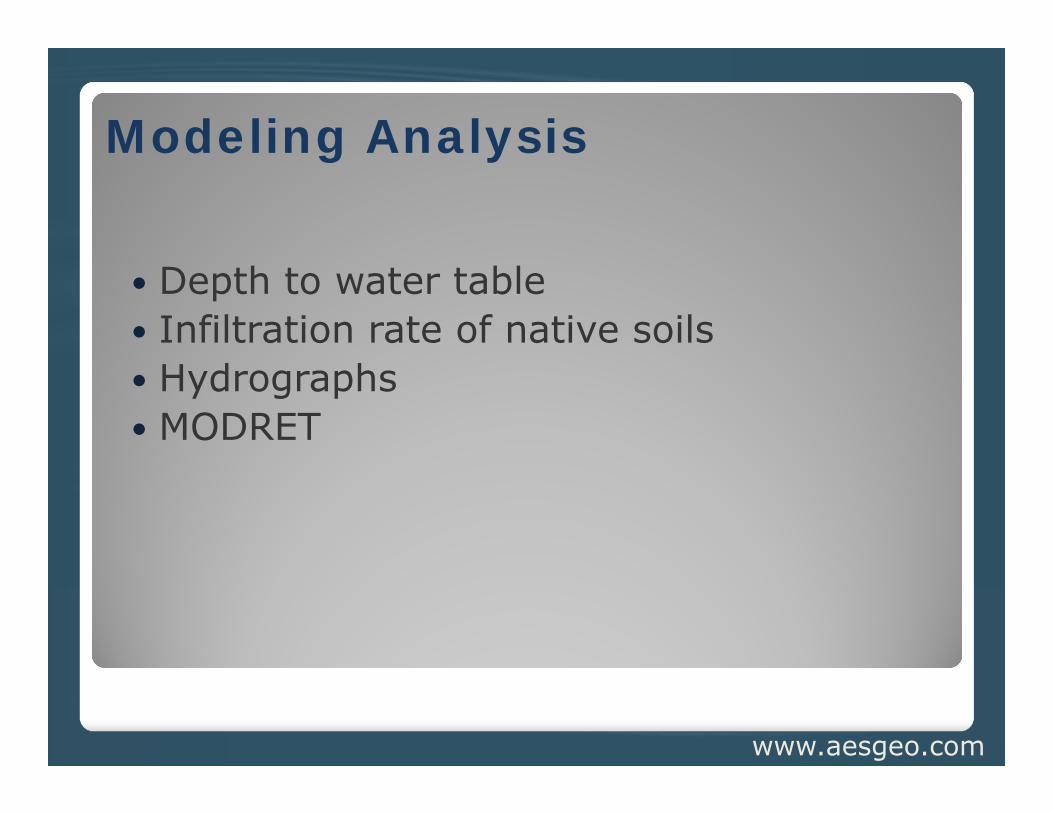
Modeling Analysis
Depth to water table Infiltration rate of native soils Hydrographs MODRET

www.aesgeo.com
Ground Water Mound Development

www.aesgeo.com
Receptor Soils
Organic Content Infiltration rate of native soils Cation Exchange Capacity Grain Size Distribution

www.aesgeo.com
Stormwater Infiltration –Summary Characterization of Receptor Soils – Hydraulic
Parameters
Infiltration Rate – Laboratory/Field Measurements
Depth to Water Table – Thickness of Unsaturated Zone
Groundwater Flow Direction – Impacts to Environment/Wells
Depth of Aquitard – Aquifer Capacity
Design Storm Event – Peak Flow Rate/Total Volume

www.aesgeo.com
Summary
Geologic constraints and opportunities mustbe fully and correctly incorporated prior tosite planning and engineering.
Geology can helppredict the nature of the physical environment.
www.aesgeo.com
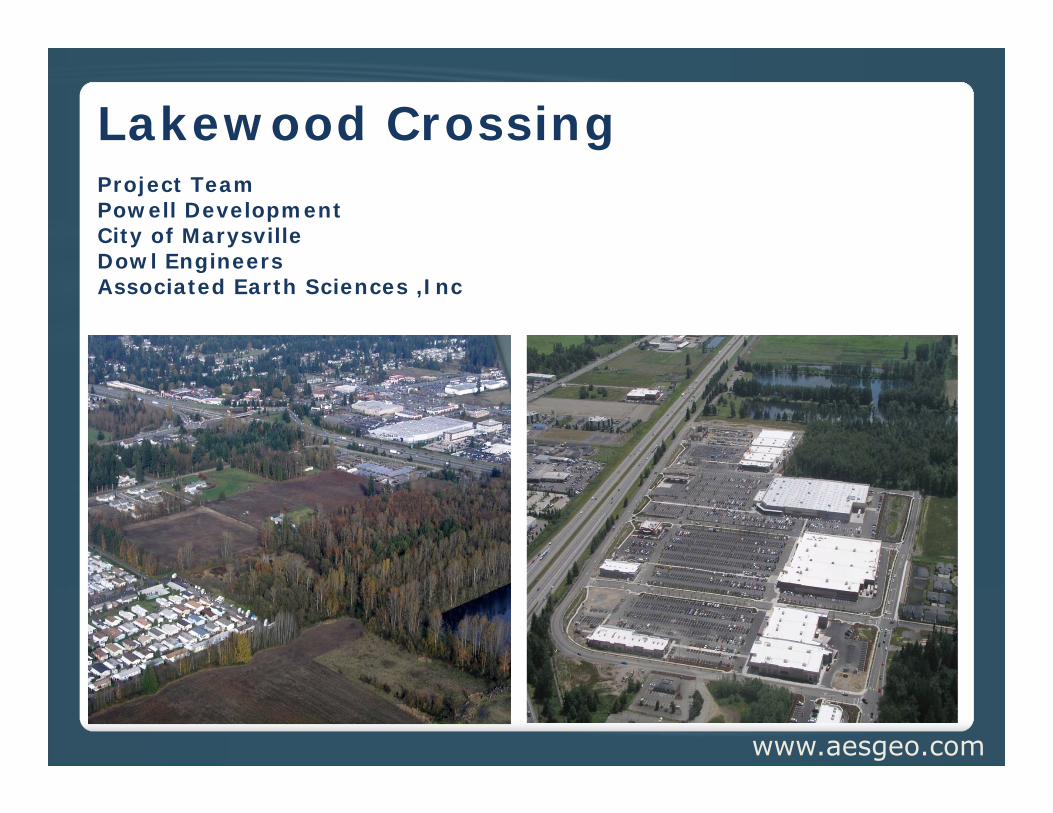
Project TeamPowell DevelopmentCity of MarysvilleDowl EngineersAssociated Earth Sciences ,Inc
Lakewood Crossing

www.aesgeo.com
Project Location

www.aesgeo.comwww.aesgeo.com
Site Conditions
Previous use ◦ Nursery◦ Farm Land◦ Residential
Topography◦ Flat
www.aesgeo.com
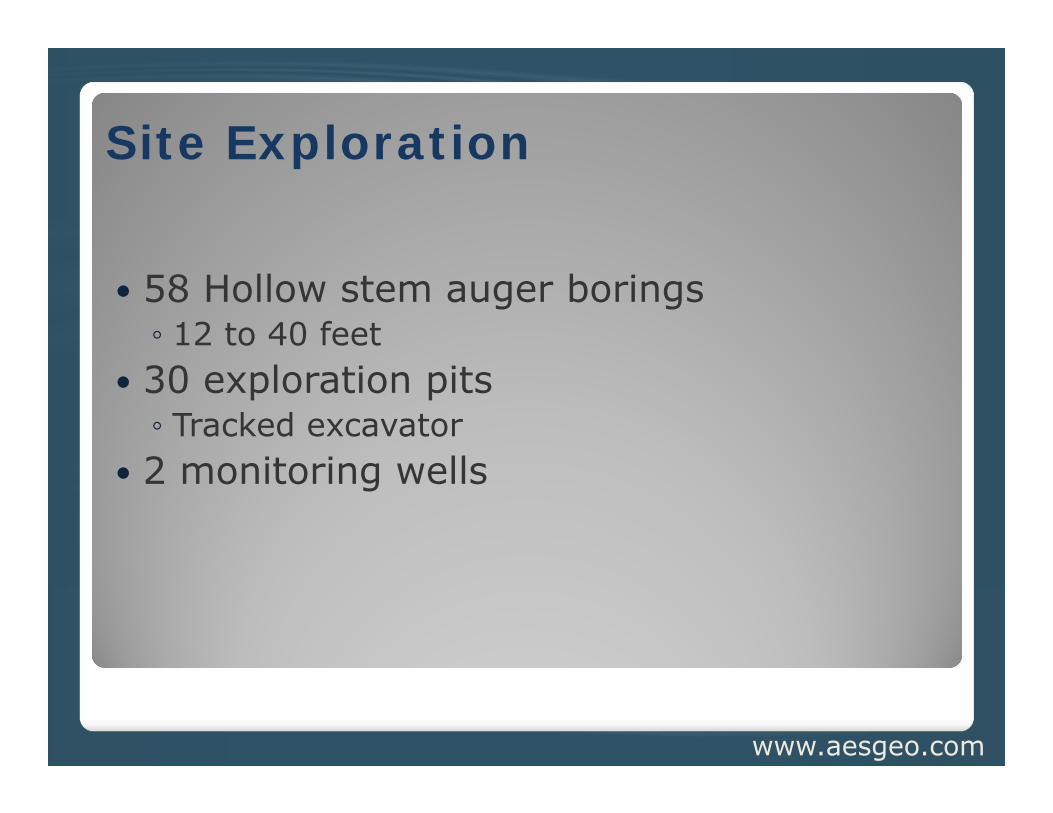
Site Exploration
58 Hollow stem auger borings◦ 12 to 40 feet
30 exploration pits◦ Tracked excavator
2 monitoring wells
www.aesgeo.com
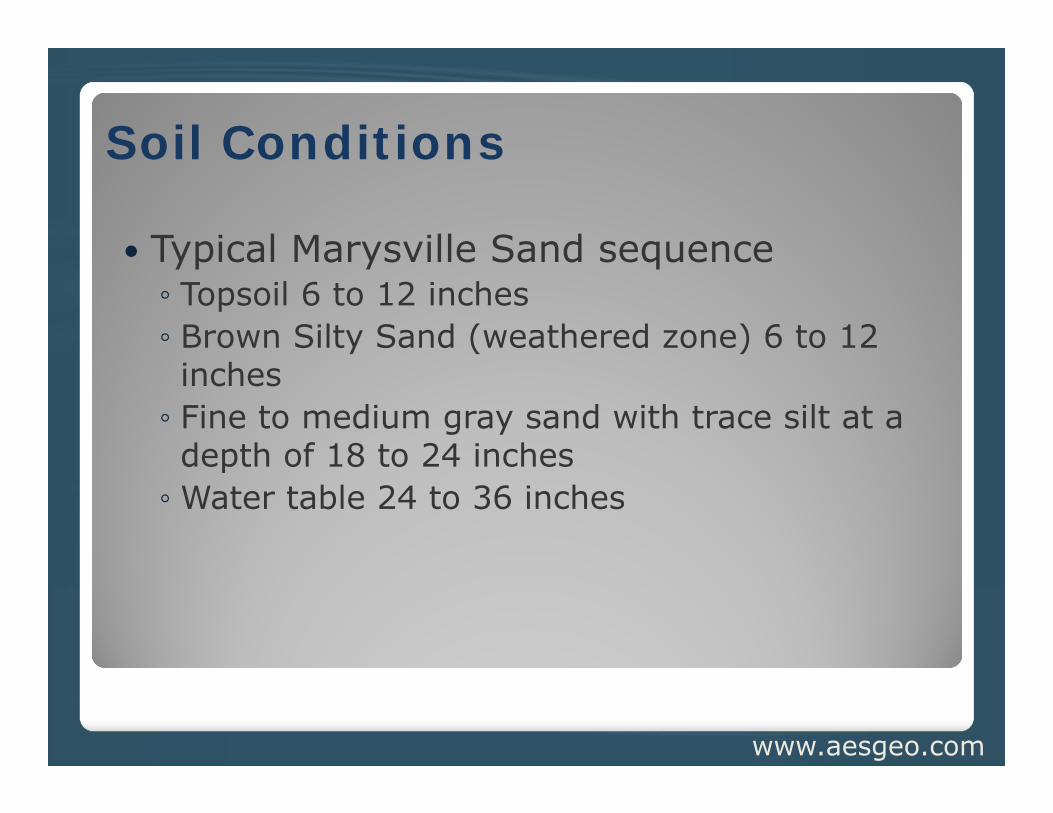
Soil Conditions
Typical Marysville Sand sequence◦ Topsoil 6 to 12 inches ◦ Brown Silty Sand (weathered zone) 6 to 12 inches◦ Fine to medium gray sand with trace silt at a depth of 18 to 24 inches◦ Water table 24 to 36 inches
www.aesgeo.com
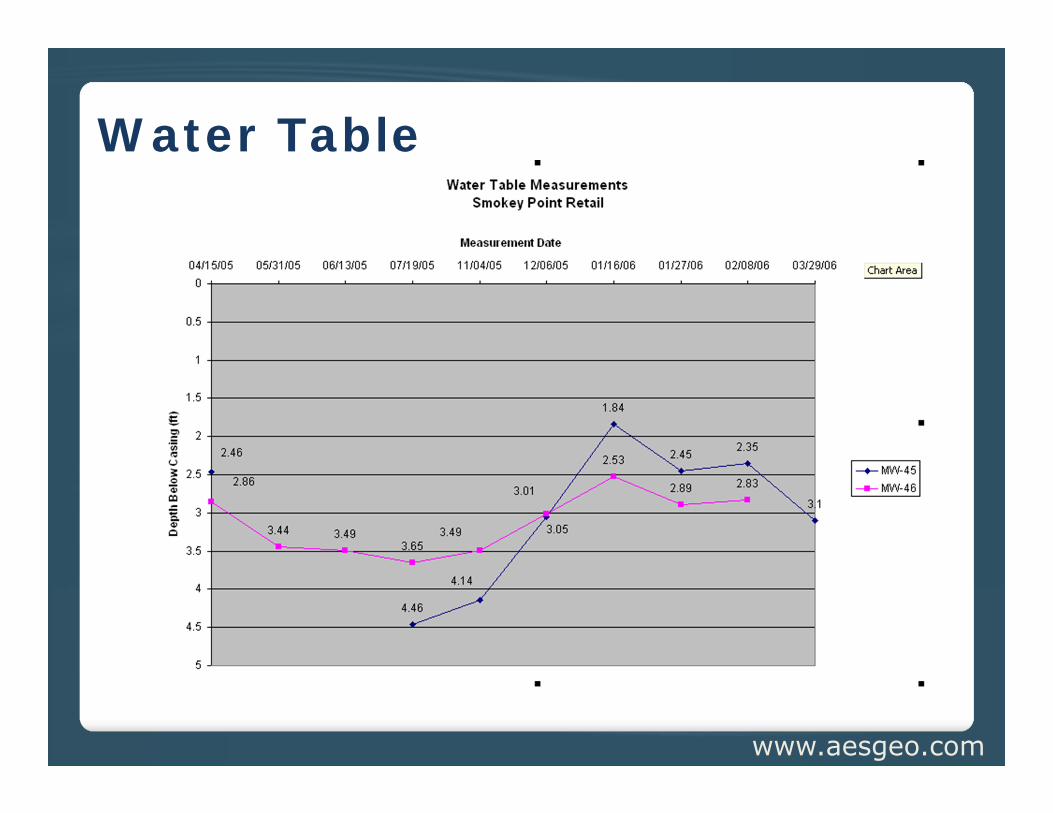
Water Table

www.aesgeo.com
Site Constraints Flat topography Parking requirements Site design

www.aesgeo.com
Alternative
• Conventional Collection•Off-site pond•Acquire more land•Discharge into existing ditch which flows into salmon bearing QuilcedaCreek
This option required raising the entire site 8 feet at $1M per foot
www.aesgeo.com
www.aesgeo.com
LID Options
Pervious surfacing Biofilters Cartridge Curb cuts to bio-swales

www.aesgeo.com
Design Elements
Infiltration rate 9 inches per hour Separation to water table 1 foot from the
bottom of the storage layer Very large parking area

www.aesgeo.com
Porous Pavement SectionPorous asphalt
5/8 clean crushed choker course
1 ¼ inch crushedStorage Layer
Clean bank run
Native subgrade
4 “
As needed
2 ”
18 “

www.aesgeo.com
Subgrade Choker Course◦ ¼” to 5/8” inch clean crushed rock (no fines)
Storage Layer◦ 1 ¼” Clean crushed rock◦ No fines◦ WSDOT 9-03.09(2) Permeable Ballast◦ Specification 30% voids (tested at 42%)
Bank Run ◦ Less than 5% minus #200 standard sieve◦ Greater permeability than the native subgrade

www.aesgeo.comwww.aesgeo.com
Subgrade Preparation Stripping depth Uniformity of
subgrade support Static Roll Geotextile

www.aesgeo.comwww.aesgeo.com
Construction
Static roll or No roll
Truck traffic to a minimum, establish haul routes
Erosion control Finished product
protection
www.aesgeo.com
Subgrade Protection
Siltation from other areas Truck Traffic Concrete washouts

www.aesgeo.com
Section Placement
Geotextile use Ballast placement Static Roll

www.aesgeo.com

www.aesgeo.com
Construction Joint
Class B
Porous

www.aesgeo.com
Target Parking Lot
Class B
Porous

www.aesgeo.com
Problems!?!