asset tangibility and cash holdings (2015 fma) · asset tangibility and cash holdings ... spectrum...
TRANSCRIPT
Asset Tangibility and Cash Holdings
Current Version: January 15, 2015
Abstract The paper underscores the role of financial development in shaping corporate financing policy through a collateral channel, providing cross-country evidence that asset tangibility significantly affects corporate cash holdings negatively. This paper shows that firms in countries with higher levels of financial development exhibit less sensitivity of cash holdings to asset tangibility, which suggests that the collateral role of tangible assets is substituted by higher-standard financial institutions, proxied by creditor rights protection and information sharing among creditors. The results imply that the development of financial markets and institutions helps lower borrowing costs and mitigate corporate financial constraints and precautionary savings concerns, thereby promoting corporate investments and economic growth. This study confirms the view that risky firms tend to pledge more tangible collateral and the collateral spread declines with improvements in the quality of institutions. The study also shows that asset salability enhances the collateral role of tangible assets.
Asset Tangibility and Cash Holdings
Abstract
The paper underscores the role of financial development in shaping corporate financing policy through a collateral channel, providing cross-country evidence that asset tangibility significantly affects corporate cash holdings negatively. This paper shows that firms in countries with higher levels of financial development exhibit less sensitivity of cash holdings to asset tangibility, which suggests that the collateral role of tangible assets is substituted by higher-standard financial institutions, proxied by creditor rights protection and information sharing among creditors. The results imply that the development of financial markets and institutions helps lower borrowing costs and mitigate corporate financial constraints and precautionary savings concerns, thereby promoting corporate investments and economic growth. This study confirms the view that risky firms tend to pledge more tangible collateral and the collateral spread declines with improvements in the quality of institutions. The study also shows that asset salability enhances the collateral role of tangible assets.
JEL Classifications Numbers: G32, G21, G33, O16 Keywords: Asset Tangibility; Cash Holdings; Financial Development; Asset Redeployability
1
1. Introduction
Considerable attention has been paid to the record-high cash holdings of U.S. firms. For
instance, Bates, Kahle, and Stulz (2009) document that the average cash-to-assets ratio of U.S.
firms more than doubles from 10.5% in 1980 to 23.2% in 2006. The Wall Street Journal
stated in June 2010, “Nonfinancial companies had socked away $1.84 trillion in cash and
other liquid assets as of the end of March, up 26% from a year earlier and the largest-ever
increase in records going back to 1952. Cash made up about 7% of all company assets, the
highest level since 1963.”1 Prior work on determinants of cash holdings suggests that firms
accrue cash for various reasons such as the transaction cost motive, the precautionary motive,
the repatriation tax motive, and the managerial agency cost motive.2
Bates, Kahle, and Stulz (2009) also find that the average cash ratio of high-tech firms is
significantly greater than the average cash ratio of manufacturing firms. This evidence
provides empirical support for the precautionary motives that drive firms, for example, in
computers, electrical equipment, and pharmaceutical sectors, to sit on huge amounts of
unspent corporate cash. One reason is that these firms may be concerned about potential
difficulties in continuously funding their costly on-going R&D projects (Brown and Petersen,
2011) and they often face higher financing and refinancing costs due to the lack of sufficient
tangible assets pledged as collateral for loans.
While asset tangibility is a major factor in determining capital structure,3 much less
attention has been directed to understanding the collateral channel through which asset
1 Justin Lahart, “U.S. Firms Build Up Record Cash Piles,” The Wall Street Journal, June 10, 2010. 2 Studies by Kim, Mauer, and Sherman (1998), and Opler, Pinkowitz, Stulz, and Williamson (1999) show the pecking order and trade-off models of benefits and costs of cash holdings, and report that firm characteristics such as firm size, growth opportunities, and volatility of future cash flows determine the optimal investment in liquidity in the presence of capital market frictions. Almeida, Campello, and Weisbach (2011) present a model of inter-temporal investment decisions with costs of external financing and show that firms hold more cash today if they anticipate tighter financing constraints in the future. Bates, Kahle, and Stulz (2009) conduct an excellent review of the literature on cash holdings. 3 See, e.g., Kiyotaki and Moore (1997), Campello and Giambona (2013), and Rampini and Viswanathan (2013) for the positive link between fixed assets and leverage, and Rajan and Zingales (1995) for some international evidence on the interplay between asset tangibility and capital structure.
2
tangibility affects corporate cash holding policy.4 This paper attempts to fill this gap in the
cash holding literature by exploring in detail the association between asset tangibility and
cash holdings. The argument is that since tangible assets can be used as collateral to alleviate
firms’ financial constraints by reducing borrowing costs, firms with low asset tangibility tend
to hold more cash from a precautionary motive standpoint.
To motivate the argument, I first present time-series evidence from U.S. data as a point
of departure. The reason is that a large body of literature on cash holdings has been devoted
to explaining the evolution of cash holdings for U.S. firms over the past three decades (see,
e.g., Opler, Pinkowitz, Stulz, and Williamson, 1999; Bates, Kahle, and Stulz, 2009). Figure 1
depicts two important stylized facts about the evolution of annual mean cash-to-assets ratio
and asset tangibility along with net tangibility and intangibility index over fiscal years 1950-
2011 from U.S. data.5
[Figure 1 about here]
First, Figure 1 reveals that not only cash holdings have not been increasing dramatically
until late 1970s, but both asset tangibility and net tangibility take on an almost reverse trend
against cash over the whole sample period, a pattern that has not been documented in the cash
holdings literature. To put it into perspective, in contrast to cash holdings, asset tangibility has
been plummeting since the early 1980s, representing merely 29.3% of the total assets in fiscal
year 2011, a 38.2% drop from 47.3% in 1980. A plausible explanation for this trend is that the
4 John (1993) shows that the liquidity ratio, measured as the ratio of cash and marketable securities to total assets, is decreasing in the ratio of inventory plus gross plant and equipment to total assets, a proxy for the liquidity costs of asset restructuring (the collateral value of the assets) suggested by Titman and Wessels (1988). Klasa, Maxwell, and Ortiz-Molina (2009) also consider the tangibility of a firm’s assets, measured as the ratio of net property, plant, and equipment to book assets, as a determinant of its cash holdings. 5 Throughout the paper, I measure the degree of asset tangibility by using the ratio of 0.715*Receivables plus 0.547*Inventories plus 0.535*Fixed Capital to Book Value of Total Assets, which is developed in Berger, Ofek, and Swary (1996). Net tangibility is calculated as 0.715*Receivables plus 0.547*Inventories plus 0.535*Fixed Capital minus total current liabilities (LCT) and plus total debt in current liabilities (DLC), deflated by book assets. Intangibility index is the ratio of research and development (R&D) to capital spending.
3
reduction in asset tangibility lowers the overall collateralizable value of firms’ assets, and
therefore reduces the availability of external debt finance. Consequently, firms, especially
those that are prone to being financially constrained, tend to stockpile large amounts of cash
to reduce potential borrowing costs, consistent with the precautionary motive for cash
holdings.
Second, the figure also illustrates another important fact. Specifically, the growth rate
of asset intangibility index (a flow measure) starts to accelerate around early 1980s, about the
same period when cash holdings start to increase. The mean capital input ratio between
intangible assets and tangible assets has been sharply rising to 3.72 in fiscal year 2011, more
than 10 times from 0.33 in 1980. As firms pour more funds in intangibles, the increasingly
intensified precautionary demand for cash plays a more critical role than before. This stylized
fact resonates with the rapid development and innovation in technology across the entire
spectrum of firms over the past three decades.
Undertaking a standard regression approach similar to the Tables III and V of Bates,
Kahle, and Stulz (2009), I show in unreported tables that 1) asset tangibility affects corporate
cash holdings negatively, which is robust to OLS regressions using variables in levels and
changes, Fama-MacBeth regressions, and specifications with firm fixed effects; and 2) asset
tangibility is the most important determinant of cash holdings in explaining the recent
dramatic increase in cash holdings in the U.S over the 2000s among a host of well-known
determinants such as industry sigma and cash flow documented in the literature.
After showing a negative link between cash and asset tangibility using U.S. data, I
further identify the collateral channel in a cross-country setting. The identification strategy is
motivated by a recent paper by Liberti and Mian (2010) who explore how the level of
financial development in a country affects the collateral cost of capital. Specifically, they
show that institutions such as creditor rights and information sharing that reflect/promote
4
financial development alleviate borrowing constraints by lowering the difference in
collateralization rates between high- and low-risk borrowers. They also document that firms
in better financially developed countries pledge a less amount and a wider range of assets
including firm-specific assets as collateral. Therefore, these findings imply that the
collateralization rates vary inversely with the quality of institutions. It further suggests that
the sensitivity of cash to asset tangibility should be smaller in countries with better
institutions.
Specifically, I exploit the cross-country variation in a country’s characteristics such as
financial development to identify the collateral channel through which asset tangibility affects
cash holdings around the world. To this end, I proceed with a cross-country analysis by
collecting data on a commonly-used proxy for financial development (the value of credits by
financial intermediaries to the private sector, divided by GDP) from Beck and Demirgüç-
Kunt (2009), and data on cash holdings and asset tangibility from Compustat for fiscal years
1993, 1998, 2003, and 2008 across 39 countries.
Panel A of Figure 2 plots the annual average cash-to-assets ratio against private credit
to GDP for fiscal years 1993, 1998, 2003 and 2008. Panel B plots the average asset tangibility
on the horizontal axis. Two facts stand out from Figure 2: (Fact 1) there exist significant
cross-national variations in cash holdings and financial development, as well as a slight
positive association between the two over time in Panel A.6 (Fact 2) the cross-sectional
average of cash holdings are decreasing in asset tangibility across countries and the
relationship has persisted throughout the sample period, as demonstrated in Panel B.
[Figure 2 about here]
6 Studies that positively link financial development (measured by private credit to GDP) and cash holdings in a cross-country setting include Dittmar, Mahrt-Smith, and Servaes (2003) and Kalcheva and Lins (2007). Khurana, Martin, and Pereira (2006) document that the sensitivity of cash holdings to cash flows decreases with financial development.
5
The work of Liberti and Mian (2010) is related to a large body of literature in law and
finance that has documented an important relationship between a country’s legal system and
the development of its financial markets. Prior work in this strand of literature by La Porta,
Lopez-de-Silanes, Shleifer, and Vishny (1997, 1998; henceforth LLSV) shed light on the
critical role of financial development as well as legal and institutional environment in
reducing the costs of collateral evaluation, processing, and liquidation.7 Importantly, LLSV
(1998) explore the role of two financial market mechanisms in economic development. They
conclude that both creditor rights and information sharing help promote capital market
development, which in turn contributes to economic growth.
The first mechanism is creditor’s rights, which refers to the contracting environment
between borrowers and lenders and the protection of creditors’ ability to collect the money
from borrowers defaulting on a debt obligation. A strand of literature on creditor rights
documents that strong creditor protection promotes credit market development (e.g., Djankov,
McLiesh, and Shleifer, 2007; Haselmann, Pistor, and Vig, 2010). In line with this view,
several studies also show that loans under strong creditor protection have lower interest rates,
lower contracting costs of financing, and favorable terms (Qian and Strahan, 2007). Stronger
creditor rights also reduce interest rate spread on loans to borrowers (Bae and Goyal, 2009).
Therefore, lenders (creditors) are willing to extend credit and take risk when they are less
exposed to borrower (debtors) expropriation, resulting in borrowing firms having more
external finance. The collateralization of loans is also lower in financially developed markets.
Moreover, LLSV (1998) construct an index aggregating the rights of secured lenders
based on restriction on reorganization, no automatic stay, no management stay, and secured
debt paid first. They show that countries with stronger legal protection of creditors have
7 In a similar spirit, Rajan and Zingales (1998) find that financial-sector development proxied by private credit to GDP, stock market capitalization, and accounting standards reduces the costs of external finance to firms.
6
deeper credit markets and that creditor rights act as a substitute for collateral in mature
markets.8 For example, restrictions on reorganization such as creditors’ consent or minimum
dividend are imposed when a debtor decides to file for reorganization. This restriction
decreases the likelihood that debtors use bankruptcy as a strategic way of avoiding debt.
Similarly, the “no automatic stay” or asset freeze imposed by the court protects creditor’s
ability to seize collateral after the petition for reorganization is approved. Finally, the “no
management stay” provides powers to an administrator rather than the incumbent
management that is in control of property pending and responsible for running the business
during the reorganization. Therefore, creditor rights weaken the role of tangible assets as
collateral for secured credit in restricting debtors from risk-taking and risk-shifting. I expect
that creditor rights protection should attenuate the cash-tangibility sensitivity.
The second mechanism that LLSV (1998) discuss is public and private information
sharing among lenders about the creditworthiness of loan applicants. Information sharing
attenuates adverse selection and moral hazard and therefore facilitates lending. A stream of
studies on creditor information sharing further shows that information exchange improves
credit availability (Pagano and Jappelli, 1993; Padilla and Pagano, 1997, 2000), lowers the
cost of credit to firms (Brown, Jappelli, and Pagano, 2009), motivates loan repayments
(Brown and Zehnder, 2007), and reduces default rates (Jappelli and Pagano, 2002).
In addition, bank lending literature suggests that collateral may be required simply to
reduce information asymmetry because lenders can obtain additional information about the
borrower by evaluating the quality and nature of the collateral (e.g., Picker, 1992) and assess
the borrower’s repayment prospects. Therefore, collateral-based lending is typically used to
provide credit availability in the opaque information environment of an emerging market
where information sharing and financial transparency are not available or extremely limited.
8 This is consistent with power theories of credit, based on the transfer of control rights upon default (Aghion and Bolton, 1992; Hart and Moore, 1998).
7
However, the improvement in the quality of creditor information through informational
infrastructure such as information sharing eliminates asymmetric information between
lenders and borrowers. Consequently, it directly decreases creditors’ effort and costs of
screening firms and encourages lenders to make use of substitutes for physical collateral to
provide credits. For example, the alternative types of loans may include unsecured loans or
loans secured by reputation collateral or restrictive covenants which limit borrowing firms’
actions prior to default and therefore provide ex ante protection for creditors, as argued by
Miller and Reisel (2012). Therefore, the role of collateral stipulated in the debt contract
becomes less significant in countries with credit information sharing systems through public
credit registries and private credit bureaus. I expect that information sharing should also
attenuate the cash-tangibility sensitivity.
The main results confirm the expectation that both creditor rights and information
sharing independently weaken the impact of asset tangibility on cash holdings after
controlling for the effects of economic development. Specifically, I estimate regressions that
include the interaction effects of asset tangibility with proxies for financial development
while also controlling for the interaction of asset tangibility with the log of gross domestic
product (GDP) per capita, along with country, industry, and time fixed effects. The main
results are robust to alternative measures of financial development, including weighted least
squares regressions where each country receives equal weight in the estimation, and
subsamples excluding the U.S. and Japan.
Having shown that creditor right protection substitutes for collateral, lowers the
importance of tangible assets in reducing a firm’s financial constraint, and hence reduces the
cash-tangibility sensitivity, I turn to further investigate whether the differences in laws and
enforceability of contracts also matter for the effect of creditor right protection on the cash-
tangibility sensitivity. This approach is motivated by Bae and Goyal (2009). I show that both
8
the existence of creditor rights per se and the quality of their legal enforcement are important
to the contracting and bank-lending process. I use four proxies including contract
enforcement speed and cost, legal formalism, and judicial efficiency for law enforcement of
the creditors’ rights to further identify the channel through which creditor rights substitute for
tangible assets as collateral.
The economic intuition is that strong legal protection that better ensures creditors to
repossess collateral impose a credible threat and greater costs upon a borrower in the case of
default. As a result, borrowers would be less willing to take on extra risk.9 Therefore I
anticipate that the expected realized value of collateral would increase with creditor
protection. It then follows that stronger (weaker) legal enforcement of creditors’ rights makes
creditor rights more (less) effective, leading to a more (less) pronounced attenuating effect of
creditor rights on the cash-tangibility sensitivity.
Having shown the attenuating impact of information sharing on the cash-tangibility
sensitivity, I next turn to further explore how the effect of information sharing on cash-
tangibility sensitivity varies with the opacity of a company. To this aim, I split the sample
according to firm characteristics – age, size, and growth opportunities. The estimates suggest
that only young, small, and high-growth firms, which arguably suffer most from financial
market imperfections such as asymmetric information and hence financial constraints, benefit
most from the establishment of information sharing. This result implies that information
sharing reduces the role of tangible assets as collateral and loosens the borrowing constraints
of informationally opaque firms. Hence, it provides additional support for the argument that
creditor information sharing substitutes for collateral in countries with high transparency of
credit markets.
9 Supporting to the view that borrowers are less willing to take risks when creditors are better protected, Acharya, Amihud, and Litov (2011) find international evidence that stronger creditor rights tend to reduce corporate risk taking. The right to repossess collateral gives lenders an essential threat to ensure that borrowers will not use the money borrowed unproductively.
9
The results also complement the findings of Liberti and Mian (2010). Specifically, I
relate the average collateral spread, proxied by the differential cash-tangibility sensitivity
between high- and low-risk borrowers, to improvements in the quality of institutions. I first
show that firms with higher ex ante credit risk or default probability tend to have lower cash-
tangibility sensitivity. This implies that in order to obtain the same dollar worth of secured
loans, high default risk firms have to post more tangible assets as non-cash collateral. These
results are in line with the sorting-by-observed-risk paradigm which claims that observably
risky low quality borrowers are required to pledge collateral while observably safe borrowers
are not required or pledge less (e.g. Berger and Udell, 1990). More importantly, I demonstrate
that the differential cash-tangibility sensitivity between high- and low-risk borrowers declines
with improvements in the quality of institutions. This finding suggests that financial
development closes the wedge in collateralization rates between high- and low-risk
borrowers.
Finally, this paper is also closely related to the asset salability literature (Shleifer and
Vishny, 1992; Berger, Ofek, and Swary, 1996; Stromberg, 2001; Acharya, Bharath, and
Srinivasan, 2007; Benmelech, 2009; Campello and Giambona, 2013). Using three industry-
level measures of asset salability (industry competitiveness, industry asset non-specificity,
and industry liquidity), I first identify the cash-tangibility link through the effect of changes
in the liquidation values of redeployable tangible assets on liquidity management after
controlling for both institutional and economic impact. I show that higher industry-level
salability enlarges the negative impact of asset tangibility on cash holdings. The result is in
accordance with the argument in asset salability literature that the combination of the effects
of physical attributes of an asset and the sheer number and financial strength of its potential
buyers in the secondary market determines liquidation values of assets. I further show that
country-level salability, proxied by log of GDP per Capita, strengthens the industry-level
10
salability effect on the cash-tangibility sensitivity. The argument is that tangible assets are
more salable in countries with more economic activities (i.e., higher GDP per capita).10
Intuitively, an economic boom spurs firms’ investments and leads to high demand for
collateralizable tangible assets in the secondary market. It becomes faster and easier for
economic agents to trade financial instruments in asset markets. This then causes a surge in
the salability of tangible assets. Consequently, the liquidation value of the collateralizable
tangible assets rises. Overall, the results support the findings of Benmelech (2009) and
Campello and Giambona (2013) and complement their work by providing some new cross-
country evidence of the effects of asset tangibility on collateral value for lenders.
This paper contributes to the cash holding literature. I show that asset tangibility
explains the evolution of firms’ cash holdings across countries as a major neglected
determinant of cash holdings. In addition, to the best of my knowledge, this paper is the first
to explore how financial development affects a firm’s cash-tangibility sensitivity. This paper
contributes to the growing literature on the role of institutions in corporate finance by
analyzing their importance in improving firms’ access to external financing and shaping
corporate cash holdings across a large number of countries. Specifically, I argue and provide
evidence that both creditor rights and creditor information sharing substitute the collateral
role of tangible assets and exert attenuating effects on the negative cash-tangibility sensitivity,
but for different reasons. Creditor rights are an effective means for imposing disciplinary
restrictions on a borrowing firm’s action, especially when creditor rights are well enforced by
laws. In contrast, information sharing helps lenders easily gather accurate and timely
information about borrowers while appraising the loans. It assists lenders to provide credit to
financially constrained firms such as small technology firms that previously suffered from
10 Campello and Giambona (2013) show that the relationship between leverage and tangible assets is stronger when federal funds rate is higher, suggesting that redeployability is more important during credit contractions. Because higher FED funds rate is typically associated with economic booms, my arguments are consistent with theirs.
11
information asymmetry. Overall, with better institutions, firms have easy and multiple access
to extensions of credit from the financial system. Therefore, both creditor rights and
information sharing help promote capital market development and effectively allocate
economic resources, which in turn contributes to economic growth. These findings suggest
that the development of financial markets and institutions is a critical part of the growth
process. It is not simply an inconsequential side show that the financial system responds
automatically to demands for financial arrangements created by economic development
(Levine, 1997).
The paper proceeds as follows. Section 2 discusses the related literature and develops
hypotheses. Section 3 briefly describes the cross-country data and econometric framework.
Section 4 reports empirical evidence on the negative link between cash holdings and asset
tangibility and how institutional variables as well as industry- and country-level factors that
determine asset salability identify the link. Section 5 offers conclusions. Appendix contains
detailed definitions and sources of variables used in the study.
2. Hypothesis Development
2.1 Asset Tangibility and Cash Holdings
Economic theory and empirics suggest that collateral is commonly used in loan contracts to
reduce credit risks through decreasing expected default rates and increasing expected
recovery rates. There are two main functions of collateral.
The first is the disciplinary role of collateral. Collateral requirements provide secured
lenders the right to repossess collateral conditional on default. Therefore, collateral can be
used by lenders to restrict borrowers from asset substitution (Jensen and Meckling, 1976).
The second is the informational role of collateral. Lenders can obtain additional
information about the borrower by evaluating the quality and nature of the collateral (Picker,
12
1992) and assess the borrower’s repayment prospects. Moreover, collateral allows lenders to
sort observationally equivalent loan applicants through signaling and help attenuate the
problems of adverse selection and credit rationing (Besanko and Thakor, 1987a, 1987b;
Stiglitz and Weiss, 1981). It also reduces moral hazard by aligning the interests of both
lenders and borrowers (Boot, Thakor, and Udell, 1991; Holmstrom and Tirole, 1997).
Tangible assets can serve as collateral in secured lending. Therefore, asset tangibility
increases the recovery value for lenders in default states and is positively linked to the ease
with which borrowers can obtain external financing. For example, the recent work of
Campello and Giambona (2013) shows that redeployability of tangible assets is a main
determinant of corporate leverage.
Therefore, I hypothesize that when a firm's borrowing capacity from its existing asset
base increases with asset tangibility, the firm tends to have lower precautionary demand for
holding cash. I propose and empirically test the following hypothesis in alternative form:
HYPOTHESIS 1: Firms with higher asset tangibility face lower borrowing costs, and therefore
should hold lower levels of cash holdings from a precautionary standpoint,
ceteris paribus.
2.2 The Effects of Institutional Variables on Cash-Tangibility Sensitivity
Financial development reduces firms’ reliance on tangible assets as collateral in corporate
borrowing and therefore decreases the precautionary motive of cash savings through the
collateral channel. There has been a rich literature focusing on the determinants of financial
development and the potential role played by both financial intermediaries and markets in the
process of economic growth and development (see Levine (2005) for a useful survey).
Arguing for the benefits of financial development, financial sectors improve efficiency
13
in financial resource allocation in the economy (Boyd and Prescott, 1986), facilitate trading
and hedging in stock markets (Holmstrom and Tirole, 1993), lower liquidity risk (Diamond
and Dybvig, 1983), ameliorate information asymmetries, and hence reduce contract
enforcement costs, transactions frictions, and costs of external finance (Rajan and Zingales,
1998).11 Therefore, I anticipate that with deep capital markets, firms can take advantage of
easy and costless access to extensions of credit from the financial system. The collateral role
of tangible assets becomes less significant.
The law and finance literature also suggests that better legal systems foster the
protection of creditors and shareholders legal rights, reduce contracting costs, and improve
information infrastructure, such as public registries or private credit bureaus for sharing credit
information across financial institutions. Better institutions therefore reinforce the liquidity
provision by financial intermediaries.
The strength of creditor rights affects the contracting environment constituting an
essential ingredient of financial development. For example, LLSV (1997) show that countries
with stronger legal protection of creditors have deeper credit markets and that creditor
protection acts as a substitute for collateral in mature markets.
Creditors also provide finance to firms largely because the law protects their rights
(LLSV, 1998). When creditors have more bargaining power (such as being able to take
control of a firm in bankruptcy), they are more willing to grant credit on favorable terms
(such as longer maturities and lower interest rates). Thus, stronger creditor rights should
result in an environment in which firms are relatively less financially constrained because
there would be less credit rationing and lower costs of external finance.
Creditor rights protection also has a number of important influences on lender’s and
11 Financial development, however, does come with costs. Excessive financial liberalization may result in an unduly large expansion of credit to risky firms with unviable projects and limited monitoring of regulatory agencies (Aghion, Bacchetta, and Banerjee (2004)).
14
borrower’s risk incentives. Better creditors’ rights over the collateral stipulated in the debt
contract will make it easier for secured creditors to seize and liquidate assets in the event of
bankruptcy. Therefore the power of secured lenders in bankruptcy is likely to have effects on
over-borrowing, effective use of borrowed funds, the likelihood of bankruptcy including
strategic bankruptcy, and the recovery rates in bankruptcy.
Along these lines, Liberti and Mian (2010) argue that because both the expected
realized value of collateral and the expected costs on a borrower for default or any deviations
from the agreed upon contract increase with creditor protection, lenders can afford to reduce
collateral spread in stronger legal regimes. Moreover, creditor rights protection reduces
borrowers’ credit risks and restricts borrowers from strategic defaults, risk-taking (Acharya,
Amihud, and Litov, 2011) and risk-shifting.
These argument and findings are consistent with the view that creditor rights serve as a
substitute for asset tangibility. In other words, creditors in poor creditor protection countries
require more collateral to ensure smaller potential losses when they make loans.
In financially developed countries where information sharing among creditors is
available, lenders have a good knowledge of borrowers’ characteristics, past behavior, current
debt exposure, and possible subsequent indebtedness. Therefore, credit information sharing is
expected to reduce moral hazard and adverse selection in credit markets which can lead to
credit rationing and underinvestment (Pagano and Jappelli, 1993). Credit information sharing
also increases borrowers’ incentives to repay their debts as a strong disciplining device
because information about defaults becomes available to all lenders (Padilla and Pagano,
2000; Brown and Zehnder, 2007; Hertzberg, Liberti, and Paravisini, 2010), and reduces over-
borrowing and default rates (Jappelli and Pagano, 2002; Brown, Jappelli, and Pagano, 2009;
Bennardo, Pagano, and Piccolo, 2014).
Arguably, creditors in countries with greater information sharing are more likely to

15
exploit soft information obtained from other creditors so as to accept alternative intangible
collateral such as patents, trademarks, and borrower’s reputation and credit scores. Creditor
information sharing enables lenders to switch loan contracts from using collateral based
lending technologies to using other softer lending technologies such as restrictive financial
covenants which specify operating performance, balance sheet ratios, and limits to which the
borrower must adhere and hence provide ex ante protection on creditors prior to default.
Lenders may also underwrite unsecured loans using soft information on risk of
borrower default, credit worthiness, current and future earnings prospects, etc., to opaque
technology companies. Therefore, information sharing also substitutes the role of tangible
assets as collateral in providing useful hard information about borrowers. Hence it reduces
moral hazard and adverse selection as well as raising the discipline on borrowers. The second
hypothesis is:
HYPOTHESIS 2: The negative effect of asset tangibility on cash holdings is attenuated for firms
operating in countries with higher-standard financial institutions, ceteris
paribus; the disciplinary role of tangible assets in loan contracts is
substituted by creditor right protection and the informational role of tangible
assets is replaced by information sharing among creditors through
alternative softer lending instruments.
2.3 The Effects of Changes in Asset Salability on Cash-Tangibility Sensitivity
With liquid capital markets, firms have easy access to extensions of credit from the financial
system and can easily redeploy their tangible assets at low costs. Benmelech (2009) uses the
term “salability” to describe how the combination of the effects of physical attributes of an
asset and the sheer number and financial strength of its potential buyers in the secondary
16
market determine liquidation values. Therefore, tangible assets are more salable in industries
with more financially strong buyers and transferable tangible assets.
In addition, firms tend to supply more tangible assets that are desirable to creditors in
order to get favorable terms (e.g. low interest rates and long maturities on loans) if their
tangible assets are more redeployable. Since asset salability is determined jointly by the
redeployability of tangible assets and the liquidity of market for assets, firms can more easily
redeploy their tangible assets at low costs in countries with more economic activity (i.e.,
higher GDP per capita).
Intuitively, during economic booms, the profitability of capital and demand for funds is
high and firms also tend to invest a lot. The rise of investment and demand for assets by firms
is associated with high asset liquidity. Tangible assets are more salable. Therefore, it implies
that economic development complements for the role of redeployable tangible collateral,
thereby strengthening the cash-tangibility sensitivity. Economic agents are then less
concerned about possible restrictions on future access to capital markets.
Specifically, I investigate the second approach for identifying the cash-tangibility link
through the effect of changes in the liquidation values of redeployable tangible assets on
liquidity management by exploiting the heterogeneity in industry and economic
characteristics across countries. The third hypothesis is:
HYPOTHESIS 3: The negative effect of asset tangibility on cash holdings is larger for firms
operating in markets with higher asset salability, ceteris paribus; the
liquidation value of tangible assets is positively associated with asset
salability.
17
3. Data and Empirical Methods
This section presents the properties of the data and methods I use for empirically identifying
and evaluating the proposed collateral channel through which asset tangibility affects
corporate cash holdings.
3.1. Sample and Variable Construction
I draw firm-level data for U.S. and non-U.S. firms from the Compustat North America and
Compustat Global Fundamentals Annual database for the period 1989-2009. These data
include active and inactive firms that appear on Compustat at any time in the sample period. I
remove the following sets of firms from the sample: 1) financial firms (SIC code 6000-6999)
and utility firms (SIC codes 4900-4999); 2) firms missing the 48 Fama-French industry
dummies constructed by using the firm's four-digit SIC industry code; 3) firms that cross-list
in other markets of the world; 4) firms that do not prepare consolidated financial statements;
5) firms that have less than three years of available data over the study period; 6) firms for
which cash and equivalents, asset tangibility, and/or total assets are missing; and 7) all firm-
year observations with negative cash holdings, total assets and sales revenue, values for cash
less than total assets, and values for the book value of total assets less than $5 million,
inflation-adjusted in 2006 U.S. dollars. Finally, I further exclude countries with less than ten
firms per fiscal year on average. The remaining sample consists of 29,130 unique firms
representing 235,089 firm-year observations from 39 countries.
In this study, the dependent variable is the cash and equivalents divided by the book
value of total assets. The baseline proxy for firm-level asset tangibility is computed using the
liquidation values of firm assets in discontinued operations and asset fire sales contained in
Berger, Ofek, and Swary (1996). Asset tangibility is defined as 0.715*receivables plus
0.547*inventories plus 0.535*fixed capital, deflated by book value of total assets. The proxy
measures the expected liquidation (resale) value of firms’ main categories of operating assets
18
such as fixed assets, accounts receivable, and inventories. Higher asset tangibility implies
higher asset redeployability and liquidity, and hence higher recover/exit value for creditors.
In addition, this measure allows us to examine how changes in fixed assets along with
changes in account receivables (or net of payables) and inventories explain the evolution of
cash holdings across the world.
3.2. Summary Statistics
Table 1 presents country medians of some key variables employed in the analysis. In column
2, I observe that Japan has the second largest total firm-year observations and number of
unique firms behind the U.S., while Columbia has the smallest. There is a wide variation in
the cash ratios as displayed in column 5. The median firm in Israel and Hong Kong has a cash
ratio of 20.4% and 16.0%, respectively, while the median firm in New Zealand, Chile, and
Peru has a value of only 2.7%, 3.2%, and 3.2%, respectively. In contrast, as shown in column
6, the asset tangibility of the median firm in Israel and Hong Kong is merely 33.1% and
33.6%, respectively, whereas the value for the median firm in New Zealand, Chile, and Peru
is 43.8%, 48.0% and 46.4%, respectively. I again observe a negative relation between cash
holdings and asset tangibility in worldwide data.
[Table 1 about here]
I also gather aggregate country-specific data from 39 countries on private credit to GDP
from Beck and Demirgüç-Kunt (2009) and on GDP per capita from the World Bank’s World
Development Indicators (WDI) database. The last two columns of Table 1 report the country
medians for private credit creation and per capita GDP. In particular, the data show
substantial variability in private credit to GDP and country wealth. Consistent with previous
19
literature, I use private credit to GDP, the total amount of credit by deposit money banks and
other financial institutions to the private sector, divided by GDP, as the main measure of
financial development or financial depth in the baseline regression model to identify the
collateral channel, and I save other alternative proxies such as liquid liabilities per GDP and
commercial-central bank for sensitivity tests. The median private credit measured over the
period 1989–2009 ranges from values of 159.6% in Switzerland, 153.9% in the United States,
143.6% in Hong Kong, and 142.0% in Netherlands, to values below 30% in Argentina,
Turkey, Peru, and Mexico. Similarly, because the sample covers both developing and
advanced countries, the median gross national income level per capita varies from well above
$30,000 to as low as about $2,000 per annum, where GDP per capita is converted to 2005
international dollars using purchasing power parity (PPP) rates. This tremendous cross-
country variation in economic development helps us identify the channel through which asset
tangibility affects cash holdings.
3.3. Empirical Strategy
I look for international evidence to support the negative link between cash holdings and asset
tangibility hypothesized in Section 2, and estimate a model of cash holdings by using pooled
least squares regressions. The additional firm-level explanatory variables that I incorporate in
the cross-country analysis are similar to those used by Dittmar, Mahrt-Smith, and Servaes
(2003), and Kalcheva and Lins (2007). Specifically, the following regression model is use to
test the first hypothesis:
, , , , , 1
where i, c, j, and t denote firm, country, industry, and year, respectively; Cash is cash and
20
equivalents deflated by the book value of total assets; Asset Tangibility is defined as
0.715*receivables plus 0.547*inventories plus 0.535*fixed capital deflated by book value of
total assets, following the metric introduced in Berger, Ofek, and Swary (1996). The
estimated coefficient on asset tangibility delivers the prediction about the collateral channel –
the direct effect of asset tangibility on cash holdings through changes in a firm’s collateral
values of tangible assets. The higher the value of the tangible collateral, the less incentives
there are for firms to hold cash. Therefore, I expect the marginal effect of asset tangibility on
cash holdings to be negative and statistically significant ( 0). I also note that asset
tangibility as a stock variable is a better proxy for debt capacity than capital expenditure
which is considered as a very lumpy flow variable. , is a set of firm-level covariates,
which includes Market-to-Book, Firm Size which is measured by the natural logarithm of
book value of total assets in millions of 2006 U.S. dollars, Cash Flow/Total Assets, Total
Capital Expenditures/Total Assets, Total Book Leverage, R&D Expenses/Sales, and Dividend
Dummy Variable. , are distributed independently across firms with zero mean. The baseline
regression also controls for unobservable time-invariant country level heterogeneity ,
industry-specific factors that capture systematic differences in liquidity management
across industries, and year effects of common macroeconomic shocks that might affect
firms’ cash decisions. Standard errors are clustered at both the firm and year levels to obtain
standard-error estimates that are more conservative, as suggested by Petersen (2009) and
Thompson (2011).12 Details on the construction of all variables are provided in the Appendix.
Next, I exploit the heterogeneity in financial and economic development and
12 Following Bates et al. (2009), I use the double-clustered (or Rogers) standard errors suggested by Petersen (2009), Moulton (1986), and Thompson (2011) to account for unobserved time and firm effects. Petersen (2009) finds that standard errors clustered by time are much larger than standard errors clustered by firm, and recommends clustering by time. Clustering by the higher level of aggregation (in my case, by country) is generally preferable (Cameron, Gelbach, and Miller, 2006), but it can give rise to distortions if the number of clusters is small and the cluster size is uneven, as is the case with my sample (Nichols and Shaffer, 2007). Specifically, since the number of observations for each country in my data set is not even, I use standard errors clustered by firm rather than country.
21
contractual environment across countries and over time to identify the channel through which
asset tangibility affects corporate cash holdings. Specifically, I test hypotheses (2) and (3)
using the following regression model,
, , , ,
, , ,
, ,
2
where i, c, j, and t denote firm, country, industry, and year, respectively. Financial
development is measured by private credit to GDP, a popular proxy for the development of
financial intermediaries that captures the demand-side effect for collateralizable tangible
assets from financial systems. Since private credit to GDP might be an outcome of financial
institutions, I use creditor rights and information sharing as proxies for financial development.
I anticipate a positive sign on the interaction of asset tangibility with financial development
( 0). Since a reduction in the potential liquidation costs, which stem from economic
booms, increases the redeployability of tangible assets, I expect a negative sign on the
interaction term between asset tangibility and economic development proxied by GDP per
capita ( 0).
4. Empirical Results on Asset Tangibility and Cash Holdings
In this section, I first provide international evidence on the tangibility-cash link and identify
this collateral channel through cross-country variations in financial and economic
development. Second, I employ alternative country-level measures – the quality of
institutions and the redeployability of tangible assets – to investigate how these measures
influence the cash-tangibility sensitivity. Third, I evaluate how a firm’s default risk affects
collateralization rates and how the quality of institutions affects collateral spread. Fourth, I
22
utilize industry-level measures of asset salability to further identify the collateral channel.
Finally, I conclude with a series of robustness tests.
4.1. The Effect of Financial and Economic Development on Cash-Tangibility Sensitivity
Table 2 presents estimates from cross-country ordinary least squares regression exploring the
distinct effects of financial development and economic development on the cash holding
sensitivities to asset tangibility. Financial development is proxied by Private Credit per GDP.
I use the natural logarithm of country real gross domestic product per capita to measure the
overall status of a country’s economic development and activity.
In Model 1 of Table 2, I begin the assessment of whether the redeployability measure of
asset tangibility alone can explain variations in cash holdings. Only controlling for country,
industry and year fixed effects, I find that the coefficient on asset tangibility is negative and
statistically significant at the 1% level. This result indicates that having a high value of
potential collateralizable tangible assets substantially and significantly decreases corporate
cash holdings.
Model 2 presents estimates of the regression model Eq. (1). The result reveals that the
effect of asset tangibility on cash holdings becomes somewhat smaller after controlling for
covariates. The coefficient on asset tangibility is -0.650 and still significant at the 1% level.13
The size of the effect is nontrivial and I interpret the economic meaning of the estimated
coefficient on asset tangibility as follows. All else equal, a move from the 25th percentile of
the asset tangibility ratio (0.291) to the 75th percentile (0.484) decreases cash holdings by
about 12.6%, which corresponds to a decrease of 47.5% relative to the sample mean effect of
-0.265. In other words, if the firm decreases its tangibility ratio by one-interquartile range
(IQR), it has to hold 47.5% more cash ratio relative to its mean value. Alternatively,
13 The results remain qualitatively unchanged when I use alternative definitions of the cash ratio, including cash to net assets, and log of cash to net assets, and when I replace asset tangibility by net tangibility.

23
interpreting the coefficient at the sample mean, for a $1.00 decrease in tangible assets, ceteris
paribus, I expect to see a 65-cent increase in cash holdings. The negative connection between
tangibility and cash simply reflect the redeployability of tangible assets pledged as
collateral.14
[Table 2 about here]
Model 3 presents estimates of the baseline regression model Eq. (2) in which I combine
the two avenues that influence the sensitivity of cash holdings to asset tangibility. The results
also indicate that first, the coefficient on the interaction of financial development with asset
tangibility is positive and significant at the 5% level, suggesting that the collateral role of
tangible assets on cash holdings is less pronounced in financially developed countries. These
results confirm the second hypothesis and provide support for the benefits of financial
development. It suggests that the ease of raising money may actually lead firms to hold less
cash in financially developed countries. The results are also consistent with findings in
Liberti and Mian (2010) that creditors in countries with better financial development demand
lower collateralization rates, implying that creditors may be able to use alternative
instruments to constraint firms from risk-taking behavior.
Second, I find that the coefficient on the interaction term between asset tangibility and
log of GDP per capita is negative and significant. It suggests that the effect of firms’ supply
of collateralizable tangible assets on cash-tangibility sensitivity is most pronounced in
countries with high economic development where there are more economic activities and
where the markets for assets are presumably more liquid. This confirms the third hypothesis
that tangible assets are more salable in countries with more economic activities and the
increase in salability enlarges the negative effect of asset tangibility on cash holdings.
14 Note that the negative relation between cash and the chosen measure of asset tangibility may not be mechanical, because in the regression I do not simultaneously control for Compustat balance sheet (asset side) items ACO, IVAEQ, IVAO, INTAN and AO (Other Current Assets, Investment and Advances in Equity, Other Investment and Advances, Intangible Assets, and Other Assets, respectively). Moreover, the results are robust to exclusion of total book leverage as firm-specific control variables.
24
The findings also show that, all else equal, a one-IQR decrease in asset tangibility ratio
of 0.193 translates to a 13.0% (=0.193*(0.703) + 0.193*(0.018*1.202) + 0.193*(-
0.135*10.381)) increase in the cash ratios in countries with private credits per GDP and per
capita GDP equal to the sample median. All the controls have the predicted signs and have
significant coefficients.
Model 4 shows that the results are also robust to instrumental variable estimation for
private credit per GDP. Specifically, I use legal origin, creditor rights, and information
sharing as instruments for private credit per GDP. The instrumental variables pass
underidentification, weak identification, and overidentification tests.
4.2. The Effect of Institutional Variables on Cash-Tangibility Sensitivity
There is a growing body of research that investigates laws as well as regulatory and
supervisory practices determining financial development. For example, Djankov, McLiesh,
and Shleifer (2007) find that improvements in creditor protections from both the legal system
and information sharing institutions that affect the ability of borrowers to use collateral are
strongly positively linked to higher ratios of private credit to GDP. It might be the quality of
institutions underlying financial development that shapes the financial system. Therefore, I
conjecture that, at a more primitive level, higher financial development is an outcome of
institutional development.
To this end, I now turn to use two sets of direct cross-country indicators of financial
development to measure the quality of institutions: creditor rights and information sharing.
The creditor rights index, constructed by LLSV (1997), measures the ease with which
creditors secure assets in the event of a default. Information sharing is a time-varying
indicator variable that equals one if either a public registry or a private bureau operates in the
country, zero otherwise.
25
[Table 3 about here]
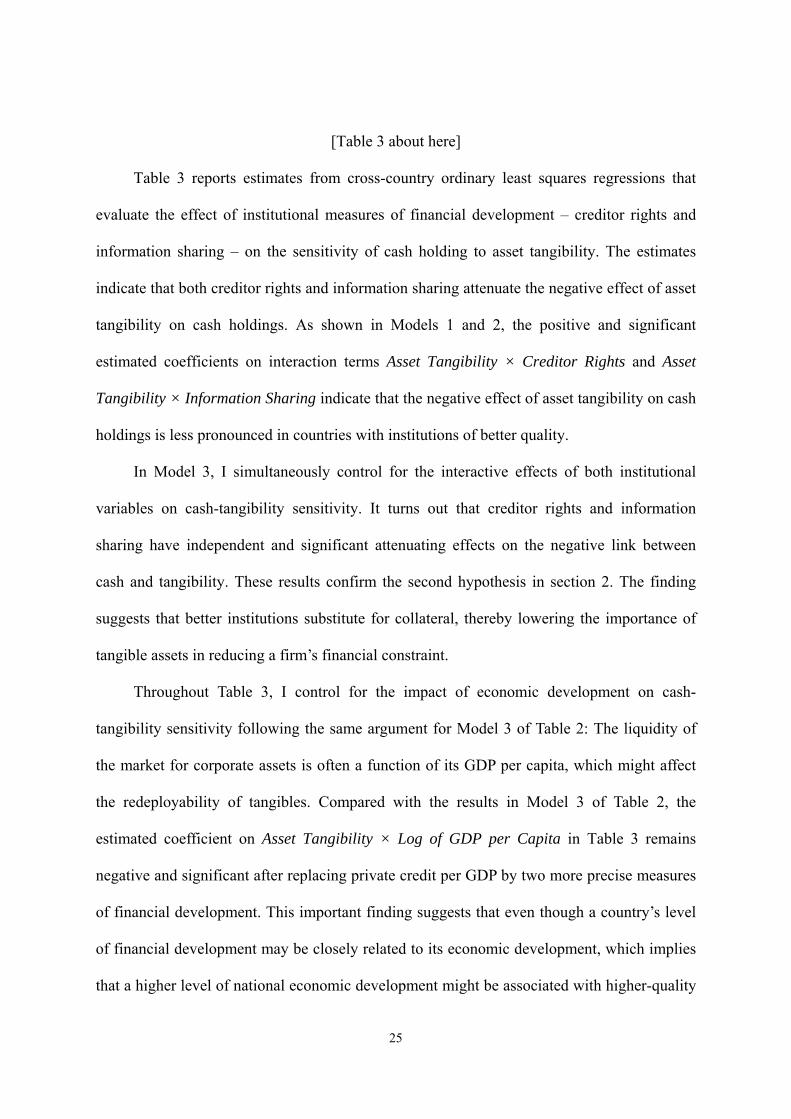
Table 3 reports estimates from cross-country ordinary least squares regressions that
evaluate the effect of institutional measures of financial development – creditor rights and
information sharing – on the sensitivity of cash holding to asset tangibility. The estimates
indicate that both creditor rights and information sharing attenuate the negative effect of asset
tangibility on cash holdings. As shown in Models 1 and 2, the positive and significant
estimated coefficients on interaction terms Asset Tangibility × Creditor Rights and Asset
Tangibility × Information Sharing indicate that the negative effect of asset tangibility on cash
holdings is less pronounced in countries with institutions of better quality.
In Model 3, I simultaneously control for the interactive effects of both institutional
variables on cash-tangibility sensitivity. It turns out that creditor rights and information
sharing have independent and significant attenuating effects on the negative link between
cash and tangibility. These results confirm the second hypothesis in section 2. The finding
suggests that better institutions substitute for collateral, thereby lowering the importance of
tangible assets in reducing a firm’s financial constraint.
Throughout Table 3, I control for the impact of economic development on cash-
tangibility sensitivity following the same argument for Model 3 of Table 2: The liquidity of
the market for corporate assets is often a function of its GDP per capita, which might affect
the redeployability of tangibles. Compared with the results in Model 3 of Table 2, the
estimated coefficient on Asset Tangibility × Log of GDP per Capita in Table 3 remains
negative and significant after replacing private credit per GDP by two more precise measures
of financial development. This important finding suggests that even though a country’s level
of financial development may be closely related to its economic development, which implies
that a higher level of national economic development might be associated with higher-quality

26
institutions that facilitate private contracting (e.g. Claessens and Laeven, 2003), financial
development and economic development are somewhat different and exert opposite impacts
on the cash-tangibility sensitivity.
4.3. Creditor Rights and the Legal Enforcement of Creditors’ Rights
Given the important role of creditor rights in the cash-tangibility sensitivity, I further identify
the effect of creditor rights on the cash-tangibility sensitivity. Specifically, I assess whether
cross-country differences in the efficiency of contract enforcement also matter.
The rationale is that strong legal protection that better ensures creditors to repossess
collateral imposes a credible threat and greater costs upon a borrower in the case of default.
As a result, borrowers would be less willing to take on extra risk and use borrowed funds
unproductively. Therefore I anticipate that the expected realized value of collateral would
increase with creditor rights protection. It then follows that better legal enforcement of
creditors’ rights makes them more effective, leading to a more pronounced attenuating effect
of creditor rights on the cash-tangibility sensitivity.
Therefore, what really matters for the incentives for loan activities and viability of
private credit is the effective power of creditors through legal enforcement. For example,
lenders in developing countries will be reluctant to accept collateral unless the legal
environment clearly defines and effectively enforces creditor rights. As a result, the value of
collateral demanded for every dollar lent out (the collateralization rate) is significantly higher
in developing countries. On the other hand, lenders in developed countries presumably enjoy
a better legal environment and demand less collateral. It explains the observation that the
incidence and degree of collateral are higher in emerging markets than in mature markets. For
example, Bae and Goyal (2009) find that the differences in laws and enforceability of
contracts matter for bank loan size and maturity and loan spreads, whereas creditor rights
27
matter only for loan spreads.
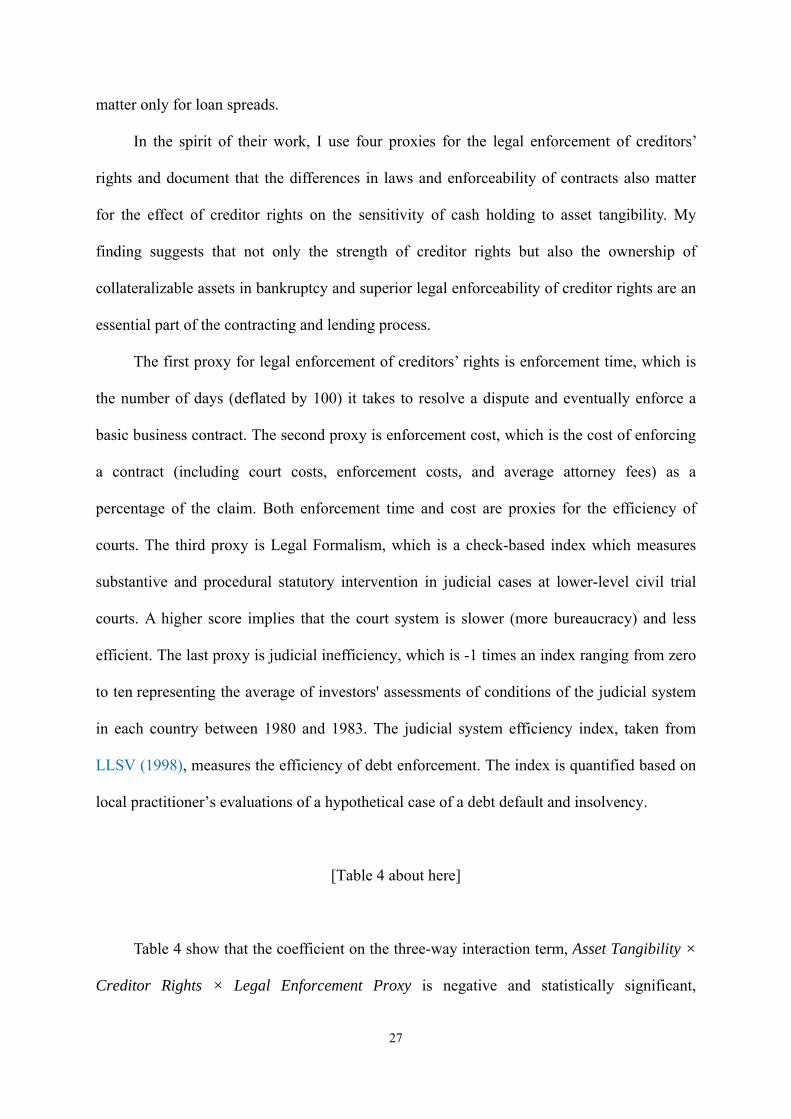
In the spirit of their work, I use four proxies for the legal enforcement of creditors’
rights and document that the differences in laws and enforceability of contracts also matter
for the effect of creditor rights on the sensitivity of cash holding to asset tangibility. My
finding suggests that not only the strength of creditor rights but also the ownership of
collateralizable assets in bankruptcy and superior legal enforceability of creditor rights are an
essential part of the contracting and lending process.
The first proxy for legal enforcement of creditors’ rights is enforcement time, which is
the number of days (deflated by 100) it takes to resolve a dispute and eventually enforce a
basic business contract. The second proxy is enforcement cost, which is the cost of enforcing
a contract (including court costs, enforcement costs, and average attorney fees) as a
percentage of the claim. Both enforcement time and cost are proxies for the efficiency of
courts. The third proxy is Legal Formalism, which is a check-based index which measures
substantive and procedural statutory intervention in judicial cases at lower-level civil trial
courts. A higher score implies that the court system is slower (more bureaucracy) and less
efficient. The last proxy is judicial inefficiency, which is -1 times an index ranging from zero
to ten representing the average of investors' assessments of conditions of the judicial system
in each country between 1980 and 1983. The judicial system efficiency index, taken from
LLSV (1998), measures the efficiency of debt enforcement. The index is quantified based on
local practitioner’s evaluations of a hypothetical case of a debt default and insolvency.
[Table 4 about here]
Table 4 show that the coefficient on the three-way interaction term, Asset Tangibility ×
Creditor Rights × Legal Enforcement Proxy is negative and statistically significant,
28
suggesting that the attenuating effect of creditor rights on cash-tangibility sensitivity is
weaker when a country has a weaker law and order system. This implies that higher
enforcement speed, lower enforcement costs, and more efficient judicial system would make
creditor rights a more effective substitute for tangible assets as collateral.
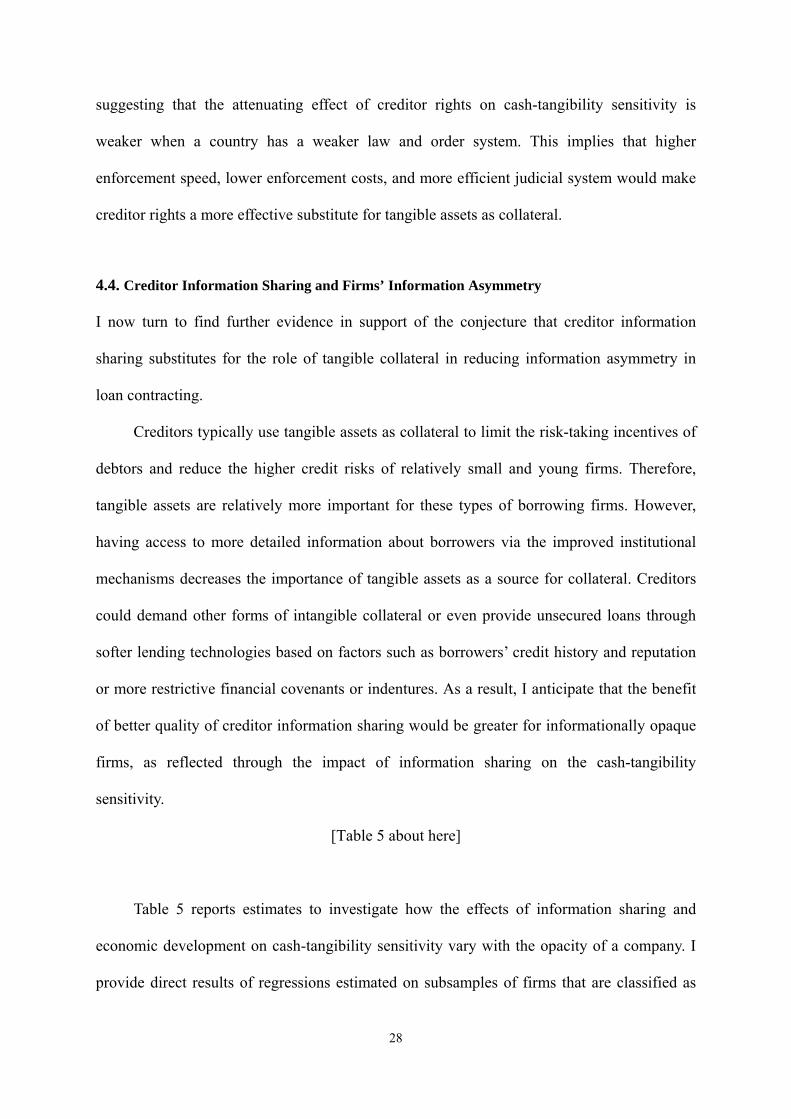
4.4. Creditor Information Sharing and Firms’ Information Asymmetry
I now turn to find further evidence in support of the conjecture that creditor information
sharing substitutes for the role of tangible collateral in reducing information asymmetry in
loan contracting.
Creditors typically use tangible assets as collateral to limit the risk-taking incentives of
debtors and reduce the higher credit risks of relatively small and young firms. Therefore,
tangible assets are relatively more important for these types of borrowing firms. However,
having access to more detailed information about borrowers via the improved institutional
mechanisms decreases the importance of tangible assets as a source for collateral. Creditors
could demand other forms of intangible collateral or even provide unsecured loans through
softer lending technologies based on factors such as borrowers’ credit history and reputation
or more restrictive financial covenants or indentures. As a result, I anticipate that the benefit
of better quality of creditor information sharing would be greater for informationally opaque
firms, as reflected through the impact of information sharing on the cash-tangibility
sensitivity.
[Table 5 about here]
Table 5 reports estimates to investigate how the effects of information sharing and
economic development on cash-tangibility sensitivity vary with the opacity of a company. I
provide direct results of regressions estimated on subsamples of firms that are classified as

29
having low or high information asymmetry by firm age, size, and firm’s growth opportunities.
Young, small, and high-growth firms usually exhibit a high degree of information
asymmetry, classified as such according to the sample median. I find positive and significant
coefficient estimates on Asset Tangibility × Information Sharing only for opaque firms. The
estimates suggest that only young, small and high-growth firms, suffering most from
financial market imperfections such as asymmetric information and hence financial
constraints, benefit from the establishment of information sharing. The result also implies that
a better quality of institutions is beneficial for opaque and distressed borrowing firms when
they have a limited amount of quality collateral. Moreover, firms that are opaque and costly
to screen gain greater access to credit through alternative lending instruments after the
introduction of a credit registry or bureau.
Table 5 also indicates that the estimated coefficient on Asset Tangibility × Log of GDP
per Capita is persistently negative and significant across various sample splits. The effect of
the level of economic development on cash-tangibility sensitivity for opaque firms is both
statistically and economically greater than that of transparent and usually unconstrained
firms. This result suggests that all types of firms take advantages of economic booms because
a booming economy enhances the redeployability of tangible assets through the collateral
channel. The rise in asset salability helps firms bolster their borrowing capacity, while opaque
and credit constrained firms benefit more from it.
4.5. Firm Default Risk, Collateral Spread, and the Role of the Quality of Institutions
In this subsection, I complement some of the findings of Liberti and Mian (2010). Liberti and
Mian (2010) show that 1) as the predicted default or expected firm risk increases, the
collateralization rate rises as well. This implies a positive collateral spread in equilibrium
which is defined as the difference in collateralization rates between high- and low-risk
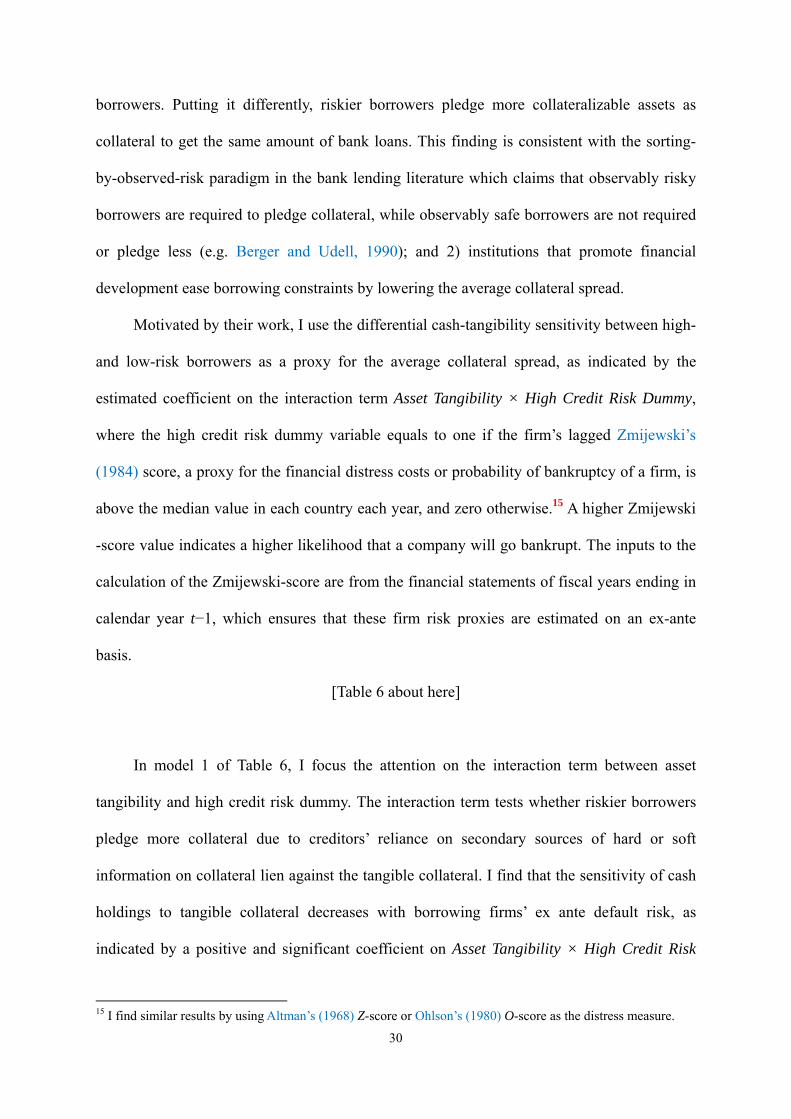
30
borrowers. Putting it differently, riskier borrowers pledge more collateralizable assets as
collateral to get the same amount of bank loans. This finding is consistent with the sorting-
by-observed-risk paradigm in the bank lending literature which claims that observably risky
borrowers are required to pledge collateral, while observably safe borrowers are not required
or pledge less (e.g. Berger and Udell, 1990); and 2) institutions that promote financial
development ease borrowing constraints by lowering the average collateral spread.
Motivated by their work, I use the differential cash-tangibility sensitivity between high-
and low-risk borrowers as a proxy for the average collateral spread, as indicated by the
estimated coefficient on the interaction term Asset Tangibility × High Credit Risk Dummy,
where the high credit risk dummy variable equals to one if the firm’s lagged Zmijewski’s
(1984) score, a proxy for the financial distress costs or probability of bankruptcy of a firm, is
above the median value in each country each year, and zero otherwise.15 A higher Zmijewski
-score value indicates a higher likelihood that a company will go bankrupt. The inputs to the
calculation of the Zmijewski-score are from the financial statements of fiscal years ending in
calendar year t−1, which ensures that these firm risk proxies are estimated on an ex-ante
basis.
[Table 6 about here]
In model 1 of Table 6, I focus the attention on the interaction term between asset
tangibility and high credit risk dummy. The interaction term tests whether riskier borrowers
pledge more collateral due to creditors’ reliance on secondary sources of hard or soft
information on collateral lien against the tangible collateral. I find that the sensitivity of cash
holdings to tangible collateral decreases with borrowing firms’ ex ante default risk, as
indicated by a positive and significant coefficient on Asset Tangibility × High Credit Risk
15 I find similar results by using Altman’s (1968) Z-score or Ohlson’s (1980) O-score as the distress measure.
31
Dummy. It implies that there exists a positive relationship between the amount of tangible
collateral pledged and borrower risk. This result is in accordance with the sorting-by-
observed-risk paradigm. Creditors usually demand higher collateral primarily to reduce the
higher credit risks of riskier firms because firms with greater default risk are more likely to
engage in risk-shifting for instance. Therefore, according to this view, tangible assets are less
effective in reducing financing constraints for high counterparty default risk firms.
Furthermore, the size of the coefficient on Asset Tangibility × High Credit Risk Dummy is
also economically significant. All else equal, riskier firms typically hold 4.54%
(=0.193*0.235) more in cash than relatively safer counterparts in response to a one-IQR
decrease in tangibility ratio of 0.193. It is consistent with the view of Liberti and Mian (2010)
that risker firms face higher collateralization rates.
More importantly, in Models 2 through 4, I explore whether the observed collateral
spread (the differential cash-tangibility sensitivity) between high- and low-risk borrowers
declines with financial development (Private credit per GDP) and improvements in the
quality of institutions (creditor rights and information sharing), respectively. As expected, I
find a negative and significant estimated coefficient on the three-way interaction in each
model. This provides additional cross-country evidence that financial development and
institutions close the wedge in collateralization rates between high- and low-risk borrowers.
4.6. Industry Redeployability of Tangible Assets and Economic Development
In this subsection, I employ variations in industry-level and/or country- measures for the
liquidity of the market for corporate assets to identify the collateral channel through which
asset tangibility influences cash holdings.
32
4.6.1. Industry-Level Measures
I use three types of industry-level measures of asset salability.16 The first type is measured by
-1 times the industry concentration which is defined as the natural logarithm of asset-based
Herfindahl index. I deploy it to gauge the effect of market concentration on asset
redeployability. The reason is that firms in high-competition industries (low concentration
ratio) can possibly fetch a greater value when their assets are redeployed. That is, the
liquidation value of a firm’s assets decreases as the market becomes more concentrated,
partly due to fewer potential buyers of second-hand capital. This is consistent with the view
of Shleifer and Vishny (1992). Therefore, I expect that industry competition reinforces the
collateral role of tangibility in firms’ cash policies.
Second, I use -1 times the industry median ratio of the book value of machinery and
equipment relative to book value of total assets to measure asset redeployability, following
the literature (See, e.g., Berger, Ofek, and Swary, 1996; Stromberg, 2001; Acharya, Bharath,
and Srinivasan, 2007). Machinery and equipment, unlike buildings and land, are firm-specific
assets and not readily redeployable outside of the industry. They are likely to experience
lower liquidation values because they may suffer from ‘‘fire-sale” discounts in auctions for
asset sales, particularly when other firms in the industry are also in distress.
The last proxy for salability is calculated as -1 times the inverse of median Quick ratio,
which is the difference between current assets and inventories deflated by current liabilities,
following Acharya, Bharath, and Srinivasan (2007). Shleifer and Vishny (1992) also point out
that liquidation values decrease when potential buyers are likely to be financially constrained.
That is, the liquidity of redeployable assets drops when the potential buyers do not have
16 Some countries in the sample have a limited number of firm-year observations that makes it difficult to calculate accurate industry-level variables for each country in each year. Therefore, I follow the argument of Rajan and Zingales (1998) that for technological and economic reasons there exist some industry-specific characteristics and cross-industry differences that persist across countries. Specifically, I first calculate the industry-level variable for each Fama-French industry classified by the two-digit SIC code for the U.S. in each fiscal year, and then I extrapolate the median value to firms in other countries.
33
financial resources to afford paying for its services.
[Table 7 about here]
After controlling for the effects of financial institutions and economic development,
Models 1 through 3 indicate that cash-tangibility sensitivity becomes larger when firms
operate in industries with high asset salability, as indicated by the negative and significant
interaction terms of Asset Tangibility × Industry Asset Salability Proxy.
4.6.2. Country-Level Measures
I have shown that industry-level salability enlarges the negative impact of asset tangibility on
cash holdings. In Models 4 through 6, I continue to test whether variations in the level of
economic development exert differential impacts on this industry-level effect.
I show that a high level of GDP per capita (such as economic booms) facilitates the
liquidity of tangible assets and enlarges the strengthening impact of industry-level asset
salability on the negative cash-tangibility sensitivity after controlling for the effect of
financial institutions. Put differently, the greater the country-level asset salability of tangible
assets, the greater the impact of industry-level asset salability on the sensitivity of cash to
tangible assets. The results therefore complement the findings of Benmelech (2009) and
Campello and Giambona (2013) by supplying new international evidence on liquidation
values of pledged tangible assets for lenders. Therefore, this provides new insights on
corporate liquidity management and capital structure through the supply-side of redeployable
assets.
4.7. Robustness
In this subsection, I investigate the robustness of the key inference results presented thus far. I
show that the results stand up to alternative measures of financial development, the
34
decomposition of creditor right index, alternative measure of creditor information, the
weighted least squares (WLS) estimation method, and subsamples.
[Table 8 about here]
Table 8 contains robustness test results. In Models 1 through 3, following the financial
development and economic growth literature, I consider liquid liabilities per GDP,
commercial-central bank, and stock market development as alternative indicators of a
country’s level of financial development. The data are constructed by Beck and Demirgüç-
Kunt (2009) who obtain the raw data from the IMF's International Financial Statistics (IFS).
Liquid liabilities of the financial system are measured by currency plus demand and interest-
bearing liabilities of banks and non-bank financial intermediaries, divided by GDP. It is a
proxy for the overall size of the formal financial intermediary sector. Commercial-central
bank equals the ratio of deposit money banks’ claims on domestic nonfinancial real sector to
the sum of deposit money bank and central bank claims on domestic nonfinancial real sector.
It measures the extent to which commercial banks versus the central bank in mobilizing
savings and allocating credit. I use it to measure the financial intermediary development
because commercial banks are more likely to identify profitable investments, monitor
managers, facilitate risk management, and allocate society’s savings than central banks
(Levine, Loayza, and Beck, 2000). Stock market development is the ratio of market
capitalization over the gross domestic product (GDP). Models 1 through 3 provide
qualitatively similar results compared to what I document earlier in Model 3 of Table 2.
In Model 4, I decompose the creditor rights index into four components: Restrictions on
Reorganization (cr1), No Automatic Stay (cr2), Secured Creditor Paid First (cr3), and No
Management Stay (cr4). The negative and significant estimate on the interaction term Asset
35
Tangibility × Secured Creditor Paid First (cr3) is consistent with the view that the liquidation
value of tangible collateral increases when secured creditors are ranked first in the
distribution of proceeds of liquidating a bankrupt firm as opposed to other creditors such as
employees or government. The results for cr1, cr2 and cr4 are qualitatively similar to the
result for creditor rights (cr) in Model 3 of Table 3.
Next, I also re-estimate the baseline specification (Model 3, in Table 3) with accounting
standards serving as an alternative measure of the quality of creditor information. Model 5
contains the estimation results. The accounting standards index is created by examining and
rating companies’ 1995 annual reports on their inclusion or omission of 90 items. These items
fall into seven categories: general information, income statements, balance sheets, funds flow
statement, accounting standards, stock data, and special items. A minimum of three
companies in each country were studied. This index captures the comprehensiveness and
quality of a company’s information available to outside investors and should therefore reduce
the external financing costs associated with information availability. This measure is also
related to the characteristics of the contracting environment in which firms develop. The data
come from Center for Financial Analysis and Research (CIFAR).
Consistent with my earlier findings, the estimated coefficient on the interactive term of
asset tangibility multiplied by accounting standards is positive and significant. The finding
indicates that lenders may demand less tangible collateral used to align borrowers’ incentives.
Instead, lenders may adopt softer alternative instruments when they have access to broad and
accurate knowledge about borrowers’ financial operating and investment conditions. This
finding further highlights that the availability, transparency and credibility of accounting rules
on firms is likely to significantly reduce information asymmetry between lenders and
borrowers about the prospects of future cash flows and risk of default, thereby promoting
non-collateral based lending.
36
Model 6 shows that the baseline model is robust to weighted least squares regressions
where each country receives equal weight in the estimation. As the final set of robustness
tests, I inspect whether the findings persist across sub-samples. In Model 7, I remove all firms
operating in the United States and Japan. Estimates in Model 7 indicate that the baseline
results of the paper are not driven by the relative preponderance of observations from the
U.S. and Japan.
5. Conclusion
Despite that the significant economic effects of asset tangibility on corporate leverage as well
as the important role of collateral in financial contracting have attracted considerable research
attention from economists in the past, their effects on corporate cash holdings have long been
neglected in the growing literature on the determinants of cash holdings. This paper bridges
this gap by examining the empirical relationship between tangibility and cash holdings and
using data on 39 countries over the 1989-2009 period.
To motivate the study, I first find U.S. evidence that asset tangibility not only
negatively affects cash holdings but also serves as the most substantial determinant
explaining the well-documented pattern in cash holdings over the past 50 years. The
economic intuition is that firms with a high degree of tangible assets have more collateral
with which to guarantee easy and cheap access to credit markets. Therefore, tangible assets
boost a firm’s borrowing capacity, which then lowers the firm’s precautionary demand for
holding cash. Following this reasoning, I introduce the collateral channel through which
tangibility influences cash holdings.
I then conjecture that the cash-tangibility link could be influenced by cross-country
variations in financial and economic development. In one respect, the findings are consistent
with Liberti and Mian (2010). The degree of financial development reflects the level of
37
underlying finance-related legal or institutional development. Better institutions make
creditors less reliant on collateral-based lending. This then attenuates the cash-tangibility
sensitivity. This paper suggests that financial development facilitates economic growth
through the ability of financial intermediaries to allocate financial resources more efficiently
to financially constrained firms that otherwise may not have access to these external sources
of funds to make investments and expand. This paper therefore sheds new light on the
implications of institutional variables on corporate liquidity management. The findings also
offer key explanations on why some proportion of commercial and industrial loans are not
made on a secured basis and why the collateralization rates vary inversely with the quality of
institutions.
In another respect, the results are consistent with Campello and Giambona (2013). The
redeployability of tangible collateral represented by the coefficient on asset tangibility hinges
on how liquid the secondary market for assets is. The asset salability, a joint effect of asset
redeployability and asset liquidity, increases with the level of overall economic activities and
with the number and financial health of potential buyers of the redeployed assets within the
same industry. Therefore, higher asset salability increases the liquidation values of an asset,
reduces the amount of credit market rationing and the cost of borrowing, and strengthens the
cash-tangibility sensitivity.
Future work is warranted to study issues such as the real effect of asset tangibility or its
flipside (e.g. investments in intangibles) on the market value of cash holdings and important
consequences for capital-structure choices of firms.
38
References Acemoglu, Daron, and Simon Johnson, 2005, Unbundling institutions, Journal of Political
Economy 113, 949–995. Acharya, Viral A., Heitor Almeida, and Murillo Campello, 2007, Is cash negative debt? A
hedging perspective on corporate financial policies, Journal of Financial Intermediation 16, 515–554.
Acharya, Viral A., Sreedhar T. Bharath, and Anand Srinivasan, 2007, Does industry-wide
distress affect defaulted firms? Evidence from creditor recoveries, Journal of Financial Economics 85, 787–821.
Acharya, Viral V., Yakov Amihud, and Lubomir Litov, 2011, Creditor rights and corporate
risk-taking, Journal of Financial Economics 102, 150–166. Aghion, Philippe, and Patrick Bolton, 1992, An incomplete contracts approach to financial
contracting, Review of Economic Studies 59, 473–494. Aghion, Philippe, Philippe Bacchetta, and Abhijit Banerjee, 2004, Financial development and
the instability of open economies, Journal of Monetary Economics 51, 1077–1106. Almeida, Heitor, and Murillo Campello, 2007, Financial constraints, asset tangibility, and
corporate investment, Review of Financial Studies 20, 1429–1460. Almeida, Heitor, Murillo Campello, and Michael S. Weisbach, 2004, The cash flow
sensitivity of cash, Journal of Finance 59, 1777–1804. Almeida, Heitor, Murillo Campello, and Michael S. Weisbach, 2011, Corporate financial and
investment policies when future financing is not frictionless, Journal of Corporate Finance 17, 675–693.
Altman, Edward I., 1968, Financial ratios, discriminant analysis and the prediction of
corporate bankruptcy, Journal of Finance 23, 589–609. Anderson, Ronald W., and Andrew Carverhill, 2011, Liquidity and Capital Structure, Review
of Financial Studies, doi: 10.1093/rfs/hhr103. Bae, Kee-Hong, Goyal, Vidhan K., 2009, Creditor rights, enforcement, and bank loans,
Journal of Finance 64, 823–860. Barth, James R., Gerard Caprio, and Ross Levine, 2004, Bank regulation and
supervision: What works best?, Journal of Financial Intermediation 13, 205–48. Bates, Thomas W., Kathleen M. Kahle, and René M. Stulz, 2009, Why do US firms hold so
much more cash than they used to? Journal of Finance 64, 1985–2021.
39
Beck, Thorsten, and Asli Demirgüç-Kunt, 2009, Financial institutions and markets across countries and over time: Data and analysis, World Bank Policy Research Working Paper No. 4943. (updated November 2010).
Beck, Thorsten, Asli Demirgüç-Kunt and Ross Levine, 2003, Law, endowments, and finance,
Journal of Financial Economics 70, 137–181. Beck, Thorsten, and Ross Levine, 2004, Legal institutions and financial development, In:
Claude, Menard, Shirley, M. (Eds.), Handbook of New Institutional Economics, Kluwer Dordrecht, The Netherlands.
Benmelech, Efraim, 2009, Asset salability and debt maturity: evidence from nineteenth-
century American railroads, Review of Financial Studies 22, 1545–1584. Berger, Allen N., and Gregory F. Udell, 1990, Collateral, loan quality and bank risk, Journal
of Monetary Economics 25, 21–42. Berger, Philip G., Eli Ofek, and Itzhak Swary, 1996, Investor valuation and abandonment
option, Journal of Financial Economics 42, 257–287. Boyd, John H., and Edward C. Prescott, 1986, Financial intermediary-coalitions, Journal of
Economics Theory 38, 211–232. Braun, Matías, and Borja Larraín, 2005, Finance and the business cycle: International, inter-
industry evidence, Journal of Finance 60, 1097–1128. Brown, James R., and Bruce C. Petersen, 2011, Cash holdings and R&D smoothing, Journal
of Corporate Finance 17, 694–709. Brown, James R., Steven M. Fazzari, and Bruce C. Petersen, 2009, Financing innovation and
growth: cash flow, external equity and the 1990s R&D boom, Journal of Finance 64, 151–185.
Brown, Martin, Tullio Jappelli, and Marco Pagano, 2009, Information sharing and credit:
Firm level evidence from transition countries, Journal of Financial Intermediation 18, 151–172.
Brown, Martin, and Christian Zehnder, 2007, Credit reporting, relationship banking, and loan
repayment, Journal of Money, Credit and Banking 39, 1884–1918. Bushman, Robert M., Joseph D. Piotroski, and Abbie J. Smith, 2004, What determines
corporate transparency?, Journal of Accounting Research 42, 207–252. Cameron, Colin A., Jonas B. Gelbach, and Douglas L. Miller, 2006, Robust inference with
multi-way clustering, NBER Technical Working Paper 327. Campello, Murillo, 2006, Debt financing: Does it hurt or boost firm performance in the
product markets?, Journal of Financial Economics 82, 135–172. Campello, Murillo, John R. Graham, and Campbell R. Harvey, 2010, The real effects of
40
financial constraints: Evidence from a financial crisis, Journal of Financial Economics 97, 470–487.
Campello, Murillo, and Erasmo Giambona, 2013, Real assets and capital structure, Journal of
Financial and Quantitative Analysis 48, 1333–1370. Campello, Murillo, Erasmo Giambona, John R. Graham, and Campbell R. Harvey, 2011,
Liquidity management and corporate investment during a financial crisis, Review of Financial Studies 24, 1944–1979.
Campello, Murillo, Erasmo Giambona, John R. Graham, and Campbell R. Harvey, 2012,
Access to liquidity and corporate investment in Europe during the financial crisis, Review of Finance 16, 323–346.
Caprio, Gerard, Luc Laeven, and Ross Levine, 2007, Governance and bank valuation,
Journal of Financial Intermediation 16, 584–617. Claessens, Stijn, and Luc Laeven, 2003, Financial Development, Property Rights, and
Growth, Journal of Finance 58, 2401–2436 Diamond, Douglas W., and Philip H. Dybvig, 1983, Bank runs, deposit insurance, and
liquidity, Journal of Political Economy 91, 401–419. Diamond, Douglas W., and Raghuram G. Rajan, 2001, Liquidity risk, liquidity creation, and
financial fragility: A theory of banking, Journal of Political Economy 109, 289–327. Dittmar, Amy, and Jan Mahrt-Smith, 2007, Corporate governance and the value of cash
holdings, Journal of Financial Economics 83, 599–634. Dittmar, Amy, Jan Mahrt-Smith, and Henri Servaes, 2003, International corporate
governance and corporate cash holdings, Journal of Financial and Quantitative Analysis 38, 111–133.
Djankov, Simeon, Caralee McLiesh, and Andrei Shleifer, 2007, Private credit in 129
countries, Journal of Financial Economics 84, 299–329. Guiso, Luigi, and Giuseppe Parigi, 1999, Investment and Demand Uncertainty, Quarterly Journal of Economics 114, 185–227. Han, Seungjin, and Jiaping Qiu, 2007, Corporate precautionary cash holdings, Journal of
Corporate Finance 13, 43–57. Hart, Oliver D., 1995, Firms, contracts, and financial structure, Oxford Univ. Press, Oxford. Hodrick, Robert, and Edward C. Prescott, 1997, Postwar U.S. business cycles: An empirical
investigation, Journal of Money, Credit, and Banking 29, 1–16. Holmstrom, Bengt, and Jean Tirole, 1993, Market liquidity and performance monitoring,
Journal of Political Economy 101, 678–709.
41
Jappelli, Tullio, and Marco Pagano, 2002, Information sharing, lending and defaults: Cross-country evidence, Journal of Banking and Finance 26, 2017–2045.
John, Teresa A., 1993, Accounting measures of corporate liquidity, leverage, and costs of
financial distress, Financial Management 22, 91–100. Johnson, Simon, John McMillan, and Christopher Woodruff, 2002, Property rights and
finance, American Economic Review 92, 1335–1356. Kalcheva, Ivalina, and Karl V. Lins, 2007, International evidence on cash holdings and
expected managerial agency problems, Review of Financial Studies 20, 1087–1112. Keynes, John Maynard, 1936, The general theory of employment, interest and money,
Macmillan, London. Khurana, Inder K., Martin, Xiumin, and Pereira, Raynolde, 2006, Financial development and
the cash flow sensitivity of cash, Journal of Financial and Quantitative Analysis 41, 787–807.
Kim, Chang-Soo, David C. Mauer, and Ann E. Sherman, 1998, The determinants of
corporate liquidity: Theory and evidence, Journal of Financial and Quantitative Analysis 33, 305–334.
King, Robert G., and Ross Levine, 1993a, Finance and growth: Schumpeter might be right,
Quarterly Journal of Economics, 108, 717–738. King, Robert G., and Ross Levine, 1993b, Finance, entrepreneurship, and growth: Theory
and evidence, Journal of Monetary Economics 32, 513–542. Kiyotaki, Nobuhiro, and John Moore, 1997, Credit cycles, Journal of Political Economy 105,
211–248. Klasa, Sandy, Maxwell, F. Maxwell, Ortiz-Molina, Hernán, 2009, The strategic use of
corporate cash holdings in collective bargaining with labor unions, Journal of Financial Economics 92, 421–442.
La Porta, Rafael, Florencio Lopez-de-Silanes, and Andrei Shleifer, 2006, What works in
securities laws?, Journal of Finance 61, 1–32. La Porta, Rafael, Florencio Lopez-de-Silanes, Andrei Shleifer, and Robert W. Vishny, 1997,
Legal determinants of external finance, Journal of Finance 52, 1131–1150. La Porta, Rafael, Florencio Lopez-de-Silanes, Andrei Shleifer, and Robert W. Vishny, 1998,
Law and finance, Journal of Political Economy 106, 1113–1155. Lerner, Josh, and Antoinette Schoar, 2005, Does legal enforcement affect financial
transactions? The contractual channel in private equity, Quarterly Journal of Economics 120, 223–46.
Levine, Ross, 2005, Finance and growth: Theory and evidence, in Philippe Aghion and
42
Steven Durlauf, eds. Handbook of Economic Growth (Elsevier Science, The Netherlands).
Levine, Ross, Norman Loayza, and Thorsten Beck, 2000, Financial intermediation and
growth: causality and causes, Journal of Monetary Economics 46, 31–77. Liberti, José M., and Atif R. Mian, 2010, Collateral spread and financial development,
Journal of Finance 65, 147–177. McLean, R. David, 2009, Share issuance and cash savings, Journal of Financial Economics
99, 693–715. Miller, Merton H., and Daniel Orr, 1966, A model of the demand for money by firms,
Quarterly Journal of Economics 80, 413–435. Miller, Darius P., and Natalia Reisel, 2012, Do country-level investor protections affect
security-level contract design? Evidence from foreign bond covenants, Review of Financial Studies 25, 408–438.
Moulton, Brent R., 1986, Random group effects and the precision of regression estimates,
Journal of Econometrics 32, 385–397. Newey, Whitney K., and Kenneth D. West, 1987, A simple positive semi-definite,
heteroskedasticity and autocorrelation consistent covariance matrix estimator, Econometrica 55, 703–708.
Nichols, Austin, and Mark Schaffer, 2007, Clustered errors in Stata, Available via the internet
at: http://repec.org/usug2007/crse.pdf. Ohlson, James, 1980, Financial ratios and the probabilistic prediction of bankruptcy, Journal
of Accounting Research18, 109–131. Opler, Tim, Lee Pinkowitz, René M. Stulz, and Rohan Williamson, 1999, The determinants
and implications of corporate cash holdings, Journal of Financial Economics 52, 3–46.
Pagano, Marco, and Tullio Jappelli, 1993, Information sharing in credit markets, Journal of
Finance 43, 1693–1718. Padilla, Jorge A., and Marco Pagano, 2000, Sharing default information as a borrower
discipline device, European Economic Review 44, 1951–1980. Petersen, Mitchell A., 2009, Estimating standard errors in finance panel data sets: Comparing
approaches, Review of Financial Studies 22, 435–480. Picker, Randal C., 1992, Security interests, misbehavior, and common pools, University of
Chicago Law Review 59, 645–79. Pinkowitz, Lee, René M. Stulz, and Rohan Williamson, 2013, Is there a U.S. high cash
holdings puzzle after the financial crisis? Working Paper.
43
Qian, Jun, and Philip E. Strahan, 2007, How laws and institutions shape financial contracts:
the case of bank Loans, Journal of Finance 62, 2803–2834. Rajan, Raghuram G., and Luigi Zingales, 1995, What do we know about capital structure?
Some evidence from international data, Journal of Finance 50, 1421–1460. Rajan, Raghuram G., and Luigi Zingales, 1998, Financial dependence and growth, American
Economic Review 88, 559–586. Rajan, Raghuram G., and Luigi Zingales, 2001, Financial systems, industrial structure and
growth, Oxford Review of Economic Policy 17, 467–482. Rampini, Adriano, and S. Viswanathan, 2013, Collateral and Capital Structure, Journal of
Financial Economics, forthcoming. Riddick, Leigh, and Toni Whited, 2009, The corporate propensity to save, Journal of Finance
64, 1729–1766. Shleifer, Andrei, and Robert W. Vishny, 1992, Liquidation values and debt capacity: A
market equilibrium approach, Journal of Finance 47, 143–66. Thompson, Samuel B., 2011, Simple formulas for standard errors that cluster by both firm
and time, Journal of Financial Economics 99, 1–10. Titman, Sheridan, and Roberto Wessels, 1988, The determinants of capital structure choice,
Journal of Finance 43, 1–21.
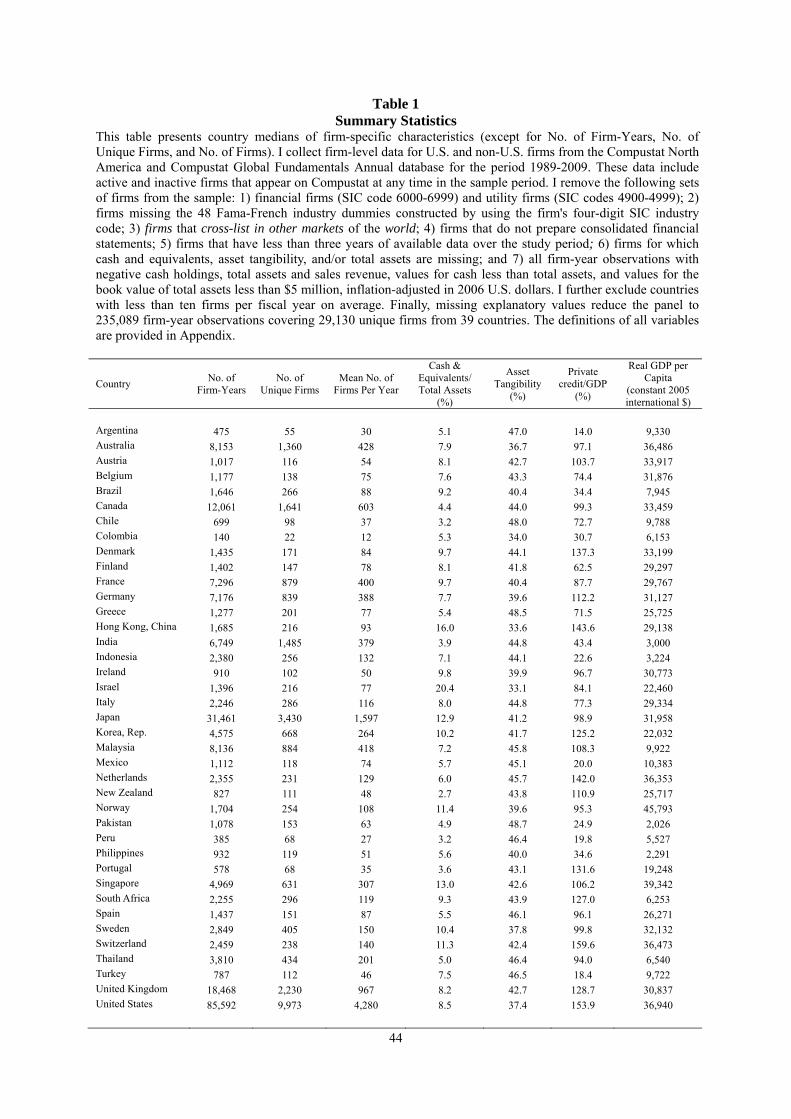
44
Table 1 Summary Statistics
This table presents country medians of firm-specific characteristics (except for No. of Firm-Years, No. of Unique Firms, and No. of Firms). I collect firm-level data for U.S. and non-U.S. firms from the Compustat North America and Compustat Global Fundamentals Annual database for the period 1989-2009. These data include active and inactive firms that appear on Compustat at any time in the sample period. I remove the following sets of firms from the sample: 1) financial firms (SIC code 6000-6999) and utility firms (SIC codes 4900-4999); 2) firms missing the 48 Fama-French industry dummies constructed by using the firm's four-digit SIC industry code; 3) firms that cross-list in other markets of the world; 4) firms that do not prepare consolidated financial statements; 5) firms that have less than three years of available data over the study period; 6) firms for which cash and equivalents, asset tangibility, and/or total assets are missing; and 7) all firm-year observations with negative cash holdings, total assets and sales revenue, values for cash less than total assets, and values for the book value of total assets less than $5 million, inflation-adjusted in 2006 U.S. dollars. I further exclude countries with less than ten firms per fiscal year on average. Finally, missing explanatory values reduce the panel to 235,089 firm-year observations covering 29,130 unique firms from 39 countries. The definitions of all variables are provided in Appendix.
Country
No. of Firm-Years
No. of Unique Firms
Mean No. of Firms Per Year
Cash & Equivalents/ Total Assets
(%)
Asset Tangibility
(%)
Private credit/GDP
(%)
Real GDP per Capita
(constant 2005 international $)
Argentina 475 55 30 5.1 47.0 14.0 9,330 Australia 8,153 1,360 428 7.9 36.7 97.1 36,486 Austria 1,017 116 54 8.1 42.7 103.7 33,917 Belgium 1,177 138 75 7.6 43.3 74.4 31,876 Brazil 1,646 266 88 9.2 40.4 34.4 7,945 Canada 12,061 1,641 603 4.4 44.0 99.3 33,459 Chile 699 98 37 3.2 48.0 72.7 9,788 Colombia 140 22 12 5.3 34.0 30.7 6,153 Denmark 1,435 171 84 9.7 44.1 137.3 33,199 Finland 1,402 147 78 8.1 41.8 62.5 29,297 France 7,296 879 400 9.7 40.4 87.7 29,767 Germany 7,176 839 388 7.7 39.6 112.2 31,127 Greece 1,277 201 77 5.4 48.5 71.5 25,725 Hong Kong, China 1,685 216 93 16.0 33.6 143.6 29,138 India 6,749 1,485 379 3.9 44.8 43.4 3,000 Indonesia 2,380 256 132 7.1 44.1 22.6 3,224 Ireland 910 102 50 9.8 39.9 96.7 30,773 Israel 1,396 216 77 20.4 33.1 84.1 22,460 Italy 2,246 286 116 8.0 44.8 77.3 29,334 Japan 31,461 3,430 1,597 12.9 41.2 98.9 31,958 Korea, Rep. 4,575 668 264 10.2 41.7 125.2 22,032 Malaysia 8,136 884 418 7.2 45.8 108.3 9,922 Mexico 1,112 118 74 5.7 45.1 20.0 10,383 Netherlands 2,355 231 129 6.0 45.7 142.0 36,353 New Zealand 827 111 48 2.7 43.8 110.9 25,717 Norway 1,704 254 108 11.4 39.6 95.3 45,793 Pakistan 1,078 153 63 4.9 48.7 24.9 2,026 Peru 385 68 27 3.2 46.4 19.8 5,527 Philippines 932 119 51 5.6 40.0 34.6 2,291 Portugal 578 68 35 3.6 43.1 131.6 19,248 Singapore 4,969 631 307 13.0 42.6 106.2 39,342 South Africa 2,255 296 119 9.3 43.9 127.0 6,253 Spain 1,437 151 87 5.5 46.1 96.1 26,271 Sweden 2,849 405 150 10.4 37.8 99.8 32,132 Switzerland 2,459 238 140 11.3 42.4 159.6 36,473 Thailand 3,810 434 201 5.0 46.4 94.0 6,540 Turkey 787 112 46 7.5 46.5 18.4 9,722 United Kingdom 18,468 2,230 967 8.2 42.7 128.7 30,837 United States 85,592 9,973 4,280 8.5 37.4 153.9 36,940
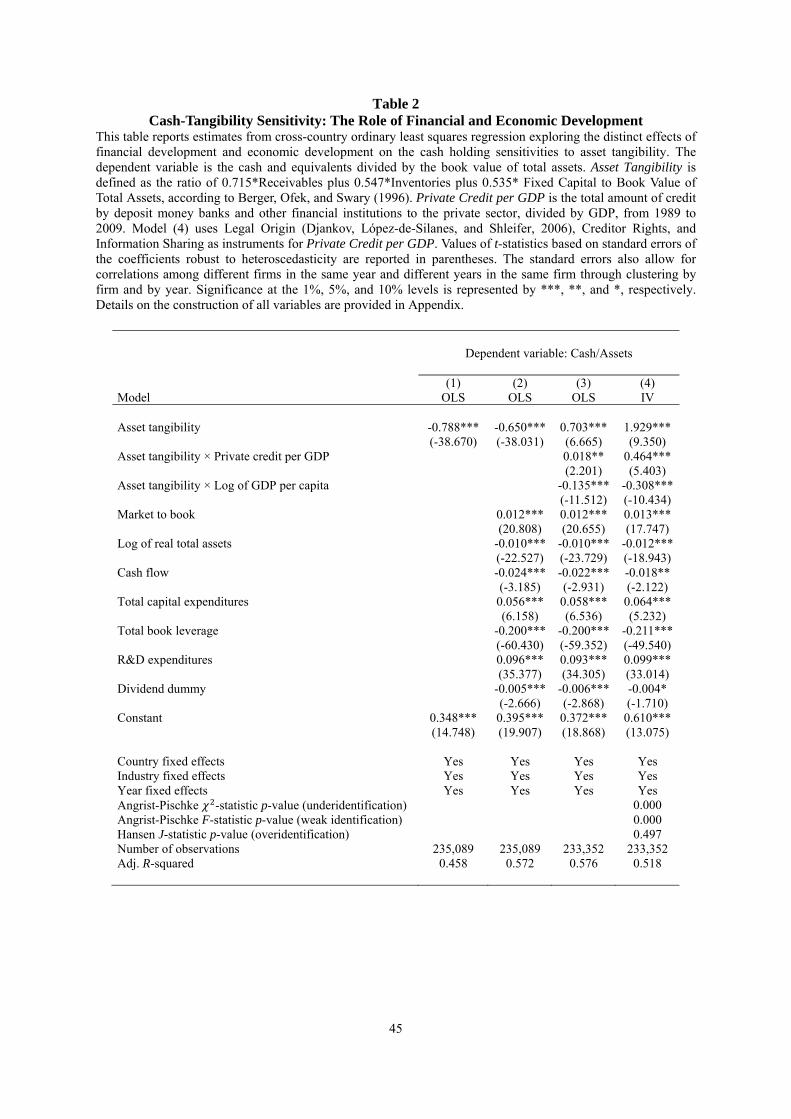
45
Table 2 Cash-Tangibility Sensitivity: The Role of Financial and Economic Development
This table reports estimates from cross-country ordinary least squares regression exploring the distinct effects of financial development and economic development on the cash holding sensitivities to asset tangibility. The dependent variable is the cash and equivalents divided by the book value of total assets. Asset Tangibility is defined as the ratio of 0.715*Receivables plus 0.547*Inventories plus 0.535* Fixed Capital to Book Value of Total Assets, according to Berger, Ofek, and Swary (1996). Private Credit per GDP is the total amount of credit by deposit money banks and other financial institutions to the private sector, divided by GDP, from 1989 to 2009. Model (4) uses Legal Origin (Djankov, López-de-Silanes, and Shleifer, 2006), Creditor Rights, and Information Sharing as instruments for Private Credit per GDP. Values of t-statistics based on standard errors of the coefficients robust to heteroscedasticity are reported in parentheses. The standard errors also allow for correlations among different firms in the same year and different years in the same firm through clustering by firm and by year. Significance at the 1%, 5%, and 10% levels is represented by ***, **, and *, respectively. Details on the construction of all variables are provided in Appendix.
Dependent variable: Cash/Assets
Model
(1) OLS
(2) OLS
(3) OLS
(4) IV
Asset tangibility -0.788*** -0.650*** 0.703*** 1.929*** (-38.670) (-38.031) (6.665) (9.350) Asset tangibility × Private credit per GDP 0.018** 0.464*** (2.201) (5.403) Asset tangibility × Log of GDP per capita -0.135*** -0.308*** (-11.512) (-10.434) Market to book 0.012*** 0.012*** 0.013*** (20.808) (20.655) (17.747) Log of real total assets -0.010*** -0.010*** -0.012*** (-22.527) (-23.729) (-18.943) Cash flow -0.024*** -0.022*** -0.018** (-3.185) (-2.931) (-2.122) Total capital expenditures 0.056*** 0.058*** 0.064*** (6.158) (6.536) (5.232) Total book leverage -0.200*** -0.200*** -0.211*** (-60.430) (-59.352) (-49.540) R&D expenditures 0.096*** 0.093*** 0.099*** (35.377) (34.305) (33.014) Dividend dummy -0.005*** -0.006*** -0.004* (-2.666) (-2.868) (-1.710) Constant 0.348*** 0.395*** 0.372*** 0.610*** (14.748) (19.907) (18.868) (13.075) Country fixed effects Yes Yes Yes Yes Industry fixed effects Yes Yes Yes Yes Year fixed effects Yes Yes Yes Yes Angrist-Pischke -statistic p-value (underidentification) 0.000 Angrist-Pischke F-statistic p-value (weak identification) 0.000 Hansen J-statistic p-value (overidentification) 0.497 Number of observations 235,089 235,089 233,352 233,352 Adj. R-squared 0.458 0.572 0.576 0.518
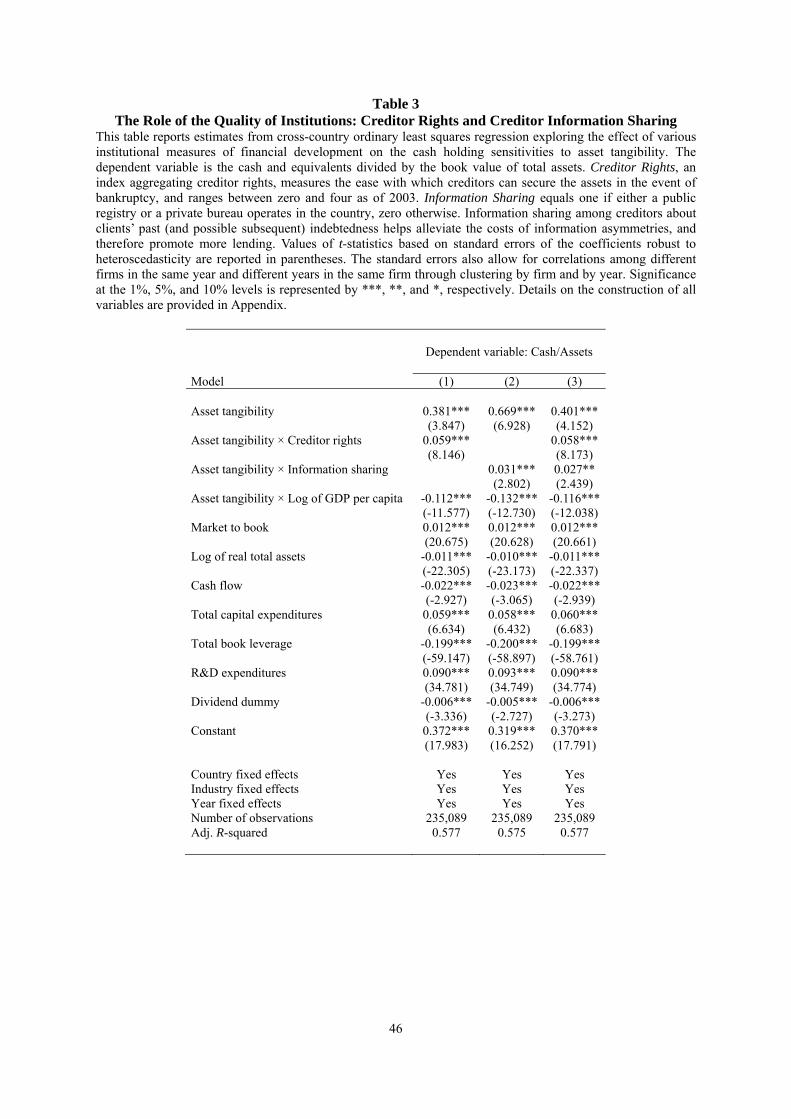
46
Table 3 The Role of the Quality of Institutions: Creditor Rights and Creditor Information Sharing
This table reports estimates from cross-country ordinary least squares regression exploring the effect of various institutional measures of financial development on the cash holding sensitivities to asset tangibility. The dependent variable is the cash and equivalents divided by the book value of total assets. Creditor Rights, an index aggregating creditor rights, measures the ease with which creditors can secure the assets in the event of bankruptcy, and ranges between zero and four as of 2003. Information Sharing equals one if either a public registry or a private bureau operates in the country, zero otherwise. Information sharing among creditors about clients’ past (and possible subsequent) indebtedness helps alleviate the costs of information asymmetries, and therefore promote more lending. Values of t-statistics based on standard errors of the coefficients robust to heteroscedasticity are reported in parentheses. The standard errors also allow for correlations among different firms in the same year and different years in the same firm through clustering by firm and by year. Significance at the 1%, 5%, and 10% levels is represented by ***, **, and *, respectively. Details on the construction of all variables are provided in Appendix.
Dependent variable: Cash/Assets
Model (1) (2) (3) Asset tangibility 0.381*** 0.669*** 0.401*** (3.847) (6.928) (4.152) Asset tangibility × Creditor rights 0.059*** 0.058*** (8.146) (8.173) Asset tangibility × Information sharing 0.031*** 0.027** (2.802) (2.439) Asset tangibility × Log of GDP per capita -0.112*** -0.132*** -0.116*** (-11.577) (-12.730) (-12.038) Market to book 0.012*** 0.012*** 0.012*** (20.675) (20.628) (20.661) Log of real total assets -0.011*** -0.010*** -0.011*** (-22.305) (-23.173) (-22.337) Cash flow -0.022*** -0.023*** -0.022*** (-2.927) (-3.065) (-2.939) Total capital expenditures 0.059*** 0.058*** 0.060*** (6.634) (6.432) (6.683) Total book leverage -0.199*** -0.200*** -0.199*** (-59.147) (-58.897) (-58.761) R&D expenditures 0.090*** 0.093*** 0.090*** (34.781) (34.749) (34.774) Dividend dummy -0.006*** -0.005*** -0.006*** (-3.336) (-2.727) (-3.273) Constant 0.372*** 0.319*** 0.370*** (17.983) (16.252) (17.791) Country fixed effects Yes Yes Yes Industry fixed effects Yes Yes Yes Year fixed effects Yes Yes Yes Number of observations 235,089 235,089 235,089 Adj. R-squared 0.577 0.575 0.577
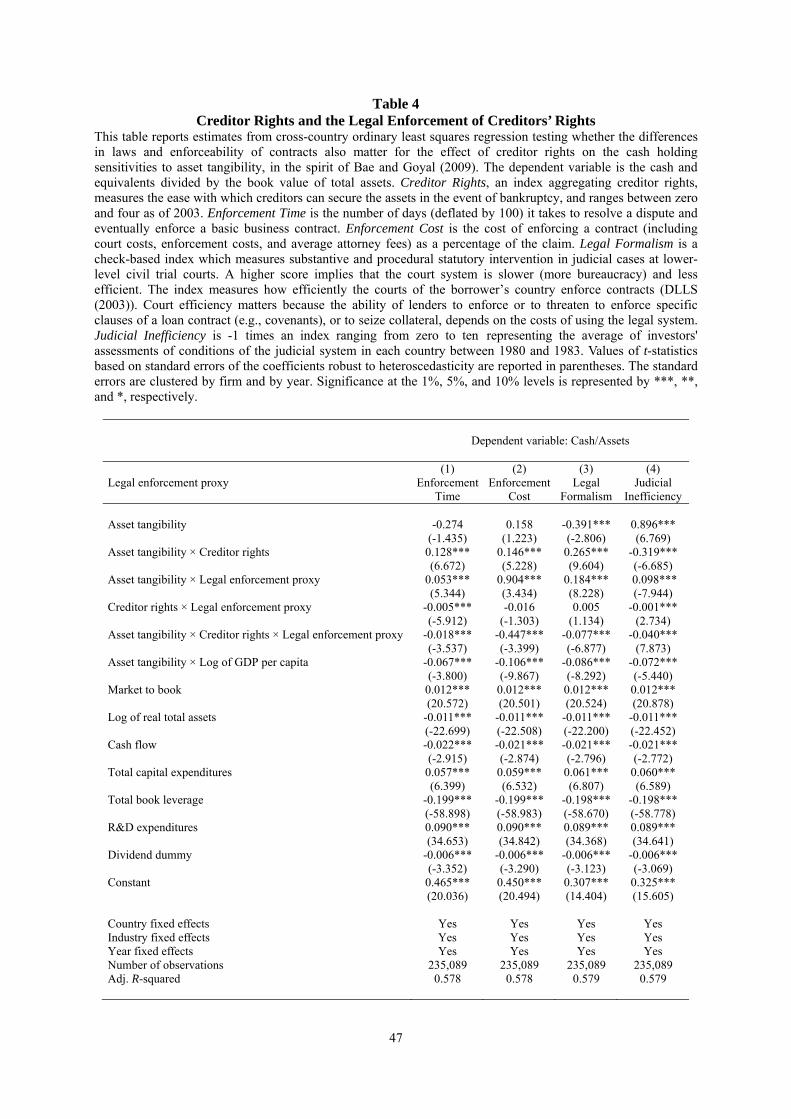
47
Table 4 Creditor Rights and the Legal Enforcement of Creditors’ Rights
This table reports estimates from cross-country ordinary least squares regression testing whether the differences in laws and enforceability of contracts also matter for the effect of creditor rights on the cash holding sensitivities to asset tangibility, in the spirit of Bae and Goyal (2009). The dependent variable is the cash and equivalents divided by the book value of total assets. Creditor Rights, an index aggregating creditor rights, measures the ease with which creditors can secure the assets in the event of bankruptcy, and ranges between zero and four as of 2003. Enforcement Time is the number of days (deflated by 100) it takes to resolve a dispute and eventually enforce a basic business contract. Enforcement Cost is the cost of enforcing a contract (including court costs, enforcement costs, and average attorney fees) as a percentage of the claim. Legal Formalism is a check-based index which measures substantive and procedural statutory intervention in judicial cases at lower-level civil trial courts. A higher score implies that the court system is slower (more bureaucracy) and less efficient. The index measures how efficiently the courts of the borrower’s country enforce contracts (DLLS (2003)). Court efficiency matters because the ability of lenders to enforce or to threaten to enforce specific clauses of a loan contract (e.g., covenants), or to seize collateral, depends on the costs of using the legal system. Judicial Inefficiency is -1 times an index ranging from zero to ten representing the average of investors' assessments of conditions of the judicial system in each country between 1980 and 1983. Values of t-statistics based on standard errors of the coefficients robust to heteroscedasticity are reported in parentheses. The standard errors are clustered by firm and by year. Significance at the 1%, 5%, and 10% levels is represented by ***, **, and *, respectively.
Dependent variable: Cash/Assets
Legal enforcement proxy (1)
Enforcement Time
(2) Enforcement
Cost
(3) Legal
Formalism
(4) Judicial
Inefficiency Asset tangibility -0.274 0.158 -0.391*** 0.896*** (-1.435) (1.223) (-2.806) (6.769) Asset tangibility × Creditor rights 0.128*** 0.146*** 0.265*** -0.319*** (6.672) (5.228) (9.604) (-6.685) Asset tangibility × Legal enforcement proxy 0.053*** 0.904*** 0.184*** 0.098*** (5.344) (3.434) (8.228) (-7.944) Creditor rights × Legal enforcement proxy -0.005*** -0.016 0.005 -0.001*** (-5.912) (-1.303) (1.134) (2.734) Asset tangibility × Creditor rights × Legal enforcement proxy -0.018*** -0.447*** -0.077*** -0.040*** (-3.537) (-3.399) (-6.877) (7.873) Asset tangibility × Log of GDP per capita -0.067*** -0.106*** -0.086*** -0.072*** (-3.800) (-9.867) (-8.292) (-5.440) Market to book 0.012*** 0.012*** 0.012*** 0.012*** (20.572) (20.501) (20.524) (20.878) Log of real total assets -0.011*** -0.011*** -0.011*** -0.011*** (-22.699) (-22.508) (-22.200) (-22.452) Cash flow -0.022*** -0.021*** -0.021*** -0.021*** (-2.915) (-2.874) (-2.796) (-2.772) Total capital expenditures 0.057*** 0.059*** 0.061*** 0.060*** (6.399) (6.532) (6.807) (6.589) Total book leverage -0.199*** -0.199*** -0.198*** -0.198*** (-58.898) (-58.983) (-58.670) (-58.778) R&D expenditures 0.090*** 0.090*** 0.089*** 0.089*** (34.653) (34.842) (34.368) (34.641) Dividend dummy -0.006*** -0.006*** -0.006*** -0.006*** (-3.352) (-3.290) (-3.123) (-3.069) Constant 0.465*** 0.450*** 0.307*** 0.325*** (20.036) (20.494) (14.404) (15.605) Country fixed effects Yes Yes Yes Yes Industry fixed effects Yes Yes Yes Yes Year fixed effects Yes Yes Yes Yes Number of observations 235,089 235,089 235,089 235,089 Adj. R-squared 0.578 0.578 0.579 0.579
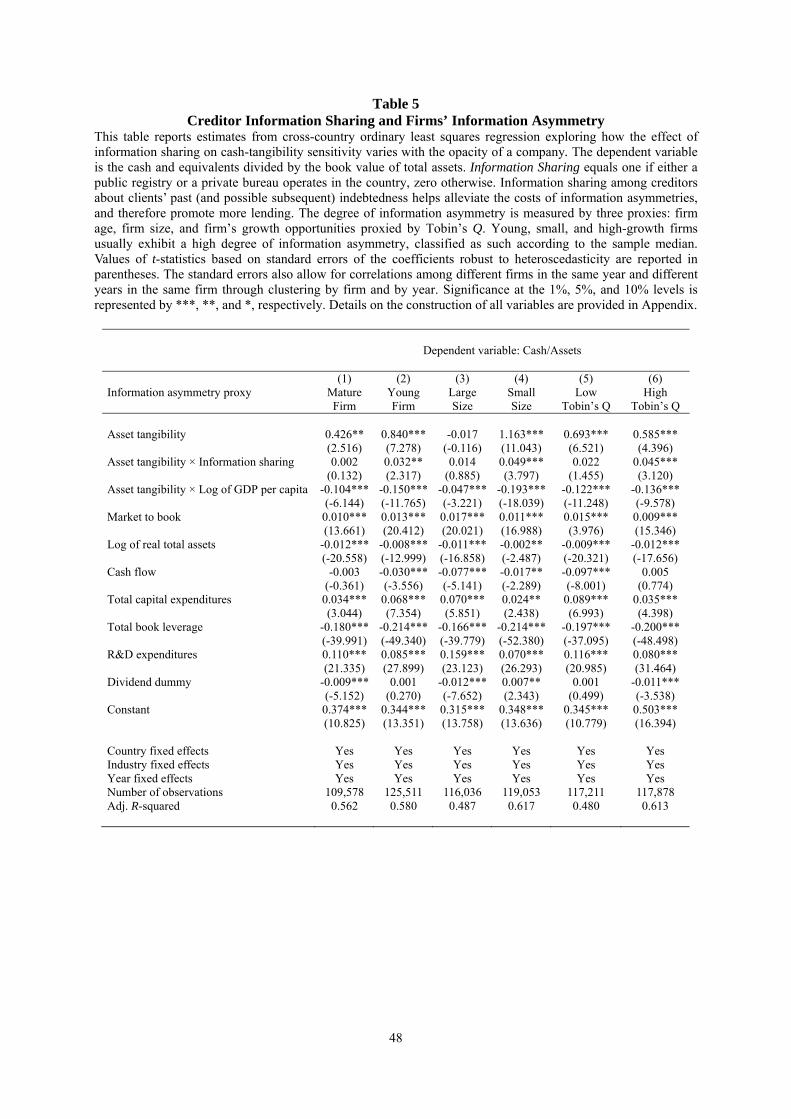
48
Table 5 Creditor Information Sharing and Firms’ Information Asymmetry
This table reports estimates from cross-country ordinary least squares regression exploring how the effect of information sharing on cash-tangibility sensitivity varies with the opacity of a company. The dependent variable is the cash and equivalents divided by the book value of total assets. Information Sharing equals one if either a public registry or a private bureau operates in the country, zero otherwise. Information sharing among creditors about clients’ past (and possible subsequent) indebtedness helps alleviate the costs of information asymmetries, and therefore promote more lending. The degree of information asymmetry is measured by three proxies: firm age, firm size, and firm’s growth opportunities proxied by Tobin’s Q. Young, small, and high-growth firms usually exhibit a high degree of information asymmetry, classified as such according to the sample median. Values of t-statistics based on standard errors of the coefficients robust to heteroscedasticity are reported in parentheses. The standard errors also allow for correlations among different firms in the same year and different years in the same firm through clustering by firm and by year. Significance at the 1%, 5%, and 10% levels is represented by ***, **, and *, respectively. Details on the construction of all variables are provided in Appendix.
Dependent variable: Cash/Assets
Information asymmetry proxy (1)
Mature Firm
(2) Young Firm
(3) Large Size
(4) Small Size
(5) Low
Tobin’s Q
(6) High
Tobin’s Q Asset tangibility 0.426** 0.840*** -0.017 1.163*** 0.693*** 0.585*** (2.516) (7.278) (-0.116) (11.043) (6.521) (4.396) Asset tangibility × Information sharing 0.002 0.032** 0.014 0.049*** 0.022 0.045*** (0.132) (2.317) (0.885) (3.797) (1.455) (3.120) Asset tangibility × Log of GDP per capita -0.104*** -0.150*** -0.047*** -0.193*** -0.122*** -0.136*** (-6.144) (-11.765) (-3.221) (-18.039) (-11.248) (-9.578) Market to book 0.010*** 0.013*** 0.017*** 0.011*** 0.015*** 0.009*** (13.661) (20.412) (20.021) (16.988) (3.976) (15.346) Log of real total assets -0.012*** -0.008*** -0.011*** -0.002** -0.009*** -0.012*** (-20.558) (-12.999) (-16.858) (-2.487) (-20.321) (-17.656) Cash flow -0.003 -0.030*** -0.077*** -0.017** -0.097*** 0.005 (-0.361) (-3.556) (-5.141) (-2.289) (-8.001) (0.774) Total capital expenditures 0.034*** 0.068*** 0.070*** 0.024** 0.089*** 0.035*** (3.044) (7.354) (5.851) (2.438) (6.993) (4.398) Total book leverage -0.180*** -0.214*** -0.166*** -0.214*** -0.197*** -0.200*** (-39.991) (-49.340) (-39.779) (-52.380) (-37.095) (-48.498) R&D expenditures 0.110*** 0.085*** 0.159*** 0.070*** 0.116*** 0.080*** (21.335) (27.899) (23.123) (26.293) (20.985) (31.464) Dividend dummy -0.009*** 0.001 -0.012*** 0.007** 0.001 -0.011*** (-5.152) (0.270) (-7.652) (2.343) (0.499) (-3.538) Constant 0.374*** 0.344*** 0.315*** 0.348*** 0.345*** 0.503*** (10.825) (13.351) (13.758) (13.636) (10.779) (16.394) Country fixed effects Yes Yes Yes Yes Yes Yes Industry fixed effects Yes Yes Yes Yes Yes Yes Year fixed effects Yes Yes Yes Yes Yes Yes Number of observations 109,578 125,511 116,036 119,053 117,211 117,878 Adj. R-squared 0.562 0.580 0.487 0.617 0.480 0.613
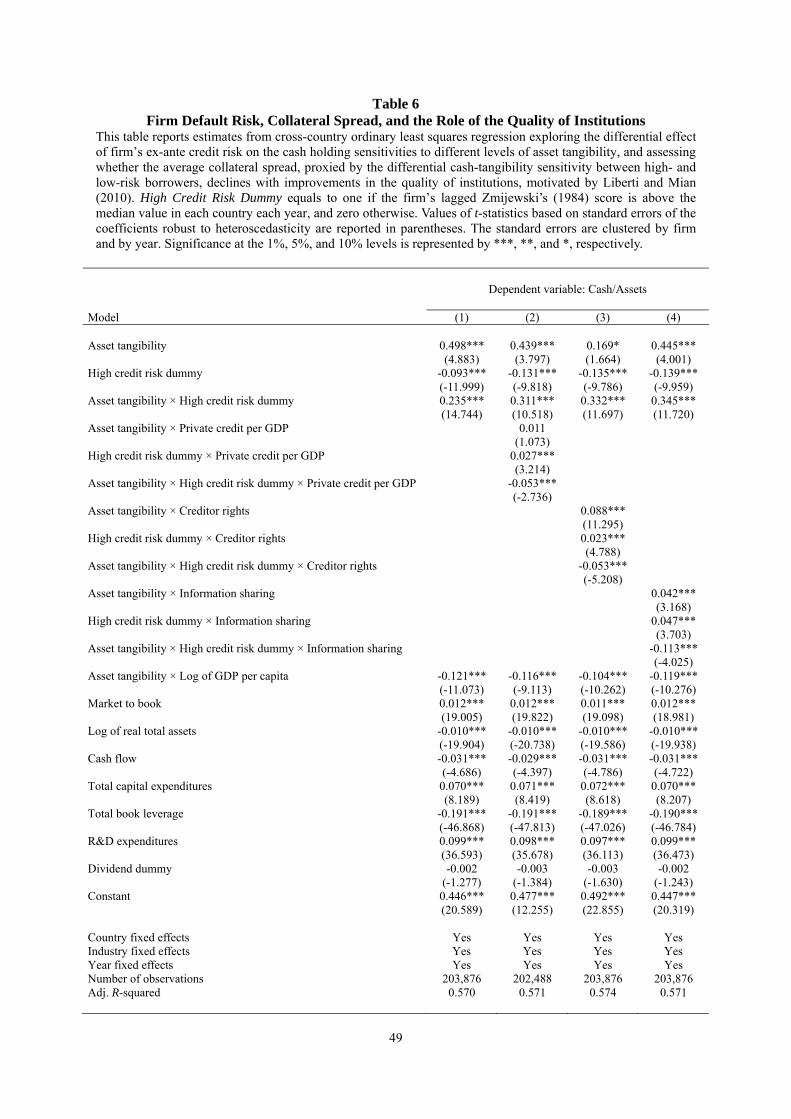
49
Table 6 Firm Default Risk, Collateral Spread, and the Role of the Quality of Institutions
This table reports estimates from cross-country ordinary least squares regression exploring the differential effect of firm’s ex-ante credit risk on the cash holding sensitivities to different levels of asset tangibility, and assessing whether the average collateral spread, proxied by the differential cash-tangibility sensitivity between high- and low-risk borrowers, declines with improvements in the quality of institutions, motivated by Liberti and Mian (2010). High Credit Risk Dummy equals to one if the firm’s lagged Zmijewski’s (1984) score is above the median value in each country each year, and zero otherwise. Values of t-statistics based on standard errors of the coefficients robust to heteroscedasticity are reported in parentheses. The standard errors are clustered by firm and by year. Significance at the 1%, 5%, and 10% levels is represented by ***, **, and *, respectively.
Dependent variable: Cash/Assets
Model (1) (2) (3) (4) Asset tangibility 0.498*** 0.439*** 0.169* 0.445*** (4.883) (3.797) (1.664) (4.001) High credit risk dummy -0.093*** -0.131*** -0.135*** -0.139*** (-11.999) (-9.818) (-9.786) (-9.959) Asset tangibility × High credit risk dummy 0.235*** 0.311*** 0.332*** 0.345*** (14.744) (10.518) (11.697) (11.720) Asset tangibility × Private credit per GDP 0.011 (1.073) High credit risk dummy × Private credit per GDP 0.027*** (3.214) Asset tangibility × High credit risk dummy × Private credit per GDP -0.053*** (-2.736) Asset tangibility × Creditor rights 0.088*** (11.295) High credit risk dummy × Creditor rights 0.023*** (4.788) Asset tangibility × High credit risk dummy × Creditor rights -0.053*** (-5.208) Asset tangibility × Information sharing 0.042*** (3.168) High credit risk dummy × Information sharing 0.047*** (3.703) Asset tangibility × High credit risk dummy × Information sharing -0.113*** (-4.025) Asset tangibility × Log of GDP per capita -0.121*** -0.116*** -0.104*** -0.119*** (-11.073) (-9.113) (-10.262) (-10.276) Market to book 0.012*** 0.012*** 0.011*** 0.012*** (19.005) (19.822) (19.098) (18.981) Log of real total assets -0.010*** -0.010*** -0.010*** -0.010*** (-19.904) (-20.738) (-19.586) (-19.938) Cash flow -0.031*** -0.029*** -0.031*** -0.031*** (-4.686) (-4.397) (-4.786) (-4.722) Total capital expenditures 0.070*** 0.071*** 0.072*** 0.070*** (8.189) (8.419) (8.618) (8.207) Total book leverage -0.191*** -0.191*** -0.189*** -0.190*** (-46.868) (-47.813) (-47.026) (-46.784) R&D expenditures 0.099*** 0.098*** 0.097*** 0.099*** (36.593) (35.678) (36.113) (36.473) Dividend dummy -0.002 -0.003 -0.003 -0.002 (-1.277) (-1.384) (-1.630) (-1.243) Constant 0.446*** 0.477*** 0.492*** 0.447*** (20.589) (12.255) (22.855) (20.319) Country fixed effects Yes Yes Yes Yes Industry fixed effects Yes Yes Yes Yes Year fixed effects Yes Yes Yes Yes Number of observations 203,876 202,488 203,876 203,876 Adj. R-squared 0.570 0.571 0.574 0.571
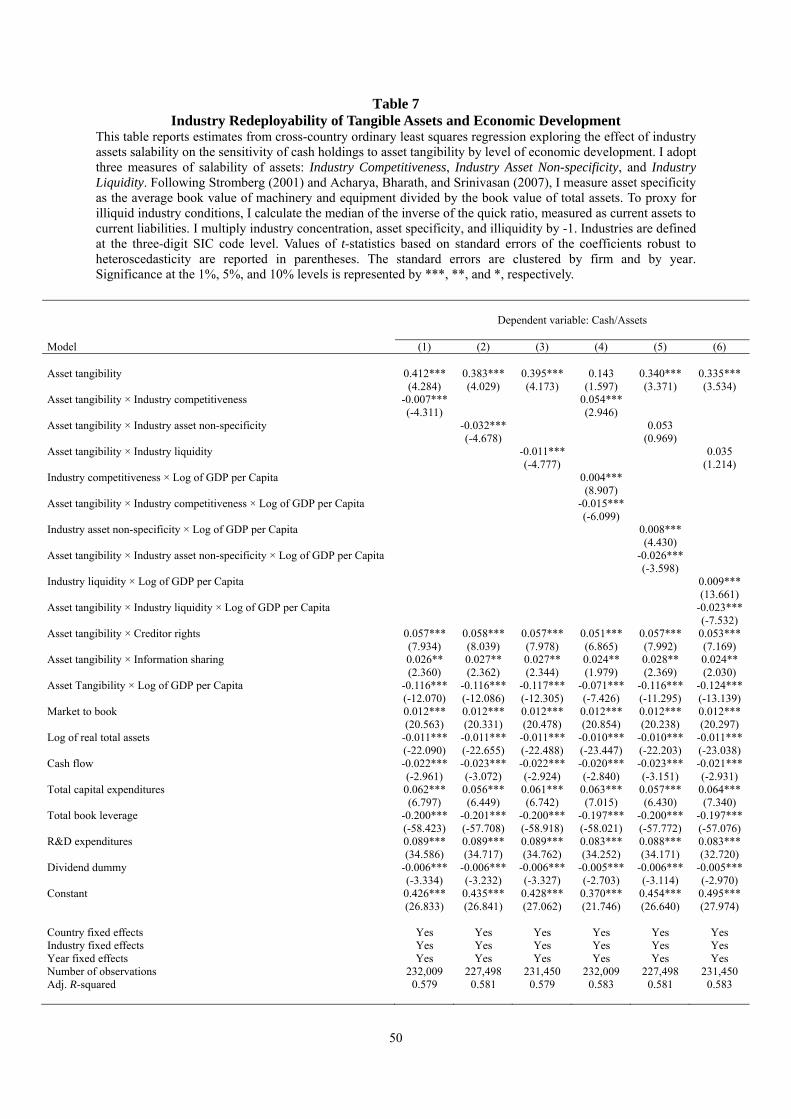
50
Table 7 Industry Redeployability of Tangible Assets and Economic Development
This table reports estimates from cross-country ordinary least squares regression exploring the effect of industry assets salability on the sensitivity of cash holdings to asset tangibility by level of economic development. I adopt three measures of salability of assets: Industry Competitiveness, Industry Asset Non-specificity, and Industry Liquidity. Following Stromberg (2001) and Acharya, Bharath, and Srinivasan (2007), I measure asset specificity as the average book value of machinery and equipment divided by the book value of total assets. To proxy for illiquid industry conditions, I calculate the median of the inverse of the quick ratio, measured as current assets to current liabilities. I multiply industry concentration, asset specificity, and illiquidity by -1. Industries are defined at the three-digit SIC code level. Values of t-statistics based on standard errors of the coefficients robust to heteroscedasticity are reported in parentheses. The standard errors are clustered by firm and by year. Significance at the 1%, 5%, and 10% levels is represented by ***, **, and *, respectively.
Dependent variable: Cash/Assets
Model (1) (2) (3) (4) (5) (6) Asset tangibility 0.412*** 0.383*** 0.395*** 0.143 0.340*** 0.335*** (4.284) (4.029) (4.173) (1.597) (3.371) (3.534) Asset tangibility × Industry competitiveness -0.007*** 0.054*** (-4.311) (2.946) Asset tangibility × Industry asset non-specificity -0.032*** 0.053 (-4.678) (0.969) Asset tangibility × Industry liquidity -0.011*** 0.035 (-4.777) (1.214) Industry competitiveness × Log of GDP per Capita 0.004*** (8.907) Asset tangibility × Industry competitiveness × Log of GDP per Capita -0.015*** (-6.099) Industry asset non-specificity × Log of GDP per Capita 0.008*** (4.430) Asset tangibility × Industry asset non-specificity × Log of GDP per Capita -0.026*** (-3.598) Industry liquidity × Log of GDP per Capita 0.009*** (13.661) Asset tangibility × Industry liquidity × Log of GDP per Capita -0.023*** (-7.532) Asset tangibility × Creditor rights 0.057*** 0.058*** 0.057*** 0.051*** 0.057*** 0.053*** (7.934) (8.039) (7.978) (6.865) (7.992) (7.169) Asset tangibility × Information sharing 0.026** 0.027** 0.027** 0.024** 0.028** 0.024** (2.360) (2.362) (2.344) (1.979) (2.369) (2.030) Asset Tangibility × Log of GDP per Capita -0.116*** -0.116*** -0.117*** -0.071*** -0.116*** -0.124*** (-12.070) (-12.086) (-12.305) (-7.426) (-11.295) (-13.139) Market to book 0.012*** 0.012*** 0.012*** 0.012*** 0.012*** 0.012*** (20.563) (20.331) (20.478) (20.854) (20.238) (20.297) Log of real total assets -0.011*** -0.011*** -0.011*** -0.010*** -0.010*** -0.011*** (-22.090) (-22.655) (-22.488) (-23.447) (-22.203) (-23.038) Cash flow -0.022*** -0.023*** -0.022*** -0.020*** -0.023*** -0.021*** (-2.961) (-3.072) (-2.924) (-2.840) (-3.151) (-2.931) Total capital expenditures 0.062*** 0.056*** 0.061*** 0.063*** 0.057*** 0.064*** (6.797) (6.449) (6.742) (7.015) (6.430) (7.340) Total book leverage -0.200*** -0.201*** -0.200*** -0.197*** -0.200*** -0.197*** (-58.423) (-57.708) (-58.918) (-58.021) (-57.772) (-57.076) R&D expenditures 0.089*** 0.089*** 0.089*** 0.083*** 0.088*** 0.083*** (34.586) (34.717) (34.762) (34.252) (34.171) (32.720) Dividend dummy -0.006*** -0.006*** -0.006*** -0.005*** -0.006*** -0.005*** (-3.334) (-3.232) (-3.327) (-2.703) (-3.114) (-2.970) Constant 0.426*** 0.435*** 0.428*** 0.370*** 0.454*** 0.495*** (26.833) (26.841) (27.062) (21.746) (26.640) (27.974) Country fixed effects Yes Yes Yes Yes Yes Yes Industry fixed effects Yes Yes Yes Yes Yes Yes Year fixed effects Yes Yes Yes Yes Yes Yes Number of observations 232,009 227,498 231,450 232,009 227,498 231,450 Adj. R-squared 0.579 0.581 0.579 0.583 0.581 0.583
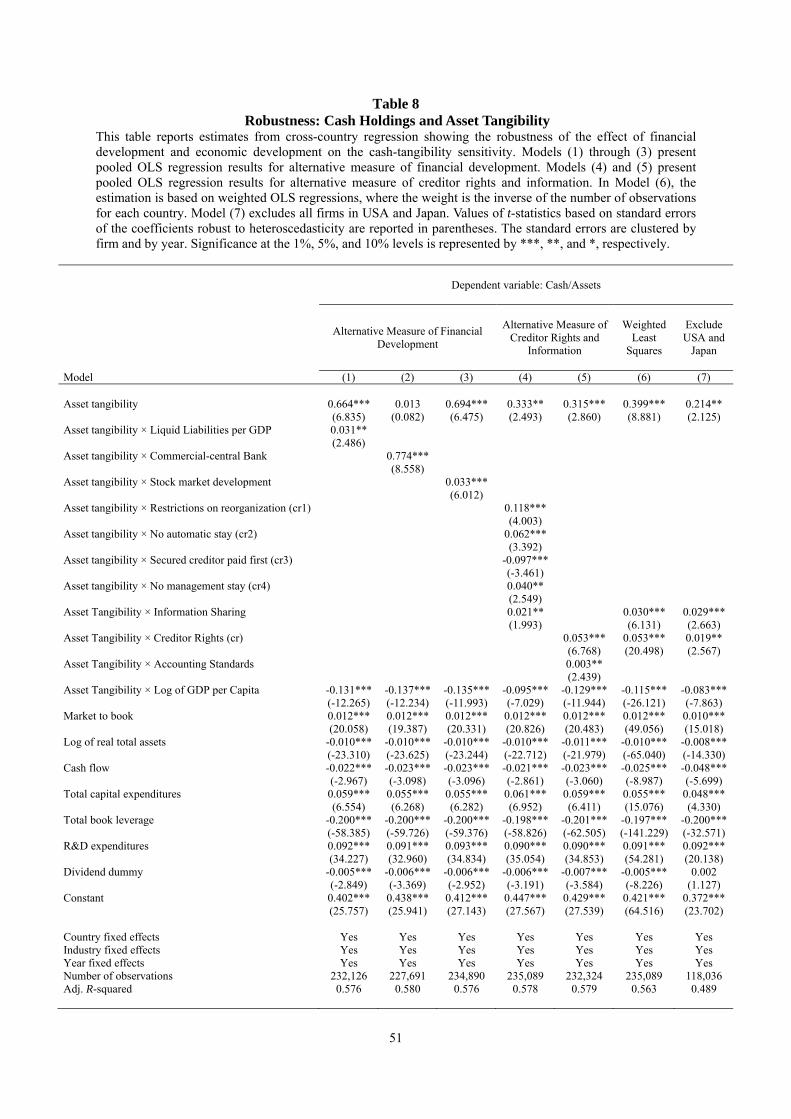
51
Table 8 Robustness: Cash Holdings and Asset Tangibility
This table reports estimates from cross-country regression showing the robustness of the effect of financial development and economic development on the cash-tangibility sensitivity. Models (1) through (3) present pooled OLS regression results for alternative measure of financial development. Models (4) and (5) present pooled OLS regression results for alternative measure of creditor rights and information. In Model (6), the estimation is based on weighted OLS regressions, where the weight is the inverse of the number of observations for each country. Model (7) excludes all firms in USA and Japan. Values of t-statistics based on standard errors of the coefficients robust to heteroscedasticity are reported in parentheses. The standard errors are clustered by firm and by year. Significance at the 1%, 5%, and 10% levels is represented by ***, **, and *, respectively.
Dependent variable: Cash/Assets
Alternative Measure of Financial
Development
Alternative Measure of
Creditor Rights and Information
Weighted Least
Squares
Exclude USA and
Japan
Model (1) (2) (3) (4) (5) (6) (7) Asset tangibility 0.664*** 0.013 0.694*** 0.333** 0.315*** 0.399*** 0.214** (6.835) (0.082) (6.475) (2.493) (2.860) (8.881) (2.125) Asset tangibility × Liquid Liabilities per GDP 0.031** (2.486) Asset tangibility × Commercial-central Bank 0.774*** (8.558) Asset tangibility × Stock market development 0.033*** (6.012) Asset tangibility × Restrictions on reorganization (cr1) 0.118*** (4.003) Asset tangibility × No automatic stay (cr2) 0.062*** (3.392) Asset tangibility × Secured creditor paid first (cr3) -0.097*** (-3.461) Asset tangibility × No management stay (cr4) 0.040** (2.549) Asset Tangibility × Information Sharing 0.021** 0.030*** 0.029*** (1.993) (6.131) (2.663) Asset Tangibility × Creditor Rights (cr) 0.053*** 0.053*** 0.019** (6.768) (20.498) (2.567) Asset Tangibility × Accounting Standards 0.003** (2.439) Asset Tangibility × Log of GDP per Capita -0.131*** -0.137*** -0.135*** -0.095*** -0.129*** -0.115*** -0.083*** (-12.265) (-12.234) (-11.993) (-7.029) (-11.944) (-26.121) (-7.863) Market to book 0.012*** 0.012*** 0.012*** 0.012*** 0.012*** 0.012*** 0.010*** (20.058) (19.387) (20.331) (20.826) (20.483) (49.056) (15.018) Log of real total assets -0.010*** -0.010*** -0.010*** -0.010*** -0.011*** -0.010*** -0.008*** (-23.310) (-23.625) (-23.244) (-22.712) (-21.979) (-65.040) (-14.330) Cash flow -0.022*** -0.023*** -0.023*** -0.021*** -0.023*** -0.025*** -0.048*** (-2.967) (-3.098) (-3.096) (-2.861) (-3.060) (-8.987) (-5.699) Total capital expenditures 0.059*** 0.055*** 0.055*** 0.061*** 0.059*** 0.055*** 0.048*** (6.554) (6.268) (6.282) (6.952) (6.411) (15.076) (4.330) Total book leverage -0.200*** -0.200*** -0.200*** -0.198*** -0.201*** -0.197*** -0.200*** (-58.385) (-59.726) (-59.376) (-58.826) (-62.505) (-141.229) (-32.571) R&D expenditures 0.092*** 0.091*** 0.093*** 0.090*** 0.090*** 0.091*** 0.092*** (34.227) (32.960) (34.834) (35.054) (34.853) (54.281) (20.138) Dividend dummy -0.005*** -0.006*** -0.006*** -0.006*** -0.007*** -0.005*** 0.002 (-2.849) (-3.369) (-2.952) (-3.191) (-3.584) (-8.226) (1.127) Constant 0.402*** 0.438*** 0.412*** 0.447*** 0.429*** 0.421*** 0.372*** (25.757) (25.941) (27.143) (27.567) (27.539) (64.516) (23.702) Country fixed effects Yes Yes Yes Yes Yes Yes Yes Industry fixed effects Yes Yes Yes Yes Yes Yes Yes Year fixed effects Yes Yes Yes Yes Yes Yes Yes Number of observations 232,126 227,691 234,890 235,089 232,324 235,089 118,036 Adj. R-squared 0.576 0.580 0.576 0.578 0.579 0.563 0.489
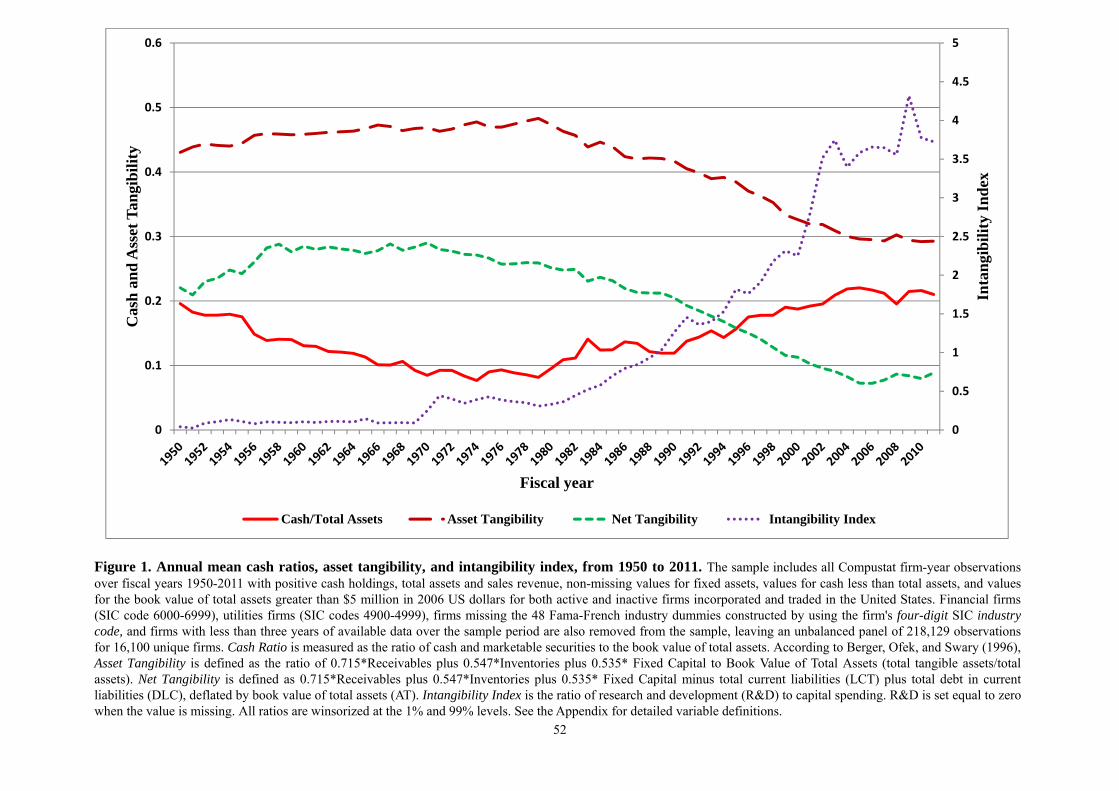
52
Figure 1. Annual mean cash ratios, asset tangibility, and intangibility index, from 1950 to 2011. The sample includes all Compustat firm-year observations over fiscal years 1950-2011 with positive cash holdings, total assets and sales revenue, non-missing values for fixed assets, values for cash less than total assets, and values for the book value of total assets greater than $5 million in 2006 US dollars for both active and inactive firms incorporated and traded in the United States. Financial firms (SIC code 6000-6999), utilities firms (SIC codes 4900-4999), firms missing the 48 Fama-French industry dummies constructed by using the firm's four-digit SIC industry code, and firms with less than three years of available data over the sample period are also removed from the sample, leaving an unbalanced panel of 218,129 observations for 16,100 unique firms. Cash Ratio is measured as the ratio of cash and marketable securities to the book value of total assets. According to Berger, Ofek, and Swary (1996), Asset Tangibility is defined as the ratio of 0.715*Receivables plus 0.547*Inventories plus 0.535* Fixed Capital to Book Value of Total Assets (total tangible assets/total assets). Net Tangibility is defined as 0.715*Receivables plus 0.547*Inventories plus 0.535* Fixed Capital minus total current liabilities (LCT) plus total debt in current liabilities (DLC), deflated by book value of total assets (AT). Intangibility Index is the ratio of research and development (R&D) to capital spending. R&D is set equal to zero when the value is missing. All ratios are winsorized at the 1% and 99% levels. See the Appendix for detailed variable definitions.
0
0.5
1
1.5
2
2.5
3
3.5
4
4.5
5
0
0.1
0.2
0.3
0.4
0.5
0.6
Inta
ngi
bil
ity
Ind
ex
Cas
h a
nd
Ass
et T
angi
bil
ity
Fiscal year
Cash/Total Assets Asset Tangibility Net Tangibility Intangibility Index
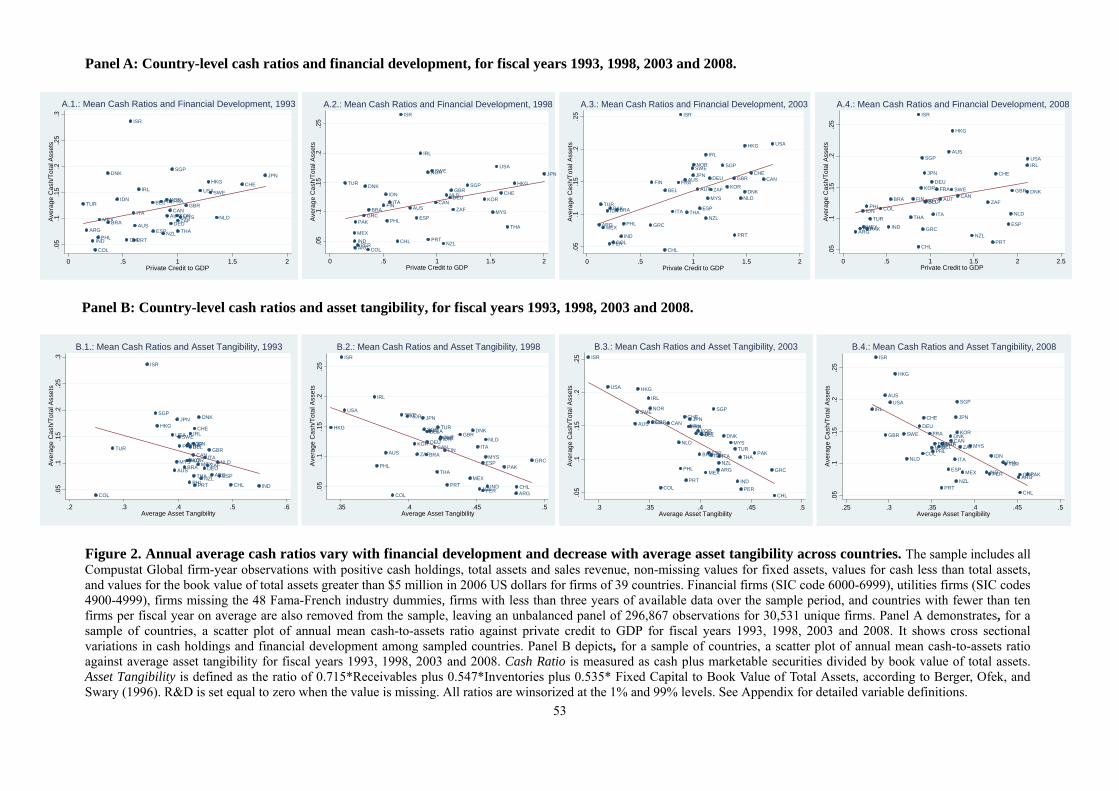
53
Panel A: Country-level cash ratios and financial development, for fiscal years 1993, 1998, 2003 and 2008.
Panel B: Country-level cash ratios and asset tangibility, for fiscal years 1993, 1998, 2003 and 2008.
Figure 2. Annual average cash ratios vary with financial development and decrease with average asset tangibility across countries. The sample includes all Compustat Global firm-year observations with positive cash holdings, total assets and sales revenue, non-missing values for fixed assets, values for cash less than total assets, and values for the book value of total assets greater than $5 million in 2006 US dollars for firms of 39 countries. Financial firms (SIC code 6000-6999), utilities firms (SIC codes 4900-4999), firms missing the 48 Fama-French industry dummies, firms with less than three years of available data over the sample period, and countries with fewer than ten firms per fiscal year on average are also removed from the sample, leaving an unbalanced panel of 296,867 observations for 30,531 unique firms. Panel A demonstrates, for a sample of countries, a scatter plot of annual mean cash-to-assets ratio against private credit to GDP for fiscal years 1993, 1998, 2003 and 2008. It shows cross sectional variations in cash holdings and financial development among sampled countries. Panel B depicts, for a sample of countries, a scatter plot of annual mean cash-to-assets ratio against average asset tangibility for fiscal years 1993, 1998, 2003 and 2008. Cash Ratio is measured as cash plus marketable securities divided by book value of total assets. Asset Tangibility is defined as the ratio of 0.715*Receivables plus 0.547*Inventories plus 0.535* Fixed Capital to Book Value of Total Assets, according to Berger, Ofek, and Swary (1996). R&D is set equal to zero when the value is missing. All ratios are winsorized at the 1% and 99% levels. See Appendix for detailed variable definitions.
ARGAUS
AUT
BEL
BRA
CAN
CHE
CHL
COL
DEU
DNK
ESP
FIN FRAGBR
HKG
IDN
IND
IRL
ISR
ITA
JPN
KORMEX MYS NLD
NOR
NZLPHL PRT
SGP
SWE
THA
TUR
USA
ZAF
.05
.1.1
5.2
.25
.3Av
erag
e C
ash/
Tota
l Ass
ets
0 .5 1 1.5 2Private Credit to GDP
A.1.: Mean Cash Ratios and Financial Development, 1993
ARG
AUSBRACAN
CHE
CHLCOL
DEU
DNK
ESP
FIN
GBR
GRC
HKG
IDN
IND
IRL
ISR
ITA
JPN
KOR
MEX
MYS
NLD
NOR
NZL
PAK
PER
PHL
PRT
SGP
SWE
THA
TUR
USA
ZAF
.05
.1.1
5.2
.25
Aver
age
Cas
h/To
tal A
sset
s
0 .5 1 1.5 2Private Credit to GDP
A.2.: Mean Cash Ratios and Financial Development, 1998
ARG
AUS
AUTBEL
BRA
CANCHE
CHLCOL
DEU
DNK
ESP
FIN FRAGBR
GRC
HKG
IDN
IND
IRL
ISR
ITA
JPN
KOR
MEX
MYS NLD
NOR
NZL
PAK
PER
PHL
PRT
SGPSWE
THATUR
USA
ZAF
.05
.1.1
5.2
.25
Aver
age
Cas
h/To
tal A
sset
s
0 .5 1 1.5 2Private Credit to GDP
A.3.: Mean Cash Ratios and Financial Development, 2003
ARG
AUS
AUTBELBRA CAN
CHE
CHL
COL
DEU
DNK
ESP
FIN
FRA GBR
GRC
HKG
IDN
IND
IRL
ISR
ITA
JPN
KOR
MEX
MYS
NLD
NZLPAKPER
PHL
PRT
SGP
SWE
THATUR
USA
ZAF
.05
.1.1
5.2
.25
Aver
age
Cas
h/To
tal A
sset
s
0 .5 1 1.5 2 2.5Private Credit to GDP
A.4.: Mean Cash Ratios and Financial Development, 2008
ARGAUS
AUT
BEL
BRA
CAN
CHE
CHL
COL
DEU
DNK
ESP
FINFRAGBR
HKG
IDN
IND
IRL
ISR
ITA
JPN
KORMEXMYS NLD
NOR
NZLPHLPRT
SGP
SWE
THA
TUR
USA
ZAF
.05
.1.1
5.2
.25
.3Av
erag
e C
ash/
Tota
l Ass
ets
.2 .3 .4 .5 .6Average Asset Tangibility
B.1.: Mean Cash Ratios and Asset Tangibility, 1993
ARG
AUS
AUTBEL
BRACAN
CHE
CHLCOL
DEU
DNK
ESP
FIN
FRA GBR
GRC
HKG
IDN
IND
IRL
ISR
ITA
JPN
KOR
MEX
MYS
NLD
NOR
NZL
PAK
PER
PHL
PRT
SGP
SWE
THA
TUR
USA
ZAF
.05
.1.1
5.2
.25
Aver
age
Cas
h/To
tal A
sset
s
.35 .4 .45 .5Average Asset Tangibility
B.2.: Mean Cash Ratios and Asset Tangibility, 1998
ARG
AUS
AUTBEL
BRA
CANCHE
CHLCOL
DEU
DNK
ESP
FINFRAGBR
GRC
HKG
IDN
IND
IRL
ISR
ITA
JPN
KOR
MEX
MYSNLD
NOR
NZL
PAK
PER
PHL
PRT
SGPSWE
THATUR
USA
ZAF
.05
.1.1
5.2
.25
Aver
age
Cas
h/To
tal A
sset
s
.3 .35 .4 .45 .5Average Asset Tangibility
B.3.: Mean Cash Ratios and Asset Tangibility, 2003
ARG
AUS
AUTBELBRACAN
CHE
CHL
COL
DEU
DNK
ESP
FIN
FRAGBR
GRC
HKG
IDN
IND
IRL
ISR
ITA
JPN
KOR
MEX
MYS
NLD
NOR
NZLPAKPER
PHL
PRT
SGP
SWE
THATUR
USA
ZAF
.05
.1.1
5.2
.25
Aver
age
Cas
h/To
tal A
sset
s
.25 .3 .35 .4 .45 .5Average Asset Tangibility
B.4.: Mean Cash Ratios and Asset Tangibility, 2008
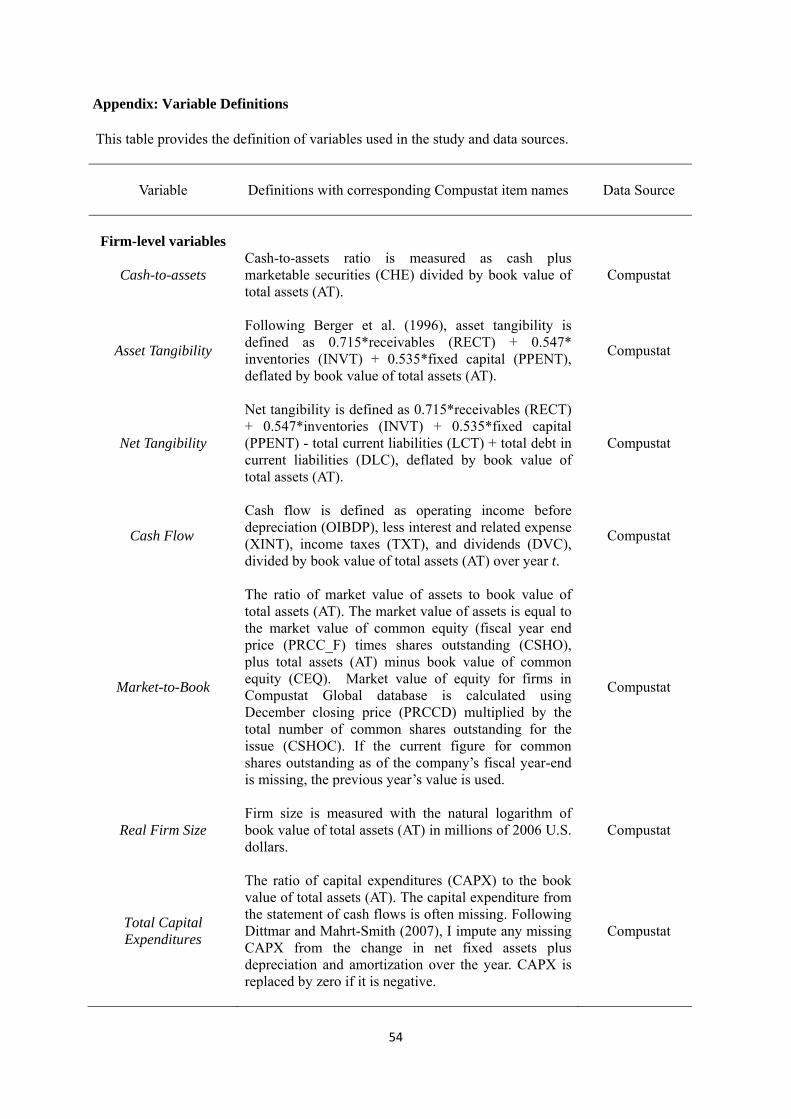
54
Appendix: Variable Definitions This table provides the definition of variables used in the study and data sources.
Variable
Definitions with corresponding Compustat item names
Data Source
Firm-level variables
Cash-to-assets Cash-to-assets ratio is measured as cash plus marketable securities (CHE) divided by book value of total assets (AT).
Compustat
Asset Tangibility
Following Berger et al. (1996), asset tangibility is defined as 0.715*receivables (RECT) + 0.547* inventories (INVT) + 0.535*fixed capital (PPENT), deflated by book value of total assets (AT).
Compustat
Net Tangibility
Net tangibility is defined as 0.715*receivables (RECT) + 0.547*inventories (INVT) + 0.535*fixed capital (PPENT) - total current liabilities (LCT) + total debt in current liabilities (DLC), deflated by book value of total assets (AT).
Compustat
Cash Flow
Cash flow is defined as operating income before depreciation (OIBDP), less interest and related expense (XINT), income taxes (TXT), and dividends (DVC), divided by book value of total assets (AT) over year t.
Compustat
Market-to-Book
The ratio of market value of assets to book value of total assets (AT). The market value of assets is equal to the market value of common equity (fiscal year end price (PRCC_F) times shares outstanding (CSHO), plus total assets (AT) minus book value of common equity (CEQ). Market value of equity for firms in Compustat Global database is calculated using December closing price (PRCCD) multiplied by the total number of common shares outstanding for the issue (CSHOC). If the current figure for common shares outstanding as of the company’s fiscal year-end is missing, the previous year’s value is used.
Compustat
Real Firm Size Firm size is measured with the natural logarithm of book value of total assets (AT) in millions of 2006 U.S. dollars.
Compustat
Total Capital Expenditures
The ratio of capital expenditures (CAPX) to the book value of total assets (AT). The capital expenditure from the statement of cash flows is often missing. Following Dittmar and Mahrt-Smith (2007), I impute any missing CAPX from the change in net fixed assets plus depreciation and amortization over the year. CAPX is replaced by zero if it is negative.
Compustat
55
Total Book Leverage The ratio of long-term debt (DLTT) plus debt in current liabilities (DLC) to total assets (AT).
Compustat
R&D Expenses/Sales The ratio of R&D expenditure (XRD) to sales (SALE). If R&D expenditure is missing, I follow the tradition to set the missing value to zero, over year t.
Compustat
Dividend Payout Dummy
A dummy variable equal to one in years in which a firm pays a common dividend (DVC). Otherwise, the dummy equals zero.
Compustat
Zmijewski’s (1984) Score
-4.336-4.513*Net Income/Total Assets (NI/AT) + 5.679*Total Debt/Total Assets (LT/AT) + 0.004* Current Assets/Current Liabilities (ACT/LCT).
Compustat
Industry-level
variables
Industry Concentration
It is measured by the natural logarithm of asset-based Herfindahl index. Liquidation costs increase as market becomes more concentrated, partly due to fewer potential buyers. The Herfindahl-Hirschman Index is computed as the sum of squared market shares. I use the assets-weighted concentration of a firm’s industry as a proxy for liquidation cost and degree of
competition. , ∑ , , , where , , is the asset share of firm in industry in year , and is the number of firms belonging to industry . Market shares are computed from Compustat using firms’ assets (AT). I first calculate industry concentration for each Fama-French industry classified by the two-digit SIC code for the U.S. in each fiscal year, and I then interpolate the value for firms in other countries.
Authors’ calculations using data
from Compustat
Asset Specificity
The ratio of the book value of machinery and equipment relative to book value of total assets, following the literature (see, e.g., Berger, Ofek, and Swary, 1996; Stromberg, 2001; Acharya, Bharath, and Srinivasan, 2007).
Authors’ calculations using data
from Compustat
Industry Illiquidity
The inverse of median Quick ratio, which is measured as the difference between current assets and inventories, deflated by current liabilities, following Acharya, Bharath, and Srinivasan (2007). I impute the industry illiquidity for firms in other countries by using that for firms in the U.S. Quick ratio measures the ability of a company to use its near cash or quick assets to extinguish or retire its current liabilities immediately.
Authors’ calculations using data
from Compustat
Country-level
variables
Private Credit per GDP
Total amount of credit by deposit money banks and other financial institutions to the private sector, divided by GDP, from 1989 to 2009.
Beck and Demirgüç-Kunt
(2009)
56
Ln(GDP per capita) The natural logarithm of country real gross domestic product per capita in constant 2005 international dollars, PPP adjusted, for the years 1989-2009.
World Bank’s World
Development Indicators (WDI)
database
Creditor Rights Index
An index aggregating four powers of secured lenders in bankruptcy. A score of one is added to the index when a country’s laws and regulations provide each of these powers to secured creditors to arrive at the aggregate creditor rights index: (1) whether there are restrictions imposed, such as creditors’ consent, when a debtor files for reorganization (restrictions on reorganization); (2) whether secured creditors have the ability to seize collateral after the petition for reorganization is approved (no automatic stay or asset freeze); (3) whether secured creditors are ranked first in the distribution of proceeds of liquidating a bankrupt firmas opposed to other creditors such as employees or government (secured creditor paid first); and (4) whether an administrator, rather than the incumbent management, is in control of property pending and responsible for running the business during the reorganization (no management stay). The aggregate creditor rights index ranges from zero to four, with higher values indicating stronger creditor rights. The index measures the ease with which creditors can secure the assets in the event of bankruptcy, and ranges between zero and four as of 2003.
LLSV (1998), and
Djankov, McLeish, and
Shleifer (2007)
Information Sharing
A time-varying indicator variable equals one if either a public registry or a private bureau operates in the country, zero otherwise. Information sharing among creditors about clients’ past (and possible subsequent) indebtedness helps alleviate the costs of information asymmetries, and therefore facilitate lending decisions and promote more lending.
Djankov, McLiesh and
Shleifer (2007)
Enforcement Time
The number of days (deflated by 100) it takes to resolve a dispute counted from the moment the plaintiff files the lawsuit in court until payment is made. This includes both the days when actions take place and the waiting periods between.
World Bank’s 2009 Doing
Business report
Enforcement Costs
The cost of enforcing a contract (including court costs, enforcement costs, and average attorney fees) as a percentage of the claim. It involves in resolving a commercial dispute through the courts and is recorded as a percentage of the claim, assumed to be equivalent to 200% of income per capita. No bribes are recorded. Three types of costs are recorded: court costs, enforcement costs and average attorney fees.
World Bank’s 2009 Doing
Business report
Legal Formalism
Formalism in check collection. Based on extensive surveys of lawyers and judges, DLLS construct
Survey of Lex Mundi/Lex
57
measures on how courts handle two types of cases: collection of a bounced check and eviction of a (nonpaying) tenant. A higher score in either category implies that the court system is slower (more bureaucracy) and less efficient. Although these measures are highly positively correlated across countries, I use the check-based formalism index because the process of collecting a check boils down to enforcement of a financial contract. The index measures substantive and procedural statutory intervention in judicial cases at lower-level civil trial courts, and equals the sum of the following categories (each takes on the value of one or zero): (1) professionals vs. laymen; (2) written vs. oral elements; (3) legal justification; (4) statutory regulation of evidence; (5) control of superior review; (6) engagement formalities; and (7) independent procedural actions. The index measures legal enforcement costs. The more legal formalism, the higher enforcement costs in the courts.
Africa association of law
firms; DLLS (2003).
Judicial Efficiency
An index ranging from zero to ten representing the average of investors' assessments of conditions of the judicial system in each country between 1980-1983 (lower scores represent lower efficiency levels). It is a constructed measure of the efficiency of debt enforcement based on local practitioner’s evaluations of a hypothetical case of a debt default and insolvency.
LLSV (1998)
Liquid Liabilities per GDP
Liquid liabilities of the financial system measured by currency plus demand and interest-bearing liabilities of banks and non-bank financial intermediaries, divided by GDP. It is a measure of financial depth.
IFS, and Beck and
Demirgüç-Kunt (2009)
Commercial-central Bank
DBA(t)/(DBA(t)+CBA(t)), where DBA is assets of deposit money banks (lines 22a-d) and CBA is central bank assets (lines 12 a-d). Ratio of deposit money bank claims on domestic nonfinancial real sector to the sum of deposit money bank and Central Bank claims on domestic nonfinancial real sector. It is an additional measure of financial intermediary development, and is computed as the ratio of commercial bank assets divided by commercial bank plus central bank assets, following King and Levine (1993a, b).
IFS, and Beck and
Demirgüç-Kunt (2009)
Stock Market Development
Ratio of market capitalization over the gross domestic product (GDP).
IFS, and Beck and
Demirgüç-Kunt (2009)
Accounting Standards
A disclosure intensity index created by examining and rating companies’ 1995 annual reports on their inclusion or omission of 90 items. These items fall into seven categories: general information, income statements, balance sheets, funds flow statement,
International Accounting andAuditing Trends,
Center for Financial

58
accounting standards, stock data, and special items. A minimum of 3 companies in each country were studied.
Analysis and Research (CIFAR)