asset part 2
DESCRIPTION
Asset Part 2TRANSCRIPT

19/04/23Adel EL JAZIRI OF/UPR SE
2G ADVANCED UTILISATION

2
Adel EL JAZIRI OF/UPR SE 19/04/23
2G ADVANCED UTILISATION
Day 3 and day 4 a.m
Checking NAP project environment
Best server wizard
Coverage interferences wizard
Analyser (Pixel analyser, height profile, statistics, map view gadget)
1st case study : GSM/DCS coverage
2nd case study : EDGE coverage

3
Adel EL JAZIRI OF/UPR SE 19/04/23
INTRODUCTION
After running Pathloss Predictor, there are three basic routes to the GSM simulation in Multiradio Planner :
GSM Best Server Wizard
Coverage Interference
Static Simulator ( Monte Carlo simulations)
Pathloss Predictions Checking 2G environment
Setting up parameters
Running GSM simulation
Displaying arrays
StatisticsPixel Analyser
4
Adel EL JAZIRI OF/UPR SE 19/04/23
CHECKING 2G ENVIRONMENT

5
Adel EL JAZIRI OF/UPR SE 19/04/23
ARRAY SETTINGS
Use the Array Settings dialog box to define the settings that will influence the arrays you wish to create
To open the Array Settings dialog box: From the arrays menu, click Array Settings
Array Resolution: set the resolution at which coverage arrays will be calculated
If predictions for a cell exist at more than one resolution, the site resolution is used first (if you choose to use it in the next pane), then the array resolution is tried, then the auto-predict resolution
Prediction Loading : choose to use the preferred prediction resolution that is set on the Predictions tab for the site, or always predict at the resolution shown on this tab (which acts as the default resolution in the Array Creation wizard

6
Adel EL JAZIRI OF/UPR SE 19/04/23
ARRAY SETTINGS
If Prediction Radius: set a minimum prediction radius for the arrays If Out of Date Prediction found: set what action you require if an out of
date or missing prediction is found Prompt individually, where you are notified each time an out-of-date
or missing prediction is found, enabling you to include, exclude or auto-predict each individual cell
Always Include any out-of-date predictions in the array Always Exclude any out-of-date predictions from the array Auto-predict, that is, predict automatically whenever an out of date or
missing prediction is found Auto Predict Settings When you have chosen to auto-predict, either
for an individual prediction or all of them, you can choose to use the radius and resolution values shown on the Predictions tab for a site, or specify particular values here instead

7
Adel EL JAZIRI OF/UPR SE 19/04/23
ARRAY SETTINGS

8
Adel EL JAZIRI OF/UPR SE 19/04/23
ARRAY SETTINGS
On the Coverage / Interference tab of the Array Settings dialog box, you can In the Coverage Array Thresholds pane: Set the minimum service level at which a cell is considered to be a serving cell. Neither Coverage nor Interference will be considered below this level
Set the maximum difference in timing between transmission and reception. This effectively defines the maximum radius at which a cell will be considered a best server even if the signal is still sufficient in terms of absolute value
In the Call Parameters pane, choose to activate either: Global Values
if you wish to generically use the Minimum Service-Level and Maximum Timing Advance (as entered on this tab) when creating the array
Sub-cell specific if you wish to specifically use the Signal-Threshold and TA Threshold set for each sub-cell on the General tab of the Site Database when creating the array

9
Adel EL JAZIRI OF/UPR SE 19/04/23
INFLUENCE OF MINIMUM SERVICE LEVEL PARAMETER
This parameter that you can set up in Array Settings, influences the coverage and arrays

10
Adel EL JAZIRI OF/UPR SE 19/04/23
ARRAY SETTINGS
In the Interference, Channel Selection pane: Select what type of interference you want to be considered for the interference arrays, in terms of Co- and/or Adjacent channels
In the Adjacent Channel Offset pane: Set the value for adjacent channel offset which is used to produce the adjacent channel curve used in calculating interference, and also used by the allocation frequencies tool
On the Sim Display Settings tab of the Array Settings dialog box, you can: Select the default array to be output when you run the Coverage : Best Server (signal) or Service Area

11
Adel EL JAZIRI OF/UPR SE 19/04/23
ARRAY SETTINGS

12
Adel EL JAZIRI OF/UPR SE 19/04/23
SETTING THRESHOLDS FOR SIMULATION ARRAYS
On the Sim Display Settings tab of the Array Settings dialog box, you can:
Select the default array to be output when you run the Coverage wizard

13
Adel EL JAZIRI OF/UPR SE 19/04/23
SETTING UP PARAMETERS (ARRAY SETTINGS)

14
Adel EL JAZIRI OF/UPR SE 19/04/23
CONFIGURING GSM SITES AND GSM CELLS
On the Predictions tab for a GSM site select Prediction resolution and Prediction radius
On the Antennas tab for a GSM cell in the Site Database you can:
Add the antennas that are to be available on the cell
Assign antennas to each cell
Configure the feeder type and length
Configure the antenna height, azimuth and mechanical downtilt
On the General tab select Prediction model
On the Predictions tab for a site or for a cell, you can view the available predictions. If no predictions are available, then you can create a prediction by clicking the Predict button
Important : you must assign a sub cell (cell layer) to each cell

15
Adel EL JAZIRI OF/UPR SE 19/04/23
CONFIGURING SITES

16
Adel EL JAZIRI OF/UPR SE 19/04/23
CONFIGURING GSM CELLS

17
Adel EL JAZIRI OF/UPR SE 19/04/23
SETTING THRESHOLDS FOR SIMULATION ARRAYS
On the Sim Display Settings tab of the Array Settings dialog box, you can:
Set a percentage threshold for the 'Coverage Probability OK' array types
Select the default array to be output when you run the Coverage wizard

18
Adel EL JAZIRI OF/UPR SE 19/04/23
BEST SERVER WIZARD

19
Adel EL JAZIRI OF/UPR SE 19/04/23
BEST SERVER WIZARD
Once pathloss predictions have been created, on the Map View you can display the coverage for a single site or cell, or you can create and display a range of arrays which can take into account the coverage from multiple cells
This array displays the signal strength of the best serving cell at each pixel on the Map View. This decision is based on parameters specified in the Site Database window and in the Array Settings dialog box
As with all the arrays, you can change the display settings in the Map View by double-clicking the array in the list of Data types

20
Adel EL JAZIRI OF/UPR SE 19/04/23
BEST SERVER WIZARD To generate the Signal Coverage arrays: Ensure that you have created
predictions for all sites that are to be included. (The Auto-Predict option can do this automatically if it has been enabled in Array Settings
Open a Map View window, and from the arrays menu, point to Signal Coverage and click the required technology. Confirm that you have the correct region to be covered by the array. The Select View button is useful if multiple Map Views are open. Click Next
Tip : You can also run the wizard using the Create arrays button in the Map View window itself. Confirmation of the region to be covered is then unnecessary
Select the filters you want to include and click Next
On the final step: Select the cell layer you wish to include in the-array
Set the resolution of the array. Select whether to favour any site-specific resolutions set on the-Site Database Predictions tab, or to only use the generic resolution(above).
Select which array to display automatically (the other one can be-displayed subsequently) . Click Finish. The data is loaded into memory, enabling you to display the created arrays on the Map View

21
Adel EL JAZIRI OF/UPR SE 19/04/23
LAUCHING BEST SERVER WIZARDor

22
Adel EL JAZIRI OF/UPR SE 19/04/23
BEST SERVER WIZARD

23
Adel EL JAZIRI OF/UPR SE 19/04/23
DISPLAYING ARRAYS ON MAP INFO & CONTROL

24
Adel EL JAZIRI OF/UPR SE 19/04/23
SERVICE AREA ARRAY
25
Adel EL JAZIRI OF/UPR SE 19/04/23
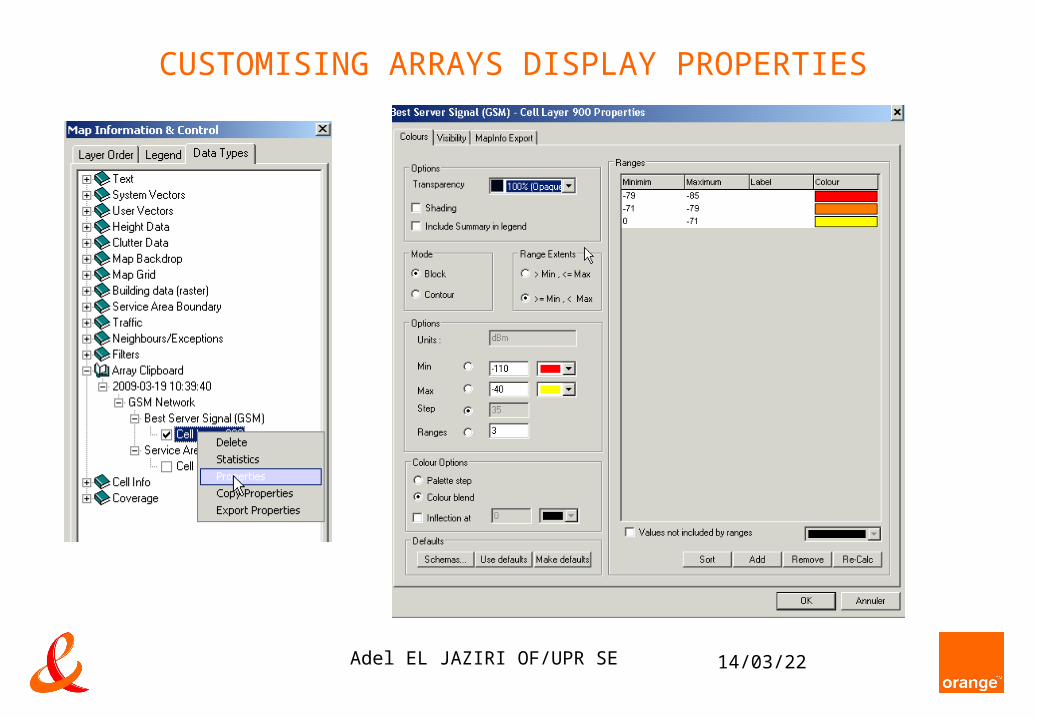
CUSTOMISING ARRAYS DISPLAY PROPERTIES

26
Adel EL JAZIRI OF/UPR SE 19/04/23
SAVING ARRAYS USING MAP INFO&CONTROL (ARRAY CLIPBORD)

27
Adel EL JAZIRI OF/UPR SE 19/04/23
PIXEL ANALYSER

28
Adel EL JAZIRI OF/UPR SE 19/04/23
PIXEL ANALYSER
After you have generated some simulation results, you can use the Pixel Analyser to view information for any selected pixel in the Map View window
By analysing the effects of each cell on a selected pixel, you can improve the network performance
To use the Pixel Analyser: ensure you have some simulation data in memory, either by running a simulation, or from a loaded simulation.
In the Map View window, click one of the Pixel Analyser buttons
The Pixel Analyser window opens. The specified arrays and their values per pixel will be displayed in the first pane, while the available cells per pixel and their values will be displayed in the second pane. To customise the content of the Pixel Analyser window, you can either use the Options menu at the top of the window, or double-click on the relevant pane
When you are satisfied with the options you have set, place the cursor on the Map View, and you will notice a symbol appears
To display the information per pixel in the Pixel Analyser window, either move the cursor (if in Hot Tracking mode) or click on a specific pixel (if in Pixel Select mode)

29
Adel EL JAZIRI OF/UPR SE 19/04/23
PIXEL ANALYSER
In the Pixel Analyser window, the cells and their values per pixel change as you move or click the cursor on the Map View
You can click any of the column headers in the second pane to sort information in ascending or descending order. For example, to find the best server using the Pixel Analyser, sort the cells by the column, which enables you to compare the other cells with the best server
In addition, at the bottom of the Pixel Analyser window, the following useful data is displayed: the pixel location, the height data of that pixel, the clutter type of that pixel, the nearest cell to that pixel

30
Adel EL JAZIRI OF/UPR SE 19/04/23
PIXEL ANALYSER

31
Adel EL JAZIRI OF/UPR SE 19/04/23
CUSTOMISING THE VECTOR ANALYSIS PLOT
You can use the Pixel Analyser to display analysis plots of any vector/polygon chosen from your Map View
To customise the vector analysis plot within the Pixel Analyser: In the Pixel Analyser dialog box, double-click anywhere in the third pane
The Vector Analysis Plot Details dialog box appears. Select one of the radio buttons to choose which covering cell levels along the vector you want to be plotted.
Enter the number of 'Best Values' to take into account (each will display its own coloured plot line)
Enter a Step value for the X axis (this determines the plot intervals along the linear distance of the vector)
Enter Min and Max values for the Y axis
When you have finished, click OK

32
Adel EL JAZIRI OF/UPR SE 19/04/23
ACTIVATING THE VECTOR ANALYSIS PLOT
To activate the vector analysis plot (in the third pane): ensure you have your required vector/polygon displayed in the Map View window
Select the Vector Analysis check box
Click the Select Vector button
On the Map View, use the cursor to select a vector/polygon
When you have selected a vector/polygon, it becomes highlighted, and the symbol appears. You can then either move the cursor (if in Hot Tracking mode) or click on a specific pixel (if in Pixel Select mode) along the vector.
As you move (or click) along the vector, you can see the analysis plots in the third pane of the Pixel Analyser
The display format depends how you chose to customise the analysis plot

33
Adel EL JAZIRI OF/UPR SE 19/04/23
DISPLAYING VECTOR ANALYSIS PLOTS

34
Adel EL JAZIRI OF/UPR SE 19/04/23
HEIGHT PROFILE

35
Adel EL JAZIRI OF/UPR SE 19/04/23
HEIGHT PROFILE
Use the Height Profile window to see a two dimensional cross-section of the terrain between two points (or Properties) on the map
To open a Height Profile window: From the View menu, click Height Profile
In the Height Profile window, click the appropriate button, for example, Property to point
In the Map View window, click the Property (or point) then move the cursor to the desired point (or Property) and click again
The start and finish heights are set by the antenna heights of the selected Property and the global height setting for the mobile antenna (normally 1.7m)
You can select which antenna from the Property is used. To do this, click with the right mouse button on the Property and then double-click the required antenna

36
Adel EL JAZIRI OF/UPR SE 19/04/23
HEIGHT PROFILE

37
Adel EL JAZIRI OF/UPR SE 19/04/23
HEIGHT PROFILE
To display clutter, in the Height Profiler, click the Settings tab, and select the clutter options that you require. You can select to use Clutter Heights,Building Raster Heights, Building Vector Heights, or a combination of these
If you choose Building Vector Heights, click the Select button, and in the dialog box that appears, ensure that the Building Vectors option is selected, and then click OK
After you have created a height profile path, you can look at specific points on it, and instantly see the clearance between the line of sight (and/or the Fresnel zone) and any obstacles below. To do this: in the Height Profile window, click the Location Finder tab
Select the Show Marker check box. A vertical black line appears on the height profile. The Marker Position pane shows the geographical co-ordinates

38
Adel EL JAZIRI OF/UPR SE 19/04/23
ANALYSING ANTENNA TILTS IN THE HEIGHT PROFILE WINDOW
When you are using the Height Profile window to view the profile you can view tilt angles in the Height Profile, display antenna tilts on the Height Profile, calculate the antenna tilt for a specific point on a profile
In the Height Profile window, click the Display Tilt Angle button. The cellular antenna tilt is displayed as a line for each Property
The antenna tilt is only valid if the profile falls within the horizontal 3dB beamwidth of the antenna. If this is the case, the displayed antenna tilt is green. However, whenever the profile falls outside this beamwidth, the displayed antenna tilt becomes red, and the tilt angle in the message bar displays >3dB
Click the Location Finder tab in the Height Profile window, and select Show Marker
On the Map View, move the vertical marker along the profile with your mouse. The calculated tilt angles are displayed on the Location Finder tabfor each end of the profile

39
Adel EL JAZIRI OF/UPR SE 19/04/23
ANALYSING ANTENNA TILTS IN THE HEIGHT PROFILE WINDOW

40
Adel EL JAZIRI OF/UPR SE 19/04/23
STATISTICS

41
Adel EL JAZIRI OF/UPR SE 19/04/23
STATISTICS
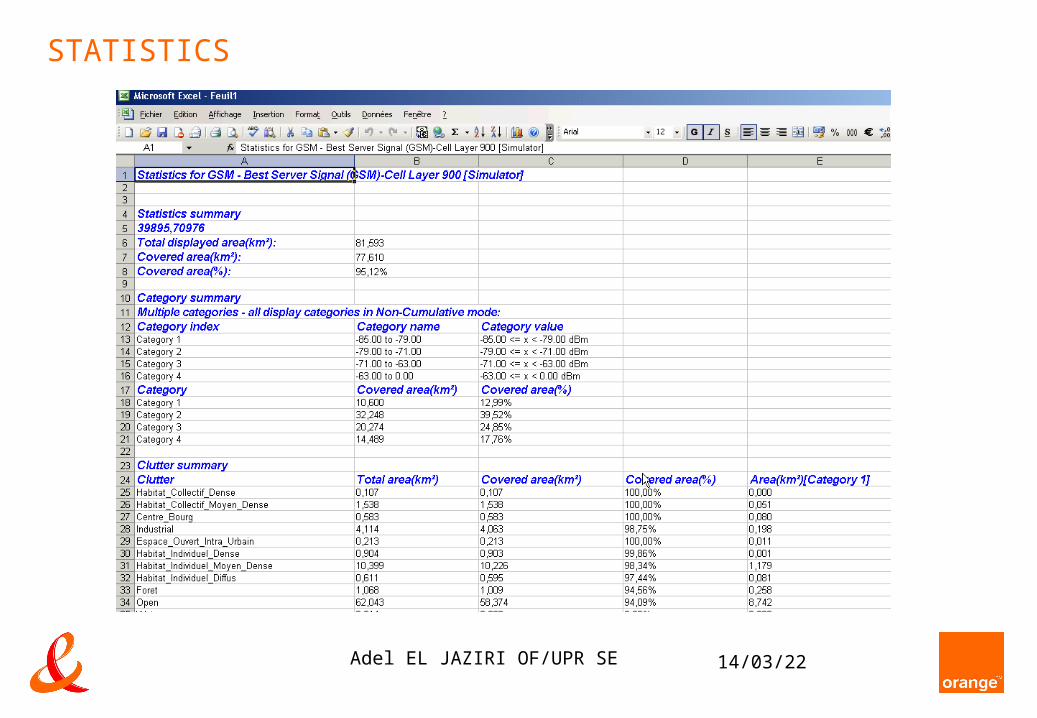
To help with decisions that influence the evolution of the cellular network, MultiRadio Planner provides a comprehensive range of database and statistical reports which can be generated in Microsoft Excel or a Text Editor
Statistical reports : these can only be generated after creating the relevant arrays. They enable you to produce percentage statistics for arrays, both in terms of overall results, and in terms of individual cells, clutter categories and cell coverage areas. Distributional statistics (such as population) can also be incorporated in the results
To create a statistical report for any array: ensure you have created the necessary arrays
Open a Map View (if not already open). Ensure that this includes the area for which you want to generate statistics
Click the Show Data Types button to display the Data Types list, and expand either the Simulator or Coverage heading, as appropriate
Select the required array, click with the right mouse button and then choose Statistics
42
Adel EL JAZIRI OF/UPR SE 19/04/23
STATISTICS
If you want to focus the statistics in a specific area or areas, enable the Restrict Analysis Area check box, and click Select. In the Select Polygon Data dialog box that appears, select one or more of the available polygons, and click OK. You should ensure that the polygon(s) are within the chosen Map View
Note : if you choose not to select polygons, the statistics will be based on the whole area displayed in the current Map View, that is the indicated Total Area value
If you want to report on the amount of area covered, select Area Values
If you want to report on distributional statistics (such as population), select Raster Values, and then browse to the saved traffic raster from which you want these values to be obtained
In the Pixel Criteria Definition pane, choose the categories to base the report on
Click Generate.
In the Reporting dialog box that appears, choose how you would like to view the report
Click OK

43
Adel EL JAZIRI OF/UPR SE 19/04/23
STATISTICS
44
Adel EL JAZIRI OF/UPR SE 19/04/23
STATISTICS

45
Adel EL JAZIRI OF/UPR SE 19/04/23
MANAGING ARRAYS (ARRAY MANAGER)

46
Adel EL JAZIRI OF/UPR SE 19/04/23
MANAGING ARRAYS
In the Array Manager, you can view any array information currently in memory
You can also:
Load arrays
Save arrays
Delete arrays
View the Data Summary of a Simulation
Copy arrays to the array clipboard
Rename clipboard arrays
To open the Array Manager: from the arrays menu, click Array Manager

47
Adel EL JAZIRI OF/UPR SE 19/04/23
MANAGING ARRAYS (SAVING/LOADING ARRAYS)
In the Array Manager, you can save a coverage or interference array To do this: from the arrays menu, click Array Manager Select the array that you want to save Click Save. In the Array File Selector dialog box, browse to the folder in which you
want to save the array file If you have any planning comments that you want to add to the array
header file, double click the Comments field and type your comments in there
Click the Save button In the Array Manager, you can load a coverage or interference array that
you have saved previously. To do this: from the arrays menu, click Array Manager
Click the Load button In the dialog box that appears, locate the *.dat file that contains the
array, and then click Load. The required array is loaded

48
Adel EL JAZIRI OF/UPR SE 19/04/23
ARRAY MANAGER

49
Adel EL JAZIRI OF/UPR SE 19/04/23
COVERAGE INTERFERENCE WIZARD
50
Adel EL JAZIRI OF/UPR SE 19/04/23
ARRAYS SETTINGS
On the Serving and Interfering Cells tab of the Array Settings dialog box, in you can:
select the Use Carrier Layers check box if you want only specific carrier layers to be considered during the creation of coverage or interference arrays, and then select the layers whose contribution you want to include
You can do this for both the serving and interfering signal
Tip : when the main check box is not selected, all carriers layers will be included during array creation

51
Adel EL JAZIRI OF/UPR SE 19/04/23
ARRAY SETTINGS

52
Adel EL JAZIRI OF/UPR SE 19/04/23
DEFINING COVERAGE SCHEMAS You can define your own coverage schemas for each cell layer, and then select
that schema to be used on the Map View
To add a coverage schema for a 2G network (Non-Sim): From the Configuration menu, click Coverage Schemas
Select what type of schema you require. Choose System for a type that other people can view or User to make a schema for your own use only
In the Schema (left side) pane, click Add. Enter a name for the new coverage schema and click OK
In the Coverage Categories (right side) pane, click Add to add a category. In the Label box enter a description, then choose a colour. Click Close to exit the Coverage Schemas dialog box
From the Configuration menu, point to Layers and click Cell Layers. On the Coverage Thresholds tab of the Cell Layers dialog box, select the appropriate coverage schema from the drop-down box and double-click each category to set its signal level
On the Coverage Type tab, choose the C/I Threshold, which dictates the point at which the connection quality begins to suffer

53
Adel EL JAZIRI OF/UPR SE 19/04/23
CREATING COVERAGE SCHEMAS AND DEFINING ARRAYS THRESHOLDS

54
Adel EL JAZIRI OF/UPR SE 19/04/23
CONFIGURING CELL LAYER

55
Adel EL JAZIRI OF/UPR SE 19/04/23
LAUNCHING COVERAGE INTERFERENCE WIZARD To create a Coverage / Interference array: ensure that you have created
predictions for all sites that are to be included
Open a Map View window, then from the arrays menu, point to Coverage/Interference and click Coverage/Interference Wizard. Confirm that you have the correct region to be covered by the array
Choose the type of array(s) you want to create, by selecting the relevant check box(es)
Choose the Filter options for which the array will be generated
Sites to Include in Array Creation In the pane, choose whether to restrict the number of sites that are considered while generating the array to: those that have predictions that overlap the map view or those within a specified distance from the map view extents
In the Array Options pane, choose a resolution for the array, and whether you want to use only this resolution, or first try the resolution specified on the Predictions tab for the site. Click Next
Choose whether to save any array(s) that you create by selecting the Save check box. Click Finish

56
Adel EL JAZIRI OF/UPR SE 19/04/23
LAUNCHING COVERAGE INTERFERENCE WIZARD
or

57
Adel EL JAZIRI OF/UPR SE 19/04/23
COVERAGE INTERFERENCE WIZARD
58
Adel EL JAZIRI OF/UPR SE 19/04/23
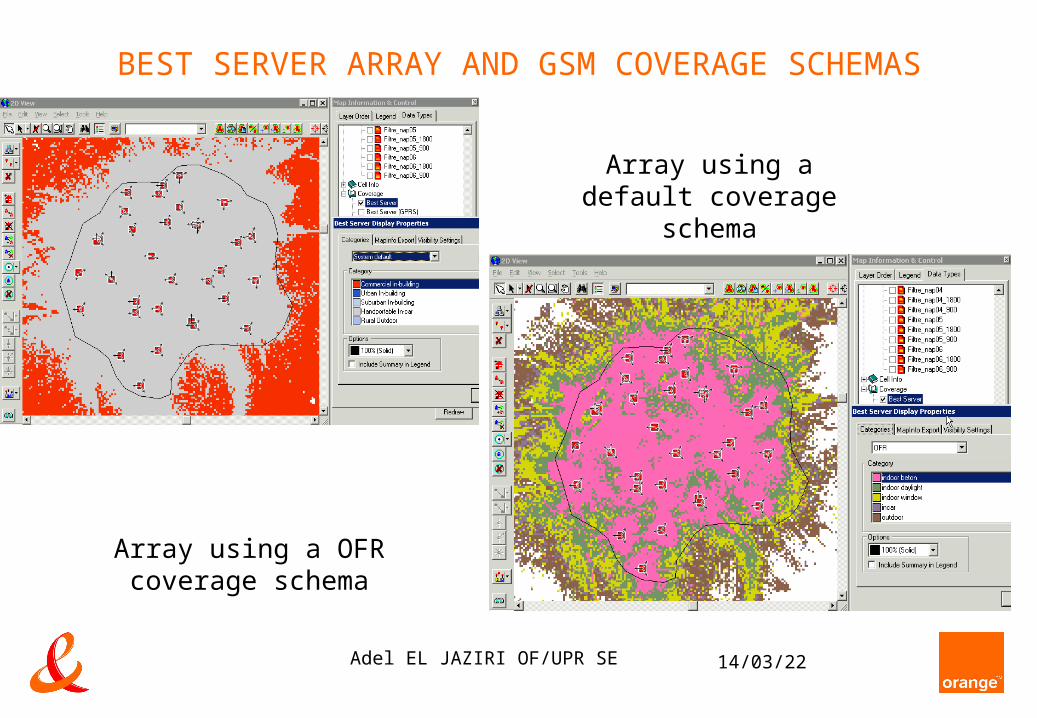
BEST SERVER ARRAY AND GSM COVERAGE SCHEMAS
Array using a default coverage schema
Array using a OFR coverage schema

59
Adel EL JAZIRI OF/UPR SE 19/04/23
ARRAYS DESCRIPTIONS
60
Adel EL JAZIRI OF/UPR SE 19/04/23
INTERFERENCE ARRAYS When creating one of the Interference arrays, MultiRadio Planner requires a
Best Server array in memory Best Server array This array displays the signal strength of the best serving cell at each pixel on
the Map View Worst Interferer array For each pixel, the Worst Interferer Array calculates the C/I per frequency,
summing over all interferers, and selects the frequency with the lowest C/I. It also finds the interferer that causes the most interference on that frequency.
Total Interference array For each pixel, the Total Interference Array calculates the C/I per frequency,
summing over all interferers, and then sums the C/I for each frequency at the serving cell
Service Area Service areas enable you to view the information from the Best Server Signal
array in terms of the geographical areas where each cell is the Best Serving Cell. It uses the same information as the Best Server Signal array, but displays it in a different way

61
Adel EL JAZIRI OF/UPR SE 19/04/23
TOTAL INTERFERENCE ARRAY

62
Adel EL JAZIRI OF/UPR SE 19/04/23
MAP VIEW GADGET
The Map View gadget provides extra pixel specific information, such as percentages or signal strengths
To specify what is displayed:
In the Map View window, from the View menu, select Show Map View Gadgets
Click the button to choose which items to display, then click OK.
The window displays data dynamically as you move the cursor across the Map View

63
Adel EL JAZIRI OF/UPR SE 19/04/23
MAP VIEW GADGET

64
Adel EL JAZIRI OF/UPR SE 19/04/23
INTERFERENCE TABLE
To view an interference table: From the Tools menu, point to Interference Tables and click View Interference Table. The window that appears shows the cell of interest and the cell layer of interest
A list of interfering cells is shown in the Interference Data pane. If you select an interferer in the list, the area of co-channel and adjacent interference is shown and what percentage of the area is affected, if these frequencies were allocated to these cells
When you create an interference table, the probability of interference depends on the C/I of a pixel. The interference table calculates the interference for overlapping areas between two sub-cells. That is, it describes the interference that would result if any two cells were allocated the same or adjacent carriers
You can use a saved interference table to compare different scenarios
65
Adel EL JAZIRI OF/UPR SE 19/04/23
INTERFERENCE TABLE
To create an interference table : ensure you have created a Best Server array as an input to be analysed. Only cells for which coverage is available will be considered when creating the interference table
From the Tools menu, point to Interference Tables and click Interference Table Wizard
Define the area which you want the interference table to be calculated in
Click Next and enter the parameters that you wish to use to define the interference table
Select a filter
Select the calculation method
If you do not select to use traffic data, then the interference table-only gives the effect of interference relative to area

66
Adel EL JAZIRI OF/UPR SE 19/04/23
INTERFERENCE TABLE: IDENTIFYING WORST INTERFERERS

67
Adel EL JAZIRI OF/UPR SE 19/04/23
INTERFERENCE TABLE: IDENTIFYING WORST INTERFERERS

68
Adel EL JAZIRI OF/UPR SE 19/04/23
GSM/DCS COVERAGE (USE CASE 1)

69
Adel EL JAZIRI OF/UPR SE 19/04/23
GSM/DCS COVERAGE (USE CASE 1)
You can create a DCS/GSM coverage. To do this :
Choose sites (4 or 5)
Draw a polygon
Create a filter based on your polygon
Check your environment
Run pathloss Predictor
Run Coverage Interference wizard
Use Map View Gadget, Table Interference
Use Height Profile
Generate statistics

70
Adel EL JAZIRI OF/UPR SE 19/04/23
EDGE COVERAGE (USE CASE 2)

71
Adel EL JAZIRI OF/UPR SE 19/04/23
EDGE COVERAGE ( USE CASE 2)
Enhanced Data Rates for Global Evolution (EDGE) is a technology concentrating on the air interface between the mobile and the base station. Based on a new modulation process, 8 Phase Shift Keying, or 8-PSK
EDGE boosts data speed and capacity per time slot
Let us have a closer look at the link adaptation function. 9 different Modulation and Coding Schemes (MCS1...9) are available for each time slot within EGPRS, chosen after a careful bit error rate measurement of the air interface. In the basic case, a very robust but low rate GMSK modulated 8.8 kbps service is available with MCS1.
In conditions of nearly zero interference, the maximum data rate of 59.2 kbps per timeslot is available with 8-PSK modulation and no additional channel coding for protection
This technology allows data rates of almost 474 kbps per user. On the other hand, EDGE is very bit error sensitive and requires careful planning and a sufficient number of base stations
72
Adel EL JAZIRI OF/UPR SE 19/04/23
EDGE COVERAGE ( USE CASE 2)
For each CCS, a data rate table plots C/I against data rate per timeslot, giving you a graph that you can use to look up the maximum data rate achievable given a C/I measurement
This table is stored in the database
From the Configuration menu, point to Lookup Tables and Curves and click EGPRS MCS
Click Show Graph to see a plot of C/I against data rate per timeslot
Prerequisites for creating (E)GPRS arrays : For this type of array Ensure that you have EGPRS Best Server (GMSK Enabled Modulation) EDGE on all the subcells that are to be included
Created an EGPRS (Best Server array)
Set the Frequency Hopping state of the best serving subcell
Calculated the interference from the current allocation of carriers

73
Adel EL JAZIRI OF/UPR SE 19/04/23
EDITING EDGE CHANNELS CODING SCHEMES

74
Adel EL JAZIRI OF/UPR SE 19/04/23
EDGE COVERAGE (USE CASE 2)
You can create a EDGE coverage. To do this :
Choose sites (4 or 5)
Draw a polygon
Create a filter based on your polygon
Check your environment
Run pathloss Predictor
Run Coverage Interference wizard
Use Map View Gadget, Table Interference
Use Height Profile
Generate statistics

75
Adel EL JAZIRI OF/UPR SE 19/04/23
EDGE COVERAGE