assessment of outreach and benefits of national …
TRANSCRIPT

ASSESSMENT OF OUTREACH AND BENEFITS OF NATIONAL RURAL EMPLOYMENT
GUARANTEE SCHEME OF INDIA
Abusaleh Shariff*
NREGA, an ambitious mass employment guarantee scheme implemented since the last four years, intends to sustain income and consumption in Indian rural outback. A large programme, backed by budgetary allocation promises 100 days of manual work to households who register and apply. Failure to provide employment through the gram sabhas creates cash entitlements as a matter of law. This paper analyses official statistics and survey data from seven northern states. The future of NREGA is strongly linked to the cherished national goal to strengthen and broadbase decentralisation of local governance. But there are wide variations amongst the states not only in the level of decentralisation but also in the capacity to implement such a large scheme and lack of convergence amongst relevant government departments and functionaries. NREGA has the potential to address both sustenance of income and enhance the social welfare of households in rural areas.
I. INTRODUCTION
India’s National Rural Employment Guarantee Act or Scheme (NREGA, also NREGS) is being implemented since the last four years, with the multiple objectives of sustaining income and consumption through wage works, creating durable assets and empowering rural communities through the backing of law. The rural mass public works programmes (PWPs) are programmatic efforts to generate non-farm employment so as to sustain incomes and consumption, especially during conditions of distress such as those caused by drought, natural disasters, market failure in distribution of food items, and so on (Sen, 1981; Dreze, 1990). The importance of direct policy and programme action for employment generation ensuring food security to the poor, replacing food subsidy strategies in the developing economics has been compulsively argued by von Braun, 1995. This paper reviews the functioning of NREGA over the years and also analyses data from formal sources, sample surveys and qualitative village studies in selected states in India. In spite of NREGA being an open-to-all programme, its outreach and coverage are low. An econometric analysis of survey data suggests that occupational and gender identities do influence access to a wage employment
The Indian Journal of Labour Economics, Vol. 52, No. 2, 2009
* The author is with the International Food Policy Research Institute, New Delhi. email: [email protected]. He would like to thank Anushree Sinha for data access, and P.M. Kulkarni and Anil B. Deolalikar for their excellent comments. He would also like to acknowledge research support provided by B.L. Joshi, Anjor Bhaskar, Devendra Kumar, Prabir Ghosh, Umme Sadiqha and Jaya Koti. The comments received at a conference organised by the Institute for Human Development (IHD) and Centre De Science Humaines, New Delhi, were enriching. He is also thankful to the referees of the Journal for their useful comments. The usual disclaimers apply.

244 ThE INDIAN JouRNAL of LABouR EcoNomIcS
programme, yet even the well-off within the local context tend to enrol and seek manual wage employment across selected states. Thus, the most deprived such as households reporting acute food scarcity and distress migration are not able to reap the benefits of NREGA.
This paper is divided into five sections. Section II introduces the scheme while Section III evaluates the available official data up to 2007-08. Section IV analyses a set of data from 16 deprived districts of 7 states in the northern part of India. A synthesis of qualitative village studies is part of this section. Section V summarises the paper, lists issues that need further research and draws relevant conclusions.
II. NREGA—A STEP TOWARDS INCLUSIVE DEVELOPMENT
1. Guiding Principles Leading to the Enactment of the NREG Act
While the NREG Act itself does not refer to or lay down any specific guiding principles, the debates around it refer to two experiences: (a) a fairly successful and people appreciated, the maharashtra Employment Guarantee Scheme (mEGS), and (b) the harsh experience of the 1942-45 Bengal famine, which was exacerbated by both an inefficient administrative response as well as market failure in food distribution. A deeper understanding of the dynamics of the famine highlighted how the lack of employment and earning opportunities lead to impoverishment, debilitation and death. The classic exposition of the ‘entitlement approach’ to the analysis of hunger and deprivation points to such a possibility during natural calamities as well (Sen, 1981; 1986). The entitlement approach focuses on the ability of a person to acquire food and other relevant commodities within the prevailing economic, social and legal arrangements. Public employment provisioning as a policy response to alleviate such deprivations has become an obvious policy choice in recent years. Policy-driven investment in PWPs has been in vogue since a long time and has also strengthened the foundations for mixed economies through externality gains caused by the emergence of manufacturing and business activities. Note that this approach does not consider direct food subsidy to the vulnerable—a prudent strategy which is reflected in India’s long-time experiments with innumerable PWPs often tied with food supplies (more on this is discussed below). It is useful to recollect the limitations of the direct food subsidy policies that were documented by Pinstrup–Andersen in 1993. further, mass programmes yield better results when the communities are adequately empowered so as to seek participation in the programmes (Streeten, 2002; Weinberger, 2000; Krishna, 2001; 2006).
2. The Scheme
The National Rural Employment Guarantee Scheme (NREGS),1 initiated in 2005, has received priority policy attention in India’s Eleventh Five Year Plan (2007-12), under the broader objective of Bharat Nirman2 aiming for the resurgence of rural India. As mentioned above, NREGS is based on the positive experiences of reducing human distress over the past three decades, beginning with the early 1970s in rural Maharashtra (see Moore and Jadhav, 2006; Dev, 1995; Dev, et al., 2004). The civil society and activists working for the welfare of the poor provided the much-needed persistence, which is normally needed to
ASSESSmENT of ouTREAch AND BENEfITS of NREGS 245
influence a policy. NREGS, India’s public works programme is unique, being large in size3, and intended to cover long periods, disburse huge funds and be dynamically responsive to climatic and rainfall conditions, and above all open to anyone intending to work at wage rates that are often lower than the prevailing causal wages in local areas. Since the programme is designed to self-target the needy, besides chronic poverty manifested, for example, in food inadequacy, it also intends to address idiosyncratic risks and shocks faced by other households (Schedule II of NREGA, 2005).
Although India has always resorted to large universal programmes such as the Public Distribution System (PDS), the Integrated child Development Services (IcDS) and a plethora of employment programmes, the NREGA is radical as it guarantees 100 days of wage work on demand, failing which the claimants can legally demand cash compensation. The Act promotes the seeking of paid employment on the volition of at least one member from any household in manual rural works. The scope for self-selection of those who indeed require imminent income support for livelihood is an innovation, which should result in a high degree of automatically targeting the most deprived—thus reflecting its potential for poverty reduction. This scheme can attract the attention of the otherwise unemployed or under-employed workforce because of immediate income (cash) transfer opportunities, which is an inbuilt short-term relief objective. What Indian policy has recognised is that such Keynesian style expenditures on public works can be important normally, even in the absence of price or income shocks, so as to smoothen and sustain seasonal fluctuations in labour demand and, therefore, wage rates in rural areas wherein rainfall patterns and insufficient irrigation preclude year-round crop cultivation.4 The Act also aims at “the generation of productive assets, protecting the environment, empowering rural women, reducing rural–urban migration and fostering social equity, among others”. NREGA, if implemented with due earnest, has the potential of not only reducing vulnerability and relieving chronic income deprivation and improving rural livelihood security but also of the construction of durable assets and markets in rural areas. The Act envisages free entry and exit into the NREGA, but has made it mandatory to follow a ‘two-step’ procedure. The first step is that all households intending to work on NREGA have to ‘register’ and show an expression of interest with the Gram Sabha/Panchayat, followed by the second step of making a written application for actual work.
The NREGS is still in its formative stage of implementation; therefore, a comprehensive assessment has not been attempted so far. While the local level functionaries and the panchayat need to work in tandem to successfully implement NREGA, often the over-riding influence and interference occurs from the local contractor, who is often a politician or has political patronage. While the local civil society institutions are generally non-existent, even if they do exist, they have been unable to penetrate the collusion between the bureaucracy and contractors. This micro-local level operative space is the one that needs a thorough study and one would find large variability across time and space with respect to these dynamic relationships.
The programme’s multiple objectives can be summarised as: generating ‘employment’ and creating ‘physical assets/infrastructure’. The balancing act between the two is difficult since the former can potentially take precedence over the other. Balancing the objectives of

246 ThE INDIAN JouRNAL of LABouR EcoNomIcS
the programme necessitates large organisational skills, and the proximate involvement and commitment of the local level functionaries. In contemporary India, such public functionaries are not available and the execution of public works has always been dependent upon private contractors, who can engineer shifts in focus, for example, by making the employment programme more of a normal/regular construction project, and NREGA cannot be an exception to this trend unless adequate safeguards are enforced.
3. Budgetary Allocations
The Budget of 2009-10 has allocated Rs. 39,000 crores or about 0.66 per cent of the GDP for the NREGA, but the entire allocated amount may not be spent, as has been the case during the previous three years. The actual allocations for 2006-07 (the first year of implementation of NREGA) was a meagre Rs. 12,000 crores, of which only Rs. 8,823 crores (uS$ 2.2 billion) was actually spent in 200 selected districts. The coverage in terms of the number of districts was enhanced by an additional 130 in 2007-08 and in 2008-09, all the 610 districts were covered, yet the total allocation of funds was only Rs. 16,000 crores. Although Rs. 20,000 crores was available for 2008-09, it is still only about one half of the original amount estimated. This shows a tardy and troubled implementation of the programme; while NREGA is a ‘centrally sponsored scheme’, administratively managed by the ministry of Rural Development, its implementation is exclusively done by the respective state governments. The states are expected to systematically make a claim over the allocated resources by planning NREGA work activities and turning them into projects. An accumulation of such projects is used to appropriate funds from the scheme resources earmarked through a budgetary process. Often, the states are unable to execute the programme efficiently due to the shortage of administrative and implementing personnel at the grassroots and sometimes due to inter-party political differentials, if the party in power in the concerned state is different from the one ruling the central Government.
The funding of NREGA has been carved out by amalgamating all past programmes and it still constitutes just about one-third of the annual budgetary allocation of the Department of Rural Development, Government of India. .. NREGA stipulates that the respective states have to contribute 25 per cent of the cost of wages and materials used during the programme implementation. The maharashtra EGS, for about the last three decades, followed a different funding model entirely supported by the state legislative body, which continued to raise its (the state’s) share of funds for NREGA by imposing (state) tax specifically for this purpose (Deolalikar, 1995).5 Whether the current NREGA cost sharing between the centre and the states is feasible or not depends upon a number of factors including the state level political will, public demand, and the fiscal prudence of the state governments. At the national level, NREGA allocations and expenditures hover between 2-3 per cent of the central (revenue account) outlays for the past three years. Any further expansion of NREGA in terms of a deepening of the programme need not be a cause for concern with respect to its adverse impact on the national level fiscal deficits, even if no additional tax or levy in the name of NREGA is imposed. Due to the economic slowdown during the last two quarters of the

ASSESSmENT of ouTREAch AND BENEfITS of NREGS 247
financial year 2008-09 and its expected continuation through 2009-10, one expects a strain on the fiscal deficit and therefore on NREGA allocations as well.
III. STATE LEVEL PERFORMANCE OF NREGA
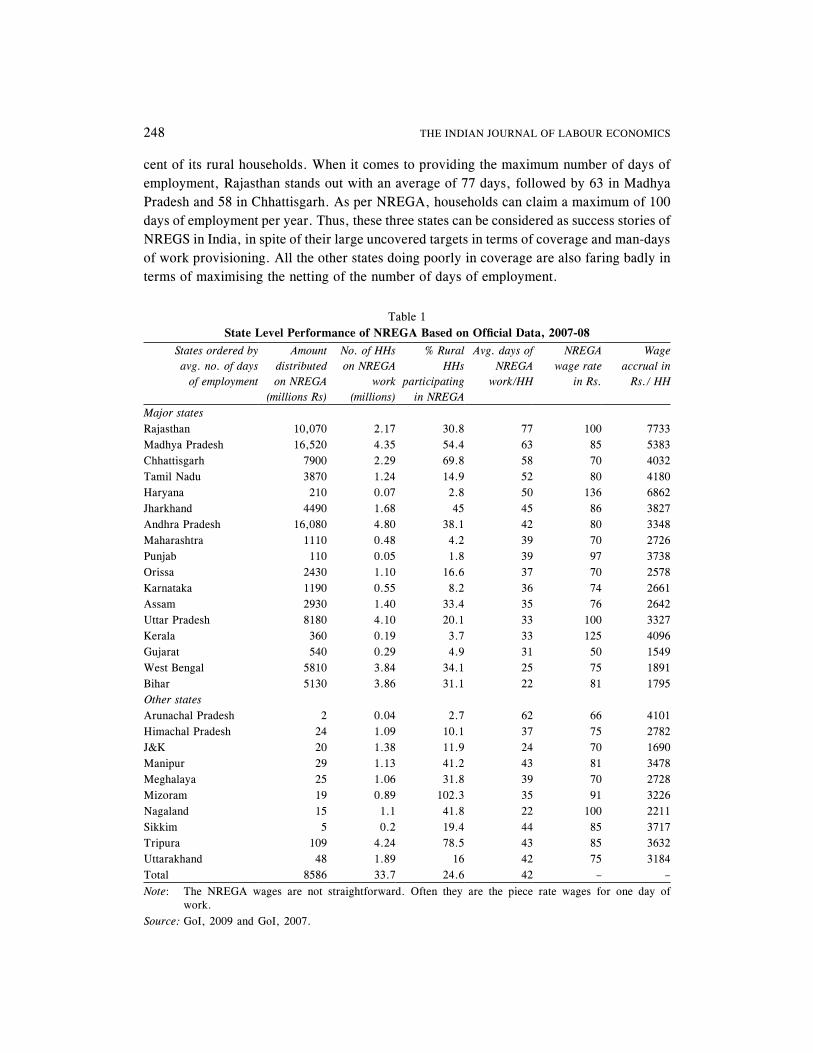
The national level ministry and associated State Departments of Rural Development are responsible for implementing NREGS across the entire country. This ministry updates the progress of implementation of NREGS on its website twice a year on the basis of data provided by the states. In the following section, the data extracted from this source is used to assess the progress of the NREGS for the year 2007-08.6 Accordingly, overall 33.7 million households were provided with 1.43 billion man-days of employment under NREGS and received close to Rs. 86 billion during 2007-08 (see Table 1). These absolute numbers suggest a vibrant and highly efficient programme implementation and match the stated policy and the targets. The following discussion intends to highlight the relatively better performing states in terms of implementation of NREGA and link it to levels of backwardness or incidences of poverty. overall, Rajasthan, madhya Pradesh and chhattisgarh stand out as the better performing states, both in terms of having a better coverage and creating a relatively larger number of days of employment per household, thus facilitating better netting of wage income. While many other states are poor performers, the worst are Bihar, uttar Pradesh, orissa and Jharkhand, which harbour a large number of the poor but do not utilise the opportunities created by NREGA to extend benefits to the needy. The state level progress for the year 2007-08 is discussed below, by using four parameters, namely the percentage of households covered under NREGS, the number of NREGA employment days, the total state level NREGA expenditures and the average wage accruals per household. Note that this analysis is based on routine ‘service statistics’ made available by the ministry of Rural Development and not elicited directly from the beneficiaries through a survey.
1. Coverage and Number of Days of Employment
Given the large variation in the size of the states, it is useful to discuss NREGA coverage in terms of the proportion of households enrolled in the scheme. This can be further matched with the state of household level poverty but such a matching is difficult to undertake without unit level data, yet the size of the coverage can be linked with the aggregate poverty rates officially estimated at the national level.7 The states that claim to have covered more than 50 per cent of the households are chhattisgarh and madhya Pradesh, with both of them having poverty rates that are much higher than the national average; followed by Bihar and Jharkhand, with over 30 per cent coverage but very high levels of poverty (see Table 1). other states achieving above 30 per cent coverage are West Bengal, Rajasthan, Assam and Andhra Pradesh, with moderate to low levels of rural poverty. on the other hand, states achieving meagre NREGA coverage are not only Punjab and haryana, with very low levels of rural poverty; but also Gujarat, Kerala and maharashtra, with less than 5 per cent coverage, and Karnataka with 8 per cent, but with moderate levels of poverty prevalence. uttar Pradesh, with fairly high levels of poverty, has extended NREGS to only about 20 per
248 ThE INDIAN JouRNAL of LABouR EcoNomIcS
Table 1State Level Performance of NREGA Based on Official Data, 2007-08
States ordered by avg. no. of days
of employment
Amount distributed on NREGA
(millions Rs)
No. of HHs on NREGA
work (millions)
% Rural HHs
participating in NREGA
Avg. days of NREGA
work/HH
NREGA wage rate
in Rs.
Wage accrual in
Rs./ HH
Major statesRajasthan 10,070 2.17 30.8 77 100 7733madhya Pradesh 16,520 4.35 54.4 63 85 5383chhattisgarh 7900 2.29 69.8 58 70 4032Tamil Nadu 3870 1.24 14.9 52 80 4180haryana 210 0.07 2.8 50 136 6862Jharkhand 4490 1.68 45 45 86 3827Andhra Pradesh 16,080 4.80 38.1 42 80 3348maharashtra 1110 0.48 4.2 39 70 2726Punjab 110 0.05 1.8 39 97 3738orissa 2430 1.10 16.6 37 70 2578Karnataka 1190 0.55 8.2 36 74 2661Assam 2930 1.40 33.4 35 76 2642uttar Pradesh 8180 4.10 20.1 33 100 3327Kerala 360 0.19 3.7 33 125 4096Gujarat 540 0.29 4.9 31 50 1549West Bengal 5810 3.84 34.1 25 75 1891Bihar 5130 3.86 31.1 22 81 1795Other statesArunachal Pradesh 2 0.04 2.7 62 66 4101himachal Pradesh 24 1.09 10.1 37 75 2782J&K 20 1.38 11.9 24 70 1690manipur 29 1.13 41.2 43 81 3478meghalaya 25 1.06 31.8 39 70 2728mizoram 19 0.89 102.3 35 91 3226Nagaland 15 1.1 41.8 22 100 2211Sikkim 5 0.2 19.4 44 85 3717Tripura 109 4.24 78.5 43 85 3632uttarakhand 48 1.89 16 42 75 3184Total 8586 33.7 24.6 42 – –Note: The NREGA wages are not straightforward. often they are the piece rate wages for one day of
work.Source: GoI, 2009 and GoI, 2007.
cent of its rural households. When it comes to providing the maximum number of days of employment, Rajasthan stands out with an average of 77 days, followed by 63 in Madhya Pradesh and 58 in chhattisgarh. As per NREGA, households can claim a maximum of 100 days of employment per year. Thus, these three states can be considered as success stories of NREGS in India, in spite of their large uncovered targets in terms of coverage and man-days of work provisioning. All the other states doing poorly in coverage are also faring badly in terms of maximising the netting of the number of days of employment.

ASSESSmENT of ouTREAch AND BENEfITS of NREGS 249
2. State Expenditures and Household Wage Accruals
A look at the total expenditures suggests that madhya Pradesh, Andhra Pradesh and Rajasthan have distributed Rs. 10-17 billion8 as wage payments followed by uttar Pradesh, chhattisgarh, West Bengal and Bihar, with the utilised amounts ranging between Rs. 5 and 10 billion each. Notwithstanding a considerable variation in NREGS wage (see more on this below),9 which ranges between the high levels of Rs. 136 in haryana, Rs. 125 in Kerala, and Rs. 100 in Rajasthan and Uttar Pradesh each, and a low of just over Rs. 70 in many of the remaining states; the average accruals per household has been the highest at Rs. 7733 in Rajasthan (with 31 per cent of the households being covered), Rs. 6862 in haryana (but with only 2.8 per cent of the households covered), Rs. 5383 in madhya Pradesh (with 54 per cent of the households covered) and Rs. 4032 in Chhattisgarh (with 70 per cent of the households covered). The amount of wage accruals is a meagre Rs. 1795 in Bihar, Rs. 1549 in Gujarat, Rs. 1981 in West Bengal, Rs. 2726 in Maharashtra (all with low coverage), and Rs. 3327 in Uttar Pradesh (covering 20 per cent of the households). Three states, namely, madhya Pradesh, Rajasthan and chhattisgarh, again stand out in terms of the annual size of wage accruals; followed by Andhra Pradesh and Jharkhand. The two relatively backward states that are not performing well are Bihar and uttar Pradesh.
3. NREGA Wage Rates
The ideal that NREGS should serve the deprived and the poor through a self-selection mechanism was based on the belief that the programme wages will provide adequate motivation to people who intend to work but do not have access to work in the local economy. Besides, the amounts of the daily wage should be just about the level of the reservation wage of deprived households. The idea was that NREGA wages should not be too high or too low, but such that the poor, when they intend to do so, can seek such employment that is available on demand. Labourers are entitled to the statutory minimum wage applicable to agricultural workers in the state, unless the central Government ‘over-rides’ this by notifying a different wage rate. If the Central Government notifies a wage rate, it is subject to a minimum of Rs. 60 per day for 2005-06 (Section 6 of the Act), and the wage amount during 2006-07 and 2007-08 has been higher at Rs. 70.
One, however, finds wide variations across states with respect to the actual prevailing casual wages, which appear to be based on the demand and supply factors regulating labour in the micro-regions such as a district or block (see Table 2). Although each state is free to frame its own ‘scheme’, it has to follow certain basic features that are listed in Schedule I of the Act, which specifies the type of works to be undertaken, the wage rates and minimum facilities that are to be provided at the worksite. further, the state scheme is expected to follow the operational guidelines issued by the ministry of Rural Development at the national level in January 2006. For the year 2007-08, it was found that many states fixed their own NREGA wages, which were considerably higher than the Rs. 70 fixed as the minimum wage. These states are haryana, Kerala, Rajasthan and uttarakhand, with wage rates of Rs. 100 or more. of these, Kerala and haryana also have high levels of regular daily causal wages

250 ThE INDIAN JouRNAL of LABouR EcoNomIcS
and, therefore, the need to fix higher NREGA wages. But in the case of Rajasthan and Uttarakhand, though there does not seem to be such a need, yet the NREGA wage is fixed at Rs. 100, which seems a good enough reason to explain why the NREGA performance is relatively better in these two states as compared with the former two.
In two other states where the NREGS seems to be working well, madhya Pradesh, and to some extent, Orissa, the NREGA wages of Rs. 85 and Rs. 70, respectively, are much higher than the prevailing daily causal wage rates in the respective states. This difference is much larger in madhya Pradesh—the NREGS wage is almost double of the prevailing state level average casual male wage rates. The case of Bihar, Andhra Pradesh, maharashtra
Table 2
NREGA Wage Rates as Compared to Casual Wages, 2007-08State NREGA wage
(Rs.)Wage rate (Rs.) for casual labor (2007)
NREGA wages as % to casual wage
Men Women Men WomenMajor statesRajasthan 100 78 72 1.28 1.40madhya Pradesh 85 42 35 2.04 2.40chhattisgarh 70 – – – –Tamil Nadu 85 – – – –haryana 136 102 93 1.33 1.46Jharkhand 86 – – – –Andhra Pradesh 80 61 45 1.31 1.79maharashtra 70 58 36 1.22 1.94Punjab 97 101 – 0.96orissa 70 57 46 1.23 1.51Karnataka 74 51 37 1.46 1.98Assam 76 74 52 1.03 1.45uttar Pradesh 85 90 – 0.94 –Kerala 125 172 130 0.73 0.96Gujarat 50 57 54 0.88 0.93West Bengal 75 – – – –Bihar 81 59 51 1.37 1.57Other stateshimachal Pradesh 75 115 – 0.65 –Jammu & Kashmir 70 112 – 0.62 –uttarakhand 100 68 56 1.47 1.78Arunachal Pradesh 75 62 54 1.22 1.40manipur 66 – – – –meghalaya 81 53 48 1.51 1.68mizoram 70 79 48 0.88 1.47Nagaland 91 – – – –Sikkim 100 – – – –Tripura 80 86 63 0.93 1.26Source: Official NREGA Reports from http://nrega.nic.in/. NREGA wages are the average amounts paid often
for a specified amount of work during the day fixed on the basis of the piece rate. The daily casual rates reported are also averages of a number of daily wage rates given for manual agricultural work, which often varies depending upon the nature of the work and the micro–region within a district.

ASSESSmENT of ouTREAch AND BENEfITS of NREGS 251
and Karnataka is different. The NREGA wages in these states are reasonable at around Rs. 70 to Rs. 80, and the respective normal wage rates are still lower. Therefore, if NREGS is implemented properly, these states will show a huge demand for NREGA employment, but this does not seem to be the case except in Andhra Pradesh.
4. NREGA Infrastructure Focus
As mentioned elsewhere in this paper, Schedule I of the Act lists eight categories of tasks that are designed to be “the focus of the Scheme”. Practically all of them relate to water-based tasks such as ‘water conservation and harvesting’, ‘drought proofing/afforestation, ‘micro and minor irrigation works’; ‘renovation of traditional water bodies also know as de-silting and ‘flood control’. Rural connectivity is a land-based activity and in addition, a residual that ‘any other work that may be notified by the Central Government in consultation with the State Government’. All such tasks are labour-intensive; therefore, there is a 60:40 ratio of labour to material inputs, which is strictly enforced so as to ensure larger wage transfers through NREGA works.
In order to facilitate a reasonable assessment of the quality of assets created and associated benefits to the people, a programme needs to be functioning for a reasonable time span. further, most of the states are unable to provide data on asset formulations during the last three phases of NREGS. It is argued that operational dilemmas due to programmatic interventions in water and land make cost-benefit analysis somewhat difficult. Further, an assessment also needs to be made in the natural resources framework, especially factoring shadow prices as well as alternative investment strategies in assessment. under such circumstances, synergy with other rural development tasks and strategies to protect natural resources can be factored into the programme.
Low employment intensity in works, leakages due to mismanagement by labour contractors and over-use of machinery are some of the problems leading to non-existent or low quality assets. The NREGA strict rule of a 60:40 ratio can also lead to assets that are normally of low durability and could lead to a situation wherein the same asset is created over and over again due to poor quality work. Although the strict ratio rule is understandable for creating works that generate large wage employment, durable asset creation can be achieved by creating synergies with other developmental programmes and their associated allocation. The need to establish durable asset formations could be within the framework of the ‘watershed development’ programme, for example, or even the minor road construction activities through departmental synergies in works and projects. The associated information includes the average size of a ‘work project’ that has worked out to be only 22 households (see Table 3), with the exception of Tamil Nadu, West Bengal and Bihar, wherein the number of households per project is somewhat large, but as we have seen earlier, overall they are poorly performing states. The average sizes of a project in the better performing states of Rajasthan and chhattisgarh are reasonable at about 44 and 31, respectively, whereas the size is just about 10-15 for the other relatively better performing states of madhya Pradesh and Andhra Pradesh.

252 ThE INDIAN JouRNAL of LABouR EcoNomIcS
Another factor that carries a substantial weight in assessing the benefits through the asset is the question of who benefits from NREGA works, and whose land and properties are developed or protected. Whether the assets generated produce substantial public good or lead to discrete private gain is a substantial issue that needs to be documented as a matter of routine in NREGA. The Act nonetheless allows that the employment scheme can undertake land improvement activities on holdings owned by the Scs and STs, but it is difficult to assess if such a programme focus is actually put in place. There is also a proposal to do away with the limit of 100 days of employment per households in districts that are dominated by the Scs and STs, which can help these communities access a higher number of employment days.
Table 3 Share of ‘Works’* by Type of Asset/Activity, 2006-08
States Rural connectivity
Flood control
Water conser-vation
Drought proofing
Minor irrigation
Traditional water
bodies
Total work
projects
No. of HHs per work**
Major statesRajasthan 23.7 2.0 51.0 4.1 3.1 16.2 31,559 44.0madhya Pradesh 30.0 0.8 36.3 20.3 6.8 5.8 1,07,205 15.0chhattisgarh 41.0 1.0 18.0 16.3 6.4 17.2 35,092 31.0Tamil Nadu 17.5 0.5 17.7 0.0 19.1 45.2 13,532 84.0haryana 34.5 4.3 24.8 10.5 10.7 15.1 1822 28.0Jharkhand 26.0 1.1 62.3 2.9 2.9 4.8 79,257 16.0Andhra Pradesh 1.3 1.8 57.7 17.3 9.9 12.0 2,47,982 10.0maharashtra 17.8 1.0 41.5 28.0 0.2 11.5 7570 35.0Punjab 26.8 5.4 2.7 15.9 0.0 49.2 1320 23.0orissa 31.1 0.8 55.0 1.9 2.7 8.5 48,479 22.0Karnataka 23.8 4.8 40.1 18.0 4.5 8.8 14,413 23.0Assam 42.7 16.2 14.4 8.2 14.1 4.5 6138 21.0uttar Pradesh 47.2 4.9 16.7 13.3 3.0 15.0 91,098 29.0Kerala 6.4 27.6 32.8 3.4 12.2 17.6 6958 12.0Gujarat 11.7 2.3 56.2 25.5 0.0 4.4 15,599 35.0West Bengal 32.6 10.8 16.6 21.4 5.9 12.7 49,807 51.0Bihar 43.7 6.4 27.4 4.0 6.6 11.9 51,050 84.0Other states himachal Pradesh 66.5 10.0 8.7 2.2 9.1 3.5 12,929 10.0 J&K 34.2 35.4 14.6 3.1 9.7 3.0 3317 43.0 uttarakhand 6.1 20.7 37.9 16.6 12.2 6.5 6347 18.0 manipur 64.2 3.7 7.5 19.7 4.6 0.4 1097 25.0 meghalaya 35.1 2.5 20.5 21.3 5.4 15.1 3928 27.0 mizoram 100.0 0.0 0.0 0.0 0.0 0.0 232 128.0 Nagaland 74.7 7.1 5.1 0.0 8.1 5.1 99 178.0 Sikkim 37.5 40.2 3.1 1.1 11.9 6.1 261 32.0 Tripura 42.4 4.1 5.9 7.9 13.9 25.8 14,942 11.0 Total 24.2 3.5 40.8 13.3 6.8 11.5 8,52,033 22.0Note: *Work is defined here as a work project which is a specified bundle of work assignment. **The averages for 2006–07 and 2007–08 are obtained by dividing the number of households provided
with jobs with the number of works.Source: Official NREGA Reports.

ASSESSmENT of ouTREAch AND BENEfITS of NREGS 253
IV. EMPIRICAL ANALYSIS OF DETERMINANTS OF NREGA USERS
In this section, a rare data set is analysed, which helps in understanding the various aspects of outreach of the scheme and also in assessing characteristics that favour its utilisation. In early 2008, the UNDP initiated a study to find out the perceptions of the under-privileged regarding government’s safety net programmes in 16 selected most deprived (backward) districts in Bihar, chhattisgarh, Jharkhand, madhya Pradesh, orissa, Rajasthan and uttar Pradesh. The study surveyed 200 households selected from 5 different villages of the districts and all the households were so identified so as to facilitate their classification as marginal and deprived. Such an identification profile was created by using a combination of social (caste, education) and economic criteria. Thus, all the 200 selected households were eligible to be enrolled into the NREGS in the respective districts and also to receive 100 days of employment during a reference year.
1. Outreach, Enrolment and Number of Employment Days in Selected Districts3
While a highly focused and pan-Indian assessment of NREGS is still due, a set of survey data from 7 states and 16 districts located in northern India are analysed and discussed below (NcAER, 2008).10 Data available from published sources (Internet downloads) of the Government of India are also used wherever necessary. The survey was conducted in two districts of Rajasthan, uttar Pradesh (one additional district), madhya Pradesh, Bihar (one additional district), Jharkhand, chhattisgarh and orissa. All the selected districts11 are part of Phase I of NREGS implemented during 2005-06 (except one district that belongs to Phase II). The sample households were selected from 5 most backward villages within a district. however, the number of households interviewed in each of the selected districts was fixed at 200. Since the survey was undertaken to find out the perceptions of the disadvantaged towards the government programme, only the poor and marginalised households were interviewed in each of the selected villages. Table 4 summarises the relative economic differentials amongst the selected deprived households, which are categorised on the basis of caste and religious identities. The Scheduled castes (Scs) and the Scheduled Tribes (STs) are classified on the basis of their respective caste identities and are usually landless labourers and hunter-gatherers spread all over India. The other Backward classes (oBcs) are identified as the middle level castes in the hierarchy of social classification amongst the hindus, and often they own and cultivate some land. The high caste hindus are at the top of the list. The term ‘minority’ is a classification which includes only the religious groups, mostly the muslims and christians in this data. The classification of deprived households is estimated from a number of asset ownership variables in the sample. for example, the better-offs in this sample are those who would own at least two types of animals out of cows, buffaloes, and sheep, and any two types of assets amongst cycles, electric fans, pressure cookers, sewing machines and television sets.

254 ThE INDIAN JouRNAL of LABouR EcoNomIcS
Table 4Economic Status* of the Deprived Sampled Households according to Social Groups
Social group Most deprived
Average within the group
Better-offs from within the group
All
Scs No.Row %col. %
65960.737.5
41738.430.2
100.9
16.4
1,086100.033.9
STs No.Row %col. %
62456.735.5
46442.233.6
121.1
19.7
1,100100.034.4
oBc No.Row %col. %
29045.316.5
32050.023.1
304.7
49.2
640100.020.0
high caste hindu No.Row %col. %
9141.05.2
12556.39.0
62.79.8
222100.0
6.9minority No.
Row %col. %
9260.55.2
5737.54.1
32.04.9
152100.0
4.8Total No.
Row %col. %
1,75654.9
100.0
1,38343.2
100.0
611.9
100.0
3,200100.0100.0
Notes: (i)* Economic status is assessed by using a combination of animal and durable asset ownership. (ii) The sampling of households for this survey was done so as to net mostly the deprived population.
As expected, one finds that the incidence of the most backward families is higher amongst the Scs, STs and religious minorities (mostly muslims and christians). As a corollary, the representation of high caste hindus and oBcs is relatively higher in the average economic condition category. As far as the better-offs within the group are concerned, they constitute a small percentage with a marginally higher representation of oBcs and high castes. This profiling of the sample makes it clear that practically all the selected households deserve to benefit from the NREGS, but as will subsequently be seen, participation in and the use of NREGS is found in only in a small fraction of the households.
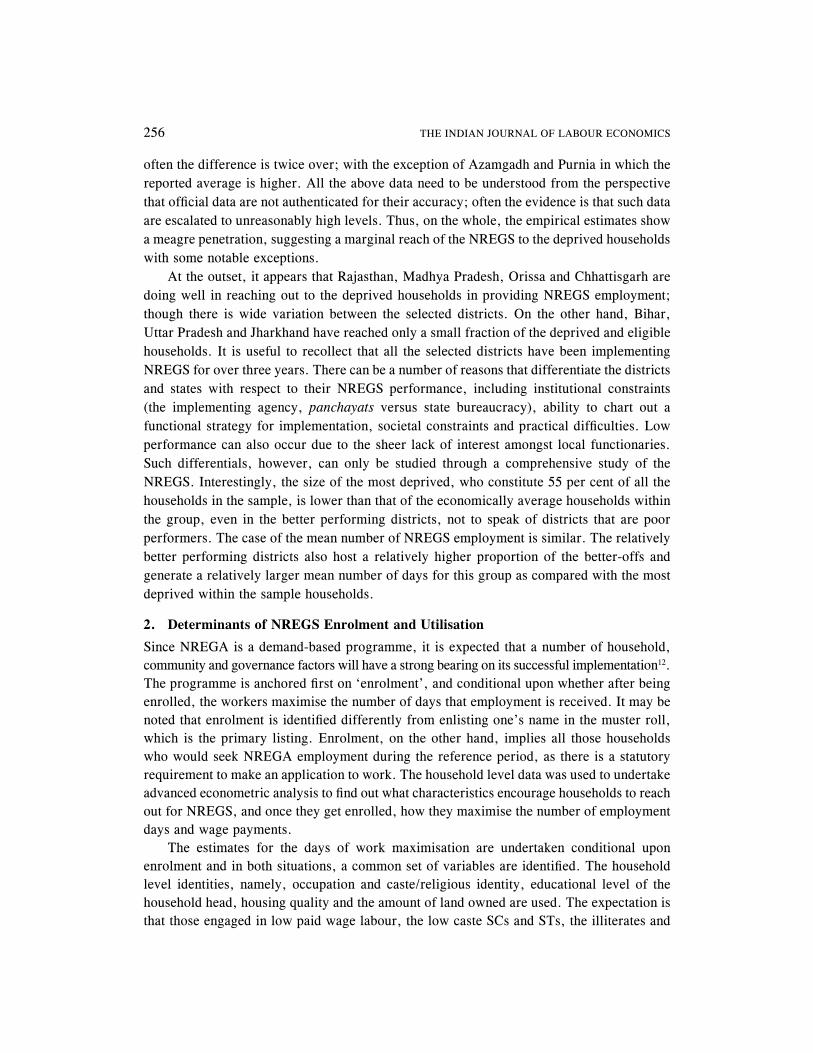
Table 5 presents empirical evidence relating to NREGS participation and employment generation from the household survey mentioned above. A large variation is noticed both within and across states with respect to the proportion of households reporting NREGA work during the previous year and the average number of days worked. It should be noted that all sample households belong to the relatively deprived sections and are thus eligible to seek NREGA employment. There are some encouraging findings as far as the districts of Mandla (madhya Pradesh), which records 93 per cent of the surveyed households reporting NREGA work and meeting 54 per cent of the target of total number of employment days, followed by Dungarpur (Rajasthan) with 87 per cent enrolment and 64 per cent of the requirement being met, and Kanker (Chhattisgarh), covering 76 per cent households and 30 per cent of the requirement being met. All these districts are extremely backward as reflected in the

ASSESSmENT of ouTREAch AND BENEfITS of NREGS 255
small developmental index values assigned to them by the Planning commission of India, and also host very high levels of poverty-stricken households. NREGA’s prime objective is to reach people living in the backward areas of India. One, however, finds very low levels of NREGA coverage in villages in Bihar—12 per cent in Purnia, 14 per cent in Gaya and 17 per cent in muzaffarpur, though they rank as moderate in terms of the index of backwardness, they also record a meagre amount of the requirements met. Similar low levels of coverage and much lower levels of the needs met are recorded in the selected districts of orissa and Jharkhand.
The broad trend observed is that a higher number of households covered have also reported a relatively high mean number of work-days, and those reporting lower coverage have reported a lower average number of days of work. It appears that those who sought work have received about 30 days of work, but if one considers all those eligible households, then the NREGS has so far created less than 20 per cent of the required jobs. for example, all 200 households in the selected sample are eligible to work on NREGS, which signifies a total of 20,000 days of employment per year. The official district level average number of days of employment per household is also presented in Table 5. It is instructive to note that the average number of employment days generated is far above the reported averages, and
Table 5
NREGA Employment Status in Selected Districts in North India, 2007-08State/District Percentage
of HHs reporting
work
Mean no. of work days of
reporting HHs/from records
Total work days in
selected villages
percentage to the required employment
% HHs reporting
easy access to women/women who got work
Rajasthan/Barmer 67 50 63** 6700 33.5 57***61Rajasthan/Dungarpur 87 74 97 12876 64.4 81 73uP/Sitapur 53 13 34 1378 6.9 7 5uP/Lalitpur 54 24 53 2592 13 20 39uP/Azamgarh 16 37 28 1058 5.3 16 6mP/mandla 94 58 71 10904 54.5 91 40mP/Tikamgarh 43 14 59 1204 6 24 33Bihar/Gaya 14 18 22 504 2.5 7 35Bihar/muzaffarpur 17 15 50 510 2.6 7 29Bihar/Purnia 12 24 10 576 2.9 8 34Jharkhand/Palamau 27 20 40 1080 5.4 26 30Jharkhand/Dumka 28 28 36 1572 7.9 22 25chhattisgarh/Kanker 76 40 86 6080 30.4 74 58chhattisgarh/Bilaspur 37 42 70 3108 15.5 34 45orissa/Ganjam 63 20 51 2520 12.6 59 47orissa/Keonjhar 67 10 27 1340 6.7 61 37Notes: (i) * A sample of 200 hhs from each district, belonging to deprived communities, was taken and
the respondents were interviewed from five randomly selected backward area villages. (ii) ** District aggregates from official NREGA reports. (iii) *** Survey data indicating the percentage of those who said that it was easy to get work for
women/percentage of women getting work extracted from NREGA records.
256 ThE INDIAN JouRNAL of LABouR EcoNomIcS
often the difference is twice over; with the exception of Azamgadh and Purnia in which the reported average is higher. All the above data need to be understood from the perspective that official data are not authenticated for their accuracy; often the evidence is that such data are escalated to unreasonably high levels. Thus, on the whole, the empirical estimates show a meagre penetration, suggesting a marginal reach of the NREGS to the deprived households with some notable exceptions.
At the outset, it appears that Rajasthan, madhya Pradesh, orissa and chhattisgarh are doing well in reaching out to the deprived households in providing NREGS employment; though there is wide variation between the selected districts. on the other hand, Bihar, uttar Pradesh and Jharkhand have reached only a small fraction of the deprived and eligible households. It is useful to recollect that all the selected districts have been implementing NREGS for over three years. There can be a number of reasons that differentiate the districts and states with respect to their NREGS performance, including institutional constraints (the implementing agency, panchayats versus state bureaucracy), ability to chart out a functional strategy for implementation, societal constraints and practical difficulties. Low performance can also occur due to the sheer lack of interest amongst local functionaries. Such differentials, however, can only be studied through a comprehensive study of the NREGS. Interestingly, the size of the most deprived, who constitute 55 per cent of all the households in the sample, is lower than that of the economically average households within the group, even in the better performing districts, not to speak of districts that are poor performers. The case of the mean number of NREGS employment is similar. The relatively better performing districts also host a relatively higher proportion of the better-offs and generate a relatively larger mean number of days for this group as compared with the most deprived within the sample households.
2. Determinants of NREGS Enrolment and Utilisation
Since NREGA is a demand-based programme, it is expected that a number of household, community and governance factors will have a strong bearing on its successful implementation12. The programme is anchored first on ‘enrolment’, and conditional upon whether after being enrolled, the workers maximise the number of days that employment is received. It may be noted that enrolment is identified differently from enlisting one’s name in the muster roll, which is the primary listing. Enrolment, on the other hand, implies all those households who would seek NREGA employment during the reference period, as there is a statutory requirement to make an application to work. The household level data was used to undertake advanced econometric analysis to find out what characteristics encourage households to reach out for NREGS, and once they get enrolled, how they maximise the number of employment days and wage payments.
The estimates for the days of work maximisation are undertaken conditional upon enrolment and in both situations, a common set of variables are identified. The household level identities, namely, occupation and caste/religious identity, educational level of the household head, housing quality and the amount of land owned are used. The expectation is that those engaged in low paid wage labour, the low caste Scs and STs, the illiterates and

ASSESSmENT of ouTREAch AND BENEfITS of NREGS 257
those living in mud or kaccha homes and the landless are expected to use NREGS in large numbers and also to maximise the number of employment days. Given that panchayats are functional across all India, information on the participation and access to community and societal institutions, namely the panchayats, mahila mandals (women’s groups), school committees, and so on; and perceived transparency in NREGS meetings are expected to favour better enrolment and utilisation. It is useful to assess how household level vulnerable aspects such as low economic status, women in need of work, households with food inadequacy and missing members impact NREGS utilisation.
(i) Socio-economic Factors
The first stage of enrolment shows relationships in the expected direction (see Table 6). The household occupation and levels of education show a considerable impact on NREGA enrolment. As expected, the casual labour households show highly significant positive and the salaried and self-employed show highly significant negative coefficients, as compared with the farming community. This suggests a fair access to the wage labour households that is compatible with the occupational hierarchy status in rural India. Similarly, as compared with the illiterate households, those having higher level education have significant and negative coefficients, suggesting that the former have better access to NREGS enrolment. As far as the caste and religious identity is concerned, the coefficients are not significant except that the minorities record positive enrolments at a less than 5 per cent significance level; while the forward caste Hindus record negative but not significant coefficients. The quality of housing, which reflects economic standing in the rural setting, shows no impact on enrolment.
When these variables are evaluated in terms of the number of days of employment, one finds that the most dominant household level variable favouring the maximisation of employment days is 1-4 standard and 5-9 standard levels of education as compared with that of the illiterates. This is exactly the opposite of the impact during the first stage, and also counters the ordinarily expected direction of relationship that the illiterates who are expected to be poor get to work a higher number of days of work. The second effect relates to the STs, who are significantly able to maximise the employment opportunities available to them. Even after controlling for the land asset variable, which shows no significant association, ownership of a pukka (good quality) house shows independent positive impact at a less than 5 per cent level; that is, the labour force living in pukka homes maximises the netting of NREGS employment days. Thus, there are contradictory forces operating for the number of days of employment maximisation, which favors attributes pointing to human capital-based abilities such as education and relatively good (relatively better off) housing that lead to higher wage realisation.
(ii) Community/Institutional Participation
The panchayats are the grassroots level institutions involved in the implementation of the NREGS. The impact of this factor is captured in two ways. firstly, we explore whether the

258 ThE INDIAN JouRNAL of LABouR EcoNomIcS
fact that women were elected or nominated members in these institutions facilitate enrolment and use of NREGS. The other aspects related to institutions are governance and transparency, which are measured by finding out whether the respondents attended panchayat meetings and whether these meetings were transparent. The former variable, that is being a member, did not show any impact on NREGS enrolment but has a dominant effect on maximisation of the number of days of employment (see more on this later). on the other hand, the households reporting higher participation in panchayat meetings and those having an opinion about transparency in NREGA meetings have a favourable impact on the choice of NREGA work. Thus, women’s membership per se in village level institutions/organisations such as the panchayat, school committee, mahila mandals, etc. does not show a noticeable impact on enrolment, but has a strong bearing on maximising the number of days of employment. What does show a large impact on enrolment is the view that panchayat meetings are transparent. Surprisingly, both divergent views—that meetings were ‘transparent’ and that they were ‘not-transparent’—show a large and significant positive effect on NREGS as opposed to those households that did not have a view at all or the fact that they were truly not interested in having a view on local panchayat meetings. Given this strong and important relationship, additional tests were performed using interactive terms of ‘transparency’ variables with ‘casual wage worker’ category but did not find any significant impact (estimates suppressed). This finding brings to the fore the facts that having a view on the panchayat functioning is important but the kind of view that one has really does not matter; and it provides a strong signal to programme managers that in order to enhance the reach and efficacy of NREGS and other similar programmes, people’s participation is an absolute necessity, irrespective of whether such participants approve or disapprove of a programme.
To reiterate, it is puzzling as to why the institutional membership of a woman would wield a large impact on the maximisation of employment? It appears that the inner story of who gets a higher number of employment days depends upon a crucial fact which shows little influence on whether one gets to work or not; but once one gets into the programme, one derives the maximum benefit. This crucial fact is that of women’s memberships in local self-governance such as the panchayat, school committees, mahila mandals, and so on, and this impact stands out in the entire analysis. Thus household gets its number of employment days maximised when a woman from the household or even from the community is a formal member in the panchayat-linked village level institutions. This finding is highly significant to both the national goal of democratic decentralisation, on the one hand, and the favourable implementation of NREGA, on the other. Thus, formal participation in panchayati raj institutions (PRIs) enables households to eliminate informational asymmetries in such a way that they are able to plan and strategise a larger netting of NREGA work-days. one can see this as an adverse exploitation of the opportunity which should otherwise have been passed on to other deserving households. Added to this puzzle is another variable, which had a positive signal in enrolment, but when it comes to maximisation of the number of employment days, it provides conflicting results, for example, those who considered that NREGA meetings are not transparent seem to be able to gain a higher number of employment

ASSESSmENT of ouTREAch AND BENEfITS of NREGS 259
Table 6
Factors which Facilitate Enrolment and Use of NREGS—A Multivariate AnalysisFactors/Determinants Sign and strength
of variable with NREGA enrolment
Sign and strength of variable with no. of NREGA employment days
(Social Group) other Backward classes (oBcs) (Excluded category)Schedule castes (Scs) ns nsSchedule Tribes (STs) ns ++forward caste hindus ns nsminority ++ ns(household occupation) farming (Excluded category)casual Labour +++ nsSalaried --- nsSelf-employed --- ns(Education of the head of the household) Illiterate (Excluded category)1-4 Standard --- +5-9 Standard - ++matriculation and Above -- ns(Women’s Work opportunity) household Expressing No Work opportunity (Excluded category)household Expressing Work opportunity +++ ns(housing condition) Kachcha house owners (Excluded category)Pukka house owners ns +(Post-survey Assessment of Economic Status) Deprived (Excluded category)Well-off +++ ns(Women’s community Participation) Not a member in any Institution (Excluded category)member in at least one Institution ns +++(Attend Panchayat meetings) Low Participation (Excluded category)high Participation in Panchayats + ns(Transparent Enrolment) unable to Assess (Excluded category)Enrolment not Transparent +++ --Transparent Enrolment +++ ns(Social and Professional Network) Not a member in any Institution (Excluded category)member in at least one Institution ns ns(food Adequacy categories) household Reporting Average food Access (Excluded category)household Reporting high ood Access ns +++household Reporting fair food Access ns +++household Reporting Inadequate food Access ns nshousehold Reporting highly Inadequate food Access ns ns(migrant Status) Non-migrant household (Excluded category)migrant household +++ --(owned Land for cultivation) Land owned in Acres -Land owned Square Term Variable not used nsobservations 3200 Note: +++p-value<0.01 and positive, --- p-value<0.01 and negative, ++ (--) p-value <0.05, + (-)
p- value <0.10, ns - not significant.

260 ThE INDIAN JouRNAL of LABouR EcoNomIcS
days. Whether this reflect some sort of ‘negative trait’ wielding a favourable pressure to maximise wage employment due to the fear of social conflict, is an issue that needs to be examined further.
No noteworthy independent impact is found by social networking since the NREGS is proximate to local governance variables, which are summarised as signifying community participation.
(iii) Household-specific Vulnerability
four characteristics are used to highlight household vulnerability factors. They are: the relative economic status, women’s employment opportunities, household food security and migration status.
Even after controlling for important social characteristics, those who are better-off within the sample households have a highly significant possibility of NREGS enrolment as compared with the relatively worse-off. It is important to highlight a qualitative distinction between the generated variable ‘relative economic status’ from other proxies such as casual labourers, illiterates and women, which are all given and highly visible. While the proxy vulnerability indicators can (but do not necessarily do so) influence the choice of NREGS a priori, the economic status variable is not expected to wield such an impact, as it is not predetermined and is a variable generated from the assets information of the household. This is, therefore, a puzzling but an important finding, as it challenges the expected hypothesis that NREGA is designed to benefit the poorest of the poor through a self-selection mechanism; but there is only limited support to this hypothesis. Since the NREGA wages in a number of states are higher than the local wage rates, it attracts the attention of those who would have otherwise not chosen to work under the programme. Although by law, all those who approach NREGA officials for work must be provided with jobs, there are many constraints that limit the creation of all the needed/demanded number of employment days. Such limits emerge from a limited supply of funds, seasonal factors, non-availability of useful projects and local level idiosyncratic factors as well. Given such limitations, many NREGA jobs are likely to be appropriated by the relatively better-offs, who can be described as the ‘local middle class’, generally having better bargaining capacity, thus limiting benefit that the poorest of the poor derive from the programme.
However, the gender effect is large and highly significant, as households which consider that women have better employment opportunities also recorded significantly high NREGA enrolment. This is clearly a favourable impact of NREGA.
The data consists of two other variables that reflect both income and food vulnerability. A household having sent out a family member as an out-migrant can be taken as a proxy to income vulnerability whereas the answer to another question on whether the household was food-adequate during the previous year is categorised to reflect food vulnerability. Controlling for all other factors, the coefficients for households with members who have out-migrated for work, indicate a large and significant possibility that they would take up NREGS work. This finding supports the view that household members left behind by migrants are often
ASSESSmENT of ouTREAch AND BENEfITS of NREGS 261
distressed and in need of social security support. Since information on remittances is not available in this survey, it was not possible to assess its impact accordingly. The variable reflecting the graded difficulty in food access does not show significant results though from the direction of association, it can be said that those reporting food inadequacy have a positive (but not significant) tendency to enrol in NREGS. Those who have ‘very high food inaccessibility’ also have negative but not significant coefficients, suggesting that no benefit accrues to the poorest of the poor. This is precisely the group that deserves not to be left out of the programme, which is why the programme focus has to be on finding ways to identify food-insecure households and extend NREGS employment. But, as will be seen later, both these vulnerability variables wield highly opposite impacts on the maximisation of the number of days of employment.
Unexpectedly, the household-specific vulnerability indicators, namely ‘migration’, show an opposing impact of not being able to maximise the number of days of employment though they were able to get enrolled into the system precisely because of this attribute. Secondly, unlike in the case for enrolment, unexpectedly households reporting high as well as fair food adequacy maximise the number of days of employment even after controlling for a number of other social and economic variables. The fact that even households that do not feel the pinch of food inadequacy make efforts to hang on to NREGS employment is puzzling. Thus, after controlling for all other factors, households which are facing food stress, do not get any advantage either in getting enrolled into the NREGA or in being able to maximise the number of days of employment. It may be noted that the fact whether such households are afflicted with other idiosyncratic factors such as disability and old age was also tested, but this variable did not show any impact on the results presented above. Given a vast array of mechanisms through which leakages and discrimination work, it appears that those who manage to show endurance can hang on to greater opportunities of employment through various partnerships that may develop with the managers of muster rolls and payments in this programme. In case of the migrant households, what appeared to be a reflection of distress while seeking work turns out to be worse as they are not able to maximise wage receipts through a higher number of days of employment. In fact, such people seem to get penalised and factors that lead to such a situation need further research and documentation.
3. Qualitative Perceptions of Households with Respect to NREGA
one village in each of the seven selected states was chosen for holding discussions and qualitative discourses with women and men belonging to different communities and economic standings. Apart from case studies, focus group discussions were also undertaken by experienced senior staff members involved in this project. A few highlights relevant for the public employment programmes are summarised below.
It was necessary to ensure that the selected villages belonged to the remote and backward parts of the district. Thus, all villages were located farther away from towns and cities, and even motorable roads. Some villages were located in the border areas of the district and adjacent to rivers. Practically all villages had one dominant caste group, followed by others

262 ThE INDIAN JouRNAL of LABouR EcoNomIcS
from amongst the oBcs, Scs, STs and muslims. The average size ranged from about 250 households to 800 households. Villages were dominated with agricultural activities, and economic and social standing was linked to the ownership and size of cultivable holdings. Landless households were dependent upon casual wage work that was often not available within the village. Thus, a considerable number of landless people were found to be migrants (seasonal in nature) in search of wage employment (for example, villages in Bihar and Orissa). Women and the infirm were left behind and they undertook various types of low productive tasks such as the collection and utilisation of minor forest produce for income generation (as in a village in madhya Pradesh, where many inhabitants were making and selling leaf plates for a living). The poor households in the selected villages did not report livestock rearing and dairying as a source of income.
The NREGA employment programme was present in all the villages but many respondents did not consider it as a dependable source of income except in the villages in orissa and Rajasthan. The male members were often aware of NREGA, but the women in most of the villages (especially from Jharkhand and madhya Pradesh) were less knowledgeable though ST and Sc women reported the availability of NREGA work. People from both these villages reported a conflict of interest between the OBCs and the SCs/STs, mostly because of panchayat politics, which was controlled by the caste group to which the pradhan belongs, who was known for favouring households belonging to his own caste. Yet the reports suggested a considerable demand from the Sc/ST households, particularly from women, whereas oBc women were either reluctant to undertake wage work or believed that NREGA work was unnecessary. At the same time, the mere implementation of NREGA was not enough to meet the demands of Sc/ST households. The views expressed by the people from a selected village in uttar Pradesh were somewhat unique. While both the Sc and oBc households expressed a desire to work on NREGA projects, they pointed out that employment was offered only to those households that cast their votes in favour of the village pradhan.
A striking positive fallout of NREGA is the fact that women in all the selected villages are becoming knowledgeable about the programme and are taking greater interest in demanding employment. While only the male members of each household are normally enrolled and issued with employment cards, women feel that work opportunities are being denied to them as they are unable to participate in the NREGA programme. It is difficult to identify the procedural hurdles being faced by various households in selecting the family member who can perform the NREGA work. It is not clear to most of the participants whether such a membership and enrolment are interchangeable between the male and female members of the households. Another stumbling block for women participating in NREGA is the long commuting distance to the worksite, that is often located near another village rather than their own. however, there is one another positive fallout of NREGA that has a gender dimension. While not all the villages reported the existence of functional self-help groups (ShGs) (only one village reported functional ShGs), most of the oBc women as opposed to their Sc/ST counterparts demanded the establishment of ShGs and associated work, which they believed could be undertaken within the confines of their own homes.

ASSESSmENT of ouTREAch AND BENEfITS of NREGS 263
on the whole, it can be said that people even in the remote parts of the selected districts are aware of NREGA. It appears that the NREGS programme will be as successful as the commitment and quality of management of the local panchayati raj institutions (PRIs). Thus, the future of the flagship national programme is tied securely with the cherished goal of the transfer of governing powers to the local communities through the gram sabha and other associated institutions.
V. DISCUSSION AND POLICY CONCLUSIONS
In conclusion, it is important to emphasise that the future of NREGS, which is now even a legal entitlement for the deprived people living in rural areas, is securely tied with the functioning of the PRIs in India. for some, this scheme symbolises a consolidation of the democratic process and seems to be revolutionary in both intent and content! But the test of the success of such a large effort lies in its ability to carry the vulnerable and the poor on board and to keep them there for a period of time. The mechanism for an exit out of the NREGS has neither been thought of nor seems possible due to its fairly broad-based coverage. In effect, the programme is susceptible to both ‘an entry barrier leading to exclusion error’ and ‘large inclusion errors reflecting poor governance’. While policy reforms and even public debates emphasise the elimination of inclusion errors, what is absolutely not considered or even recognized is that the exclusion errors are large and detrimental due to the high probability of the poorest of the poor facing the high risk of such exclusion.
While strategies to improve programme efficiency must be undertaken jointly and concurrently by strengthening local self-governance with clear distinctions between political, administrative and fiscal decentralisation; reforms in NREGS are also needed to ensure that special efforts are made to provide the requisite passage to the excluded to enable them to enter the folds of the scheme. In this regard, it is beneficial for political and administrative decentralisation to precede the financial one, but it appears that such a step-wise transition has not taken clear shape in the process of implementation of the NREGS.
Since the breakdown of the jajmani system, a large number of wage workers and artisans have been able to come out of bondage, but they are now being pushed towards penury due to the breakdown of traditional support systems. Although wage determination was highly exploitative and imperfect in the jajmani system, it did serve to provide job stability. NREGS, on the other hand, signifies a delayed response to the need to provide a safety net for such a vulnerable workforce. While the NREGS payment is pegged to the state minimum wages prevalent in the state concerned, what is not well known is its impact on regular manual agricultural wages during the peak and slack agriculture season,. This has a relevance to the food output and the larger food security issues of the region, and subsequently of the country as a whole. There are demands to incorporate amendments in the Act so as to facilitate extended coverage of the programme, especially after aligning it with the agricultural season.
The econometric analysis explored the household, societal and community characteristics that support NREGS enrolment and utilisation. All the factors that herald the visible attributes
264 ThE INDIAN JouRNAL of LABouR EcoNomIcS
of distress and vulnerability show better enrolments, for example, the rural casual wage worker households, the illiterates and women have significantly positive coefficients. Yet, a measure of economic standing constructed by using a set of household assets suggests that as compared with the deprived thus defined, the well-off from within the local area are maximising the NREGA benefits, especially enrolments, which signify the first and essential stage in the scheme. further, qualitative variables expressing vulnerability such as food insecurity and households with a migrant member (mostly for economic reasons) also show that they are unable to draw any benefit from NREGS suggesting the failure of self-targeting in the programme. What stands out in the empirical data is the fact that households which are found to be formal members in local institutions have shown large positive capabilities to optimise the monetary gains by maximising the number of days of employment. further, households that had gathered an opinion about the scheme, which essentially means those who have reduced informational (programmatic) asymmetries, have drawn greater benefits from the NREGS. Thus, the scheme itself is helping the democratic process to evolve. community participation, information sharing and the formulation of an opinion by rural residents about a scheme are some of the dominating factors that enhance the maximisation of receipts from NREGA. These mechanisms empower communities, strengthen the democratic process and contribute towards making the programme inclusionary. NREGS has thus facilitated women’s empowerment by providing them opportunities for enhanced participation and cash earnings, which seem to be complementing another revolutionary programme for offering micro-credit across India. This synergy is expected to create an unprecedented range of positive outcomes in terms of empowering women in the rural areas. A highly desirable intra-household dynamics favouring children, women, the differently abled, and the old and infirm can therefore become functional.
Given the importance of NREGS and in the light of the above analysis, there is a need to understand the local, regional and state level dynamics, and the social and economic relevance of the programme amongst the rural households. Now that the programme has been under implementation for over three years in various parts of India, a nationwide quantitative survey needs to be undertaken to estimate the welfare impact of the programme on households. Qualitative studies in the form of focus group discussions with the stakeholders, case studies and village studies can complement and enhance contextual understanding of the programme.
Although the earlier sections of this paper present a number of noteworthy and nearly-conclusive findings, it also points to a number of major challenges that need to be overcome in order to fully understand the dynamics of the development and welfare outcomes of this revolutionary mega programme launched in India for the first time. Therefore, in order to fully understand the implementation and impact of NREGA, the following aspects need to be examined further through exclusively designed scientific empirical studies. The key dimensions and a few key questions in each of them are listed below.
(a) Implementation Framework—Inter-state differentials in execution, coverage and administration, particularly assessment of fluctuations and differentials in the number of man-days of employment provided per household.

ASSESSmENT of ouTREAch AND BENEfITS of NREGS 265
(b) Impact—Impact of NREGA on local level wage rates and prices of food items.
(c) Synergies—Effects of NREGA on the nutrition levels of women and children, and on child schooling.
1. Implementation Framework: Inter-state Differentials in Execution, Coverage and Administration
The following queries need to be addressed with regard to the implementation framework:
(a) Does the NREGA enhance expertise in local area programme formulation, development of proposals for work projects and accounting practices?
(b) Why is formal registration through job cards essential? Since this is a voluntary programme that is open to all, should not the two stages—job card registration and subsequently making a formal application for NREGA employment—be simplified?
(c) Given the inadequate penetration of banking infrastructure, are there other mechanisms to help reduce corruption in NREGA?
(d) Should the public works programmes be supported, since such programmes in their earlier format of EGS were politically highly successful and durable, but at what costs? What are the economic opportunity costs?
2. Impact of NREGA on Real Wages, Wage Equalisation and Rural Markets
The following queries need to be addressed with regard to the impact of NREGA on wages, wage equalisation and rural markets:(a) how can the wage payment mechanisms be documented and the weak points that can
lead to leakages be identified? What impact will NREG have on local agricultural and non-farm casual wages? Will this programme lead to wage equalisation in the district or state?
(b) High inflation amongst the agricultural labourers has been documented in states where the NREGA was fully implemented, for example, orissa and madhya Pradesh. By and large, the poorer states like Bihar and Orissa have seen higher inflation—resulting from the NREGA windfall—than the better-off states have. What are the reasons for this outcome of NREGA and how can they be resolved?
(c) how will the local asset formation impact the local economy? What kind of complementarities prevail along with the aggressive national rural road and infrastructure construction programmes?
(d) Along with the recently announced ‘farmers loan waiver scheme’, NREGA is expected to generate more rural markets and financial services. What are the ways in which the dynamics of private markets under the new regime of the safety net programme can be investigated?
(e) Will NREGA restrain rural-to-urban migration, especially from the distress areas and areas that are under the grip of rain-fed agriculture?
266 ThE INDIAN JouRNAL of LABouR EcoNomIcS
3. Synergies with Other (Gender and Nutritional) Social Security Schemes
The following queries need to be addressed with regard to the synergies between NREGA and other gender and nutrition-related social security schemes:(a) how can the food security gains and well-being in vulnerable households and of women
and children within households be assessed?
(b) The rules of intra-household dynamics can restrict direct benefits to women and children. Will the gender of the NREGA participant influence household welfare, and does it enhance the work burden of female participants?
(c) Does NREGA affect child nutrition, school attendance, and educational performance of boys and girls in different age groups?
(d) Given the lower reservation wage of females in India, can female workers become direct beneficiaries of this programme, which, from one point of view, promotes gender empowerment?
(e) how can we identify synergies linking the NREGA with other programmes in the region such as the ‘area development’, ‘tribal sub-programme’, ‘micro-watershed development’, ‘micro-credit’ and ‘micro-enterprise development’ programmes, and so on?
In spite of powerful demands made by the monitoring agencies, academics and activists, one finds a lack of co-ordinated government level initiative, innovation and interventions to improve the programme. In the end, it must be stated that NREGS has immense potential to provide social security to the masses only if its implementation is efficient and its synergies are optimally exploited. India should not miss another opportunity to demonstrate that the world’s largest democracy also cares for its people, especially the deprived and the vulnerable, and that it is truly marching ahead in its quest to become a welfare state.
Notes1. Note that NREGA, NREGS, ‘act’, ‘scheme’ and ‘programme’ are used interchangeably to mean the NREG Act-
supported scheme or programme.
2. Roughly translates to ‘rural India reconstruction’.
3. The universalisation of NREGA is recent (2008) and a policy response to the demands made by a newly appointed General Secretary of the congress, the party currently in power at the centre in India.
4. An assessment of food for work programmes of the erstwhile years in India (Barrett, et al., 2004) has arrived at similar conclusions.
5. It is only in November 2008 that the maharashtra state disbanded the special funding model followed since the beginning of its own programme, namely the mEGS. Now the NREGA funding, even in maharashtra, follows the national pattern.
6. The official data sources do not provide adequate explanations about the quality of NREGS data, in general and inter-state differentials, in particular. often the number of households seeking work and the number provided with NREGS employment are almost the same, which is not supported by a number of keen observers of the NREGS.
7. The national level poverty rates are estimated by using NSSo survey data on household consumption expenditures, which are normally much lower than the estimates made by the respective states by using 13 variable criteria. for a useful commentary on this, see Shariff (2007).

ASSESSmENT of ouTREAch AND BENEfITS of NREGS 267
8. The exchange rate during 2009 was between Rs. 45 and Rs. 50 per uSD.
9. The NREGS wages are not straightforward. often, they are the piece rate wages for one day of work.
10. The field survey was funded by the United Nations Development Programme (UNDP) and conducted by the National council of Applied Economic Research (NcAER), New Delhi. The author was senior advisor to this project.
11. The selected districts belong to at least one of the following multiple criteria: 1. Districts identified as backward districts, under the Backward Regions Grant fund of Government of India. 2. Districts with low human Development Indices and Gender Development Indices (which are hDIs adjusted for Gender disparity in hDI). 3. Districts with Sc/ST population, which is more than the average State Sc/ST population. 4. multi-hazard Districts as per the Vulnerability Atlas of India, 2nd Edition, Building materials and Technology Promotion centre under ministry of urban Development, GoI. 5. Districts with high prevalence of hIV (“A” districts) as per the district categorisation done by NAco based on the 2006 hIV prevalence data.
12. Although the data do not provide information on individual or worker level attributes, what are most relevant in the rural Indian set-up are the household characteristics.
ReferencesBanerjee, A.V. (2008), “Why fighting Poverty is hard?”, unpublished, mIT (mimeo).
Barrett, c.; holden, S. and clay, D.c. (2004), “can food for Work Programmes Reduce Vulnerability?” in S. Dercon (ed.), Insurance Against Poverty, oxford university Press, oxford.
centre for Development Support (2006), first monitoring Report, Prepared by Samarthan with support from Poorest Area civil Society Programme (PAcS), Status of NREGA Implementation: Grassroots Learning and Way Forward. Available at http://www.empowerpoor.com/backgrounder.asp?report=434.
Dev, S. mahendra (1995), “India’s (maharashtra) Employment Guarantee Scheme: Lessons from Long Experience”, in J. Von Braun (ed.), Employment for Poverty Reduction and Food Security, International food Policy Research Institute, Washington D.c.
——; Ravi, c; Viswanathan, B.; Gulati, A. and Ramachandar, S. (2004), “Economic Liberalisation, Targeted Programmes and household food Security: A case Study of India”, Discussion Paper No. 68, markets, Trade and Industry Division, International food Policy Research Institute, Washington D.c.
Deolalikar, A.B. (1995), “Special Employment Programme and Poverty Alleviation”, Asian Development Review, Vol. 13, No. 2, pp. 50-73.
—— (1990), “famine Prevention in India”, in J. Dreze and A.K. Sen (eds.), The Political Economy of Hunger clarendon, oxford.
Government of India (2009), Extracts from Official Reports, Downloaded from http://nrega.nic.in/.
—— (2007), Extracts from Official report from - http://planningcommission.nic.in/ news/prmar07.pdf
Krishna, Anirudh (2001), “Moving from the Stock of Social Capital to the Flow of Benefits: The Role of Agency”, World Development, Vol. 29, No. 6, pp. 925-43.
—— (2006), “Poverty and Democratic Participation Reconsidered: Evidence from the Local Level in India”, Comparative Politics, Vol. 38, No. 4, pp. 439-58.
moore, m. and Jadhav, V. (2006), “The Politics and Bureaucratics of Rural Public Works: maharashtra’s Employment Guarantee Scheme”, Journal of Development Studies, Vol. 42, No. 8, pp.1271-300. (Online publication date 01 November 2006).
National council of Applied Economic Research (NcAER) (2008), Study on Perception of Disadvantaged in Seven States of India, Draft Report, Volume I and II, New Delhi.
National Rural Employment Guarantee Scheme (NREGS) (2005), Gazette Notification.
Pinstrup-Andersen P. (ed.) (1993), The Political Economy of Food and Nutrition Policies, Johns hopkins university Press, Baltimore, md., uSA.

268 ThE INDIAN JouRNAL of LABouR EcoNomIcS
Sen, A. (1981), Poverty and Famine: An Essay on Entitlement and Deprivation, oxford university Press, New York.
—— (1986), “food, Economics and Entailments”, Lloyds Bank Review, Vol.160, pp. 1-20.
Shariff, Abusaleh (2007). “How to Find the Poor”, Editorial Article, Times of India; August 10, New Delhi Edition.
Streeten, Paul (2002), “Empowerment, Participation and the Poor”, Occasional Paper, human Development Report Office, United Nations Development Programme, New York.
Von Braun, Joachim (1995), “Employment for Poverty Reduction and food Security: concepts, Research Issues and overview”, ’in Von Braun (ed.), Employment for Poverty Reduction and Food Security, International food Policy Research Institute, Washington D.c., pp. 1-20.
Weinberger, Katinka (2000), “Women’s Participation: An Economic Analysis in Rural chad and Pakistan”, Peter Lang Europaischer Verlag der Wissenschaften, frankfurt am main.