assessment of high school physics teachers’ …etd.lib.metu.edu.tr/upload/12614413/index.pdf ·...
TRANSCRIPT
ASSESSMENT OF HIGH SCHOOL PHYSICS TEACHERS’ PEDAGOGICAL
CONTENT KNOWLEDGE RELATED TO THE TEACHING OF
ELECTRICITY
A THESIS SUBMITTED TO
THE GRADUATE SCHOOL OF NATURAL AND APPLIED SCIENCES
OF
MIDDLE EAST TECHNICAL UNIVERSITY
BY
ERALP BAHÇİVAN
IN PARTIAL FULFILLMENT OF THE REQUIREMENTS
FOR
THE DEGREE OF DOCTOR OF PHILOSOPHY
IN
SECONDARY SCIENCE AND MATHEMATICS EDUCATION
JUNE 2012
Approval of the thesis:
ASSESSMENT OF HIGH SCHOOL PHYSICS TEACHERS’
PEDAGOGICAL CONTENT KNOWLEDGE RELATED TO THE
TEACHING OF ELECTRICITY
submitted by ERALP BAHÇİVAN in partial fulfillment of the requirements for
the degree of Doctor of Philosophy in Secondary Science and Mathematics
Education Department, Middle East Technical University by,
Prof. Dr. Canan ÖZGEN
Dean, Graduate School of Natural and Applied Sciences
Prof. Dr. Ömer GEBAN
Head of Department, Secondary Sci. and Math. Edu. Dept.
Assist. Prof. Dr. Ömer Faruk ÖZDEMİR
Supervisor, Secondary Sci. and Math. Edu. Dept., METU
Dr. Ufuk YILDIRIM
Co-Supervisor, Secondary Sci. and Math. Edu. Dept., METU
Examining Committee Members:
Assist. Prof. Dr. Nusret KAVAK
Secondary Sci. and Math. Edu. Dept., Gazi University
Assist. Prof. Dr. Ömer Faruk ÖZDEMİR
Secondary Science and Mathematics Education Dept., METU
Assoc. Prof. Dr. Ali ERYILMAZ
Secondary Science and Mathematics Education Dept., METU
Assoc. Prof. Dr. Ayhan Kürşat ERBAŞ
Secondary Science and Mathematics Education Dept., METU
Assoc. Prof. Dr. Özgül YILMAZ TÜZÜN
Elementary Education Dept., METU
Date: 11 June 2012

iii
I hereby declare that all information in this document has been obtained and
presented in accordance with academic rules and ethical conduct. I also
declare that, as required by these rules and conduct, I have fully cited and
referenced all material and results that are not original to this work.
Name, Last name : Eralp BAHÇİVAN
Signature :
iv
ABSTRACT
ASSESSMENT OF HIGH SCHOOL PHYSICS TEACHERS’ PEDAGOGICAL
CONTENT KNOWLEDGE RELATED TO THE TEACHING OF
ELECTRICITY
Bahçivan, Eralp
Ph.D., Department of Secondary Science and Mathematics Education
Supervisor: Assist. Prof. Dr. Ömer Faruk Özdemir
Co-Supervisor: Dr. Ufuk Yıldırım
June 2012, 175 pages
The main purpose of this study is to assess pedagogical content knowledge
(PCK) of in-service physics teachers about electricity topic in high school level by
developing a paper-and-pencil instrument consisting of open-ended items. The
instrument was developed with four different implementations by administration
to the 278 in-service physics teachers.
An exploratory and confirmatory factor analysis including only PCK items
was conducted in validation processes. The relations among teachers’ job
satisfaction levels, perceived self-efficacy levels, years of teaching experience and
specific experiences, attendance to in-service training seminars related to physics
teaching programs and teachers’ PCK were also analyzed by a confirmatory
structural equation modeling study in validation of test scores. SPSS and AMOS
programs were used in the analyses.
Results of the study showed that teachers’ perceived self-efficacy level,
attendance to in-service training seminars and specific experiences were
significant predictors of their PCK. Teachers’ years of teaching experience and
v
job satisfaction level were not significant predictors of their PCK. Inter-rater
reliability scores were calculated as 0.86 and 78% for scoring and coding of the
participant teachers’ responses respectively. Results also showed that there are
many Turkish physics teachers whose PCK scores regarding students’ learning
difficulties and misconceptions are below the average and participants mostly
prefer to implement direct instruction in their classrooms as the instructional
strategy.
Keywords: Physics teacher, pedagogical content knowledge, assessment of
teacher knowledge, job satisfaction, self-efficacy, electricity
vi
ÖZ
FİZİK ÖĞRETMENLERİNİN ELEKTRİK KONUSUNUN ÖĞRETİMİNE
YÖNELİK PEDAGOJİK ALAN BİLGİLERİNİN ÖLÇÜLMESİ
Bahçivan, Eralp
Doktora, Orta Öğretim Fen ve Matematik Alanları Eğitimi Bölümü
Tez Yöneticisi: Yrd. Doç. Dr. Ömer Faruk Özdemir
Ortak Tez Danışmanı: Dr. Ufuk Yıldırım
Haziran 2012, 175 sayfa
Bu çalışmanın amacı açık-uçlu sorular içeren bir ölçüm aracı geliştirerek
fizik öğretmenlerinin elektrik konusuna yönelik pedagojik alan bilgilerini (PAB)
ölçmektir. Ölçüm aracı 278 fizik öğretmeninin katılımıyla dört farklı uygulamaya
dayanılarak geliştirilmiştir.
Ölçme sonuçlarının geçerlik denetim sürecinde PAB maddelerine yönelik
açımlayıcı ve doğrulayıcı faktör analizi uygulanmıştır. Öğretmenlerin mesleki
doyum seviyeleri, öz-yeterlik algı seviyeleri, mesleki deneyimleri ve özel
deneyimleri, fizik öğretim programlarına yönelik hizmet-içi eğitimlere katılımları
ve PAB’ları arasındaki ilişki doğrulayıcı yapısal eşitlik modellemesi ile analiz
edilmiş ve ölçüm sonuçlarının geçerliliğine katkı sağlamıştır. Analizlerde SPSS ve
AMOS programları kullanılmıştır.
Çalışmanın sonuçları öğretmenlerin öz-yeterlik algı seviyeleri, hizmet-içi
eğitim katılımı ve özel deneyimlerinin, PAB’larını anlamlı olarak yordayan
bileşenler olduğunu göstermiştir. Öğretmenlerin genel deneyimleri ve mesleki
doyum seviyeleri PAB kalitesinin anlamlı yordayıcıları olarak bulunmamıştır.
Katılımcıların cevaplarının puanlandırılmasına ve kodlanmasına yönelik
vii
değerlendirici güvenirliği değerleri sırası ile 0.86 ve %78 olarak hesaplanmıştır.
Çalışma sonuçları birçok fizik öğretmenimizin öğrencilerin öğrenme zorlukları ve
kavram yanılgılarına yönelik PAB puanlarının ortalamanın altında olduğunu ve
katılımcıların sınıf içi uygulamalarında öğretim stratejisi olarak daha çok
doğrudan anlatımı tercih ettiklerini de göstermiştir.
Anahtar Kelimeler: Fizik öğretmeni, pedagojik alan bilgisi, öğretmen bilgisini
ölçme, mesleki doyum, öz-yeterlik, elektrik
viii
To My Wife Nermin BAHÇİVAN,
it is impossible to ignore her support
ix
ACKNOWLEDGEMENT
I would like to thank my co-supervisor Dr. Ufuk YILDIRIM for his encouraging
support and guidance throughout the study. He always supported me, in spite of
his intensive work program.
I would like to thank my supervisor Assist. Prof. Dr. Ömer Faruk ÖZDEMİR for
his support.
I am grateful to Assoc. Prof. Dr. Ali ERYILMAZ for his wisdom and belief in
me. Special thanks to Assoc. Prof. Dr. Özgül YILMAZ TÜZÜN for her
contributions to the study.
I present special thanks to Assist. Prof. Dr. Ahmet KILINÇ for his unforgettable
support during the study.
I would like to thank Dr. Ayşegül ARSLAN for her help during the data
collection process in Aksaray.
Special thanks to Özgür Murat ÇOLAKOĞLU for his great support during data
analysis process.
I am also grateful to my friends Özlem AYDIN and Funda ERASLAN who
always supported me when I requested their emergent help.
I also wish to express my deep gratitude to the physics teachers who participated
in implementations during my study.
Last but not the least, my deepest thanks go to my wife and our children. I always
felt their all sweetness and light throughout my study.
x
TABLE OF CONTENTS
ABSTRACT................................................................................................ iv
ÖZ............................................................................................................... vi
ACKNOWLEDGEMENT.......................................................................... ix
TABLE OF CONTENTS............................................................................ xi
LIST OF TABLES...................................................................................... xiv
LIST OF FIGURES.................................................................................... xvi
LIST OF ABBREVIATIONS..................................................................... xvii
CHAPTERS
1. INTRODUCTION…………………..…………………….……....... 1
1.1 Research Problems.…………..……………...…………………... 8
1.2 Statistical Research Hypotheses.….……………..….…............... 9
1.3 Significance of the Study.............................................................. 10
1.4 Definition of Important Terms...................................................... 11
2. LITERATURE REVIEW…….…………………………………...... 13
2.1 Definition and Common Properties of PCK................................. 13
2.1.1 PCK Models…………..………………….….…...…............. 15
2.2 Assessment of PCK…..………………………..…….….............. 20
2.2.1 Assessment of PCK in Mathematics Education..................... 20
2.2.2 Assessment of PCK in Science and Technology
Education…………………………………………...............
23
2.3 Self-Efficacy.................................................................................. 26
2.3.1 Teacher Self-Efficacy....................................................... 27
2.3.2 Assessment of Teacher Self-Efficacy............................... 28
2.4 Job Satisfaction.............................................................................. 30
2.4.1 Teachers’ Job Satisfaction................................................ 31
2.5 Relation among Teachers’ PCK, PSE and JS............................... 31
xi
2.6 The Summary of the Literature Review………………................ 35
2.6.1 Decisions Taken by Analyzing the Literature……............. 37
3. METHODOLOGY……………………..………………................ 39
3.1 Research Design…………..………………………................... 39
3.2 Population and Sample…………………………....................... 39
3.3 Instruments...……………………………………….…….…….. 41
3.3.1 Pedagogical Electricity Content Knowledge Instrument
(PECKI)………………………….…………………………..
41
3.3.2 Perceived Self-Efficacy Instrument (PSEI)……….............. 44
3.3.3 Job Satisfaction Instrument (JSI)……………......…………. 45
3.4 Variables...................................................................................... 45
3.4.1 Pedagogical Content Knowledge.................................... 45
3.4.2 Perceived Self-Efficacy………....................................... 46
3.4.3 Job Satisfaction…………................................................ 46
3.4.4 Year of Teaching Experience.......................................... 46
3.4.5 Specific Experience......................................................... 47
3.4.6 In-service Training Attendance....................................... 47
3.5 Procedure……………………………………............................. 47
3.6 Scoring Method…………........................................................... 48
3.6.1 Rubric for Rating...……………………......................... 50
3.7 Analysis of Data…………………….…………………………... 50
3.7.1 Validity and Reliability Evidences….................................. 51
3.7.1.1 Factor Analyses and Structural Equation
Modeling…………………..…………….................
56
3.8 Limitations of the Study……………………….......................... 60
3.9 Assumption…………………….……………………….............. 61
4. RESULTS…………….……………………………..……............... 62
4.1 Validation of the Pedagogical Electricity Content Knowledge
Instrument…...............................................................................
63
4.1.1 Exploratory Factor Analysis…………………..................... 63
4.1.2 Confirmatory Factor Analysis Results of PECKI
xii
Items……............................................................................. 66
4.1.3 Confirmatory Structural Equation Modeling Results............. 69
4.1.4 Inter-rater Reliability in Scoring and Coding......................... 73
4.1.5 Reliability of Perceived Self-Efficacy and Job Satisfaction
Scores…………………………………………...…..............
73
4.1.6 Descriptive Statistics............................................................... 74
4.1.6.1 Teachers’ Perceived Self-Efficacy Scores.................. 74
4.1.6.2 Teachers’ Job Satisfaction Scores.................................... 75
4.1.6.3 Teachers’ Years of Teaching Experience................... 76
4.1.6.4 Teachers’ Specific Experiences.................................. 77
4.1.6.5 Teachers’ In-service Training Attendance…….......... 78
4.2 Survey Results............................................................................... 80
4.2.1 Teachers’ Knowledge of Students’ Understanding of
Electricity..............................................................................
80
4.2.2 Teachers’ Knowledge of Instructional Strategies.................. 90
4.2.2.1 Analysis of 11th Item………............................................ 91
4.2.2.2 Analysis of 12th Item………..…..........…........................ 94
4.2.2.3 Analysis of 13th Item………….........…..…………...…... 96
4.2.2.4 Analysis of 14th Item……….........…..……………...…... 98
4.2.2.5 Summary of Teachers’ Knowledge of Instructional
Strategies……………………….......................................
101
4.3 Summary of the Results................................................................ 102
5. DISCUSSIONS, CONCLUSIONS AND IMPLICATIONS............. 104
5.1 Discussions of the Results......……………………....................... 104
5.2 Conclusions.........................………...................………………… 107
5.3 Implications………………….........……………….………......... 109
5.4 Recommendations for Future Research Studies........................... 110
REFERENCES……………………………………………….…….......... 112
APPENDICES
A. INSTRUMENT OF FIRST IMPLEMENTATION……................ 124
B. INSTRUMENT OF SECOND IMPLEMENTATION…............... 128
xiii
C. INSTRUMENT OF THIRD IMPLEMENTATION……............... 137
D. INSTRUMENT OF FINAL IMPLEMENTATION..................... 145
E. JSI AND PSEI ITEMS................................................................. 156
F. APPROVAL OF METU HUMAN RESEARCH ETHIC
COMMITTEE…………………………………………………….
157
G. PERMISSION OF THE TURKISH MINISTRY OF NATIONAL
EDUCATION…………..………………………………………...
158
H. RUBRIC...………………………………….……………................ 159
I. EXAMPLES OF RESPONSES……………………..….................. 165
CURRICULUM VITAE……………………………………………… 175
xiv
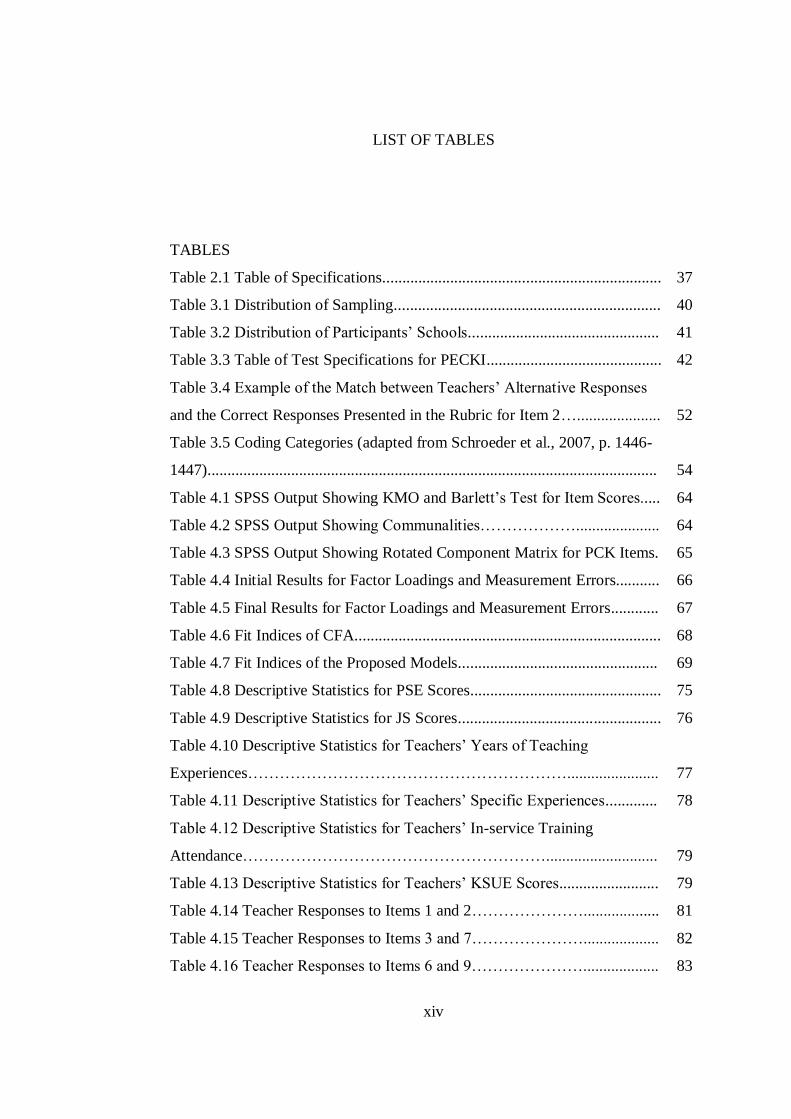
LIST OF TABLES
TABLES
Table 2.1 Table of Specifications...................................................................... 37
Table 3.1 Distribution of Sampling................................................................... 40
Table 3.2 Distribution of Participants’ Schools................................................ 41
Table 3.3 Table of Test Specifications for PECKI............................................ 42
Table 3.4 Example of the Match between Teachers’ Alternative Responses
and the Correct Responses Presented in the Rubric for Item 2….....................
52
Table 3.5 Coding Categories (adapted from Schroeder et al., 2007, p. 1446-
1447).................................................................................................................
54
Table 4.1 SPSS Output Showing KMO and Barlett’s Test for Item Scores..... 64
Table 4.2 SPSS Output Showing Communalities………………..................... 64
Table 4.3 SPSS Output Showing Rotated Component Matrix for PCK Items. 65
Table 4.4 Initial Results for Factor Loadings and Measurement Errors........... 66
Table 4.5 Final Results for Factor Loadings and Measurement Errors............ 67
Table 4.6 Fit Indices of CFA............................................................................. 68
Table 4.7 Fit Indices of the Proposed Models.................................................. 69
Table 4.8 Descriptive Statistics for PSE Scores................................................ 75
Table 4.9 Descriptive Statistics for JS Scores................................................... 76
Table 4.10 Descriptive Statistics for Teachers’ Years of Teaching
Experiences…………………………………………………….......................
77
Table 4.11 Descriptive Statistics for Teachers’ Specific Experiences............. 78
Table 4.12 Descriptive Statistics for Teachers’ In-service Training
Attendance…………………………………………………............................
79
Table 4.13 Descriptive Statistics for Teachers’ KSUE Scores......................... 79
Table 4.14 Teacher Responses to Items 1 and 2…………………................... 81
Table 4.15 Teacher Responses to Items 3 and 7…………………................... 82
Table 4.16 Teacher Responses to Items 6 and 9…………………................... 83
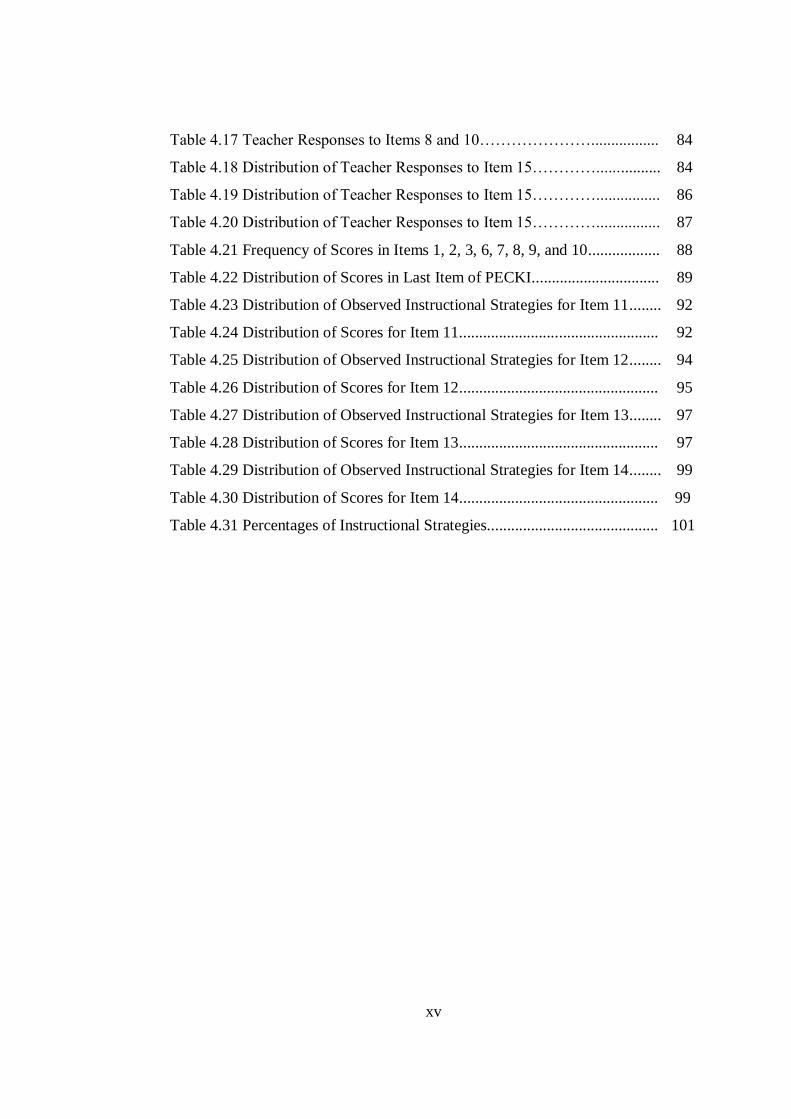
xv
Table 4.17 Teacher Responses to Items 8 and 10…………………................. 84
Table 4.18 Distribution of Teacher Responses to Item 15…………................ 84
Table 4.19 Distribution of Teacher Responses to Item 15…………................ 86
Table 4.20 Distribution of Teacher Responses to Item 15…………................ 87
Table 4.21 Frequency of Scores in Items 1, 2, 3, 6, 7, 8, 9, and 10.................. 88
Table 4.22 Distribution of Scores in Last Item of PECKI................................ 89
Table 4.23 Distribution of Observed Instructional Strategies for Item 11........ 92
Table 4.24 Distribution of Scores for Item 11.................................................. 92
Table 4.25 Distribution of Observed Instructional Strategies for Item 12........ 94
Table 4.26 Distribution of Scores for Item 12.................................................. 95
Table 4.27 Distribution of Observed Instructional Strategies for Item 13........ 97
Table 4.28 Distribution of Scores for Item 13.................................................. 97
Table 4.29 Distribution of Observed Instructional Strategies for Item 14........ 99
Table 4.30 Distribution of Scores for Item 14.................................................. 99
Table 4.31 Percentages of Instructional Strategies........................................... 101
xvi
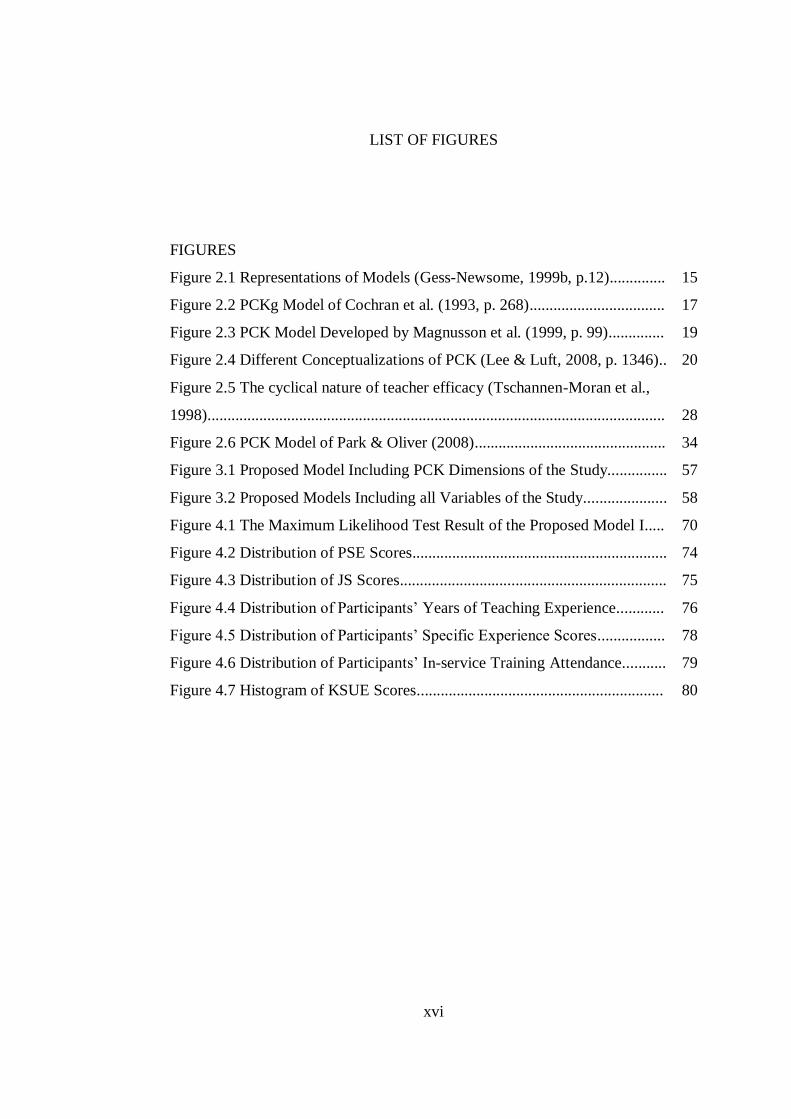
LIST OF FIGURES
FIGURES
Figure 2.1 Representations of Models (Gess-Newsome, 1999b, p.12).............. 15
Figure 2.2 PCKg Model of Cochran et al. (1993, p. 268).................................. 17
Figure 2.3 PCK Model Developed by Magnusson et al. (1999, p. 99).............. 19
Figure 2.4 Different Conceptualizations of PCK (Lee & Luft, 2008, p. 1346).. 20
Figure 2.5 The cyclical nature of teacher efficacy (Tschannen-Moran et al.,
1998)...................................................................................................................
28
Figure 2.6 PCK Model of Park & Oliver (2008)................................................ 34
Figure 3.1 Proposed Model Including PCK Dimensions of the Study............... 57
Figure 3.2 Proposed Models Including all Variables of the Study..................... 58
Figure 4.1 The Maximum Likelihood Test Result of the Proposed Model I..... 70
Figure 4.2 Distribution of PSE Scores................................................................ 74
Figure 4.3 Distribution of JS Scores................................................................... 75
Figure 4.4 Distribution of Participants’ Years of Teaching Experience............ 76
Figure 4.5 Distribution of Participants’ Specific Experience Scores................. 78
Figure 4.6 Distribution of Participants’ In-service Training Attendance........... 79
Figure 4.7 Histogram of KSUE Scores.............................................................. 80
xvii
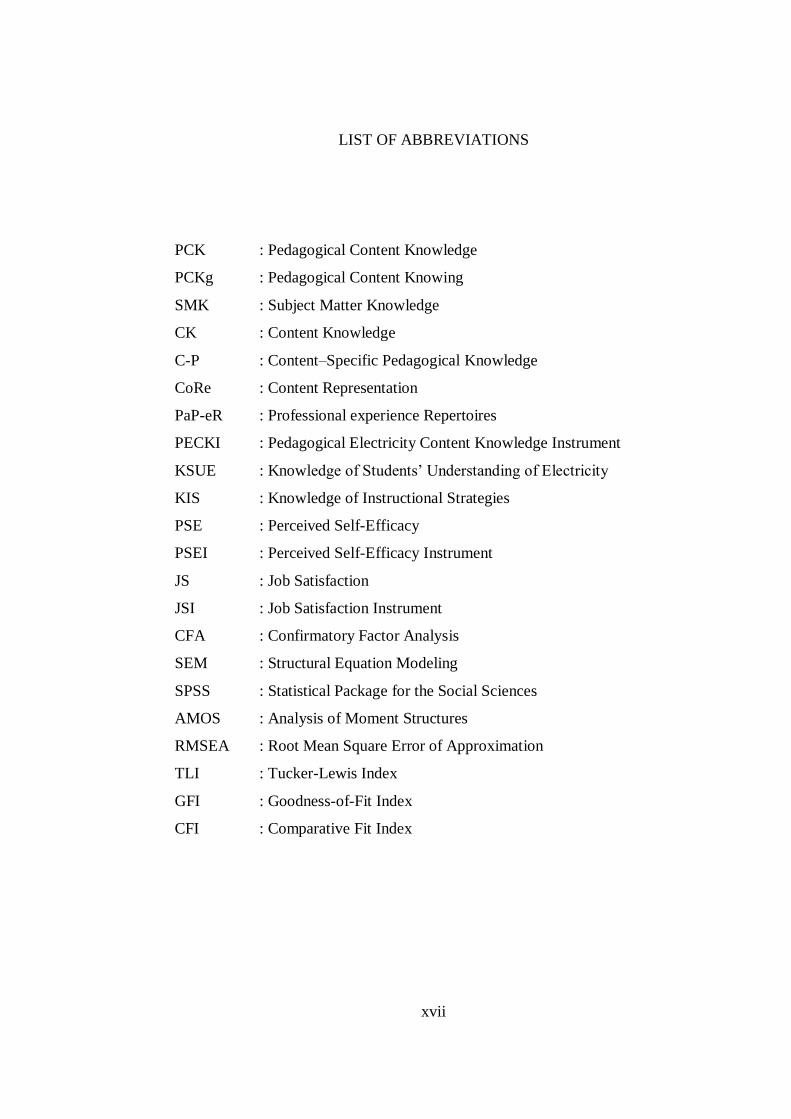
LIST OF ABBREVIATIONS
PCK : Pedagogical Content Knowledge
PCKg : Pedagogical Content Knowing
SMK : Subject Matter Knowledge
CK
C-P
CoRe
: Content Knowledge
: Content–Specific Pedagogical Knowledge
: Content Representation
PaP-eR : Professional experience Repertoires
PECKI : Pedagogical Electricity Content Knowledge Instrument
KSUE : Knowledge of Students’ Understanding of Electricity
KIS : Knowledge of Instructional Strategies
PSE : Perceived Self-Efficacy
PSEI : Perceived Self-Efficacy Instrument
JS : Job Satisfaction
JSI : Job Satisfaction Instrument
CFA : Confirmatory Factor Analysis
SEM : Structural Equation Modeling
SPSS : Statistical Package for the Social Sciences
AMOS : Analysis of Moment Structures
RMSEA : Root Mean Square Error of Approximation
TLI : Tucker-Lewis Index
GFI : Goodness-of-Fit Index
CFI : Comparative Fit Index
1
CHAPTER 1
INTRODUCTION
Even though many research studies in education directly focus on the
measurement and evaluation of students’ achievement and learning outcomes,
these attempts cannot portray classroom learning environments comprehensively
(Fraser, 2003). Teacher is one of the most vital components of a classroom
learning environment since his/her practice affects students’ achievement in and
meaningful understanding of a subject (Abell, 2007). By selecting (in)appropriate
teaching strategies and methodologies, teachers shape the classroom learning
environments, and therefore affects conceptual understanding of the students
(Heck, 2009; Linney, 1989). In this regard, it is important to determine
qualifications that contribute to teachers’ instructional practices and to evaluate
teachers on these qualifications (Fabiano, 1999). Efforts regarding determination
and evaluation of teacher qualifications also support the applicability of
educational reforms such as curriculum changes (MoNE, 2008; Tutkun &
Aksoyalp, 2010).
The gap between what a (physics) teacher wants to teach and what
students learn has been a fundamental issue in (physics) education (McDermott,
1991). This gap motivates education researchers to identify teacher qualifications
for different subjects including science such as physics, chemistry, etc…
Considering necessity of this identification, Ministry of National Education
(MoNE) in Turkey has started the studies for determination of teacher
qualifications since 2002. Determining teacher qualifications of elementary and
high school teachers in all subjects started in 2004 (MoNE, 2008) and completed
in 2011.
2
Dewey (1902), to the best of my knowledge, for the first time stated the
main differences between a scientist’s and a teacher’s role and knowledge as
regards subject matter. However, this comparison had not been magnified for
years. Ausubel (1968) stated that “the most important single factor influencing
learning is what the learner already knows. Ascertain this and teach him
accordingly” (p. iv). However, Ausubel’s statements did not also draw the
education researchers’ attention on teacher knowledge. Research on teacher
knowledge has been mainly conducted in only last three decades. Elbaz (1983)
referred teacher knowledge as ‘practical knowledge’ which was supporting
teachers to teach effectively in different contexts since this knowledge includes
students’ learning interests, abilities and difficulties together with different types
of instructional techniques. According to Elbaz (1983) practical knowledge is a
bridge between the curriculum and actual student learning.
In his famous research study, Shulman (1986) gave some examples to
teacher competency tests focusing mostly on the subject matter to be taught in
assessment of teachers and/or teacher candidates. According to him, these tests
were pointing out a missing paradigm which was about transformation of subject
matter into content of instruction. He named this knowledge domain as
pedagogical content knowledge (PCK). PCK is topic-specific and is formed by
‘the blending of content and pedagogy’ (Shulman, 1987). The main differences
between PCK and ‘practical knowledge’ are that the former is topic-specific and
implying the missing paradigm. Following these studies, Wilson, Shulman and
Richert (1987) defined teacher knowledge base as “the body of understanding,
knowledge, skills, and dispositions that a teacher needs to perform effectively in a
given teaching situation” (p.106). Based on the studies about teacher knowledge,
we can state that teacher knowledge base is an umbrella term including
knowledge domains required for effective teaching. In subsequent years,
researchers have included PCK in their descriptions of knowledge base of a
teacher (see for example, Carlsen, 1999; Grossman, 1990; Turner-Bisset, 1999).
Research studies describing structure of PCK has accelerated since
Shulman’s definition of this concept (Abell, 2008; Cochran, DeRuiter & King,
3
1993; Turner-Bisset, 1999; van der Valk & Broekman, 1999; Veal & MaKinster,
1999). These descriptive studies clarified that PCK has some other components
such as knowledge of students’ understanding, instructional strategies,
curriculum, assessment, and so forth. Even if these components were also defined
as domains of teacher knowledge base, PCK was constituted by (integration or
transformation of) these knowledge domains in many research studies (see for
example, Grossman, 1990; Magnusson, Krajcik & Borko, 1999, Tamir, 1988;
Wilson et al., 1987). Most of the descriptive studies modeling PCK represented
teachers’ knowledge of students’ understanding and instructional strategies as the
constituent components.
The importance of PCK arises from the fact that it is affected by teachers’
beliefs and is effective on their classroom implementations and decisions (van
Driel, Beijaard & Verloop, 2001). Teacher implementations and decisions in a
classroom can sometimes be sources of student misconceptions (Halim & Meerah,
2002; Yumuşak, 2008). In a science classroom, we cannot say that a particular
teaching strategy is more appropriate than others. Instead, we prefer to state that a
teaching strategy is appropriate when it is needed in accordance with students’
learning and cognitive abilities (Schroeder, 2007). Many researchers stressed that
teachers’ PCK have visible effects on their implementations, and decisions
regarding instructional strategies (Grossman, 1990; Magnusson et al., 1999).
Moreover, a group of researchers in mathematics education represented some
evidences that teachers’ PCK were effective on their students’ achievements (Hill,
Rowan & Ball, 2005).
PCK has been accepted as one of the fundamental concepts in teacher
education literature for three decades. However, descriptive studies related to
PCK have led to emergence of new labels for the already existing components of
PCK (Abell, 2007; Appleton & Kindth, 1999; Friedrichsen, 2008). For example
while Cochran et al. (1993) named one of the PCK components as ‘knowledge of
students,’ Magnusson et al. (1999) named the same component as ‘knowledge of
students’ understanding’ of science in their PCK models. In this respect, research
on PCK in science education should focus on teachers’ classroom
4
implementations of different topics and studies about assessment of teachers’
PCK instead of descriptive studies (Abell, 2008; van Driel et al., 1998).
In political arena, assessment of teachers’ PCK has gained much
importance for the last ten years in both international and national levels. National
Council for Accreditation of Teacher Education (NCATE) in the US included
PCK as a standard for assessment of teacher candidates’ performances (NCATE,
2002). In national level, MoNE published teacher qualifications, including PCK,
specified for each subject areas in both of elementary and high school education.
These standards and qualifications force researchers to develop ways for
assessment teachers’ PCK. Today many researchers from different subject areas
try to develop ways for assessing teachers’ PCK. Assessment of teachers’ PCK
gives feedback to teacher education and teacher professional development
programs in terms of how pre-service and in-service teachers’ knowledge should
be supported (Hill, Schilling & Ball, 2004; Lange, Kleickmann & Möller, 2009;
Rohaan, Taconis & Jochems, 2009). Assessment tools developed in such studies
provide guidance for teacher certification exams to assess teachers’ knowledge
base (Hill et al., 2004; Rohaan et al., 2009).
Baxter and Lederman (1999) stated that PCK assessment studies generally
use qualitative research designs, especially case studies. In these studies,
researchers generally use classroom observations, interviews and lesson plans as
data sources regarding assessment. These designs produced useful hints for
researchers about teachers’ PCK structures rather than assessment (Loughran et
al., 2001). However, because of the nature of these research designs and their
purposes, methods used to assess teachers’ PCK do not lend themselves for large-
scale assessment. Because such methods require long-term observations of
teachers’ classroom practices (Kagan, 1990, as cited in Baxter & Lederman, 1999;
Loughran, Mulhall & Berry, 2004; Rohaan et al., 2009; Rollnick et al., 2008).
Although these designs display teacher knowledge in greater detail, they are time-
consuming, include low number of teacher participants and need high-quantity
investment for assessment of teachers’ PCK (Baxter & Lederman, 1999; Kromrey
& Renfrow, 1991). In this regard, it seems that qualitative studies in do not make
5
conspicuous contributions to research area in terms of assessment of teachers’
PCK, although they have a potential to represent a more comprehensive picture of
a teacher’s PCK.
On the other hand, limited number of quantitative designs for assessing
teachers’ PCK use paper-and-pencil tests which consist of multiple-choice and/or
open-ended items. Researchers using these designs have struggled in construction
of test items due to the lack of a standard for teaching a particular subject or a
topic within that subject (Carlson, 1990; Kromrey & Renfrow, 1991; Rohaan et
al., 2009). Researchers who utilized quantitative designs generally used different
types of scenarios in items, since scenarios give them a chance for representing
classroom contexts. Additionally, teachers mostly avoid assessment of their
knowledge; however, scenario utilization in items decreases teachers’ reluctance
in such tasks (Hill et al., 2004; Krauss et al., 2008; Kromrey & Renfrow, 1991).
In science and technology education, some researchers, albeit limited in
number, constructed instruments for assessment of teachers’ PCK (Lange et al.,
2009; Rohaan et al., 2009). However, their approaches, as some of them have
themselves pointed out, have some issues in terms of reliability and/or validity.
On the other hand, mathematics educators seemed to find ways for assessing PCK
by using paper-and-pencil tests (Hill et al., 2008; Hill et al., 2004; Krauss et al.,
2008; Manizade, 2006). They could assess PCK directly instead of using proxy
measures which can be classified as number of courses taken by teachers during
their pre-service education, subject-matter competence, teaching experience and
cognitive abilities (Davis, 2003; Gess-Newsome, 1999a; Hill, Rowan & Ball,
2005; Wilson et al., 1987). In addition, their assessment approaches formed ways
for possibility of large-scale assessments of mathematics teachers’ PCK. Existing
literature pointed out that not only physics education area but also all the subject
areas need instruments enabling large-scale assessment of high school physics
teachers.
As mentioned previously, PCK is a multidimensional construct. Therefore,
rather than trying to assess all components of teachers’ PCK, it is more feasible to
concentrate on only a small number of components. In this study, developing
6
Pedagogical Electricity Content Knowledge Instrument (PECKI), we set out to
investigate PCK in two dimensions: namely ‘knowledge of students’
understanding’ (KSU) and ‘knowledge of instructional strategies’ (KIS). First
dimension focused on physics teachers’ knowledge about student preconceptions,
learning difficulties and misconceptions about electricity topic. Second dimension
provided evidence regarding which type of instructional strategies were mostly
being used by high school physics teachers for overcoming the students’ learning
difficulties and misconceptions in electricity. The reason for selecting these
components of PCK was the general acceptance of these in different
conceptualizations by different researchers.
Considering the topic-specific nature of PCK, I decided to focus on topics
related to electricity in physics to assess teachers’ PCK, since it is not feasible to
focus on all of the topics. Charging, electric fields, simple circuits, electric
potential, and electric energy and power were determined as the focused concepts
in electricity title. As a plethora of research studies have shown, students possess
many misconceptions related to physics. Electricity presents students with many
difficulties which sometimes results in misconceptions, even after physics
instruction (Sencar & Eryilmaz, 2004). Abstract nature of the concepts in
electricity causes that students have different types of learning difficulties and
misconceptions in this domain of physics. In this regard, it is important to portray
the physics teachers’ knowledge about their students’ learning difficulties and
misconceptions, since it is crucial for a teacher to be knowledgeable about student
understanding for an effective instruction.
In our assessment, we conducted a structural equation modeling study on
the data as a part of validation processes. In this regard, we, based on the
literature, needed to explore relationship of high school physics teachers’ PCK
with some other variables such as teachers’ years of teaching experience, specific
experiences, perceived self-efficacy (PSE) levels, job satisfaction (JS) levels and
the number of in-service trainings related to physics teaching programs attended.
Many researchers asserted that PCK develops with classroom practice and
teaching experience (Cochran et al., 1993; Crawford, 1999; Holt-Reynolds, 2000;
7
Morine-Dershimer & Kent, 1999; Veal, Tippins & Bell, 1999 among others).
Some other researchers clarified that teachers’ reflections in/on their practice had
more critical value for PCK development than magnitude of professional
experience. If teaching experience creates chances for teachers to be active and
reflective on their implementations, then it contributes to their PCK development
(Abd-El-Khalick, 2006; Park & Oliver, 2007). Therefore, year of teaching
experience could not be accepted as an immediate predictor of PCK; however,
this situation is still a controversial issue in physics education literature.
Teachers’ beliefs affect their decisions in classroom (Pajares, 1992; Park
& Oliver, 2007), and hence their PCK structures (Gess-Newsome, 1999a;
Magnusson et al., 1999; Tobin & McRobbie, 1999; van Driel et al., 2001). As a
critical part of teachers’ beliefs self-efficacy includes beliefs of teachers in their
capability affecting students’ learning (Gibson & Dembo, 1984; Swackhamer et
al., 2009). In this regard, teachers’ self-efficacy beliefs have an effect on their
instructional decisions, motivations, actions and performances (Caprara et al.,
2003). Some studies showed that there is a relationship between teachers’ PCK
and their self-efficacy beliefs (Swackhamer et al., 2009; Yoon et al., 2006).
Moreover, high levels of teacher job satisfaction (JS) also affect teachers’
instructional practices in classrooms and may have a positive effect on their
students’ achievements similar to self-efficacy beliefs and PCK (Caprara et al.,
2003; Viel-Ruma et al., 2010). Van der Heijden and Brinkman (2001) found that
employees’ JS level can positively predict their professional knowledge levels.
Additionally, deficiency in PCK may cause a decrease in teachers’ JS level (Azar
& Henden, 2003). In this respect, we thought that there should be statistically
significant relations between teachers’ PCK and JS level.
Furthermore, some researchers in this area included curricular knowledge
of teachers as a component of PCK in their models (Grossman, 1990; Loghran et
al., 2001; Magnusson et al., 1999; Tamir, 1988). According to integrative model
of PCK, each component develops independently from each other (Gess-
Newsome, 1999b). On the other hand, some researchers believe that in-service
training seminars conducted to develop teachers’ curricular knowledge may have
8
a positive direct effect on teachers’ PCK, since these programs have also a
potential to increase teachers’ qualifications in other dimensions of PCK in
accordance with the transformative model (Gess-Newsome, 1999b, Magnusson et
al., 1999, Nilsson, 2008).
Consequently, the purpose of my study is to assess high school physics
teachers’ knowledge of students’ understanding of electricity and knowledge of
instructional strategies related to teaching electricity by developing a paper-and-
pencil instrument consisting of open-ended items. In doing so, we focused on
Turkish high school physics teachers’ knowledge regarding their students’
preconceptions, learning difficulties and misconceptions, and the type of
instructional strategies they used for overcoming student difficulties and
misconceptions in electricity. In validation processes, we also provided evidence
regarding the relationship of high school physics teachers’ PCK and their years of
teaching experience, specific experiences, PSE levels, JS levels, and the number
of in-service trainings related to physics teaching programs attended.
1.1 Research Problems
There are three main research problems to be investigated in this study.
These research problems and the research hypotheses of the first research problem
prepared to collect evidence for the validation purposes were presented below:
The first research problem of my study was to establish acceptable validity
and reliability estimates for an instrument developed to measure knowledge of
students’ understanding of electricity and knowledge of instructional strategies
component of high school physics teachers’ PCK related to the teaching of
electricity. The research hypotheses are:
1) High school physics teachers’ years of teaching experience have a
positive, direct effect on their PCK.
2) High school physics teachers’ specific experiences have a positive, direct
effect on their PCK.
9
3) High school physics teachers’ PSE level has a positive, direct and indirect
effect on their PCK.
4) High school physics teachers’ JS level has a positive, direct effect on their
PCK.
5) High school physics teachers’ attendance to in-service training seminars
on the physics teaching programs has a positive, direct effect on their
PCK.
The second research problem is related to the assessment of high school
physics teachers’ knowledge about students’ pre-instructional thinking and
misconceptions in electricity. The research question related to this problem is
formulated as:
What is the level of high school physics teachers’ knowledge about
students’ pre-instructional thinking and misconceptions in electricity?
The third research problem is also related to the assessment of teachers’ PCK,
but this time on the component of teachers’ knowledge of instructional strategies
related to the teaching of electricity. The research question related to this problem
is formulated as:
What are the teaching strategies implemented by high school physics
teachers to overcome student learning difficulties and misconceptions in
teaching of electricity?
1.2 Statistical Research Hypotheses
In this section of the study, research hypotheses, constructed to collect
evidence regarding the construct-related validity of the instrument, were also
stated in statistical form. Therefore, we stated a null and an alternative hypothesis
for each of research hypothesis presented above, respectively.
H01: There is no positive and direct relationship between high school physics
teachers’ years of teaching experience and PCK scores.
10
H1: There is a positive and direct relationship between high school physics
teachers’ years of teaching experience and PCK scores.
H02: There is no positive and direct relationship between high school physics
teachers’ specific experiences and PCK scores.
H2: There is a positive and direct relationship between high school physics
teachers’ specific experiences and PCK scores.
H03: There is no positive, direct and indirect relationship between high school
physics teachers’ PSE and PCK scores.
H3: There is a positive, direct and indirect relationship between high school
physics teachers’ PSE and PCK scores.
H04: There is no positive and direct relationship between high school physics
teachers’ JS and PCK scores.
H4: There is a positive and direct relationship between high school physics
teachers’ JS and PCK scores.
H05: There is no positive and direct relationship between high school physics
teachers’ attendance to in-service training seminars on the physics
teaching programs and PCK scores.
H5: There is a positive and direct relationship between high school physics
teachers’ attendance to in-service training seminars on the physics
teaching programs and PCK scores.
1.3 Significance of the Study
My study contributes to physics education literature in several ways.
Firstly, there is a need for valid and reliable measures of PCK in physics
education. This study measured physics teachers’ PCK as direct as possible
instead of benefiting from proxy measures. Turkish teacher candidates have been
appointed to public schools by Personnel Selection Examination which does not
include items assessing teacher candidates’ PCK. Next, these types of instruments
can be utilized in assessment of teacher qualifications. Turkey Ministry of
National Education has determined teacher qualifications for all subjects,
11
including physics. In this regard, my study can be considered as an encouraging
attempt in assessment of PCK since it is providing an assessment tool for other
researchers who seek to design similar instruments in other domains of physics
and/or different aspects of PCK. Additionally, literature provides both empirical
and theoretical evidences regarding that a teacher’s PCK has relationship with
some other variables. Physics education literature needs clarification of these
relationships. Through its validation purposes, this study contributes to the
literature, in context of Turkey, with its empirical results regarding the
relationship between a high school physics teacher’s PCK and his/her year of
teaching experience, specific experiences, PSE level, JS level, in-service training
attendance regarding physics teaching program.
Secondly, this study shows what Turkish high school physics teachers
know about their students’ pre-instructional thinking and misconceptions in
electricity. Finally this study shows what type of teaching strategies are being
used by Turkish high school physics teachers to overcome students’ learning
difficulties and misconceptions in electricity. Portraying teachers’ knowledge in
these areas has invaluable importance to the education researchers about how they
should support the in-service and pre-service physics teachers.
1.4 Definitions of Important Terms
This section includes some important definitions of the terms as follow:
Pedagogical Content Knowledge: “special amalgam of content and pedagogy that
is uniquely the providence of teachers, their own special form of professional
understanding ... Pedagogical content knowledge ... identifies the distinctive
bodies of knowledge for teaching. It represents the blending of content and
pedagogy into an understanding of how particular topics, problems, or issues arc
organized, represented, and adapted to diverse interests and abilities of learners,
and presented for instruction” (Shulman, 1987, p. 8). We assessed high school
physics teachers’ PCK with PECKI (see Appendix D).
12
Perceived Self-Efficacy: “Within organizations, … perceived self-efficacy (PSE)
corresponds to the beliefs people hold about their capacity to meet successfully
the opportunities and challenges associated with the various tasks characterizing
their specific roles...” (Caprara et al., 2003, p. 821). We assessed high school
physics teachers’ PSE level with PSE instrument (see Appendix E)
Job Satisfaction: “Job satisfaction (JS) is multidimensional psychological
responses to one’s job. These responses have cognitive (evaluative), affective (or
emotional), and behavioral components. JS refers to internal cognitive and
affective states accessible by means of verbal—or other behavioral—and
emotional responses” (Hulin & Judge, 2003, p. 255). We assessed high school
physics teachers’ JS level with JS instrument (see Appendix E)
Misconception: In the Online Dictionary [OD] (2012), there are two definitions as
below:
1. An erroneous conception,
2. Mistaken notion.
Hestenes, Wells and Swackhamer (1992) define misconception as
“commonsense beliefs”.
Learning Difficulty: In the MacMillan Dictionary [MD] (2012), the definition is
that a condition that prevents someone from learning basic skills or information at
the same rate as other people.
Specific Experience: In this study, specific experience refers to whether the
participant teachers experienced the student learning difficulties or
misconceptions, represented in PECKI items, in their classroom context. The
information regarding teachers’ specific experiences was collected with additional
parts of PECKI, placed at the bottom of each item except for the last one.
Year of Teaching Experience: In this study, year of teaching experience refers to a
high school physics teacher’s teaching experience in years. Participant teachers
were requested to state their years of teaching experience on the beginning page
of PECKI.
13
CHAPTER 2
LITERATURE REVIEW
In this chapter, I presented a review of literature in three sections:
Definitions and common properties of PCK, assessment of PCK in mathematics,
and science and technology education, teacher self-efficacy, job satisfaction (JS)
and the relation of PCK with teachers’ perceived self-efficacy (PSE) and JS.
Finally, the summary of the literature review and some of our decisions taken by
analyzing the literature were presented.
2.1 Definition and Common Properties of PCK
In 1986, Shulman pointed out a missing paradigm regarding learning
environments with respect to teachers and called this paradigm as pedagogical
content knowledge. He described PCK as
…the most useful forms of representations of ideas, the most powerful
analogies, illustrations, examples and demonstrations,…an
understanding of what makes the learning of specific topics easy or
difficult: the conceptions and preconceptions that students of different
ages and backgrounds bring with them to the learning (Shulman, 1986,
p. 9).
One year later, Shulman (1987) declared some important characteristics of
PCK by defining it as a unique knowledge of teachers to represent particular
topics for instruction and bound with “diverse interests and abilities of learners”
(Shulman, 1987, p. 8). Wilson et al.’s (1987) teacher knowledge base included
seven components which are ‘knowledge of subject matter’, ‘pedagogical content
knowledge’, ‘knowledge of other content’, ‘knowledge of curriculum’,
14
‘knowledge of learners’, ‘knowledge of educational aims’ and ‘general
pedagogical knowledge’. In the containment of their study, PCK was mentioned
as a new type of subject matter knowledge benefiting from other knowledge
domains such as ‘Knowledge of the learner,’ ‘knowledge of the curriculum,’
‘knowledge of the context,’ and ‘knowledge of pedagogy’. After Shulman’s
clarification of PCK, some researchers extended its meaning and structure.
Existing studies show that researchers have reached a consensus partially
related to PCK. Firstly, PCK includes knowledge of representations of subject-
matter and knowledge of student conception (Grayson, 2004; Lee & Luft, 2008;
Nilsson, 2008; van Driel et al., 1998). Multiple representations of a topic, which a
teacher wants to teach, in accordance to the learners’ needs and/or contextual
situation of a learning environment has a critical importance for PCK (Magnusson
et al., 1999; Morine-Dershimer & Kent, 1999). Secondly, subject matter
knowledge (SMK) has a central importance for PCK. That is, SMK is a
prerequisite for well-structured PCK (Appleton & Kindth, 1999; Henze et al.,
2008; Kinach, 2002; Magnusson et al., 1999; Niess & Sholz, 1999; Tobin &
McRobbie, 1999; van Driel, Beijaard & Verloop, 2001; Zembal-Saul, Starr &
Krajcik, 1999). Thirdly, beliefs of teachers affect their decisions in classroom
(Pajares, 1992; Park & Oliver, 2007), and hence their PCK structures. (Gess-
Newsome, 1999a; Magnusson et al., 1999; Tobin & McRobbie, 1999; van Driel et
al., 2001). Fourthly, PCK develops with classroom practice (Cochran et al., 1993;
Crawford, 1999; Gess-Newsome, 1999b; Holt-Reynolds, 2000; Lederman &
Gess-Newsome, 1999; Morine-Dershimer & Kent, 1999; van Driel et al., 2001;
van Driel, de Jong & Verloop, 2002; Veal, Tippins & Bell, 1999). If teaching
experience creates chances for teachers to be active and reflective on their
implementations, then it contributes to their PCK development (Abd-El-Khalick,
2006; Park & Oliver, 2007). Finally, PCK can be used as an ‘organizer’ for
teacher education, professional development, and certification programs (Berry,
Loughran & van Driel, 2008; Carlsen, 1999; Cochran et al., 1993; Gess-
Newsome, 1999b; Mason, 1999), because PCK includes what teachers should
15
know and how to organize that knowledge to be able to support students’
meaningful and conceptual learning.
2.1.1 PCK Models
Gess-Newsome (1999b) summarized the PCK conceptions of researchers
based on their own PCK models. In the simplest form, there are two extreme
points about PCK models. On one hand, there is not a unique teacher knowledge
named as PCK that is, PCK is a construct comprised by the intersection of other
domains. This type of model is named as ‘integrative model’. According to the
integrative models, teaching is formed by integration of other knowledge
domains. On the other hand, some researchers defined PCK as a synthesis of all
the other knowledge domains. This type of model is called as ‘transformative
model’ which claims that PCK is a transformation of other knowledge domains
into a unique form for effective teaching. According to a transformative model,
other knowledge domains are only useful when they are transformed into PCK
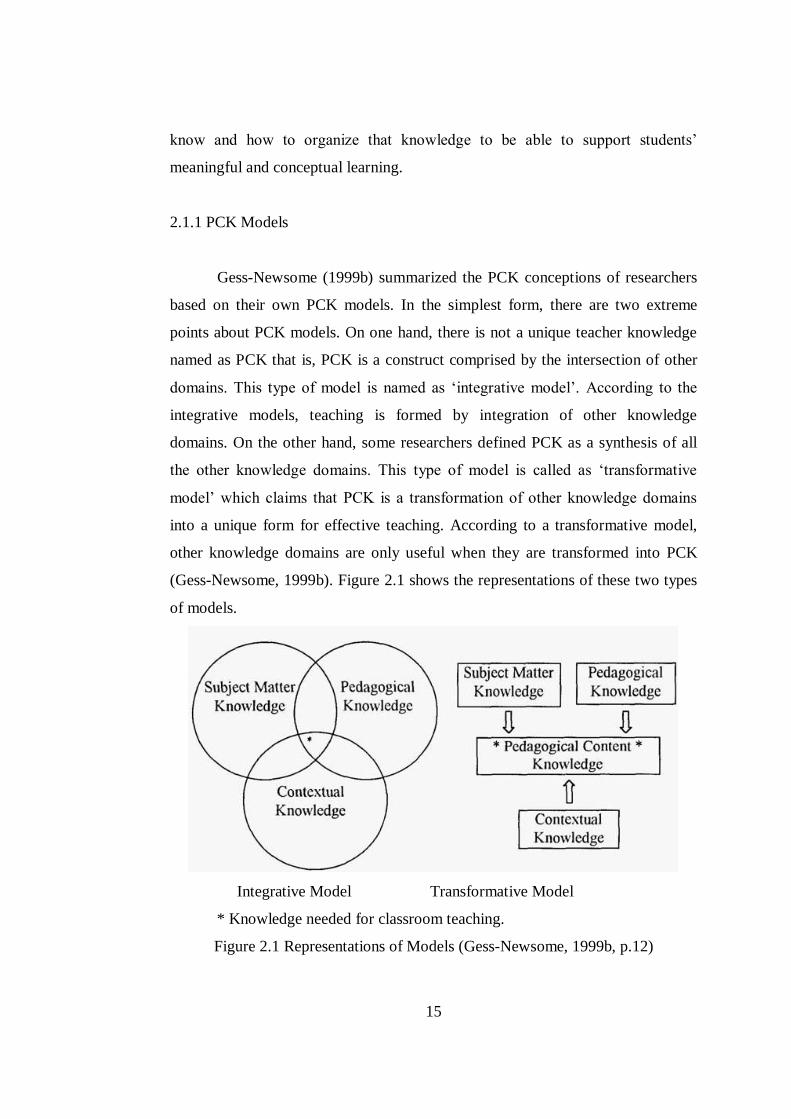
(Gess-Newsome, 1999b). Figure 2.1 shows the representations of these two types
of models.
Integrative Model Transformative Model
* Knowledge needed for classroom teaching.
Figure 2.1 Representations of Models (Gess-Newsome, 1999b, p.12)
16
Gess-Newsome (1999b) stated that integrative models might create
problems during classroom practices. For example, teachers may not realize the
importance of integration process and can proceed by emphasizing subject matter
knowledge on pedagogy. A possible danger also exists about transformative
models. In these models, teachers can make generalizations across different
classroom practices; however, this is a difficult process. Because of this difficulty,
teachers may ignore the importance of context and have a stable teaching
behavior.
PCK model of Grosmann (1990) composed of four central components
which are ‘conceptions of purposes for teaching subject matter,’ ‘knowledge of
students’ understanding,’ ‘curricular knowledge,’ and ‘knowledge of instructional
strategies’. The first component includes knowledge and beliefs about teaching
purposes for a subject at different grade levels. Second one contains knowledge of
teachers about student conceptions and misconceptions. What students already
know and what learning difficulties and misconceptions they have help teachers to
generate useful explanations and representations. Curricular knowledge refers to
teacher knowledge about what curriculum materials available for teaching topics
in his/her subject area, what students learned in the past, and what they will learn
in the future. Last component includes knowledge of representations and
instructional strategies for teaching specific topics.
Grossman (1990) offers four different sources contributing to development
of PCK which are apprenticeship of observation, disciplinary background,
professional coursework, and learning from experience. Apprenticeship of
observation provides prospective teachers with memories of instructional
strategies and representations for teaching specific topics. This source also
support teacher candidates related to knowledge of student understanding.
Disciplinary knowledge affects teachers’ conceptions of teaching particular topics
and selection of curriculum materials. Professional coursework, subject-specific
courses for prospective teachers, enriches knowledge of teaching specific topics.
Finally, experiences contribute to the development of PCK, because teachers have
the opportunity to test and be reflective on their knowledge.
17
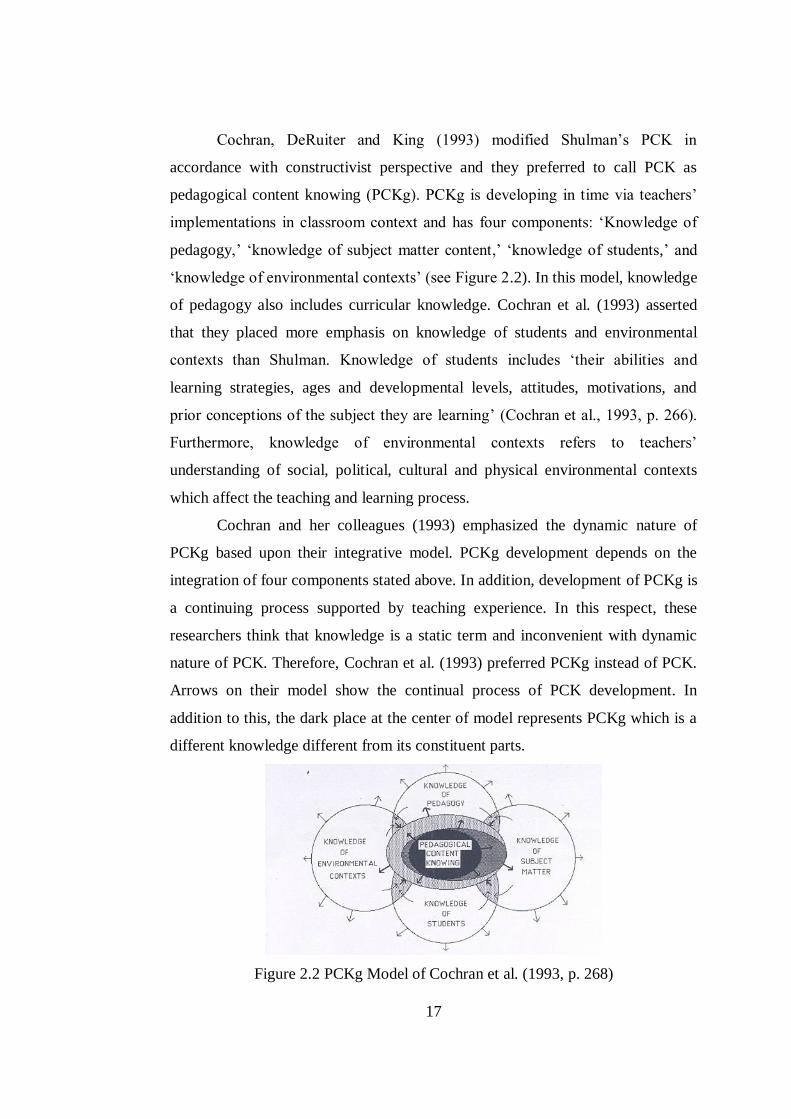
Cochran, DeRuiter and King (1993) modified Shulman’s PCK in
accordance with constructivist perspective and they preferred to call PCK as
pedagogical content knowing (PCKg). PCKg is developing in time via teachers’
implementations in classroom context and has four components: ‘Knowledge of
pedagogy,’ ‘knowledge of subject matter content,’ ‘knowledge of students,’ and
‘knowledge of environmental contexts’ (see Figure 2.2). In this model, knowledge
of pedagogy also includes curricular knowledge. Cochran et al. (1993) asserted
that they placed more emphasis on knowledge of students and environmental
contexts than Shulman. Knowledge of students includes ‘their abilities and
learning strategies, ages and developmental levels, attitudes, motivations, and
prior conceptions of the subject they are learning’ (Cochran et al., 1993, p. 266).
Furthermore, knowledge of environmental contexts refers to teachers’
understanding of social, political, cultural and physical environmental contexts
which affect the teaching and learning process.
Cochran and her colleagues (1993) emphasized the dynamic nature of
PCKg based upon their integrative model. PCKg development depends on the
integration of four components stated above. In addition, development of PCKg is
a continuing process supported by teaching experience. In this respect, these
researchers think that knowledge is a static term and inconvenient with dynamic
nature of PCK. Therefore, Cochran et al. (1993) preferred PCKg instead of PCK.
Arrows on their model show the continual process of PCK development. In
addition to this, the dark place at the center of model represents PCKg which is a
different knowledge different from its constituent parts.
Figure 2.2 PCKg Model of Cochran et al. (1993, p. 268)
18
Other researchers did not prefer to emphasize the dynamic nature of PCK
with its name, but they also had similar conceptions of PCK with Cochran and her
colleagues. This model is considering PCK as an integrative process. However,
some researchers assert that transformative models seem more appropriate than
integrative models for representing science teacher knowledge (Magnusson et al.,
1999; Nilsson, 2008). PCK of a science teacher is not an interaction of other types
of knowledge placed in teacher knowledge base; it is a transformation of them
supported by teaching practice (Nilsson, 2008).
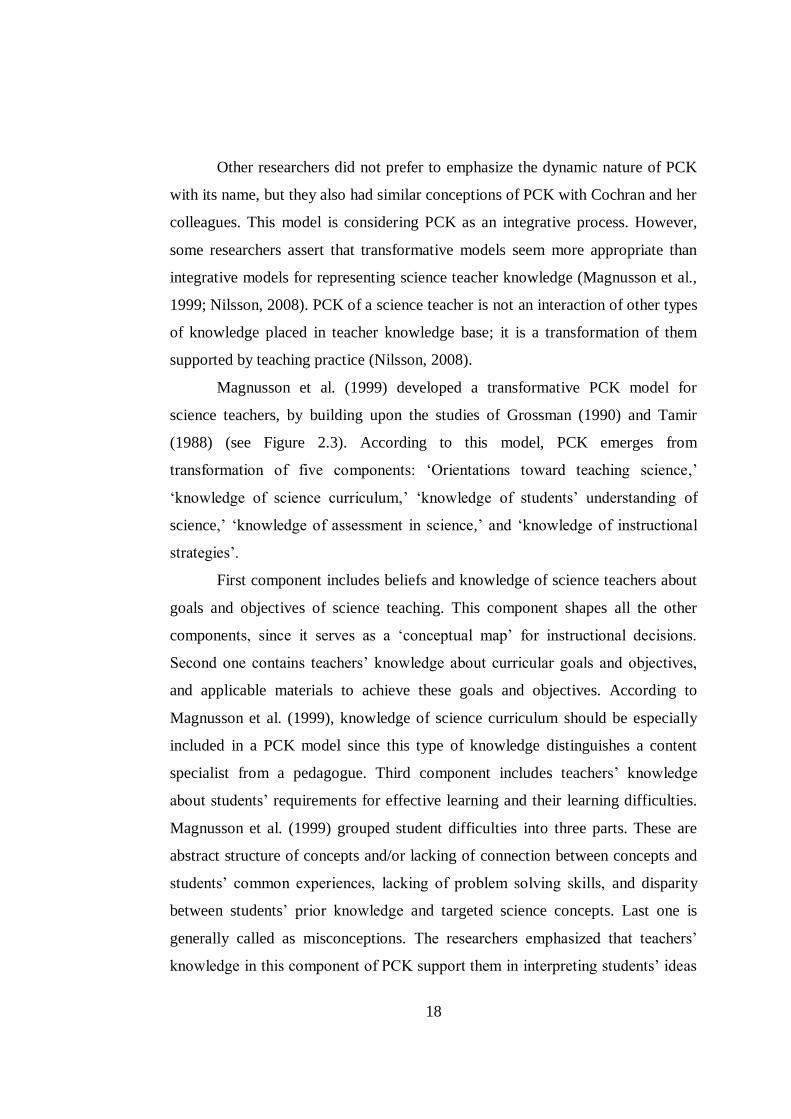
Magnusson et al. (1999) developed a transformative PCK model for
science teachers, by building upon the studies of Grossman (1990) and Tamir
(1988) (see Figure 2.3). According to this model, PCK emerges from
transformation of five components: ‘Orientations toward teaching science,’
‘knowledge of science curriculum,’ ‘knowledge of students’ understanding of
science,’ ‘knowledge of assessment in science,’ and ‘knowledge of instructional
strategies’.
First component includes beliefs and knowledge of science teachers about
goals and objectives of science teaching. This component shapes all the other
components, since it serves as a ‘conceptual map’ for instructional decisions.
Second one contains teachers’ knowledge about curricular goals and objectives,
and applicable materials to achieve these goals and objectives. According to
Magnusson et al. (1999), knowledge of science curriculum should be especially
included in a PCK model since this type of knowledge distinguishes a content
specialist from a pedagogue. Third component includes teachers’ knowledge
about students’ requirements for effective learning and their learning difficulties.
Magnusson et al. (1999) grouped student difficulties into three parts. These are
abstract structure of concepts and/or lacking of connection between concepts and
students’ common experiences, lacking of problem solving skills, and disparity
between students’ prior knowledge and targeted science concepts. Last one is
generally called as misconceptions. The researchers emphasized that teachers’
knowledge in this component of PCK support them in interpreting students’ ideas
19
and actions. Knowledge of assessment in science refers to teachers’ knowledge of
student learning and scientific literacy that is important to assess and assessment
procedures appropriate for different aspects of student learning. Last component
of the model includes teachers’ knowledge of subject-specific and topic-specific
strategies. Scope of subject-specific strategies (such as conceptual change
strategies and learning cycle) is wider than topic-specific strategies (such as
illustrations and analogies).
Figure 2.3 PCK Model Developed by Magnusson et al. (1999, p. 99)
20
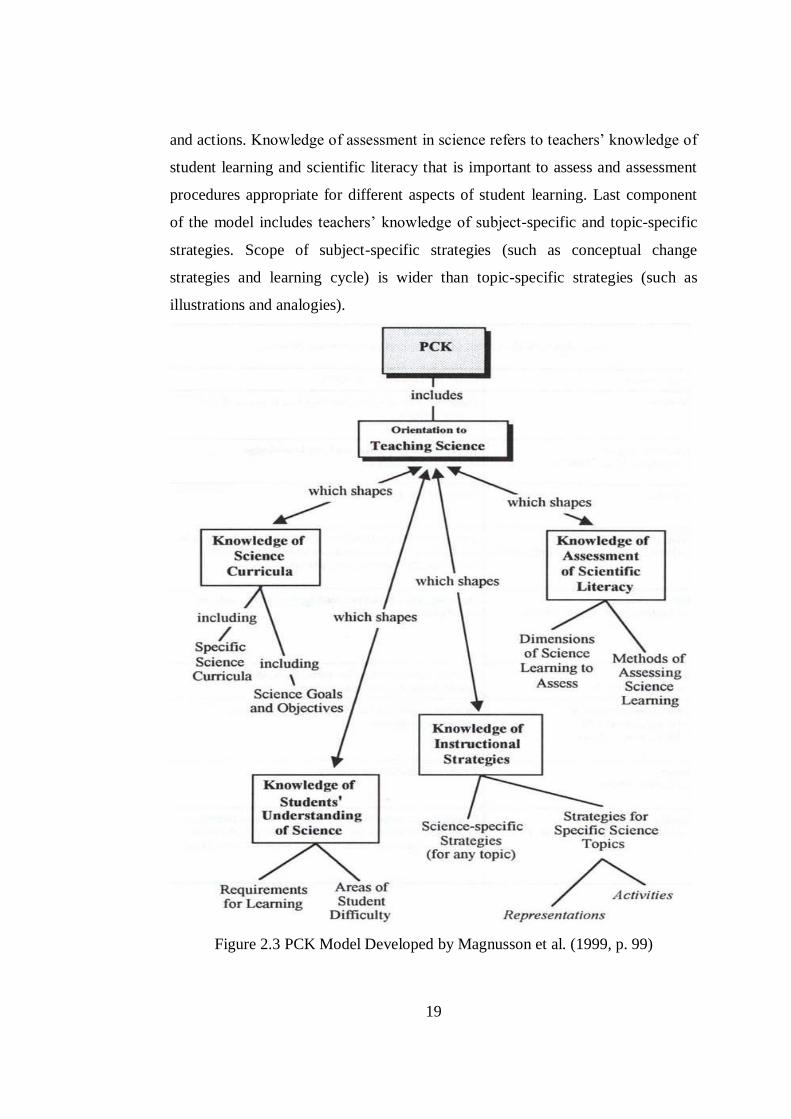
Lee and Luft (2008) represented all of the conceptions of PCK models
belonging to different researchers in this research area as shown in Figure 2.4.
This representation clearly shows that knowledge of student learning and
conceptions; and knowledge of representations and instructional strategies are the
common components of many PCK models and there is not a hierarchical
alignment between these components. This commonality indicates significance of
Shulman’s first definition of PCK on other researchers, since that definition was
only including these two dimensions of the concept. These common knowledge
dimensions of PCK were assessed in my study.
Figure 2.4 Different Conceptualizations of PCK (Lee & Luft, 2008, p. 1346)
2.2 Assessment of PCK
Existing literature shows that studies aiming to develop measures for
assessing PCK were mainly concentrated in two educational areas: mathematics
education, and science and technology education. Following sections will provide
detailed description of some studies in each group.
2.2.1 Assessment of PCK in Mathematics Education
In a project, Study of Instructional Improvement (SII), Hill et al. (2004)
studied on ‘teachers’ knowledge of mathematics for teaching’ and achieved to
21
develop measures of this knowledge for large-scale assessment of mathematics
teachers. They offered two sets of criteria to develop such measures: proposing a
delimited construct and analyzing the data with construct-identification methods
(Hill et al., 2008). The researchers selected ‘knowledge of content’ and
‘knowledge of students and content’ as the domains of teachers’ knowledge of
mathematics for teaching. They wrote 138 multiple-choice items focusing on two
content areas: number concepts and operations. All of the items were constructed
on scenarios because of two reasons. Firstly, scenarios gave a chance to the
researchers to represent a context similar to classroom in items. Secondly,
teachers were generally avoiding to be measured. Items were divided into three
forms by including same content areas and domains equally. Each item was
piloted with at least 377 elementary teachers. Exploratory factor analysis showed
that two domains mentioned above could be separable. Reliability coefficients for
the forms were found as 0.71, 0.73 and 0.78. At the end, they made cognitive
interviews to determine convergent validity. In another study, the same
researchers found that mathematics knowledge for teaching predicted first and
third grade kindergarten students’ achievements positively by controlling key
student and teacher-level covariates (Hill et al., 2005). This researcher group
could directly measure PCK of mathematics teachers instead of using proxy
measures such as teaching experience and teacher preparation. However, results
of cognitive interviews showed that test-taking skills and mathematical reasoning
of participants were effective in selection of correct answers.
Another group of mathematics educators not only tried to measure PCK
and content knowledge (CK) of high school mathematics teachers but also
showed that PCK and CK are separate domains of teacher knowledge (Krauss et
al., 2008). Open-ended survey items written to measure PCK included three
subscales: ‘Knowledge of mathematical tasks’ (4 items), ‘knowledge of student
misconceptions and difficulties’ (7 items) and ‘knowledge of mathematics-
specific instructional strategies’ (10 items). First subscale was intended to
measure teachers’ awareness of multiple solution paths. Second subscale focused
on teachers’ knowledge about possible student learning difficulties and
22
misconceptions. Items of this subscale utilized scenarios. Last subscale measured
teachers’ knowledge about useful representations, analogies, illustrations, etc…
accessible to students. There were also 13 open-ended items to measure CK.
Survey was implemented on a sample of 198 high school mathematics teachers in
Germany. While correct answers were scored 1, items with no response or an
incorrect response were coded 0. Sum of the correct answers was calculated.
Cronbach alpha reliability of PCK and CK scales were .77 and .83. Confirmatory
factor analysis (CFA) showed that PCK and CK are distinguishable knowledge
domains. This study produced encouraging results to assess teacher knowledge
with open-ended items.
Manizade (2006) also tried to develop survey items for measuring middle
school mathematics teachers’ PCK about geometry in her dissertation. She
mentioned that there was a requirement for describing new ways to assess
mathematics teachers’ PCK. In this respect, she used Delphi methodology, often
used in field of Economics, to construct her survey. This methodology is based on
consensus of an expert team around survey items structured by the researcher. Her
team included 20 participants in total from researcher experts, mathematics
education experts, teacher experts and mathematics education leader experts. The
researcher decided to use three multiple rounding of survey items to get
suggestions of experts in the team. At the beginning of the study, she identified
the dimensions of PCK and constructed 10 open-ended survey items including
scenarios. For the first rounding of the items, experts rated items from 1 to 5 and
wrote their suggestions. In the second rounding of the survey, experts reviewed
the modified items and other experts’ comments and ratings for each item. Third
rounding was a repetition of second rounding. By conducting qualitative and
quantitative data analysis, the researcher constructed the survey including 10
open-ended items. The researcher indeed offered a different methodology to
construct such a survey; however, Delphi methodology seems to provide only
content related evidence for the validation of items (Fraenkel & Wallen, 1996).
Survey was not administered to mathematics teachers, so we could not see
whether this survey would yield reliable scores. The survey developed in the
23
study can be a first step for constructing of such measures about PCK within this
form.
2.2.2 Assessment of PCK in Science and Technology Education
Halim and Meerah (2002) examined Malaysian science trainee teachers’
PCK on selected physics concepts. They administered a survey to 12 trainees for
capturing their knowledge about representing physics concepts to lower high
school students. Another data came from interviews conducted for the purpose of
investigating trainee teachers’ knowledge about student conceptions and
knowledge about representation ways of physics. As a result of their study,
researchers stated that trainees’ deficiency in content knowledge prevented them
to have a well-structured PCK. Selecting a qualitative design forced them to
include low number of participants in the study. Studying with trainee teachers in
a PCK assessment study is also problematic since the existing literature
emphasizes the necessity of (teaching) experience on development of PCK.
An Australian group of science educators invented a way to capture and
portray PCK of science teachers (Loughran et al., 2001; Loughran, Mulhall &
Berry, 2008; Loughran et al., 2004; Mulhall, Berry & Loughran, 2003). Over a
two-year study period, with a sample of 50 high school science teachers, they
developed two tools: Content Representation (CoRe) and Professional experience
Repertoires (PaP-eRs). CoRe was developed to measure what the critical aspects
of a specific science topic are and what students know about this topic. This tool
can be used not only for assessing science teachers’ understanding of the content
but also for a research tool (Loughran et al., 2004). The researchers implemented
CoRes as interview tools with small groups including three or four high school
science teachers. Attached to CoRe, PaP-eRs provide researchers opportunity to
get details about teaching process in practice of each teacher. Data for PaP-eRs
comes from individual interviews and classroom observations. One of the most
important aspects of these research tools is that a CoRe should be attached to
24
more than one PaP-eR since PaP-eRs are focusing on specific implementations of
science teachers in the classroom.
This study contributed to the existing literature by showing a way not only
for capturing science teachers’ PCK on a science topic but also showing tacit
nature of this knowledge to others. Validation was provided through a drafting
process between researchers and teachers. Assessment seems as a second purpose
for the researchers, but it is blurred how it can be possible based on the tools
developed in their studies. In addition, it is not possible to study with a large
sample of science teachers since it will not be feasible in terms of amount of time.
Finally, CoRes and PaP-eRs force teachers to invest much effort and time while
capturing and representing their PCK.
Another group of researchers from Holland tried to measure primary
technology teachers’ PCK focusing on three aspects: ‘Knowledge of student
conceptions,’ ‘knowledge of teaching strategies,’ and ‘knowledge of nature and
purpose of technology education’ (Rohaan et al., 2009). They benefited from
Kromrey and Renfrow’s (1987) ideas to create multiple-choice items. Kromrey
and Renfrow (1991) introduced researchers with ‘content-specific pedagogical
knowledge’ (C-P) items that represent teachers’ determination of treatment
preference for specific teaching contexts. By considering C-P items, Rohaan et al.
(2009) constructed 40 multiple-choice items which present teachers scenarios.
These scenarios included problematic situations for classroom contexts in terms of
students’ understanding of technology and asked teachers about what they would
do next. 40 multiple-choice items were divided into two equal forms and piloted
on a sample of 120 teachers. They selected 19 items by analyzing reliability of
pilot study data and retested the final form on 101 teachers. At the end, they
constructed a 19-item multiple-choice test with a test-retest reliability coefficient
of 0.36.
This study tried to measure PCK in a transformative way. That is, the
researchers measured all three aspects of PCK in each item. Reliability score of
the test provided us to consider assessing physics teachers’ PCK component by
component even if PCK has a transformative structure. Another criticism to this
25
study can be made about the criteria about right answers of multiple-choice items.
Although, there is not a standard for appropriateness of teaching strategies related
to any classroom context in existing literature; the authors approximated as if
there is.
German researchers developed a paper and pencil instrument including 13
open-ended and 3 multiple-choice items for measuring primary science teachers’
PCK (Lange, Kleickman & Möller, 2009). The researchers benefited from
Magnusson et al.’s (1999) PCK model and focused on dimensions of knowledge
of student understanding and knowledge of instructional strategies. The test was
piloted on 115 science teachers and final implementation was made on 107
teachers. They found a reliability score of 0.71 at the end. This study seems
yielded encouraging results for the purposes of this study.
Uşak (2005) studied on prospective elementary science teachers’ PCK
about flowering plants in his dissertation. This study included 4 prospective
elementary science teachers and used case study as the methodology. The
researcher collected data by video records of observed lessons, concept maps,
lesson plans, word association tasks, written documents and interviews. Data
triangulation showed that relation between prospective teachers’ SMK and PCK is
not constant among participants. In addition to this, prospective teachers have
misconceptions about the topic they teach. Another important finding of this study
is that development of PCK is a gradual process. In abstract, Uşak’s (2005)
dissertation produced descriptive results related to structure of prospective
teachers’ PCK. Because of the case study design, number of participants is not
enough to make generalizations about PCK structures of prospective elementary
science teachers.
Canbazoğlu (2008) assessed prospective elementary science teachers’
PCK related to structure of matter by utilizing case study methodology in her
dissertation. The sample included 5 prospective teachers. Data was collected by
classroom observations, interviews and written documents. This study shows that
SMK is a prerequisite for PCK, but not enough without other knowledge domains
such as knowledge of curriculum, knowledge of student understanding,
26
knowledge of instructional strategies. Prospective teachers, having teaching
experience in their subject area, possess more qualified and effective PCK than
other prospective teachers who have not any teaching experience. Results of this
study are consistent with existing literature.
2.3 Self-Efficacy
Self-efficacy refers to perceived beliefs, judgments, or capabilities of a
person for performing actions at designated levels (Bandura, 1977). Pajares
(2002) stated that self-efficacy beliefs serve people as a mechanism instrumental
to achieving and exercising their goals over their environment. According to
Bandura (1982) self-efficacy judgments of people have four main information
sources which are enactive attainments, vicarious experience, verbal persuasion
and physiological state.
Enactive attainments have the most influential effect on self-efficacy
information since they can be based on mastery experiences that is people’s own
successes and failures. Vicarious experiences is taking someone, performing
similar performances, as a model and comparing one’s own capabilities with the
model. Verbal persuasion is discourses coming from others to make the people to
believe that they have the needed capabilities for achieving what they want to
perform. Finally, physiological state includes people’s judgments regarding their
capabilities in terms of their own physical and emotional situations (Bandura,
1982).
Bandura (1982) stated that people could not isolate themselves from
society. Additionally, many of the challenges, which people encounter, are parts
of their societies. In this respect these challenges require collective efficacy which
influences people’s choices as a social group. As a different concept from PSE,
perceived collective-efficacy ‘reflects the beliefs members of an organization hold
about their capacity to operate in concert and to create the needed synergies
among different roles and expertise to meet adequately the obligations and
challenges of the group or organization’ (Caprara et al., 2003, p.821).
27
There are two dimensions of self-efficacy: personal self-efficacy and
outcome expectancy. Personal self-efficacy is “belief in one’s capabilities to
organize and execute the courses of action required to produce given attainments,
whereas outcome expectancy is a judgment of the likely consequence such
performances will produce” (Bandura, 1997, p.3, as cited in Cantrell, Young &
Moore, 2003).
2.3.1 Teacher Self-Efficacy
Research studies in this area dates back to introduction of self-efficacy by
Bandura. Teacher self-efficacy refers to the beliefs of teachers in their capabilities
and abilities affecting students’ learning (Gibson & Dembo, 1984; Swackhamer et
al., 2009). Researchers have found two separate dimensions of teacher self-
efficacy by the impact of Bandura’s social cognitive theory: personal teaching
efficacy and outcome expectancy (Tschannen-Moran, Woolfolk Hoy & Hoy,
1998).
Teachers with high levels of PSE believe that they can positively affect
student achievement (Viel-Ruma et al., 2010). High-efficacy teachers have higher
persistence in their students’ learning failure and higher expectations on their
students in comparison with low-efficacy teachers. This situation has a direct and
positive effect on their students’ meaningful learning and achievements (Gibson
& Dembo, 1984; Tschannen-Moran et al., 1998).
Tschannen-Moran and her colleagues developed the model cyclical nature
of teacher efficacy (see Figure 2.5) to present the conceptual issues regarding
teacher self-efficacy and to suggest new research areas. The model starts with the
four different information sources of self-efficacy stated by Bandura. In the
cognitive processing period, teachers determine impacts of the four different
information on analysis of teaching task and assessment of personal teaching
competence. In the next step, teachers analyze teaching tasks in terms of
requirements such as student abilities and instructional strategies, and make
assessment of personal teaching competences whether their current abilities are
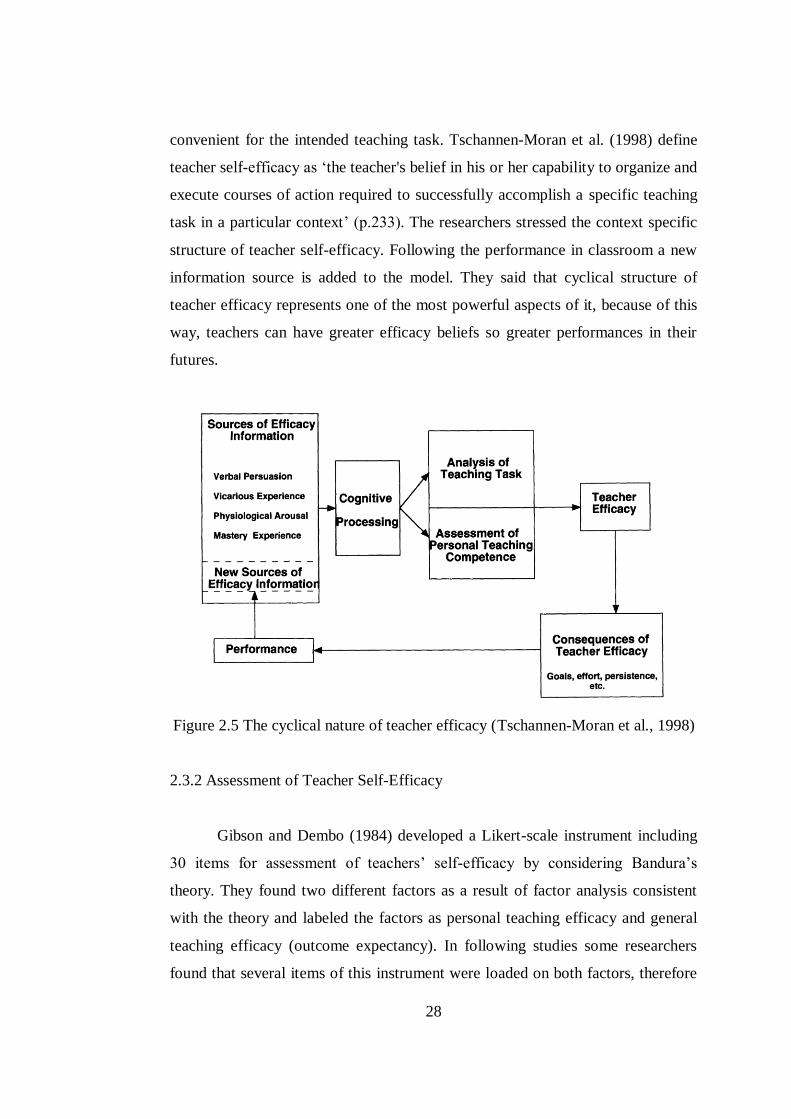
28
convenient for the intended teaching task. Tschannen-Moran et al. (1998) define
teacher self-efficacy as ‘the teacher's belief in his or her capability to organize and
execute courses of action required to successfully accomplish a specific teaching
task in a particular context’ (p.233). The researchers stressed the context specific
structure of teacher self-efficacy. Following the performance in classroom a new
information source is added to the model. They said that cyclical structure of
teacher efficacy represents one of the most powerful aspects of it, because of this
way, teachers can have greater efficacy beliefs so greater performances in their
futures.
Figure 2.5 The cyclical nature of teacher efficacy (Tschannen-Moran et al., 1998)
2.3.2 Assessment of Teacher Self-Efficacy
Gibson and Dembo (1984) developed a Likert-scale instrument including
30 items for assessment of teachers’ self-efficacy by considering Bandura’s
theory. They found two different factors as a result of factor analysis consistent
with the theory and labeled the factors as personal teaching efficacy and general
teaching efficacy (outcome expectancy). In following studies some researchers
found that several items of this instrument were loaded on both factors, therefore
29
another version of the instrument including 16 items was used by some other
researchers (Tschannen-Moran et al., 1998).
Gibson and Dembo (1984) asserted that teachers getting higher scores on
both dimension of the instrument would persist longer, provide different types of
feedback to their students and be active in their lessons than other teachers. Many
researchers supported the findings of this study.
Considering the context and subject-matter specific nature of teacher self-
efficacy some researchers tried to adapt the existing efficacy instruments to this
specificity (Tschannen-Moran et al., 1998). Riggs and Enochs (1990) developed a
Likert-scale instrument consisting of 25 items to assess efficacy of teaching
science based on Gibson and Dembo’s study. They also found two different
factors labeled as personal science teaching efficacy and science teaching
outcome expectancy.
In a following study, Rubeck and Enochs (1991, as cited in Tschannen-
Moran et al., 1998) goes further in subject-matter specification of the instrument.
In that study researchers tried to measure not only science teaching self-efficacy
but also chemistry teaching self-efficacy of high school teachers. The researchers
could distinguish science teaching self-efficacy from chemistry teaching efficacy
and found that the first one was significantly higher than the second one.
Among the discussions related to context or subject-matter specificity
assessment of teaching efficacy, Bandura (1997, as cited in Tschannen-Moran et
al., 1998) offered a new instrument including 30 Likert-items. Bandura stated that
teaching efficacy was ‘not necessarily uniform across the many different types of
tasks teachers are asked to perform, nor across different subject matter’
(Tschannen-Moran et al., 1998, p.219). Bandura’s instrument is including seven
sub-scales: efficacy to influence decision making, efficacy to influence school
resources, instructional efficacy, disciplinary efficacy, efficacy to enlist parental
involvement, efficacy to enlist community involvement, and efficacy to create a
positive school climate.
Caprara et al. (2003) also developed an instrument for assessment of PSE
of junior high school teachers. The instrument included 12 Likert-items
30
independent from context and subject-matter. Actually, Caprara and his
colleagues tried modeling the relations among teachers’ PSE, perceived
collective-efficacy and JS within school organizations. As a result of the study,
they declared that PSE was predicting JS directly and positively.
2.4 Job Satisfaction
JS refers to the degree of satisfaction an employee discloses regarding
his/her work (Fuming & Jiliang, 2008) and attitudes that an employee has related
to his/her job (Mahmood et al., 2011). In this respect, JS is a multidimensional
psychological response, including cognitive, affective and behavioral
components; to an employee’s his/her own job (Hulin and Judge, 2003).
Van der Heijden and Brinkman (2001) state that JS is an emotional
(affective) state rather than a personal characteristics. They emphasize that people
satisfy with their job if they achieve job requirements. This achievement can be
provided when people develop their professional knowledge. The researchers
provided evidence in study (consisting of 559 employees working in Dutch
companies) that people’s JS level predicted their professional knowledge (Van der
Heijden & Brinkman, 2001).
Many attempts have been realized for assessment of JS. Researchers
developed different assessment tools among which the Job Descriptive Index, the
Job Diagnostic Survey, the Minnesota Satisfaction Questionnaire and the Index of
Organizational Reactions are the mostly preferred ones in research studies. The
most widely applied assessment tool for JS is the Job Descriptive Index including
72 items in total focused on five facets of JS: work itself, pay, promotional
opportunities and policies, supervision, and coworkers (Hulin and Judge, 2003;
Stanton et al., 2001).
31
2.4.1 Teachers’ Job Satisfaction
Recent studies show that JS has a meaningful effect on peoples’ job
performances (Hulin and Judge, 2003). Therefore, it can be asserted that teachers’
JS affects their classroom performances and their students’ achievements (Caprara
et al., 2003; Klassen, Usher & Bong, 2010; Viel-Ruma et al., 2010).
Studies on teachers’ JS provide deeper understanding of teachers’ attitudes
towards school and contribute to the development of quality of teaching and
education (Fuming & Jiliang, 2008). Fuming and Jiliang (2008) offered an
increase in welfare benefits of teachers and quantity of software and hardware
materials of high schools , and a decrease in principal factors and class sizes for
raising teachers’ JS.
Klassen, Usher and Bong (2010) examined the relationship between
teachers’ collective efficacy and JS. They used JS instrument, adapted from the
Job Descriptive Index by Caprara et al. (2003), in the study. The study included
500 elementary and high school teachers from Canada, Korea (South Korea or
Republic of Korea), and the United States. As a result of the study they found that
there was a significant relationship between teachers’ JS and collective efficacy.
2.5 The Relation among Teachers’ Pedagogical Content Knowledge, Perceived
Self-Efficacy and Job Satisfaction
PCK was firstly introduced by Shulman as a part of teachers’ practical
knowledge developing with classroom implementation and experience (Wilson et
al., 1987). What Shulman referred with experience is the transformation of
knowledgebase dimensions of a teacher (Wilson et al., 1987) followed by
reflections in/on classroom implementations (Abd-El-Khalick, 2006; Park &
Oliver, 2007). These reflections have vital effects on teachers’ pedagogical
reasoning regarding their future implementations. The magic under this
pedagogical reasoning process is that it seems impossible to be completed, since
32
PCK has a context-based structure. Therefore, a teacher’s future implementations
will create new reflections and encircling will continue (Wilson et al., 1987).
Within the action oriented and context-bound structure (Gess-Newsome,
1999b), teachers’ practical knowledge, be seen as the core of teachers’
professionality, is a combination of teachers’ experiential knowledge and personal
beliefs (van Driel et al., 2001). The model, representing cyclical nature of teacher
efficacy offered by Tschannen-Moran et al. (1998), has almost the same circling
with transformation process of Shulman. Additionally, the model highlights the
term ‘experience’ distinctively since mastery experiences of teachers have the
most influential effect on their self-efficacy (Bandura, 1982). Beside of this,
literature offers some other commonalities between teachers’ PCK and self-
efficacy.
Yoon et al. (2006) investigated the relationship between teachers’ PCK
and self-efficacy. 12 elementary pre-service science teachers were participated in
the study. Teachers’ PCK was developed with the case method which spanned a
total of 3 hour. Based on the data triangulation, they found that case method
provided pre-service science teachers to gain confidence in their understanding of
PCK which, in turn, positively affected their self-efficacy beliefs. Some other
researchers also found the same relationship between PCK and self-efficacy of
pre-service science teachers (Mulholland & Wallace, 2001; Palmer, 2001).
Lin and Tsai (1999) examined the relationship between teaching efficacy
and PCK among in-service and pre-service science and math teachers. There were
11 expert teachers (having an average 11 years of teaching experience), 8
beginner teachers (in their first year of teaching) and 12 pre-service teachers.
Based on the video records, interviews and teaching efficacy scale data they found
that expert and beginner teachers had more qualified in their PCK and teaching
efficacy.
Swackhamer et al. (2009) investigated the relationship between PCK and
self-efficacy of middle school science and mathematics teachers in a 5-year
project study. 88 in-service teachers participated in the study. The main goal of
the project was to develop SMK and PCK of middle school teachers. Based on the
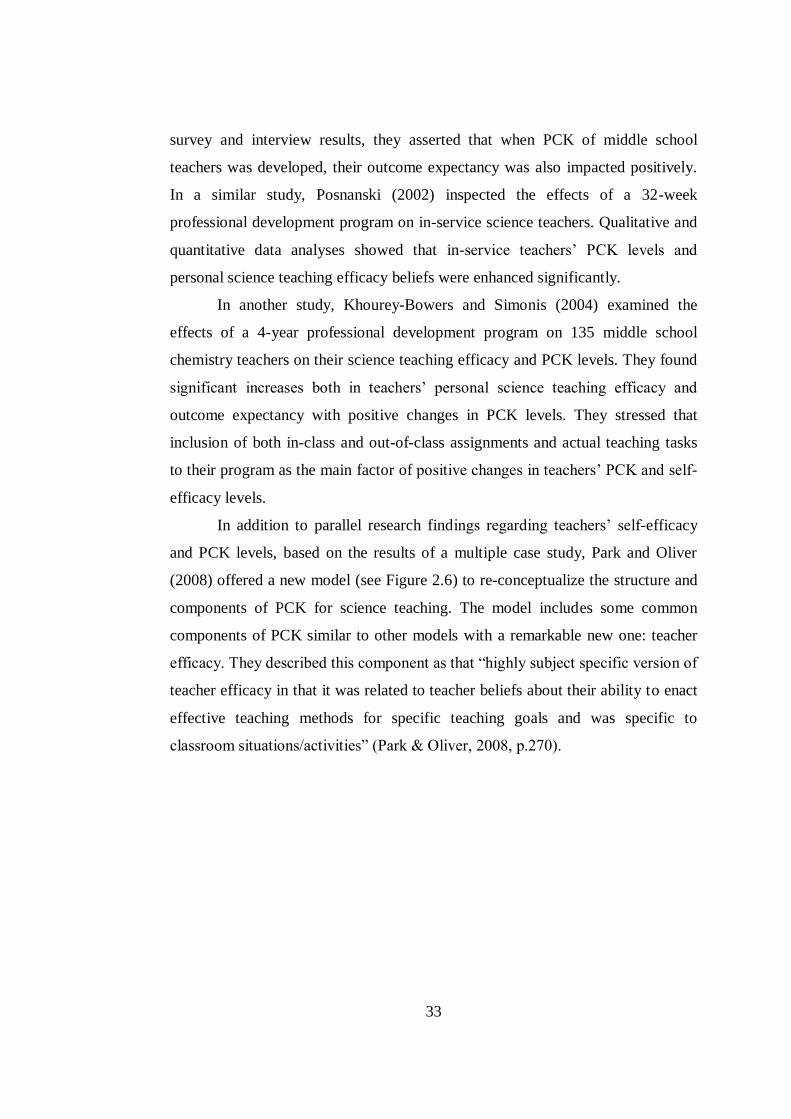
33
survey and interview results, they asserted that when PCK of middle school
teachers was developed, their outcome expectancy was also impacted positively.
In a similar study, Posnanski (2002) inspected the effects of a 32-week
professional development program on in-service science teachers. Qualitative and
quantitative data analyses showed that in-service teachers’ PCK levels and
personal science teaching efficacy beliefs were enhanced significantly.
In another study, Khourey-Bowers and Simonis (2004) examined the
effects of a 4-year professional development program on 135 middle school
chemistry teachers on their science teaching efficacy and PCK levels. They found
significant increases both in teachers’ personal science teaching efficacy and
outcome expectancy with positive changes in PCK levels. They stressed that
inclusion of both in-class and out-of-class assignments and actual teaching tasks
to their program as the main factor of positive changes in teachers’ PCK and self-
efficacy levels.
In addition to parallel research findings regarding teachers’ self-efficacy
and PCK levels, based on the results of a multiple case study, Park and Oliver
(2008) offered a new model (see Figure 2.6) to re-conceptualize the structure and
components of PCK for science teaching. The model includes some common
components of PCK similar to other models with a remarkable new one: teacher
efficacy. They described this component as that “highly subject specific version of
teacher efficacy in that it was related to teacher beliefs about their ability to enact
effective teaching methods for specific teaching goals and was specific to
classroom situations/activities” (Park & Oliver, 2008, p.270).
34
Figure 2.6 PCK Model of Park & Oliver (2008)
As a result, some research studies stated above, provides evidence that
there is a relationship between teachers’ PSE and PCK. Some other researchers
also state that teachers’ beliefs have a potential to affect their PCK structures
(Gess-Newsome, 1999a; Magnusson et al., 1999; Tobin & McRobbie, 1999; van
Driel et al., 2001).
Regarding these findings, we can state that teachers’ PCK and teaching
efficacy beliefs can affect their classroom implementations and decisions as parts
of their practical knowledge. JS is also another construct possessing an effective
potential on teachers’ classroom practices. In some studies researchers found that
teachers’ PSE beliefs is predicting their JS level positively and directly (Caprara
et al., 2003; Viel-Ruma et al., 2010).
35
Azar and Henden (2003) identified JS level of primary school teachers in a
survey study. 2450 primary school teachers, be assigned out of their profession,
participated in the study. They found that participated teachers had low scores in
JS. Based on the results they offered implementation of a non-thesis pedagogical
education program or a professional development program for improving these
teachers’ practical knowledge. Fuming and Jiliang (2008) also stated that
professional development programs aiming to support teachers’ qualifications
might provide teachers to realize their values in teaching, then, this realization
could arise in teachers’ JS.
2.6 The Summary of the Literature Review
I divided the reviewed studies related to PCK in several sections
systematically. First section of the literature review focused on conceptions of
different researchers regarding PCK and their PCK models. Second section
represented the assessment studies related to PCK in mathematics, and science
and technology education. Following sections provided information regarding
teachers’ PSE beliefs and JS.
PCK is a topic-specific construct including teachers’ knowledge of
representations, student difficulties and misconceptions. It is acting in teachers’
practices and helps teachers to transport their knowledge to learners. SMK has a
central importance but not enough alone for a comprehensive PCK. In this regard,
modeling studies show that PCK is an integration or transformation of other
knowledge domains. For an integrative model, PCK is not a knowledge domain
by itself; it is the integration of other knowledge domains. Possible problem with
this model is that teachers may never see the importance of integration and
neglect the importance of pedagogy. For a transformative model, PCK is a unique
knowledge domain constituted by other knowledge domains via transformation.
However, teachers may neglect the educational contexts and possess a stable
teaching manner within this model.
36
I also explained some PCK models with details in this part. Knowledge of
student learning and conceptions, and representations and instructional strategies
are the common knowledge domains of many PCK models. Researchers’
conceptions related to these common knowledge domains are also very similar.
In the second part of the literature review, I presented studies related to
assessment of PCK in mathematics, and science and technology education. In
mathematics education, assessment instruments include only multiple-choice
items or open-ended items. There are not any instruments including both of these
types of items. By conducting exploratory or confirmatory factor analysis,
researchers found that PCK and CK are separate domains of teacher knowledge
base. However, test-taking skills of teachers were found effective in their correct
responses for multiple-choice items.
Studies regarding PCK assessment in science and technology education
generally utilized qualitative designs, especially case studies. These studies seem
to produce descriptive results which may be used to categorize teachers in terms
of their PCK. Rohaan et al. (2009) wrote only multiple-choice items to assess
technology teachers’ PCK in three dimensions of PCK: ‘Knowledge of student
conceptions,’ ‘knowledge of teaching strategies,’ and ‘knowledge of nature and
purpose of technology education’. This study yielded low reliability for test
scores. This may because of measuring all the three dimensions of PCK together
in each item. Furthermore, Lange et al. (2009) could develop an instrument,
including open-ended and multiple-choice items, for assessing primary science
teachers’ PCK. They focused knowledge of student understanding and knowledge
of instructional strategies from Magnusson et al’s (1999) model of PCK. The
study yielded reliable scores.
In the remaining parts, I presented some studies asserting that teachers’
PSE beliefs and JS level affect their persistence in teaching even if the learning
environment has some negative sides. Some researchers found a remarkable
relation between teachers’ PCK and their self-efficacy beliefs. The similarities
between structures of PSE and PCK support the researchers stating that PSE has a
potential in predicting PCK.
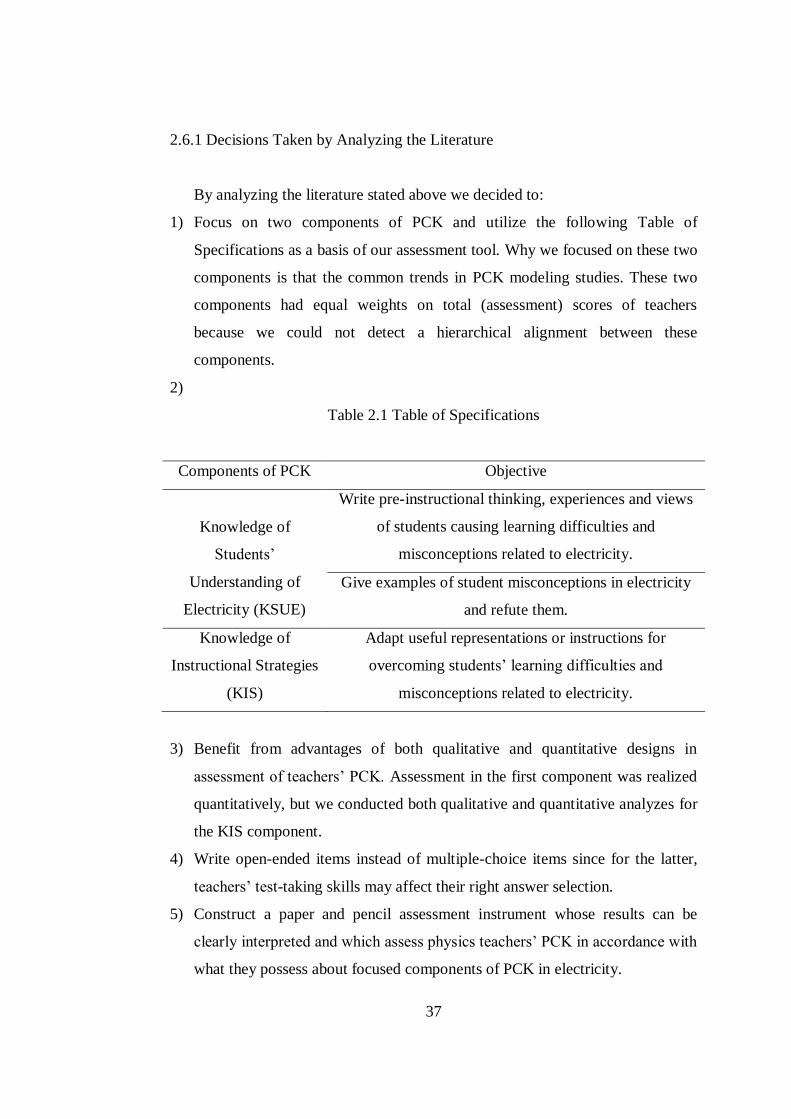
37
2.6.1 Decisions Taken by Analyzing the Literature
By analyzing the literature stated above we decided to:
1) Focus on two components of PCK and utilize the following Table of
Specifications as a basis of our assessment tool. Why we focused on these two
components is that the common trends in PCK modeling studies. These two
components had equal weights on total (assessment) scores of teachers
because we could not detect a hierarchical alignment between these
components.
2)
Table 2.1 Table of Specifications
Components of PCK Objective
Knowledge of
Students’
Understanding of
Electricity (KSUE)
Write pre-instructional thinking, experiences and views
of students causing learning difficulties and
misconceptions related to electricity.
Give examples of student misconceptions in electricity
and refute them.
Knowledge of
Instructional Strategies
(KIS)
Adapt useful representations or instructions for
overcoming students’ learning difficulties and
misconceptions related to electricity.
3) Benefit from advantages of both qualitative and quantitative designs in
assessment of teachers’ PCK. Assessment in the first component was realized
quantitatively, but we conducted both qualitative and quantitative analyzes for
the KIS component.
4) Write open-ended items instead of multiple-choice items since for the latter,
teachers’ test-taking skills may affect their right answer selection.
5) Construct a paper and pencil assessment instrument whose results can be
clearly interpreted and which assess physics teachers’ PCK in accordance with
what they possess about focused components of PCK in electricity.
38
6) Utilize multiplicity in teachers’ representations in accordance to the students’
learning needs/situation as a positive indicator for KIS.
7) Utilize teachers’ years of teaching experience, specific experiences regarding
students’ learning difficulties and misconceptions, PSE level, JS level and
attendance to in-service training seminars regarding physics teaching
programs as predictors for teachers’ PCK in validation processes.
39
CHAPTER 3
METHODOLOGY
The methodology chapter explains the research design, description of the
population and sample, variables of the study, description of instruments used for
data collection, procedure by which the study was conducted, rubric preparation,
description of the statistical techniques used in analyzing the results, limitations
and assumptions of the study.
3.1 Research Design
The purpose of this study was to assess PCK of physics teachers about
electricity topic in high school level by developing a paper and pencil instrument
consisting only open-ended items. In this regard, the instrument was distributed to
the participants, and therefore; the methodology of the study is cross-sectional
survey since I would collect the data ‘at just one point in time’ (Fraenkel &
Wallen, 1996, p.368; Johnson, 2001).
3.2 Population and Sample
Target population of the study is all the in-service high school physics
teachers in Turkey. Sample (regarding all the implementations during test
construction period) included 278 in-service physics teachers. In final
implementation, PECKI was administered to 124 high school physics teachers, by
convenience sampling from different parts of Turkey. 76 male (61.3%) and 48
(38.7%) female teachers participated in the final implementation. 56 of the
participants were the teachers who participated in an in-service training seminar in
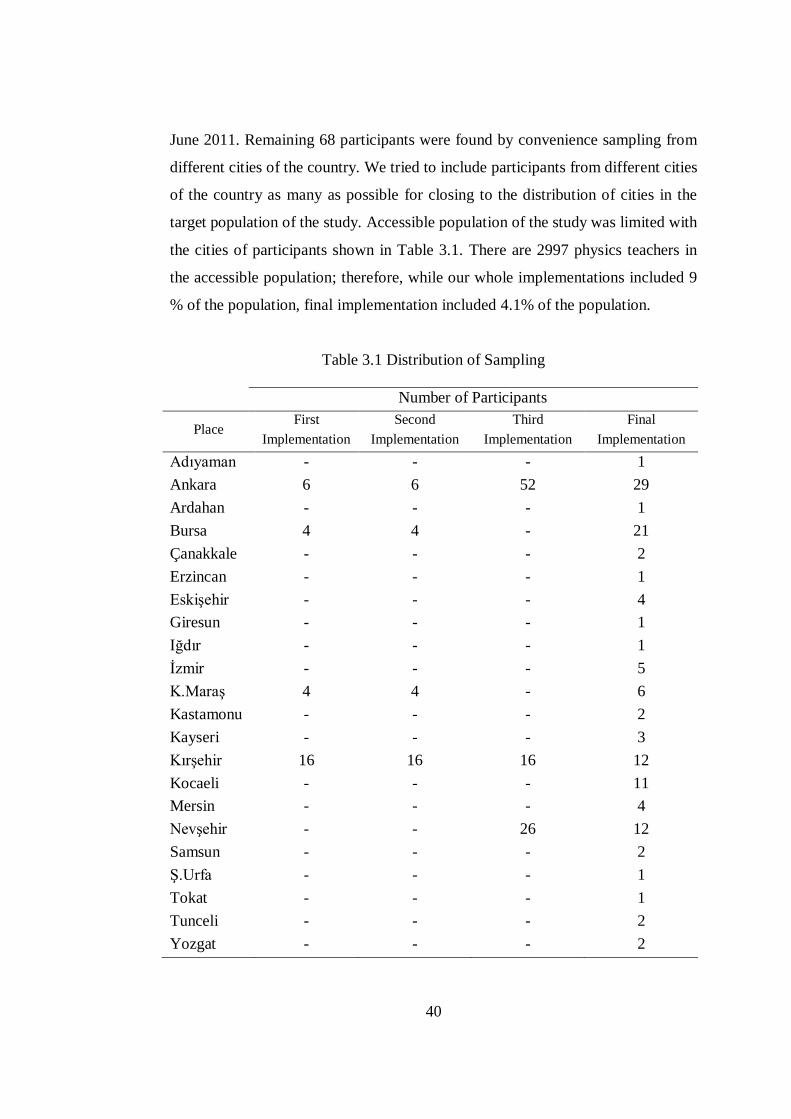
40
June 2011. Remaining 68 participants were found by convenience sampling from
different cities of the country. We tried to include participants from different cities
of the country as many as possible for closing to the distribution of cities in the
target population of the study. Accessible population of the study was limited with
the cities of participants shown in Table 3.1. There are 2997 physics teachers in
the accessible population; therefore, while our whole implementations included 9
% of the population, final implementation included 4.1% of the population.
Table 3.1 Distribution of Sampling
Number of Participants
Place First
Implementation
Second
Implementation
Third
Implementation
Final
Implementation
Adıyaman
Ankara
Ardahan
Bursa
Çanakkale
Erzincan
Eskişehir
Giresun
Iğdır
İzmir
K.Maraş
Kastamonu
Kayseri
Kırşehir
Kocaeli
Mersin
Nevşehir
Samsun
Ş.Urfa
Tokat
Tunceli
Yozgat
-
6
-
4
-
-
-
-
-
-
4
-
-
16
-
-
-
-
-
-
-
-
-
6
-
4
-
-
-
-
-
-
4
-
-
16
-
-
-
-
-
-
-
-
-
52
-
-
-
-
-
-
-
-
-
-
-
16
-
-
26
-
-
-
-
-
1
29
1
21
2
1
4
1
1
5
6
2
3
12
11
4
12
2
1
1
2
2
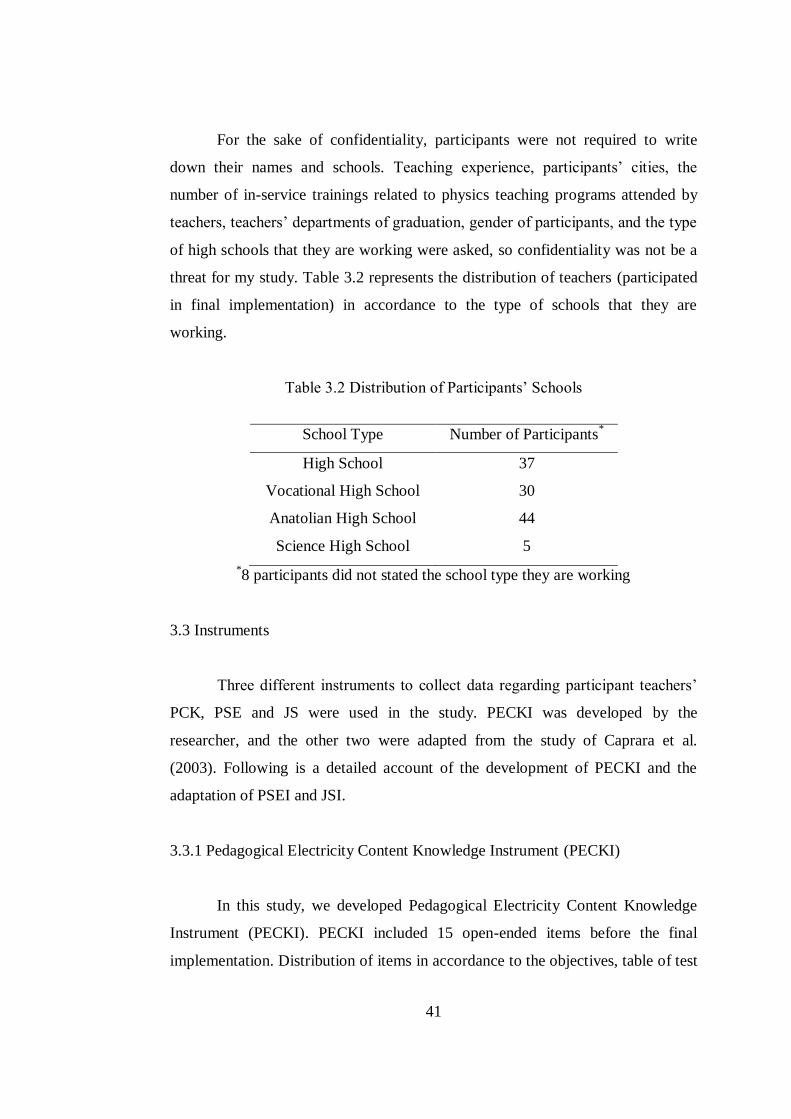
41
For the sake of confidentiality, participants were not required to write
down their names and schools. Teaching experience, participants’ cities, the
number of in-service trainings related to physics teaching programs attended by
teachers, teachers’ departments of graduation, gender of participants, and the type
of high schools that they are working were asked, so confidentiality was not be a
threat for my study. Table 3.2 represents the distribution of teachers (participated
in final implementation) in accordance to the type of schools that they are
working.
Table 3.2 Distribution of Participants’ Schools
School Type Number of Participants*
High School
Vocational High School
Anatolian High School
Science High School
37
30
44
5
*8 participants did not stated the school type they are working
3.3 Instruments
Three different instruments to collect data regarding participant teachers’
PCK, PSE and JS were used in the study. PECKI was developed by the
researcher, and the other two were adapted from the study of Caprara et al.
(2003). Following is a detailed account of the development of PECKI and the
adaptation of PSEI and JSI.
3.3.1 Pedagogical Electricity Content Knowledge Instrument (PECKI)
In this study, we developed Pedagogical Electricity Content Knowledge
Instrument (PECKI). PECKI included 15 open-ended items before the final
implementation. Distribution of items in accordance to the objectives, table of test
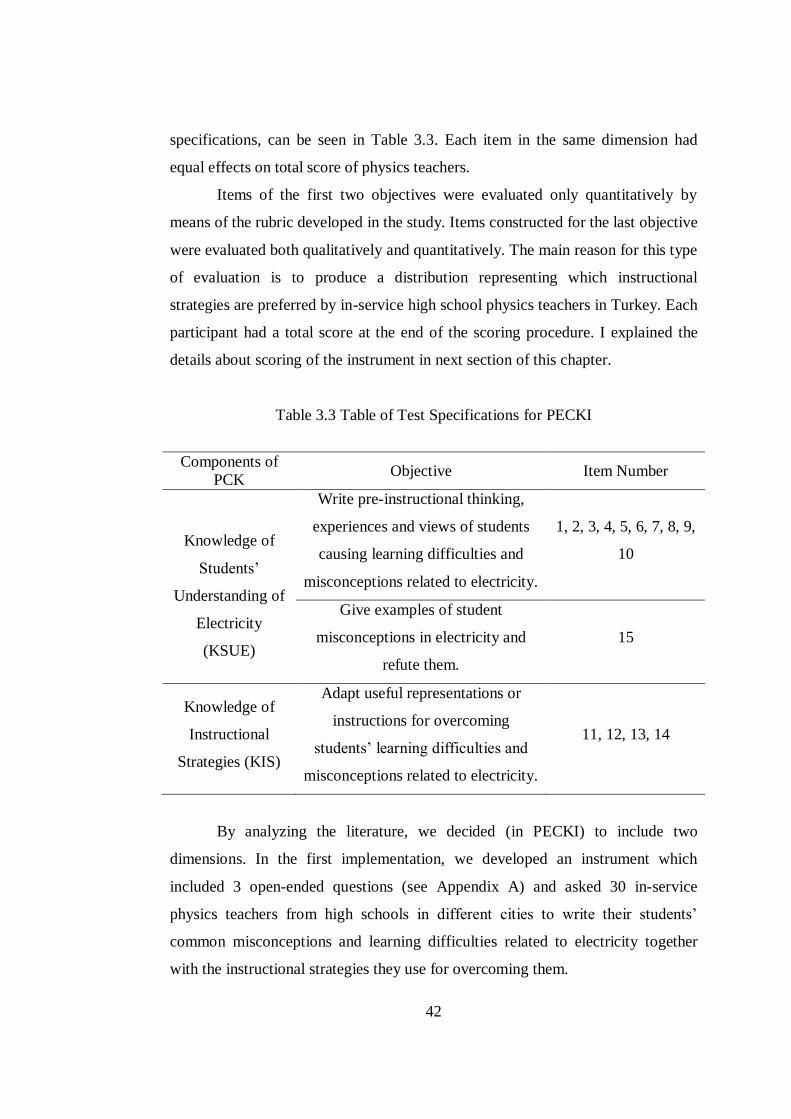
42
specifications, can be seen in Table 3.3. Each item in the same dimension had
equal effects on total score of physics teachers.
Items of the first two objectives were evaluated only quantitatively by
means of the rubric developed in the study. Items constructed for the last objective
were evaluated both qualitatively and quantitatively. The main reason for this type
of evaluation is to produce a distribution representing which instructional
strategies are preferred by in-service high school physics teachers in Turkey. Each
participant had a total score at the end of the scoring procedure. I explained the
details about scoring of the instrument in next section of this chapter.
Table 3.3 Table of Test Specifications for PECKI
Components of
PCK Objective Item Number
Knowledge of
Students’
Understanding of
Electricity
(KSUE)
Write pre-instructional thinking,
experiences and views of students
causing learning difficulties and
misconceptions related to electricity.
1, 2, 3, 4, 5, 6, 7, 8, 9,
10
Give examples of student
misconceptions in electricity and
refute them.
15
Knowledge of
Instructional
Strategies (KIS)
Adapt useful representations or
instructions for overcoming
students’ learning difficulties and
misconceptions related to electricity.
11, 12, 13, 14
By analyzing the literature, we decided (in PECKI) to include two
dimensions. In the first implementation, we developed an instrument which
included 3 open-ended questions (see Appendix A) and asked 30 in-service
physics teachers from high schools in different cities to write their students’
common misconceptions and learning difficulties related to electricity together
with the instructional strategies they use for overcoming them.
43
Following this implementation, the instrument for the second
implementation was constructed which included 19 open-ended items (see
Appendix B). We paid special attention to include most frequently repeated
student learning difficulties and misconceptions stated by the participant teachers
of the first implementation. In addition to these most frequent student
misconceptions and learning difficulties, three items (Items 9, 10 and 11) from a
dissertation study (Peşman, 2006) regarding student misconceptions in electricity
were adapted to be included in the second version of the instrument. This
instrument was given to co-supervisor and one physics educator for face and
content validation and then distributed to the same teachers from the first
implementation to control understandability. At the same time, teachers were also
asked to answer the questions in the test. Another aim of this implementation was
to transform the items into restricted response open-ended questions which would
require at most three or four sentences to answer.
Based on the results of the second implementation, we made some
corrections on some of the figures and statements represented in items to arise
understandability. In items 12, 15 and 18 participants gave the same answers. We
decided to delete these three items from the instrument since they could not make
a differentiation among the participants’ responses.
Third version of the instrument (see Appendix C) were divided into two
equal parts and distributed to 116 high school physics teachers from different
cities of the country. 94 teachers responded to this version of the instrument. In
this implementation, we asked teachers to time how long they spent answering the
questions in order to predict the whole instrument’s answering. This
implementation also served us to prepare the evaluation rubric for the final
implementation.
Based on the results of the third implementation Item 9 and first sub-
questions of items 11 and 15 (in third version of PECKI) were extracted from the
instrument, because we could not observe a variation in teachers’ responses for
these questions. At the beginning of this implementation, items 11 and 15 had two
different sub-questions constructed for two different objectives of the instrument.
44
By deleting first sub-questions, items 11 and 15 were completely directed to last
objective of PECKI. In addition to these changes, we decided to change item 16,
since teachers were required to write only refutation sentences for the
misconceptions represented in that item and this was mostly measuring teachers’
SMK rather than their PCK. And also, we constructed an additional part under all
PECKI items except for the last one to observe contribution of teachers’ specific
experiences to their PCK.
Just before the final implementation, the instrument which included 15
open-ended items (see Appendix D), was presented to two physics educators and
two PhD candidates from the physics education department of METU for face and
content validation purposes.
The researcher or trainer distributed the final version of the instrument to
the participants by providing a short introduction regarding the study. PECKI
forms also introduced the participants regarding the aims of the study itself. Time
limitation was not performed during implementations. Forms were collected in
following three days of distribution. Participants answered questions in the final
version of PECKI at their spare times. Items require teachers to think about their
classroom implementations and students’ learning difficulties or misconceptions
efficiently and then write their responses. In this regard, we thought our approach
about implementers, place, and time limitation increased participant teachers’
response rates to the items.
3.3.2 Perceived Self-Efficacy Instrument (PSEI)
Perceived self-efficacy instrument (PSEI) included twelve likert type items
measuring teachers’ PSE. PSEI was distributed to the teachers during final
implementation and presented on the second page of PECKI. The instrument was
adapted (by back translation of 2 foreign language educators) from the research
study of Caprara et al. (2003) (see Appendix E). The researchers provided
construct-related evidence with CFA. They found the cronbach alpha reliability as
45
0.74. We presented reliability score regarding our implementation in the next
chapter.
3.3.3 Job Satisfaction Instrument (JSI)
We measured teachers’ JS with four likert type items. This instrument was
distributed to the teachers during final implementation and presented on the
second page of PECKI. Job satisfaction instrument (JSI) was adapted (by back
translation of 2 foreign language educators) from the research study of Caprara et
al. (2003) (see Appendix E). The researchers provided construct-related evidence
with CFA. They found the cronbach alpha reliability as 0.82. The study was
introduced to 2688 high school teachers. Klassen et al. (2010) administered the
same test to a total of 500 elementary and high school teachers from Canada,
Korea (South Korea or Republic of Korea), and the United States and found the
reliability of the JSI as 0.83 (for Canadian teachers), 0.87 (for Korean teachers),
and 0.83 (for USA teachers) respectively. We presented reliability score regarding
our implementation in next chapter.
3.4 Variables
Variables of this study were obtained with final implementation of PECKI.
Following sub-sections contains detailed information regarding variables of the
study. Data regarding all the variables were collected in final implementation.
Teachers were asked to write down their years of teaching experience and the
number of attendance to in-service training seminars related to physics teaching
program on the first page of PECKI (see Appendix D).
3.4.1 Pedagogical Content Knowledge
It is a continuous variable obtained from the final implementation of the
instrument. PCK score corresponds to participants’ level of pedagogical content
46
knowledge related to teaching of electricity. There were fifteen open-ended items
measuring this variable. PECKI had two different dimensions named as
knowledge of students’ understanding of electricity (KSUE) and knowledge of
instructional strategies (KIS). PECKI score was found by summing the
participants’ scores in these two dimensions. Total maximum score available for
this test is 52 whereas the minimum score available is 0.
3.4.2 Perceived Self-Efficacy
It is a continuous variable obtained from the final implementation of the
instrument. PSE score corresponds to participants’ PSE level. There were twelve
5-point Likert items measuring this variable. Total maximum score available for
this test is 60 whereas the minimum score available is 12.
3.4.3 Job Satisfaction
It is a continuous variable obtained from the final implementation of the
instrument. JS score corresponds to participants’ JS level. There were four 5-point
Likert items measuring this variable. Total maximum score available for this test
is 20 whereas the minimum score available is 4.
3.4.4 Year of Teaching Experience
It is a continuous variable obtained from the final implementation of the
instrument. Year of teaching experience corresponds to years of participants’
teaching experience. We asked participants’ years of teaching experience on the
first page of PECKI.
47
3.4.5 Specific Experience
It is a continuous variable obtained from the final implementation of the
instrument. Specific experience score corresponds to whether participants having
previously experienced a specific student learning difficulty or misconception.
Under all PECKI items except for the last one, we asked participants to select if
the sources of their knowledge were their experience or their reasoning; or write
down the name of sources if they select ‘other’. There were only 7 ‘other’
responses given out of possible 1736. Therefore, we neglected the ‘other’
category and coded them as reasoning in dataset, because these teachers stated
they did not previously experience the student learning difficulty or
misconception represented in that item. Furthermore, there were 12 responses in
which nothing was selected as alternative or written an information source in
other category. We coded these cases manually as experience or reasoning by
skimming the previous answers of those teachers to similar items. Experienced
teachers got 1 point score for that item; hence each participant had a score out of
14 in this variable. The minimum score available for this variable of the study was
0.
3.4.6 In-service Training Attendance
It is an ordinal variable obtained from the final implementation of the
instrument. We asked participants how many times they attended an in-service
training seminar regarding physics teaching programs.
3.5 Procedure
At the beginning of the study, I reviewed the international and national
secondary sources in detail, by focusing on PCK and teacher knowledge. Then,
keywords were identified as ‘physics teacher;’ ‘science teacher;’ ‘teacher
knowledge base;’ ‘pedagogical content knowledge;’ ‘measurement of teacher
48
knowledge;’ ‘teacher assessment;’ ‘teacher self-efficacy;’ and ‘teachers’ JS.’
Next, these keywords were searched on Educational Resources Information
Center (ERIC), Ebscohost, Science Direct, Social Science Citation Index,
International Dissertation Abstracts, Google and Google Scholar. Hacettepe
Üniversitesi Eğitim Fakültesi Dergisi and Milli Eğitim Dergisi were also searched
for the above keywords. Finally, online service of the Council of Higher
Education (YÖK) were searched in detail for theses containing the above
keywords.
Based on the literature review and follow up implementations of the initial
versions of the PCK instrument, PECKI was developed and submitted to the
Middle East Technical University of Human Researches Ethic Committee for the
approval of the study (see Appendix F). In addition to this approval, permission of
the Turkish Ministry of National Education was taken for administration of the
survey to physics teachers during the in-service training seminar held in June,
2011, Aksaray (see Appendix G). Obtaining the approval and the permission took
approximately 6 weeks.
Finally, PECKI was distributed to 65 physics teachers attending the in-
service training. 56 PECKI forms were returned. We also distributed PECKI to
other 86 teachers, and received 68 PECKI forms. Consequently, final
implementation of PECKI included 124 high school physics teachers. Procedure
for data analysis was explained in the following sections.
3.6 Scoring Method
Miller et al. (2008) suggested two types of scoring methods for open-
ended items: ‘analytic scoring’ and ‘holistic scoring’. In analytic scoring rubrics,
evaluators should focus on one aspect of the answer at a time. The most important
characteristic of this type of scoring method is to provide participants with
detailed feedback via separate scores attained to their responses in terms of
different aspects. On the other hand, holistic scoring offers only one score for the
entire response of a participant. Regarding PECKI, participants were not required
49
to give responses including different aspects at a time. Therefore, we decided to
adapt holistic scoring approach in our study.
In our holistic scoring rubric, we aligned the true answers for an item with
their scores. We warned the independent raters about to use these scores at
guidelines part of the rubric for a particular question. If a participant’s answer
included all the true responses/sentences represented in the rubric, this
participant’s paper was scored as 2 for that item. This procedure was applied for
evaluation of the first ten items of the instrument.
For the 15th item, evaluation procedure was different from others. In this
item, we wanted participants to write one misconception about current, potential
difference, electrostatic force with refutation statements. We aligned all the
(teacher-introduced) misconceptions respectively with their refutation statements
provided by participant teachers. In this item, all the responses including a
misconception were scored as 1. If a participant also refuted the misconception
convincingly, his/her answer was scored as 2 for only that concept. Refutation
statements were not always scored as 1. They sometimes were scored as 0.5.
Types of refutation statements for each of teacher introduced misconception, we
encountered in responses, were also presented in the related part of the rubric.
Therefore, the maximum score for the 15th item was 6 and for all the items
constructed for the first two objectives was 26.
We firstly categorized teachers’ responses in accordance to the coding
categories to start the scoring of questions of the second component of our
instrument (teachers’ KIS). This component has the same weight on the total
scores of participants as KSUE. KIS contained four different items; hence, each
item had a 6.5 maximum score with 26 as maximum total score. Regarding these
items, scores were distributed according to whether teachers changed their
instructional strategies for repetition of the subject. We observed two different
instructional strategies at maximum in each of responses. Therefore, if they did
not change their instructional strategies for repetition they got 3.25 point in that
item, but if they changed they got 6.5 point.
50
3.6.1 Rubric for Rating
Scoring open-ended questions poses problems for reliability. Miller, Linn
and Gronland (2008) offered several steps to increase the reliability of scoring
open-ended questions. These are preparing scoring key, using the most
appropriate scoring method, deciding how to handle irrelevant factors, evaluating
all answers to one question before going on to the next, scoring the answers
without looking at participants’ names and obtaining independent ratings. A
rubric (see Appendix H), which had two parts, was prepared for evaluation of
written responses of participants. First part of the rubric included guidelines about
scoring. There were two independent raters in the study, one was the researcher
and other was a research assistant (also PhD candidate in the same department)
from METU in department of physics education. Therefore, guidelines firstly
informed the independent raters about scoring method which was described in
next section. Secondly, guidelines warned the independent raters about not to give
scores by considering the irrelevant factors such as handwriting, spelling, sentence
structure, etc… Finally, guidelines suggested independent raters to evaluate all
answers to one question before going to the next. Furthermore, names of
participants were not demanded during the data collection, therefore it was not a
threat for reliability.
In the second part of the rubric, there was a scoring key. Scoring key was
constructed based on participants’ answers obtained via third implementation,
because this version of PECKI is very similar to the final form. Then, the scoring
key was modified based on views of the co-supervisor and two research assistants
in physics education department. In addition to this, papers of final
implementation were also revised to extend the right answers scope of the rubric.
3.7 Analysis of Data
Analysis included several steps in this study. First of all, we prepared the
rubric based on the written responses of teachers. We created the rubric which
51
included the categories of correct answers obtained from the last two
administration of PECKI. Each teacher’s paper was scored according to this
rubric. All the scores were entered on Statistical Package for the Social Sciences
(SPSS). Then, descriptive statistics and some of the statistics for validity and
reliability analysis and principal component factor analysis were conducted on
SPSS. In next step, confirmatory factor analysis including only PECKI items
followed by confirmatory structural equation modeling including all variables of
the study were conducted on AMOS program.
3.7.1 Validity and Reliability Evidences
Validity is the most important characteristic for assessment studies to
make sure that one makes accurate interpretations based on data of the survey.
Fraenkel and Wallen (1996) stated that “validity refers to the appropriateness,
meaningfulness and usefulness of the inferences a researcher makes” (p. 152).
At the beginning of the analysis, we firstly scored teachers’ responses to
the KSUE items of PECKI according to the rubric explained in detail in Section
3.6. Weight of each correct response for an item represented in the rubric were
determined by detailed discussion among two research assistants, the researcher
and the co-supervisor. Refutation sentences’ scores were also determined with
regard to the convincing power by the same group of researchers.
We selected second item to give some details about coding of teachers’
responses since this item has the maximum variation in teachers’ responses. In the
second item (see Appendix D), we presented teachers with a student learning
difficulty from electrostatics. Table 3.4 shows the correct responses presented in
the rubric and alternative responses that teachers provided as their answers for this
item.
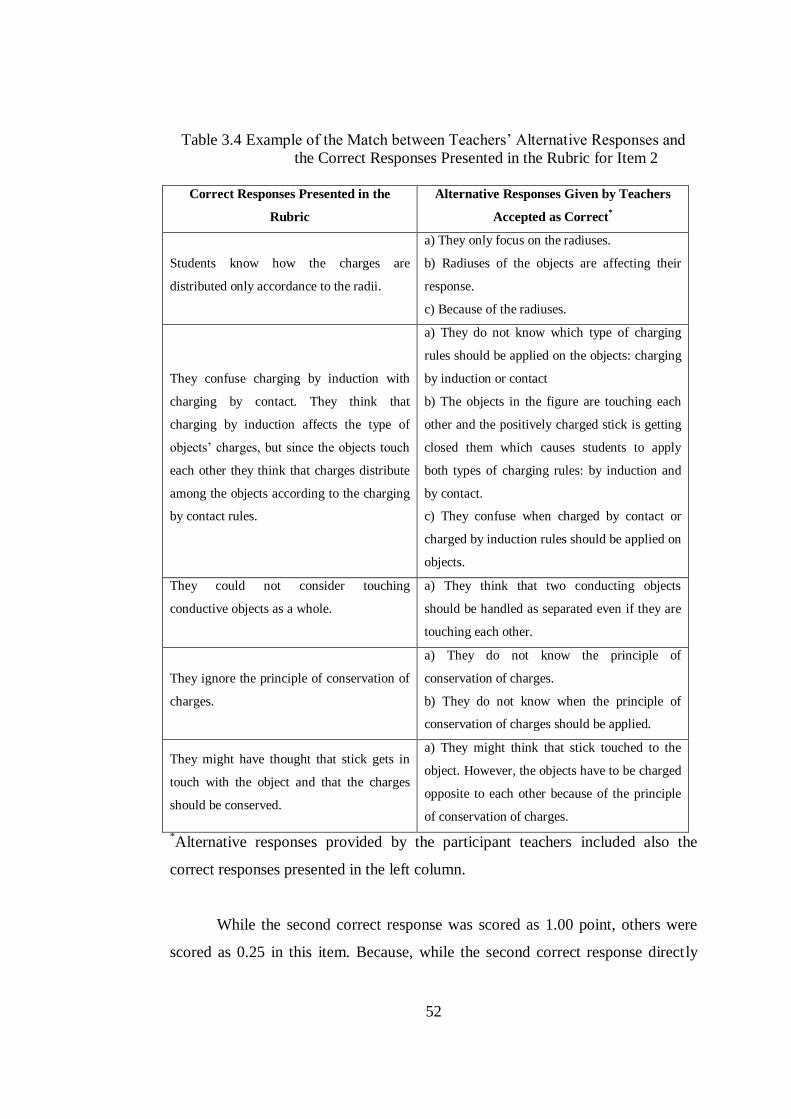
52
Table 3.4 Example of the Match between Teachers’ Alternative Responses and
the Correct Responses Presented in the Rubric for Item 2
Correct Responses Presented in the
Rubric
Alternative Responses Given by Teachers
Accepted as Correct*
Students know how the charges are
distributed only accordance to the radii.
a) They only focus on the radiuses.
b) Radiuses of the objects are affecting their
response.
c) Because of the radiuses.
They confuse charging by induction with
charging by contact. They think that
charging by induction affects the type of
objects’ charges, but since the objects touch
each other they think that charges distribute
among the objects according to the charging
by contact rules.
a) They do not know which type of charging
rules should be applied on the objects: charging
by induction or contact
b) The objects in the figure are touching each
other and the positively charged stick is getting
closed them which causes students to apply
both types of charging rules: by induction and
by contact.
c) They confuse when charged by contact or
charged by induction rules should be applied on
objects.
They could not consider touching
conductive objects as a whole.
a) They think that two conducting objects
should be handled as separated even if they are
touching each other.
They ignore the principle of conservation of
charges.
a) They do not know the principle of
conservation of charges.
b) They do not know when the principle of
conservation of charges should be applied.
They might have thought that stick gets in
touch with the object and that the charges
should be conserved.
a) They might think that stick touched to the
object. However, the objects have to be charged
opposite to each other because of the principle
of conservation of charges.
*Alternative responses provided by the participant teachers included also the
correct responses presented in the left column.
While the second correct response was scored as 1.00 point, others were
scored as 0.25 in this item. Because, while the second correct response directly
53
results in the student learning difficulty focused in that item, other responses
given by teachers do not alone directly result in the same difficulty. Teachers’
scores for the first ten items changed, naturally, in accordance with the number of
correct responses they gave. Total score of a participant for an item was calculated
by summing up the weighted points given in the rubric for each of the correct
response included in his/her answer.
Following the rubric preparation, we constructed the coding categories
based on the participants’ responses to the KIS items. With the last research
question of the study, our main aim was to categorize instructional strategies
teachers utilize to remedy/overcome student difficulties/misconceptions. To make
this categorization, we had to find all the instructional strategies from the
literature or find studies including all these instructional strategies. Schroeder et
al. (2007) conducted a meta-analysis study to grasp the effects of instructional
strategies on student achievement in science education. They categorized all
instructional strategies into ten different groups. We used four of their groups as
the basis for coding categories in this study. The main reason for using only four
groups is the distribution of instructional strategies provided in participating
teachers’ responses. That is, the remaining 6 groups in Schroeder et al’s study
were not observed in teachers’ responses. However, we added one more group,
‘conceptual change strategies,’ which was not in Schroeder et al.’s original 10. At
the end, we had a total of five instructional strategies to be used as the codes in
qualitative analysis of the items written for the last objective in the table of test
specification. Table 3.5 shows these coding categories with their descriptions.
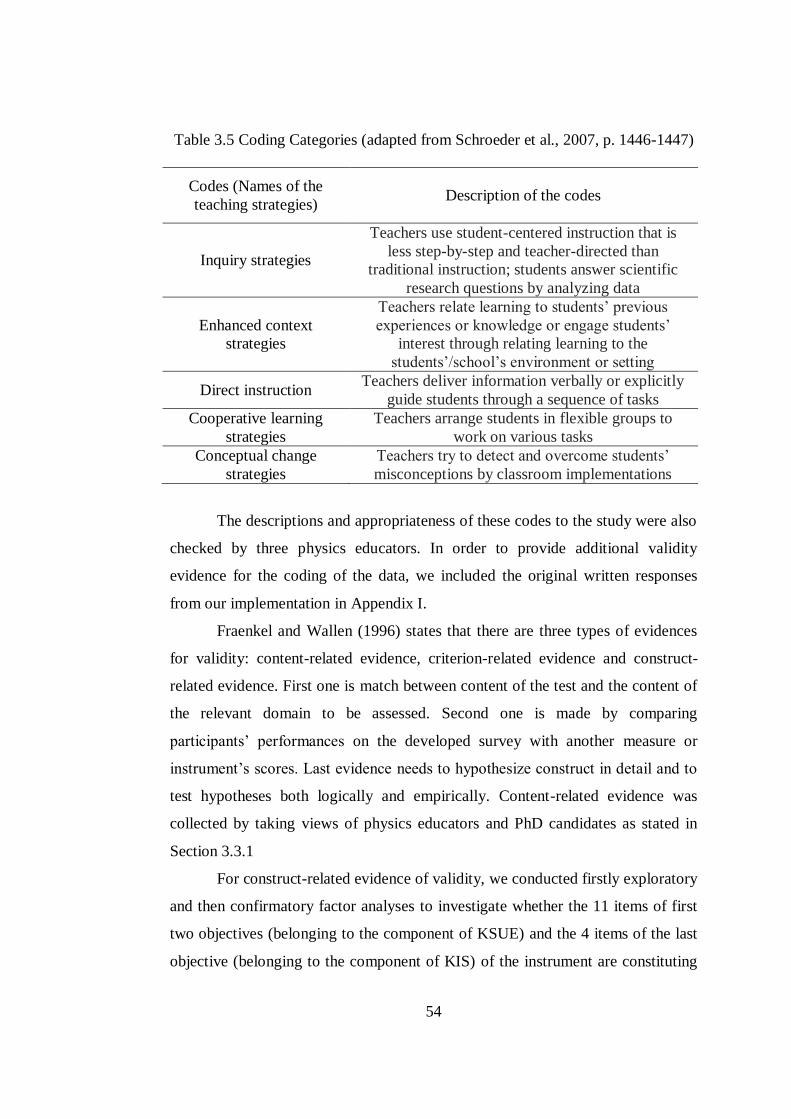
54
Table 3.5 Coding Categories (adapted from Schroeder et al., 2007, p. 1446-1447)
Codes (Names of the
teaching strategies)
Description of the codes
Inquiry strategies
Teachers use student-centered instruction that is
less step-by-step and teacher-directed than
traditional instruction; students answer scientific
research questions by analyzing data
Enhanced context
strategies
Teachers relate learning to students’ previous
experiences or knowledge or engage students’
interest through relating learning to the
students’/school’s environment or setting
Direct instruction Teachers deliver information verbally or explicitly
guide students through a sequence of tasks
Cooperative learning
strategies
Teachers arrange students in flexible groups to
work on various tasks
Conceptual change
strategies
Teachers try to detect and overcome students’
misconceptions by classroom implementations
The descriptions and appropriateness of these codes to the study were also
checked by three physics educators. In order to provide additional validity
evidence for the coding of the data, we included the original written responses
from our implementation in Appendix I.
Fraenkel and Wallen (1996) states that there are three types of evidences
for validity: content-related evidence, criterion-related evidence and construct-
related evidence. First one is match between content of the test and the content of
the relevant domain to be assessed. Second one is made by comparing
participants’ performances on the developed survey with another measure or
instrument’s scores. Last evidence needs to hypothesize construct in detail and to
test hypotheses both logically and empirically. Content-related evidence was
collected by taking views of physics educators and PhD candidates as stated in
Section 3.3.1
For construct-related evidence of validity, we conducted firstly exploratory
and then confirmatory factor analyses to investigate whether the 11 items of first
two objectives (belonging to the component of KSUE) and the 4 items of the last
objective (belonging to the component of KIS) of the instrument are constituting
55
different constructs or not. First ten items of the instrument were written for the
first objective in table of test specifications (see Table 3.3), and the last item was
written for the second objective. There were two different reasons of why we
focused only on one factor instead of two for these eleven items, although we had
two different objectives. Firstly, if we tried to get two different factors, the second
factor would have only one item. Secondly, these two different objectives belong
to the same component of PCK, namely KSUE. Consequently, treating these 11
items as member of the same factor would not be a problem.
Furthermore, we conducted a confirmatory structural equation modeling to
observe the relationships among teachers’ PCK and their JS level, PSE level,
specific experiences, years of teaching experience and number of attendance to in-
service training seminars related to physics teaching program. Results of the two
factor analyses and the confirmatory structural equation modeling were used as
evidence for construct-related validity. Details of the analyses were provided in
the next chapter.
Reliability is defined as “the extent to which a measure yields the same
scores across different times, groups of people, or versions of the instrument”
(Vanderstoep & Johnston, 2009, p. 83). For JSI and PSEI, internal consistency
reliability was represented by Cronbach alpha coefficient.
Cronbach alpha coefficient was not applicable for PECKI scores due to
inequality in scoring ranges. Therefore, for PECKI inter-rater reliability was
calculated. Vanderstoep and Johnston (2009) mentioned that a measurement has
high inter-rater reliability when two researchers agree on characteristics of
observed behaviors. Coffman (1971) offered to estimate the reliability by
obtaining Pearson product-moment correlation between raters. The researcher and
a PhD candidate studying in physics education programme at METU scored the
KSUE items independently following the final administration of the PECKI. In
this regard, product-moment correlation was estimated by evaluation of 25
randomly selected papers, which amounts to a 20% of all the papers. Utilizing the
rubric during evaluation of the papers strengthened the possibility of getting a
high inter-rater reliability. Vanderstoep and Johnston (2009) stated that inter-rater
56
reliability coefficients in range of 0.80 to 1.00 are indicators of high inter-rater
reliability. We decided the researcher to evaluate all the papers alone if we would
estimate the inter-rater reliability coefficient as 0.8 or above.
Reliability of coding conducted on the KIS items was also controlled with
inter-rater reliability processes. 25 papers were evaluated by the researcher and a
research assistant (from METU), then we calculated percentage of agreement
between evaluations of these independent raters. We divided twice of the number
of matched observations to total number of observations, and then multiplied this
value by 100 (Neuendorf, 2002).
3.7.1.1 Factor Analyses and Structural Equation Modeling
We firstly conducted exploratory factor analysis including solely PCK
items on SPSS. Considering the results of this step together with content-related
evidence for validity provided by two physics educators and two PhD candidates,
we conducted confirmatory factor analysis and confirmatory structural equation
modeling (SEM) by utilizing AMOS on our data. This analysis had several steps
to follow. First of all, we proposed models presented in Figure 3.1 and Figure 3.2
to test and collect construct-related evidence for validity. These models were the
result of the literature.
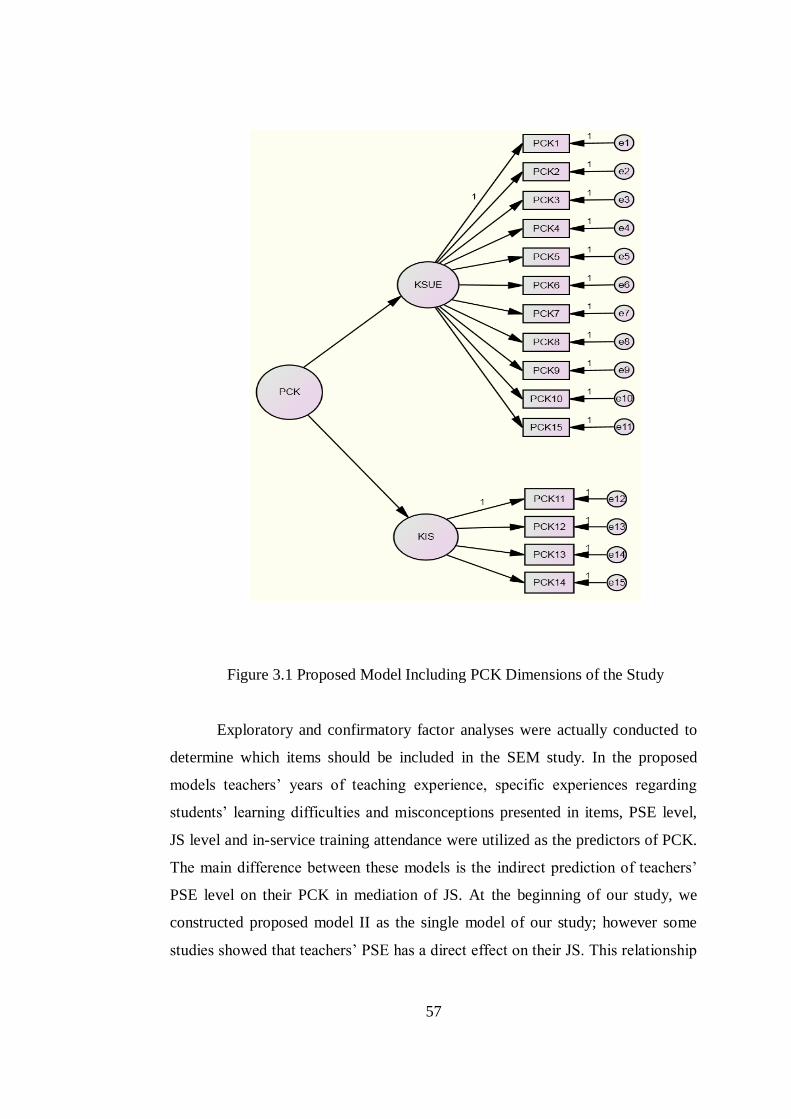
57
Figure 3.1 Proposed Model Including PCK Dimensions of the Study
Exploratory and confirmatory factor analyses were actually conducted to
determine which items should be included in the SEM study. In the proposed
models teachers’ years of teaching experience, specific experiences regarding
students’ learning difficulties and misconceptions presented in items, PSE level,
JS level and in-service training attendance were utilized as the predictors of PCK.
The main difference between these models is the indirect prediction of teachers’
PSE level on their PCK in mediation of JS. At the beginning of our study, we
constructed proposed model II as the single model of our study; however some
studies showed that teachers’ PSE has a direct effect on their JS. This relationship
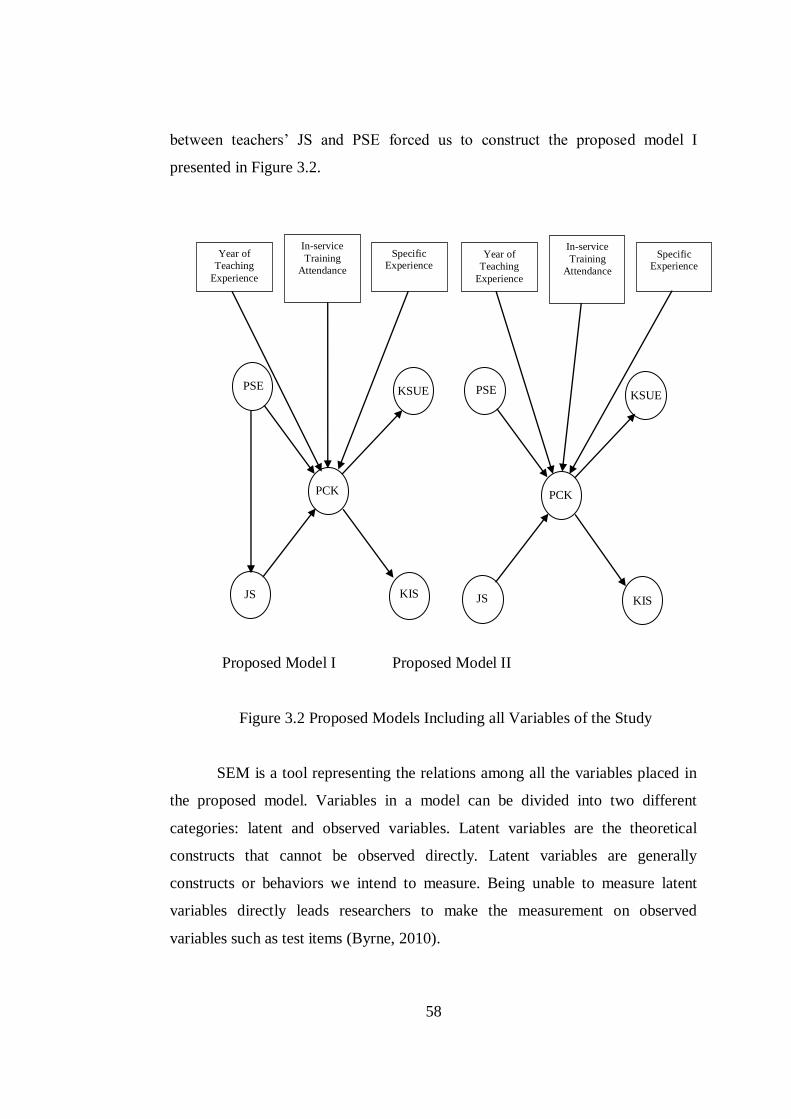
58
between teachers’ JS and PSE forced us to construct the proposed model I
presented in Figure 3.2.
Proposed Model I Proposed Model II
Figure 3.2 Proposed Models Including all Variables of the Study
SEM is a tool representing the relations among all the variables placed in
the proposed model. Variables in a model can be divided into two different
categories: latent and observed variables. Latent variables are the theoretical
constructs that cannot be observed directly. Latent variables are generally
constructs or behaviors we intend to measure. Being unable to measure latent
variables directly leads researchers to make the measurement on observed
variables such as test items (Byrne, 2010).
Year of
Teaching
Experience
In-service
Training
Attendance
Specific Experience
Year of
Teaching
Experience
In-service
Training
Attendance
Specific Experience
KIS
PCK PCK
JS
PSE PSE KSUE KSUE
KIS JS
59
SEM analysis shows the relations between latent and observed variables
via standardized regression weights (factor loadings). We checked significance of
these relations among variables together with their values in this second step.
Even though AMOS set a default value of 0.001 for the significance level, we
interpreted the results against a significance level of 0.05. Additionally,
standardized regression weights below 0.4 were accepted as poor measures of the
latent variables. Following the second step, we started the evaluation process of
model fit. First of all, chi-square (χ2) value with significance analysis was
checked. Byrne (2010) stated that χ2
statistics is affected by sample size strongly
and additionally offered to utilize χ2
per degrees of freedom (df) known as
CMIN/df. She mentioned that CMIN/df values smaller than 2 represents a good fit
of data. This procedure gives a quick overview of model fit to researchers. Even
though researchers obtain a CMIN/df smaller than 2, some other fit indices should
be controlled in the research studies to avoid misinterpretation of data (Byrne,
2010), such as root mean square error of approximation (RMSEA), Goodness-of-
Fit Index (GFI), Tucker-Lewis Index (TLI) and Comparative Fit Index (CFI). In
our analysis, we also checked all of these indices.
RMSEA relates with the error of approximation in the population and asks
the question “How well would the model, with unknown but optimally chosen
parameter values, fit the population covariance matrix if it were available?”
(Browne & Cudeck, 1993, pp. 137–138 as cited in Byrne, 2010). Browne and
Cudeck (1993) mentioned that RMSEA values smaller than 0.05 can be accepted
as good fit indicators, and RMSEA values ranging from 0.05 to 0.08 represent
reasonable errors of approximation (fair fit) in the population, values ranging from
0.08 to 1.00 indicate mediocre fit and the values larger than 1.00 indicate poor fit.
GFI represents the relative amount of variance and covariance in observed
variable scores. As an absolute index GFI compares the proposed model with no
model at all (Byrne, 2010). GFI gets values ranging from 0 to 1.00. 0.90 or higher
values are indicators of good fit. Finally, TLI and CFI represent how much the
proposed model described sample data adequately. TLI and CFI values range
from 0 to 1.00. Values higher than 0.90 are indicators of good fit (Byrne,2010).
60
3.8 Limitations of the Study
In this study, we developed PECKI, which consists of 13 open-ended
items regarding concepts related to electricity. The first limitation of the study
was the scope of focused concepts within electricity. In the first implementation,
30 participants were asked to write the most difficult concepts related to
electricity and their students’ learning difficulties and misconceptions. Therefore,
mainly these 30 teachers’ responses to our questions determined the scope of
PECKI. In this respect, we want to stress that PECKI does not focus on all the
concepts in electricity.
Another limitation was about the rubric prepared in this study. The rubric
was prepared based on the participant teachers’ responses and specified the
distribution of scores to the cases. If the rubric was prepared based on the findings
stated in the literature, we might have attained different scores to teachers’ correct
responses. This would not change the distribution of teachers’ scores but most
probably affect adequacy of the responses.
Another limitation was related to the number of participants. 124 teachers
participated in the final implementation of the study. Teachers mostly avoid
assessment of their knowledge and have a reluctance related to participation in
such tasks. Therefore, we could not study with a high level of participation.
Principally, 124 participants are enough for a survey study. However, CFA and
SEM studies need more participants for more valid results.
The final limitation of the study included qualitative analysis which was
implemented mainly on the 4 items in dimension of KIS. We gathered data from
the participants only with our instrument. In this situation, we encountered some
problems regarding reliability, because we sometimes could not understand
whether a participant teacher has the intention to implement all the requirements
of an instructional strategy. Moreover, we did not collect observational data from
classroom environment. Therefore, we are not sure whether participants
implement the strategies stated on their responses in their instructional practices.
61
3.9 Assumption
Assumption of the study is that participating physics teachers have
answered PECKI sincerely.
62
CHAPTER 4
RESULTS
In this study we had three main research problems. The first research
problem of the study was to establish acceptable validity and reliability estimates
for an instrument developed to measure knowledge of students’ understanding of
electricity and knowledge of instructional strategies components of high school
physics teachers’ PCK related to the teaching of electricity. The research
hypotheses are:
1) High school physics teachers’ years of teaching experience have a
positive, direct effect on their PCK.
2) High school physics teachers’ specific experiences have a positive, direct
effect on their PCK.
3) High school physics teachers’ PSE level has a positive, direct and indirect
effect on their PCK.
4) High school physics teachers’ JS level has a positive, direct effect on their
PCK.
5) High school physics teachers’ attendance to in-service training seminars
on the physics teaching programs has a positive, direct effect on their
PCK.
First research problem of the study together with its research hypotheses needs
to portray the details regarding the validation processes of the instrument
including exploratory and confirmatory factor analyses together with physics
educators’ suggestions on items’ content and SEM study on the data provided by
the PECKI. Therefore; this chapter begins with giving the details of validation
processes together with some descriptive information at the final part.
The second research problem is related to the assessment of high school
physics teachers’ knowledge about students’ pre-instructional thinking and
63
misconceptions in electricity. The research question related to this problem is
formulated as:
What is the level of high school physics teachers’ knowledge about
students’ pre-instructional thinking and misconceptions in electricity?
The third research problem is also related to the assessment of teachers’ PCK,
but this time on the component of teachers’ knowledge of instructional strategies
related to the teaching of electricity. The research question related to this problem
is formulated as:
What are the teaching strategies implemented by high school physics
teachers to overcome student learning difficulties and misconceptions in
teaching of electricity?
Following parts of this chapter provided the survey results of the study in
answering the second and third research problems. Scoring of participant
teachers’ responses were realized based the rubric developed in study. Final part
of this title presents the summary of overall results.
4.1 Validation of the Pedagogical Electricity Content Knowledge Instrument
This part of the chapter provides information about validation processes of
the study including exploratory and confirmatory factor analysis and confirmatory
structural equation modeling. Additionally, we gave the details of results’
reliability both for the PECKI and other instruments utilized in the study which
were PSEI and JSI.
4.1.1 Exploratory Factor Analysis
To conduct exploratory factor analysis, Measures of Sampling Adequacy
(MSA) values and anti-image correlations should be greater than 0.50. These
values were acceptable in our study. Table 4.1 shows Kaiser-Meyer-Olkin (KMO)
measure of sampling and the Bartlett’s test of sphericity for item scores. KMO
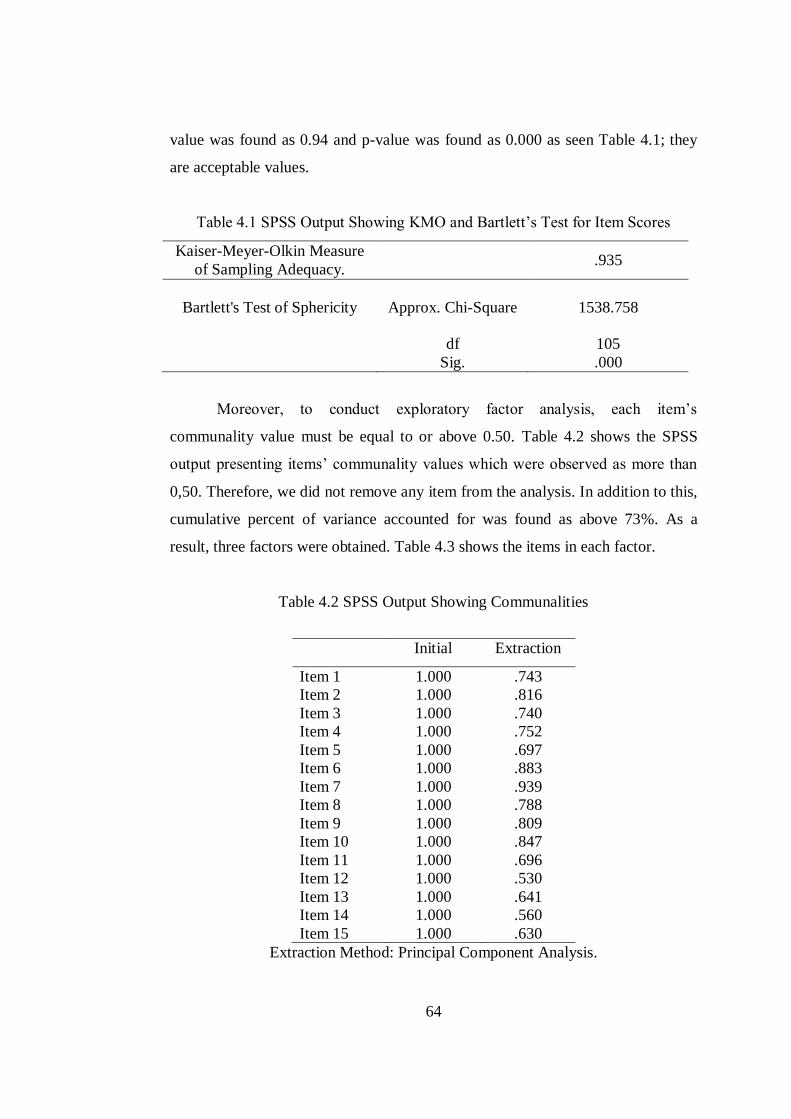
64
value was found as 0.94 and p-value was found as 0.000 as seen Table 4.1; they
are acceptable values.
Table 4.1 SPSS Output Showing KMO and Bartlett’s Test for Item Scores
Kaiser-Meyer-Olkin Measure
of Sampling Adequacy. .935
Bartlett's Test of Sphericity
Approx. Chi-Square 1538.758
df 105
Sig. .000
Moreover, to conduct exploratory factor analysis, each item’s
communality value must be equal to or above 0.50. Table 4.2 shows the SPSS
output presenting items’ communality values which were observed as more than
0,50. Therefore, we did not remove any item from the analysis. In addition to this,
cumulative percent of variance accounted for was found as above 73%. As a
result, three factors were obtained. Table 4.3 shows the items in each factor.
Table 4.2 SPSS Output Showing Communalities
Initial Extraction
Item 1 1.000 .743
Item 2 1.000 .816
Item 3 1.000 .740
Item 4 1.000 .752
Item 5 1.000 .697
Item 6 1.000 .883
Item 7 1.000 .939
Item 8 1.000 .788
Item 9 1.000 .809
Item 10
Item 11
Item 12
Item 13
Item 14
Item 15
1.000
1.000
1.000
1.000
1.000
1.000
.847
.696
.530
.641
.560
.630
Extraction Method: Principal Component Analysis.
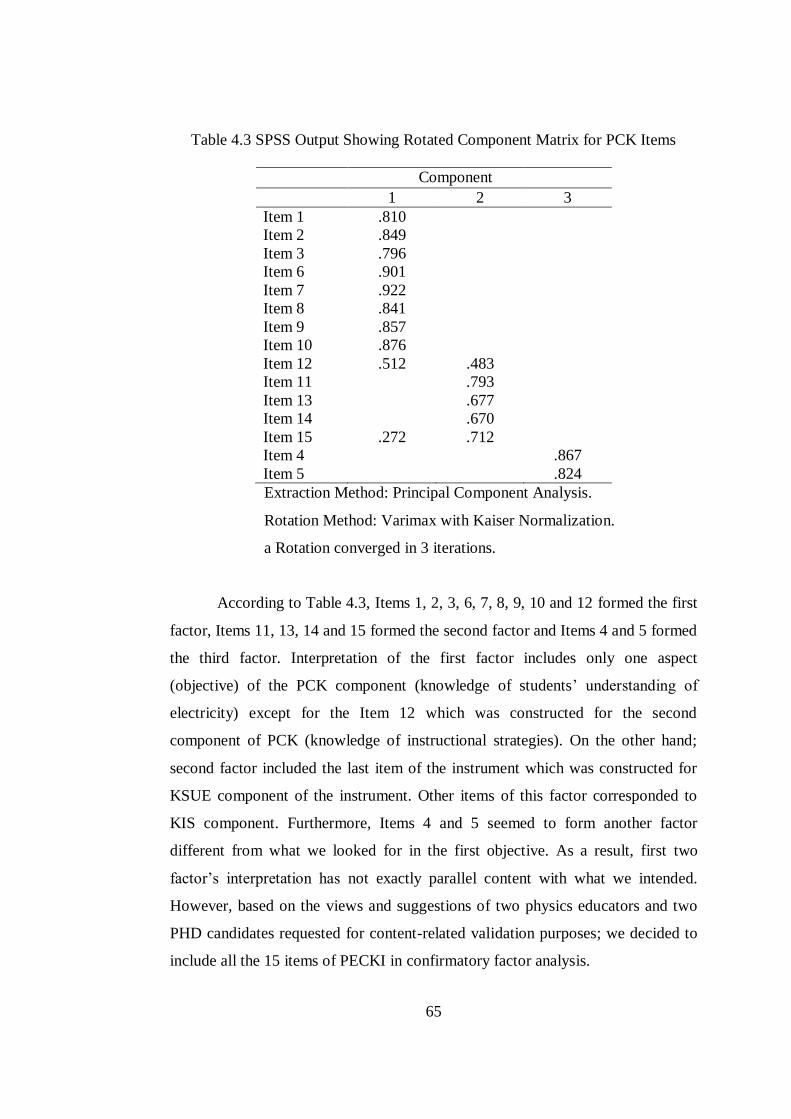
65
Table 4.3 SPSS Output Showing Rotated Component Matrix for PCK Items
Component
1 2 3
Item 1 .810
Item 2 .849
Item 3 .796
Item 6 .901
Item 7 .922
Item 8 .841
Item 9 .857
Item 10
Item 12
.876
.512
.483
Item 11
Item 13
Item 14
Item 15
Item 4
Item 5
.272
.793
.677
.670
.712
.867
.824
Extraction Method: Principal Component Analysis.
Rotation Method: Varimax with Kaiser Normalization.
a Rotation converged in 3 iterations.
According to Table 4.3, Items 1, 2, 3, 6, 7, 8, 9, 10 and 12 formed the first
factor, Items 11, 13, 14 and 15 formed the second factor and Items 4 and 5 formed
the third factor. Interpretation of the first factor includes only one aspect
(objective) of the PCK component (knowledge of students’ understanding of
electricity) except for the Item 12 which was constructed for the second
component of PCK (knowledge of instructional strategies). On the other hand;
second factor included the last item of the instrument which was constructed for
KSUE component of the instrument. Other items of this factor corresponded to
KIS component. Furthermore, Items 4 and 5 seemed to form another factor
different from what we looked for in the first objective. As a result, first two
factor’s interpretation has not exactly parallel content with what we intended.
However, based on the views and suggestions of two physics educators and two
PHD candidates requested for content-related validation purposes; we decided to
include all the 15 items of PECKI in confirmatory factor analysis.
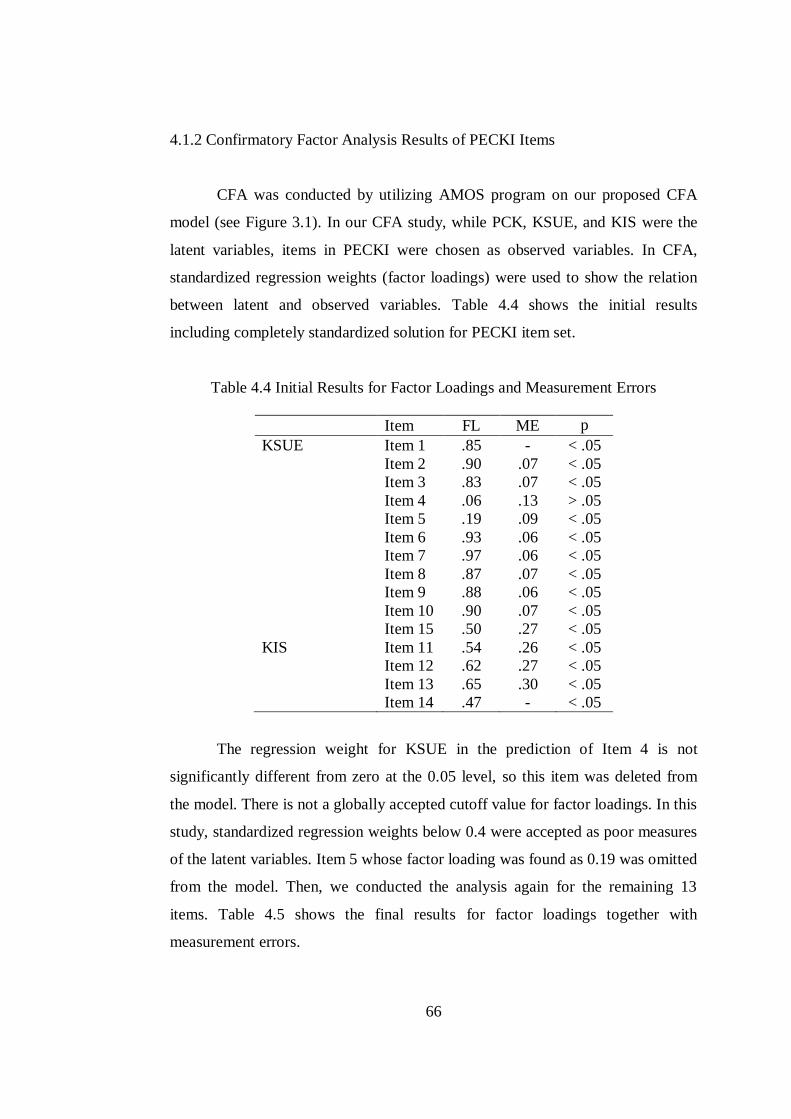
66
4.1.2 Confirmatory Factor Analysis Results of PECKI Items
CFA was conducted by utilizing AMOS program on our proposed CFA
model (see Figure 3.1). In our CFA study, while PCK, KSUE, and KIS were the
latent variables, items in PECKI were chosen as observed variables. In CFA,
standardized regression weights (factor loadings) were used to show the relation
between latent and observed variables. Table 4.4 shows the initial results
including completely standardized solution for PECKI item set.
Table 4.4 Initial Results for Factor Loadings and Measurement Errors
Item FL ME p
KSUE Item 1 .85 - < .05
Item 2 .90 .07 < .05
Item 3 .83 .07 < .05
Item 4
Item 5
Item 6
.06
.19
.93
.13
.09
.06
> .05
< .05
< .05
Item 7 .97 .06 < .05
Item 8 .87 .07 < .05
Item 9 .88 .06 < .05
Item 10 .90 .07 < .05
KIS
Item 15
Item 11
Item 12
Item 13
Item 14
.50
.54
.62
.65
.47
.27
.26
.27
.30
-
< .05
< .05
< .05
< .05
< .05
The regression weight for KSUE in the prediction of Item 4 is not
significantly different from zero at the 0.05 level, so this item was deleted from
the model. There is not a globally accepted cutoff value for factor loadings. In this
study, standardized regression weights below 0.4 were accepted as poor measures
of the latent variables. Item 5 whose factor loading was found as 0.19 was omitted
from the model. Then, we conducted the analysis again for the remaining 13
items. Table 4.5 shows the final results for factor loadings together with
measurement errors.
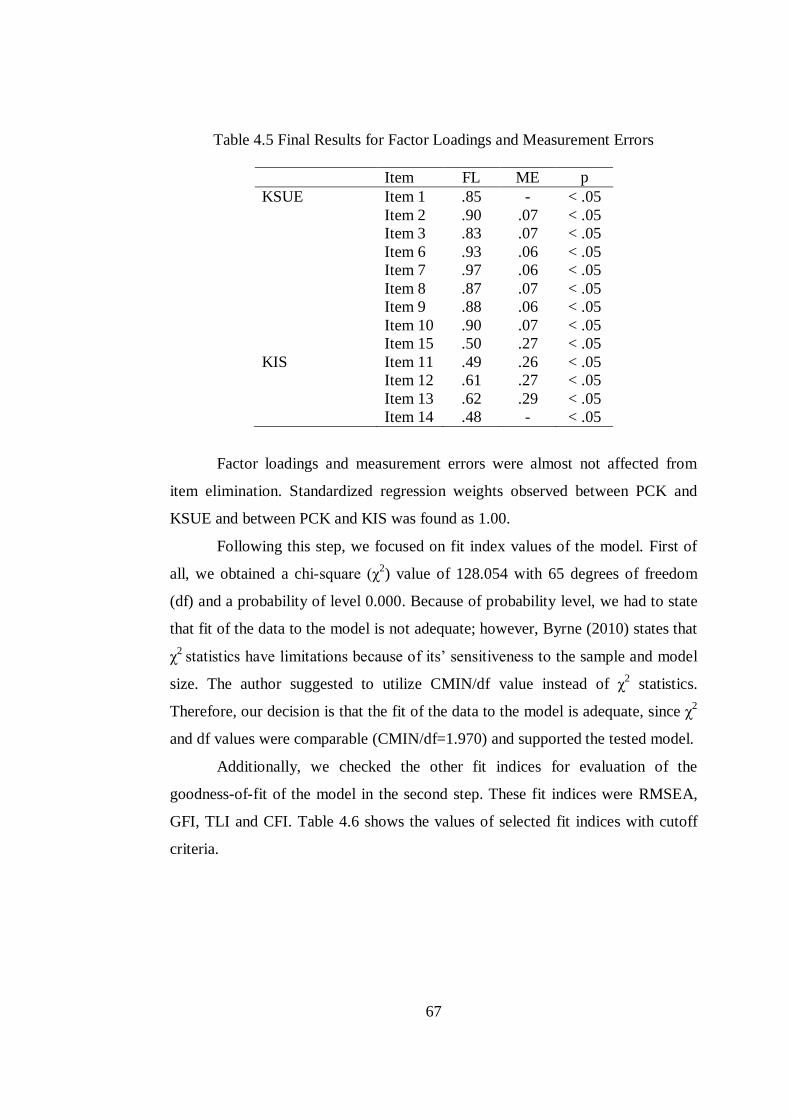
67
Table 4.5 Final Results for Factor Loadings and Measurement Errors
Item FL ME p
KSUE Item 1 .85 - < .05
Item 2 .90 .07 < .05
Item 3 .83 .07 < .05
Item 6 .93 .06 < .05
Item 7 .97 .06 < .05
Item 8 .87 .07 < .05
Item 9 .88 .06 < .05
Item 10 .90 .07 < .05
KIS
Item 15
Item 11
Item 12
Item 13
Item 14
.50
.49
.61
.62
.48
.27
.26
.27
.29
-
< .05
< .05
< .05
< .05
< .05
Factor loadings and measurement errors were almost not affected from
item elimination. Standardized regression weights observed between PCK and
KSUE and between PCK and KIS was found as 1.00.
Following this step, we focused on fit index values of the model. First of
all, we obtained a chi-square (χ2) value of 128.054 with 65 degrees of freedom
(df) and a probability of level 0.000. Because of probability level, we had to state
that fit of the data to the model is not adequate; however, Byrne (2010) states that
χ2
statistics have limitations because of its’ sensitiveness to the sample and model
size. The author suggested to utilize CMIN/df value instead of χ2 statistics.
Therefore, our decision is that the fit of the data to the model is adequate, since χ2
and df values were comparable (CMIN/df=1.970) and supported the tested model.
Additionally, we checked the other fit indices for evaluation of the
goodness-of-fit of the model in the second step. These fit indices were RMSEA,
GFI, TLI and CFI. Table 4.6 shows the values of selected fit indices with cutoff
criteria.
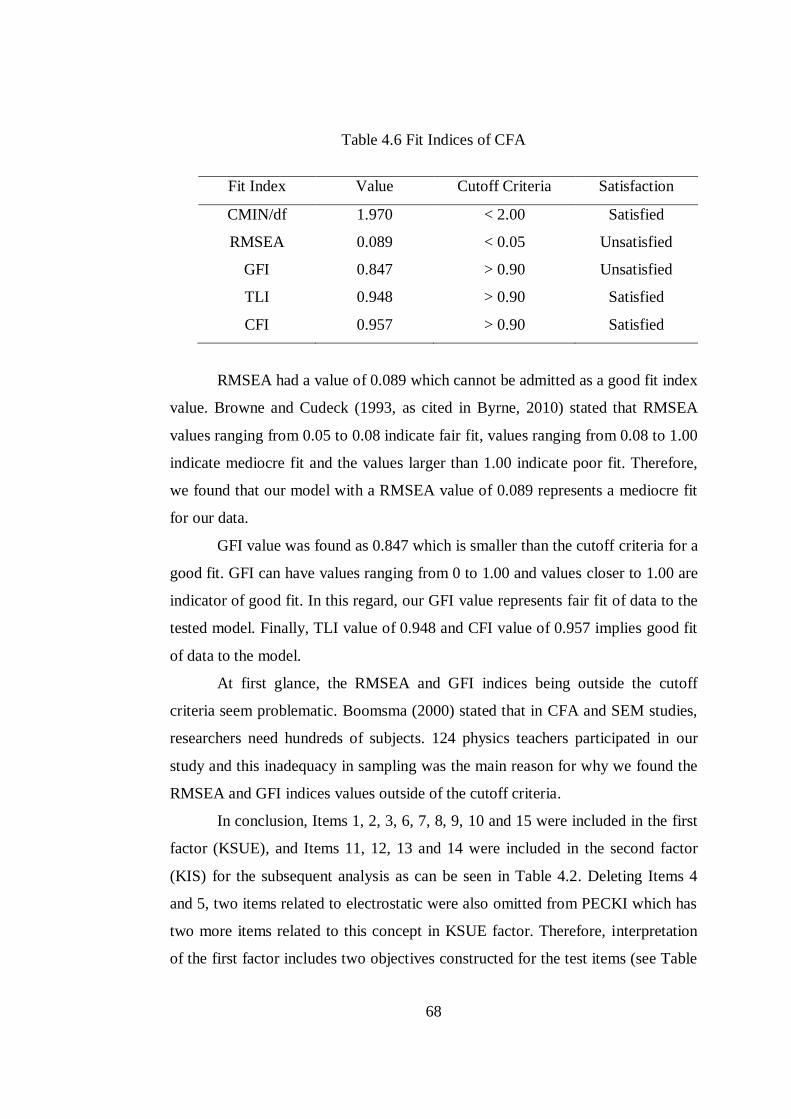
68
Table 4.6 Fit Indices of CFA
Fit Index Value Cutoff Criteria Satisfaction
CMIN/df
RMSEA
GFI
TLI
CFI
1.970
0.089
0.847
0.948
0.957
< 2.00
< 0.05
> 0.90
> 0.90
> 0.90
Satisfied
Unsatisfied
Unsatisfied
Satisfied
Satisfied
RMSEA had a value of 0.089 which cannot be admitted as a good fit index
value. Browne and Cudeck (1993, as cited in Byrne, 2010) stated that RMSEA
values ranging from 0.05 to 0.08 indicate fair fit, values ranging from 0.08 to 1.00
indicate mediocre fit and the values larger than 1.00 indicate poor fit. Therefore,
we found that our model with a RMSEA value of 0.089 represents a mediocre fit
for our data.
GFI value was found as 0.847 which is smaller than the cutoff criteria for a
good fit. GFI can have values ranging from 0 to 1.00 and values closer to 1.00 are
indicator of good fit. In this regard, our GFI value represents fair fit of data to the
tested model. Finally, TLI value of 0.948 and CFI value of 0.957 implies good fit
of data to the model.
At first glance, the RMSEA and GFI indices being outside the cutoff
criteria seem problematic. Boomsma (2000) stated that in CFA and SEM studies,
researchers need hundreds of subjects. 124 physics teachers participated in our
study and this inadequacy in sampling was the main reason for why we found the
RMSEA and GFI indices values outside of the cutoff criteria.
In conclusion, Items 1, 2, 3, 6, 7, 8, 9, 10 and 15 were included in the first
factor (KSUE), and Items 11, 12, 13 and 14 were included in the second factor
(KIS) for the subsequent analysis as can be seen in Table 4.2. Deleting Items 4
and 5, two items related to electrostatic were also omitted from PECKI which has
two more items related to this concept in KSUE factor. Therefore, interpretation
of the first factor includes two objectives constructed for the test items (see Table
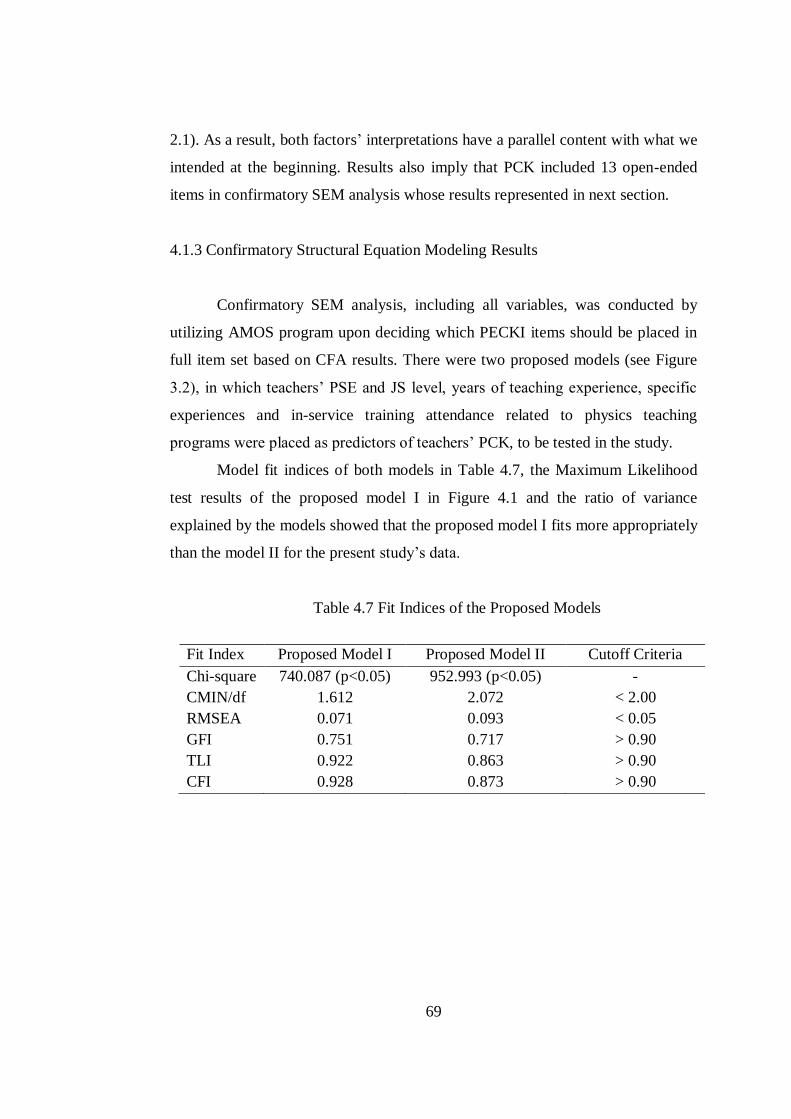
69
2.1). As a result, both factors’ interpretations have a parallel content with what we
intended at the beginning. Results also imply that PCK included 13 open-ended
items in confirmatory SEM analysis whose results represented in next section.
4.1.3 Confirmatory Structural Equation Modeling Results
Confirmatory SEM analysis, including all variables, was conducted by
utilizing AMOS program upon deciding which PECKI items should be placed in
full item set based on CFA results. There were two proposed models (see Figure
3.2), in which teachers’ PSE and JS level, years of teaching experience, specific
experiences and in-service training attendance related to physics teaching
programs were placed as predictors of teachers’ PCK, to be tested in the study.
Model fit indices of both models in Table 4.7, the Maximum Likelihood
test results of the proposed model I in Figure 4.1 and the ratio of variance
explained by the models showed that the proposed model I fits more appropriately
than the model II for the present study’s data.
Table 4.7 Fit Indices of the Proposed Models
Fit Index Proposed Model I Proposed Model II Cutoff Criteria
Chi-square 740.087 (p<0.05) 952.993 (p<0.05) -
CMIN/df 1.612 2.072 < 2.00
RMSEA 0.071 0.093 < 0.05
GFI 0.751 0.717 > 0.90
TLI 0.922 0.863 > 0.90
CFI 0.928 0.873 > 0.90
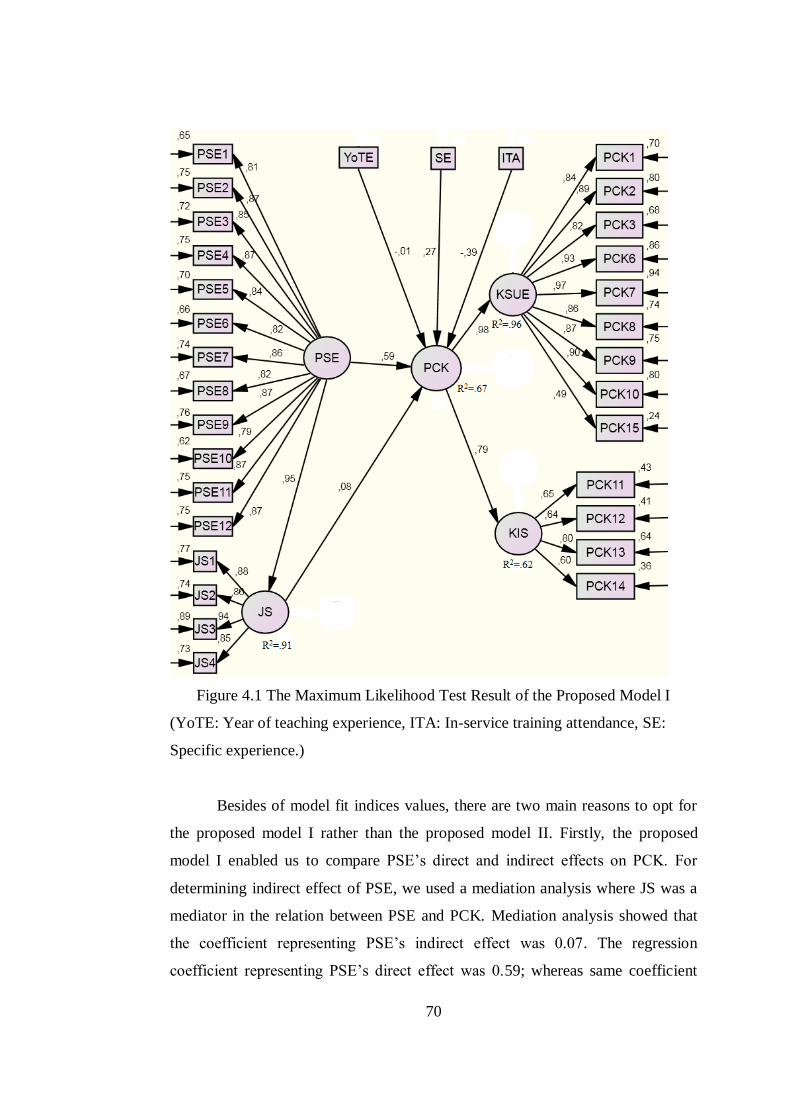
70
Figure 4.1 The Maximum Likelihood Test Result of the Proposed Model I
(YoTE: Year of teaching experience, ITA: In-service training attendance, SE:
Specific experience.)
Besides of model fit indices values, there are two main reasons to opt for
the proposed model I rather than the proposed model II. Firstly, the proposed
model I enabled us to compare PSE’s direct and indirect effects on PCK. For
determining indirect effect of PSE, we used a mediation analysis where JS was a
mediator in the relation between PSE and PCK. Mediation analysis showed that
the coefficient representing PSE’s indirect effect was 0.07. The regression
coefficient representing PSE’s direct effect was 0.59; whereas same coefficient
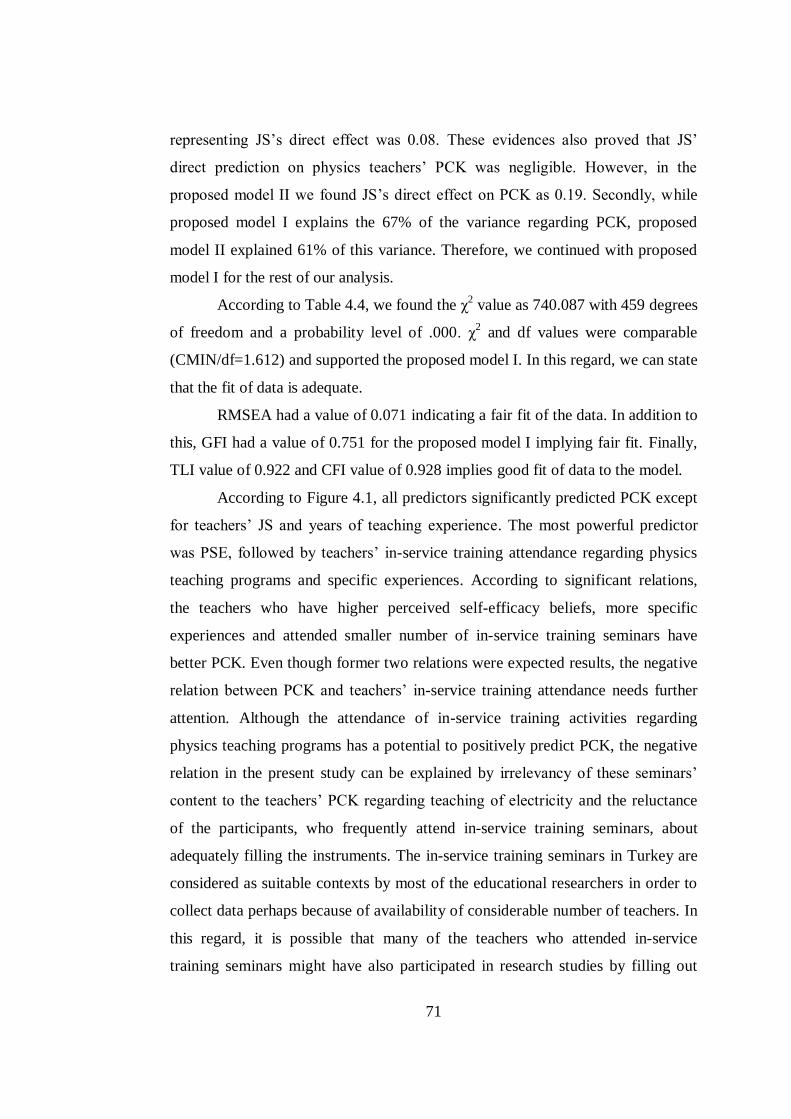
71
representing JS’s direct effect was 0.08. These evidences also proved that JS’
direct prediction on physics teachers’ PCK was negligible. However, in the
proposed model II we found JS’s direct effect on PCK as 0.19. Secondly, while
proposed model I explains the 67% of the variance regarding PCK, proposed
model II explained 61% of this variance. Therefore, we continued with proposed
model I for the rest of our analysis.
According to Table 4.4, we found the χ2 value as 740.087 with 459 degrees
of freedom and a probability level of .000. χ2 and df values were comparable
(CMIN/df=1.612) and supported the proposed model I. In this regard, we can state
that the fit of data is adequate.
RMSEA had a value of 0.071 indicating a fair fit of the data. In addition to
this, GFI had a value of 0.751 for the proposed model I implying fair fit. Finally,
TLI value of 0.922 and CFI value of 0.928 implies good fit of data to the model.
According to Figure 4.1, all predictors significantly predicted PCK except
for teachers’ JS and years of teaching experience. The most powerful predictor
was PSE, followed by teachers’ in-service training attendance regarding physics
teaching programs and specific experiences. According to significant relations,
the teachers who have higher perceived self-efficacy beliefs, more specific
experiences and attended smaller number of in-service training seminars have
better PCK. Even though former two relations were expected results, the negative
relation between PCK and teachers’ in-service training attendance needs further
attention. Although the attendance of in-service training activities regarding
physics teaching programs has a potential to positively predict PCK, the negative
relation in the present study can be explained by irrelevancy of these seminars’
content to the teachers’ PCK regarding teaching of electricity and the reluctance
of the participants, who frequently attend in-service training seminars, about
adequately filling the instruments. The in-service training seminars in Turkey are
considered as suitable contexts by most of the educational researchers in order to
collect data perhaps because of availability of considerable number of teachers. In
this regard, it is possible that many of the teachers who attended in-service
training seminars might have also participated in research studies by filling out
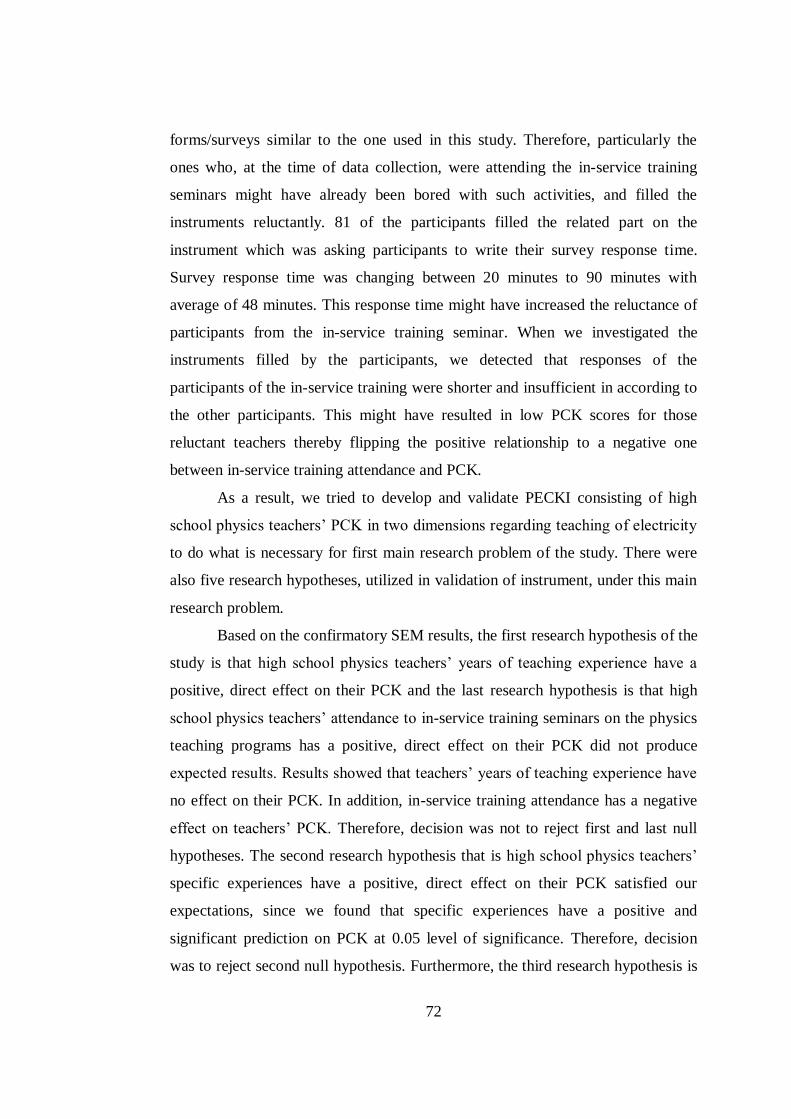
72
forms/surveys similar to the one used in this study. Therefore, particularly the
ones who, at the time of data collection, were attending the in-service training
seminars might have already been bored with such activities, and filled the
instruments reluctantly. 81 of the participants filled the related part on the
instrument which was asking participants to write their survey response time.
Survey response time was changing between 20 minutes to 90 minutes with
average of 48 minutes. This response time might have increased the reluctance of
participants from the in-service training seminar. When we investigated the
instruments filled by the participants, we detected that responses of the
participants of the in-service training were shorter and insufficient in according to
the other participants. This might have resulted in low PCK scores for those
reluctant teachers thereby flipping the positive relationship to a negative one
between in-service training attendance and PCK.
As a result, we tried to develop and validate PECKI consisting of high
school physics teachers’ PCK in two dimensions regarding teaching of electricity
to do what is necessary for first main research problem of the study. There were
also five research hypotheses, utilized in validation of instrument, under this main
research problem.
Based on the confirmatory SEM results, the first research hypothesis of the
study is that high school physics teachers’ years of teaching experience have a
positive, direct effect on their PCK and the last research hypothesis is that high
school physics teachers’ attendance to in-service training seminars on the physics
teaching programs has a positive, direct effect on their PCK did not produce
expected results. Results showed that teachers’ years of teaching experience have
no effect on their PCK. In addition, in-service training attendance has a negative
effect on teachers’ PCK. Therefore, decision was not to reject first and last null
hypotheses. The second research hypothesis that is high school physics teachers’
specific experiences have a positive, direct effect on their PCK satisfied our
expectations, since we found that specific experiences have a positive and
significant prediction on PCK at 0.05 level of significance. Therefore, decision
was to reject second null hypothesis. Furthermore, the third research hypothesis is
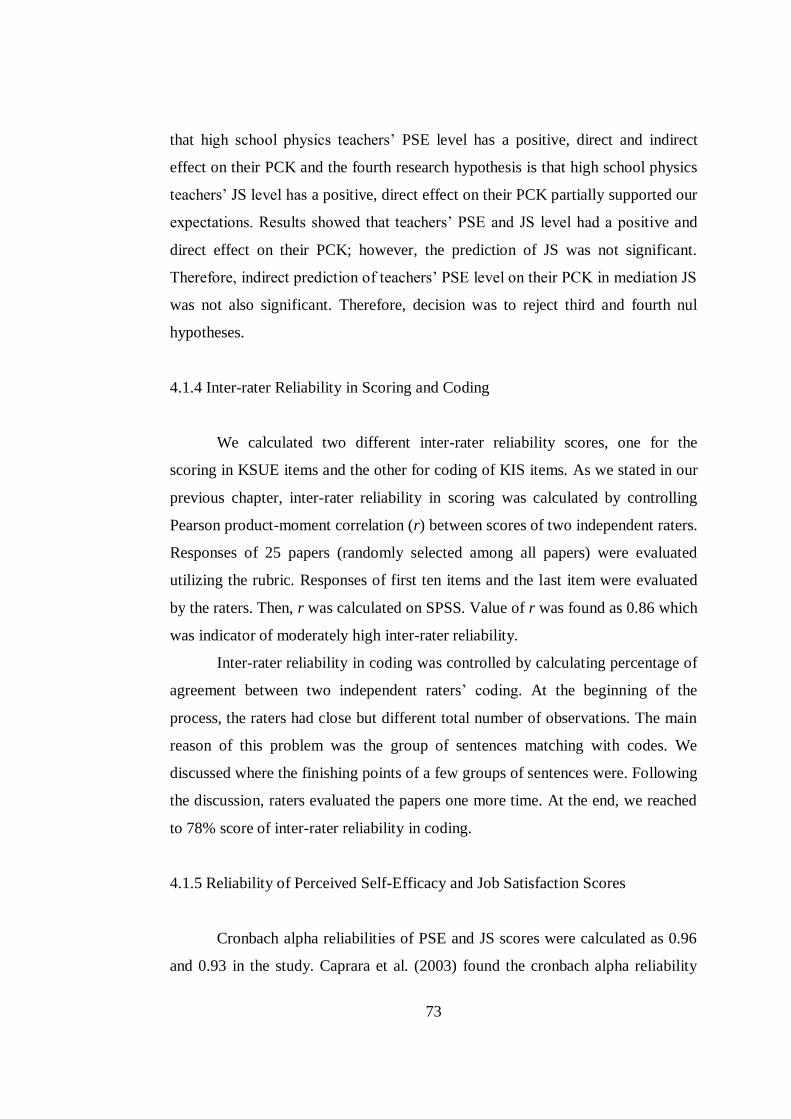
73
that high school physics teachers’ PSE level has a positive, direct and indirect
effect on their PCK and the fourth research hypothesis is that high school physics
teachers’ JS level has a positive, direct effect on their PCK partially supported our
expectations. Results showed that teachers’ PSE and JS level had a positive and
direct effect on their PCK; however, the prediction of JS was not significant.
Therefore, indirect prediction of teachers’ PSE level on their PCK in mediation JS
was not also significant. Therefore, decision was to reject third and fourth nul
hypotheses.
4.1.4 Inter-rater Reliability in Scoring and Coding
We calculated two different inter-rater reliability scores, one for the
scoring in KSUE items and the other for coding of KIS items. As we stated in our
previous chapter, inter-rater reliability in scoring was calculated by controlling
Pearson product-moment correlation (r) between scores of two independent raters.
Responses of 25 papers (randomly selected among all papers) were evaluated
utilizing the rubric. Responses of first ten items and the last item were evaluated
by the raters. Then, r was calculated on SPSS. Value of r was found as 0.86 which
was indicator of moderately high inter-rater reliability.
Inter-rater reliability in coding was controlled by calculating percentage of
agreement between two independent raters’ coding. At the beginning of the
process, the raters had close but different total number of observations. The main
reason of this problem was the group of sentences matching with codes. We
discussed where the finishing points of a few groups of sentences were. Following
the discussion, raters evaluated the papers one more time. At the end, we reached
to 78% score of inter-rater reliability in coding.
4.1.5 Reliability of Perceived Self-Efficacy and Job Satisfaction Scores
Cronbach alpha reliabilities of PSE and JS scores were calculated as 0.96
and 0.93 in the study. Caprara et al. (2003) found the cronbach alpha reliability
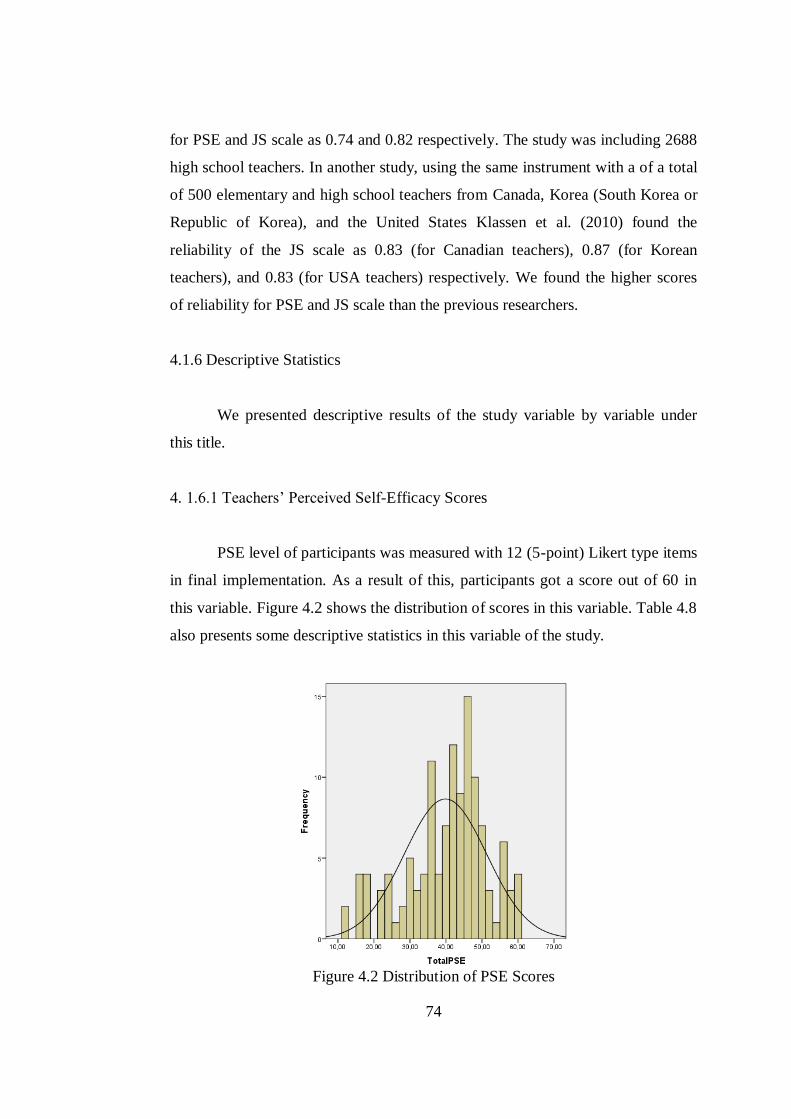
74
for PSE and JS scale as 0.74 and 0.82 respectively. The study was including 2688
high school teachers. In another study, using the same instrument with a of a total
of 500 elementary and high school teachers from Canada, Korea (South Korea or
Republic of Korea), and the United States Klassen et al. (2010) found the
reliability of the JS scale as 0.83 (for Canadian teachers), 0.87 (for Korean
teachers), and 0.83 (for USA teachers) respectively. We found the higher scores
of reliability for PSE and JS scale than the previous researchers.
4.1.6 Descriptive Statistics
We presented descriptive results of the study variable by variable under
this title.
4. 1.6.1 Teachers’ Perceived Self-Efficacy Scores
PSE level of participants was measured with 12 (5-point) Likert type items
in final implementation. As a result of this, participants got a score out of 60 in
this variable. Figure 4.2 shows the distribution of scores in this variable. Table 4.8
also presents some descriptive statistics in this variable of the study.
Figure 4.2 Distribution of PSE Scores
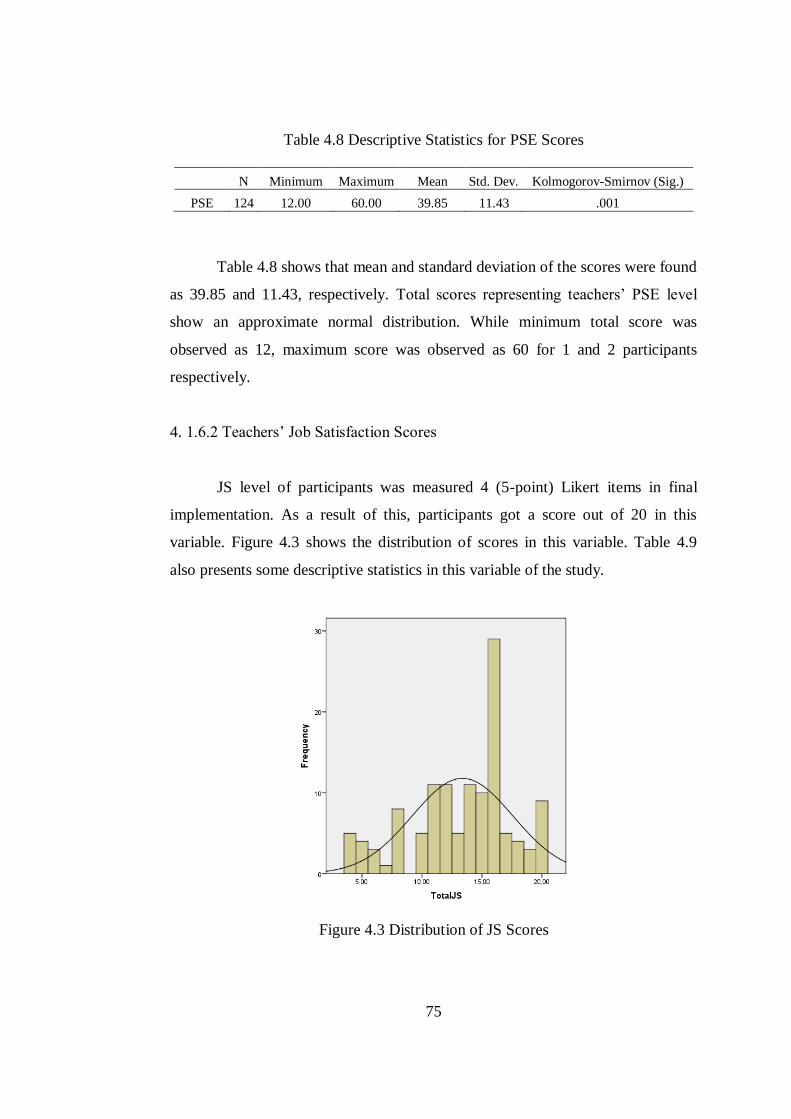
75
Table 4.8 Descriptive Statistics for PSE Scores
N Minimum Maximum Mean Std. Dev. Kolmogorov-Smirnov (Sig.)
PSE 124 12.00 60.00 39.85 11.43 .001
Table 4.8 shows that mean and standard deviation of the scores were found
as 39.85 and 11.43, respectively. Total scores representing teachers’ PSE level
show an approximate normal distribution. While minimum total score was
observed as 12, maximum score was observed as 60 for 1 and 2 participants
respectively.
4. 1.6.2 Teachers’ Job Satisfaction Scores
JS level of participants was measured 4 (5-point) Likert items in final
implementation. As a result of this, participants got a score out of 20 in this
variable. Figure 4.3 shows the distribution of scores in this variable. Table 4.9
also presents some descriptive statistics in this variable of the study.
Figure 4.3 Distribution of JS Scores
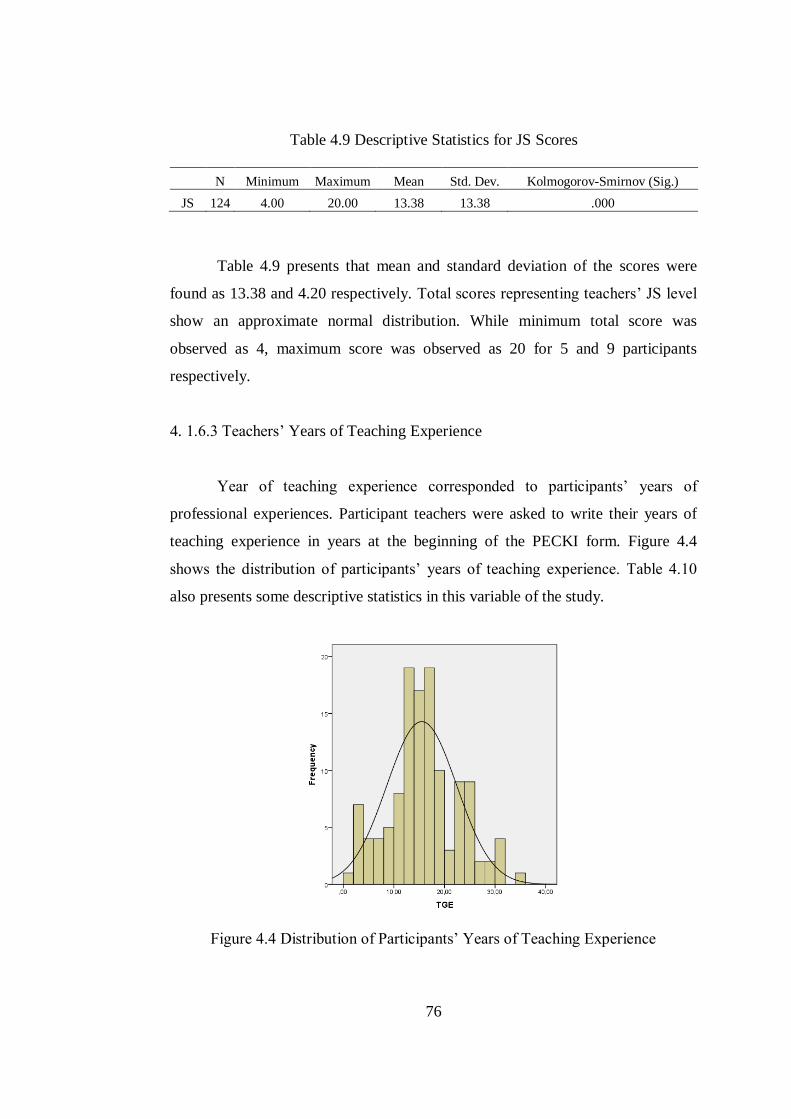
76
Table 4.9 Descriptive Statistics for JS Scores
N Minimum Maximum Mean Std. Dev. Kolmogorov-Smirnov (Sig.)
JS 124 4.00 20.00 13.38 13.38 .000
Table 4.9 presents that mean and standard deviation of the scores were
found as 13.38 and 4.20 respectively. Total scores representing teachers’ JS level
show an approximate normal distribution. While minimum total score was
observed as 4, maximum score was observed as 20 for 5 and 9 participants
respectively.
4. 1.6.3 Teachers’ Years of Teaching Experience
Year of teaching experience corresponded to participants’ years of
professional experiences. Participant teachers were asked to write their years of
teaching experience in years at the beginning of the PECKI form. Figure 4.4
shows the distribution of participants’ years of teaching experience. Table 4.10
also presents some descriptive statistics in this variable of the study.
Figure 4.4 Distribution of Participants’ Years of Teaching Experience
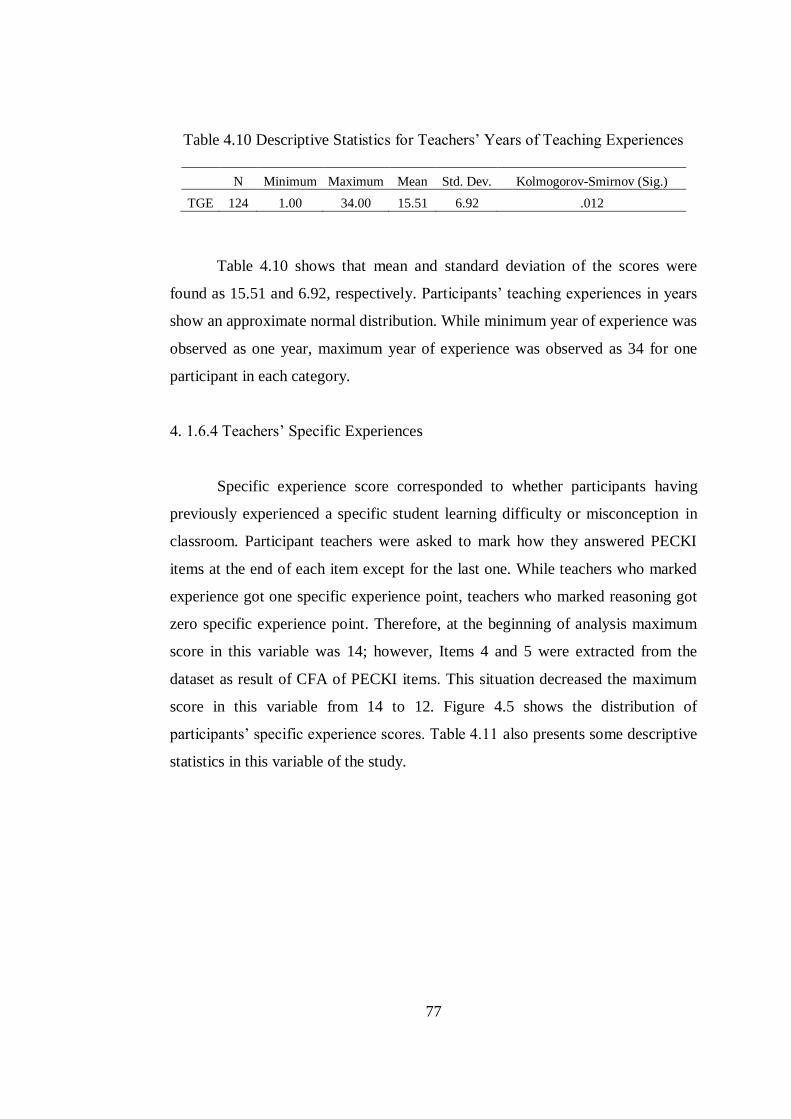
77
Table 4.10 Descriptive Statistics for Teachers’ Years of Teaching Experiences
N Minimum Maximum Mean Std. Dev. Kolmogorov-Smirnov (Sig.)
TGE 124 1.00 34.00 15.51 6.92 .012
Table 4.10 shows that mean and standard deviation of the scores were
found as 15.51 and 6.92, respectively. Participants’ teaching experiences in years
show an approximate normal distribution. While minimum year of experience was
observed as one year, maximum year of experience was observed as 34 for one
participant in each category.
4. 1.6.4 Teachers’ Specific Experiences
Specific experience score corresponded to whether participants having
previously experienced a specific student learning difficulty or misconception in
classroom. Participant teachers were asked to mark how they answered PECKI
items at the end of each item except for the last one. While teachers who marked
experience got one specific experience point, teachers who marked reasoning got
zero specific experience point. Therefore, at the beginning of analysis maximum
score in this variable was 14; however, Items 4 and 5 were extracted from the
dataset as result of CFA of PECKI items. This situation decreased the maximum
score in this variable from 14 to 12. Figure 4.5 shows the distribution of
participants’ specific experience scores. Table 4.11 also presents some descriptive
statistics in this variable of the study.
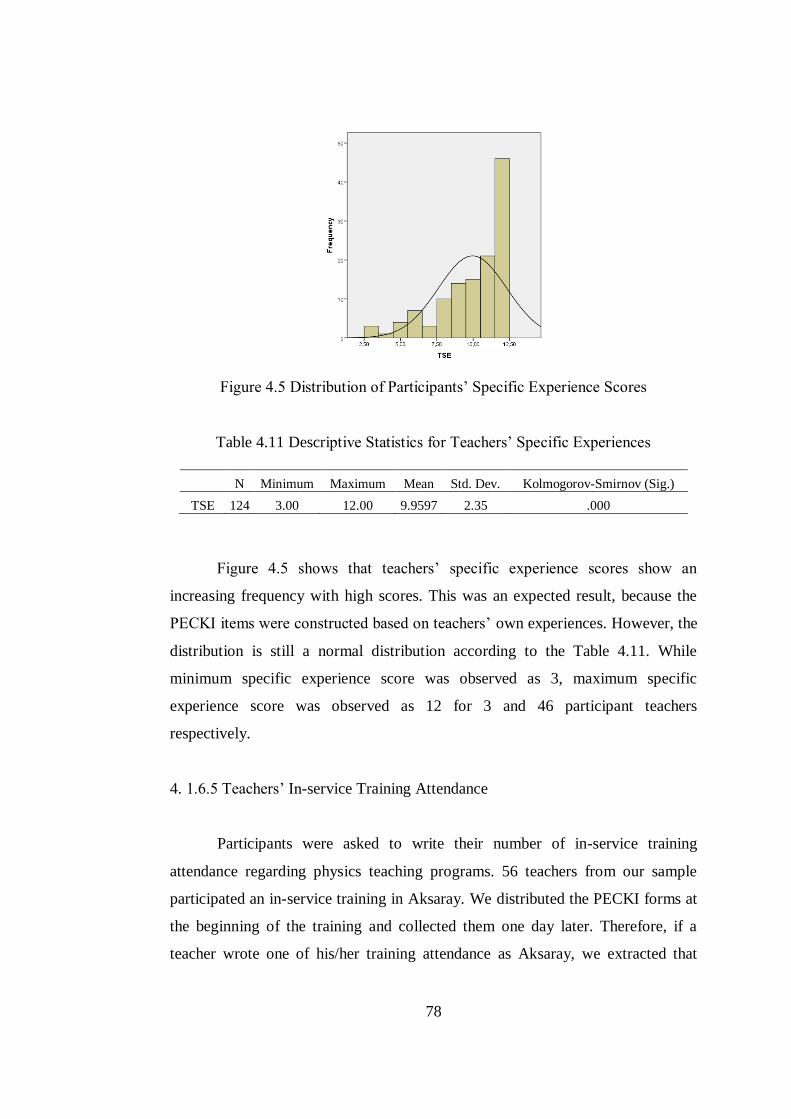
78
Figure 4.5 Distribution of Participants’ Specific Experience Scores
Table 4.11 Descriptive Statistics for Teachers’ Specific Experiences
N Minimum Maximum Mean Std. Dev. Kolmogorov-Smirnov (Sig.)
TSE 124 3.00 12.00 9.9597 2.35 .000
Figure 4.5 shows that teachers’ specific experience scores show an
increasing frequency with high scores. This was an expected result, because the
PECKI items were constructed based on teachers’ own experiences. However, the
distribution is still a normal distribution according to the Table 4.11. While
minimum specific experience score was observed as 3, maximum specific
experience score was observed as 12 for 3 and 46 participant teachers
respectively.
4. 1.6.5 Teachers’ In-service Training Attendance
Participants were asked to write their number of in-service training
attendance regarding physics teaching programs. 56 teachers from our sample
participated an in-service training in Aksaray. We distributed the PECKI forms at
the beginning of the training and collected them one day later. Therefore, if a
teacher wrote one of his/her training attendance as Aksaray, we extracted that
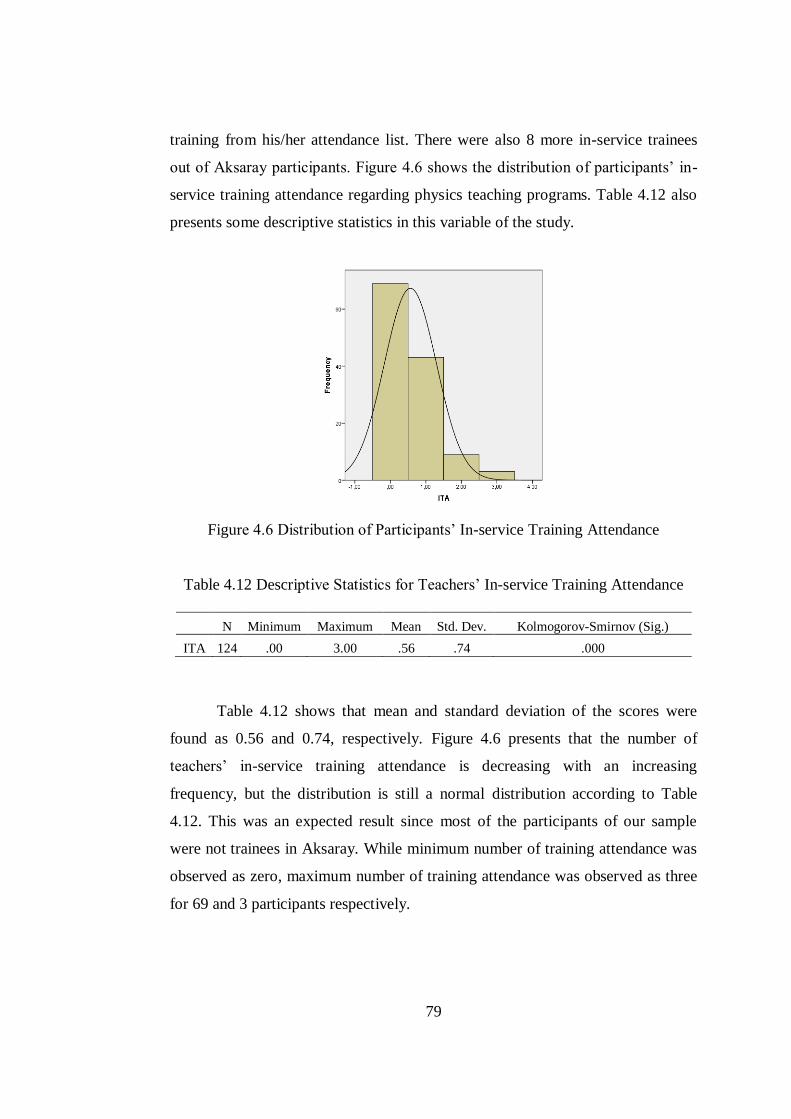
79
training from his/her attendance list. There were also 8 more in-service trainees
out of Aksaray participants. Figure 4.6 shows the distribution of participants’ in-
service training attendance regarding physics teaching programs. Table 4.12 also
presents some descriptive statistics in this variable of the study.
Figure 4.6 Distribution of Participants’ In-service Training Attendance
Table 4.12 Descriptive Statistics for Teachers’ In-service Training Attendance
N Minimum Maximum Mean Std. Dev. Kolmogorov-Smirnov (Sig.)
ITA 124 .00 3.00 .56 .74 .000
Table 4.12 shows that mean and standard deviation of the scores were
found as 0.56 and 0.74, respectively. Figure 4.6 presents that the number of
teachers’ in-service training attendance is decreasing with an increasing
frequency, but the distribution is still a normal distribution according to Table
4.12. This was an expected result since most of the participants of our sample
were not trainees in Aksaray. While minimum number of training attendance was
observed as zero, maximum number of training attendance was observed as three
for 69 and 3 participants respectively.
80
4.2 Survey Results
In this section, survey results regarding the second and third research
problems were presented.
4.2.1 Teachers’ Knowledge of Students’ Understanding of Electricity
In this section of the study, second research problem of the study, which
was related to the assessment of high school physics teachers’ knowledge about
students’ pre-instructional thinking and misconceptions in electricity, was
handled.
There were 11 items under this component of PECKI at the beginning of
the analysis. Based on the exploratory and confirmatory factor analyses results
and two physics educators’ suggestions, Items 4 and 5 were discarded from the
data set. Therefore, total maximum score available decreased to 22 for the
remaining nine items of the KSUE component. Figure 4.7 shows histogram of
KSUE scores. Table 4.13 also presents some descriptive statistics in teachers’
KSUE scores.
Figure 4.7 Histogram of KSUE Scores
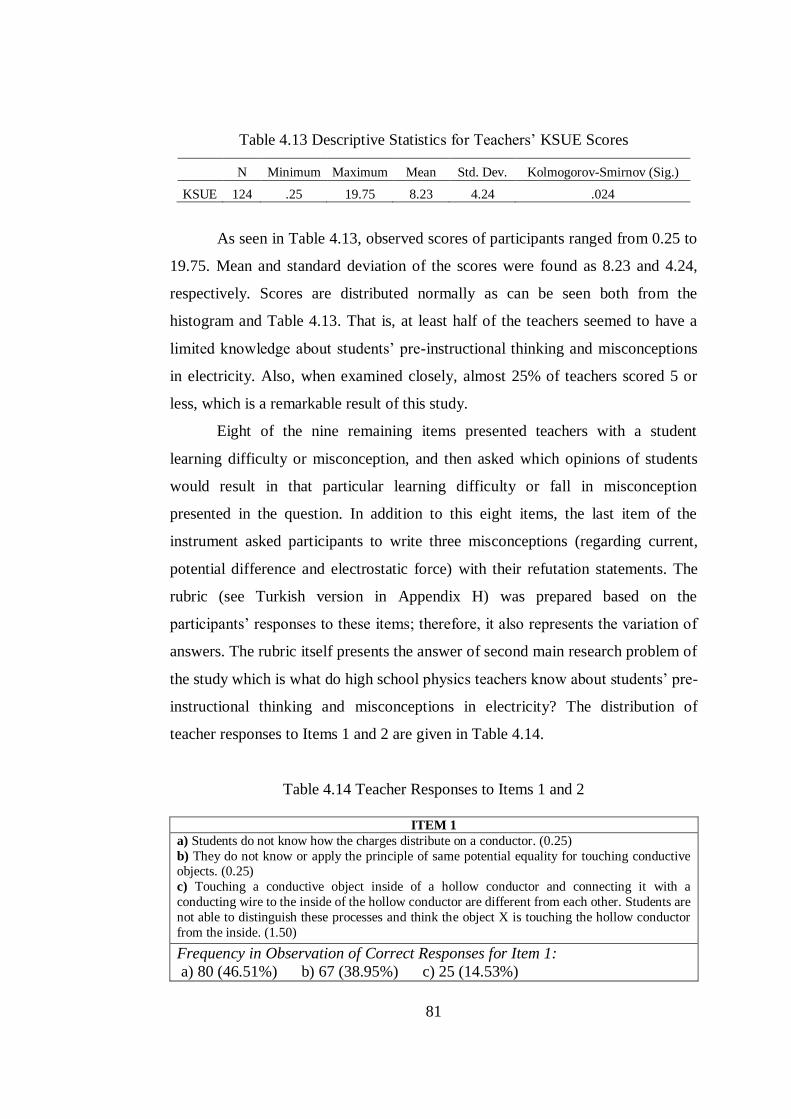
81
Table 4.13 Descriptive Statistics for Teachers’ KSUE Scores
N Minimum Maximum Mean Std. Dev. Kolmogorov-Smirnov (Sig.)
KSUE 124 .25 19.75 8.23 4.24 .024
As seen in Table 4.13, observed scores of participants ranged from 0.25 to
19.75. Mean and standard deviation of the scores were found as 8.23 and 4.24,
respectively. Scores are distributed normally as can be seen both from the
histogram and Table 4.13. That is, at least half of the teachers seemed to have a
limited knowledge about students’ pre-instructional thinking and misconceptions
in electricity. Also, when examined closely, almost 25% of teachers scored 5 or
less, which is a remarkable result of this study.
Eight of the nine remaining items presented teachers with a student
learning difficulty or misconception, and then asked which opinions of students
would result in that particular learning difficulty or fall in misconception
presented in the question. In addition to this eight items, the last item of the
instrument asked participants to write three misconceptions (regarding current,
potential difference and electrostatic force) with their refutation statements. The
rubric (see Turkish version in Appendix H) was prepared based on the
participants’ responses to these items; therefore, it also represents the variation of
answers. The rubric itself presents the answer of second main research problem of
the study which is what do high school physics teachers know about students’ pre-
instructional thinking and misconceptions in electricity? The distribution of
teacher responses to Items 1 and 2 are given in Table 4.14.
Table 4.14 Teacher Responses to Items 1 and 2
ITEM 1
a) Students do not know how the charges distribute on a conductor. (0.25)
b) They do not know or apply the principle of same potential equality for touching conductive objects. (0.25)
c) Touching a conductive object inside of a hollow conductor and connecting it with a
conducting wire to the inside of the hollow conductor are different from each other. Students are
not able to distinguish these processes and think the object X is touching the hollow conductor
from the inside. (1.50)
Frequency in Observation of Correct Responses for Item 1:
a) 80 (46.51%) b) 67 (38.95%) c) 25 (14.53%)
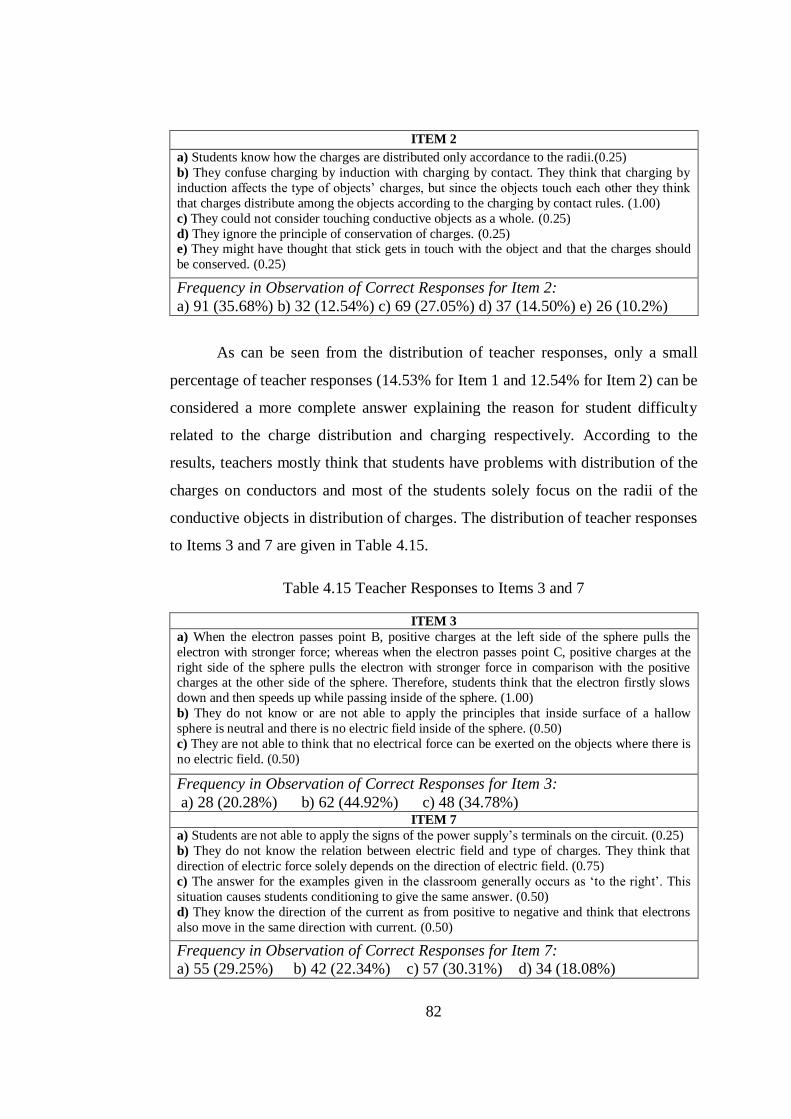
82
ITEM 2
a) Students know how the charges are distributed only accordance to the radii.(0.25)
b) They confuse charging by induction with charging by contact. They think that charging by
induction affects the type of objects’ charges, but since the objects touch each other they think
that charges distribute among the objects according to the charging by contact rules. (1.00)
c) They could not consider touching conductive objects as a whole. (0.25)
d) They ignore the principle of conservation of charges. (0.25) e) They might have thought that stick gets in touch with the object and that the charges should
be conserved. (0.25)
Frequency in Observation of Correct Responses for Item 2:
a) 91 (35.68%) b) 32 (12.54%) c) 69 (27.05%) d) 37 (14.50%) e) 26 (10.2%)
As can be seen from the distribution of teacher responses, only a small
percentage of teacher responses (14.53% for Item 1 and 12.54% for Item 2) can be
considered a more complete answer explaining the reason for student difficulty
related to the charge distribution and charging respectively. According to the
results, teachers mostly think that students have problems with distribution of the
charges on conductors and most of the students solely focus on the radii of the
conductive objects in distribution of charges. The distribution of teacher responses
to Items 3 and 7 are given in Table 4.15.
Table 4.15 Teacher Responses to Items 3 and 7
ITEM 3
a) When the electron passes point B, positive charges at the left side of the sphere pulls the
electron with stronger force; whereas when the electron passes point C, positive charges at the
right side of the sphere pulls the electron with stronger force in comparison with the positive charges at the other side of the sphere. Therefore, students think that the electron firstly slows
down and then speeds up while passing inside of the sphere. (1.00)
b) They do not know or are not able to apply the principles that inside surface of a hallow
sphere is neutral and there is no electric field inside of the sphere. (0.50)
c) They are not able to think that no electrical force can be exerted on the objects where there is
no electric field. (0.50)
Frequency in Observation of Correct Responses for Item 3:
a) 28 (20.28%) b) 62 (44.92%) c) 48 (34.78%) ITEM 7
a) Students are not able to apply the signs of the power supply’s terminals on the circuit. (0.25)
b) They do not know the relation between electric field and type of charges. They think that
direction of electric force solely depends on the direction of electric field. (0.75)
c) The answer for the examples given in the classroom generally occurs as ‘to the right’. This
situation causes students conditioning to give the same answer. (0.50)
d) They know the direction of the current as from positive to negative and think that electrons
also move in the same direction with current. (0.50)
Frequency in Observation of Correct Responses for Item 7:
a) 55 (29.25%) b) 42 (22.34%) c) 57 (30.31%) d) 34 (18.08%)
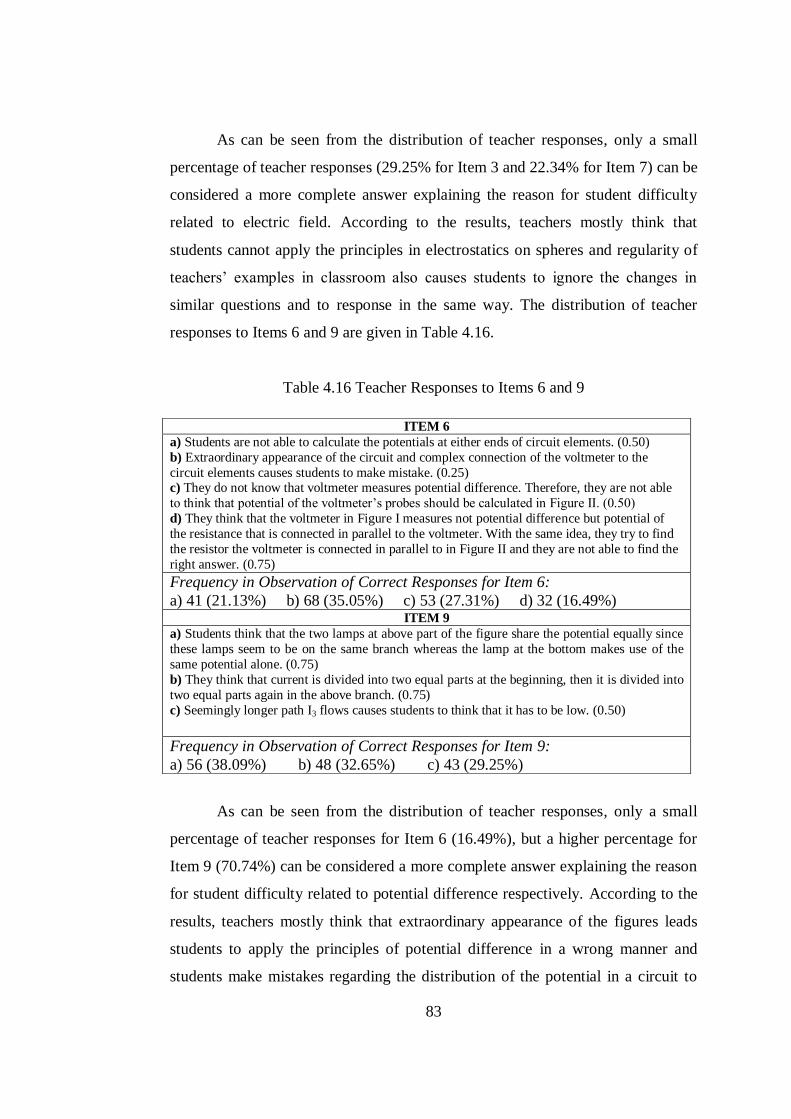
83
As can be seen from the distribution of teacher responses, only a small
percentage of teacher responses (29.25% for Item 3 and 22.34% for Item 7) can be
considered a more complete answer explaining the reason for student difficulty
related to electric field. According to the results, teachers mostly think that
students cannot apply the principles in electrostatics on spheres and regularity of
teachers’ examples in classroom also causes students to ignore the changes in
similar questions and to response in the same way. The distribution of teacher
responses to Items 6 and 9 are given in Table 4.16.
Table 4.16 Teacher Responses to Items 6 and 9
As can be seen from the distribution of teacher responses, only a small
percentage of teacher responses for Item 6 (16.49%), but a higher percentage for
Item 9 (70.74%) can be considered a more complete answer explaining the reason
for student difficulty related to potential difference respectively. According to the
results, teachers mostly think that extraordinary appearance of the figures leads
students to apply the principles of potential difference in a wrong manner and
students make mistakes regarding the distribution of the potential in a circuit to
ITEM 6
a) Students are not able to calculate the potentials at either ends of circuit elements. (0.50)
b) Extraordinary appearance of the circuit and complex connection of the voltmeter to the
circuit elements causes students to make mistake. (0.25) c) They do not know that voltmeter measures potential difference. Therefore, they are not able
to think that potential of the voltmeter’s probes should be calculated in Figure II. (0.50)
d) They think that the voltmeter in Figure I measures not potential difference but potential of
the resistance that is connected in parallel to the voltmeter. With the same idea, they try to find
the resistor the voltmeter is connected in parallel to in Figure II and they are not able to find the
right answer. (0.75)
Frequency in Observation of Correct Responses for Item 6:
a) 41 (21.13%) b) 68 (35.05%) c) 53 (27.31%) d) 32 (16.49%) ITEM 9
a) Students think that the two lamps at above part of the figure share the potential equally since
these lamps seem to be on the same branch whereas the lamp at the bottom makes use of the
same potential alone. (0.75)
b) They think that current is divided into two equal parts at the beginning, then it is divided into
two equal parts again in the above branch. (0.75)
c) Seemingly longer path I3 flows causes students to think that it has to be low. (0.50)
Frequency in Observation of Correct Responses for Item 9:
a) 56 (38.09%) b) 48 (32.65%) c) 43 (29.25%)
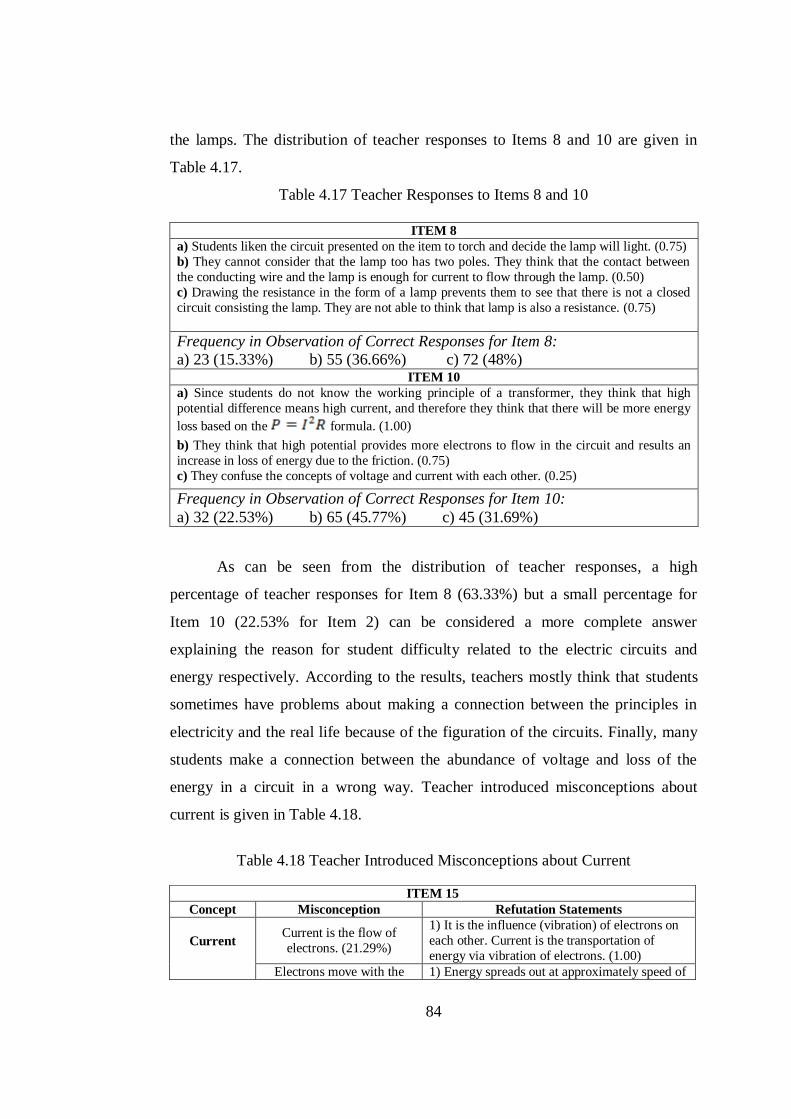
84
the lamps. The distribution of teacher responses to Items 8 and 10 are given in
Table 4.17.
Table 4.17 Teacher Responses to Items 8 and 10
ITEM 8
a) Students liken the circuit presented on the item to torch and decide the lamp will light. (0.75)
b) They cannot consider that the lamp too has two poles. They think that the contact between
the conducting wire and the lamp is enough for current to flow through the lamp. (0.50)
c) Drawing the resistance in the form of a lamp prevents them to see that there is not a closed
circuit consisting the lamp. They are not able to think that lamp is also a resistance. (0.75)
Frequency in Observation of Correct Responses for Item 8:
a) 23 (15.33%) b) 55 (36.66%) c) 72 (48%) ITEM 10
a) Since students do not know the working principle of a transformer, they think that high
potential difference means high current, and therefore they think that there will be more energy
loss based on the formula. (1.00)
b) They think that high potential provides more electrons to flow in the circuit and results an
increase in loss of energy due to the friction. (0.75)
c) They confuse the concepts of voltage and current with each other. (0.25)
Frequency in Observation of Correct Responses for Item 10:
a) 32 (22.53%) b) 65 (45.77%) c) 45 (31.69%)
As can be seen from the distribution of teacher responses, a high
percentage of teacher responses for Item 8 (63.33%) but a small percentage for
Item 10 (22.53% for Item 2) can be considered a more complete answer
explaining the reason for student difficulty related to the electric circuits and
energy respectively. According to the results, teachers mostly think that students
sometimes have problems about making a connection between the principles in
electricity and the real life because of the figuration of the circuits. Finally, many
students make a connection between the abundance of voltage and loss of the
energy in a circuit in a wrong way. Teacher introduced misconceptions about
current is given in Table 4.18.
Table 4.18 Teacher Introduced Misconceptions about Current
ITEM 15
Concept Misconception Refutation Statements
Current
Current is the flow of
electrons. (21.29%)
1) It is the influence (vibration) of electrons on
each other. Current is the transportation of
energy via vibration of electrons. (1.00)
Electrons move with the 1) Energy spreads out at approximately speed of
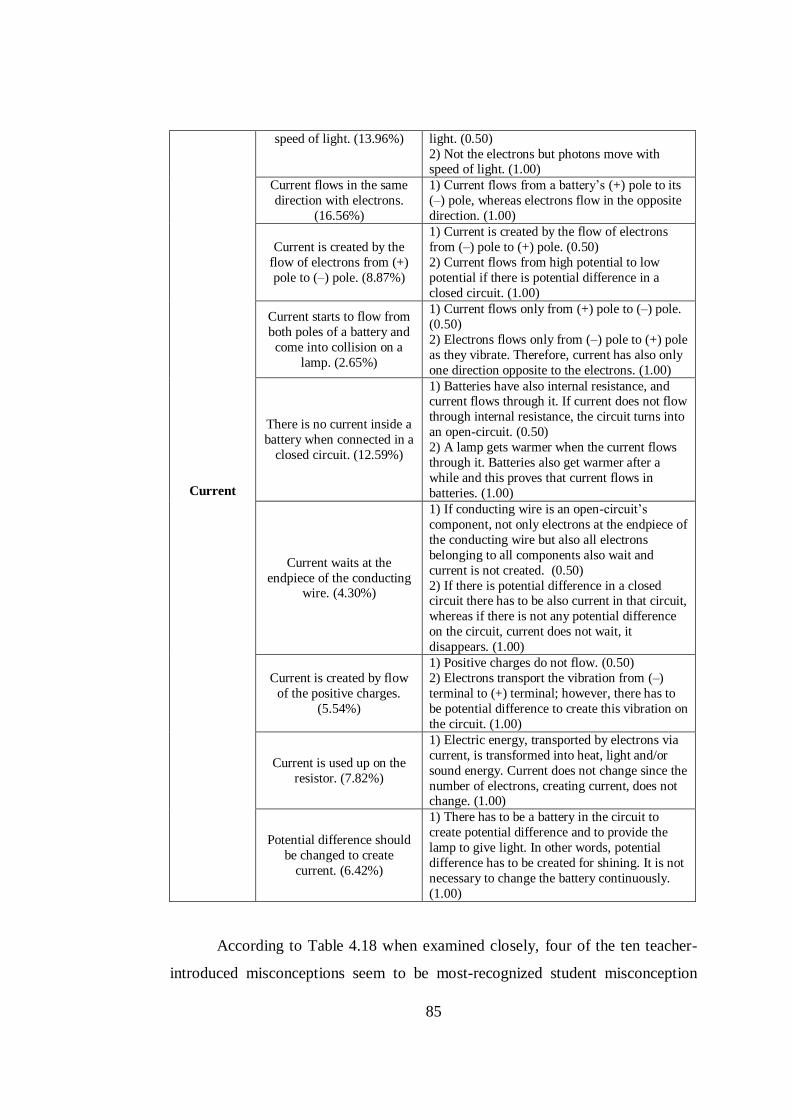
85
According to Table 4.18 when examined closely, four of the ten teacher-
introduced misconceptions seem to be most-recognized student misconception
Current
speed of light. (13.96%) light. (0.50)
2) Not the electrons but photons move with speed of light. (1.00)
Current flows in the same
direction with electrons.
(16.56%)
1) Current flows from a battery’s (+) pole to its
(–) pole, whereas electrons flow in the opposite
direction. (1.00)
Current is created by the
flow of electrons from (+)
pole to (–) pole. (8.87%)
1) Current is created by the flow of electrons
from (–) pole to (+) pole. (0.50)
2) Current flows from high potential to low
potential if there is potential difference in a
closed circuit. (1.00)
Current starts to flow from
both poles of a battery and
come into collision on a
lamp. (2.65%)
1) Current flows only from (+) pole to (–) pole.
(0.50)
2) Electrons flows only from (–) pole to (+) pole
as they vibrate. Therefore, current has also only
one direction opposite to the electrons. (1.00)
There is no current inside a
battery when connected in a
closed circuit. (12.59%)
1) Batteries have also internal resistance, and current flows through it. If current does not flow
through internal resistance, the circuit turns into
an open-circuit. (0.50)
2) A lamp gets warmer when the current flows
through it. Batteries also get warmer after a
while and this proves that current flows in
batteries. (1.00)
Current waits at the
endpiece of the conducting wire. (4.30%)
1) If conducting wire is an open-circuit’s
component, not only electrons at the endpiece of
the conducting wire but also all electrons
belonging to all components also wait and
current is not created. (0.50)
2) If there is potential difference in a closed circuit there has to be also current in that circuit,
whereas if there is not any potential difference
on the circuit, current does not wait, it
disappears. (1.00)
Current is created by flow
of the positive charges.
(5.54%)
1) Positive charges do not flow. (0.50)
2) Electrons transport the vibration from (–)
terminal to (+) terminal; however, there has to
be potential difference to create this vibration on
the circuit. (1.00)
Current is used up on the
resistor. (7.82%)
1) Electric energy, transported by electrons via
current, is transformed into heat, light and/or
sound energy. Current does not change since the
number of electrons, creating current, does not change. (1.00)
Potential difference should
be changed to create
current. (6.42%)
1) There has to be a battery in the circuit to
create potential difference and to provide the
lamp to give light. In other words, potential
difference has to be created for shining. It is not
necessary to change the battery continuously.
(1.00)
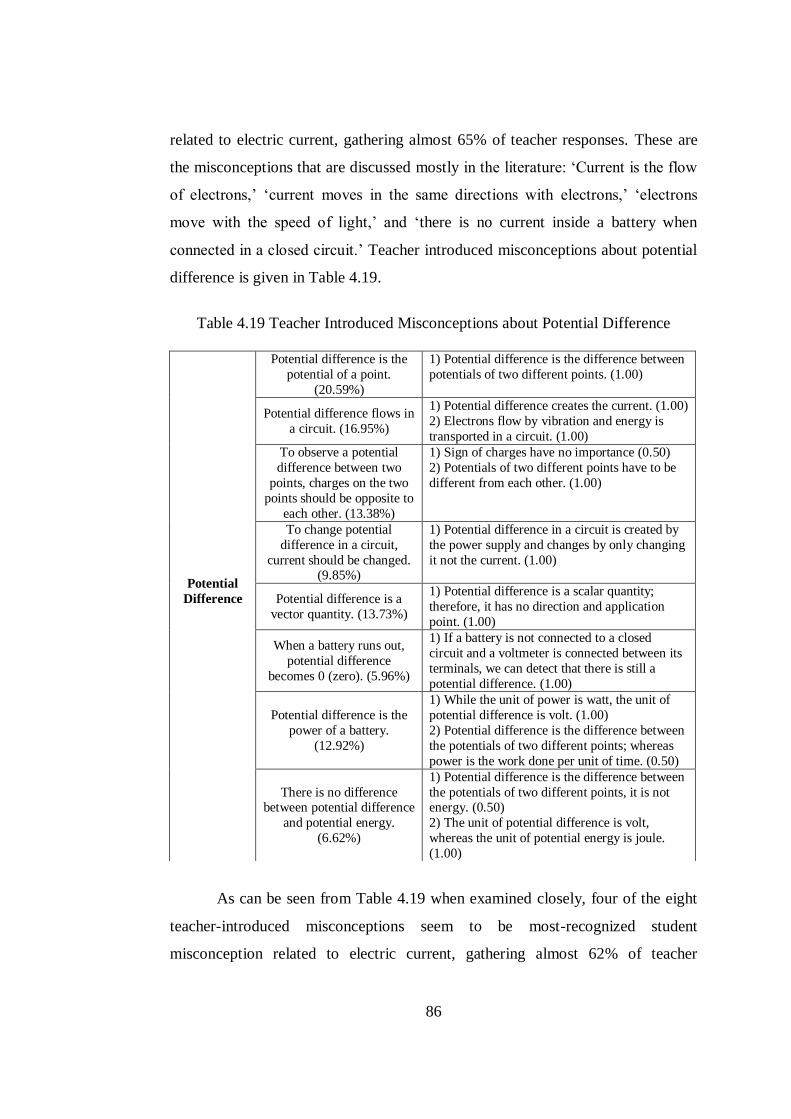
86
related to electric current, gathering almost 65% of teacher responses. These are
the misconceptions that are discussed mostly in the literature: ‘Current is the flow
of electrons,’ ‘current moves in the same directions with electrons,’ ‘electrons
move with the speed of light,’ and ‘there is no current inside a battery when
connected in a closed circuit.’ Teacher introduced misconceptions about potential
difference is given in Table 4.19.
Table 4.19 Teacher Introduced Misconceptions about Potential Difference
As can be seen from Table 4.19 when examined closely, four of the eight
teacher-introduced misconceptions seem to be most-recognized student
misconception related to electric current, gathering almost 62% of teacher
Potential
Difference
Potential difference is the
potential of a point.
(20.59%)
1) Potential difference is the difference between
potentials of two different points. (1.00)
Potential difference flows in
a circuit. (16.95%)
1) Potential difference creates the current. (1.00)
2) Electrons flow by vibration and energy is
transported in a circuit. (1.00)
To observe a potential
difference between two
points, charges on the two
points should be opposite to
each other. (13.38%)
1) Sign of charges have no importance (0.50)
2) Potentials of two different points have to be
different from each other. (1.00)
To change potential
difference in a circuit,
current should be changed. (9.85%)
1) Potential difference in a circuit is created by
the power supply and changes by only changing
it not the current. (1.00)
Potential difference is a
vector quantity. (13.73%)
1) Potential difference is a scalar quantity;
therefore, it has no direction and application
point. (1.00)
When a battery runs out,
potential difference
becomes 0 (zero). (5.96%)
1) If a battery is not connected to a closed
circuit and a voltmeter is connected between its
terminals, we can detect that there is still a
potential difference. (1.00)
Potential difference is the
power of a battery.
(12.92%)
1) While the unit of power is watt, the unit of
potential difference is volt. (1.00)
2) Potential difference is the difference between
the potentials of two different points; whereas
power is the work done per unit of time. (0.50)
There is no difference between potential difference
and potential energy.
(6.62%)
1) Potential difference is the difference between
the potentials of two different points, it is not energy. (0.50)
2) The unit of potential difference is volt,
whereas the unit of potential energy is joule.
(1.00)
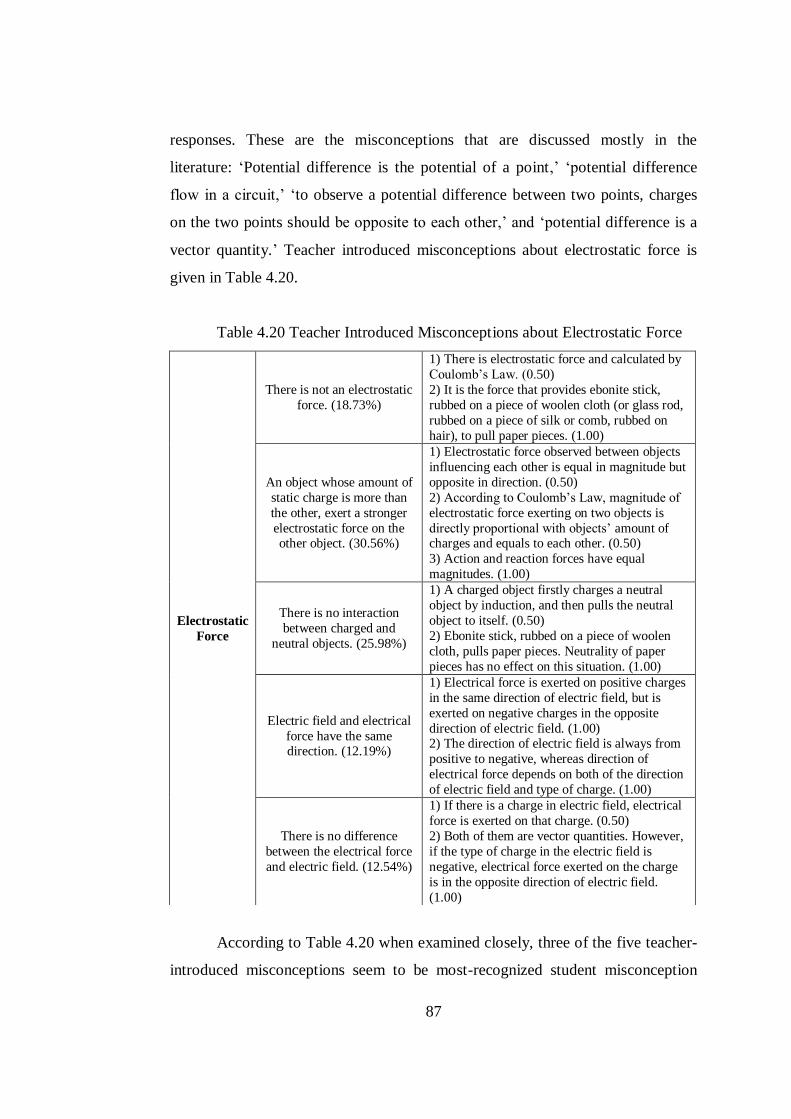
87
responses. These are the misconceptions that are discussed mostly in the
literature: ‘Potential difference is the potential of a point,’ ‘potential difference
flow in a circuit,’ ‘to observe a potential difference between two points, charges
on the two points should be opposite to each other,’ and ‘potential difference is a
vector quantity.’ Teacher introduced misconceptions about electrostatic force is
given in Table 4.20.
Table 4.20 Teacher Introduced Misconceptions about Electrostatic Force
According to Table 4.20 when examined closely, three of the five teacher-
introduced misconceptions seem to be most-recognized student misconception
Electrostatic
Force
There is not an electrostatic
force. (18.73%)
1) There is electrostatic force and calculated by
Coulomb’s Law. (0.50)
2) It is the force that provides ebonite stick,
rubbed on a piece of woolen cloth (or glass rod,
rubbed on a piece of silk or comb, rubbed on
hair), to pull paper pieces. (1.00)
An object whose amount of
static charge is more than
the other, exert a stronger
electrostatic force on the other object. (30.56%)
1) Electrostatic force observed between objects
influencing each other is equal in magnitude but
opposite in direction. (0.50)
2) According to Coulomb’s Law, magnitude of
electrostatic force exerting on two objects is
directly proportional with objects’ amount of charges and equals to each other. (0.50)
3) Action and reaction forces have equal
magnitudes. (1.00)
There is no interaction
between charged and
neutral objects. (25.98%)
1) A charged object firstly charges a neutral
object by induction, and then pulls the neutral
object to itself. (0.50)
2) Ebonite stick, rubbed on a piece of woolen
cloth, pulls paper pieces. Neutrality of paper
pieces has no effect on this situation. (1.00)
Electric field and electrical
force have the same direction. (12.19%)
1) Electrical force is exerted on positive charges
in the same direction of electric field, but is
exerted on negative charges in the opposite
direction of electric field. (1.00) 2) The direction of electric field is always from
positive to negative, whereas direction of
electrical force depends on both of the direction
of electric field and type of charge. (1.00)
There is no difference
between the electrical force
and electric field. (12.54%)
1) If there is a charge in electric field, electrical
force is exerted on that charge. (0.50)
2) Both of them are vector quantities. However,
if the type of charge in the electric field is
negative, electrical force exerted on the charge
is in the opposite direction of electric field.
(1.00)
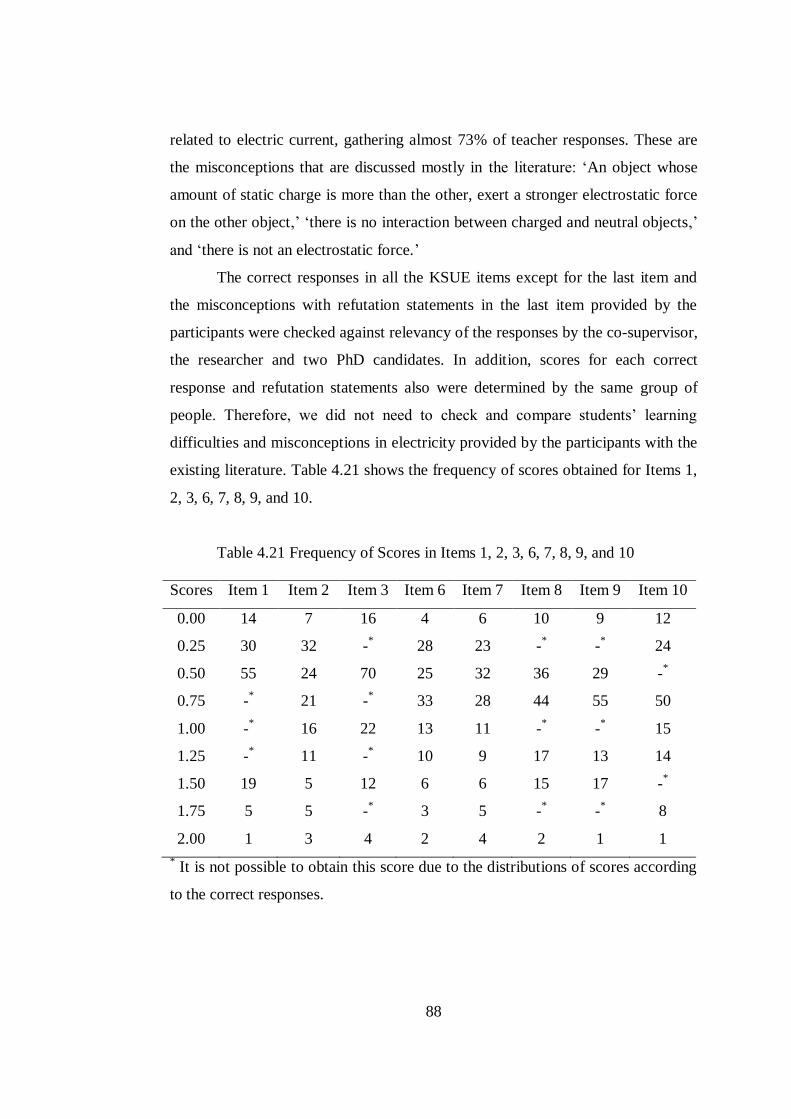
88
related to electric current, gathering almost 73% of teacher responses. These are
the misconceptions that are discussed mostly in the literature: ‘An object whose
amount of static charge is more than the other, exert a stronger electrostatic force
on the other object,’ ‘there is no interaction between charged and neutral objects,’
and ‘there is not an electrostatic force.’
The correct responses in all the KSUE items except for the last item and
the misconceptions with refutation statements in the last item provided by the
participants were checked against relevancy of the responses by the co-supervisor,
the researcher and two PhD candidates. In addition, scores for each correct
response and refutation statements also were determined by the same group of
people. Therefore, we did not need to check and compare students’ learning
difficulties and misconceptions in electricity provided by the participants with the
existing literature. Table 4.21 shows the frequency of scores obtained for Items 1,
2, 3, 6, 7, 8, 9, and 10.
Table 4.21 Frequency of Scores in Items 1, 2, 3, 6, 7, 8, 9, and 10
Scores Item 1 Item 2 Item 3 Item 6 Item 7 Item 8 Item 9 Item 10
0.00 14 7 16 4 6 10 9 12
0.25 30 32 -*
28 23 -*
-*
24
0.50 55 24 70 25 32 36 29 -*
0.75 -*
21 -*
33 28 44 55 50
1.00 -*
16 22 13 11 -*
-*
15
1.25 -*
11 -*
10 9 17 13 14
1.50 19 5 12 6 6 15 17 -*
1.75 5 5 -*
3 5 -*
-*
8
2.00 1 3 4 2 4 2 1 1
* It is not possible to obtain this score due to the distributions of scores according
to the correct responses.
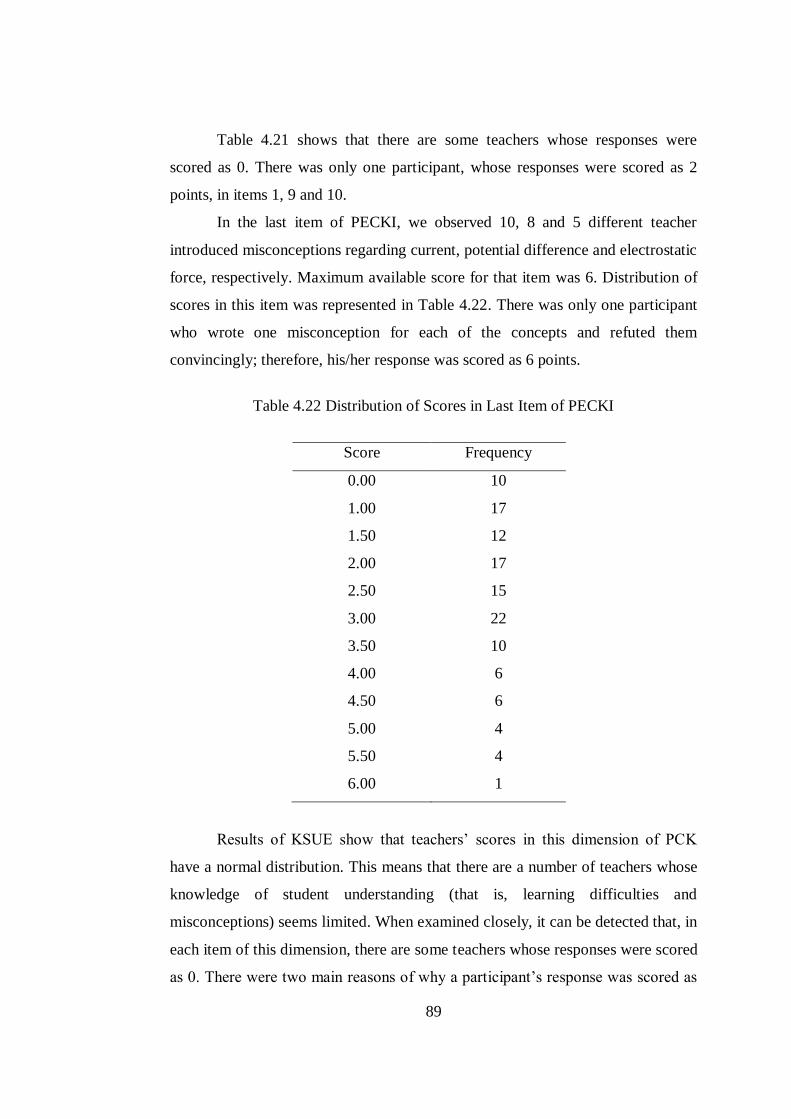
89
Table 4.21 shows that there are some teachers whose responses were
scored as 0. There was only one participant, whose responses were scored as 2
points, in items 1, 9 and 10.
In the last item of PECKI, we observed 10, 8 and 5 different teacher
introduced misconceptions regarding current, potential difference and electrostatic
force, respectively. Maximum available score for that item was 6. Distribution of
scores in this item was represented in Table 4.22. There was only one participant
who wrote one misconception for each of the concepts and refuted them
convincingly; therefore, his/her response was scored as 6 points.
Table 4.22 Distribution of Scores in Last Item of PECKI
Score Frequency
0.00 10
1.00 17
1.50 12
2.00 17
2.50 15
3.00 22
3.50 10
4.00 6
4.50 6
5.00 4
5.50 4
6.00 1
Results of KSUE show that teachers’ scores in this dimension of PCK
have a normal distribution. This means that there are a number of teachers whose
knowledge of student understanding (that is, learning difficulties and
misconceptions) seems limited. When examined closely, it can be detected that, in
each item of this dimension, there are some teachers whose responses were scored
as 0. There were two main reasons of why a participant’s response was scored as
90
0. First one was non-responded items which were scored as 0. Second one was the
irrelevancy of participants’ answers to the items. In most of 0-point scored items,
participants gave a response; however, their responses did not include a student’s
pre-instructional thinking or a misconception.
4.2.2 Survey Results of Teachers’ Knowledge of Instructional Strategies
The names and definitions of the codes utilized in the study were presented
independently from the topic of electricity in the study. Regarding the study, this
may create a perception as if it is opposite to the structure of PCK which is
already a topic-specific knowledge. The items in this dimension of the instrument
completely focused on some concepts of electricity. Therefore, results of the study
in this dimension of PCK should not be accepted as that they are measuring high
school physics teachers’ pedagogical knowledge instead of their PCK.
There were only 4 open-ended items, 11th, 12
th, 13
th and 14
th items,
constructed for the assessment of physics teachers’ KIS as can be seen in Table
3.3. All the items in this component of PCK presented participants with a learning
difficulty or a misconception students possess; and then asked for how they teach
the subject in that situation. The questions were structured such that teachers were
requested two different responses. Firstly, each item asked how the participants
would teach the subject to a new group of students taking into account the student
learning difficulty or misconception presented in each item. Secondly each item
also asked the participants about how they would teach if they needed to repeat
the subject in the presence of the student learning difficulty or misconception. In
this way, we wanted to observe at least two different instructional strategies in
responses to these items. Additional points were awarded depending on whether
teachers provided a different strategy for the second part of the question.
During our qualitative analysis we encountered a critical problem. This
was the number of data sources being included in analysis. We only utilized
participants’ answers given to four open-ended items in analysis. Our main aim
was the assessment of a teacher’s PCK with a single implementation. This would
91
increase the repetition of our study by other researchers. However, it was, in most
cases, very difficult to grasp whether a teacher would make all the requirements of
an instructional strategy in his/her classroom. Because, participants generally
preferred to write their answers in a few sentences. This deficiency in our data
forced us during matching the answers with the codes. In these situations, we
matched an answer with the closest code to that answer. In other words, if a
teacher’s answer was briefly including some critical aspects of an instructional
strategy we admitted that this teacher was implementing that instructional strategy
in his/her classroom. For example, if a teacher stated that I provide my students to
make an experiment about power of lamps and give enough time to them for
thinking on and analyzing the data to empower their meaningful learning, we then
matched this answer with inquiry strategies from our codes.
In following sub-sections you can see firstly the qualitative analysis results
of these 4 items were presented, followed by a summary of the results of KIS. In
analysis of each item, we gave some numeric information including the number of
observations with their matched codes and frequency of observed strategies. Then,
we presented some teacher responses from our implementation. In the summary of
this title, we also presented whole distribution of participated teachers’
preferences regarding instructional strategies.
4.2.2.1 Analysis of 11th
Item
There were 124 teachers participated in the study. 14 of the participants
gave no response or not a valid response matching with our codes to this item
meaning that whose responses could not be categorized into an instructional
strategy. The remaining 110 teachers provided at least one strategy, which we
considered as a sign of taking students’ difficulty in selecting a teaching strategy.
We observed at least one instructional strategy in a responded and valid paper.
The maximum number of the instructional strategies that we observed in a paper
was three. We observed 194 instructional strategies in total distributed to our
codes which included 5 different types of instructional strategies. Table 4.23
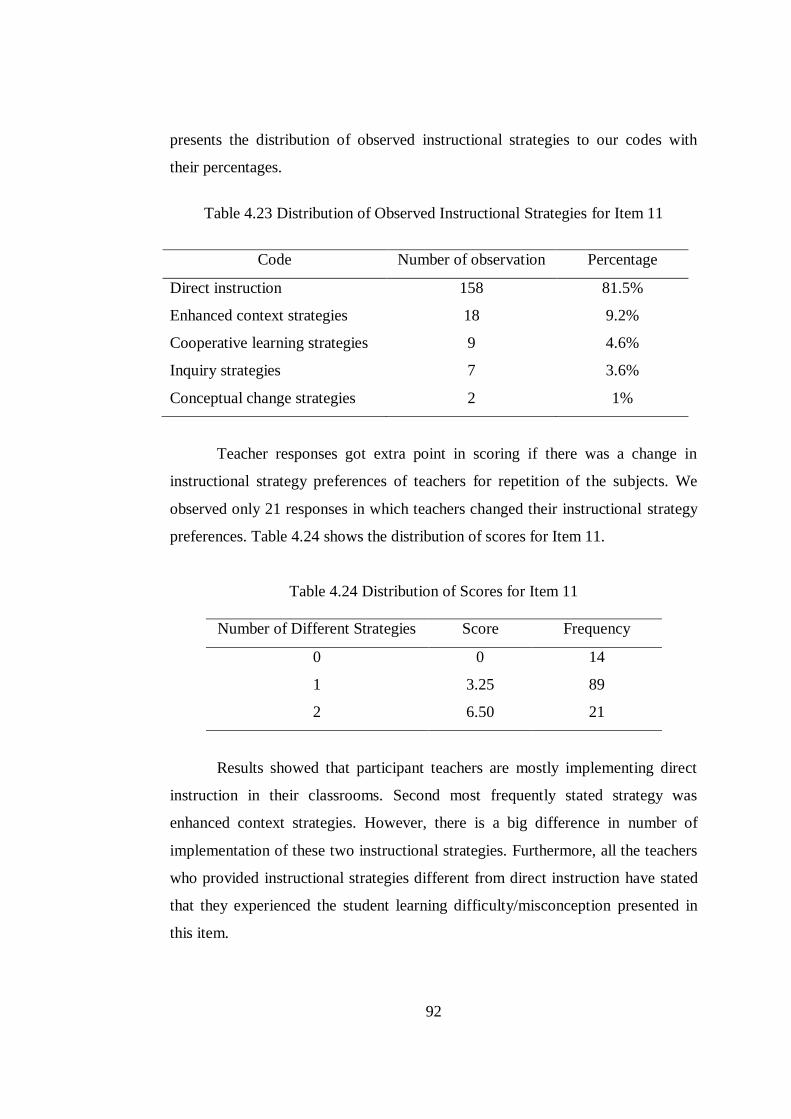
92
presents the distribution of observed instructional strategies to our codes with
their percentages.
Table 4.23 Distribution of Observed Instructional Strategies for Item 11
Code Number of observation Percentage
Direct instruction
Enhanced context strategies
Cooperative learning strategies
Inquiry strategies
Conceptual change strategies
158
18
9
7
2
81.5%
9.2%
4.6%
3.6%
1%
Teacher responses got extra point in scoring if there was a change in
instructional strategy preferences of teachers for repetition of the subjects. We
observed only 21 responses in which teachers changed their instructional strategy
preferences. Table 4.24 shows the distribution of scores for Item 11.
Table 4.24 Distribution of Scores for Item 11
Number of Different Strategies Score Frequency
0
1
2
0 14
3.25 89
6.50 21
Results showed that participant teachers are mostly implementing direct
instruction in their classrooms. Second most frequently stated strategy was
enhanced context strategies. However, there is a big difference in number of
implementation of these two instructional strategies. Furthermore, all the teachers
who provided instructional strategies different from direct instruction have stated
that they experienced the student learning difficulty/misconception presented in
this item.
93
To illustrate the coding of teacher responses we presented answers of three
teachers selected randomly. Scanned images of the papers were given in
Appendix I. Teacher A wrote that she firstly would provide them to realize the
differences by giving examples from their environments and asking them how the
lamps in different rooms in their homes were lighting. This part of her answer
giving some clues to match with enhanced context strategies, since she tried to
relate learning to the students’ environment. She, then, stated with that she would
want her students to compare the brightness of lamps by increasing the number of
the lamps and by making students to try different types of circuits in the
classroom. In this part of her answer, she seemed to provide her students making
an experiment in classroom and getting their own results. For this part of her
answer, we admit that she was implementing inquiry strategy in the classroom.
For the repetition part, she stated that she would reinforce the subject with new
types of questions. This part could not be matched with instructional strategies
included in the study and scored as 0 point. As a result we observed two different
instructional strategies which were enhanced context strategies and inquiry
strategies, in her answer to this item and scored her paper as 6.5 point.
In another example, Teacher B stated that in laboratory he would divide
his students into groups of 4 or 5 students. Then, he would ask them to set up a
real circuit with the laboratory equipment. In the next step, he would want them to
represent their circuits in physical symbols meaning perhaps to ask students to
draw circuit diagram. Then he would set up an example of circuit, and compare
the values they calculated with the values they found as a result of the experiment
by using formulas. This part of teacher B’s answer was matched with cooperative
learning strategies. For the second part, he stated that he would do the same
operations stated in the first part. Therefore, his response was scored as 3.25 in
this item.
In final example, Teacher C stated that resistances placed between the
same letters are connected in parallel to each other. If other resistances appear in
the figures we can put in order them by changing the letters. She also made
different type of drawings on her paper to show the letter use. Her response was
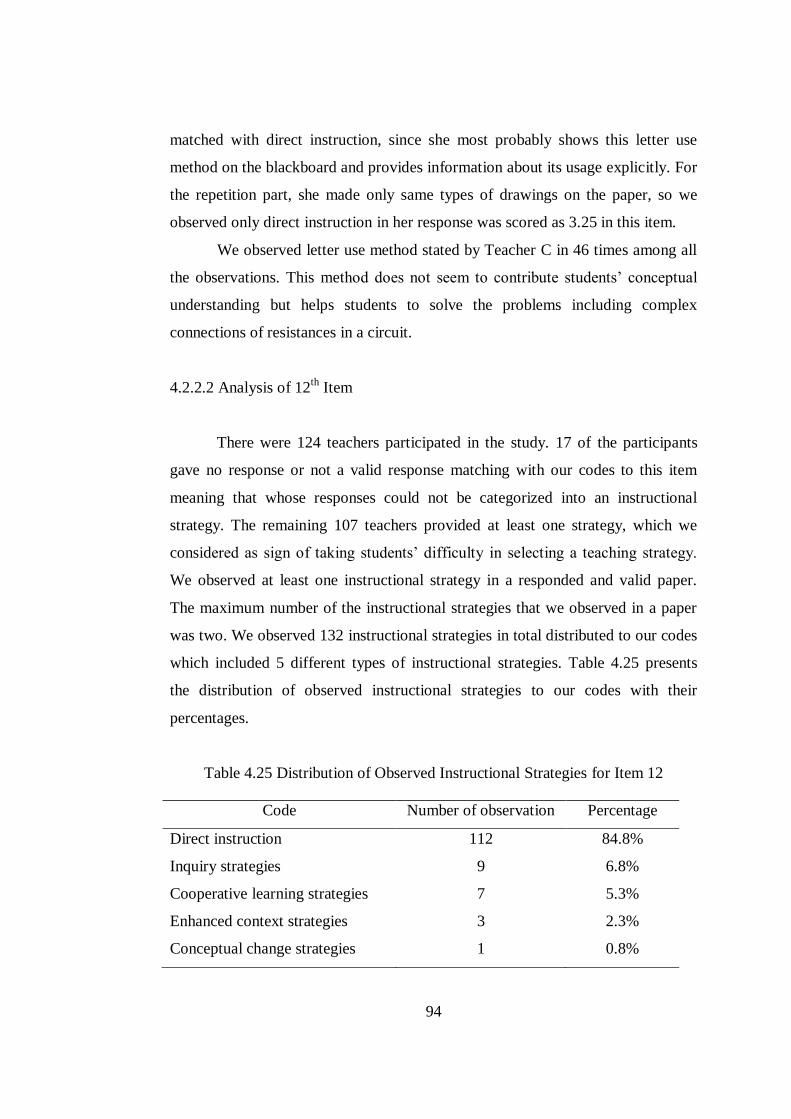
94
matched with direct instruction, since she most probably shows this letter use
method on the blackboard and provides information about its usage explicitly. For
the repetition part, she made only same types of drawings on the paper, so we
observed only direct instruction in her response was scored as 3.25 in this item.
We observed letter use method stated by Teacher C in 46 times among all
the observations. This method does not seem to contribute students’ conceptual
understanding but helps students to solve the problems including complex
connections of resistances in a circuit.
4.2.2.2 Analysis of 12th
Item
There were 124 teachers participated in the study. 17 of the participants
gave no response or not a valid response matching with our codes to this item
meaning that whose responses could not be categorized into an instructional
strategy. The remaining 107 teachers provided at least one strategy, which we
considered as sign of taking students’ difficulty in selecting a teaching strategy.
We observed at least one instructional strategy in a responded and valid paper.
The maximum number of the instructional strategies that we observed in a paper
was two. We observed 132 instructional strategies in total distributed to our codes
which included 5 different types of instructional strategies. Table 4.25 presents
the distribution of observed instructional strategies to our codes with their
percentages.
Table 4.25 Distribution of Observed Instructional Strategies for Item 12
Code Number of observation Percentage
Direct instruction
Inquiry strategies
Cooperative learning strategies
Enhanced context strategies
Conceptual change strategies
112
9
7
3
1
84.8%
6.8%
5.3%
2.3%
0.8%
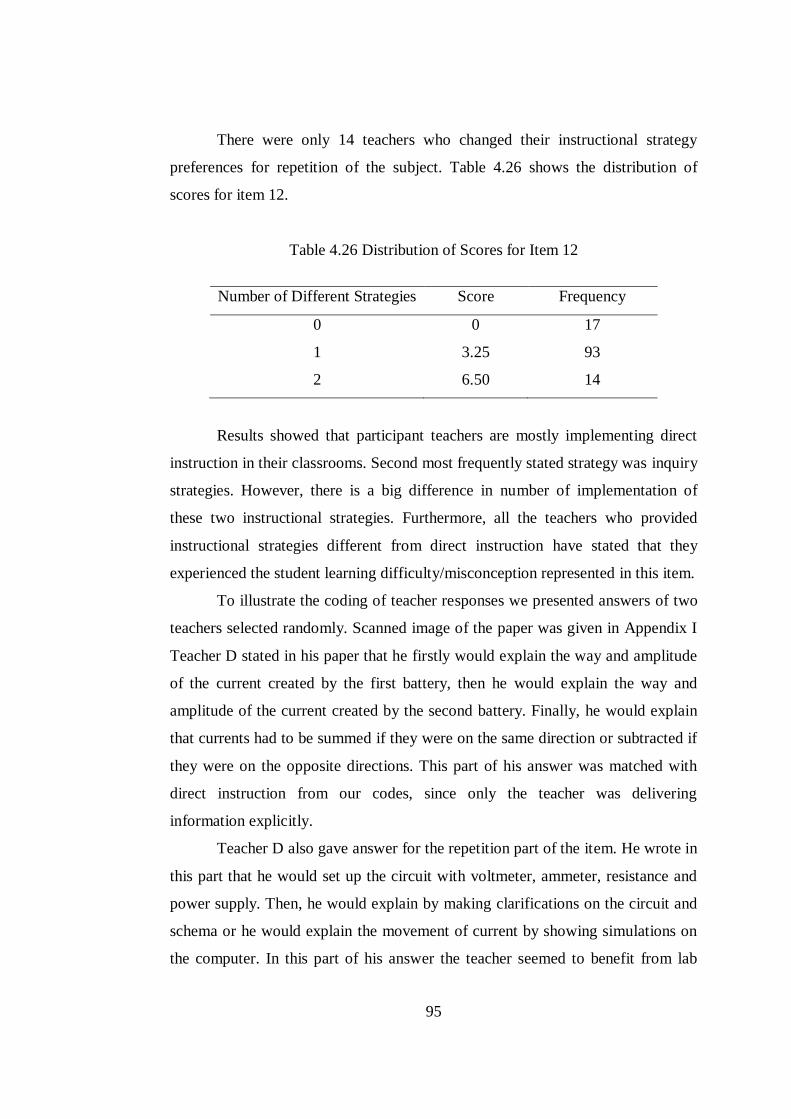
95
There were only 14 teachers who changed their instructional strategy
preferences for repetition of the subject. Table 4.26 shows the distribution of
scores for item 12.
Table 4.26 Distribution of Scores for Item 12
Number of Different Strategies Score Frequency
0 0 17
1 3.25 93
2 6.50 14
Results showed that participant teachers are mostly implementing direct
instruction in their classrooms. Second most frequently stated strategy was inquiry
strategies. However, there is a big difference in number of implementation of
these two instructional strategies. Furthermore, all the teachers who provided
instructional strategies different from direct instruction have stated that they
experienced the student learning difficulty/misconception represented in this item.
To illustrate the coding of teacher responses we presented answers of two
teachers selected randomly. Scanned image of the paper was given in Appendix I
Teacher D stated in his paper that he firstly would explain the way and amplitude
of the current created by the first battery, then he would explain the way and
amplitude of the current created by the second battery. Finally, he would explain
that currents had to be summed if they were on the same direction or subtracted if
they were on the opposite directions. This part of his answer was matched with
direct instruction from our codes, since only the teacher was delivering
information explicitly.
Teacher D also gave answer for the repetition part of the item. He wrote in
this part that he would set up the circuit with voltmeter, ammeter, resistance and
power supply. Then, he would explain by making clarifications on the circuit and
schema or he would explain the movement of current by showing simulations on
the computer. In this part of his answer the teacher seemed to benefit from lab
96
equipment, but he was still at the center of the learning process and making
clarifications explicitly. Therefore, this part of Teacher D’ answer was also
matched with direct instruction. As a result, we observed two instructional
strategies in Teacher D’s response; however, both of these strategies were direct
instruction. Therefore, we scored his response as 3.25 point in this item.
In another example, Teacher E stated that he would give a lecture by
drawing the currents coming from the different batteries with colorful pens and
attaining numerical values to them, if possible. His response in this part was
matched with direct instruction. In the second part he stated that he would give
some similar examples. Then, he would divide students into groups and give them
similar problems. Finally, he would offer students to come to next lesson be
prepared and make discussions. This part of his giving some clues about direct
instruction; however, remaining part could not be matched with any instructional
since the type and result of student discussions are not definite. Therefore, his
response included two following direct instruction and scored as 3.25.
4.2.2.3 Analysis of 13th
Item
There were 124 teachers participated in the study. 13 of the participants
gave no response or not a valid response matching with our codes to this item
meaning that whose responses could not be categorized into an instructional
strategy. The remaining 111 teachers provided at least one strategy, which we
considered as sign of taking students’ difficulty in selecting a teaching strategy.
We observed at least one instructional strategy in a responded and valid paper.
The maximum number of the instructional strategies that we observed in a paper
was two. We observed 178 instructional strategies in total distributed to our codes
which included 5 different types of instructional strategies. Table 4.27 presents
the distribution of observed instructional strategies to our codes with their
percentages.
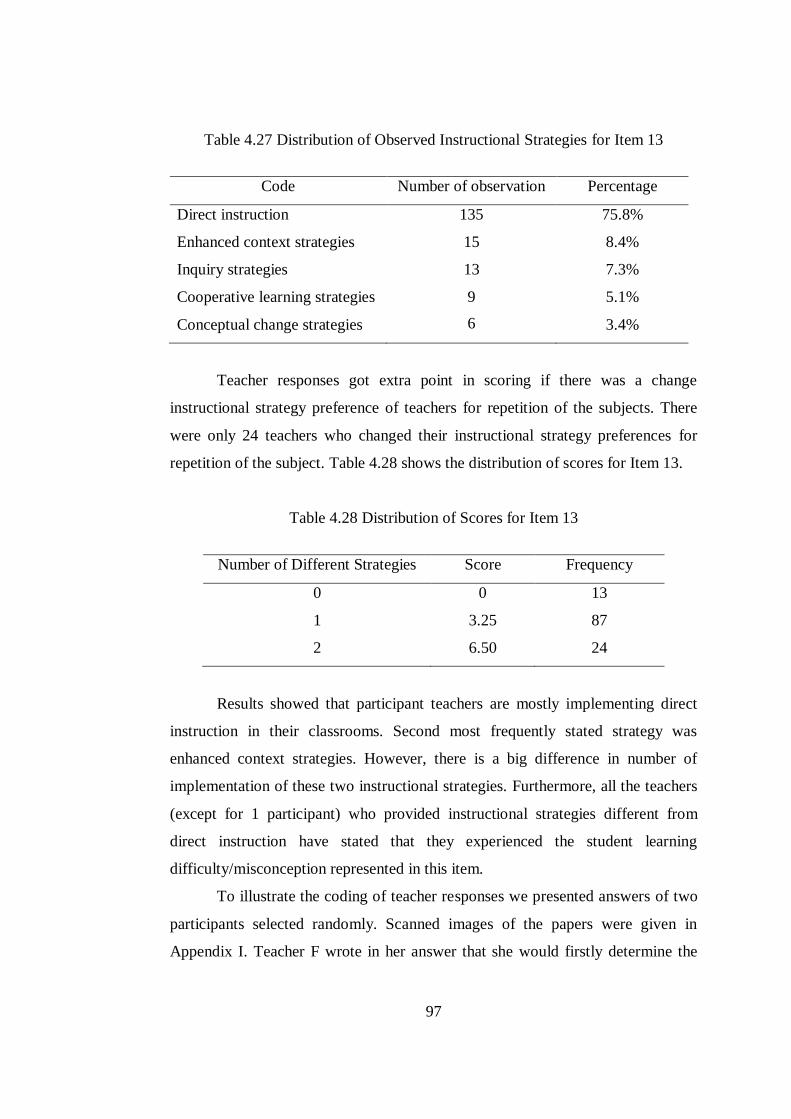
97
Table 4.27 Distribution of Observed Instructional Strategies for Item 13
Code Number of observation Percentage
Direct instruction
Enhanced context strategies
Inquiry strategies
Cooperative learning strategies
Conceptual change strategies
135
15
13
9
6
75.8%
8.4%
7.3%
5.1%
3.4%
Teacher responses got extra point in scoring if there was a change
instructional strategy preference of teachers for repetition of the subjects. There
were only 24 teachers who changed their instructional strategy preferences for
repetition of the subject. Table 4.28 shows the distribution of scores for Item 13.
Table 4.28 Distribution of Scores for Item 13
Number of Different Strategies Score Frequency
0 0 13
1 3.25 87
2 6.50 24
Results showed that participant teachers are mostly implementing direct
instruction in their classrooms. Second most frequently stated strategy was
enhanced context strategies. However, there is a big difference in number of
implementation of these two instructional strategies. Furthermore, all the teachers
(except for 1 participant) who provided instructional strategies different from
direct instruction have stated that they experienced the student learning
difficulty/misconception represented in this item.
To illustrate the coding of teacher responses we presented answers of two
participants selected randomly. Scanned images of the papers were given in
Appendix I. Teacher F wrote in her answer that she would firstly determine the
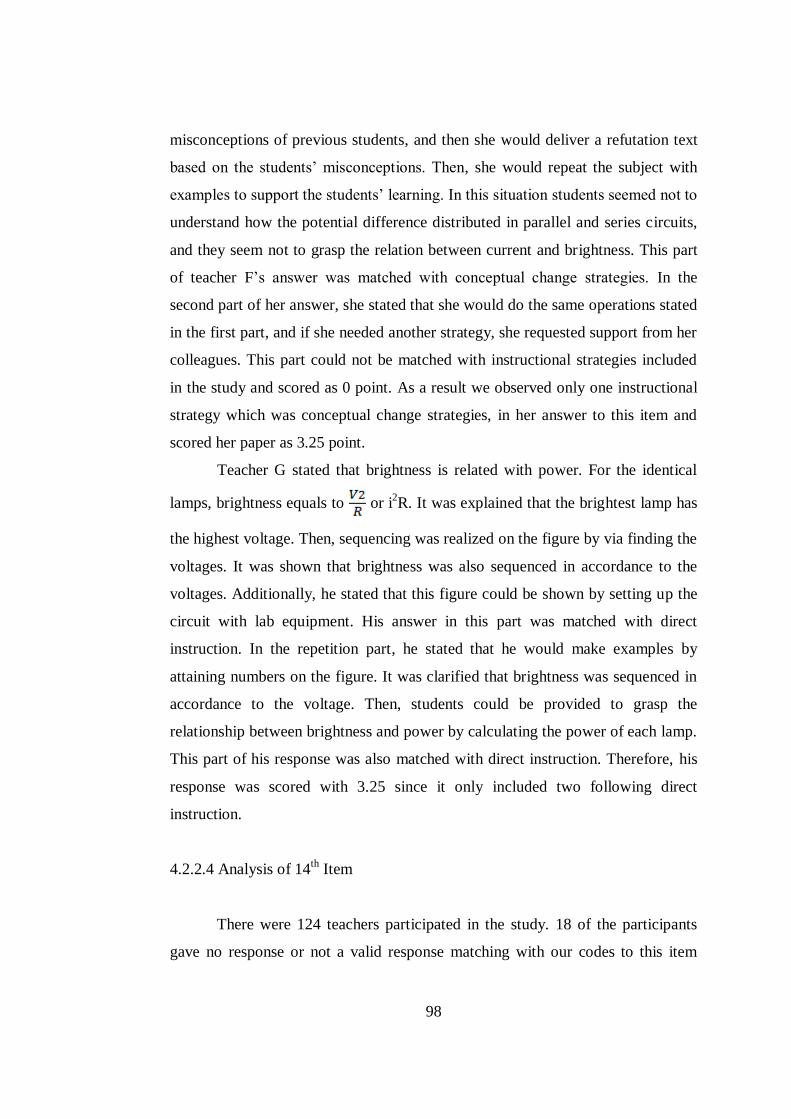
98
misconceptions of previous students, and then she would deliver a refutation text
based on the students’ misconceptions. Then, she would repeat the subject with
examples to support the students’ learning. In this situation students seemed not to
understand how the potential difference distributed in parallel and series circuits,
and they seem not to grasp the relation between current and brightness. This part
of teacher F’s answer was matched with conceptual change strategies. In the
second part of her answer, she stated that she would do the same operations stated
in the first part, and if she needed another strategy, she requested support from her
colleagues. This part could not be matched with instructional strategies included
in the study and scored as 0 point. As a result we observed only one instructional
strategy which was conceptual change strategies, in her answer to this item and
scored her paper as 3.25 point.
Teacher G stated that brightness is related with power. For the identical
lamps, brightness equals to or i2R. It was explained that the brightest lamp has
the highest voltage. Then, sequencing was realized on the figure by via finding the
voltages. It was shown that brightness was also sequenced in accordance to the
voltages. Additionally, he stated that this figure could be shown by setting up the
circuit with lab equipment. His answer in this part was matched with direct
instruction. In the repetition part, he stated that he would make examples by
attaining numbers on the figure. It was clarified that brightness was sequenced in
accordance to the voltage. Then, students could be provided to grasp the
relationship between brightness and power by calculating the power of each lamp.
This part of his response was also matched with direct instruction. Therefore, his
response was scored with 3.25 since it only included two following direct
instruction.
4.2.2.4 Analysis of 14th
Item
There were 124 teachers participated in the study. 18 of the participants
gave no response or not a valid response matching with our codes to this item
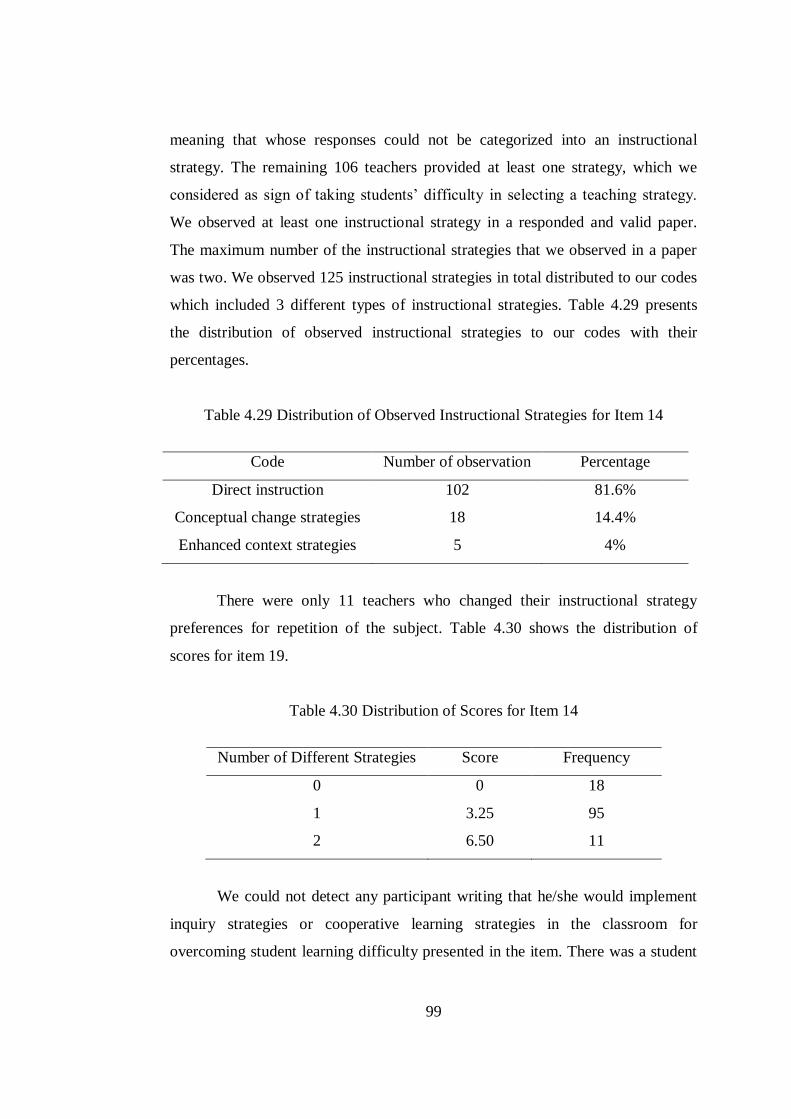
99
meaning that whose responses could not be categorized into an instructional
strategy. The remaining 106 teachers provided at least one strategy, which we
considered as sign of taking students’ difficulty in selecting a teaching strategy.
We observed at least one instructional strategy in a responded and valid paper.
The maximum number of the instructional strategies that we observed in a paper
was two. We observed 125 instructional strategies in total distributed to our codes
which included 3 different types of instructional strategies. Table 4.29 presents
the distribution of observed instructional strategies to our codes with their
percentages.
Table 4.29 Distribution of Observed Instructional Strategies for Item 14
Code Number of observation Percentage
Direct instruction
Conceptual change strategies
Enhanced context strategies
102
18
5
81.6%
14.4%
4%
There were only 11 teachers who changed their instructional strategy
preferences for repetition of the subject. Table 4.30 shows the distribution of
scores for item 19.
Table 4.30 Distribution of Scores for Item 14
Number of Different Strategies Score Frequency
0 0 18
1 3.25 95
2 6.50 11
We could not detect any participant writing that he/she would implement
inquiry strategies or cooperative learning strategies in the classroom for
overcoming student learning difficulty presented in the item. There was a student
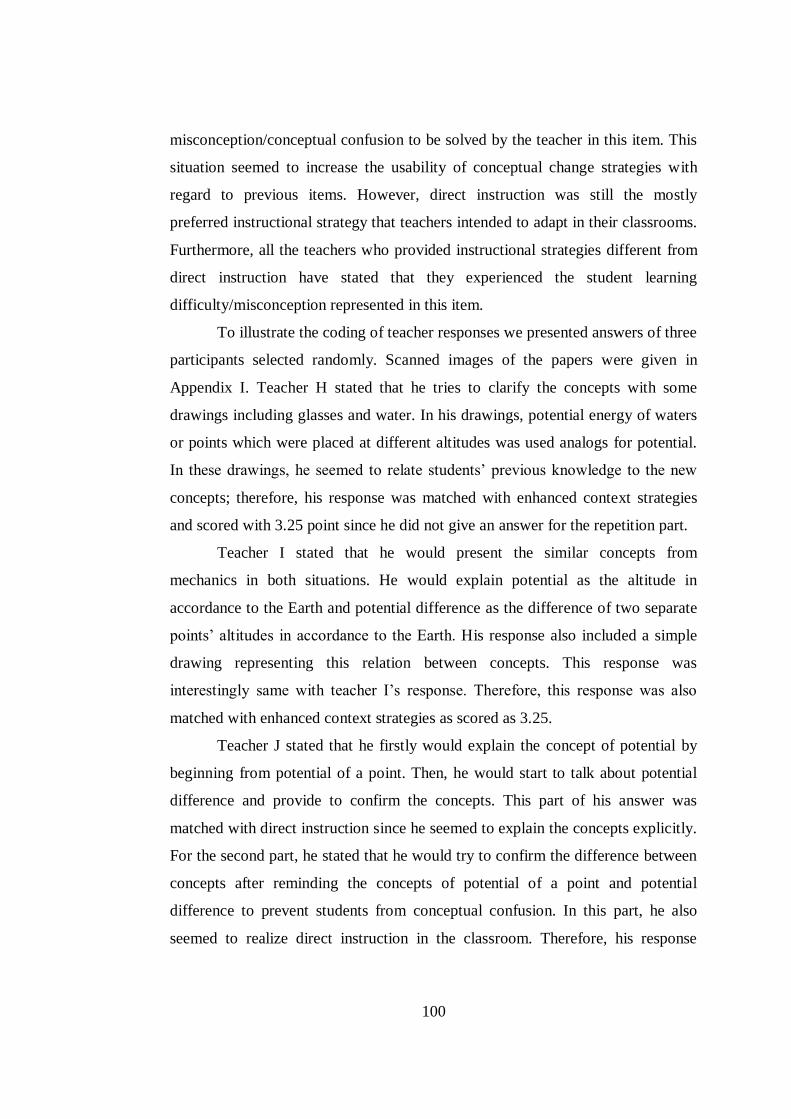
100
misconception/conceptual confusion to be solved by the teacher in this item. This
situation seemed to increase the usability of conceptual change strategies with
regard to previous items. However, direct instruction was still the mostly
preferred instructional strategy that teachers intended to adapt in their classrooms.
Furthermore, all the teachers who provided instructional strategies different from
direct instruction have stated that they experienced the student learning
difficulty/misconception represented in this item.
To illustrate the coding of teacher responses we presented answers of three
participants selected randomly. Scanned images of the papers were given in
Appendix I. Teacher H stated that he tries to clarify the concepts with some
drawings including glasses and water. In his drawings, potential energy of waters
or points which were placed at different altitudes was used analogs for potential.
In these drawings, he seemed to relate students’ previous knowledge to the new
concepts; therefore, his response was matched with enhanced context strategies
and scored with 3.25 point since he did not give an answer for the repetition part.
Teacher I stated that he would present the similar concepts from
mechanics in both situations. He would explain potential as the altitude in
accordance to the Earth and potential difference as the difference of two separate
points’ altitudes in accordance to the Earth. His response also included a simple
drawing representing this relation between concepts. This response was
interestingly same with teacher I’s response. Therefore, this response was also
matched with enhanced context strategies as scored as 3.25.
Teacher J stated that he firstly would explain the concept of potential by
beginning from potential of a point. Then, he would start to talk about potential
difference and provide to confirm the concepts. This part of his answer was
matched with direct instruction since he seemed to explain the concepts explicitly.
For the second part, he stated that he would try to confirm the difference between
concepts after reminding the concepts of potential of a point and potential
difference to prevent students from conceptual confusion. In this part, he also
seemed to realize direct instruction in the classroom. Therefore, his response
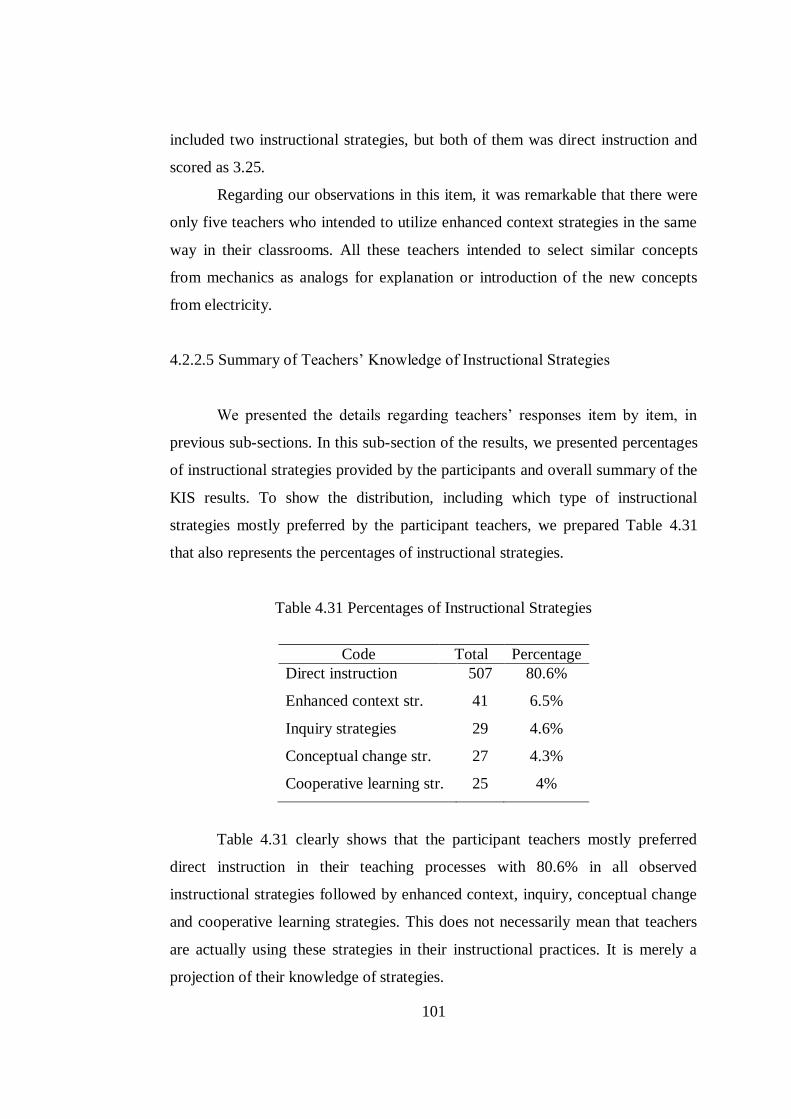
101
included two instructional strategies, but both of them was direct instruction and
scored as 3.25.
Regarding our observations in this item, it was remarkable that there were
only five teachers who intended to utilize enhanced context strategies in the same
way in their classrooms. All these teachers intended to select similar concepts
from mechanics as analogs for explanation or introduction of the new concepts
from electricity.
4.2.2.5 Summary of Teachers’ Knowledge of Instructional Strategies
We presented the details regarding teachers’ responses item by item, in
previous sub-sections. In this sub-section of the results, we presented percentages
of instructional strategies provided by the participants and overall summary of the
KIS results. To show the distribution, including which type of instructional
strategies mostly preferred by the participant teachers, we prepared Table 4.31
that also represents the percentages of instructional strategies.
Table 4.31 Percentages of Instructional Strategies
Code Total Percentage
Direct instruction
Enhanced context str.
Inquiry strategies
Conceptual change str.
Cooperative learning str.
507
41
29
27
25
80.6%
6.5%
4.6%
4.3%
4%
Table 4.31 clearly shows that the participant teachers mostly preferred
direct instruction in their teaching processes with 80.6% in all observed
instructional strategies followed by enhanced context, inquiry, conceptual change
and cooperative learning strategies. This does not necessarily mean that teachers
are actually using these strategies in their instructional practices. It is merely a
projection of their knowledge of strategies.
102
Furthermore, the participants who intended to implement instructional
strategies different from direct instruction were the ones who previously
experienced the student learning difficulties or misconceptions presented in the
items. There was only one participant which contradicts our observation who,
even though did not experience student learning difficulty or misconception,
wrote down a strategy other than direct instruction. Based on these results, it
would not be illogical to conclude that if a teacher experienced a particular
difficulty or misconception, s/he is likely to utilize strategies other than direct
instruction.
Another remarkable result of the analysis was instructional strategy
sequence in teachers’ preferences. Most of the participants intended to implement
same instructional strategy both for the first time teaching and for the repetition of
the subject represented in items. This intention was also observed between items. I
mean that if a teacher intended to implement direct instruction for the 11th
item,
this was also observed in other items of the same participant teacher.
4.3 Summary of the Results
In answering the first research problem of the study we did not only tried
to develop an instrument but also but also realized validation processes via five
additional research hypotheses. We eliminated Items 4 and 5 based on exploratory
and confirmatory factor analysis together with physics educators’ suggestions
among all other PECKI items because of issues about these items’ significance of
predictions and factor loadings. Therefore, in confirmatory structural modeling
PECKI included 13 items; 9 for KSUE and 4 for KIS. In confirmatory SEM we
focused on two different models which were proposed models. Based on the
results, we selected the proposed model I which was more appropriate to explain
the relations among the variable of the study with better fit values. And also,
proposed model I explained 67% of the variance regarding PCK which was more
than the proposed model II (61% of the variance of PCK). Confirmatory SEM
analysis showed that, teachers’ PSE level, in-service training attendance and
103
specific experiences were the significant predictors of their PCK. In addition to
them, teachers’ job satisfaction levels and years of teaching experience were not
found as significant predictors of their PCK. Therefore, this study produced
content- and construct-related evidence for the validation. However, results of the
study did not meet all the expectations that we had at the beginning of the study
regarding construct validity of the instrument.
The study included two more research problems both of which were
related to the assessment of high school physics teachers’ knowledge about
students’ pre-instructional thinking and misconceptions in electricity and teachers’
knowledge of instructional strategies related to the teaching of electricity. Results
of this study showed that high school physics teachers provided some information
regarding their students’ pre-instructional thinking and misconceptions; however,
distribution of teachers’ scores in this this dimension of the instrument presented a
normal distribution. In other words, there were many teachers whose KSUE levels
are below the average. In addition, physics teachers mostly preferred to
implement direct instruction as the instructional strategy in their teaching courses
to overcome students’ learning difficulties and misconceptions in electricity.
Furthermore, being experienced on the student learning difficulties and
misconceptions seemed effective on their selection of instructional strategies. The
participants who intended to utilize instructional strategies different from direct
instruction were the ones who previously experienced the student learning
difficulties or misconceptions presented in the items.
104
CHAPTER 5
DISCUSSIONS, CONCLUSIONS AND IMPLICATIONS
This chapter of the study presents discussions of the results, conclusions,
implications, and finally, recommendations for future research studies.
5.1 Discussions of the Results
PECKI included two dimensions, namely KSUE and KIS, for
measurement of teachers’ PCK related to teaching of electricity. In science and
technology education, other researchers also included these dimensions in their
studies regarding PCK assessment (Halim & Meerah, 2002; Lange et al., 2009;
Rohaan et al., 2009). In this regard, our PCK components are in line with what the
other researchers expected from an instrument developed for teachers’ PCK.
In validation of the instrument, we utilized exploratory and confirmatory
factor analyses followed by the confirmatory SEM analysis. Based on the PCK
literature, we proposed two different models to utilize in confirmatory SEM
analysis for establishing construct related evidence for validity. According to the
proposed model I of the study, the coefficient showing PSE’s direct effect on JS
was 0.95. That is, teachers’ PSE level has a positive and high level of prediction
on their JS level. Similar results were also obtained in the literature (Caprara et
al., 2003; Viel-Ruma et al., 2010).
Our results imply that JS is not a significant predictor of PCK. The
literature regarding JS provides evidence that employees’ JS level can positively
predict their professional knowledge levels (Van der Heijden & Brinkman, 2001).
Even though there are, to the best of our knowledge, no research studies
investigating the relation between teachers’ PCK and JS level, above evidence
105
directed us to utilize the JS level of physics teachers’ as a predictor of their PCK.
In a survey study, Azar and Henden (2003) identified JS level of primary school
teachers who were appointed out of their profession or subject area. They found
that those primary school teachers had low JS scores which were most probably a
result of deficiency in those teachers’ professional knowledge compared to those
of whom trained specifically to become primary school teachers. In our study, we
found a small effect of teachers’ JS level on their PCK but this was stemmed
mostly from PSE. In proposed model II, JS seemed to have a significant effect on
PCK. However, in that model, we did not include PSE’s indirect effect where JS
was a mediator in the relation between PSE and PCK. In the proposed model I,
when this effect was added, JS influence on PCK has become negligible. This
may because of the inadequacy in number of items in JS dimension of our
instrument.
According to the results, teachers’ PSE level has the highest direct effect
on their PCK. In the literature, there are several studies revealing the relationship
among teachers’ self-efficacy beliefs and their PCK (Khourey-Bowers & Simonis,
2004; Posnanski ,2002; Swackhamer et al., 2009). Additionally, some researchers
stated that teachers’ beliefs – including PSE – affect their PCK development
(Gess-Newsome, 1999a; Magnusson et al., 1999; Tobin & McRobbie, 1999; van
Driel et al., 2001). Based on such research studies, we investigated in our model
the existence of a relation between teachers’ PCK and PSE level. Because of the
limitations of AMOS we set out PSE as a predictor of PCK in our model.
However, if it were possible, it would have been a more logical analysis when
PCK and PSE are set in the model as correlating variables. As a result of our
analysis, we found that teachers’ PSE level has a positive and direct effect on their
PCK. That mean, the more PCK teachers have, the more they will believe in
themselves to be effective in teaching which is what one would logically expect:
If a teacher’s pedagogical ‘toolbox’ is quite rich, he/she would feel that he/she
would be successful in his/her instructional practice.
As part of the validation process, we investigated the relationship between
teachers’ years of teaching experience and PCK, which was originally thought to
106
have existed. However, as both later research studies pointed out, we did not find
a significant effect of year of teaching experience on teachers’ PCK. However,
specific experiences defined as whether the participant teachers experienced the
student learning difficulties or misconceptions, represented in PECKI items, in
their classroom context have a significant effect according to the proposed model
I. Even though earlier research on PCK implied the effect of teachers’ years of
teaching experience on teachers’ PCK (Crawford, 1999; Holt-Reynolds, 2000;
Morine-Dershimer & Kent, 1999), recent research studies stressed the importance
of teachers’ specific experiences on their PCK (Abd-El-Khalick, 2006; Park &
Oliver, 2007). It may be expected that a teacher’s specific experiences and year of
teaching experience should have a positive relation between themselves and have
the same effect on teachers’ PCK. In this study, we assumed that teachers’
specific experiences create chances for them to be reflective in/on their teaching
courses. Our expectations regarding teachers’ specific experiences were
supported; however, we found an opposite result related to teachers’ years of
teaching experience. This opposite result can rightfully be attributed to the
possibility of participants’ intention for implementing mostly direct instruction in
their classrooms. These results show that mere number of teaching experience,
without a conscious reflection on one’s actions, has no effect on one’s PCK. The
research regarding PCK in recent years is already moving it focus more towards
this view: teachers’ specific experiences rather than their years of teaching
experience is influential on the development of PCK.
Although the attendance of in-service training seminars regarding physics
teaching programs has a potential to positively predict PCK (Gess-Newsome,
1999b, Magnusson et al., 1999, Nilsson, 2008), our study surprisingly found an
opposite result; that is, teachers who attended to more in-service training seminars
had lower PCK scores compared to those who attended less seminars. This might
be due to the content of in-service training seminars the participants attended to
and also due to reluctance of the participants from the in-service training seminars
to adequately filling the PECKI forms. There are two possible explanations for the
discrepancy between our expectations and findings. First, to the best of our
107
knowledge, none of the in-service training seminars that the participants of this
study have attended focused specifically on the issues related to the two
components of the PCK this study has focused on. In this regard, it is not
reasonable to expect improvement in teachers’ PCK in KSU and KIS. However,
the transformative model of PCK suggests that an improvement of one component
of PCK results in the improvement of other components as well. In this regard,
one, albeit weak, possibility is that regardless of the content of seminars, teachers
might have developed PCK related to the teaching of electricity. Yet, no evidence
can be set forth to support this assumption. Second explanation is related to the
invaluable opportunity for researchers to study teachers in in-service training
seminars. The attendants often have been asked to participate in studies in which
they fill several questionnaires or are interviewed. Therefore, the more training
programs they attend, the more instruments they fill, which results in reluctance of
teachers towards participating in subsequent research studies. Before collecting
data from these participants, we did not consider teachers’ reluctance as a threat to
internal validity; hence, no precautions were taken for this threat. Of the two
explanations, in light of the above discussions, the second one seems more
plausible.
Second and third research problems of the study were survey problems
about what teachers know regarding their students’ learning difficulties and
misconceptions and what type of instructional strategies they implement to
overcome these learning difficulties and misconceptions in teaching of electricity.
Results showed that teachers’ knowledge about their students’ learning difficulties
and misconceptions presented a normal distribution. There were many participants
whose scores were below the average in this dimension of PCK. In addition to
this, teachers mostly preferred to implement direct instruction in their classrooms.
Deficiency in teachers’ knowledge regarding their students’ learning difficulties
and misconceptions might divert them to implement direct instruction in their
teaching courses. Because, in direct instruction, where no differentiation based on
student differences/difficulties is needed. Nor alternative methods to overcome
such difficulties or misconceptions are necessary when one is ignorant of these
108
issues. Additionally, the teachers whose knowledge is deficient regarding
students’ learning difficulties and misconceptions almost cannot be effective
teachers in their classrooms.
5.2 Conclusions
One of the main purposes of this study was to provide validity of
interpretations on teachers’ responses. We established validity of PECKI results in
two ways. Firstly, we collected experts’ opinion regarding our items’ content
validity before our two different implementations. Based on their suggestions
some of the PECKI items were revised. Therefore, we can conclude that we have
established content-related validity of PECKI results.
Secondly, we provided evidence for construct validity of PECKI items in
two steps. In the first step, we conducted an exploratory and confirmatory factor
analyses on all the 15 PECKI items, in two factors: KSUE and KIS. Exploratory
factor analysis produced three factors whose content was different from our
original intentions. However, we decided to include all the items of the instrument
based on physics educators’ views in CFA. Based on the CFA results, we had to
omit two items from PECKI because of low factor loadings and problems
regarding significance of prediction. Actually, we conducted CFA to decide which
items could be incorporated into the second step of analysis, confirmatory SEM
for construct-related validity of PECKI scores. In the second step, we conducted a
confirmatory SEM analysis on the remaining 13 items with other variables of the
study. We had two different proposed models. Based on the SEM results, we
eliminated the proposed model II because of poorer fit values and variance ratio
explained by this model. According to our proposed model I, physics teachers’
PSE level has the highest positive prediction on their PCK related to teaching of
electricity. Teachers’ specific experiences are also positively predicting their
PCK. Additionally, teachers’ JS level and years of teaching experience have no
significant effect on PCK. Contrary to the literature-based expectations,
attendance to in-service training seminars regarding physics teaching programs
109
had a negative effect on teachers’ PCK, most probably because of irrelevancy of
content of these seminars to the PCK related to the teaching of electricity and
reluctance of the participants attending the in-service training seminar. As a result,
we can conclude that some of the CFA and confirmatory SEM analysis provided
construct-related evidence for PECKI items, while others did not fulfill our
expectations, which we believe need further investigation.
In addition to the validity estimation, we calculated reliability of PECKI
results in two ways. First one was the inter-rater reliability of teachers’ scores in
11 items constructed for assessment of teachers’ KSUE. Pearson product-moment
correlation (r) was found as 0.86 in this step. The second one was the inter-rater
reliability in coding of 4 items constructed for assessment of teachers’ KIS.
Percent agreement was found as 78% in this step. As a result, we can conclude
that teachers’ scores have moderately high reliability.
Regarding the survey results we found in KSUE and KIS dimensions, we
can firstly conclude that teachers’ KSUE scores have a normal distribution that is
there are many teachers whose KSUE scores were below average. In addition to
this, qualitative analysis of KIS data showed that teachers’ mostly preferred to
implement direct instruction in their classrooms as a first choice of instructional
strategy for overcoming their students’ learning difficulties and misconceptions.
Furthermore, the participants who intended to implement instructional strategies
different from direct instruction were the ones who previously experienced the
student learning difficulties or misconceptions presented in the items.
5.3 Implications
Suggestions about implications of the results can be made based on the
following results: Firstly, this study showed that teachers’ scores in KSUE had a
normal distribution. Additionally, being experienced on a specific student learning
difficulty or misconception positively affected teachers’ PCK. On the other hand,
teachers’ years of teaching experience do not have an effect on their PCK. In this
regard, we offer that pre-service teachers should be incorporated into teaching
110
assignment courses in real classroom environments in which they can experience
examples of student learning difficulties and misconceptions.
Another cluster of suggestions can be made regarding usage of instrument
developed in our study. Turkish teacher candidates have to join public personnel
selection examination to be appointed in public schools. This exam has two
different parts: general ability and culture, and educational sciences. This exam is
not changing in accordance to the subject areas of teacher candidates. If these
types of instruments are developed for other subjects, titles and dimensions of
PCK, it will be more appropriate to utilize these instruments in selection of
teachers. Next, these types of instruments can be utilized in assessment of teacher
qualifications. Turkey Ministry of National Education has completed the
determination period of teacher qualifications for all subjects.
Finally, our study showed that high school physics teachers mostly prefer
to implement direct instruction in their teaching courses to overcome student
difficulty or misconceptions. In addition to this, teachers’ specific experiences
have a positive effect on their preferences in terms of their selection of other
strategies. Based on these findings, we offer that the professional development
programs designed for in-service teachers and the courses designed for pre-service
teachers should inform them regarding different type of instructional strategies
and how to implement these strategies.
5.4 Recommendations for Future Research Studies
Our recommendations for future research studies were presented as below:
1) PECKI was administered to 124 high school physics teachers in this study.
The number of participants should be increased in future studies.
2) The second objective of the instrument consisted of only one item whose
total maximum score was 6 while it was 2 for the other items in first
dimension of PCK. For the following researchers we suggest to increase
the number of items for this objective.
111
3) PECKI items focused on electrostatic, electric fields, circuits, electric
potential, and electric energy and power as the physics concepts related to
electricity. However, there are still other concepts left out in this study. In
this regard, we firstly suggest that other concepts should also be focused in
measurement of PCK. Secondly, other domains in physics such as waves,
kinematics, etc… should also be investigated. Finally, we suggest that
instruments developed for the measurement of teachers’ PCK should
specify on one concept rather than many concepts. In so doing,
interpretations will be much easier for the researchers. In this way,
measurement studies can give a more comprehensive picture of physics
teachers’ PCK.
4) We developed a survey instrument including open-ended items in the
study. But, however difficult it may be, we suggest developing a test that
consists solely of selection type items, particularly multiple-choice items.
This type of items may contribute positively to the reliability estimation of
scores, reaching to high number of participants in these studies and
completing the evaluation procedures in a short time duration.
5) Caution must be taken when studying with participants who are attending
in-service training seminars, as they seem to be reluctant to participate in
research studies.
112
REFERENCES
Abd-El-Khalick, F. (2006). Preservice and experienced biology teachers' global
and specific subject matter structures: Implications for conceptions of
pedagogical content knowledge. Eurasia Journal of Mathematics,
Science & Technology Education, 2(1), 1-29.
Abell, S. K. (2008). Twenty years later: Does pedagogical content knowledge
remain a useful idea? International Journal of Science Education, 30(10),
1405-1416.
Abell, S., K. (2007). Research on science teacher knowledge. In Abell, S. K., &
Lederman, N. G., (Eds.), Handbook of research on science education
(pp. 1105-1149). London: Lawrence Erlbaum Associates Publishers.
Appleton, K., & Kindth, I. (1999). How do beginning elementary teachers cope
with science: development of pedagogical content knowledge in science.
Paper presented at the annual meeting of the National Association for
Research in Science Teaching, Boston.
Ausubel, D. P. (1968). Educational psychology: A cognitive view. New York:
Holt, Rinehart & Winston.
Azar, A., & Çepni, S. (1999). Fizik öğretmenlerinin kullandıkları öğretim
etkinliklerinin mesleki deneyime göre değişimi. Hacettepe Üniversitesi
Eğitim Fakültesi Dergisi, 16-17, 24-33.
Azar, A., & Henden, R. (2003). Alan dışından atanmanın iş doyumuna etkileri:
Sınıf öğretmenliği örneği. Theory & Practice, 3(2), 323-349.
Baxter, J. A., & Lederman, N. G. (1999). Assessment and measurement of
pedagogical content knowledge. In J. Gess-Newsome & N. G. Lederman
(Eds.), Examining pedagogical content knowledge (pp.147-161).
Dordrecht, The Netherlands: Kluwer.
Bandura, A. (1997). Self-efficacy: The exercise of control. New York: W.H.
Freeman and Company.
113
Bandura, A. (1982). Self-efficacy mechanism in human agency. American
Psychologist, 37(2), 122-147.
Bandura, A. (1977). Self-efficacy: Toward a unifying theory of behavioral
change. Psychological Review, 84(2), 191-215.
Bentler, P. M. (2005). EQS 6 Structural equations program manual. Encino, CA:
Multivariate Software.
Berry, A., Loughran, J., & van Driel, J. H. (2008). Revisiting the roots of
pedagogical content knowledge. International Journal of Science
Education, 30(10), 1271-1279.
Boomsma, A. (2000). Reporting Analyses of Covariance Structures. Structural
Equation Modeling: A Multidisciplinary Journal, 7(3), 461–483.
Browne, M. W., & Cudeck, R. (1993). Alternative ways of assessing model fit. In
K. A. Bollen & J. S. Long (Eds.), Testing structural equation models
(136–162). Newbury Park, CA: Sage.
Byrne, B. M. 2010. Structural equation modeling with AMOS. Basic concepts,
applications and programming. Taylor & Francis Group: New York.
Canbazoğlu, S. (2008). Fen bilgisi öğretmen adaylarının maddenin tanecikli yapısı
ünitesine ilişkin pedagojik alan bilgilerinin değerlendirilmesi. Yüksek
Lisans Tezi, Gazi Üniversitesi.
Cantrell, P., Young, S., & Moore, A. (2003). Factors affecting science teaching
efficacy of preservice elementary teachers. Journal of Science Teacher
Education, 14(3), 177-192.
Caprara, G. V., Barbaranelli, C., Borgogni, L., & Steca, P. (2003). Efficacy
beliefs as determinants of teachers’ job satisfaction. Journal of
Educational Psychology, 95(4), 821-832.
Carlsen, W. S. (1999). Domains of teacher knowledge. In J. Gess-Newsome & N.
G. Lederman (Eds.), Examining pedagogical content knowledge (pp.133-
144). Dordrecht, The Netherlands: Kluwer.
Carlson, R. E. (1990). Assessing teachers' pedagogical content knowledge: Item
development issues. Journal of Personnel Evaluation in Education, 4,
157-173.
114
Cochran, K. F., DeRuiter, J. A., & King, R. A. (1993). Pedagogical content
knowing: An integrative model for teacher preparation. Journal of
Teacher Education, 44(4), 263-272.
Coffman, W. E. (1971). Essay examinations. In R. L. Thorndike (Eds.),
Educational measurement (pp.271-302). Washington, D. C: American
Council on Education.
Crawford, B. A. (1999). Is it realistic to expect a preservice teacher to create an
inquiry-based classroom? Journal of Science Teacher Education, 10(3),
175-194.
Davis, E. A. (2003). Knowledge integration in science teaching: Analysing
teachers' knowledge development. Research in Science Education, 34,
21-53.
Dewey, J. (1902). The child and the curriculum. In Boydston, J. A. (Eds.), The
middle works (pp. 273-291). Southern Illinois University Press.
Elbaz, F. (1983). Teacher thinking: A study of practical knowledge. London:
Croom Helm.
Fabiano, L. (1999). Measuring teacher qualifications. Working Paper No. 1999-
04. U.S. Department of Education. National Center for Education
Statistics. Washington, D.C.: 1999
Fraenkel, J. R., & Wallen, N. E. (1996). How to design and evaluate research in
education. McGraw-Hill, Inc.
Fraser, B. J. (2003). Science learning environments: Assessment, effects and
determinants. In Fraser, B. J., & Tobin, K. G. (Eds.), International
handbook of science education (pp. 527-564). London: Kluwer
Academic Publishers.
Friedrichsen, P. J. (2008). A conversation with Sandra Abell: Science teacher
learning. Eurasia Journal of Mathematics, Science & Technology
Education, 4(1), 71-79.
Fuming, X., & Jiliang, S. (2008). Research on job satisfaction of elementary and
high school teachers and strategies to increase job satisfaction. Chinese
Education and Society, 40(5), 86-96.
115
Gess-Newsome, J. (1999a). Secondary teachers’ knowledge and beliefs about
subject matter and their impact on instruction. In J. Gess-Newsome & N.
G. Lederman (Eds.), Examining pedagogical content knowledge (pp.51-
94). Dordrecht, The Netherlands: Kluwer.
Gess-Newsome, J. (1999b). Pedagogical content knowledge: An introduction and
orientation. In J. Gess-Newsome & N. G. Lederman (Eds.), Examining
pedagogical content knowledge (pp.3-17). Dordrecht, The Netherlands:
Kluwer.
Gibson, S., & Dembo, M., H. (1984). Teacher efficacy: A construct validation.
Journal of Educational Psychology, 76(4), 569-582.
Grayson, D. J. (2004). Concept substitution: A teaching strategy for helping
students disentangle related physics concepts. Am. J. Phys., 72(8), 1126-
1133.
Grossman, P. L. (1990). The making of a teacher: Teacher knowledge and teacher
education. London: Teachers College Press.
Halim, L., & Meerah, S. M. (2002). Science trainee teachers' pedagogical content
knowledge and its influence on physics teaching. Research in Science &
Technological Education, 20(2), 215-225.
Heck, R. H. (2009). Teacher effectiveness and student achievement: Investigating
a multilevel cross-classified model. Journal of Educational
Administration, 47(2), 227-249.
Henze, I., van Driel, J. H., & Verloop, N. (2008). Development of experienced
science teachers' pedagogical content knowledge of models of the solar
system and the universe. International Journal of Science Education,
30(10), 1321-1342.
Hestenes, D., Wells, M., & Swackhamer, G. (1992). Force concept inventory. The
Physics Teacher, 30, 141-158.
Hill, H. C., Ball, D. L., & Schilling, S. G. (2008). Unpacking pedagogical content
knowledge: Conceptualizing and measuring teachers' topic-specific
knowledge of students. Journal for Research in Mathematics Education,
39(4), 372-400.
116
Hill, H. C., Rowan, B., & Ball, D. L. (2005). Effects of teachers' mathematical
knowledge for teaching on student achievement. American Educational
Research Journal, 42(2), 371-406.
Hill, H. C., Schilling, S. G., & Ball, D. L. (2004). Developing measures of
teachers' mathematics knowledge for teaching. The Elementary School
Journal, 105(1), 11-30.
Holt-Reynolds, D. (2000). What does the teacher do? Constructivist pedagogies
and prospective teachers' beliefs about the role of a teacher. Teaching
and Teacher Education, 16, 21-32.
Hulin, C. L. and Judge, T. A. (2003). Job attitudes. In I.B. Weiner (Eds..),
Handbook of psychology (pp.255–276). New Jersey: John Wiley & Sons,
Inc.
Johnson, B. (2001). Toward a new classification of nonexperimental quantitative
research. Educational Researcher, 30(2), 3-13.
Kagan, D. M. (1990). Ways of evaluating teacher cognition: Inferences
concerning the Goldilocks Principle. Review of Educational Research,
60(3), 419-469.
Khourey-Bowers, C., & Simonis, D. G. (2004). Longitudinal study of middle
grades chemistry professional development: Enhancement of personal
science teaching self-efficacy and outcome expectancy. Journal of
Science Teacher Education, 15(3), 175-195.
Kinach, B. M. (2002). A cognitive strategy for developing pedagogical content
knowledge in the secondary mathematics methods course: toward a
model of effective practice. Teaching and Teacher Education, 18, 51-71.
Klassen, R. M., Usher, E. L., & Bong, M. (2010). Teachers’ collective efficacy,
job satisfaction, and job stress in cross-cultural context. The Journal of
Experimental Education, 78, 464-486.
Krauss, S., Brunner, M., Kunter, M., Baumert, J., Blum, W., Neubrand, M., et al.
(2008). Pedagogical content knowledge and content knowledge of
secondary mathematics teachers. Journal of Educational Psychology,
100(3), 716-725.
117
Kromrey, J. D., & Renfrow, D. D. (1991). Using multiple-choice examination
items to measure teachers' content-specific pedagogical knowledge.
Paper presented at the annual meeting of the Eastern Educational
Research Association, Boston.
Lange, K., Kleickmann, T., & Möller, K. (2009). Measuring primary school
teachers' pedagogical content knowledge in science education with open-
ended and multiple-choice items. Paper presented at the annual meeting
of the European Science Education Research Association, İstanbul.
Lederman, N. G., & Gess-Newsome, J. (1999). Reconceptualizing secondary
science teacher education. In J. Gess-Newsome & N. G. Lederman
(Eds.), Examining pedagogical content knowledge (pp.199-213).
Dordrecht, The Netherlands: Kluwer.
Lee, E., & Luft, J. A. (2008). Experienced secondary science teachers'
representations of pedagogical content knowledge. International Journal
of Science Education, 30(10), 1343-1363.
Lin, S. S. J., & Tsai, C. C. (1999). Teaching efficacy along the development of
teaching expertise among science and math teachers in Taiwan. Paper
presented at the annual meeting of the National Association for Research
in Science Teaching, Boston.
Linney, J. A., & Seidman, E. (1989). The future of schooling. American
Psychologist, 44(2), 336-340.
Loughran, J., Milroy, P., Berry, A., Gunstone, R., & Mulhall, P. (2001).
Documenting science teachers' pedagogical content knowledge through
PaP-eRs. Research in Science Education, 31, 289-307.
Loughran, J., Mulhall, P., & Berry, A. (2004). In search of pedagogical content
knowledge in science: Developing ways of articulating and documenting
professional practice. Journal for Research in Science Teaching, 41(4),
370-391.
Loughran, J., Mulhall, P., & Berry, A. (2008). Exploring pedagogical content
knowledge in science teacher education. International Journal of Science
Education, 30(10), 1301-1320.
118
Magnusson, S., Krajcik, J., & Borko, H. (1999). Nature, sources, and development
of pedagogical content knowledge for science teaching. In J. Gess-
Newsome & N. G. Lederman (Eds.), Examining pedagogical content
knowledge (pp.95-132). Dordrecht, The Netherlands: Kluwer.
Mahmood, A., Nudrat, S., Asdaque, M. M., Nawaz, A., & Haider, N. (2011). Job
satisfaction of high school teachers: A comparative analysis of gender,
urban and rural schools. Asian Social Science, 7(8), 203-208.
Manizade, A. (2006). Designing measures for assessing teachers' pedagogical
content knowledge of geometry and measurement at the middle school
level. Doctoral Dissertation, Virginia University. UMI Number:
3235090.
Mason, C. L. (1999). The triad approach: a consensus for science teaching and
learning. In J. Gess-Newsome & N. G. Lederman (Eds.), Examining
pedagogical content knowledge (pp.277-292). Dordrecht, The
Netherlands: Kluwer.
McDermott, L. C. (1991). Millikan Lecture 1990: What we teach and what is
learned-Closing the gap. American Journal of Physics, 59(4), 301-315.
MEB. (2008). Öğretmen yeterlikleri. Öğretmenlik mesleği genel ve özel alan
yeterlikleri. Ankara: Devlet Kitapları Müdürlüğü.
Miller, M. D., Linn, R. L. & Gronlund, N. E. (2008). Measurement and
assessment in teaching. Prentice Hall.
Morine-Dershimer, G., & Kent, T. (1999). The complex nature and sources of
teachers' pedagogical content knowledge. In J. Gess-Newsome & N. G.
Lederman (Eds.), Examining pedagogical content knowledge (pp.21-50).
Dordrecht, The Netherlands: Kluwer.
Mulhall, P., Berry, A., & Loughran, J. (2003). Frameworks for representing
science teachers' pedagogical content knowledge. Asia-Pacific Forum on
Science Learning and Teaching, 4(2), 1-25.
Mulholland, J., & Wallace, J. (2001). Teacher induction and elementary science
teaching: Enhancing self-efficacy. Teaching and Teacher Education, 17,
243-261.
119
NCATE. (2002). Professional standards for the accreditation of schools, colleges,
and departments of education. Washington, DC: Author. Retrieved
March 14, 2012 from
http://www.ncate.org/Standards/NCATEUnitStandards/UnitStandardsinE
ffect2008/tabid/476/Default.aspx#stnd1
Neuendorf, K. A. (2002). The content analysis guidebook. London, New Delhi:
Sage Publications.
Niess, M. L., & Sholz, J. M. (1999). Incorporating subject matter specific teaching
strategies into secondary science teacher preparation. In J. Gess-
Newsome & N. G. Lederman (Eds.), Examining pedagogical content
knowledge (pp.257-276). Dordrecht, The Netherlands: Kluwer.
Nilsson, P. 2008. Teaching for understanding: The complex nature of pedagogical
content knowledge. International Journal of Science Education, 30(10),
1281-1299.
Palmer, D., H. (2001). Factors contributing to attitude exchange amongst
preservice elementary teachers. Science Teacher Education, 86, 122-138.
Park, S., & Oliver, J. S. (2008). Revisiting the conceptualisation of pedagogical
content knowledge (PCK): PCK as a conceptual tool to understand
teachers as professionals. Research in Science Education, 38(3), 261-
284.
Pajares, F. (2002). Gender and perceived self-efficacy in self-regulated learning.
Theory into Practice, 41(2), 116-125.
Pajares, M. F. (1992). Teachers' beliefs and educational research: Cleaning up a
messy construct. Review of Educational Research, 62(3), 307-332.
Perkins, D. N., & Simmons, R. (1988). Patterns of misunderstanding: An
integrative model for science, math, and programming. Review of
Educational Research, 58(3), 303-326.
Peşman, H. (2005). Development of a three-tier test to assess ninth grade
students’ misconceptions about simple electric circuits. Unpublished
doctoral dissertation, Middle East Technical University, Ankara.
120
Posnaski, T. J. (2002). Professional development programs for elementary science
teachers: An analysis of teacher self-efficacy beliefs and a professional
development model. Journal of Science Teacher Education, 13, 189–230.
Riggs, I., & Enochs, L. (1990). Toward the development of an elementary
teacher's science teaching efficacy belief instrument. Science Education,
74, 625-638.
Rohaan, E. J., Taconis, R., & Jochems, W. M. G. (2009). Measuring teachers'
pedagogical content knowledge in primary technology education.
Research in Science & Technological Education, 27(3), 327-338.
Rollnick, M., Bennett, J., Rhemtula, M., Dharsey, N., & Ndlovu, T. (2008). The
place of subject matter knowledge in pedagogical knowledge: A case
study of South African teachers teaching the amount of substance and
chemical equilibrium. International Journal of Science Education,
30(10), 1365-1387.
Rubeck, M. L., & Enochs, L. G. (1991). A path analytic model of variables that
influence science and chemistry teaching self-efficacy and outcome
expectancy in middle school science teachers. Paper presented at the
annual meeting of the National Association for Research in Science
Teaching, Lake Geneva, WI.
Schroeder, C., M., Scott, T., P., Tolson, H., Huang, T.-Y., & Lee, Y.-H. (2007). A
meta-analysis of national research: Effects of teaching strategies on
student achievement in science in the United States, Journal of Research
in Science Teaching, 44(10), 1436-1460.
Sencar, S., & Eryilmaz, A. (2004). Factors mediating the effect of gender on
ninth-grade Turkish students' misconceptions concerning electric circuits.
Journal of Research in Science Teaching, 41(6), 603-616.
Shulman, L. S., (1987). Knowledge and teaching: foundations of the new reform,
Harvard Educational Review, 57(1).
Shulman, L. S. (1986). Those who understand: Knowledge growth in teaching.
Educational Researcher, 15(2), 4-14.
121
Stanton, J. M., Sinar, E. F., Balzer, W. K., Julian, A. L., Thoresen, P., et al.
(2001). Development of a compact measure of job satisfaction: The
abridged job descriptive index. Educational and Psychological
Measurement, 61(6), 1104-1122.
Swackhamer, L. E., Koellner, K., Basile, C., & Kimrough, D. (2009). Increasing
the self-efficacy of in-service teachers through content knowledge.
Teaching Education Quarterly, 36(2), 63-79.
Tamir, P. (1988). Subject matter and related pedagogical knowledge in teacher
education, Teaching & Teacher Education, 4, 99-110.
Tobin, K., & McRobbie, C. (1999). Pedagogical content knowledge and co-
participation in science classrooms. In J. Gess-Newsome & N. G.
Lederman (Eds.), Examining pedagogical content knowledge (pp.215-
234). Dordrecht, The Netherlands: Kluwer.
Tschannen-Moran, M., Woolfolk Hoy, A., & Hoy, W. K. (1998). Teacher
efficacy: Its meaning and measure. Review of Educational Research,
68(2), 202-248.
Turner-Bisset, R. (1999). The knowledge bases of the expert teacher. British
Educational Research Journal, 25(1), 39-55.
Tutkun, Ö. F., & Aksoyalp, Y. (2010). 21. yüzyılda öğretmen yetiştirme eğitim
programının boyutları. Selçuk Üniversitesi Sosyal Bilimler Enstitüsü
Dergisi, 24, 361-370.
Uşak, M. (2005). Fen bilgisi öğretmen adaylarının çiçekli bitkiler konusundaki
pedagojik alan bilgileri. Doktora Tezi, Gazi Üniversitesi.
Van der Heijden, B. I. J. M, & Brinkman, J. G. (2001). Stimulating lifelong
professional growth by guiding job characteristics. Human Resource
Development International, 4(2), 173-198.
van der Valk, A. E., & Broekman, H. (1999). The lesson preparation method: a
way of investigating pre-service teachers' pedagogical content
knowledge. European Journal of Teacher Education, 22(1), 11-22.
122
Vanderstoep, W. V., & Johnston, D. D. (2009). Research methods for everyday
life : Blending qualitative and quantitative approaches. John Wiley &
Sons, Inc.
van Driel, J. H., Beijaard, D., & Verloop, N. (2001). Professional development
and reform in science education: The role of teachers' practical
knowledge. Journal for Research in Science Teaching, 38(2), 137-158.
van Driel, J. H., de Jong, O., & Verloop, N. (2002). The development of
preservice chemistry teachers' pedagogical content knowledge. Science
Teacher Education, 86, 572-590.
van Driel, J. H., Verloop, N., & de Vos, W. (1998). Developing science teachers'
pedagogical content knowledge. Journal of Research in Science
Teaching, 35(6), 673-695.
Veal, W. R., & MaKinster, J. G. (1999). Pedagogical Content Knowledge
Taxonomies. Electronic Journal of Science Education, 3(4).
Veal, W. R., Tippins, D. J., & Bell, J. (1999). The evaluation of pedagogical
content knowledge in prospective secondary physics teachers. Research
Report on ERIC (443719).
Viel-Ruma, K., Houchins, D., Jolivette, K., & Benson, G. (2010). Efficacy beliefs
of special educators: The relationship among collective efficacy, teacher
self-efficacy and job satisfaction. Teacher Education and Special
Education, 33(3), 225-233.
Yoon, S., Pedretti, E., Bencze, L., Hewitt, J., Perris, K., & Oostveen, R. V.
(2006). Exploring the use of cases and case methods in influencing
elementary preservice science teachers’ self-efficacy beliefs. Journal of
Science Teacher Education, 17, 15-35.
Yumuşak, A. (1980). Fen bilgisi öğretmen adaylarının ısı-sıcaklık, mekanik ve
elektrik konularındaki kavram yanılgılarının araştırılması. Milli Eğitim
Dergisi, 180, 123-132.
West, S. G., Finch, J. F., & Curran, P. J. (1995). Structural equation models with
nonnormal variables: Problems and remedies. In R. H. Hoyle (Ed.),
123
Structural equation modeling: Concepts, issues, and applications (pp.
56–75). Thousand Oaks, CA: Sage.
Wilson, S. M., Shulman, L. S., & Richert, A. E. (1987). '150 different ways' of
knowing: Representations of knowledge in teaching. In Calderhead, J.,
(Eds.), ‘Exploring Teachers’ Thinking, London: Cassell.
Zembal-Saul, C., Starr, M. L., & Krajcik, J. S. (1999). Constructing a framework
for elementary science teaching using pedagogical content knowledge. In
J. Gess-Newsome & N. G. Lederman (Eds.), Examining pedagogical
content knowledge (pp.237-256). Dordrecht, The Netherlands: Kluwer.

124
APPENDIX A
INSTRUMENT OF FIRST IMPLEMENTATION
ELEKTRİK KONUSUNA YÖNELİK PEDAGOJİK ALAN BİLGİSİNİ
ÖLÇME TESTİ GELİŞTİRME ÇALIŞMALARI
Lütfen teste başlamadan önce yukarıdaki kutucuğu doldurunuz.
Değerli öğretmenim;
Elinizdeki ankete vereceğiniz cevaplar doğrultusunda fizik öğretmenlerimizin elektrik konusuna yönelik
pedagojik alan bilgilerini ölçmek amacında olan bir test oluşturulacaktır. Anketten alacağımız verileri
kesinlikle sizi değerlendirmek amacı ile kullanmayacağız. Vereceğiniz cevaplar testin geliştirilmesi
sürecinde önemli katkılarda bulunacaktır. Bu süreçte size ait hiçbir kişisel bilgiye ihtiyaç
duyulmamaktadır. Sorulara anlaşılır şekilde kısaca cevap vermeniz yeterlidir. Lütfen her soruya cevap
vermeye gayret ediniz.
TEŞEKKÜR EDERİM
Eralp Bahçivan
Doktora Öğrencisi
OFMAE-Orta Doğu Teknik Üniversitesi
Cinsiyetiniz: Bay Bayan
Öğretmenlik Deneyiminiz: _____ yıl
Şu Anda Görev Yaptığınız
Okul Türü: _____________________________________
İl: ____________________________________________
Mezun Olduğunuz Bölüm: Fizik
Fizik Öğretmenliği
Diğer (Bölüm adını belirtiniz …………………….)
Dersine Girdiğiniz Sınıflar : 9. Sınıf 10. Sınıf 11. Sınıf 12. Sınıf
Daha önce “Fizik Dersi Öğretim Programları” ile ilgili hizmet içi eğitim kurslarına
katıldınız mı? EVET HAYIR
Cevabınız “Evet” ise Katılmış Olduğunuz Hizmet İçi Eğitim Kurslarının;
İlk
Katıldığım
Kursun
İkinci
Katıldığım
Kursun
Üçüncü
Katıldığım
Kursun
Dördüncü
Katıldığım
Kursun
Süresi
Yeri
125
1) a) Elektrik konusu kapsamında öğrencilerinizde sıklıkla karşılaştığınız
kavram yanılgılarına iki örnek veriniz?
b) Sizce öğrencilerinizin bu kavram yanılgılarına sahip olmalarının
sebepleri nelerdir?
c) Bu kavram yanılgılarından kurtulma konusunda onlara nasıl yardımcı
oluyorsunuz? Kısaca öğretim dizaynınızın içeriğinden ve aşamalarından
bahsediniz. Varsa, kullanacağınız çizim ve gösterimlerinizden örnekler
veriniz.
1. Örnek 2. Örnek

126
2) a) Öğrencilerinizin çözmekte zorlanacağını tahmin ettiğiniz elektrik
konusu ile ilgili bir soru oluşturabilir misiniz?
b) Sizce öğrencileriniz bu soruyu çözmekte neden zorlanıyorlar?
c) Bu ve benzer soruları kolaylıkla çözebilmeleri için onlara nasıl
yardımcı olduğunuzu detaylı bir şekilde anlatınız. Varsa, kullanacağınız
çizim ve gösterimlerinizden örnekler veriniz.

127
3) a) Öğrencilerinizin elektrik konusu kapsamında yer alan ve algılamakta
zorlandıkları gündelik yaşamda karşılaştığımız olaylara bir örnek
veriniz.
b) Sizce öğrencileriniz bu olayı algılamada neden zorlanıyorlar?
c) Bu zorluğu aşmalarında, öğrencilerinize nasıl yardımcı olduğunuzu
detaylı bir şekilde anlatınız. Varsa, kullanacağınız çizim ve
gösterimlerinizden örnekler veriniz.

128
APPENDIX B
INSTRUMENT OF SECOND IMPLEMENTATION
ELEKTRİK KONUSUNA YÖNELİK PEDAGOJİK ALAN BİLGİSİNİ
ÖLÇME TESTİ GELİŞTİRME ÇALIŞMALARI
Lütfen teste başlamadan önce yukarıdaki kutucuğu doldurunuz. Değerli öğretmenim;
Elinizdeki ankete vereceğiniz cevaplar doğrultusunda fizik öğretmenlerimizin elektrik konusuna yönelik pedagojik alan bilgilerini ölçmek amacında olan bir test oluşturulacaktır. Anketten alacağımız verileri kesinlikle sizi değerlendirmek amacı ile kullanmayacağız. Vereceğiniz cevaplar testin geliştirilmesi sürecinde önemli katkılarda bulunacaktır. Bu süreçte size ait hiçbir kişisel bilgiye ihtiyaç
duyulmamaktadır. Sorulara anlaşılır şekilde kısaca cevap vermeniz yeterlidir. Lütfen her soruya cevap vermeye gayret ediniz.
TEŞEKKÜR EDERİM
Eralp Bahçivan
Doktora Öğrencisi
OFMAE-Orta Doğu Teknik Üniversitesi
Cinsiyetiniz: Bay Bayan
Öğretmenlik Deneyiminiz: _____ yıl
Şu Anda Görev Yaptığınız
Okul Türü: _____________________________________
İl: ____________________________________________
Mezun Olduğunuz Bölüm: Fizik
Fizik Öğretmenliği
Diğer (Bölüm adını belirtiniz …………………….)
Dersine Girdiğiniz Sınıflar : 9. Sınıf 10. Sınıf 11. Sınıf 12. Sınıf
Daha önce “Fizik Dersi Öğretim Programları” ile ilgili hizmet içi eğitim kurslarına
katıldınız mı? EVET HAYIR
Cevabınız “Evet” ise Katılmış Olduğunuz Hizmet İçi Eğitim Kurslarının;
İlk
Katıldığım
Kursun
İkinci
Katıldığım
Kursun
Üçüncü
Katıldığım
Kursun
Dördüncü
Katıldığım
Kursun
Süresi
Yeri
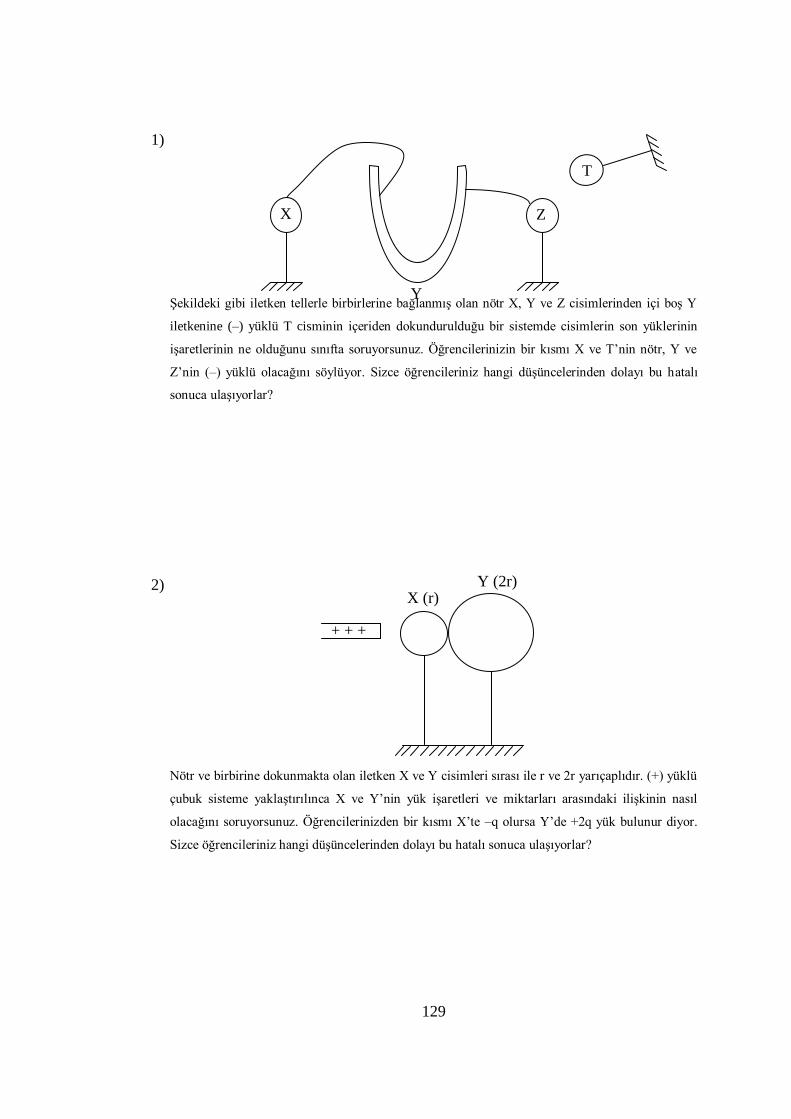
129
1)
Şekildeki gibi iletken tellerle birbirlerine bağlanmış olan nötr X, Y ve Z cisimlerinden içi boş Y
iletkenine (–) yüklü T cisminin içeriden dokundurulduğu bir sistemde cisimlerin son yüklerinin
işaretlerinin ne olduğunu sınıfta soruyorsunuz. Öğrencilerinizin bir kısmı X ve T’nin nötr, Y ve
Z’nin (–) yüklü olacağını söylüyor. Sizce öğrencileriniz hangi düşüncelerinden dolayı bu hatalı
sonuca ulaşıyorlar?
2)
Nötr ve birbirine dokunmakta olan iletken X ve Y cisimleri sırası ile r ve 2r yarıçaplıdır. (+) yüklü
çubuk sisteme yaklaştırılınca X ve Y’nin yük işaretleri ve miktarları arasındaki ilişkinin nasıl
olacağını soruyorsunuz. Öğrencilerinizden bir kısmı X’te –q olursa Y’de +2q yük bulunur diyor.
Sizce öğrencileriniz hangi düşüncelerinden dolayı bu hatalı sonuca ulaşıyorlar?
Z X
Y
T
+ + +
X (r) Y (2r)
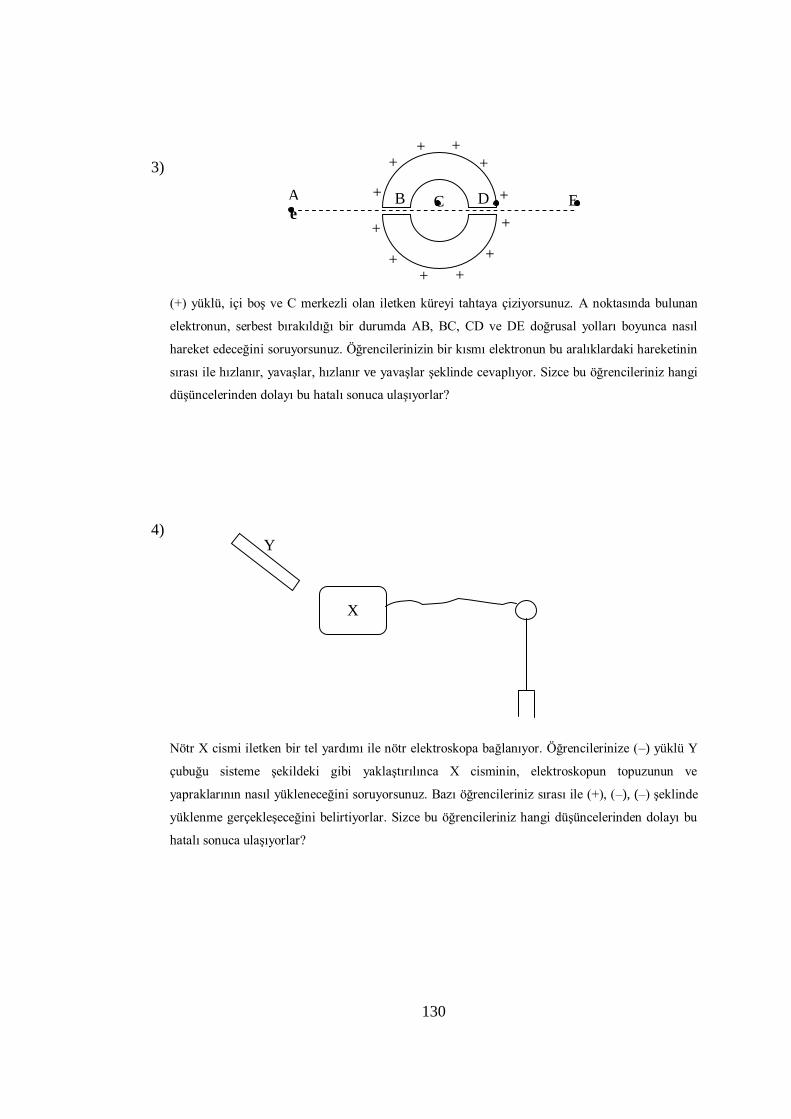
130
B E D C A
e
3)
(+) yüklü, içi boş ve C merkezli olan iletken küreyi tahtaya çiziyorsunuz. A noktasında bulunan
elektronun, serbest bırakıldığı bir durumda AB, BC, CD ve DE doğrusal yolları boyunca nasıl
hareket edeceğini soruyorsunuz. Öğrencilerinizin bir kısmı elektronun bu aralıklardaki hareketinin
sırası ile hızlanır, yavaşlar, hızlanır ve yavaşlar şeklinde cevaplıyor. Sizce bu öğrencileriniz hangi
düşüncelerinden dolayı bu hatalı sonuca ulaşıyorlar?
4)
Nötr X cismi iletken bir tel yardımı ile nötr elektroskopa bağlanıyor. Öğrencilerinize (–) yüklü Y
çubuğu sisteme şekildeki gibi yaklaştırılınca X cisminin, elektroskopun topuzunun ve
yapraklarının nasıl yükleneceğini soruyorsunuz. Bazı öğrencileriniz sırası ile (+), (–), (–) şeklinde
yüklenme gerçekleşeceğini belirtiyorlar. Sizce bu öğrencileriniz hangi düşüncelerinden dolayı bu
hatalı sonuca ulaşıyorlar?
Y
X
+ +
+ + +
+
+
+
+ + +
+
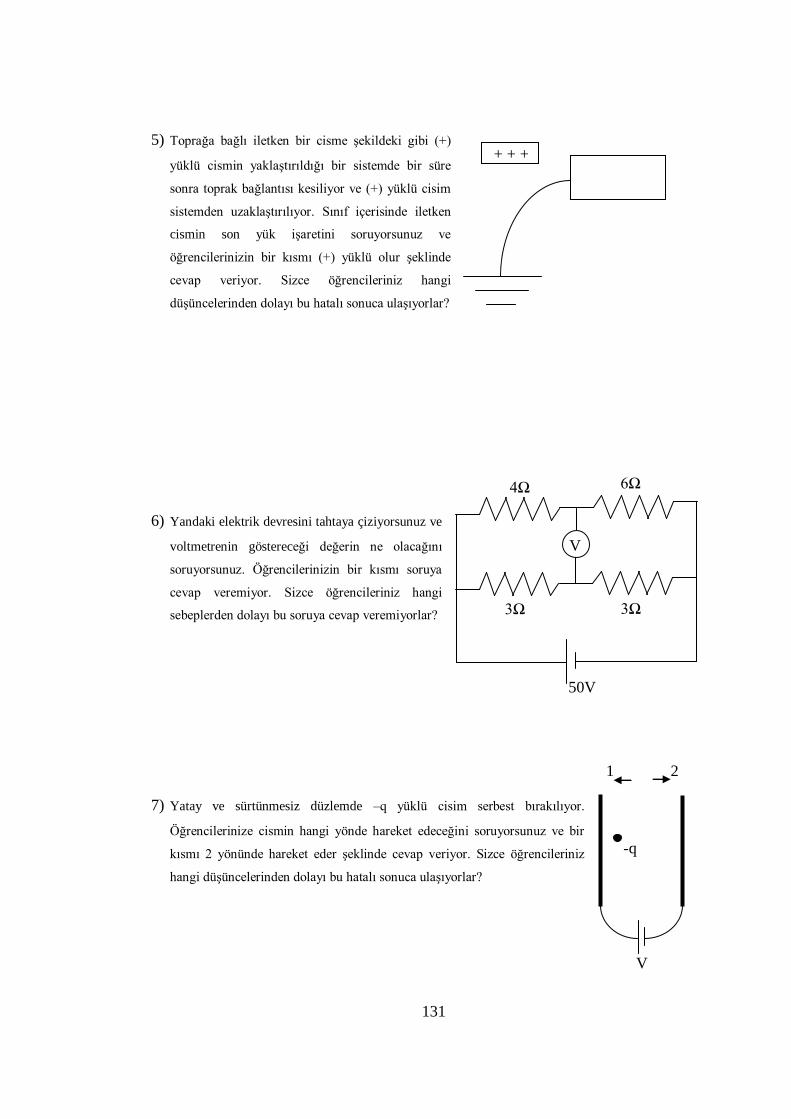
131
5) Toprağa bağlı iletken bir cisme şekildeki gibi (+)
yüklü cismin yaklaştırıldığı bir sistemde bir süre
sonra toprak bağlantısı kesiliyor ve (+) yüklü cisim
sistemden uzaklaştırılıyor. Sınıf içerisinde iletken
cismin son yük işaretini soruyorsunuz ve
öğrencilerinizin bir kısmı (+) yüklü olur şeklinde
cevap veriyor. Sizce öğrencileriniz hangi
düşüncelerinden dolayı bu hatalı sonuca ulaşıyorlar?
6) Yandaki elektrik devresini tahtaya çiziyorsunuz ve
voltmetrenin göstereceği değerin ne olacağını
soruyorsunuz. Öğrencilerinizin bir kısmı soruya
cevap veremiyor. Sizce öğrencileriniz hangi
sebeplerden dolayı bu soruya cevap veremiyorlar?
7) Yatay ve sürtünmesiz düzlemde –q yüklü cisim serbest bırakılıyor.
Öğrencilerinize cismin hangi yönde hareket edeceğini soruyorsunuz ve bir
kısmı 2 yönünde hareket eder şeklinde cevap veriyor. Sizce öğrencileriniz
hangi düşüncelerinden dolayı bu hatalı sonuca ulaşıyorlar?
+ + +
V
6Ω
50V
3Ω 3Ω
4Ω
Ω
V
-q
1 2
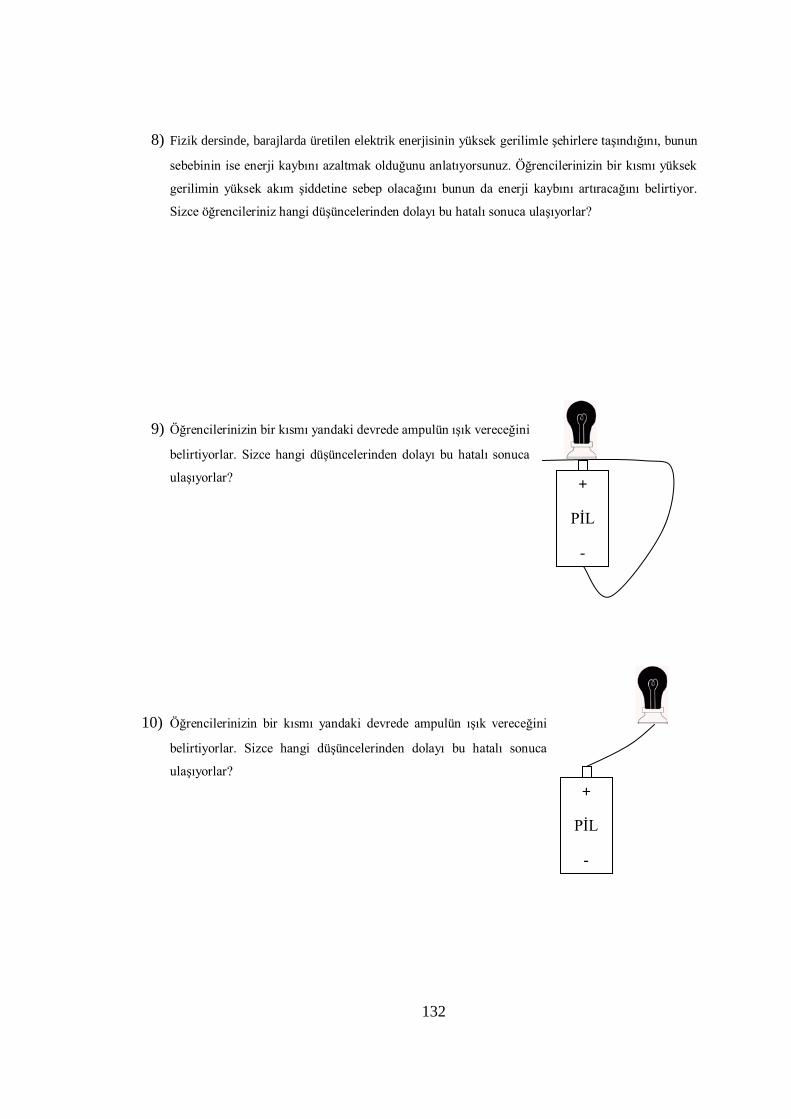
132
8) Fizik dersinde, barajlarda üretilen elektrik enerjisinin yüksek gerilimle şehirlere taşındığını, bunun
sebebinin ise enerji kaybını azaltmak olduğunu anlatıyorsunuz. Öğrencilerinizin bir kısmı yüksek
gerilimin yüksek akım şiddetine sebep olacağını bunun da enerji kaybını artıracağını belirtiyor.
Sizce öğrencileriniz hangi düşüncelerinden dolayı bu hatalı sonuca ulaşıyorlar?
9) Öğrencilerinizin bir kısmı yandaki devrede ampulün ışık vereceğini
belirtiyorlar. Sizce hangi düşüncelerinden dolayı bu hatalı sonuca
ulaşıyorlar?
10) Öğrencilerinizin bir kısmı yandaki devrede ampulün ışık vereceğini
belirtiyorlar. Sizce hangi düşüncelerinden dolayı bu hatalı sonuca
ulaşıyorlar?
+
PİL
-
+
PİL
-
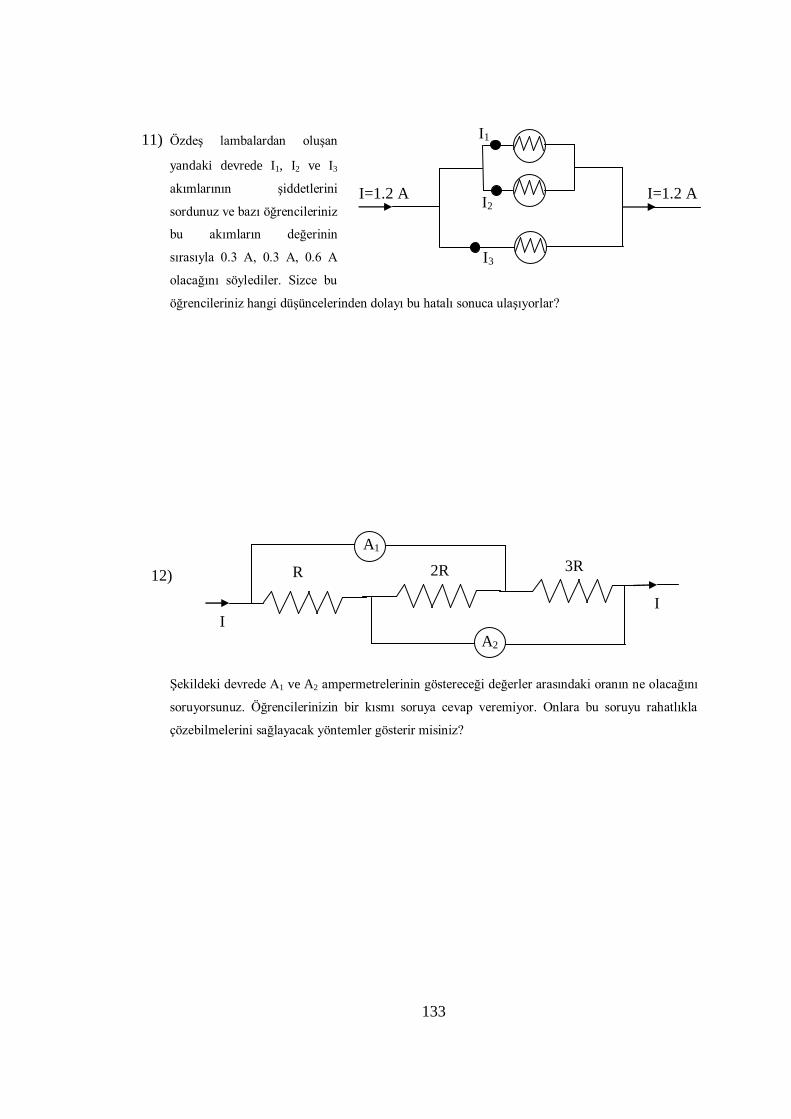
133
11) Özdeş lambalardan oluşan
yandaki devrede I1, I2 ve I3
akımlarının şiddetlerini
sordunuz ve bazı öğrencileriniz
bu akımların değerinin
sırasıyla 0.3 A, 0.3 A, 0.6 A
olacağını söylediler. Sizce bu
öğrencileriniz hangi düşüncelerinden dolayı bu hatalı sonuca ulaşıyorlar?
12)
Şekildeki devrede A1 ve A2 ampermetrelerinin göstereceği değerler arasındaki oranın ne olacağını
soruyorsunuz. Öğrencilerinizin bir kısmı soruya cevap veremiyor. Onlara bu soruyu rahatlıkla
çözebilmelerini sağlayacak yöntemler gösterir misiniz?
I
I
A1
A2
R 2R 3R
I1
I2
I3
I=1.2 A I=1.2 A
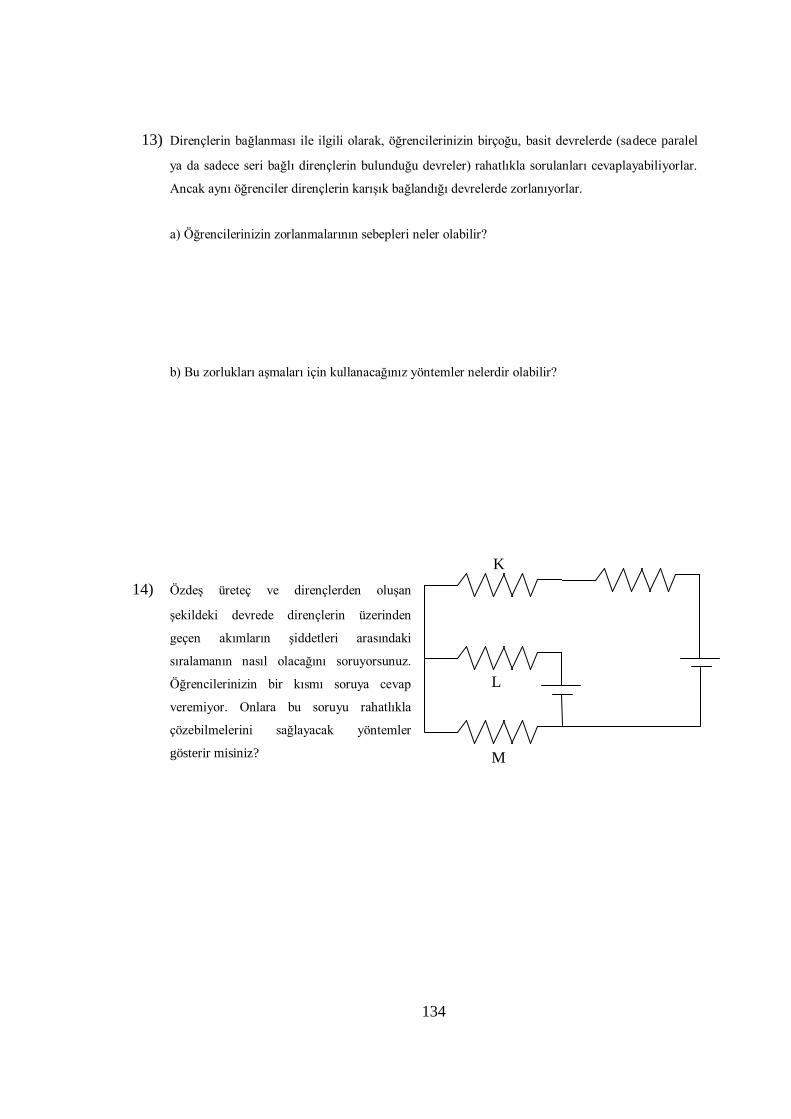
134
13) Dirençlerin bağlanması ile ilgili olarak, öğrencilerinizin birçoğu, basit devrelerde (sadece paralel
ya da sadece seri bağlı dirençlerin bulunduğu devreler) rahatlıkla sorulanları cevaplayabiliyorlar.
Ancak aynı öğrenciler dirençlerin karışık bağlandığı devrelerde zorlanıyorlar.
a) Öğrencilerinizin zorlanmalarının sebepleri neler olabilir?
b) Bu zorlukları aşmaları için kullanacağınız yöntemler nelerdir olabilir?
14) Özdeş üreteç ve dirençlerden oluşan
şekildeki devrede dirençlerin üzerinden
geçen akımların şiddetleri arasındaki
sıralamanın nasıl olacağını soruyorsunuz.
Öğrencilerinizin bir kısmı soruya cevap
veremiyor. Onlara bu soruyu rahatlıkla
çözebilmelerini sağlayacak yöntemler
gösterir misiniz?
K
L
M
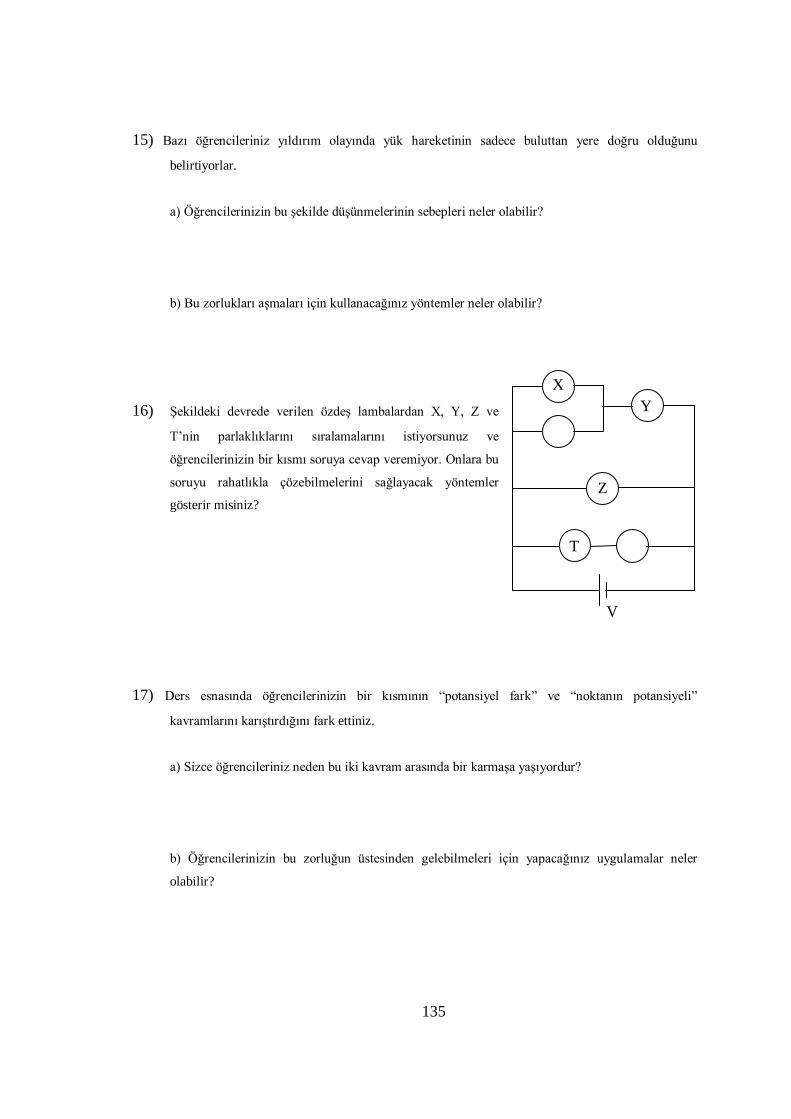
135
15) Bazı öğrencileriniz yıldırım olayında yük hareketinin sadece buluttan yere doğru olduğunu
belirtiyorlar.
a) Öğrencilerinizin bu şekilde düşünmelerinin sebepleri neler olabilir?
b) Bu zorlukları aşmaları için kullanacağınız yöntemler neler olabilir?
16) Şekildeki devrede verilen özdeş lambalardan X, Y, Z ve
T’nin parlaklıklarını sıralamalarını istiyorsunuz ve
öğrencilerinizin bir kısmı soruya cevap veremiyor. Onlara bu
soruyu rahatlıkla çözebilmelerini sağlayacak yöntemler
gösterir misiniz?
17) Ders esnasında öğrencilerinizin bir kısmının “potansiyel fark” ve “noktanın potansiyeli”
kavramlarını karıştırdığını fark ettiniz.
a) Sizce öğrencileriniz neden bu iki kavram arasında bir karmaşa yaşıyordur?
b) Öğrencilerinizin bu zorluğun üstesinden gelebilmeleri için yapacağınız uygulamalar neler
olabilir?
X
Y
Z
T
V
136
18) Ders esnasında öğrencilerinizin bir kısmının “potansiyel” ve “elektromotor kuvvet” kavramlarını
karıştırdığını fark ettiniz.
a) Sizce öğrencileriniz neden bu iki kavram arasında bir karmaşa yaşıyor?
b) Öğrencilerinizin bu zorluğun üstesinden gelebilmeleri için yapacağınız uygulamalar neler
olabilir?
19) Aşağıdaki tabloda, sol sütunda, elektrik konusu kapsamında öğrencilerde sıklıkla karşılaşılan
kavram yanılgılarından bazıları verilmiştir. Her kavram yanılgısını en fazla iki cümle ile çürütür
müsünüz?
Kavram Yanılgısı
Çürütücü İfade
Elektronlar ışık hızında hareket eder.
Nötr cisimlerde yük yoktur.
Elektrik akımı, dirençlerde harcanır.
Elektrik akımı, potansiyel farkın
değişimi sonucu oluşur.
Elektrik akımının miktarı değiştirilerek,
devrenin potansiyel farkı değiştirilir.
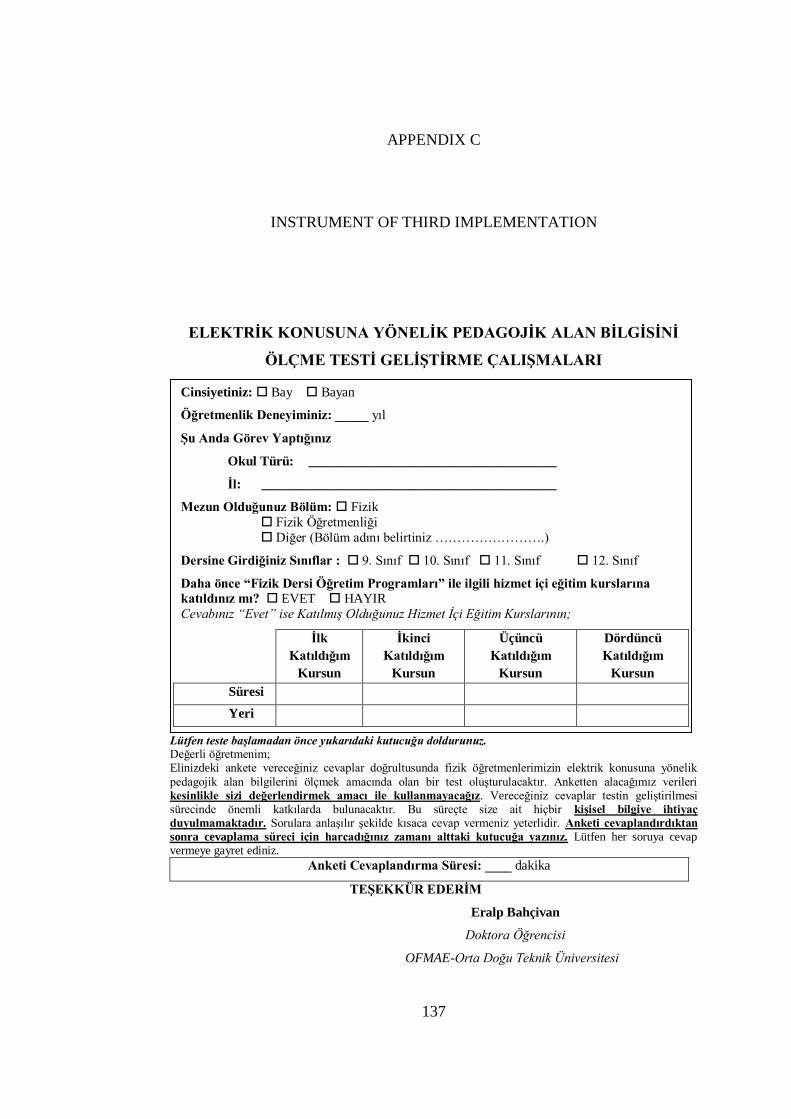
137
APPENDIX C
INSTRUMENT OF THIRD IMPLEMENTATION
ELEKTRİK KONUSUNA YÖNELİK PEDAGOJİK ALAN BİLGİSİNİ
ÖLÇME TESTİ GELİŞTİRME ÇALIŞMALARI
Lütfen teste başlamadan önce yukarıdaki kutucuğu doldurunuz. Değerli öğretmenim; Elinizdeki ankete vereceğiniz cevaplar doğrultusunda fizik öğretmenlerimizin elektrik konusuna yönelik
pedagojik alan bilgilerini ölçmek amacında olan bir test oluşturulacaktır. Anketten alacağımız verileri kesinlikle sizi değerlendirmek amacı ile kullanmayacağız. Vereceğiniz cevaplar testin geliştirilmesi sürecinde önemli katkılarda bulunacaktır. Bu süreçte size ait hiçbir kişisel bilgiye ihtiyaç
duyulmamaktadır. Sorulara anlaşılır şekilde kısaca cevap vermeniz yeterlidir. Anketi cevaplandırdıktan
sonra cevaplama süreci için harcadığınız zamanı alttaki kutucuğa yazınız. Lütfen her soruya cevap vermeye gayret ediniz.
Anketi Cevaplandırma Süresi: ____ dakika
TEŞEKKÜR EDERİM
Eralp Bahçivan
Doktora Öğrencisi
OFMAE-Orta Doğu Teknik Üniversitesi
Cinsiyetiniz: Bay Bayan
Öğretmenlik Deneyiminiz: _____ yıl
Şu Anda Görev Yaptığınız
Okul Türü: _____________________________________
İl: ____________________________________________
Mezun Olduğunuz Bölüm: Fizik
Fizik Öğretmenliği
Diğer (Bölüm adını belirtiniz …………………….)
Dersine Girdiğiniz Sınıflar : 9. Sınıf 10. Sınıf 11. Sınıf 12. Sınıf
Daha önce “Fizik Dersi Öğretim Programları” ile ilgili hizmet içi eğitim kurslarına
katıldınız mı? EVET HAYIR
Cevabınız “Evet” ise Katılmış Olduğunuz Hizmet İçi Eğitim Kurslarının;
İlk
Katıldığım
Kursun
İkinci
Katıldığım
Kursun
Üçüncü
Katıldığım
Kursun
Dördüncü
Katıldığım
Kursun
Süresi
Yeri
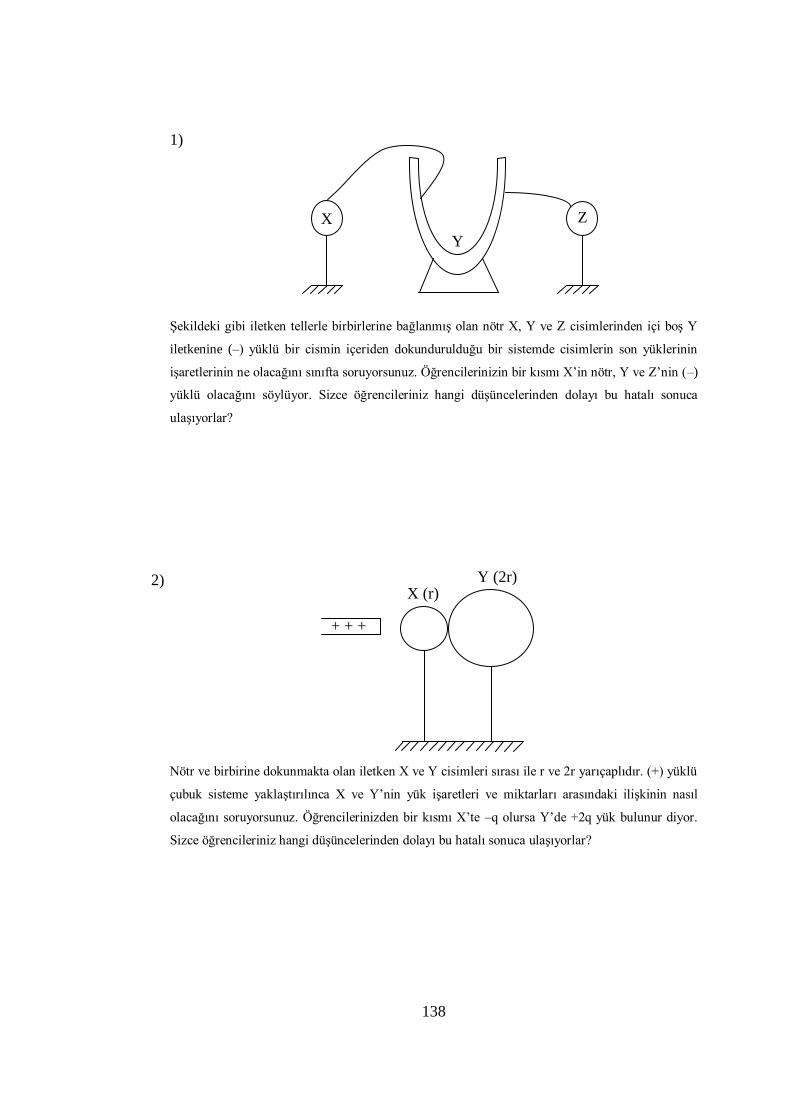
138
1)
Şekildeki gibi iletken tellerle birbirlerine bağlanmış olan nötr X, Y ve Z cisimlerinden içi boş Y
iletkenine (–) yüklü bir cismin içeriden dokundurulduğu bir sistemde cisimlerin son yüklerinin
işaretlerinin ne olacağını sınıfta soruyorsunuz. Öğrencilerinizin bir kısmı X’in nötr, Y ve Z’nin (–)
yüklü olacağını söylüyor. Sizce öğrencileriniz hangi düşüncelerinden dolayı bu hatalı sonuca
ulaşıyorlar?
2)
Nötr ve birbirine dokunmakta olan iletken X ve Y cisimleri sırası ile r ve 2r yarıçaplıdır. (+) yüklü
çubuk sisteme yaklaştırılınca X ve Y’nin yük işaretleri ve miktarları arasındaki ilişkinin nasıl
olacağını soruyorsunuz. Öğrencilerinizden bir kısmı X’te –q olursa Y’de +2q yük bulunur diyor.
Sizce öğrencileriniz hangi düşüncelerinden dolayı bu hatalı sonuca ulaşıyorlar?
+ + +
X (r) Y (2r)
Y
X Z
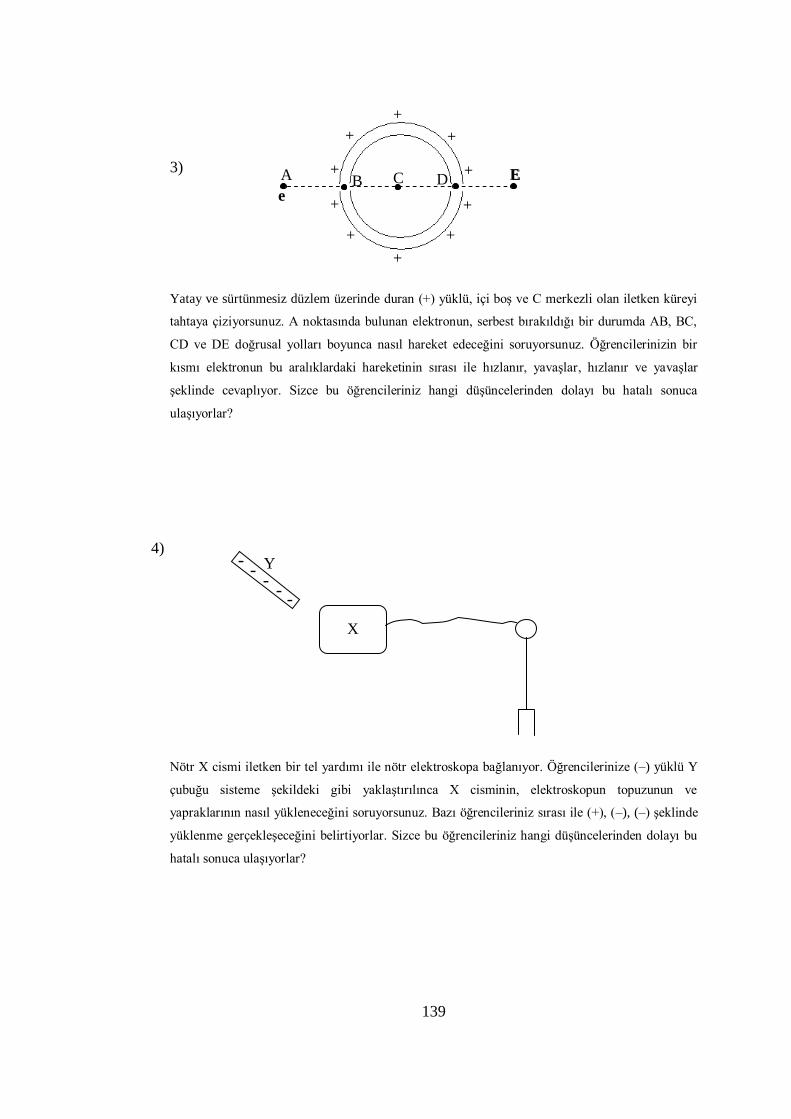
139
3)
Yatay ve sürtünmesiz düzlem üzerinde duran (+) yüklü, içi boş ve C merkezli olan iletken küreyi
tahtaya çiziyorsunuz. A noktasında bulunan elektronun, serbest bırakıldığı bir durumda AB, BC,
CD ve DE doğrusal yolları boyunca nasıl hareket edeceğini soruyorsunuz. Öğrencilerinizin bir
kısmı elektronun bu aralıklardaki hareketinin sırası ile hızlanır, yavaşlar, hızlanır ve yavaşlar
şeklinde cevaplıyor. Sizce bu öğrencileriniz hangi düşüncelerinden dolayı bu hatalı sonuca
ulaşıyorlar?
4)
Nötr X cismi iletken bir tel yardımı ile nötr elektroskopa bağlanıyor. Öğrencilerinize (–) yüklü Y
çubuğu sisteme şekildeki gibi yaklaştırılınca X cisminin, elektroskopun topuzunun ve
yapraklarının nasıl yükleneceğini soruyorsunuz. Bazı öğrencileriniz sırası ile (+), (–), (–) şeklinde
yüklenme gerçekleşeceğini belirtiyorlar. Sizce bu öğrencileriniz hangi düşüncelerinden dolayı bu
hatalı sonuca ulaşıyorlar?
Y
X
- -
- -
-
A D C
C B E
e
E +
+
+
+
+
+
+
+
+
+
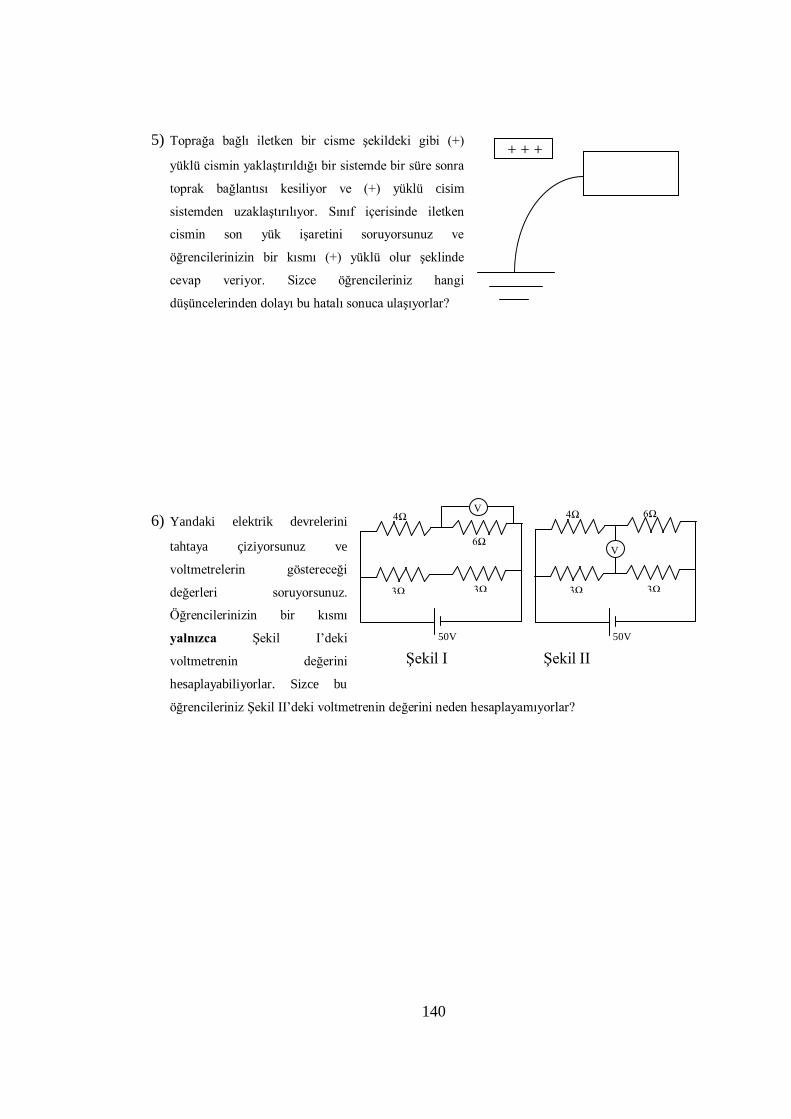
140
5) Toprağa bağlı iletken bir cisme şekildeki gibi (+)
yüklü cismin yaklaştırıldığı bir sistemde bir süre sonra
toprak bağlantısı kesiliyor ve (+) yüklü cisim
sistemden uzaklaştırılıyor. Sınıf içerisinde iletken
cismin son yük işaretini soruyorsunuz ve
öğrencilerinizin bir kısmı (+) yüklü olur şeklinde
cevap veriyor. Sizce öğrencileriniz hangi
düşüncelerinden dolayı bu hatalı sonuca ulaşıyorlar?
6) Yandaki elektrik devrelerini
tahtaya çiziyorsunuz ve
voltmetrelerin göstereceği
değerleri soruyorsunuz.
Öğrencilerinizin bir kısmı
yalnızca Şekil I’deki
voltmetrenin değerini
hesaplayabiliyorlar. Sizce bu
öğrencileriniz Şekil II’deki voltmetrenin değerini neden hesaplayamıyorlar?
+ + +
6Ω
3Ω
50V
4Ω
Ω
V
3Ω
V
6Ω 4Ω
Ω
3Ω 3Ω
50V
Şekil I Şekil II
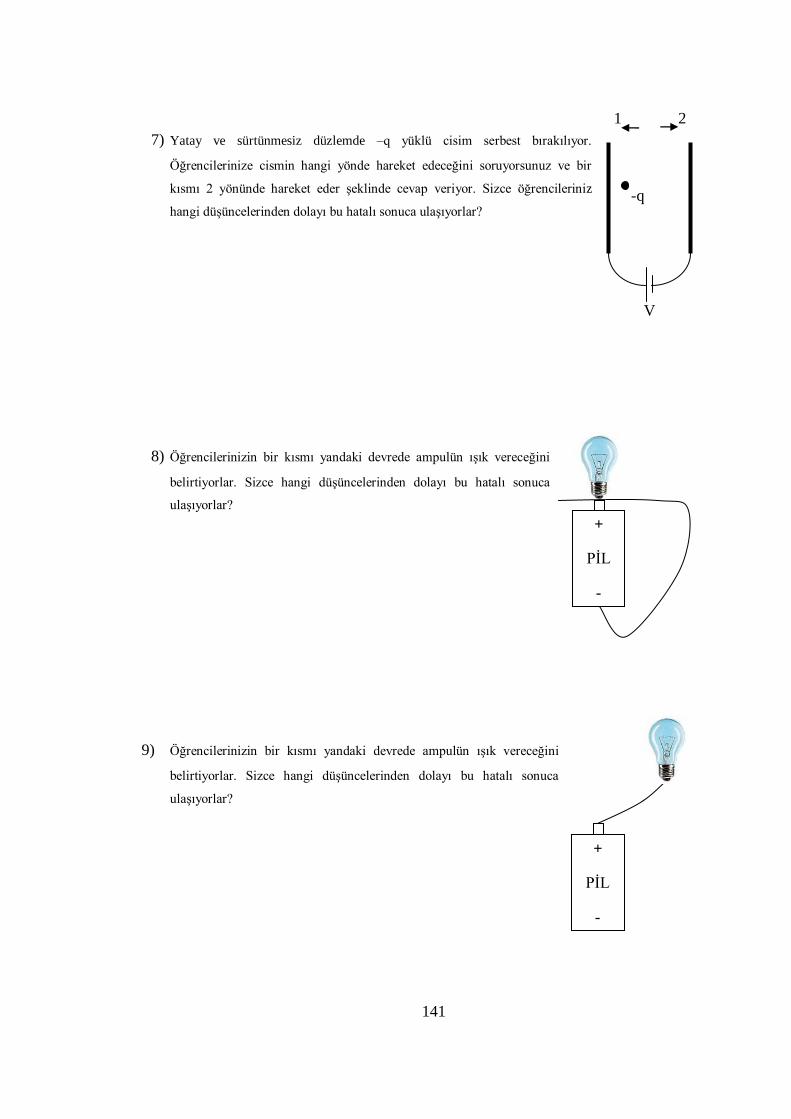
141
+
PİL
-
7) Yatay ve sürtünmesiz düzlemde –q yüklü cisim serbest bırakılıyor.
Öğrencilerinize cismin hangi yönde hareket edeceğini soruyorsunuz ve bir
kısmı 2 yönünde hareket eder şeklinde cevap veriyor. Sizce öğrencileriniz
hangi düşüncelerinden dolayı bu hatalı sonuca ulaşıyorlar?
8) Öğrencilerinizin bir kısmı yandaki devrede ampulün ışık vereceğini
belirtiyorlar. Sizce hangi düşüncelerinden dolayı bu hatalı sonuca
ulaşıyorlar?
9) Öğrencilerinizin bir kısmı yandaki devrede ampulün ışık vereceğini
belirtiyorlar. Sizce hangi düşüncelerinden dolayı bu hatalı sonuca
ulaşıyorlar?
V
-q
1 2
+
PİL
-
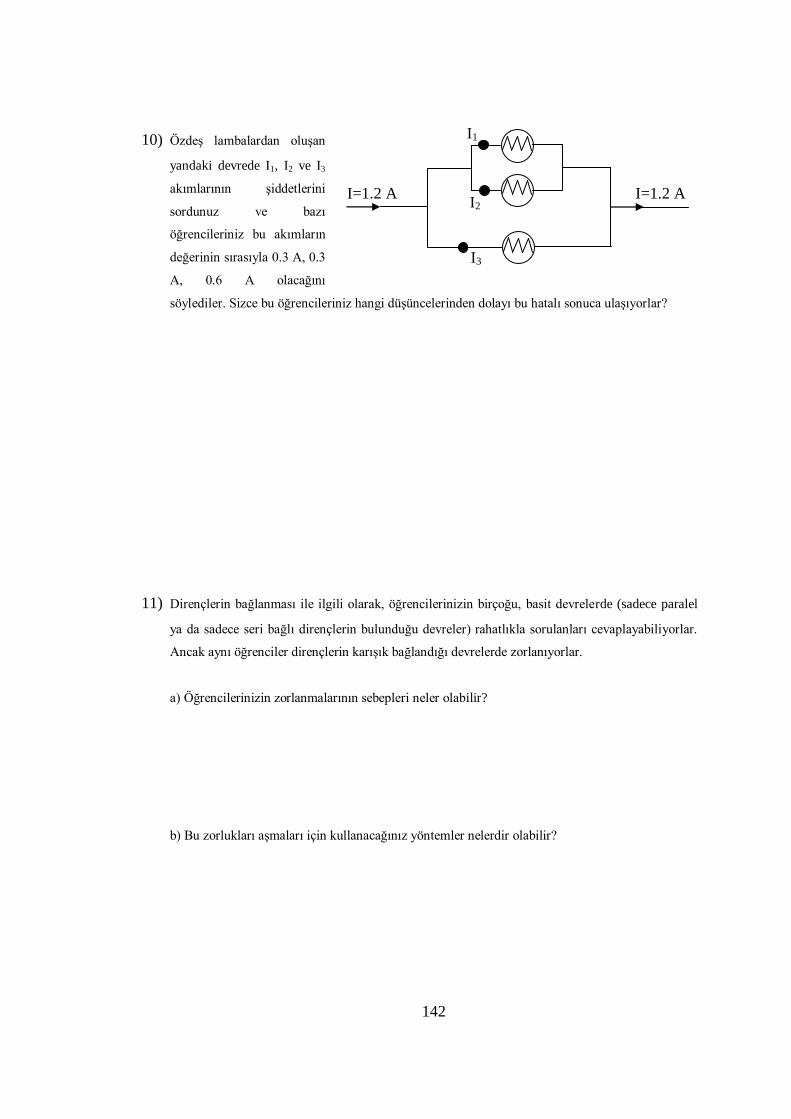
142
10) Özdeş lambalardan oluşan
yandaki devrede I1, I2 ve I3
akımlarının şiddetlerini
sordunuz ve bazı
öğrencileriniz bu akımların
değerinin sırasıyla 0.3 A, 0.3
A, 0.6 A olacağını
söylediler. Sizce bu öğrencileriniz hangi düşüncelerinden dolayı bu hatalı sonuca ulaşıyorlar?
11) Dirençlerin bağlanması ile ilgili olarak, öğrencilerinizin birçoğu, basit devrelerde (sadece paralel
ya da sadece seri bağlı dirençlerin bulunduğu devreler) rahatlıkla sorulanları cevaplayabiliyorlar.
Ancak aynı öğrenciler dirençlerin karışık bağlandığı devrelerde zorlanıyorlar.
a) Öğrencilerinizin zorlanmalarının sebepleri neler olabilir?
b) Bu zorlukları aşmaları için kullanacağınız yöntemler nelerdir olabilir?
I1
I2
I3
I=1.2 A I=1.2 A
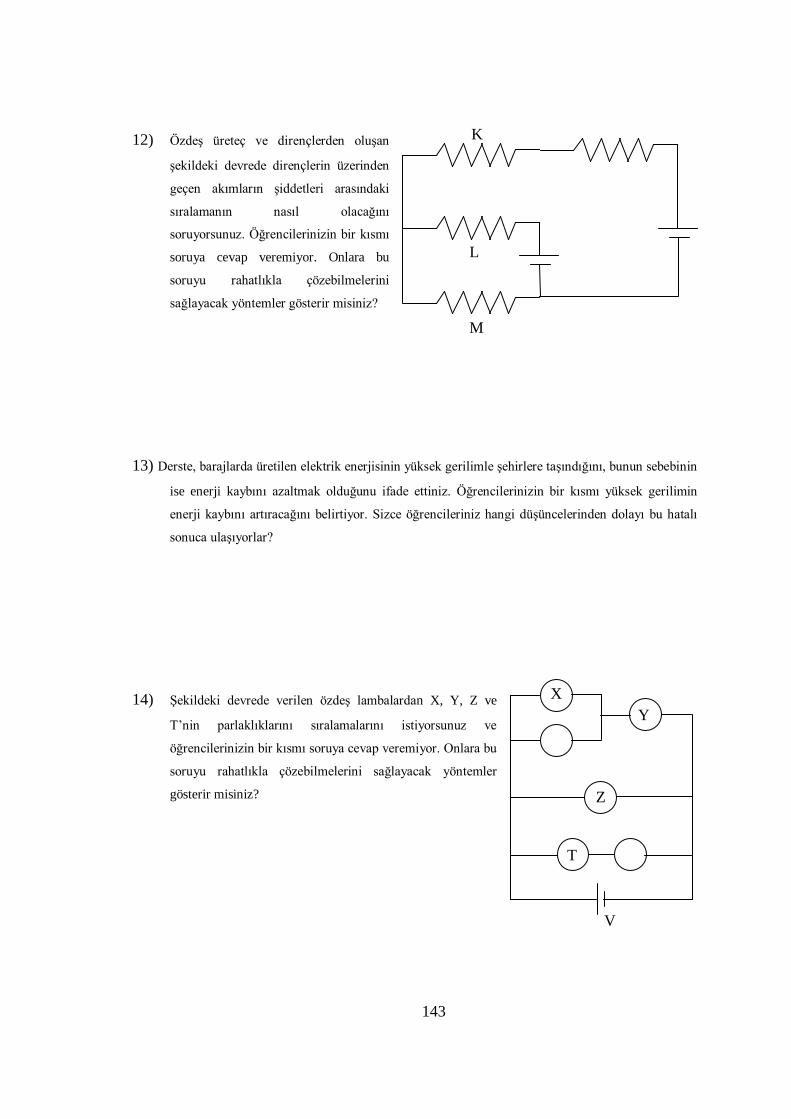
143
12) Özdeş üreteç ve dirençlerden oluşan
şekildeki devrede dirençlerin üzerinden
geçen akımların şiddetleri arasındaki
sıralamanın nasıl olacağını
soruyorsunuz. Öğrencilerinizin bir kısmı
soruya cevap veremiyor. Onlara bu
soruyu rahatlıkla çözebilmelerini
sağlayacak yöntemler gösterir misiniz?
13) Derste, barajlarda üretilen elektrik enerjisinin yüksek gerilimle şehirlere taşındığını, bunun sebebinin
ise enerji kaybını azaltmak olduğunu ifade ettiniz. Öğrencilerinizin bir kısmı yüksek gerilimin
enerji kaybını artıracağını belirtiyor. Sizce öğrencileriniz hangi düşüncelerinden dolayı bu hatalı
sonuca ulaşıyorlar?
14) Şekildeki devrede verilen özdeş lambalardan X, Y, Z ve
T’nin parlaklıklarını sıralamalarını istiyorsunuz ve
öğrencilerinizin bir kısmı soruya cevap veremiyor. Onlara bu
soruyu rahatlıkla çözebilmelerini sağlayacak yöntemler
gösterir misiniz?
X
Y
Z
T
V
K
L
M
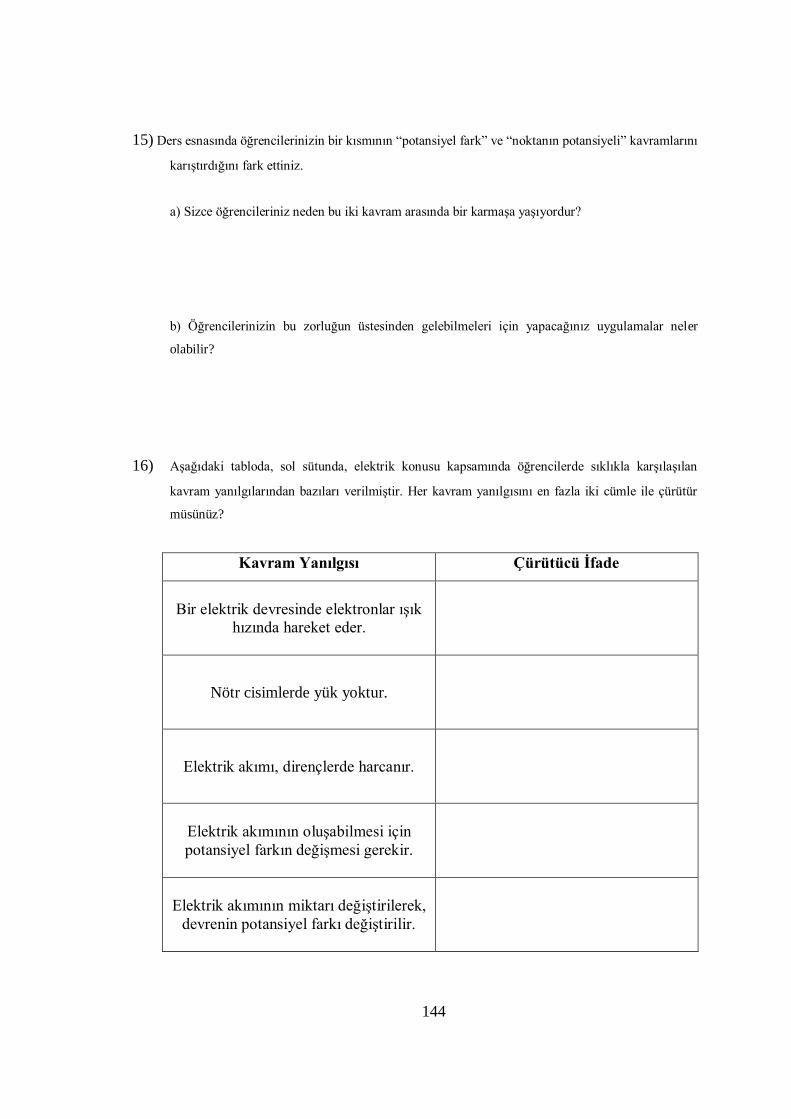
144
15) Ders esnasında öğrencilerinizin bir kısmının “potansiyel fark” ve “noktanın potansiyeli” kavramlarını
karıştırdığını fark ettiniz.
a) Sizce öğrencileriniz neden bu iki kavram arasında bir karmaşa yaşıyordur?
b) Öğrencilerinizin bu zorluğun üstesinden gelebilmeleri için yapacağınız uygulamalar neler
olabilir?
16) Aşağıdaki tabloda, sol sütunda, elektrik konusu kapsamında öğrencilerde sıklıkla karşılaşılan
kavram yanılgılarından bazıları verilmiştir. Her kavram yanılgısını en fazla iki cümle ile çürütür
müsünüz?
Kavram Yanılgısı Çürütücü İfade
Bir elektrik devresinde elektronlar ışık
hızında hareket eder.
Nötr cisimlerde yük yoktur.
Elektrik akımı, dirençlerde harcanır.
Elektrik akımının oluşabilmesi için
potansiyel farkın değişmesi gerekir.
Elektrik akımının miktarı değiştirilerek,
devrenin potansiyel farkı değiştirilir.
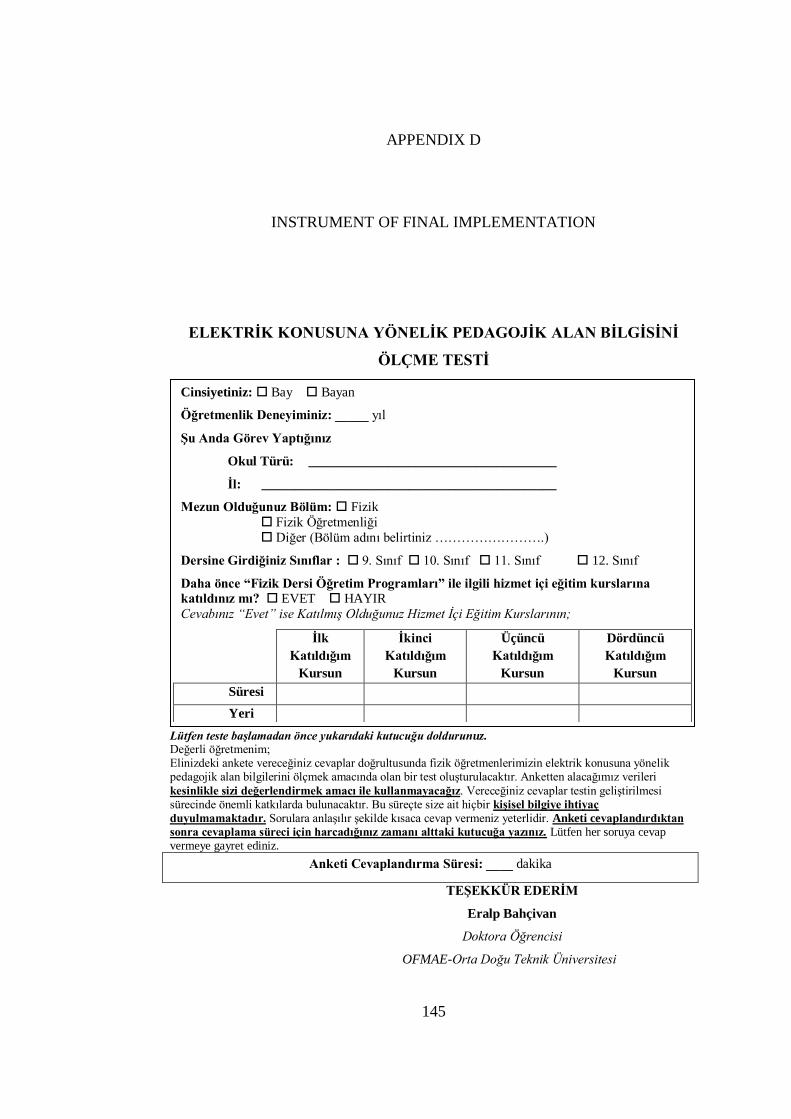
145
APPENDIX D
INSTRUMENT OF FINAL IMPLEMENTATION
ELEKTRİK KONUSUNA YÖNELİK PEDAGOJİK ALAN BİLGİSİNİ
ÖLÇME TESTİ
Lütfen teste başlamadan önce yukarıdaki kutucuğu doldurunuz. Değerli öğretmenim; Elinizdeki ankete vereceğiniz cevaplar doğrultusunda fizik öğretmenlerimizin elektrik konusuna yönelik pedagojik alan bilgilerini ölçmek amacında olan bir test oluşturulacaktır. Anketten alacağımız verileri
kesinlikle sizi değerlendirmek amacı ile kullanmayacağız. Vereceğiniz cevaplar testin geliştirilmesi sürecinde önemli katkılarda bulunacaktır. Bu süreçte size ait hiçbir kişisel bilgiye ihtiyaç
duyulmamaktadır. Sorulara anlaşılır şekilde kısaca cevap vermeniz yeterlidir. Anketi cevaplandırdıktan
sonra cevaplama süreci için harcadığınız zamanı alttaki kutucuğa yazınız. Lütfen her soruya cevap vermeye gayret ediniz.
Anketi Cevaplandırma Süresi: ____ dakika
TEŞEKKÜR EDERİM
Eralp Bahçivan
Doktora Öğrencisi
OFMAE-Orta Doğu Teknik Üniversitesi
Cinsiyetiniz: Bay Bayan
Öğretmenlik Deneyiminiz: _____ yıl
Şu Anda Görev Yaptığınız
Okul Türü: _____________________________________
İl: ____________________________________________
Mezun Olduğunuz Bölüm: Fizik
Fizik Öğretmenliği
Diğer (Bölüm adını belirtiniz …………………….)
Dersine Girdiğiniz Sınıflar : 9. Sınıf 10. Sınıf 11. Sınıf 12. Sınıf
Daha önce “Fizik Dersi Öğretim Programları” ile ilgili hizmet içi eğitim kurslarına
katıldınız mı? EVET HAYIR
Cevabınız “Evet” ise Katılmış Olduğunuz Hizmet İçi Eğitim Kurslarının;
İlk
Katıldığım
Kursun
İkinci
Katıldığım
Kursun
Üçüncü
Katıldığım
Kursun
Dördüncü
Katıldığım
Kursun
Süresi
Yeri
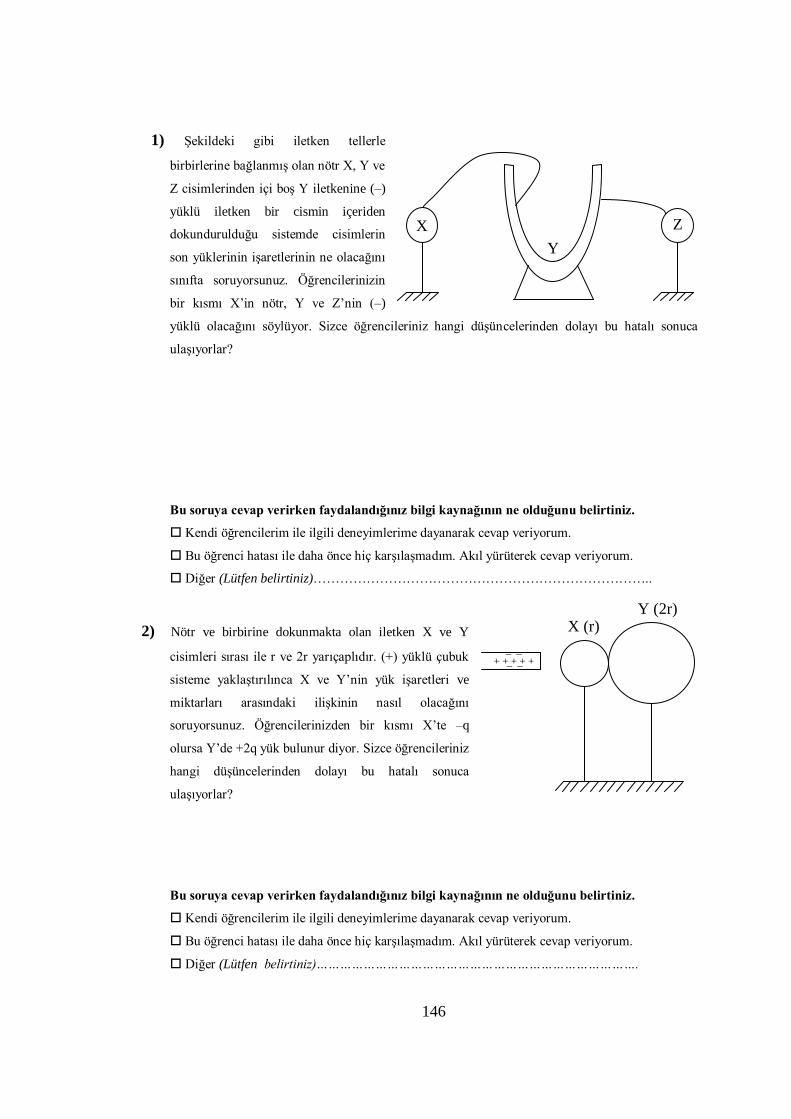
146
1) Şekildeki gibi iletken tellerle
birbirlerine bağlanmış olan nötr X, Y ve
Z cisimlerinden içi boş Y iletkenine (–)
yüklü iletken bir cismin içeriden
dokundurulduğu sistemde cisimlerin
son yüklerinin işaretlerinin ne olacağını
sınıfta soruyorsunuz. Öğrencilerinizin
bir kısmı X’in nötr, Y ve Z’nin (–)
yüklü olacağını söylüyor. Sizce öğrencileriniz hangi düşüncelerinden dolayı bu hatalı sonuca
ulaşıyorlar?
Bu soruya cevap verirken faydalandığınız bilgi kaynağının ne olduğunu belirtiniz.
Kendi öğrencilerim ile ilgili deneyimlerime dayanarak cevap veriyorum.
Bu öğrenci hatası ile daha önce hiç karşılaşmadım. Akıl yürüterek cevap veriyorum.
Diğer (Lütfen belirtiniz)…………………………………………………………………..
2) Nötr ve birbirine dokunmakta olan iletken X ve Y
cisimleri sırası ile r ve 2r yarıçaplıdır. (+) yüklü çubuk
sisteme yaklaştırılınca X ve Y’nin yük işaretleri ve
miktarları arasındaki ilişkinin nasıl olacağını
soruyorsunuz. Öğrencilerinizden bir kısmı X’te –q
olursa Y’de +2q yük bulunur diyor. Sizce öğrencileriniz
hangi düşüncelerinden dolayı bu hatalı sonuca
ulaşıyorlar?
Bu soruya cevap verirken faydalandığınız bilgi kaynağının ne olduğunu belirtiniz.
Kendi öğrencilerim ile ilgili deneyimlerime dayanarak cevap veriyorum.
Bu öğrenci hatası ile daha önce hiç karşılaşmadım. Akıl yürüterek cevap veriyorum.
Diğer (Lütfen belirtiniz)……………………………………………………………………….
Y
X Z
X (r) Y (2r)
+ + + + + _ _
_ _
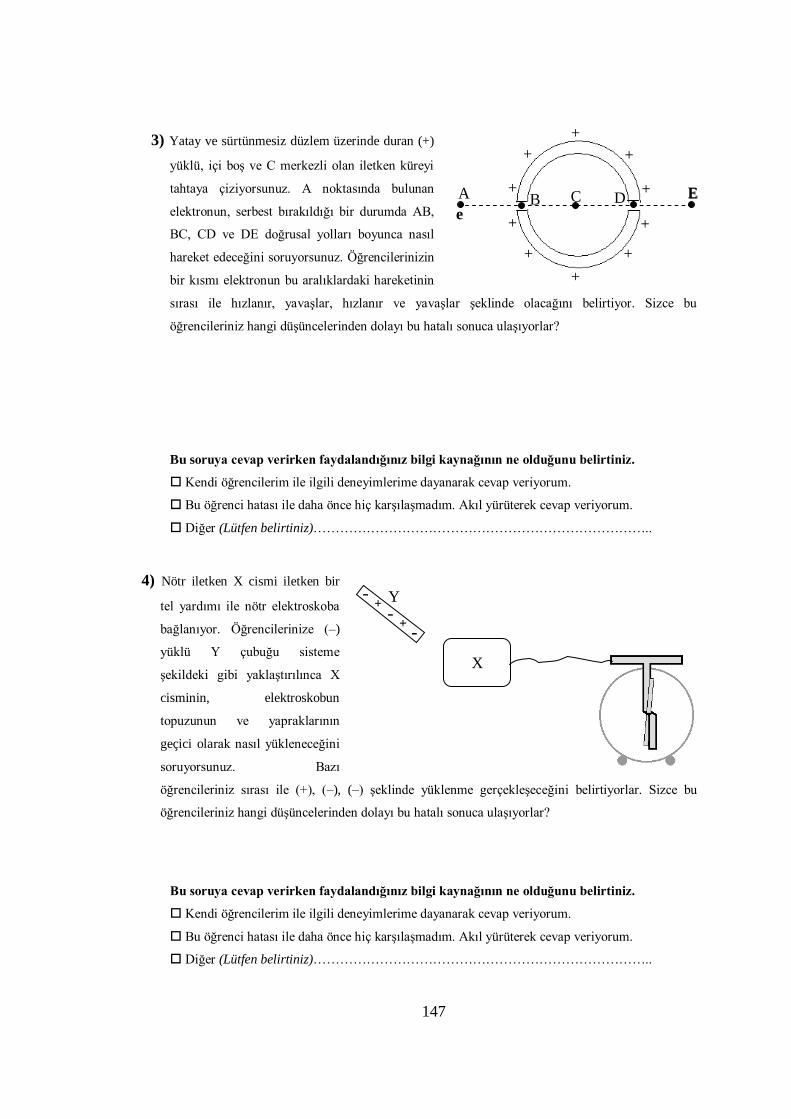
147
3) Yatay ve sürtünmesiz düzlem üzerinde duran (+)
yüklü, içi boş ve C merkezli olan iletken küreyi
tahtaya çiziyorsunuz. A noktasında bulunan
elektronun, serbest bırakıldığı bir durumda AB,
BC, CD ve DE doğrusal yolları boyunca nasıl
hareket edeceğini soruyorsunuz. Öğrencilerinizin
bir kısmı elektronun bu aralıklardaki hareketinin
sırası ile hızlanır, yavaşlar, hızlanır ve yavaşlar şeklinde olacağını belirtiyor. Sizce bu
öğrencileriniz hangi düşüncelerinden dolayı bu hatalı sonuca ulaşıyorlar?
Bu soruya cevap verirken faydalandığınız bilgi kaynağının ne olduğunu belirtiniz.
Kendi öğrencilerim ile ilgili deneyimlerime dayanarak cevap veriyorum.
Bu öğrenci hatası ile daha önce hiç karşılaşmadım. Akıl yürüterek cevap veriyorum.
Diğer (Lütfen belirtiniz)…………………………………………………………………..
4) Nötr iletken X cismi iletken bir
tel yardımı ile nötr elektroskoba
bağlanıyor. Öğrencilerinize (–)
yüklü Y çubuğu sisteme
şekildeki gibi yaklaştırılınca X
cisminin, elektroskobun
topuzunun ve yapraklarının
geçici olarak nasıl yükleneceğini
soruyorsunuz. Bazı
öğrencileriniz sırası ile (+), (–), (–) şeklinde yüklenme gerçekleşeceğini belirtiyorlar. Sizce bu
öğrencileriniz hangi düşüncelerinden dolayı bu hatalı sonuca ulaşıyorlar?
Bu soruya cevap verirken faydalandığınız bilgi kaynağının ne olduğunu belirtiniz.
Kendi öğrencilerim ile ilgili deneyimlerime dayanarak cevap veriyorum.
Bu öğrenci hatası ile daha önce hiç karşılaşmadım. Akıl yürüterek cevap veriyorum.
Diğer (Lütfen belirtiniz)…………………………………………………………………..
A D C
C B E
e
E +
+
+
+
+
+
+
+
+
+
Y - +
- -
+
X
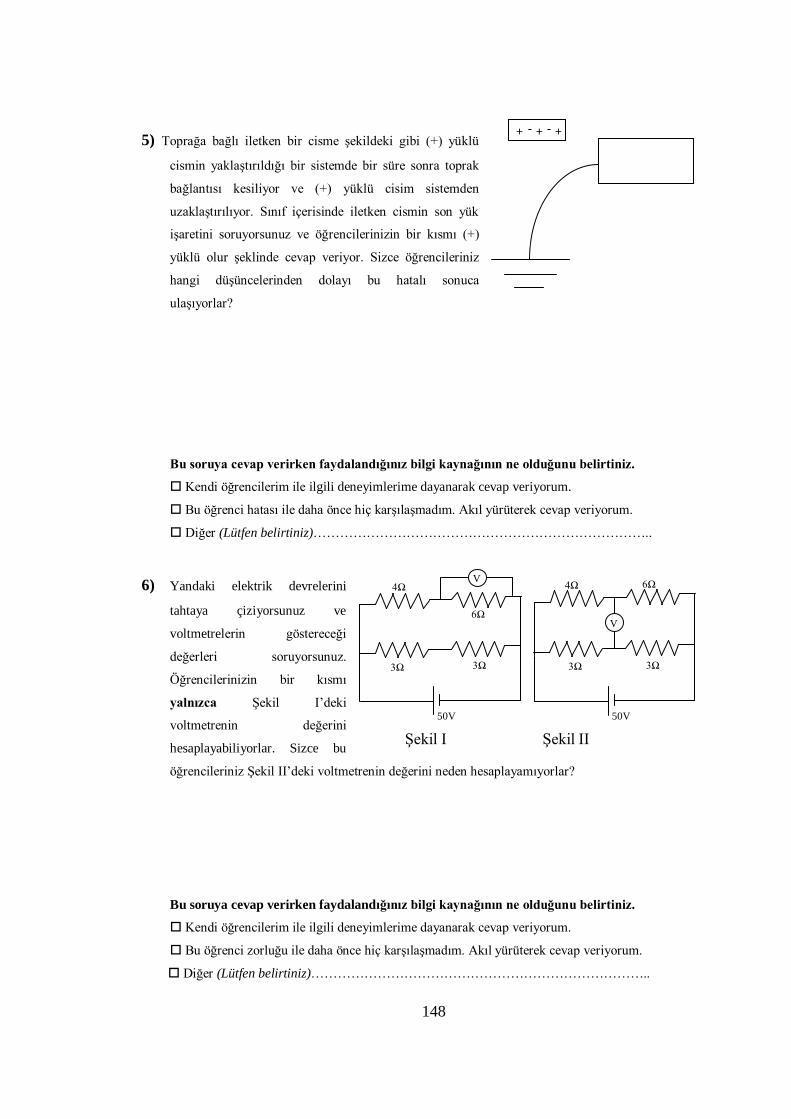
148
5) Toprağa bağlı iletken bir cisme şekildeki gibi (+) yüklü
cismin yaklaştırıldığı bir sistemde bir süre sonra toprak
bağlantısı kesiliyor ve (+) yüklü cisim sistemden
uzaklaştırılıyor. Sınıf içerisinde iletken cismin son yük
işaretini soruyorsunuz ve öğrencilerinizin bir kısmı (+)
yüklü olur şeklinde cevap veriyor. Sizce öğrencileriniz
hangi düşüncelerinden dolayı bu hatalı sonuca
ulaşıyorlar?
Bu soruya cevap verirken faydalandığınız bilgi kaynağının ne olduğunu belirtiniz.
Kendi öğrencilerim ile ilgili deneyimlerime dayanarak cevap veriyorum.
Bu öğrenci hatası ile daha önce hiç karşılaşmadım. Akıl yürüterek cevap veriyorum.
Diğer (Lütfen belirtiniz)…………………………………………………………………..
6) Yandaki elektrik devrelerini
tahtaya çiziyorsunuz ve
voltmetrelerin göstereceği
değerleri soruyorsunuz.
Öğrencilerinizin bir kısmı
yalnızca Şekil I’deki
voltmetrenin değerini
hesaplayabiliyorlar. Sizce bu
öğrencileriniz Şekil II’deki voltmetrenin değerini neden hesaplayamıyorlar?
Bu soruya cevap verirken faydalandığınız bilgi kaynağının ne olduğunu belirtiniz.
Kendi öğrencilerim ile ilgili deneyimlerime dayanarak cevap veriyorum.
Bu öğrenci zorluğu ile daha önce hiç karşılaşmadım. Akıl yürüterek cevap veriyorum.
Diğer (Lütfen belirtiniz)…………………………………………………………………..
6Ω
3Ω
50V
4Ω
Ω
V
3Ω
V
6Ω 4Ω
Ω
3Ω 3Ω
50V
Şekil I Şekil II
+
- - +
+
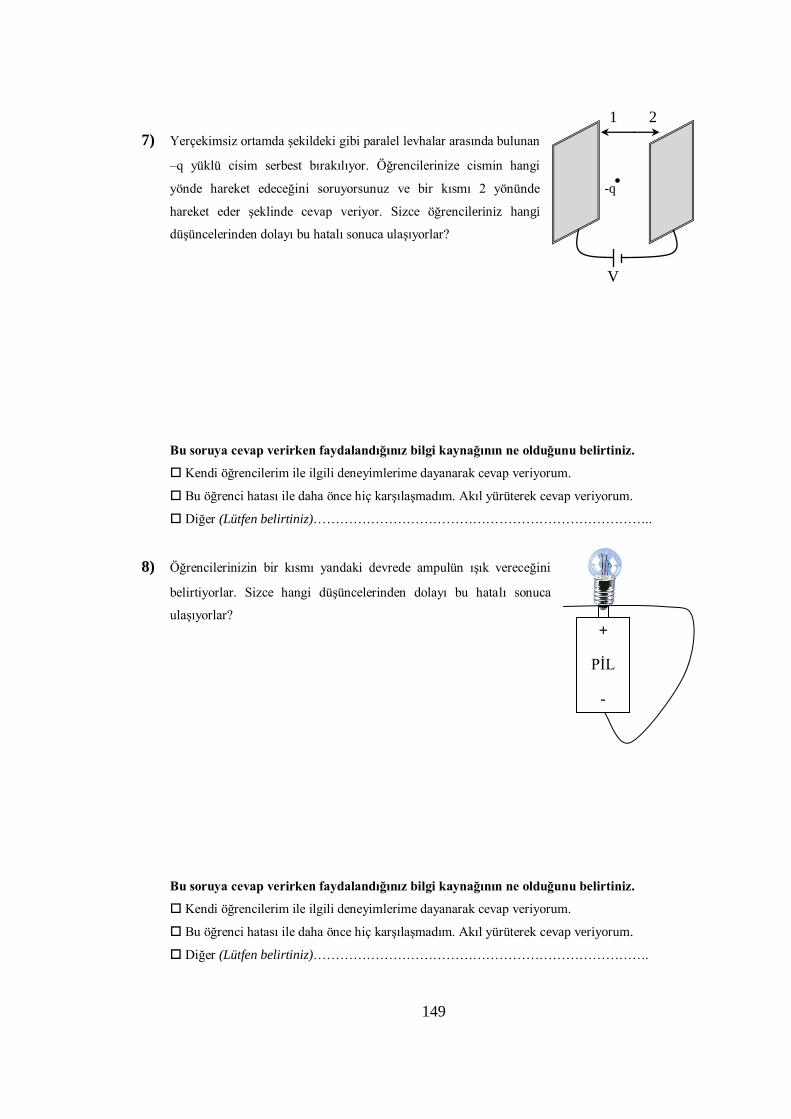
149
7) Yerçekimsiz ortamda şekildeki gibi paralel levhalar arasında bulunan
–q yüklü cisim serbest bırakılıyor. Öğrencilerinize cismin hangi
yönde hareket edeceğini soruyorsunuz ve bir kısmı 2 yönünde
hareket eder şeklinde cevap veriyor. Sizce öğrencileriniz hangi
düşüncelerinden dolayı bu hatalı sonuca ulaşıyorlar?
Bu soruya cevap verirken faydalandığınız bilgi kaynağının ne olduğunu belirtiniz.
Kendi öğrencilerim ile ilgili deneyimlerime dayanarak cevap veriyorum.
Bu öğrenci hatası ile daha önce hiç karşılaşmadım. Akıl yürüterek cevap veriyorum.
Diğer (Lütfen belirtiniz)…………………………………………………………………..
8) Öğrencilerinizin bir kısmı yandaki devrede ampulün ışık vereceğini
belirtiyorlar. Sizce hangi düşüncelerinden dolayı bu hatalı sonuca
ulaşıyorlar?
Bu soruya cevap verirken faydalandığınız bilgi kaynağının ne olduğunu belirtiniz.
Kendi öğrencilerim ile ilgili deneyimlerime dayanarak cevap veriyorum.
Bu öğrenci hatası ile daha önce hiç karşılaşmadım. Akıl yürüterek cevap veriyorum.
Diğer (Lütfen belirtiniz)………………………………………………………………….
+
PİL
-
-q
V
1 2
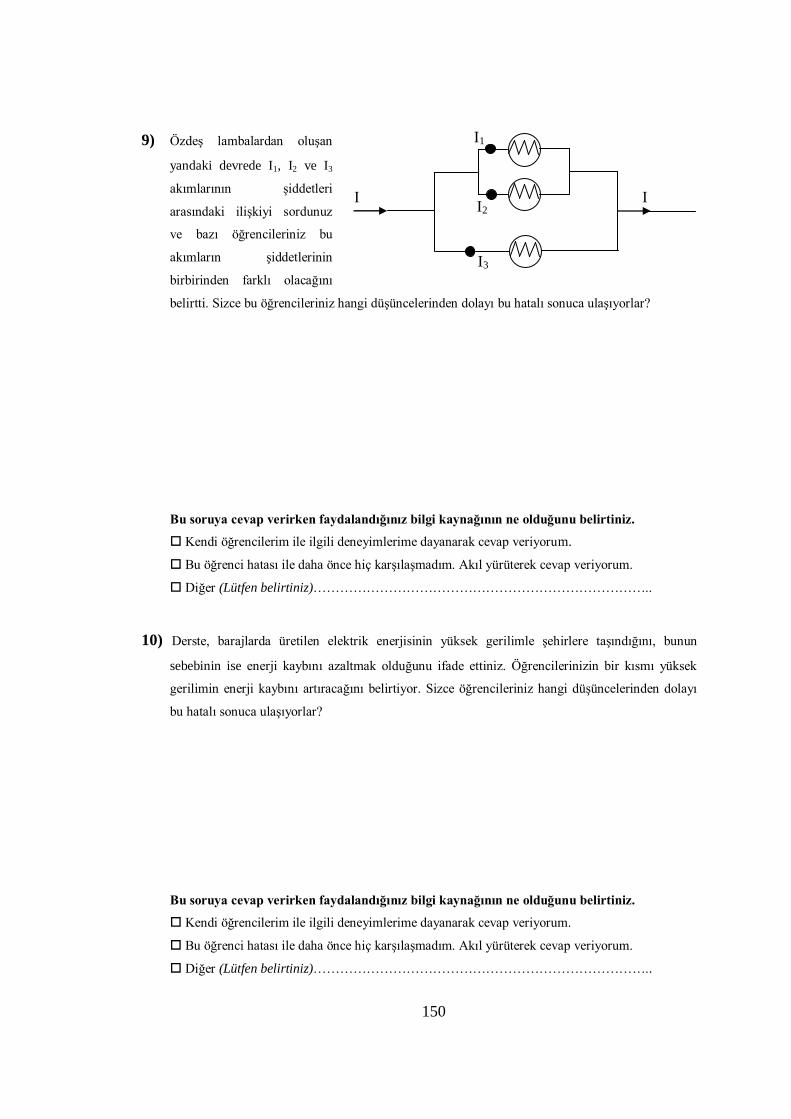
150
9) Özdeş lambalardan oluşan
yandaki devrede I1, I2 ve I3
akımlarının şiddetleri
arasındaki ilişkiyi sordunuz
ve bazı öğrencileriniz bu
akımların şiddetlerinin
birbirinden farklı olacağını
belirtti. Sizce bu öğrencileriniz hangi düşüncelerinden dolayı bu hatalı sonuca ulaşıyorlar?
Bu soruya cevap verirken faydalandığınız bilgi kaynağının ne olduğunu belirtiniz.
Kendi öğrencilerim ile ilgili deneyimlerime dayanarak cevap veriyorum.
Bu öğrenci hatası ile daha önce hiç karşılaşmadım. Akıl yürüterek cevap veriyorum.
Diğer (Lütfen belirtiniz)…………………………………………………………………..
10) Derste, barajlarda üretilen elektrik enerjisinin yüksek gerilimle şehirlere taşındığını, bunun
sebebinin ise enerji kaybını azaltmak olduğunu ifade ettiniz. Öğrencilerinizin bir kısmı yüksek
gerilimin enerji kaybını artıracağını belirtiyor. Sizce öğrencileriniz hangi düşüncelerinden dolayı
bu hatalı sonuca ulaşıyorlar?
Bu soruya cevap verirken faydalandığınız bilgi kaynağının ne olduğunu belirtiniz.
Kendi öğrencilerim ile ilgili deneyimlerime dayanarak cevap veriyorum.
Bu öğrenci hatası ile daha önce hiç karşılaşmadım. Akıl yürüterek cevap veriyorum.
Diğer (Lütfen belirtiniz)…………………………………………………………………..
I1
I2
I3
I I
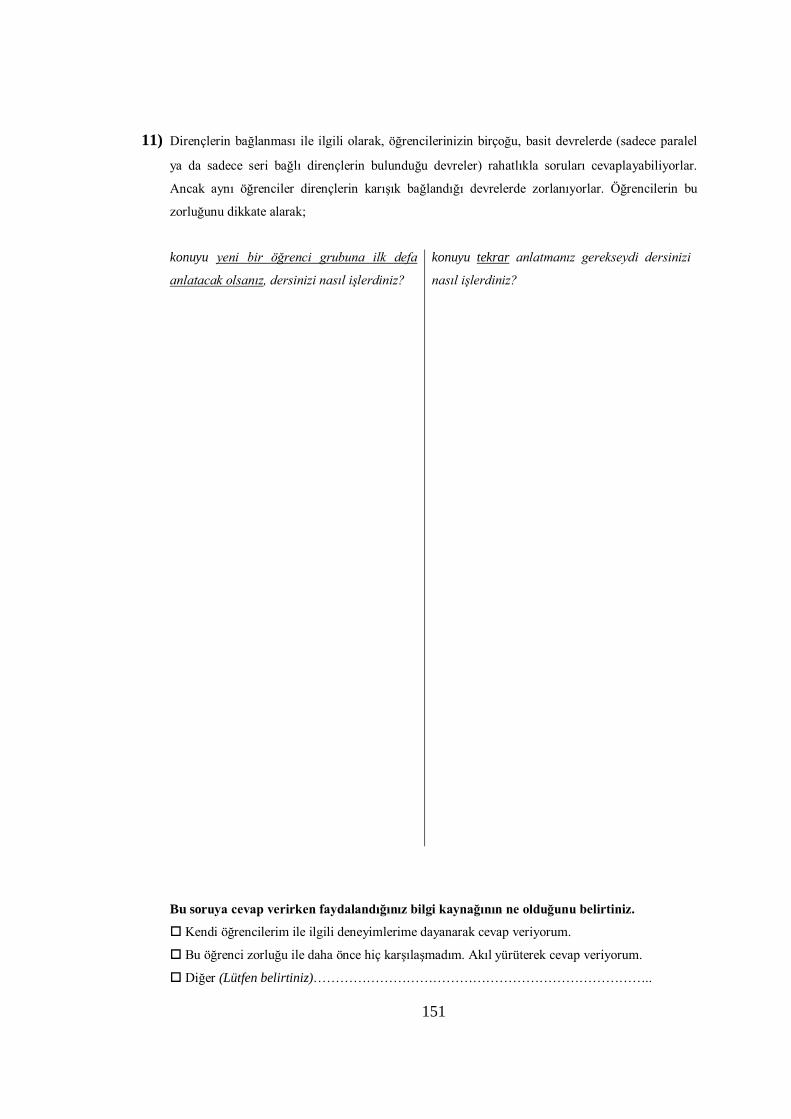
151
11) Dirençlerin bağlanması ile ilgili olarak, öğrencilerinizin birçoğu, basit devrelerde (sadece paralel
ya da sadece seri bağlı dirençlerin bulunduğu devreler) rahatlıkla soruları cevaplayabiliyorlar.
Ancak aynı öğrenciler dirençlerin karışık bağlandığı devrelerde zorlanıyorlar. Öğrencilerin bu
zorluğunu dikkate alarak;
konuyu yeni bir öğrenci grubuna ilk defa
anlatacak olsanız, dersinizi nasıl işlerdiniz?
konuyu tekrar anlatmanız gerekseydi dersinizi
nasıl işlerdiniz?
Bu soruya cevap verirken faydalandığınız bilgi kaynağının ne olduğunu belirtiniz.
Kendi öğrencilerim ile ilgili deneyimlerime dayanarak cevap veriyorum.
Bu öğrenci zorluğu ile daha önce hiç karşılaşmadım. Akıl yürüterek cevap veriyorum.
Diğer (Lütfen belirtiniz)…………………………………………………………………..
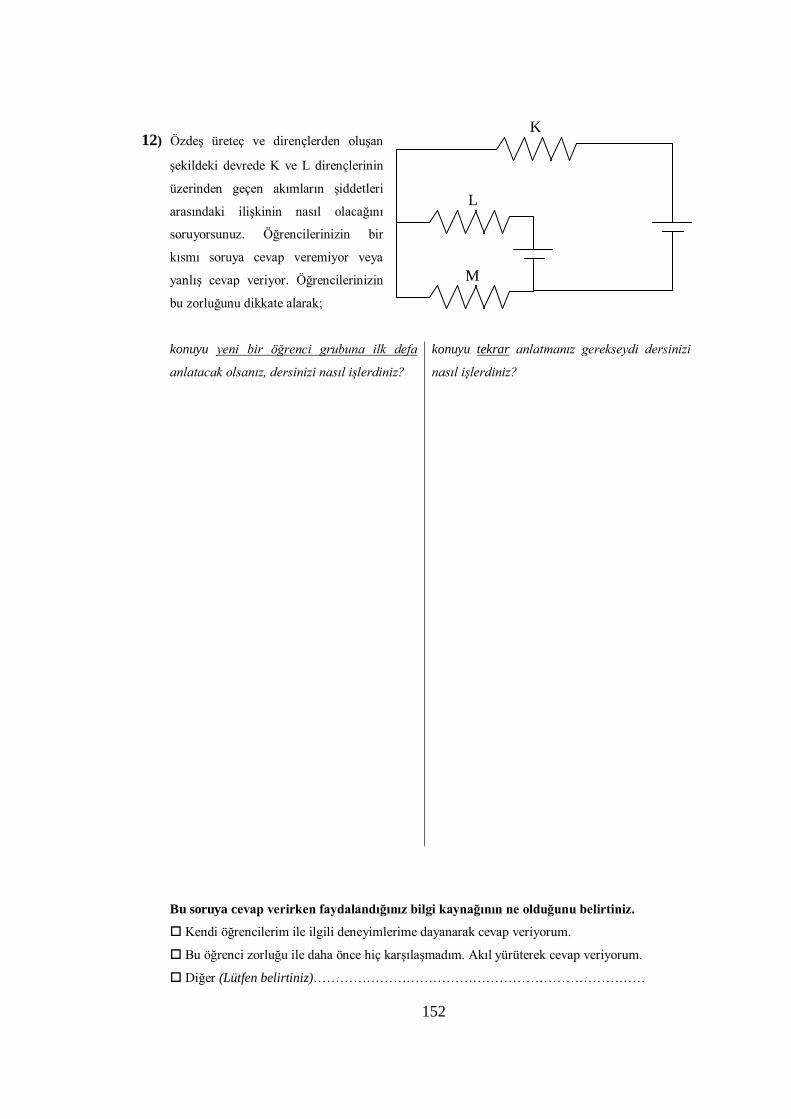
152
12) Özdeş üreteç ve dirençlerden oluşan
şekildeki devrede K ve L dirençlerinin
üzerinden geçen akımların şiddetleri
arasındaki ilişkinin nasıl olacağını
soruyorsunuz. Öğrencilerinizin bir
kısmı soruya cevap veremiyor veya
yanlış cevap veriyor. Öğrencilerinizin
bu zorluğunu dikkate alarak;
konuyu yeni bir öğrenci grubuna ilk defa
anlatacak olsanız, dersinizi nasıl işlerdiniz?
konuyu tekrar anlatmanız gerekseydi dersinizi
nasıl işlerdiniz?
Bu soruya cevap verirken faydalandığınız bilgi kaynağının ne olduğunu belirtiniz.
Kendi öğrencilerim ile ilgili deneyimlerime dayanarak cevap veriyorum.
Bu öğrenci zorluğu ile daha önce hiç karşılaşmadım. Akıl yürüterek cevap veriyorum.
Diğer (Lütfen belirtiniz)…………………………………………………………………
K
L
M
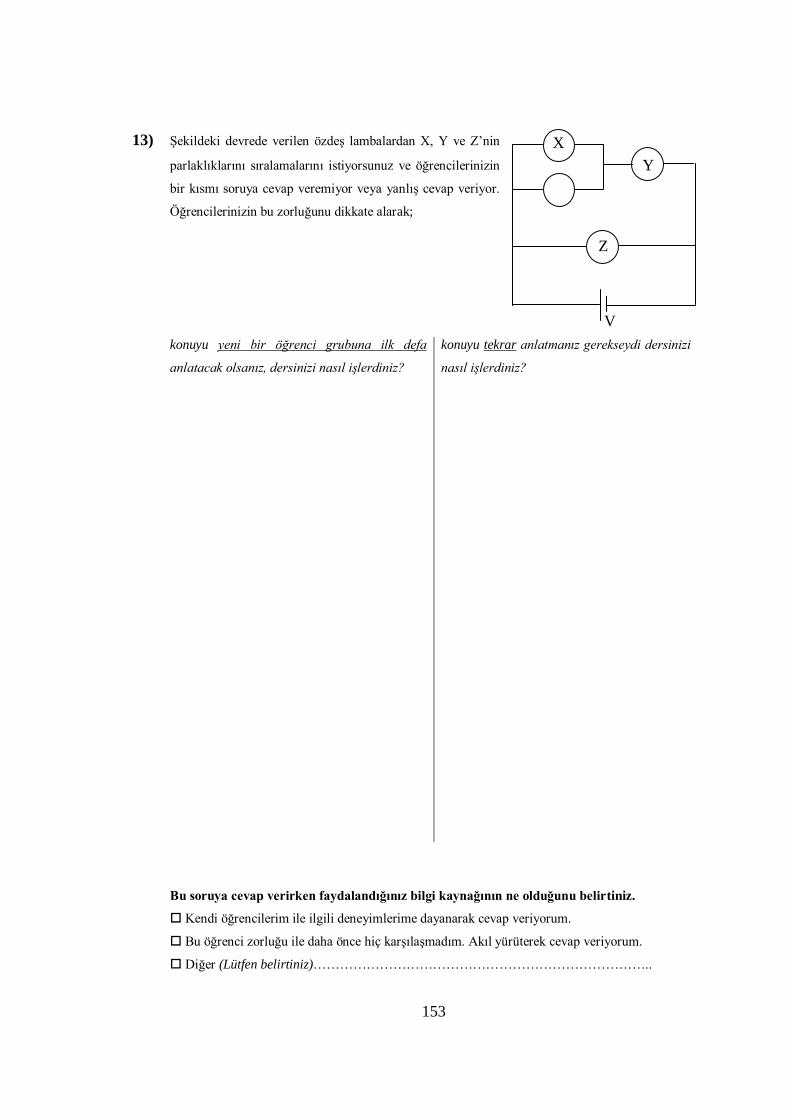
153
13) Şekildeki devrede verilen özdeş lambalardan X, Y ve Z’nin
parlaklıklarını sıralamalarını istiyorsunuz ve öğrencilerinizin
bir kısmı soruya cevap veremiyor veya yanlış cevap veriyor.
Öğrencilerinizin bu zorluğunu dikkate alarak;
konuyu yeni bir öğrenci grubuna ilk defa
anlatacak olsanız, dersinizi nasıl işlerdiniz?
konuyu tekrar anlatmanız gerekseydi dersinizi
nasıl işlerdiniz?
Bu soruya cevap verirken faydalandığınız bilgi kaynağının ne olduğunu belirtiniz.
Kendi öğrencilerim ile ilgili deneyimlerime dayanarak cevap veriyorum.
Bu öğrenci zorluğu ile daha önce hiç karşılaşmadım. Akıl yürüterek cevap veriyorum.
Diğer (Lütfen belirtiniz)…………………………………………………………………..
Y
X
Z
V
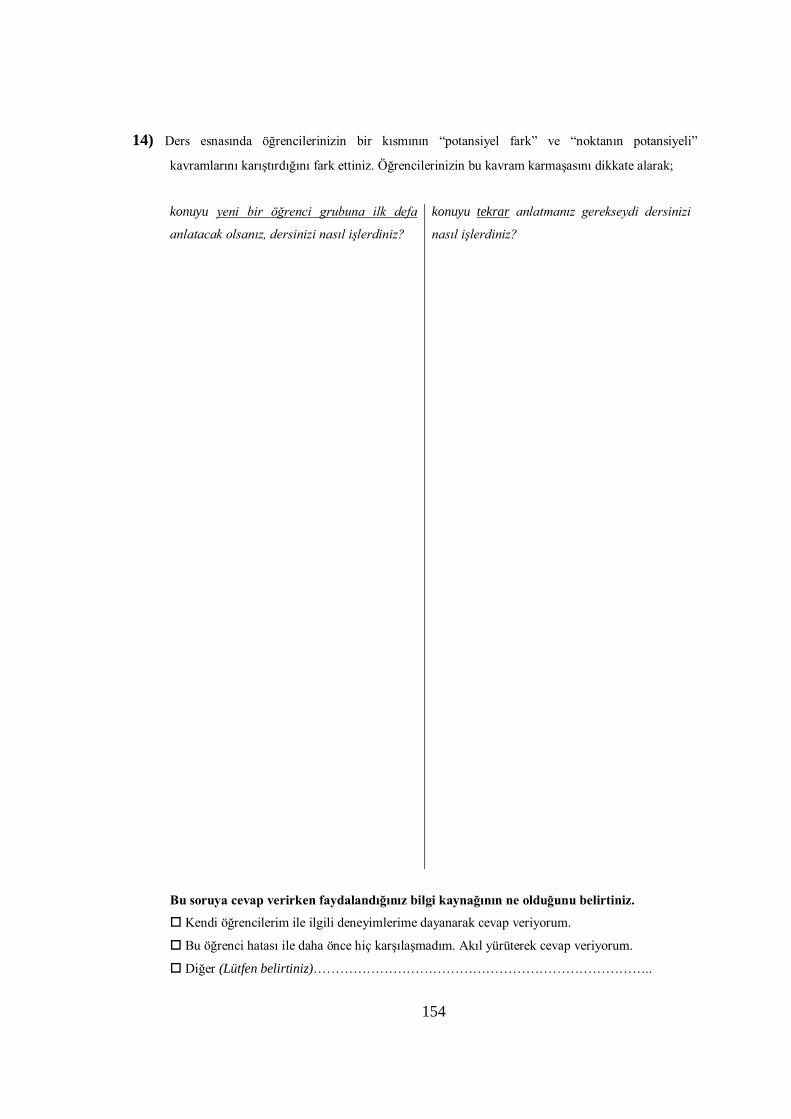
154
14) Ders esnasında öğrencilerinizin bir kısmının “potansiyel fark” ve “noktanın potansiyeli”
kavramlarını karıştırdığını fark ettiniz. Öğrencilerinizin bu kavram karmaşasını dikkate alarak;
konuyu yeni bir öğrenci grubuna ilk defa
anlatacak olsanız, dersinizi nasıl işlerdiniz?
konuyu tekrar anlatmanız gerekseydi dersinizi
nasıl işlerdiniz?
Bu soruya cevap verirken faydalandığınız bilgi kaynağının ne olduğunu belirtiniz.
Kendi öğrencilerim ile ilgili deneyimlerime dayanarak cevap veriyorum.
Bu öğrenci hatası ile daha önce hiç karşılaşmadım. Akıl yürüterek cevap veriyorum.
Diğer (Lütfen belirtiniz)…………………………………………………………………..
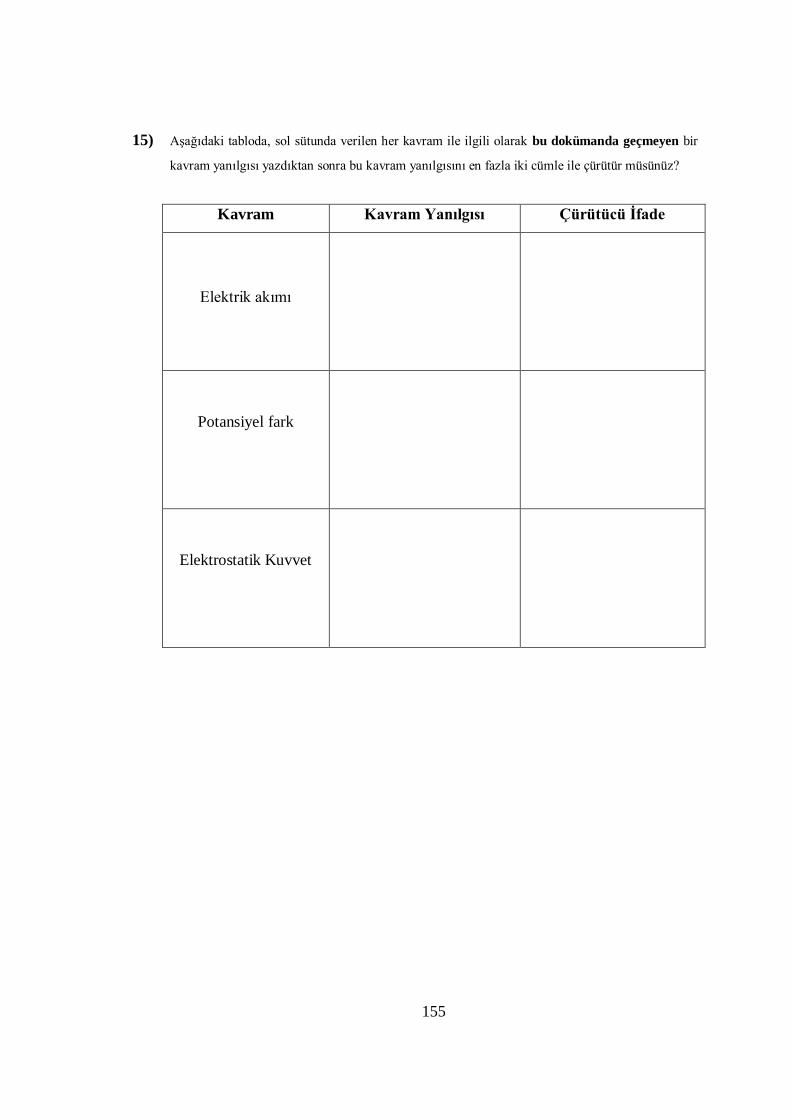
155
15) Aşağıdaki tabloda, sol sütunda verilen her kavram ile ilgili olarak bu dokümanda geçmeyen bir
kavram yanılgısı yazdıktan sonra bu kavram yanılgısını en fazla iki cümle ile çürütür müsünüz?
Kavram Kavram Yanılgısı Çürütücü İfade
Elektrik akımı
Potansiyel fark
Elektrostatik Kuvvet
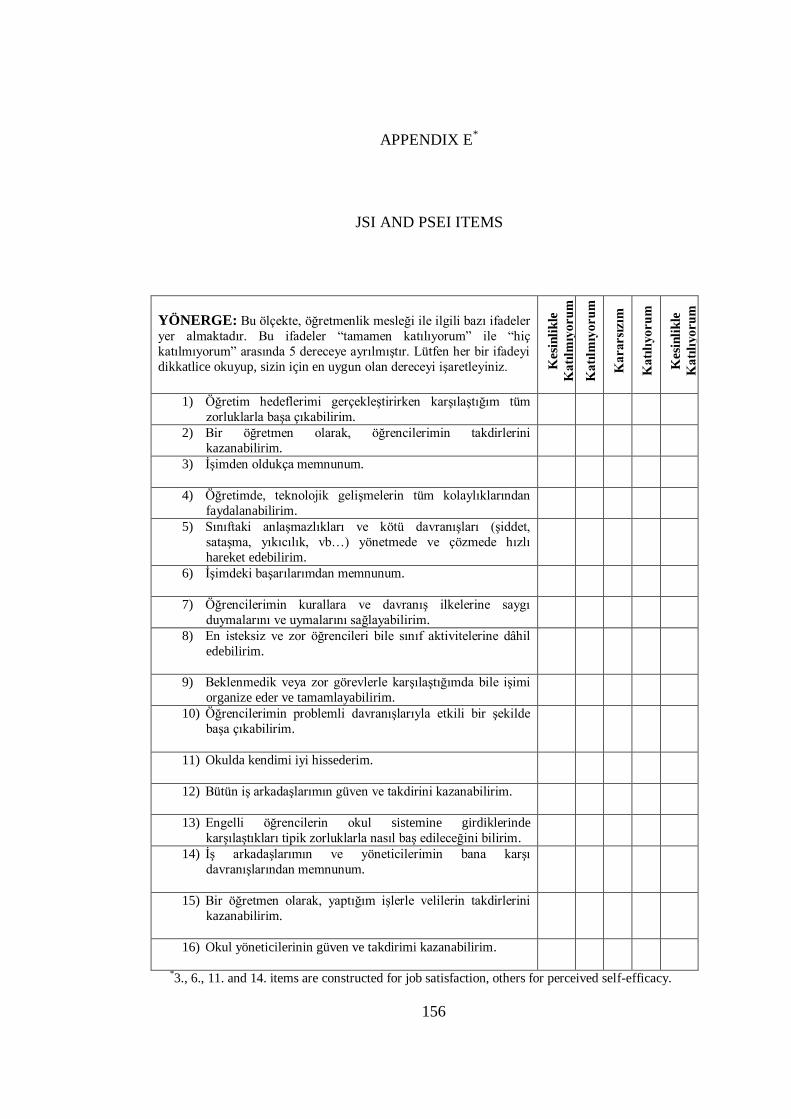
156
APPENDIX E*
JSI AND PSEI ITEMS
YÖNERGE: Bu ölçekte, öğretmenlik mesleği ile ilgili bazı ifadeler
yer almaktadır. Bu ifadeler “tamamen katılıyorum” ile “hiç
katılmıyorum” arasında 5 dereceye ayrılmıştır. Lütfen her bir ifadeyi
dikkatlice okuyup, sizin için en uygun olan dereceyi işaretleyiniz. Kesi
nli
kle
Katı
lmıy
oru
m
K
atı
lmıy
oru
m
K
ararsı
zım
Katı
lıyoru
m
Kesi
nli
kle
Katı
lıyoru
m
1) Öğretim hedeflerimi gerçekleştirirken karşılaştığım tüm
zorluklarla başa çıkabilirim.
2) Bir öğretmen olarak, öğrencilerimin takdirlerini
kazanabilirim.
3) İşimden oldukça memnunum.
4) Öğretimde, teknolojik gelişmelerin tüm kolaylıklarından
faydalanabilirim.
5) Sınıftaki anlaşmazlıkları ve kötü davranışları (şiddet,
sataşma, yıkıcılık, vb…) yönetmede ve çözmede hızlı
hareket edebilirim.
6) İşimdeki başarılarımdan memnunum.
7) Öğrencilerimin kurallara ve davranış ilkelerine saygı
duymalarını ve uymalarını sağlayabilirim.
8) En isteksiz ve zor öğrencileri bile sınıf aktivitelerine dâhil
edebilirim.
9) Beklenmedik veya zor görevlerle karşılaştığımda bile işimi
organize eder ve tamamlayabilirim.
10) Öğrencilerimin problemli davranışlarıyla etkili bir şekilde
başa çıkabilirim.
11) Okulda kendimi iyi hissederim.
12) Bütün iş arkadaşlarımın güven ve takdirini kazanabilirim.
13) Engelli öğrencilerin okul sistemine girdiklerinde
karşılaştıkları tipik zorluklarla nasıl baş edileceğini bilirim.
14) İş arkadaşlarımın ve yöneticilerimin bana karşı
davranışlarından memnunum.
15) Bir öğretmen olarak, yaptığım işlerle velilerin takdirlerini
kazanabilirim.
16) Okul yöneticilerinin güven ve takdirimi kazanabilirim.
*3., 6., 11. and 14. items are constructed for job satisfaction, others for perceived self-efficacy.
157
APPENDIX F
APPROVAL OF METU HUMAN RESEARCHES ETHIC COMMITTEE
158
APPENDIX G
PERMISSION OF THE TURKISH MINISTRY OF NATIONAL EDUCATION
159
APPENDIX H
RUBRIC
YÖNERGE
Değerlendirmeciler aşağıdaki kıstasları dikkate alarak puanlandırma yapmalıdırlar.
1. Katılımcıların kâğıtlarını değerlendirirken aşağıda görülen cevap anahtarını
kullanınız.
2. Bu cevap anahtarı, katılımcıların kâğıdında yer alan ilk 10 ve 15. soru için
kullanılacaktır. 11, 12, 13 ve 14. sorularla ilgili olarak herhangi bir değerlendirme
yapmayınız.
3. Değerlendirmenizi yaparken bir soruyu bütün katılımcılar için değerlendirdikten
sonra diğer sorulara geçiniz.
4. El yazısı, cümle yapısı gibi nicelikleri puanlandırmayınız.
5. Her soru için katılımcının cevap kâğıdında gördüğünüz ve cevap anahtarında yer alan maddeleri puanlandırınız. Her maddenin puanı o maddenin devamında parantez
içerisinde verilmiştir.
6. Katılımcının cevabı cevap anahtarındaki maddelere birebir uymuyor ise cevaba en
yakın olduğunu düşündüğünüz (eş anlamlı) maddeye gidiniz ve puanını en yakın
maddeye göre veriniz.
7. 15. soruda puanlandırmayı aşağıdaki kıstaslara uygun olarak yapınız.
7.1. Katılımcının yazdığı her kavram yanılgısına 1 puan veriniz.
7.2. Çürütücü ifadeleri puanlandırırken cevap anahtarında belirtilen çürütücü
ifadelerin puanlarını dikkate alınız. Her çürütücü ifadenin puanı, ifadenin devamında parantez içerisinde verilmiştir.
7.3. Katılımcı kavram yanılgısı yazmış ve kullandığı çürütücü ifade yanlış ise1 puan
veriniz.
8. Yönergede belirtilen durumların dışında herhangi bir puanlandırma yapmayınız.
160
CEVAP ANAHTARI
1. Soru İçin Cevap Dağılımı
a) İletken bir cisimde yükün nasıl dağıldığını bilmiyorlar. (0,25)
b) Birbirine dokunan cisimlerde potansiyel eşitliği ilkesini bilmiyor veya
uygulayamıyorlar. (0,25) c) İçi boş iletkene başka bir iletken cismi içeriden dokundurmak ile bir iletken tel
yardımıyla içeriye bağlanmak farklı şeylerdir. Öğrenciler bu durumu ayırt edemiyor ve X
cismini içerden dokundurulmuş gibi düşünüyorlar. (1,50)
2. Soru İçin Cevap Dağılımı
a) Yükleri yalnızca yarıçaplara göre dağıtmayı biliyorlar. (0,25)
b) Dokunma ve etki ile elektriklenme olaylarını karıştırıyorlar. Etki ile elektriklenmenin cisimlerin yük cinsine etki edeceğini ancak cisimler birbirine dokunduğu için yük
dağılımının dokunma ile elektriklenme kurallarına göre gerçekleşeceğini düşünüyorlar.
(1,00) c) Birbirine dokunan iletken cisimleri bir bütün olarak düşünemiyorlar. (0,25)
d) Yüklerin korunumu ilkesini ihmal ediyorlar. (0.25)
e) Çubuğun dokundurulduğunu yüklerin ise korunması gerektiğini düşünmüş olabilirler. (0.25)
3. Soru İçin Cevap Dağılımı
a) Elektron B noktasını geçtikten sonra kürenin sol tarafındaki (+) yükler tarafından daha büyük şiddetle çekilir, C noktasını geçtikten sonra ise kürenin sağ tarafındaki (+) yükler
tarafından daha büyük şiddetle çekilir, dolayısıyla kürenin içinden geçerken önce yavaşlar
sonra hızlanır şeklinde düşünüyorlar. (1,00) b) İçi boş iletken kürenin iç yüzeyinin nötr olacağını ve içeride elektrik alan olmayacağı
bilgisini bilmiyor veya uygulayamıyorlar. (0,50)
c) Elektriksel alanın olmadığı bir yerde yüklü bir cisme elektriksel kuvvet etki
edemeyeceğini düşünemiyorlar. (0,50)
4. Soru İçin Cevap Dağılımı
a) Elektroskobun yapraklarının ve topuzunun birbirleriyle temas halinde olmalarından dolayı, bir bütünmüş gibi düşünerek, daima aynı cins yük barındırması gerektiğini
düşünüyorlar. (1,00)
b) Etki ile elektriklenmede aynı işaretli yüklerin daima birbirinden en uzakta olan noktalarda toplanacağı bilgisini ihmal ediyorlar. (1,00)
5. Soru İçin Cevap Dağılımı
a) Topraktan elektron çekileceğini düşünemiyorlar ve topraklama da sadece (–) yüklerin toprağa aktığını düşünüyorlar. (0,50)
b) Önce toprağa yakın uçta (–) yüklerin, uzak uçta ise (+) yüklerin toplanacağını
düşünüyorlar. Sonra da (–) yüklerin (+) yüklere göre toprağa daha yakın olmalarından dolayı nötrleneceğini düşünüyorlar. Bu durum toprak bağlantısının cismin alışılagelen
tarafında değil ters tarafında olmasından oluyor. (0,75)
c) Bir cisim üzerinde topraklama ile yaratılacak etkinin, o cisme yaklaştırılan yüklü bir
cismin etkisinden daha şiddetli olacağını ve yaklaştırılan yüklü cismin yerküre karşısında kendine yakın uçta (–) yük tutamayacağını düşünüyorlar. (0,75)
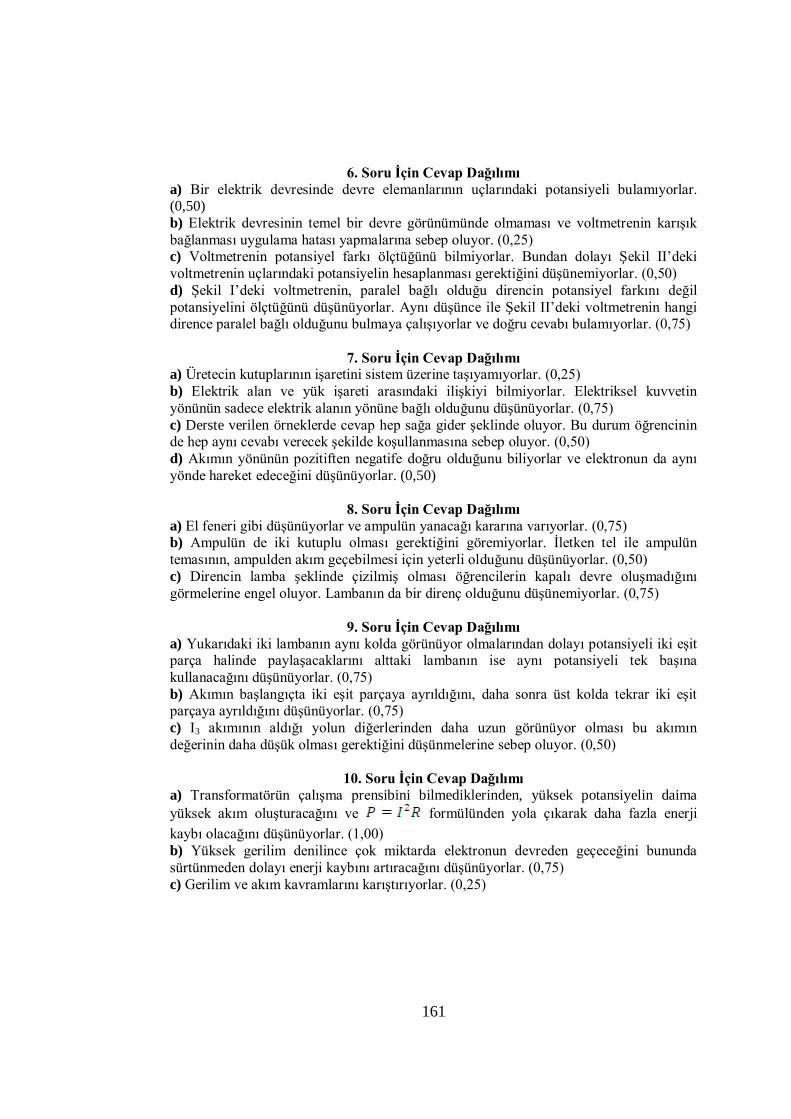
161
6. Soru İçin Cevap Dağılımı
a) Bir elektrik devresinde devre elemanlarının uçlarındaki potansiyeli bulamıyorlar. (0,50)
b) Elektrik devresinin temel bir devre görünümünde olmaması ve voltmetrenin karışık
bağlanması uygulama hatası yapmalarına sebep oluyor. (0,25) c) Voltmetrenin potansiyel farkı ölçtüğünü bilmiyorlar. Bundan dolayı Şekil II’deki
voltmetrenin uçlarındaki potansiyelin hesaplanması gerektiğini düşünemiyorlar. (0,50)
d) Şekil I’deki voltmetrenin, paralel bağlı olduğu direncin potansiyel farkını değil
potansiyelini ölçtüğünü düşünüyorlar. Aynı düşünce ile Şekil II’deki voltmetrenin hangi dirence paralel bağlı olduğunu bulmaya çalışıyorlar ve doğru cevabı bulamıyorlar. (0,75)
7. Soru İçin Cevap Dağılımı a) Üretecin kutuplarının işaretini sistem üzerine taşıyamıyorlar. (0,25)
b) Elektrik alan ve yük işareti arasındaki ilişkiyi bilmiyorlar. Elektriksel kuvvetin
yönünün sadece elektrik alanın yönüne bağlı olduğunu düşünüyorlar. (0,75)
c) Derste verilen örneklerde cevap hep sağa gider şeklinde oluyor. Bu durum öğrencinin de hep aynı cevabı verecek şekilde koşullanmasına sebep oluyor. (0,50)
d) Akımın yönünün pozitiften negatife doğru olduğunu biliyorlar ve elektronun da aynı
yönde hareket edeceğini düşünüyorlar. (0,50)
8. Soru İçin Cevap Dağılımı
a) El feneri gibi düşünüyorlar ve ampulün yanacağı kararına varıyorlar. (0,75) b) Ampulün de iki kutuplu olması gerektiğini göremiyorlar. İletken tel ile ampulün
temasının, ampulden akım geçebilmesi için yeterli olduğunu düşünüyorlar. (0,50)
c) Direncin lamba şeklinde çizilmiş olması öğrencilerin kapalı devre oluşmadığını
görmelerine engel oluyor. Lambanın da bir direnç olduğunu düşünemiyorlar. (0,75)
9. Soru İçin Cevap Dağılımı
a) Yukarıdaki iki lambanın aynı kolda görünüyor olmalarından dolayı potansiyeli iki eşit parça halinde paylaşacaklarını alttaki lambanın ise aynı potansiyeli tek başına
kullanacağını düşünüyorlar. (0,75)
b) Akımın başlangıçta iki eşit parçaya ayrıldığını, daha sonra üst kolda tekrar iki eşit parçaya ayrıldığını düşünüyorlar. (0,75)
c) I3 akımının aldığı yolun diğerlerinden daha uzun görünüyor olması bu akımın
değerinin daha düşük olması gerektiğini düşünmelerine sebep oluyor. (0,50)
10. Soru İçin Cevap Dağılımı
a) Transformatörün çalışma prensibini bilmediklerinden, yüksek potansiyelin daima
yüksek akım oluşturacağını ve formülünden yola çıkarak daha fazla enerji
kaybı olacağını düşünüyorlar. (1,00)
b) Yüksek gerilim denilince çok miktarda elektronun devreden geçeceğini bununda
sürtünmeden dolayı enerji kaybını artıracağını düşünüyorlar. (0,75)
c) Gerilim ve akım kavramlarını karıştırıyorlar. (0,25)
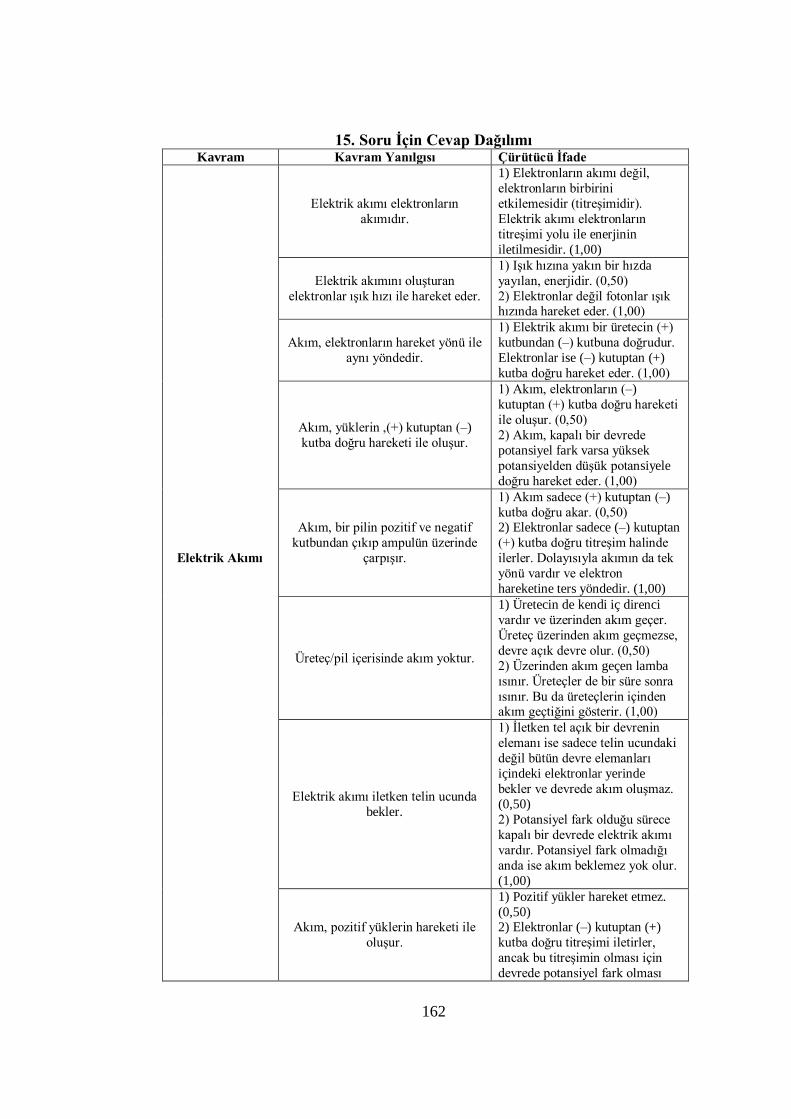
162
15. Soru İçin Cevap Dağılımı Kavram Kavram Yanılgısı Çürütücü İfade
Elektrik Akımı
Elektrik akımı elektronların
akımıdır.
1) Elektronların akımı değil,
elektronların birbirini
etkilemesidir (titreşimidir).
Elektrik akımı elektronların
titreşimi yolu ile enerjinin
iletilmesidir. (1,00)
Elektrik akımını oluşturan
elektronlar ışık hızı ile hareket eder.
1) Işık hızına yakın bir hızda
yayılan, enerjidir. (0,50)
2) Elektronlar değil fotonlar ışık hızında hareket eder. (1,00)
Akım, elektronların hareket yönü ile
aynı yöndedir.
1) Elektrik akımı bir üretecin (+)
kutbundan (–) kutbuna doğrudur.
Elektronlar ise (–) kutuptan (+)
kutba doğru hareket eder. (1,00)
Akım, yüklerin ,(+) kutuptan (–)
kutba doğru hareketi ile oluşur.
1) Akım, elektronların (–)
kutuptan (+) kutba doğru hareketi
ile oluşur. (0,50)
2) Akım, kapalı bir devrede
potansiyel fark varsa yüksek
potansiyelden düşük potansiyele
doğru hareket eder. (1,00)
Akım, bir pilin pozitif ve negatif
kutbundan çıkıp ampulün üzerinde
çarpışır.
1) Akım sadece (+) kutuptan (–)
kutba doğru akar. (0,50) 2) Elektronlar sadece (–) kutuptan
(+) kutba doğru titreşim halinde
ilerler. Dolayısıyla akımın da tek
yönü vardır ve elektron
hareketine ters yöndedir. (1,00)
Üreteç/pil içerisinde akım yoktur.
1) Üretecin de kendi iç direnci
vardır ve üzerinden akım geçer.
Üreteç üzerinden akım geçmezse,
devre açık devre olur. (0,50)
2) Üzerinden akım geçen lamba
ısınır. Üreteçler de bir süre sonra
ısınır. Bu da üreteçlerin içinden akım geçtiğini gösterir. (1,00)
Elektrik akımı iletken telin ucunda
bekler.
1) İletken tel açık bir devrenin
elemanı ise sadece telin ucundaki
değil bütün devre elemanları
içindeki elektronlar yerinde
bekler ve devrede akım oluşmaz.
(0,50)
2) Potansiyel fark olduğu sürece
kapalı bir devrede elektrik akımı
vardır. Potansiyel fark olmadığı
anda ise akım beklemez yok olur.
(1,00)
Akım, pozitif yüklerin hareketi ile
oluşur.
1) Pozitif yükler hareket etmez.
(0,50) 2) Elektronlar (–) kutuptan (+)
kutba doğru titreşimi iletirler,
ancak bu titreşimin olması için
devrede potansiyel fark olması
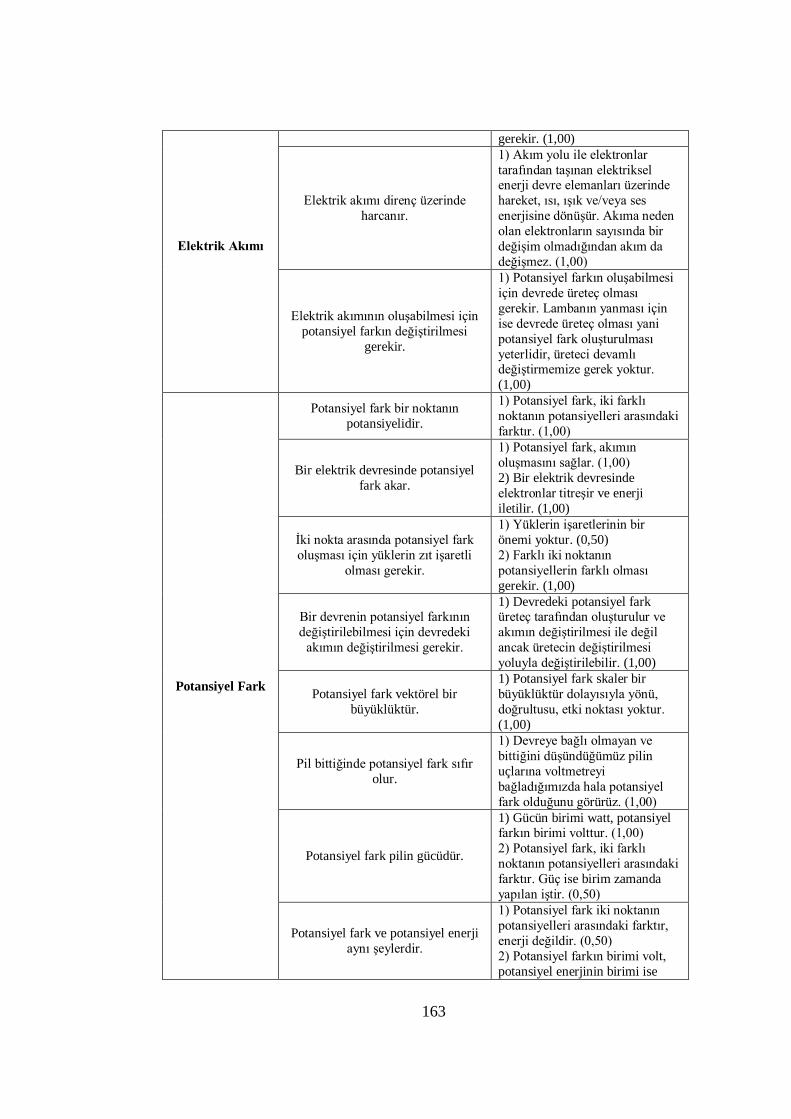
163
Elektrik Akımı
gerekir. (1,00)
Elektrik akımı direnç üzerinde
harcanır.
1) Akım yolu ile elektronlar
tarafından taşınan elektriksel enerji devre elemanları üzerinde
hareket, ısı, ışık ve/veya ses
enerjisine dönüşür. Akıma neden
olan elektronların sayısında bir
değişim olmadığından akım da
değişmez. (1,00)
Elektrik akımının oluşabilmesi için
potansiyel farkın değiştirilmesi
gerekir.
1) Potansiyel farkın oluşabilmesi
için devrede üreteç olması
gerekir. Lambanın yanması için
ise devrede üreteç olması yani
potansiyel fark oluşturulması
yeterlidir, üreteci devamlı değiştirmemize gerek yoktur.
(1,00)
Potansiyel Fark
Potansiyel fark bir noktanın
potansiyelidir.
1) Potansiyel fark, iki farklı
noktanın potansiyelleri arasındaki
farktır. (1,00)
Bir elektrik devresinde potansiyel
fark akar.
1) Potansiyel fark, akımın
oluşmasını sağlar. (1,00)
2) Bir elektrik devresinde
elektronlar titreşir ve enerji
iletilir. (1,00)
İki nokta arasında potansiyel fark
oluşması için yüklerin zıt işaretli
olması gerekir.
1) Yüklerin işaretlerinin bir
önemi yoktur. (0,50)
2) Farklı iki noktanın
potansiyellerin farklı olması
gerekir. (1,00)
Bir devrenin potansiyel farkının
değiştirilebilmesi için devredeki
akımın değiştirilmesi gerekir.
1) Devredeki potansiyel fark üreteç tarafından oluşturulur ve
akımın değiştirilmesi ile değil
ancak üretecin değiştirilmesi
yoluyla değiştirilebilir. (1,00)
Potansiyel fark vektörel bir
büyüklüktür.
1) Potansiyel fark skaler bir
büyüklüktür dolayısıyla yönü,
doğrultusu, etki noktası yoktur.
(1,00)
Pil bittiğinde potansiyel fark sıfır
olur.
1) Devreye bağlı olmayan ve
bittiğini düşündüğümüz pilin
uçlarına voltmetreyi
bağladığımızda hala potansiyel
fark olduğunu görürüz. (1,00)
Potansiyel fark pilin gücüdür.
1) Gücün birimi watt, potansiyel farkın birimi volttur. (1,00)
2) Potansiyel fark, iki farklı
noktanın potansiyelleri arasındaki
farktır. Güç ise birim zamanda
yapılan iştir. (0,50)
Potansiyel fark ve potansiyel enerji
aynı şeylerdir.
1) Potansiyel fark iki noktanın
potansiyelleri arasındaki farktır,
enerji değildir. (0,50)
2) Potansiyel farkın birimi volt,
potansiyel enerjinin birimi ise
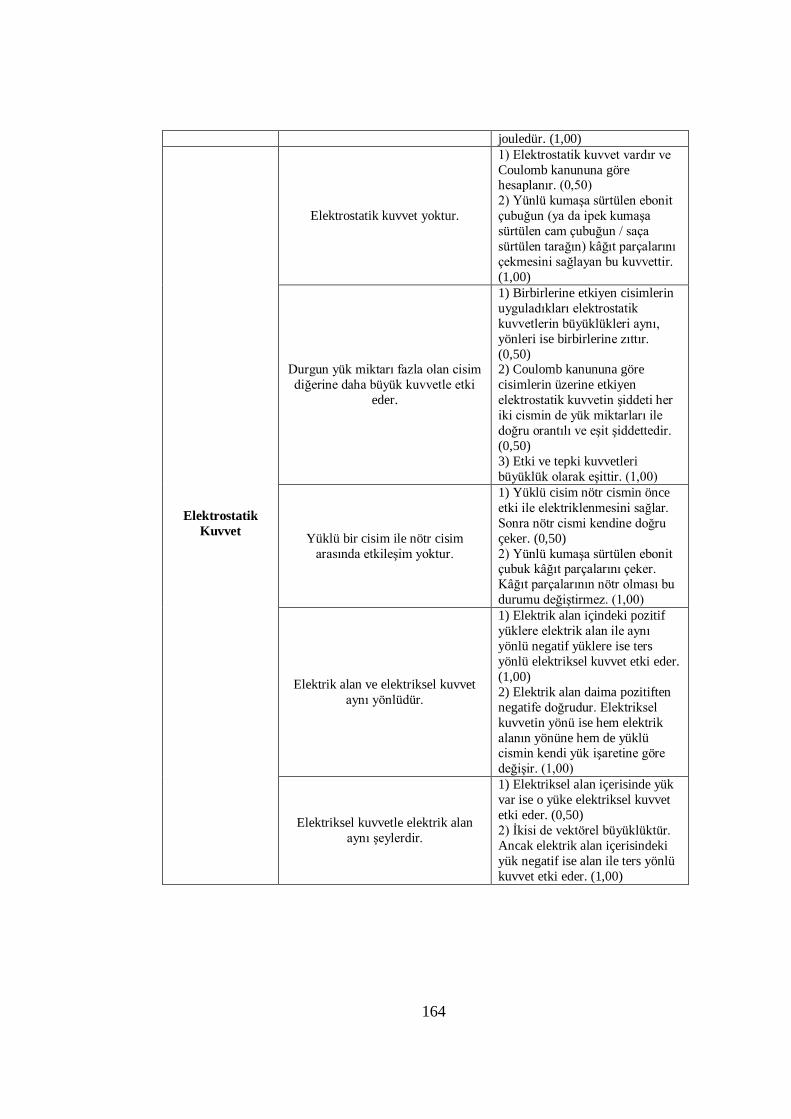
164
jouledür. (1,00)
Elektrostatik
Kuvvet
Elektrostatik kuvvet yoktur.
1) Elektrostatik kuvvet vardır ve
Coulomb kanununa göre hesaplanır. (0,50)
2) Yünlü kumaşa sürtülen ebonit
çubuğun (ya da ipek kumaşa
sürtülen cam çubuğun / saça
sürtülen tarağın) kâğıt parçalarını
çekmesini sağlayan bu kuvvettir.
(1,00)
Durgun yük miktarı fazla olan cisim
diğerine daha büyük kuvvetle etki
eder.
1) Birbirlerine etkiyen cisimlerin
uyguladıkları elektrostatik
kuvvetlerin büyüklükleri aynı,
yönleri ise birbirlerine zıttır.
(0,50) 2) Coulomb kanununa göre
cisimlerin üzerine etkiyen
elektrostatik kuvvetin şiddeti her
iki cismin de yük miktarları ile
doğru orantılı ve eşit şiddettedir.
(0,50)
3) Etki ve tepki kuvvetleri
büyüklük olarak eşittir. (1,00)
Yüklü bir cisim ile nötr cisim
arasında etkileşim yoktur.
1) Yüklü cisim nötr cismin önce
etki ile elektriklenmesini sağlar.
Sonra nötr cismi kendine doğru
çeker. (0,50)
2) Yünlü kumaşa sürtülen ebonit çubuk kâğıt parçalarını çeker.
Kâğıt parçalarının nötr olması bu
durumu değiştirmez. (1,00)
Elektrik alan ve elektriksel kuvvet
aynı yönlüdür.
1) Elektrik alan içindeki pozitif
yüklere elektrik alan ile aynı
yönlü negatif yüklere ise ters
yönlü elektriksel kuvvet etki eder.
(1,00)
2) Elektrik alan daima pozitiften
negatife doğrudur. Elektriksel
kuvvetin yönü ise hem elektrik
alanın yönüne hem de yüklü cismin kendi yük işaretine göre
değişir. (1,00)
Elektriksel kuvvetle elektrik alan
aynı şeylerdir.
1) Elektriksel alan içerisinde yük
var ise o yüke elektriksel kuvvet
etki eder. (0,50)
2) İkisi de vektörel büyüklüktür.
Ancak elektrik alan içerisindeki
yük negatif ise alan ile ters yönlü
kuvvet etki eder. (1,00)
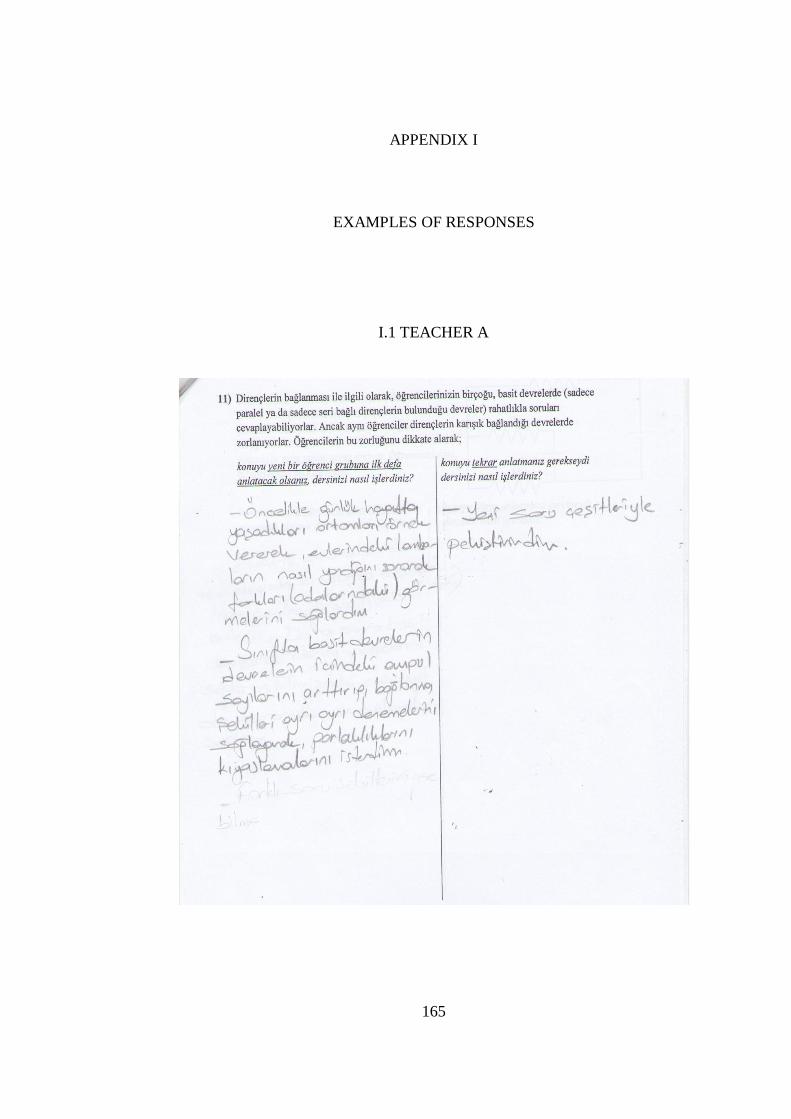
165
APPENDIX I
EXAMPLES OF RESPONSES
I.1 TEACHER A

166
I.2 TEACHER B
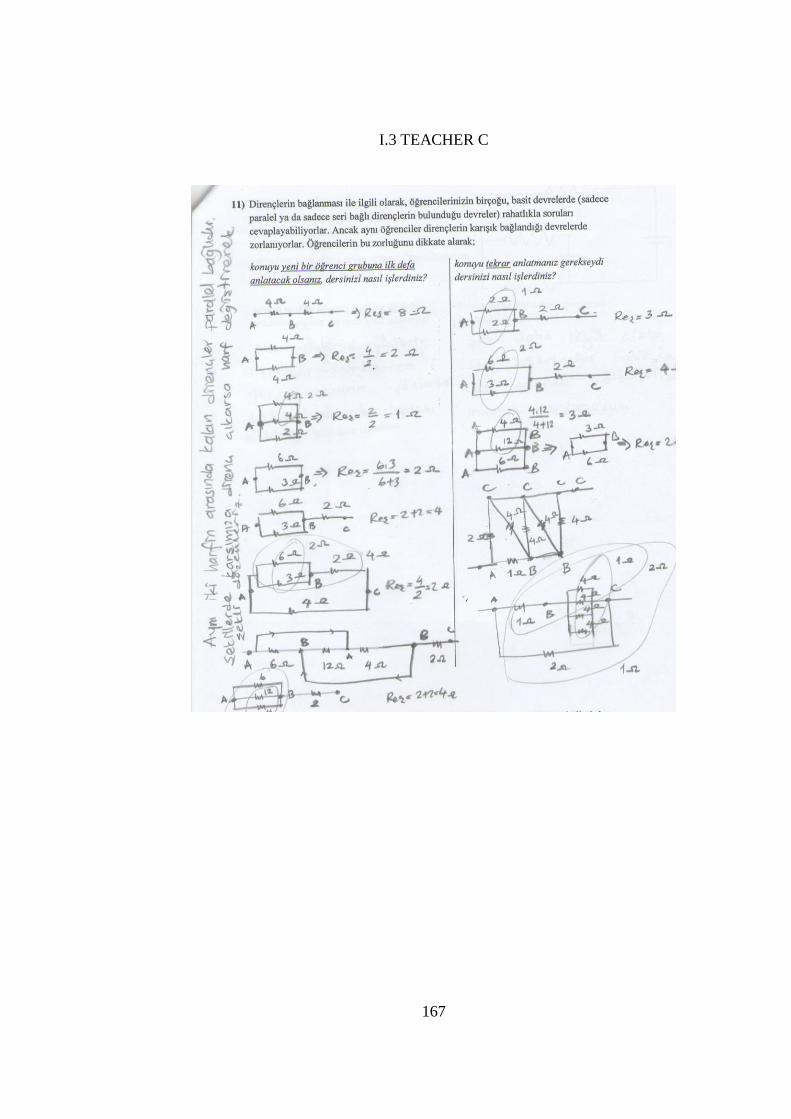
167
I.3 TEACHER C
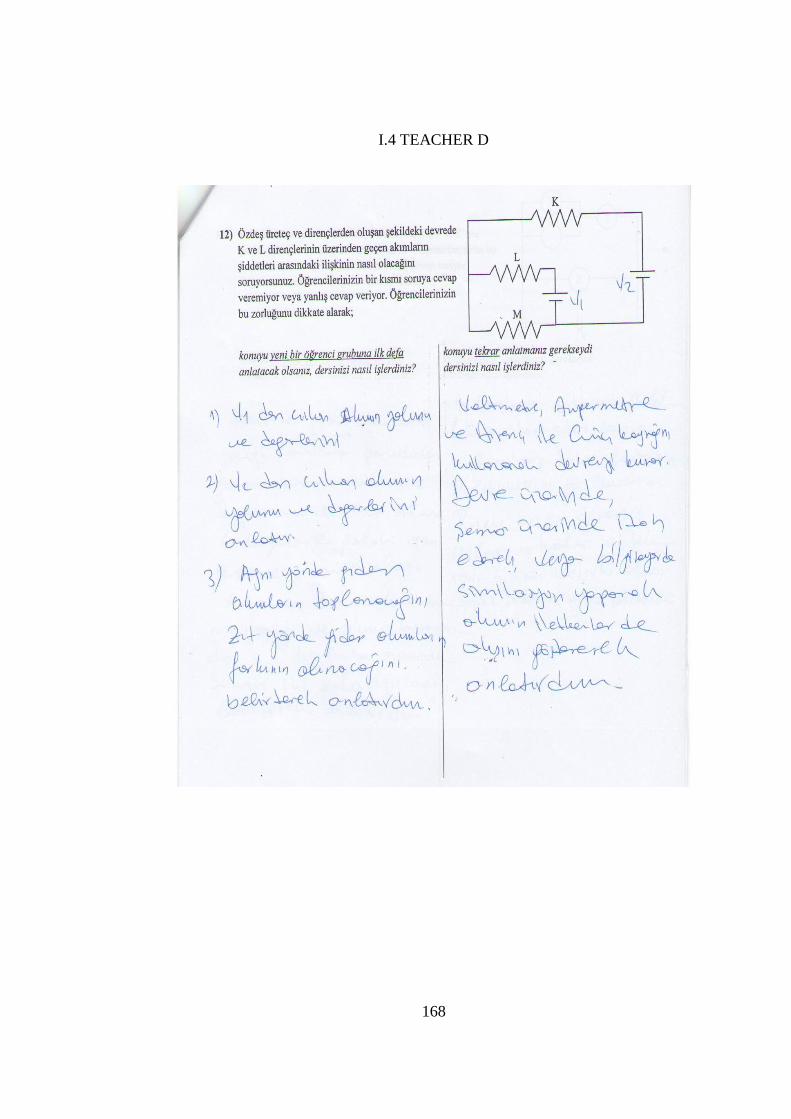
168
I.4 TEACHER D
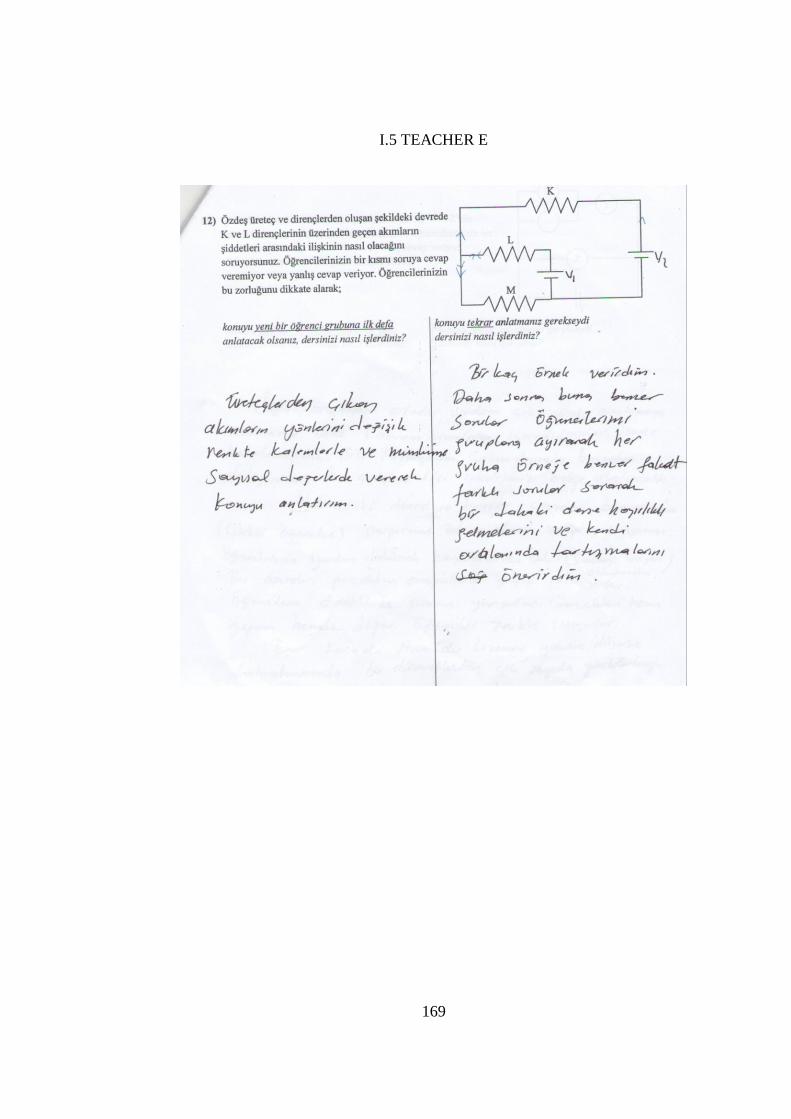
169
I.5 TEACHER E
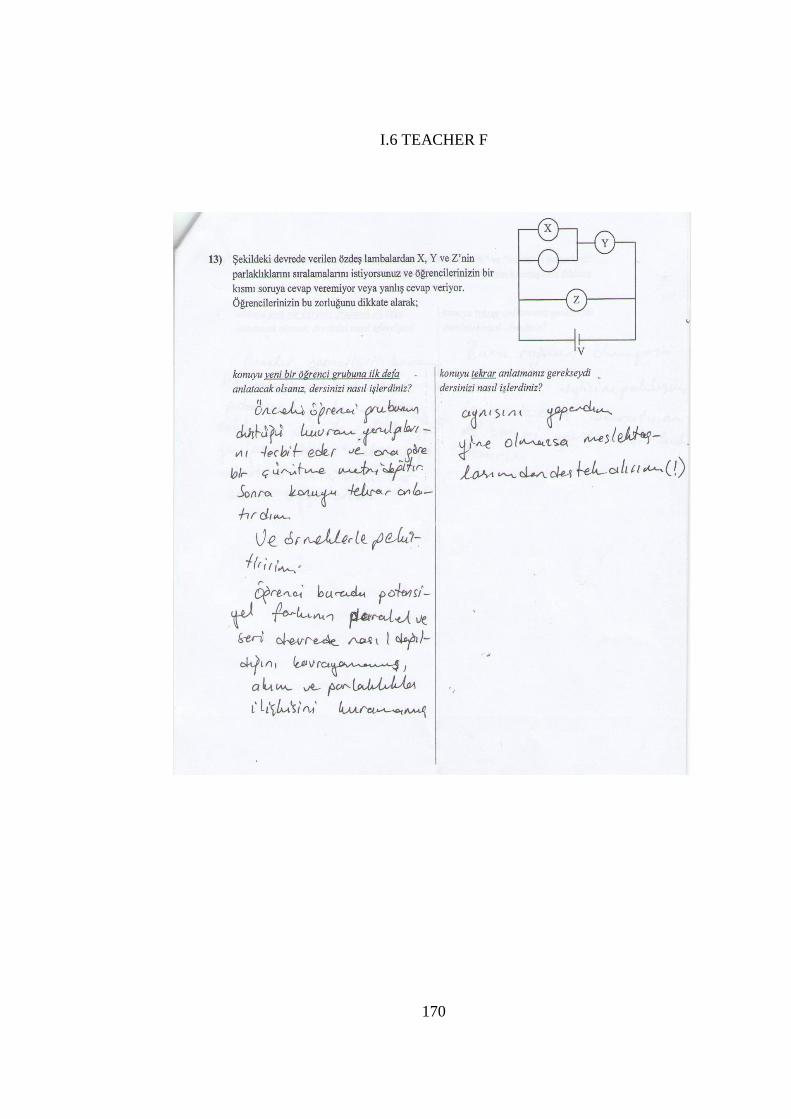
170
I.6 TEACHER F
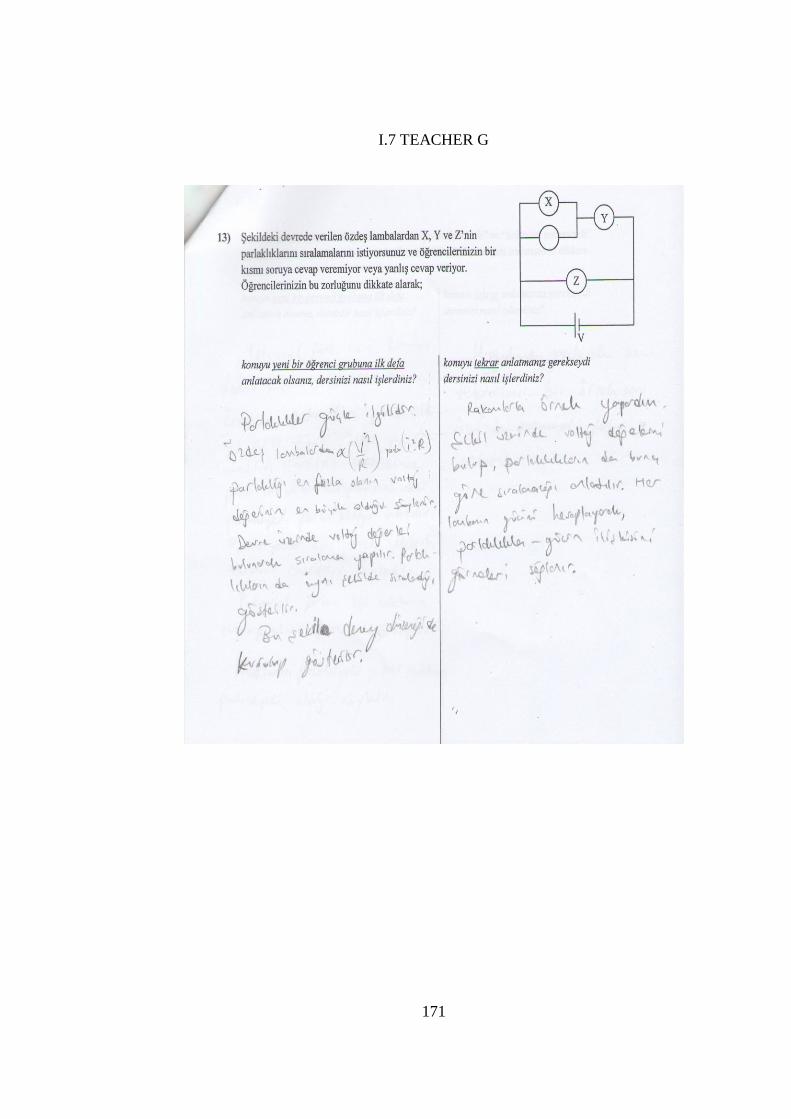
171
I.7 TEACHER G
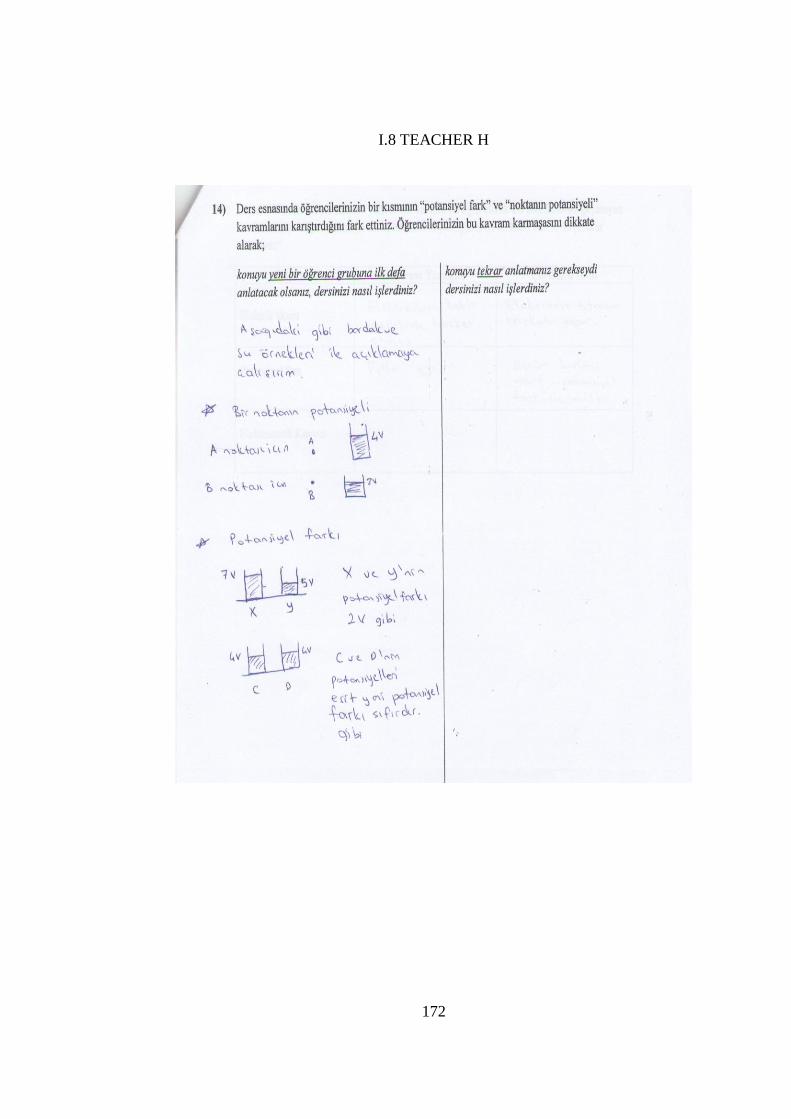
172
I.8 TEACHER H
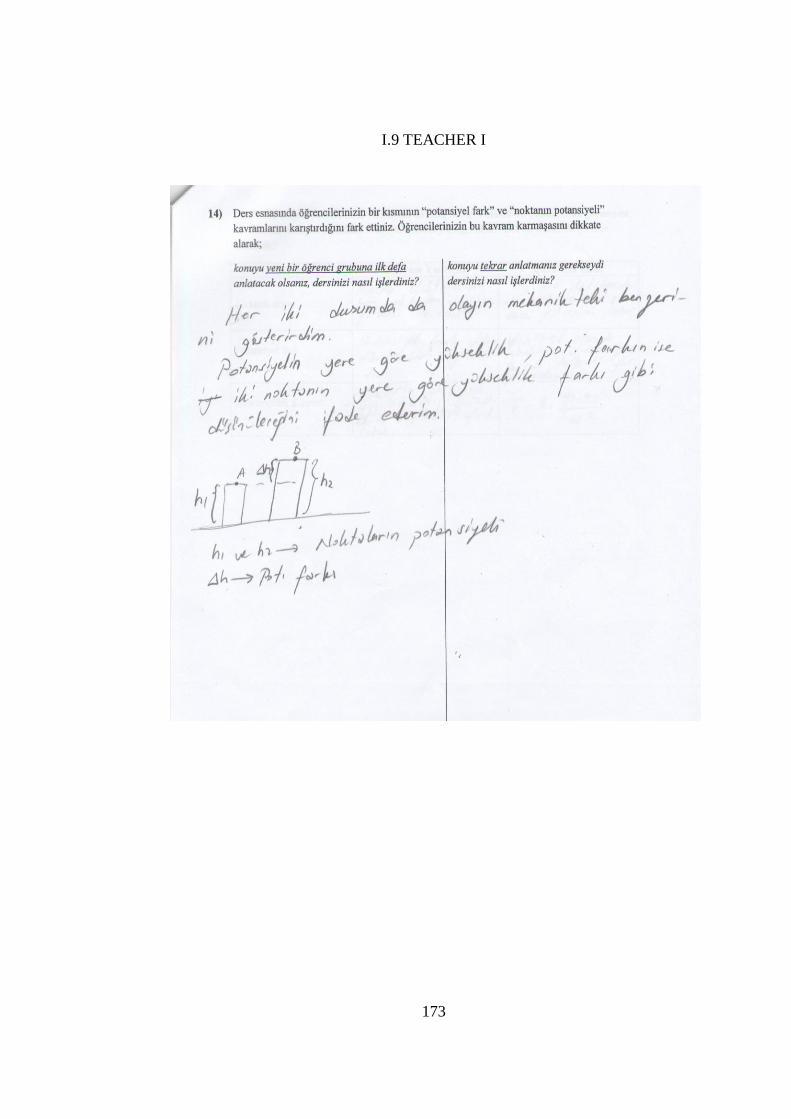
173
I.9 TEACHER I
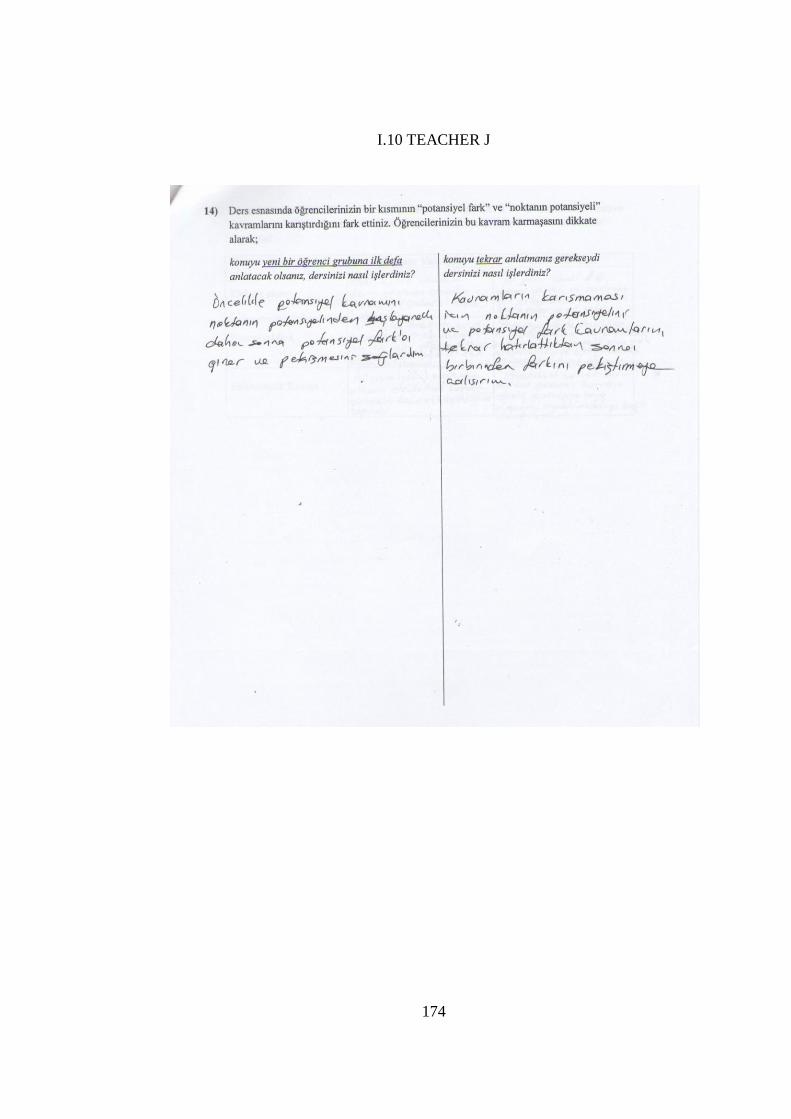
174
I.10 TEACHER J
175
CURRICULUM VITAE
PERSONAL INFORMATION
Surname, Name: Bahçivan, Eralp
Nationality: Turkish (TC)
Date and Place of Birth: 02 December 1980, Aksaray
Marital Status: Married
Phone: +90 505 388 8689
E-mail: [email protected]
EDUCATION
Degree Institution Year of Graduation
BA Middle East Technical University 2005
Physics Education
WORK EXPERIENCE
2007- EU Project Specialist
International Relations Office of Ahi Evran University
2005-2007 Physics teacher in private sector
RESEARCH INTERESTS
- Science teacher knowledge
- Professional development of science teachers