assessment of ground compaction using multi-channel
TRANSCRIPT
HAL Id: hal-01025230https://hal-brgm.archives-ouvertes.fr/hal-01025230
Submitted on 17 Jul 2014
HAL is a multi-disciplinary open accessarchive for the deposit and dissemination of sci-entific research documents, whether they are pub-lished or not. The documents may come fromteaching and research institutions in France orabroad, or from public or private research centers.
L’archive ouverte pluridisciplinaire HAL, estdestinée au dépôt et à la diffusion de documentsscientifiques de niveau recherche, publiés ou non,émanant des établissements d’enseignement et derecherche français ou étrangers, des laboratoirespublics ou privés.
Assessment of ground compaction using multi-channelanalysis of surface wave data and cone penetration tests
Adnand Bitri, Kevin Samyn, Stéphane Brulé, Emmanuel Javelaud
To cite this version:Adnand Bitri, Kevin Samyn, Stéphane Brulé, Emmanuel Javelaud. Assessment of ground compactionusing multi-channel analysis of surface wave data and cone penetration tests. Near Surface Geo-physics, European Association of Geoscientists and Engineers (EAGE), 2013, 11 (6), pp.683-690.�10.3997/1873-0604.2013037�. �hal-01025230�

© 2013 European Association of Geoscientists & Engineers 683
Near Surface Geophysics, 2013, 11, 683-690 doi: 10.3997/1873-0604.2013037
Assessment of ground compaction using multi-channel analysis of surface wave data and cone penetration tests
A. Bitri1*, K. Samyn1, S. Brûlé2 and E.H. Javelaud2
1 BRGM, Bureau de Recherches Géologiques et Minières, Risks Department, 3 Avenue Claude Guillemin BP36009 45060 Orléans Cedex 2, France
2 Ménard, 2 rue Gutenberg, BP28, 91620 Nozay, France
Received March 2012, revision accepted May 2013
ABSTRACTThe construction of a new industrial and commercial area in 2009 at the Givors’ former glass fac-tory area in France involved heavy dynamic compaction work. For the purpose of founding the new buildings, it was necessary to improve the ground mechanical properties of 7–15 m of well-graded gravel backfill lying on geotechnical bedrock. In order to assess the quality and depth of ground compaction, cone penetration tests are often performed before and after compaction. The method is intrusive and a one-location test. It requires a substantial amount of time to evaluate a large area and evaluation quality is quite dependent on the operation technique and soil type. In this paper, the quality and extent of ground compaction were evaluated using results from the in situ Multi-Channel Analysis of Surface Waves (MASW) seismic method and cone penetration tests (CPT). MASW tests were used to determine shear-wave velocity (Vs) profiles before and after compaction and CPT tests were adopted to determine the correlation between Vs and the measured penetration resistance (qc) improvement along profiles. The results of this study show the effectiveness of sur-face waves for the evaluation of compaction performance and demonstrate the potential of this technique to engineering and environmental problems.
image of dispersion energy in the frequency velocity (f-c) domain. A high-resolution image leads to an accurate picking of dispersion curves and helps to separate fundamental and higher propagation modes of surface waves. Several methods allow to obtain dispersion images such as the F-K transform (Gabriels et al. 1987), tau-p transform (McMechan and Yeldin 1981; Moktar et al. 1988), phase shift method (Park et al. 1998) and linear Radon transform (Luo et al. 2008). Modelling results (Park et al. 1998) show that the resolution of a dispersion image is mainly influenced by the geophone spread length. The resolution increases as the geophone spread increases.
Estimating Vs variations with depth is tackled as an inverse problem for which the phase velocity variations with frequency constitute the observations. Several inverse methods used in seismology have already been proposed to resolve such a prob-lem. Dorman and Ewing (1962) used surface waves to determine elastic properties of crustal-mantle structures. Engineering prob-lems were tackled in Nazarian and Stokoe (1984) where a ham-mer was used as an impulsive source for generating Rayleigh waves while ground motions were recorded from two seismic sensors. The dispersion was afterwards derived from the spec-trum of recorded vertical motions. Addo and Robertson (1992) also used the same approach and validated the method on six different sites by comparing Spectral Analysis of Surface Wave
INTRODUCTIONEvaluation of soil geotechnical parameters is a preliminary task to be conducted either for designing building foundations, or for studying site effects in seismic hazard evaluation. Both of these applications show the importance of knowing soil elastic proper-ties, which govern its behaviour in presence of natural or human solicitations. Shear-wave velocity (Vs) is usually taken as a good indicator of the elastic behaviour of soils and is classically esti-mated from cross-hole measurements. In order to avoid destruc-tive and expensive testing, we study here the possibility to esti-mate the quality and depth of ground compaction using Vs distri-bution with depth obtained by the Multi-Channel Analysis of Surface Waves (MASW) method (Park et al. 1999). This method studies surface wave dispersion i.e., variation of phase velocity (c) with frequency (f). The technique consists in: 1) data acquisi-tion using a multichannel recording system; 2) dispersion curve picking; 3) inversion of dispersion curve. Surface waves are easy to generate by impact sources or vibrators and are mostly sensi-tive to shear- wave velocity. The determination of Vs profiles from surface waves is attractive since their propagation velocity, i.e., phase velocity, highly depends on the stiffness-depth profile.An important step in the MASW method is to generate a reliable

A. Bitri et al.684
© 2013 European Association of Geoscientists & Engineers, Near Surface Geophysics, 2013, 11, 683-690
that were performed before and after dynamic compaction on this test area are shown in Fig. 2. The groundwater level is about 6 m below the surface. Initial investigations and geotechnical feasibility studies have recommended pile or micropile foundations, embed-ded in compact sand and gravel at 12–15 m depth. In fact, deep piles could impact the water resource, blending the superficial pol-luted soil and water with the deeper ones.
DYNAMIC COMPACTIONDynamic compaction is a cost attractive ground improvement technique for brownsites especially when thick, heterogeneous and polluted backfills have to be densified.
‘High Energy’ Dynamic Compaction (HDCTM) work was performed in 2009 at the Givors’ former glass factory area in France. For the purpose of founding the new buildings, the objective was to improve the ground mechanical properties of 7–15 m of well-graded gravel backfills laying on geotechnical bedrock composed of sediments of the Gier river.
For granular soils, dynamic compaction tends towards an improved soil with more homogeneous properties than initially. Therefore, for this 85 000 m² building project, the heavy com-paction work increased the density of the ground by means of energy applied by ponder (m = 27 000 Kg) free-dropped on the soil surface from various heights (H
dro = 20–25 m) with a square
print grid (Fig. 3). It led to a large-scale ground improvement.
(SASW) (Nazarian and Stokoe 1984) inverted results and cone penetration test (CPT) data. The evaluation of ground densifica-tion using SASW and resonant column (RC) tests was performed by Kim and Park (1999). Gabriels et al. (1987) and Karray et al. (2010) improved the method by taking into account higher propagation modes of Rayleigh waves and by increasing the distance between the sources and receivers. Xia et al. (1999a) proposed an inverse method based on the Levenberg-Marquart technique. Recently, inversion of the full-waveform has been proposed in order to overcome the limitations of the usual approach based on the inversion of a dispersion curve (Forbriger 2003a,b; Romdham et al. 2011.). The Linearized Least-Squares (LLS) technique used for this study is adapted from Hermann (1987) and was already tested in Bitri et al. (1998).
The purpose of this paper is to present and discuss the results of our methodology based on a surface wave method for the assessment of the quality and depth of ground compaction on the studied site.
SITE DESCRIPTIONThe project is located on the Givors’ former glass factory area along the Gier river. The site was occupied for over a century by industrial activities. The plant was dismantled recently (Fig. 1a) and the construction of new industrial and commercial buildings is planned (Fig. 1b). For the purpose of building and founding these structures, a ground improvement technique was proposed by engi-neers to meet the dual problem of soils with low-mechanical prop-erties and environmental issues resulting from a chemical residual impact of former industrial activities on the soil and water. A compaction program was developed in order to improve the back-fills overlying sand and gravel deposited by the Gier river. Particle size analysis of five samples taken at 2 m depth and average friction ratio (f) clarified that the filling material is of sand type. According to geotechnical available reports, the average mechanical character-istics of the backfills are: q
c = 3.7 MPa, f = f
s / q
c ~ 1%,
pl* = 0.53 MPa and EM = 8.2 Mpa where qc is the measured cone
resistance obtained during CPT tests, fs the friction ratio obtained
during CPT tests and pl* and EM are breaking limit pressures. For the purpose of assessing the quality and depth of the ground com-paction procedure, preliminary tests were realized over a 160 x 35 m area (Figs 1 and 2). The positions of the four parallel seismic lines (A, B, C and D) and the five CPTs (B3, B15, C8, D3 and D15)
FIGURE 1
a) Photograph of the dismantled
Givors’ former glass factory site,
purpose of the dynamic compac-
tion project; b) conceptual 3D
view of the new industrial and
commercial area. (from Givors
Development, by courtesy)
FIGURE 2
Localization of the 160 x 35 m test area on the dismantled Givors’ former
glass factory site. The four parallel seismic lines (A, B, C and D) are
highlighted in red solid lines and the five CPTs (B3, B15, C8, D3 and
D15) are marked using black circles. (Adapted from Brûlé et al. 2010b)

Ground compaction using surface wave data and cone penetration tests 685
© 2013 European Association of Geoscientists & Engineers, Near Surface Geophysics, 2013, 11, 683-690
Low-frequency waves with longer wavelengths propagate through the near-surface layers and also deeper layers. Therefore, by using surface waves over a wide range of frequencies, one can effectively sample different portions of the material profile (Richart et al. 1970).
Vs reference models before compaction were established in September 2009 along four linear parallel lines (A, B, C and D) on the test area (Fig. 2). The second surface wave investigations were carried out at the end of October 2009, after heavy dynam-ic compaction on the same lines in order to assess the effect of compaction.
To increase the speed and efficiency of data recording and thereby keep acquisition costs down, a multichannel seismic cable was designed and manufactured. It consists in 24 geo-phones at fixed 2 m intervals. Each geophone is attached to a single self-orientating, gimbals-mounted, vertical geophone with 10 Hz central frequency. To help ensure proper coupling, each gimbal geophone is housed in a heavy casing (~1 kg). To damp the motion of the sensor around its rotational axis, the inside of the casing is filled with viscous oil. The seismic cable is towed behind a vehicle. A 24-channel Geometrics Stratavizor seismo-graph was used to record impacts of a 10 kg hammer seismic source. The source-to-nearest-receiver offset was 4 m, whilst the increment between source locations along the seismic lines was 10 m. The general configuration of receivers and sources in the MASW test is shown in Fig. 4. The record length was selected as 1024 ms at 1 ms sample intervals.
The most critical part of surface wave analysis is the accurate estimation of dispersion curves (i.e., phase velocity as a function of frequency) and surface wave mode. The dispersion patterns were imaged with the slant-stack method in a common shot gather, followed by a 1D Fourier transform over the intercept time (McMechan and Yeldin 1981; Moktar et al. 1988). The transformation procedure can by described by the following expression:
(1)
where c is the phase velocity, N is the number of traces in the shot gather, B(f) is the amplitude spectrum of the first trace, A(x
i,
f) is the amplitude spectrum of the trace at distance xi and ϕ
i is
its phase spectrum. The dispersion curve is obtained by picking
The energy brought at each drop is more than 4000 kJ and the velocity of the ponder impacting the soil is about 20–25 m/s. Ponder drops create compaction craters (Fig. 3) that are filled using the same material before being compacted again. This way, there is no change in the lithology. At the final stage of compac-tion, the elevation of the area is globally changed by about a –50 to –80 cm downwards vertical translation. In the rest of the study, we assume that this difference in elevation can be considered negligible.
SHEAR-WAVE (Vs) PROFILINGMASW is an effective tool for obtaining vertical shear-wave profiles from a single non-invasive measurement. The method was developed by the Kansas Geological Survey and can be used with active or passive sources (Song et al. 1989; Xia et al. 1999a; Park et al. 1999; Park et al. 2007).
Numerical relationships between soil mechanical properties and Vs have been previously published. One of these relation-ships, which is given by the elastic theory and is an essential property for evaluating dynamic responses and the stiffness of soil, is the small-strain shear modulus, G. Vs is a valuable indica-tor of the dynamic properties of soil and rock because of its relation with G, given by the equation G =ρVs2, where soil den-sity ρ is the total unit weight of the soil divided by gravity. G has units force per length squared (i.e., kPa). This relation demon-strates the good correlation of Vs to soil mechanical properties, which are improved during compaction stages and allow for the expectation of a Vs increase after ground compaction.
The MASW method is based on dispersive characteristics of surface waves. The accepted rule of thumb for the maximum penetration depth in dispersive media is approximately half the longest wavelength. In layered media, the velocity propagation of surface waves depends on the frequency (or wavelength) of the wave because waves of different wavelengths sample differ-ent parts of the layered medium. For example, high-frequency (short wavelength) waves propagate only in near-surface layers.
FIGURE 3
a) Schematic representation of the ‘High Energy’ dynamic compaction
(HDCTM) procedure; b) photograph of a 27 000 Kg ponder free-dropped
on the soil surface.
FIGURE 4
MASW test field configuration.

A. Bitri et al.686
© 2013 European Association of Geoscientists & Engineers, Near Surface Geophysics, 2013, 11, 683-690
described by Xia et al. (1999a). Figure 6 shows the initial models obtained before and after dynamic compaction using this relation and the mean resolution factor of dispersion curves picking. On this figure we observe increased c (around 40 m/s) from 0–8 m depth after dynamic compaction. Below 8 m depth, c appears to be more or less unchanged. The mean resolution factor shows that the picking accuracy of the dispersion curves decreases with depth. According to this observation, a lower confidence is given to estimated velocities at high depths.
Each dispersion curve was then individually inverted into a 1D depth/Vs profile. A 2D matrix of Vs was produced by gather-ing all 1D Vs profiles into sequential order according to the sur-face coordinate at the midpoint of the spread, the common pro-cedure described by Park (2005). Ten iterations for inverting velocities and ten more for inverting layers thickness were neces-sary to converge to the final model. This allowed a root mean square error between the measured and calculated dispersion curves less than 5%. The LLS inversion technique used for this study is adapted from Hermann (1987).
CONE PENETRATION TESTAs described in Lunne et al. (1997), in the CPT, a cone on the end of a series of rods is pushed into the ground at a constant
the maximal values of the U(c,f) modulus. If the seismic signal in the shot gather consists in single noise free surface wave mode, the maximum value of the U(c,f) modulus should be equal to N. If this value is smoother then N, than we can attribute this to an error in the phase velocity between the traces in the shot gather (Hermann 1987).
O’Neill (2003) evaluated, by numerical and field repeatability testing, the error envelopes of dispersion curves determined using equation (1). The observation was a large increase in the phase velocity standard deviation at low frequency, often exceed-ing 30%, although at the highest frequencies it is 1% or less. In order to qualitatively assess the reliability of the data, a resolu-tion factor of picking is computed considering the balanced inverse velocity standard deviation in the dispersion patterns according to the frequency, as described by O’Neill (2003).
Typical seismic shot gathers before and after dynamic com-paction, with the related dispersion f-c images showing the fun-damental mode, are presented in Fig. 5(a,b). One can see here the c for high frequencies (from 15 Hz) after dynamic compaction. The initial models for the inversion process of dispersion curves were obtained by converting f-c curves and the resolution factor as a function of the frequency in the depth-velocity domain (depth-c) using the empirical relation of a half wavelength
FIGURE 5
Typical seismic shot gathers of line C before (a) and after (b) compac-
tion, with the related dispersion f-c images. The reference fundamental
mode before compaction overlays both f-c images in black solid lines.
Here we observe the c shift for high frequencies (from 15 Hz) between
fundamental modes before and after dynamic compaction.
FIGURE 6
Depth-c converted dispersion curves used as initial models before and
after dynamic compaction obtained along the seismic lines A, B, C and
D. The mean resolution factor of dispersion curves picking overlays the
plot in red solid lines. We observe the increased c (around 40 m/s) from
0–8 m depth after dynamic compaction.
Ground compaction using surface wave data and cone penetration tests 687
© 2013 European Association of Geoscientists & Engineers, Near Surface Geophysics, 2013, 11, 683-690
2 cm intervals. CPT for geotechnical applications was standard-ized in 1986 by ASTM Standard D 3441 (ASTM 2004).
The qc reference soundings before compaction were estab-
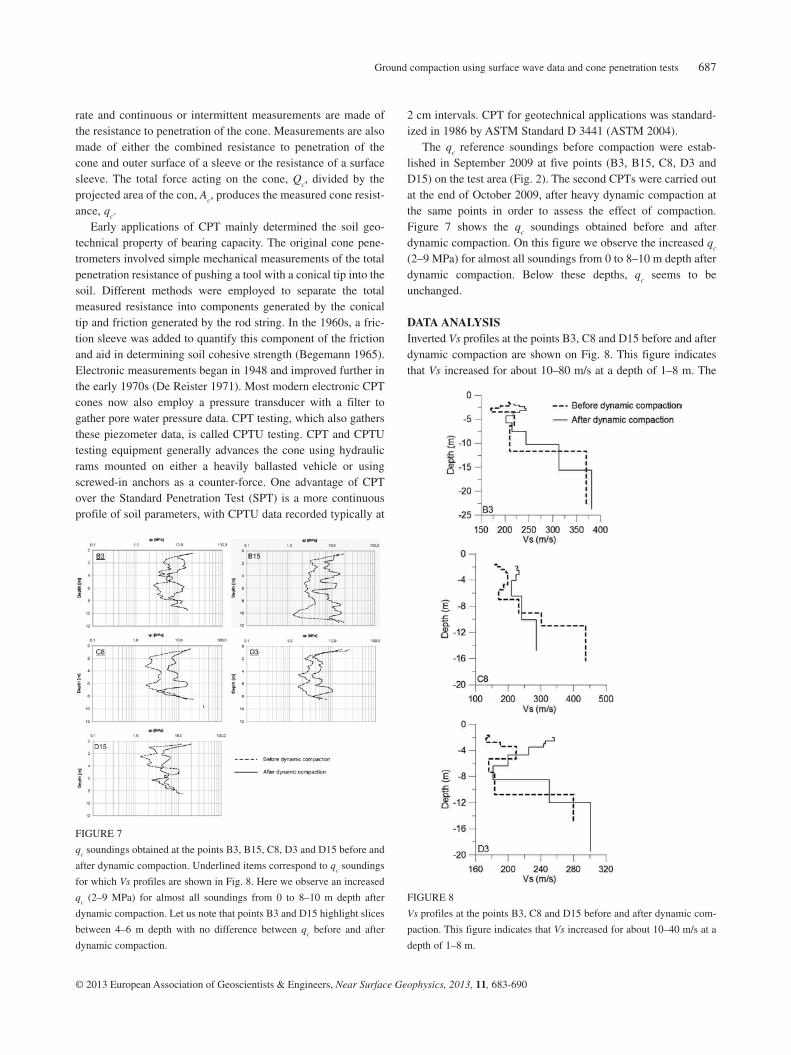
lished in September 2009 at five points (B3, B15, C8, D3 and D15) on the test area (Fig. 2). The second CPTs were carried out at the end of October 2009, after heavy dynamic compaction at the same points in order to assess the effect of compaction. Figure 7 shows the q
c soundings obtained before and after
dynamic compaction. On this figure we observe the increased qc
(2–9 MPa) for almost all soundings from 0 to 8–10 m depth after dynamic compaction. Below these depths, q
c seems to be
unchanged.
DATA ANALYSISInverted Vs profiles at the points B3, C8 and D15 before and after dynamic compaction are shown on Fig. 8. This figure indicates that Vs increased for about 10–80 m/s at a depth of 1–8 m. The
rate and continuous or intermittent measurements are made of the resistance to penetration of the cone. Measurements are also made of either the combined resistance to penetration of the cone and outer surface of a sleeve or the resistance of a surface sleeve. The total force acting on the cone, Q
c, divided by the
projected area of the con, Ac, produces the measured cone resist-
ance, qc.
Early applications of CPT mainly determined the soil geo-technical property of bearing capacity. The original cone pene-trometers involved simple mechanical measurements of the total penetration resistance of pushing a tool with a conical tip into the soil. Different methods were employed to separate the total measured resistance into components generated by the conical tip and friction generated by the rod string. In the 1960s, a fric-tion sleeve was added to quantify this component of the friction and aid in determining soil cohesive strength (Begemann 1965). Electronic measurements began in 1948 and improved further in the early 1970s (De Reister 1971). Most modern electronic CPT cones now also employ a pressure transducer with a filter to gather pore water pressure data. CPT testing, which also gathers these piezometer data, is called CPTU testing. CPT and CPTU testing equipment generally advances the cone using hydraulic rams mounted on either a heavily ballasted vehicle or using screwed-in anchors as a counter-force. One advantage of CPT over the Standard Penetration Test (SPT) is a more continuous profile of soil parameters, with CPTU data recorded typically at
FIGURE 8
Vs profiles at the points B3, C8 and D15 before and after dynamic com-
paction. This figure indicates that Vs increased for about 10–40 m/s at a
depth of 1–8 m.
FIGURE 7
qc soundings obtained at the points B3, B15, C8, D3 and D15 before and
after dynamic compaction. Underlined items correspond to qc soundings
for which Vs profiles are shown in Fig. 8. Here we observe an increased
qc (2–9 MPa) for almost all soundings from 0 to 8–10 m depth after
dynamic compaction. Let us note that points B3 and D15 highlight slices
between 4–6 m depth with no difference between qc before and after
dynamic compaction.
A. Bitri et al.688
© 2013 European Association of Geoscientists & Engineers, Near Surface Geophysics, 2013, 11, 683-690
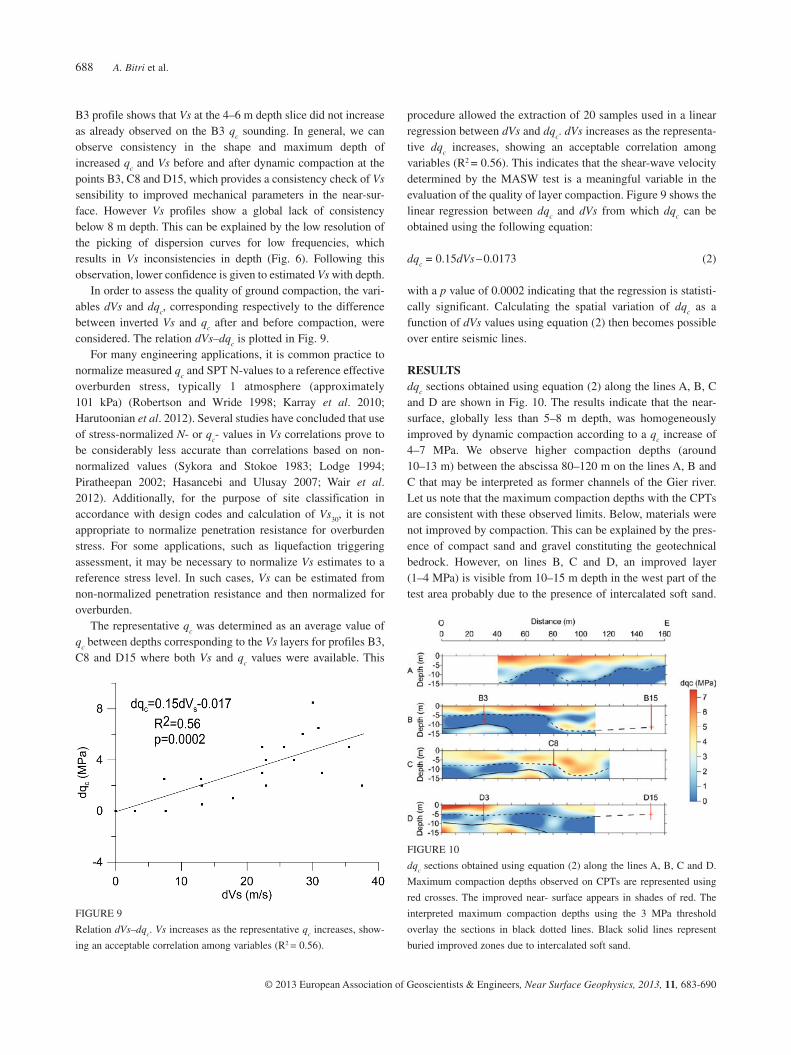
procedure allowed the extraction of 20 samples used in a linear regression between dVs and dq
c. dVs increases as the representa-
tive dqc increases, showing an acceptable correlation among
variables (R2 = 0.56). This indicates that the shear-wave velocity determined by the MASW test is a meaningful variable in the evaluation of the quality of layer compaction. Figure 9 shows the linear regression between dq
c and dVs from which dq
c can be
obtained using the following equation:
dqc = 0.15dVs – 0.0173 (2)
with a p value of 0.0002 indicating that the regression is statisti-cally significant. Calculating the spatial variation of dq
c as a
function of dVs values using equation (2) then becomes possible over entire seismic lines.
RESULTSdqc sections obtained using equation (2) along the lines A, B, C and D are shown in Fig. 10. The results indicate that the near-surface, globally less than 5–8 m depth, was homogeneously improved by dynamic compaction according to a qc increase of 4–7 MPa. We observe higher compaction depths (around 10–13 m) between the abscissa 80–120 m on the lines A, B and C that may be interpreted as former channels of the Gier river. Let us note that the maximum compaction depths with the CPTs are consistent with these observed limits. Below, materials were not improved by compaction. This can be explained by the pres-ence of compact sand and gravel constituting the geotechnical bedrock. However, on lines B, C and D, an improved layer (1–4 MPa) is visible from 10–15 m depth in the west part of the test area probably due to the presence of intercalated soft sand.
B3 profile shows that Vs at the 4–6 m depth slice did not increase as already observed on the B3 q
c sounding. In general, we can
observe consistency in the shape and maximum depth of increased q
c and Vs before and after dynamic compaction at the
points B3, C8 and D15, which provides a consistency check of Vs sensibility to improved mechanical parameters in the near-sur-face. However Vs profiles show a global lack of consistency below 8 m depth. This can be explained by the low resolution of the picking of dispersion curves for low frequencies, which results in Vs inconsistencies in depth (Fig. 6). Following this observation, lower confidence is given to estimated Vs with depth.
In order to assess the quality of ground compaction, the vari-ables dVs and dq
c, corresponding respectively to the difference
between inverted Vs and qc after and before compaction, were
considered. The relation dVs–dqc is plotted in Fig. 9.
For many engineering applications, it is common practice to normalize measured qc and SPT N-values to a reference effective overburden stress, typically 1 atmosphere (approximately 101 kPa) (Robertson and Wride 1998; Karray et al. 2010; Harutoonian et al. 2012). Several studies have concluded that use of stress-normalized N- or qc- values in Vs correlations prove to be considerably less accurate than correlations based on non-normalized values (Sykora and Stokoe 1983; Lodge 1994; Piratheepan 2002; Hasancebi and Ulusay 2007; Wair et al. 2012). Additionally, for the purpose of site classification in accordance with design codes and calculation of Vs30, it is not appropriate to normalize penetration resistance for overburden stress. For some applications, such as liquefaction triggering assessment, it may be necessary to normalize Vs estimates to a reference stress level. In such cases, Vs can be estimated from non-normalized penetration resistance and then normalized for overburden.
The representative qc was determined as an average value of qc between depths corresponding to the Vs layers for profiles B3, C8 and D15 where both Vs and qc values were available. This
FIGURE 9
Relation dVs–dqc. Vs increases as the representative qc increases, show-
ing an acceptable correlation among variables (R2 = 0.56).
FIGURE 10
dqc sections obtained using equation (2) along the lines A, B, C and D.
Maximum compaction depths observed on CPTs are represented using
red crosses. The improved near- surface appears in shades of red. The
interpreted maximum compaction depths using the 3 MPa threshold
overlay the sections in black dotted lines. Black solid lines represent
buried improved zones due to intercalated soft sand.
Ground compaction using surface wave data and cone penetration tests 689
© 2013 European Association of Geoscientists & Engineers, Near Surface Geophysics, 2013, 11, 683-690
REFERENCESAddo K.O. and Robertson P.K. 1992. Shear-wave velocity measurements
of soils using Rayleigh waves. Canadian Geotechnical Journal 29, 558–568.
ASTM. 2004. Standard Method of Deep Quasi-Static Cone and Friction-Cone Penetration Tests of Soil. ASTM Standard D 3441. ASTM International, West Conshohocken, PA, 7.
Begemann H.K.S. 1965. The Friction Jacket Cone as an Aid in Determining the Soil Profile. Proceedings of the 6th ICSMFE, Montreal, Quebec, Canada, Vol I, 17–20.
Bitri A., Le Bégat S. and Baltassat J.M. 1998. Shear wave velocity deter-mination of soils from in-situ Rayleigh waves measurements. Proceedings of the 4th Meeting EEGS, Barcelona, Spain, 503–506.
Brûlé S., Javelaud E.H., Ohmachi T., Nakamura Y. and Inoue S. 2010b. H/V method used to qualify the modification of dynamic soil charac-teristics due to ground improvement work by means of heavy compac-tion process. A case study: the former Givors’s glass factory area. 7th International Conference on Urban Earthquake Engineering and 5th
International Conference on Earthquake Engineering, Tokyo, Japan, 02–26, 451–455.
Cohen J.K. and Stockwell Jr. J.W. 1997. CWP/SU: Seismic Unix. A free package for seismic research and processing. Center for Wave Phenomena, Colorado School of Mines, Golden, CO.
De Reister J. 1971. Electric Penetrometer for Site Investigations. Journal of SMFE Division, ASCE 97(SM-2), 457–472.
Dorman J. and Ewing M. 1962. Numerical inversion of seismic surface waves dispersion data and crust-mantle structures in the New-York-Pennsylvania area. Journal of Geophysical Research 67, 5227–5241.
Forbriger T. 2003a. Inversion of shallow seismic wavefield: I. Wavefield transform. Geophysical Journal International 153, 719–734.
Forbriger T. 2003b. Inversion of shallow seismic wavefield: II. Inferring subsurface properties from wavefield transforms. Geophysical Journal International 153, 735–752.
Gabriels P., Sneider R. and Nolet G. 1987. In-situ measurements of shear wave velocity in sediments with higher mode Rayleigh waves. Geophysical Prospecting 35, 187–196.
Harutoonian P., Leo C.J., Doanh T., Castellaro S., Zou J.J., Liyanapathirana D.S. et al. 2012. Microtremor measurements of rolling compacted ground. Soil Dynamics and Earthquake Engineering 41, 23–31.
Hasancebi N. and Ulusay R. 2007. Empirical correlations between shear wave velocity and penetration resistance for ground shaking assess-ment. Bulletin of Engineering Geology and the Environment 66, 203–213.
Hermann R.B. 1987. Computer Programs in Seismology. Saint-Louis University, USA.
Karray M., Lefebvre G., Ethier Y. and Bigras A. 2010. Assessment of deep compaction of the Péribonka dam foundation using ‘modal analysis of surface waves’ (MASW). Canadian Geotechnical Journal 47, 312–326.
Kim D.S. and Park. H.C. 1999. Evaluation of ground densification using spectral analysis of surface waves (SASW) and resonant column (RC) tests. Canadian Geotechnical Journal 36, 291–299.
Lodge A.L. 1994. Shear wave velocity measurements for subsurface characterization. PhD thesis, Dept of Civil and Environmental Engineering, University of California, Berkeley, CA.
Lunne T., Robertson P.K. and Powell J.J.M. 1997. Cone Penetration Testing in Geotechnical Practice. Blackie Academic/Routledge Publishing, New York.
Luo Y., Xia J., Miller R.D., Xu Y., Liu J. and Liu Q. 2008. Rayleigh-wave dispersive energy imaging using a high resolution linear Radon trans-form. Pure and Applied Geophysics 165, 903–922.
McMechan G.A. and Yeldin M.J. 1981. Analysis of dispersive waves by wave field transformation. Geophysics 49, 1169–1179.
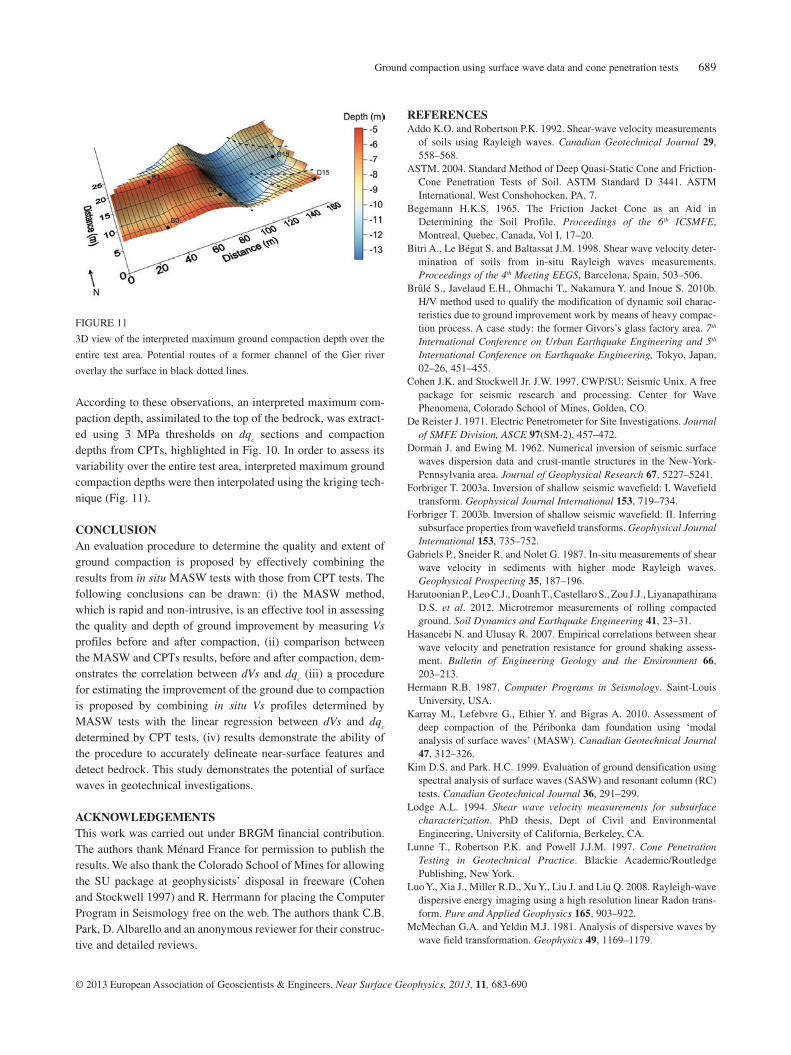
According to these observations, an interpreted maximum com-paction depth, assimilated to the top of the bedrock, was extract-ed using 3 MPa thresholds on dqc sections and compaction depths from CPTs, highlighted in Fig. 10. In order to assess its variability over the entire test area, interpreted maximum ground compaction depths were then interpolated using the kriging tech-nique (Fig. 11).
CONCLUSIONAn evaluation procedure to determine the quality and extent of ground compaction is proposed by effectively combining the results from in situ MASW tests with those from CPT tests. The following conclusions can be drawn: (i) the MASW method, which is rapid and non-intrusive, is an effective tool in assessing the quality and depth of ground improvement by measuring Vs profiles before and after compaction, (ii) comparison between the MASW and CPTs results, before and after compaction, dem-onstrates the correlation between dVs and dqc (iii) a procedure for estimating the improvement of the ground due to compaction is proposed by combining in situ Vs profiles determined by MASW tests with the linear regression between dVs and dq
c
determined by CPT tests, (iv) results demonstrate the ability of the procedure to accurately delineate near-surface features and detect bedrock. This study demonstrates the potential of surface waves in geotechnical investigations.
ACKNOWLEDGEMENTSThis work was carried out under BRGM financial contribution. The authors thank Ménard France for permission to publish the results. We also thank the Colorado School of Mines for allowing the SU package at geophysicists’ disposal in freeware (Cohen and Stockwell 1997) and R. Herrmann for placing the Computer Program in Seismology free on the web. The authors thank C.B. Park, D. Albarello and an anonymous reviewer for their construc-tive and detailed reviews.
FIGURE 11
3D view of the interpreted maximum ground compaction depth over the
entire test area. Potential routes of a former channel of the Gier river
overlay the surface in black dotted lines.

A. Bitri et al.690
Robertson P.K. and Wride C.E. 1998. Evaluating cyclic liquefaction potential using the cone penetration test. Canadian Geotechnical Journal 35, 442–459.
Romdhan A., Grandjean G., Brossier R., Rejiba F., Opero S. and Virieux J. 2011. Shallow-structure characterization by 2D elastic full-wave-form inversion. Geophysics 76, (R81). doi:10.1190/1.3569798
Song Y.Y., Castagna J.P., Black R.A. and Knapp R.W. 1989. Sensitivity of near-surface shear-wave velocity determination from Rayleigh and Love waves. Technical program with Biographies. SEG 59th Annual Meeting, Dallas, TX, 509–512.
Sykora D.E. and Stokoe K.H. 1983. Correlations of in-situ measurements in sands of shear wave velocity. Soil Dynamics and Earthquake Engineering 20, 125–136
Wair B.R., De Jong J.T. and Shantz T. 2012. Guidelines for estimation of shear wave velocity profiles. Pacific Earthquake Engineering Research Center, PEER 2012/08.
Xia J., Miller R.D. and Park C.B. 1999a. Estimation of near-surface shear-wave velocity by inversion of Rayleigh waves. Geophysics 64(3), 691–700.
Xia J., Miller R.D. and Park C.B. 1999b. Advantage of calculating shear-wave velocity from surface waves with higher modes. SEG 70th Meeting, Houston, Texas.
Moktar T.A., Hermann R.B. and Russel D.R. 1988. Seismic velocity and Q model for the shallow structure of the Arabian shield from short-period Rayleigh waves. Geophysics 53, 1379–1387.
Nazarian S. and Stokoe K.H. 1984. In-situ shear wave velocities from spectral analysis of surface waves. Proceedings 8th World Conference on Earthquake Engineering 3, 31–38.
O’Neill. A. 2003. Full-waveform reflectivity for modeling, inversion and appraisal of seismic surface wave dispersion in shallow site investiga-tions. MSc thesis, The University of Western Australia.
Park C.B. 2005. MASW – Horizontal resolution in 2D shear-velocity (Vs) mapping. KGS Open-File Report 2005–4.
Park C.B., Miller R.D. and Xia J. 1998. Imaging dispersion curves of surface waves on multi-channel record. Technical Program with Biographies. SEG 68th Annual Meeting, New Orleans, LA., 1377–1380.
Park C.B., Miller R.D. and Xia J. 1999. Multi-channel analysis of surface waves. Geophysics 64(3), 800–808.
Park C.B., Miller R.D., Xia J. and Ivanov J. 2007. Multi-channel analysis of surface waves. (MASW) active and passive methods. Leading Edge 26, 60–64.
Piratheepan P. 2002. Estimating shear wave velocity from SPT and CPT data. MSc Thesis, Clemson University.
Richart Jr.F.E., Hall Jr.J.R. and Woods R.D. 1970. Vibration of Soils and Foundations. Prentice Hall Inc., Englewood Cliffs, N.J.
www.eage.org
Shales: What do they have in common?
This three-day multidisciplinary specialist workshop will focus on the latest research results on shale properties and their importance for various applications, including caprock integrity for CO2 storage or enhanced oil recovery, radioactive waste disposal, or production from gas or oil shales. The workshop is aimed at specialists from all disciplines who are interested in shales.
Topics:1. Shale Characterization2. Modeling of Shales and Upscaling3. Geological Processes, Sedimentology and Stratigraphy4. Chemistry of Shales5. Unconventional Resources6. Seals for Carbon Sequestration and Radioactive Waste Disposal7. Caprock Integrity8. Bore Hole Stability9. Seismic and CSEM
The programme will be available online mid-December.
Fourth EAGE Shale Workshop
Register now!
6-9 April 2014 – Porto, Portugal
ESW14-V3H.indd 1 11-09-13 14:16