ground improvement for mitigation of failure risks to ... 2010-oct6... · ground improvement for...
TRANSCRIPT
1
Ground Improvement for Mitigation of Failure Risks to Existing Embankment Dams
by
James K. Mitchell, Sc.D., P.E., Dist. M.ASCE
University of Alberta, Edmonton, Alberta
October 6, 2010

2
SCOPE OF THE LECTURE
Types of distress and failure of existing embankment dams and their causes
Why so many existing embankment dams require fixing
Available ground improvement methods and basis for selecting among them
Illustrative case histories Recent trends in design and ground improvement
method applications Some major unresolved problems

3
TYPES OF DISTRESS AND FAILURE OF EXISTING EMBANKMENT DAMS AND THEIR CAUSES
Excessive Settlement Liquefaction of embankment and
foundation materials Large Deformations Cracking and opening of seepage paths Damage to control structures

4
Loss of freeboard and overtopping as a result of:
Crest settlement from compression of the embankment and foundation
Crest settlement from loss of embankment stability and lateral displacement
Crest settlement from liquefaction in the embankment and/or foundation and lateral spreading
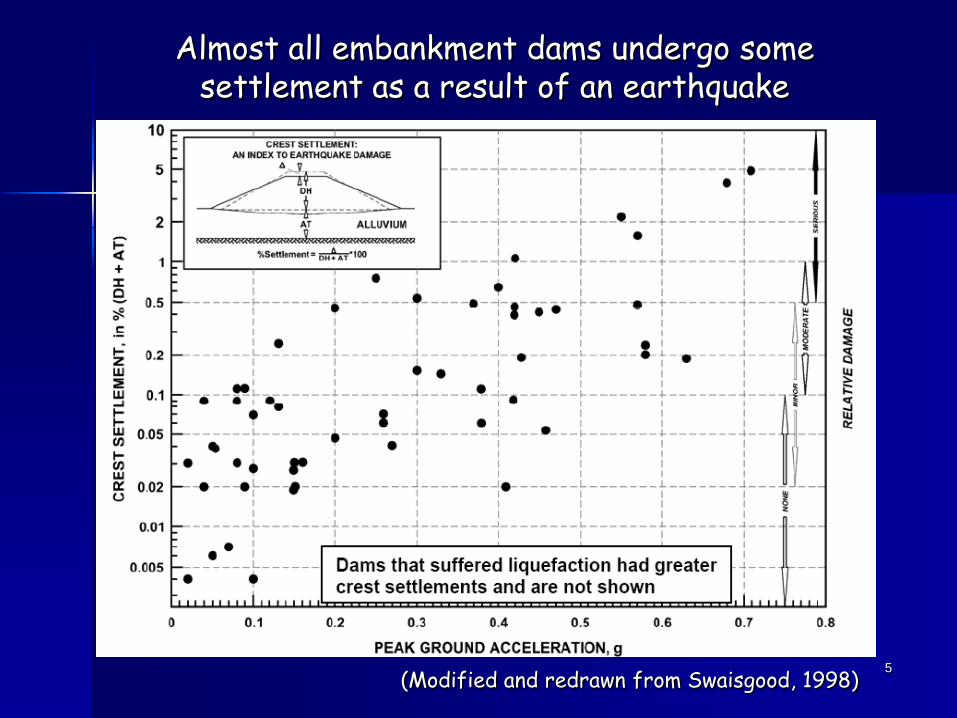
5(Modified and redrawn from Swaisgood, 1998)
Almost all embankment dams undergo some settlement as a result of an earthquake
6
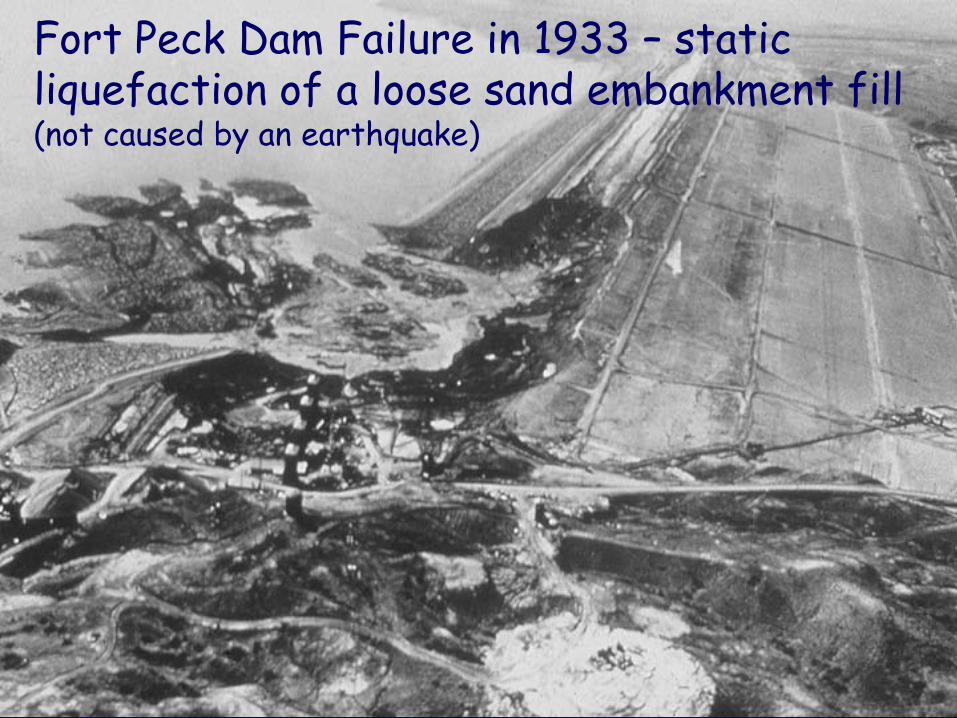
Fort Peck Dam Failure in 1933 – static liquefaction of a loose sand embankment fill(not caused by an earthquake)

7
Failure of Fort Peck Dam – static liquefaction of a loose sand embankment fill

8
Lower San Fernando Dam Failure, 1971
Earthquake-induced liquefaction

9
1971 Slide – Lower San Fernando Dam
Photo taken during reservoir emptying after the earthquake to protect the large population at risk downstream

10
Seepage and Piping (initiated by cracking and differential movements):
Within and through the embankment as a result of cracking of the core and inadequate protective filters
Seepage and piping through the foundation as a result of cracking of cutoff walls and seepage control blankets
Piping along conduits as a result of differential ground movements
11
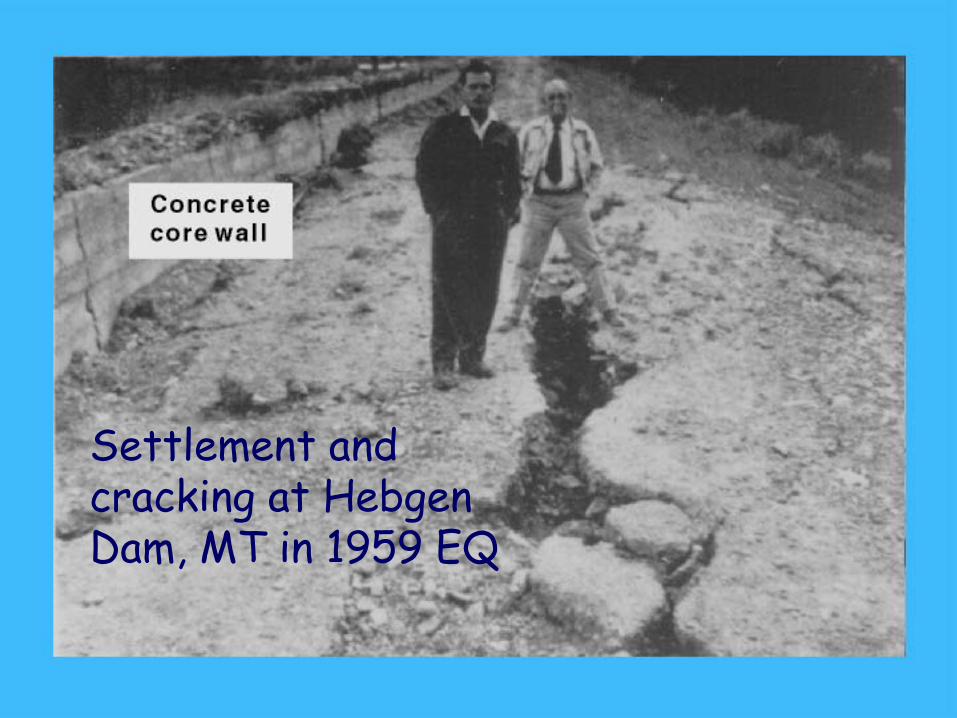
Settlement and cracking at Hebgen Dam, MT in 1959 EQ

12Transverse crack in a long, low dam near Anchorage caused by the Great Alaska EQ of 1964 (from Sherard, 1973)

13
Loss of Reservoir Control can result from:
Loss of spillway Damage to spillway gates Damage to inlet and outlet works

14
WHY DO SO MANY DAMS NEED REMEDIATION?
Many were built on sedimentary deposits now known to be susceptible to liquefaction
Many dams were built using methods now known to yield embankments that have poor stability; e.g. hydraulic filling
Aging dam inventory and the deteriorating effects of time on the condition of the dam and appurtenant structures
Much more is known about how dams can be adversely impacted by seismic shaking
Escalation of estimated seismic risk Larger populations in the downstream floodplain
now and in the future Higher standards for dams built today – stricter
regulatory requirements

15
16
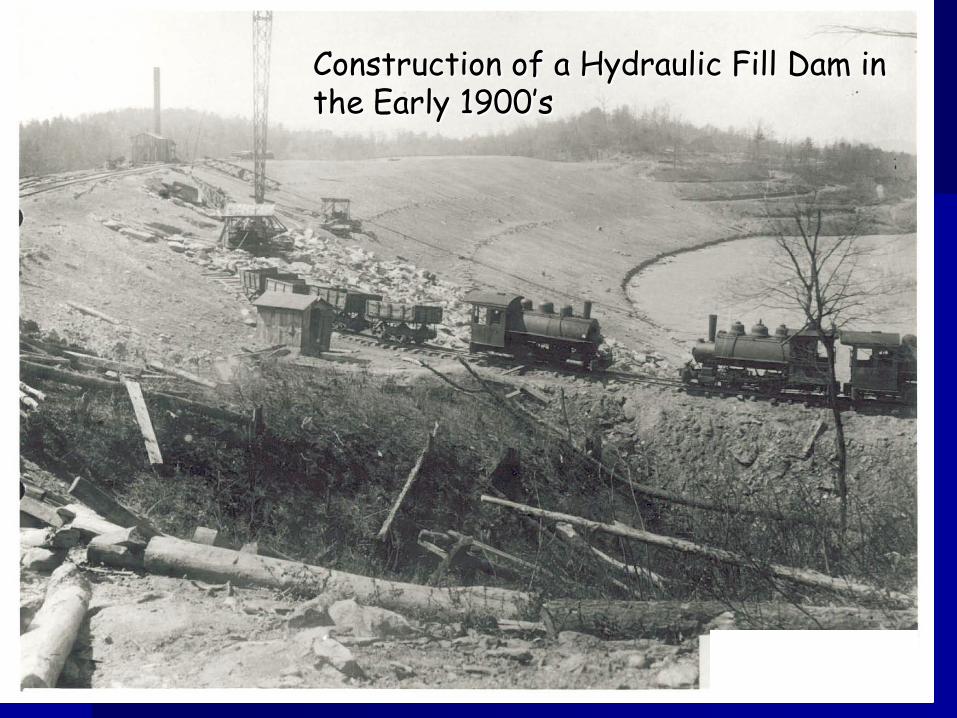
Construction of a Hydraulic Fill Dam in the Early 1900’s

17
Hydraulic Filling Operations

18
Hydraulic Fill Dam Completed in 1915
Placement method results in loose, potentially liquefiable embankment shell and soft clay core

19
Steps in the Evaluation of Dam Safety1. Review project history – site conditions, construction
records, as-built conditions, maintenance records, etc.2. Assess current conditions of the foundation, embankment
and appurtenant structures3. Determine site seismicity and estimate the ground
motions4. Determine hydraulic demands; e.g., PMF, Reservoir levels5. Develop best estimate site characterization models for
the dam and its foundation6. Do simple/approximate analyses for estimation of
possible liquefaction, deformations, and cracking7. Do the results indicate the possibility of failure or near-
failure by any conceivable failure mode?8. If so, then more refined analyses and a risk assessment
are necessary. 9. If the risk is greater than acceptable limits, then begin
development of protective and remedial strategies
20
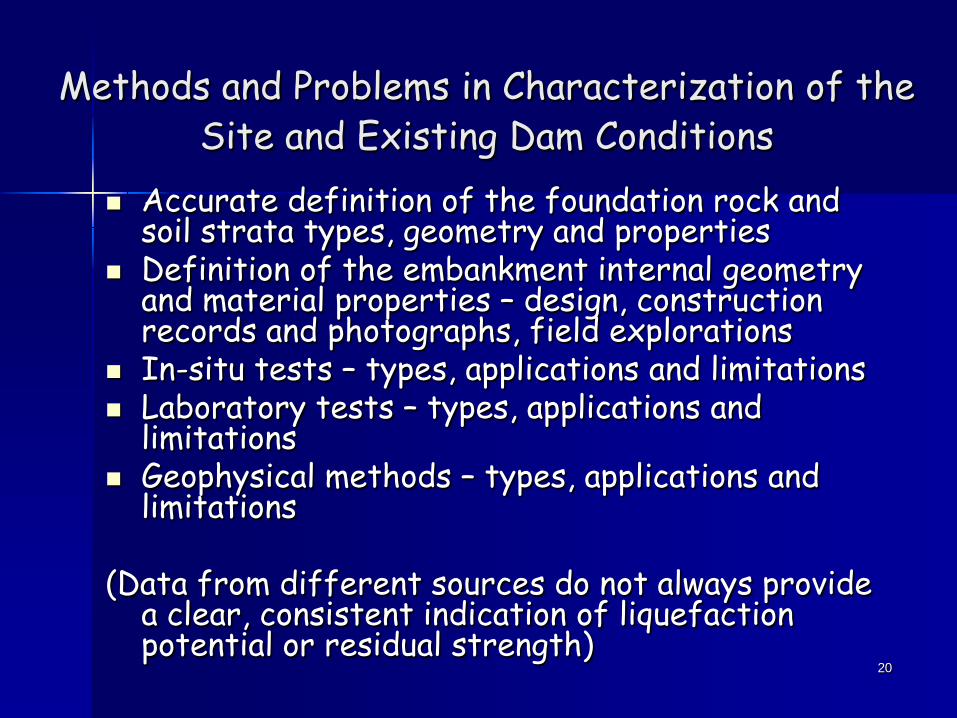
Methods and Problems in Characterization of the Site and Existing Dam Conditions
Accurate definition of the foundation rock and soil strata types, geometry and properties
Definition of the embankment internal geometry and material properties – design, construction records and photographs, field explorations
In-situ tests – types, applications and limitations Laboratory tests – types, applications and
limitations Geophysical methods – types, applications and
limitations
(Data from different sources do not always provide a clear, consistent indication of liquefaction potential or residual strength)
21
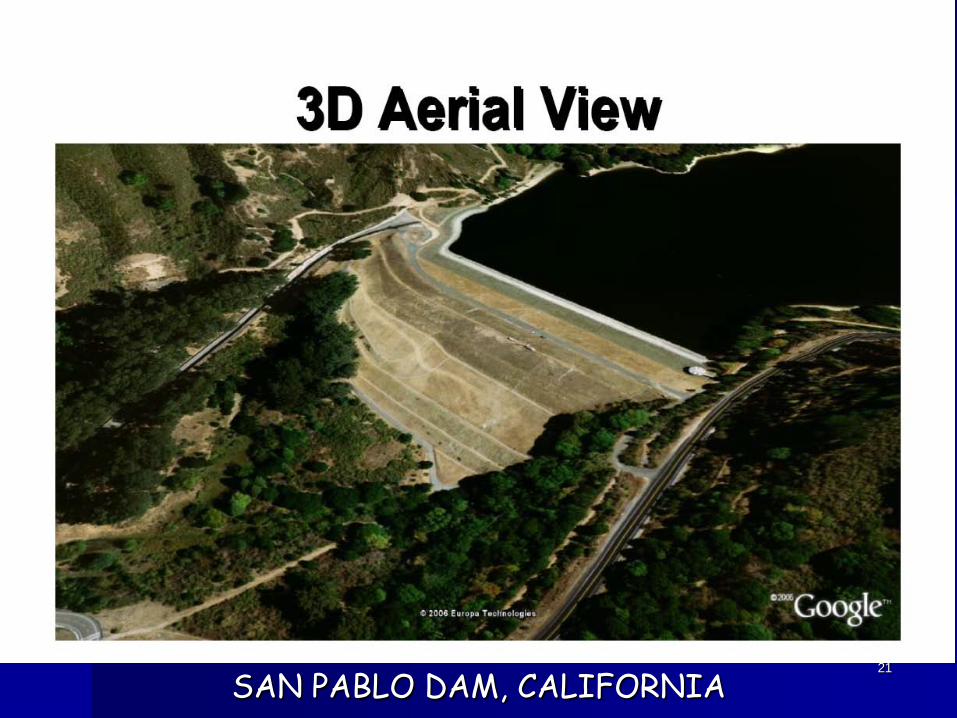
SAN PABLO DAM, CALIFORNIA

22
San Pablo Dam - A Case of Misidentified materials•170-ft high, 125-ft wide, 1200-ft long hydraulic fill dam completed in 1921
•Founded on alluvial sediments; some zones susceptible to liquefaction
•Embankment of hydraulic fill material that consisted of weathered sandstone and shale
•Evaluations in 1960’s and again in 1970’s assumed a liquefiable embankment, evidently because it was a hydraulic fill, and included tests on sandy embankment samples - resulted in a small DS buttress in 1967 and large US buttress to bedrock in 1979
•Reevaluation in 2004 assumed liquefiable embankment and indicated excessive slumping and overtopping in M7.25 EQ on Hayward Fault
•Considered completely rebuilding the dam- would require draining the reservoir
•Chose an in-place alternative instead, with Cement Deep Soil Mixing (CDSM) in the foundation and a large DS buttress fill.
•Extensive field (mostly CPT) and lab testing programs revealed that the embankment material was fine-grained and not susceptible to liquefaction.
•As a result a considerably smaller zone of CDSM and reduced buttress was used.
23
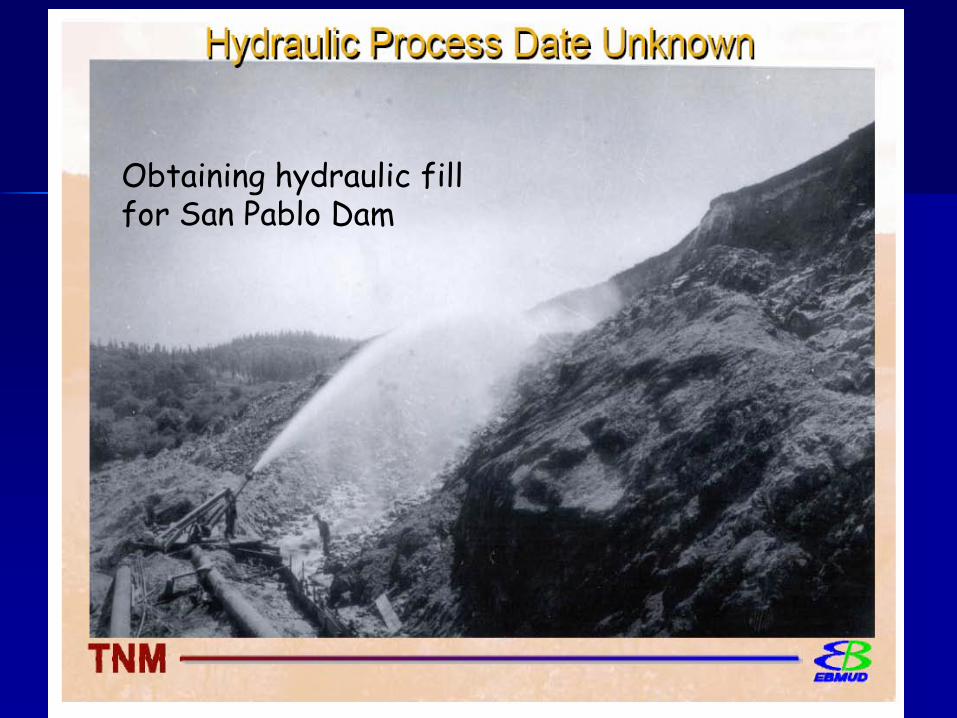
Obtaining hydraulic fill for San Pablo Dam
24
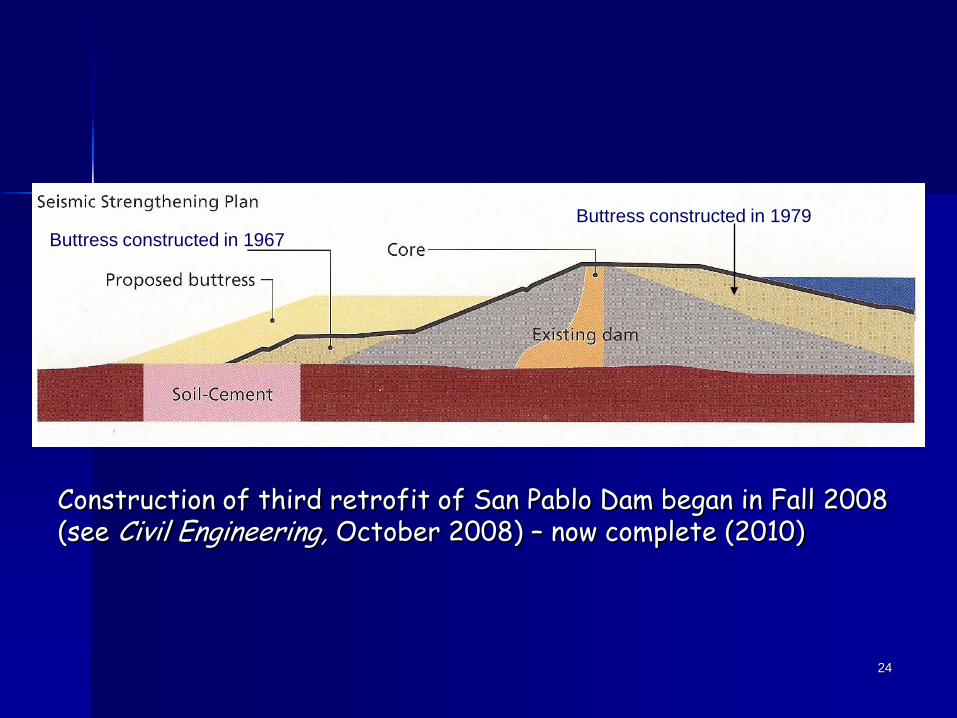
Buttress constructed in 1979Buttress constructed in 1967
Construction of third retrofit of San Pablo Dam began in Fall 2008 (see Civil Engineering, October 2008) – now complete (2010)
25
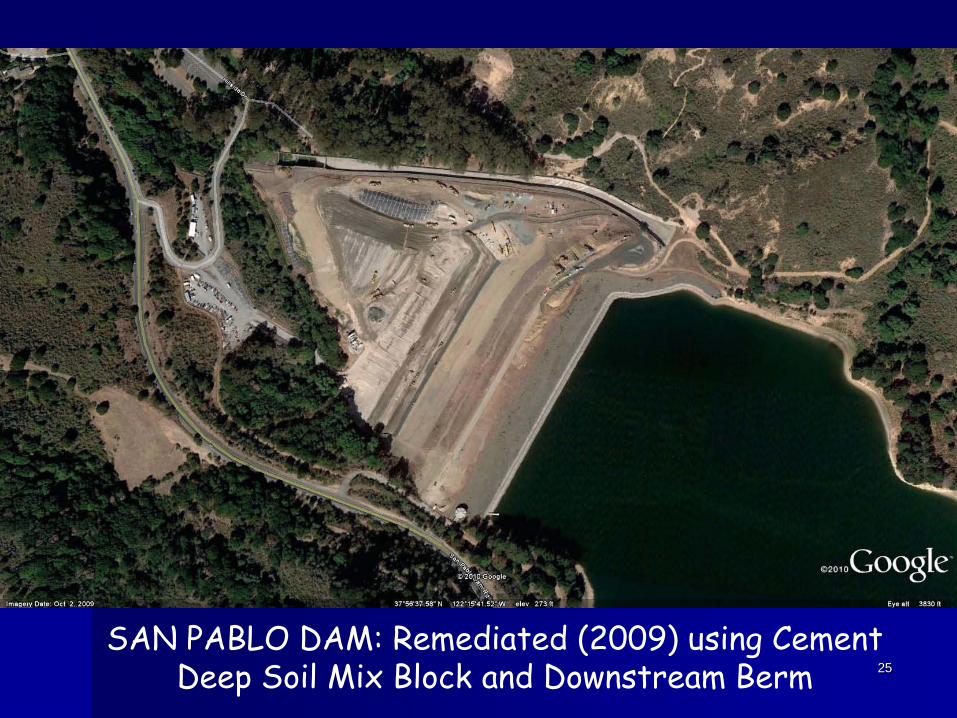
SAN PABLO DAM: Remediated (2009) using Cement Deep Soil Mix Block and Downstream Berm

26
Ground Improvement Methods Used for Strengthening Dams and Their
Foundations
27
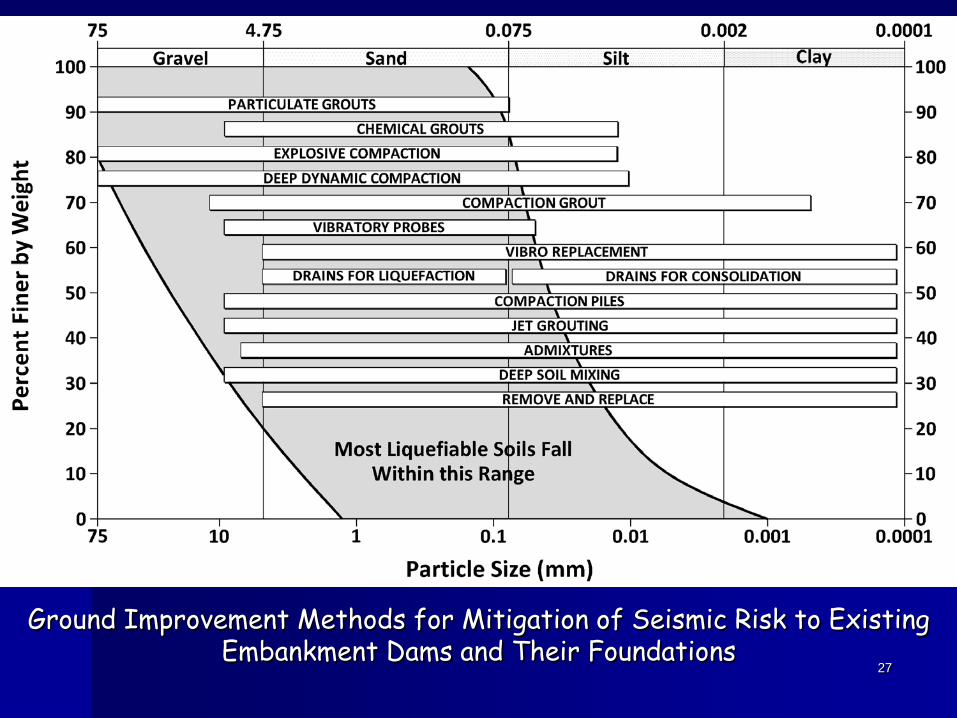
Ground Improvement Methods for Mitigation of Seismic Risk to Existing Embankment Dams and Their Foundations
28
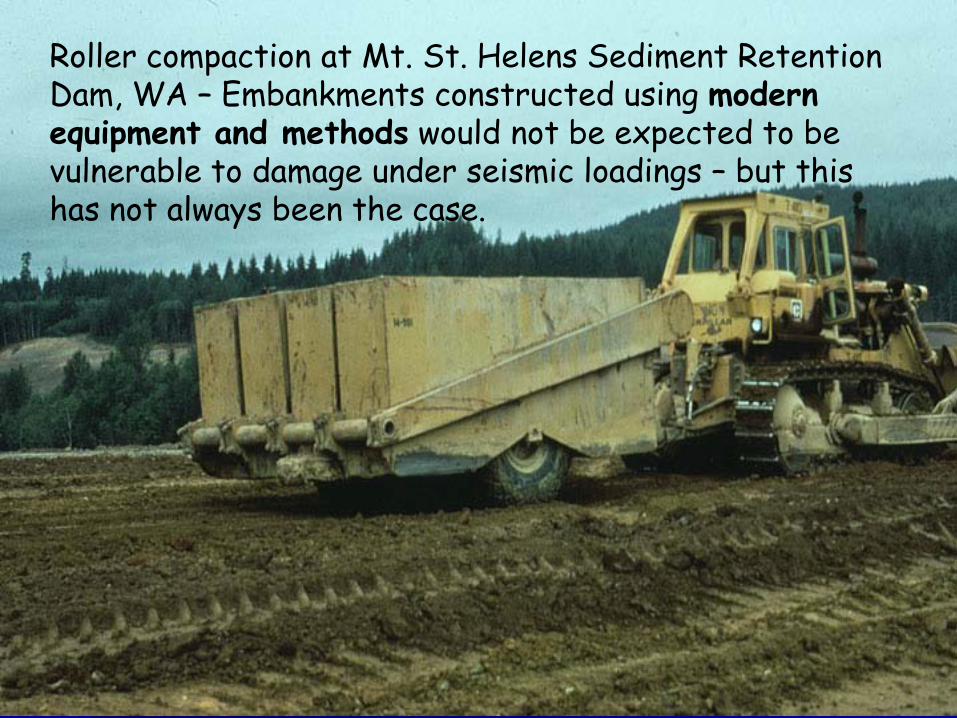
Roller compaction at Mt. St. Helens Sediment Retention Dam, WA – Embankments constructed using modern equipment and methods would not be expected to be vulnerable to damage under seismic loadings – but this has not always been the case.
29
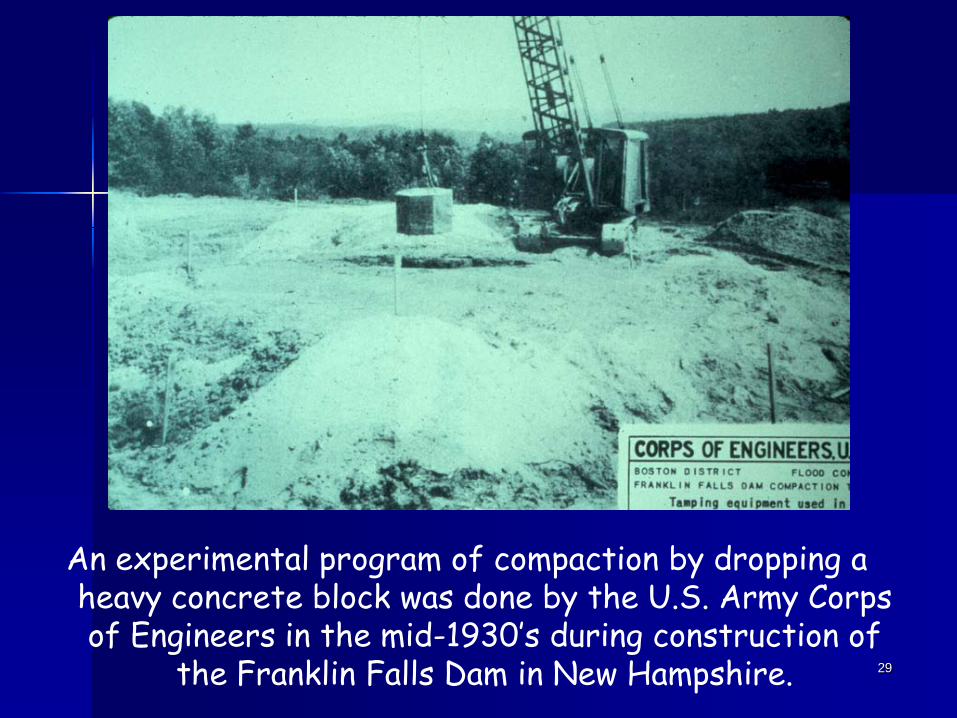
An experimental program of compaction by dropping a heavy concrete block was done by the U.S. Army Corps of Engineers in the mid-1930’s during construction of
the Franklin Falls Dam in New Hampshire.

30
Deep Dynamic Compaction
Courtesy of DGI-Menard

31
Variation of improvement with depth after DDC is consistent with the strain distribution beneath the weight impact point. Upper limit for densification by DDC is about 35 feet.
32
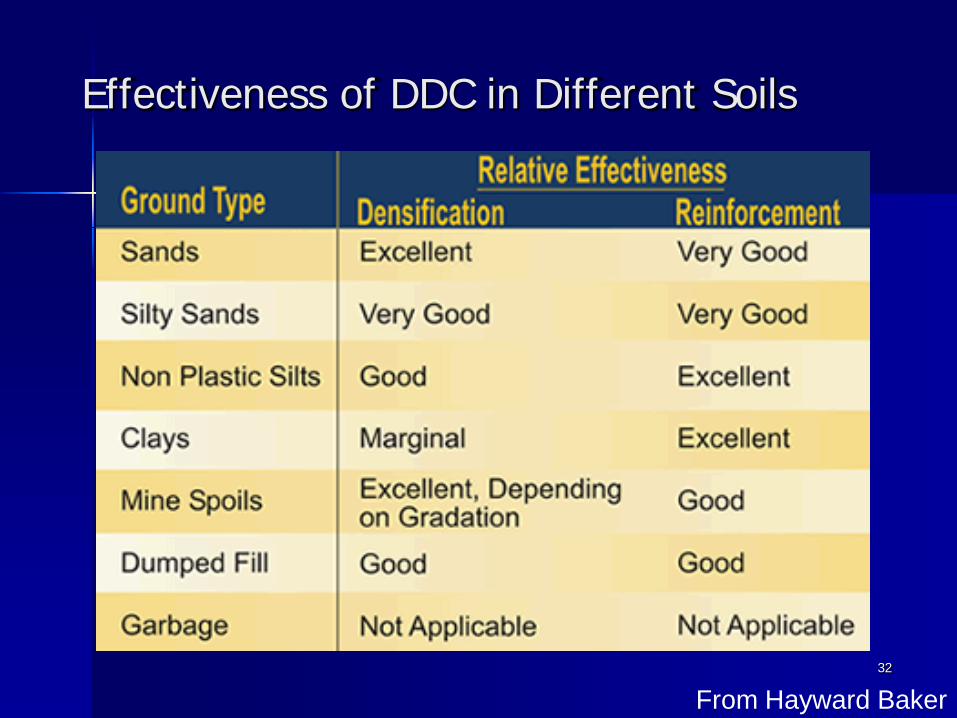
Effectiveness of DDC in Different Soils
From Hayward Baker
33
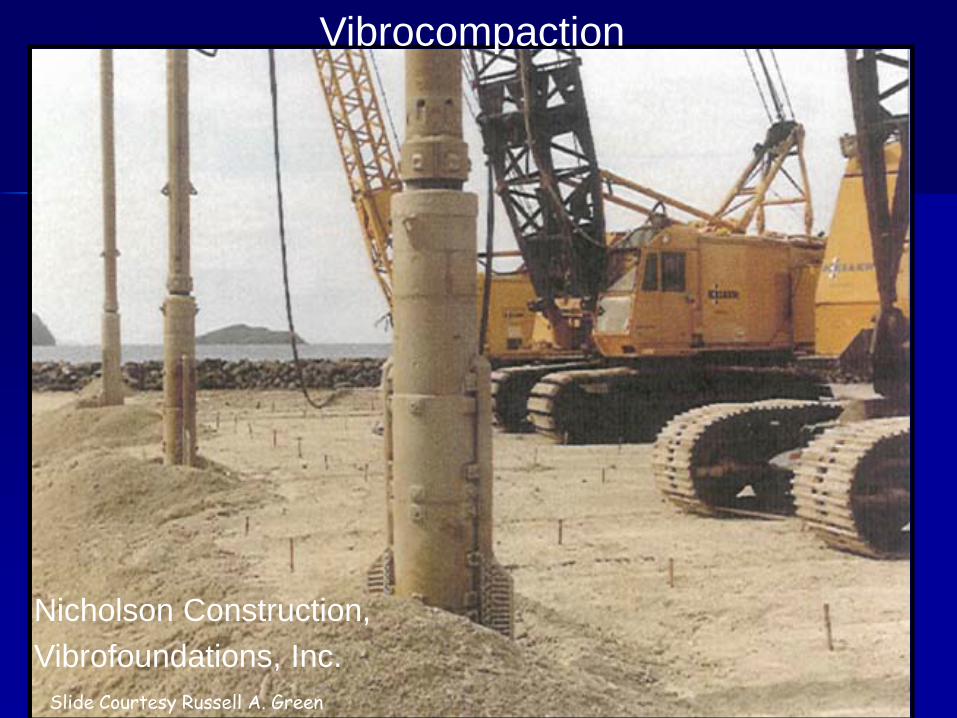
Vibrocompaction
Nicholson Construction,Vibrofoundations, Inc.
Slide Courtesy Russell A. Green

34
Vibroreplacement Stone Columns Developed based on German (1930’s)
vibroflotation technology, introduced to North America in 1940’s
Wet and dry methods to depths of 100 ft Top and bottom feed Column installation can provide
densification of matrix soil (if fines content not excessive)
Columns can enhance drainage and provide some reinforcement
Rapid, but difficult to penetrate stiff cohesive soils
35
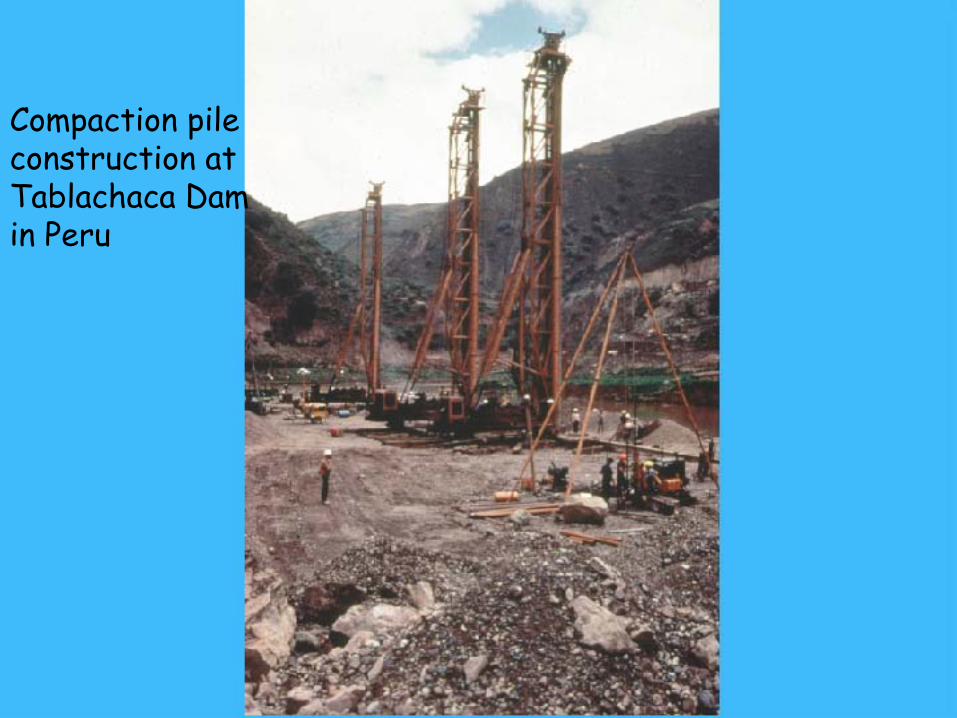
Compaction pile construction at Tablachaca Dam in Peru
36
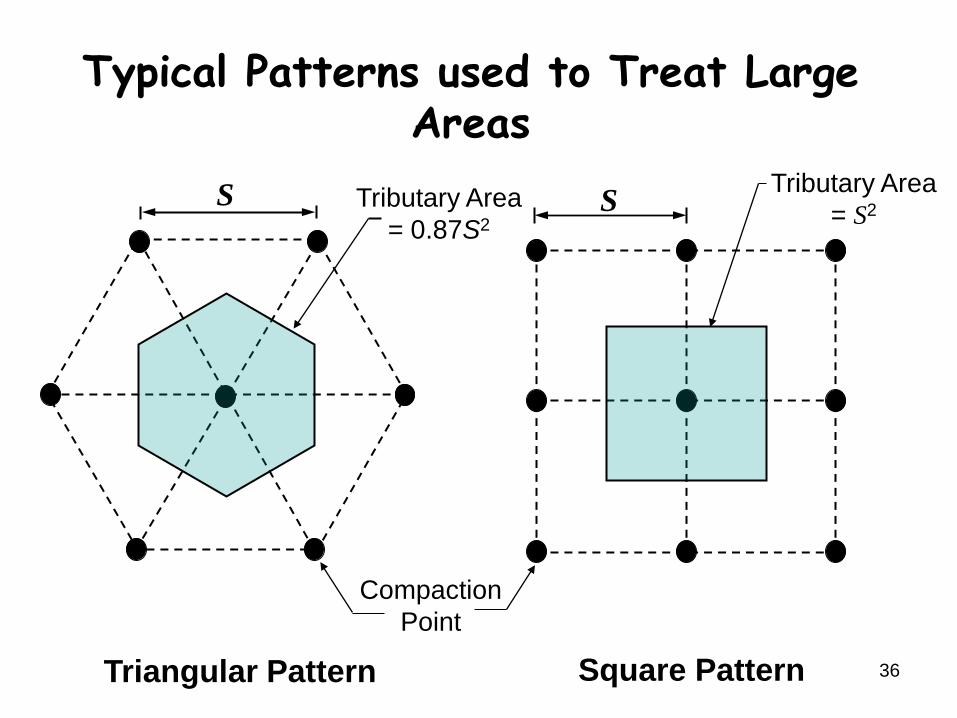
Typical Patterns used to Treat Large Areas
Square Pattern
S Tributary Area = S2
Compaction Point
Tributary Area = 0.87S2
Triangular Pattern
S
37
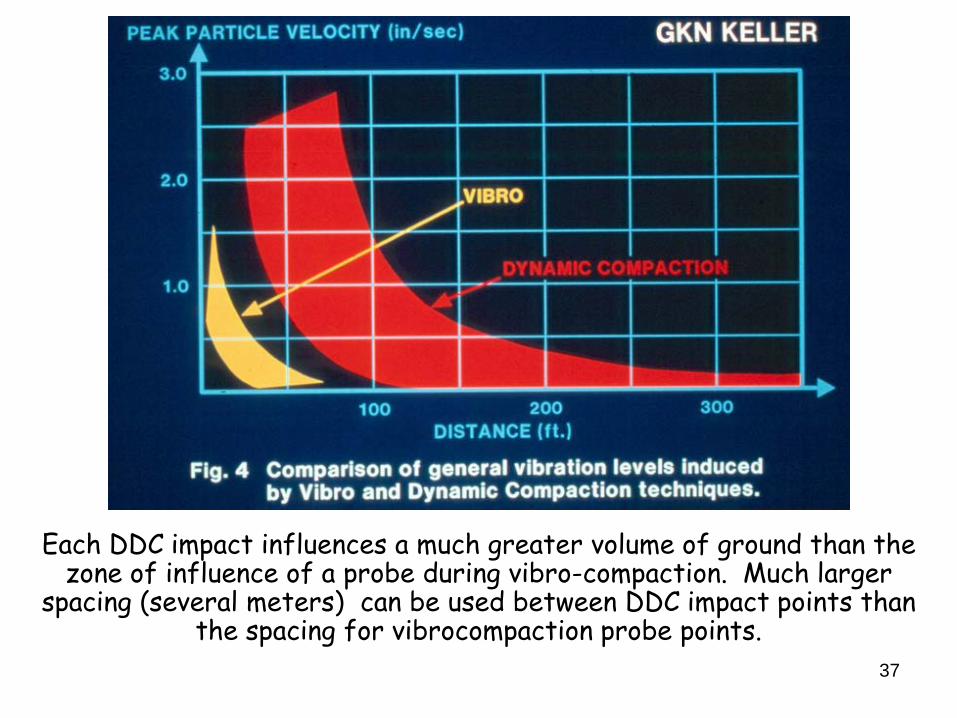
Each DDC impact influences a much greater volume of ground than the zone of influence of a probe during vibro-compaction. Much larger
spacing (several meters) can be used between DDC impact points than the spacing for vibrocompaction probe points.

38
Expected Vibro-Compaction, Vibro-replacement and Rammed Aggregate Results
Relative Effectiveness
Ground Type Densification Reinforcement Drainage*
Sands Excellent Very Good GoodSilty Sands Very Good Very Good Very GoodNon-plastic
Silts Good Excellent Very Good
Clays Marginal Excellent Excellent
Mine Spoils Depends on gradation Good Depends on
gradations
Dumped Fill Good Good Depends on gradations
*Assumes no fines mixed into columns

39
Effect of fines on SPT resistance
40
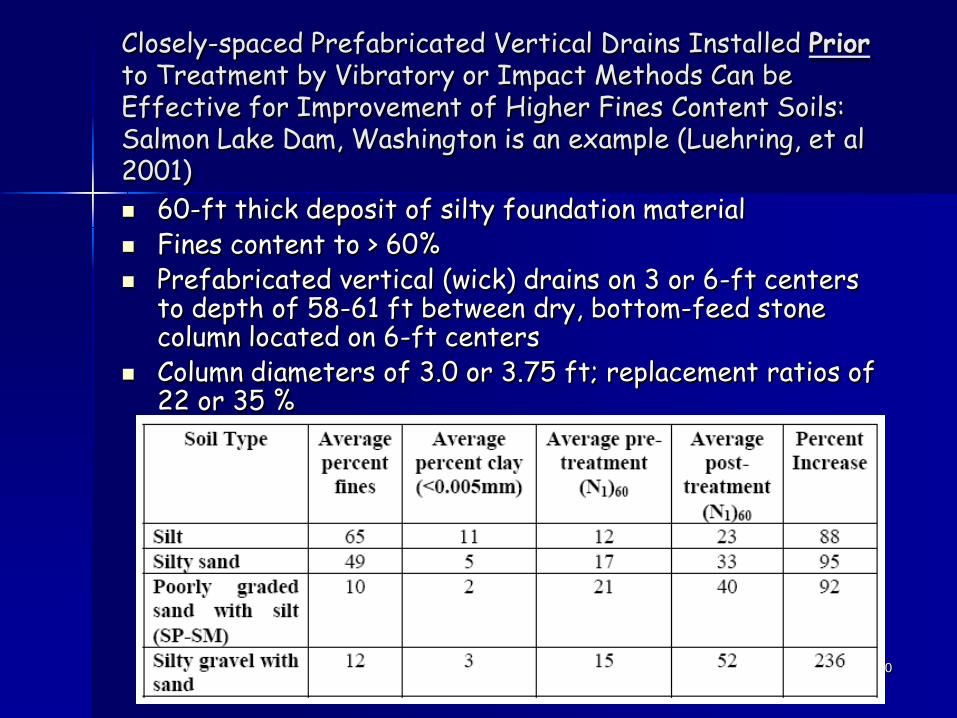
Closely-spaced Prefabricated Vertical Drains Installed Priorto Treatment by Vibratory or Impact Methods Can be Effective for Improvement of Higher Fines Content Soils:Salmon Lake Dam, Washington is an example (Luehring, et al 2001) 60-ft thick deposit of silty foundation material Fines content to > 60% Prefabricated vertical (wick) drains on 3 or 6-ft centers
to depth of 58-61 ft between dry, bottom-feed stone column located on 6-ft centers
Column diameters of 3.0 or 3.75 ft; replacement ratios of 22 or 35 %

41
Explosive Compaction
Can be useful for densification at large depths (>30 m) and where there is a high content of gravel, cobbles, and boulders
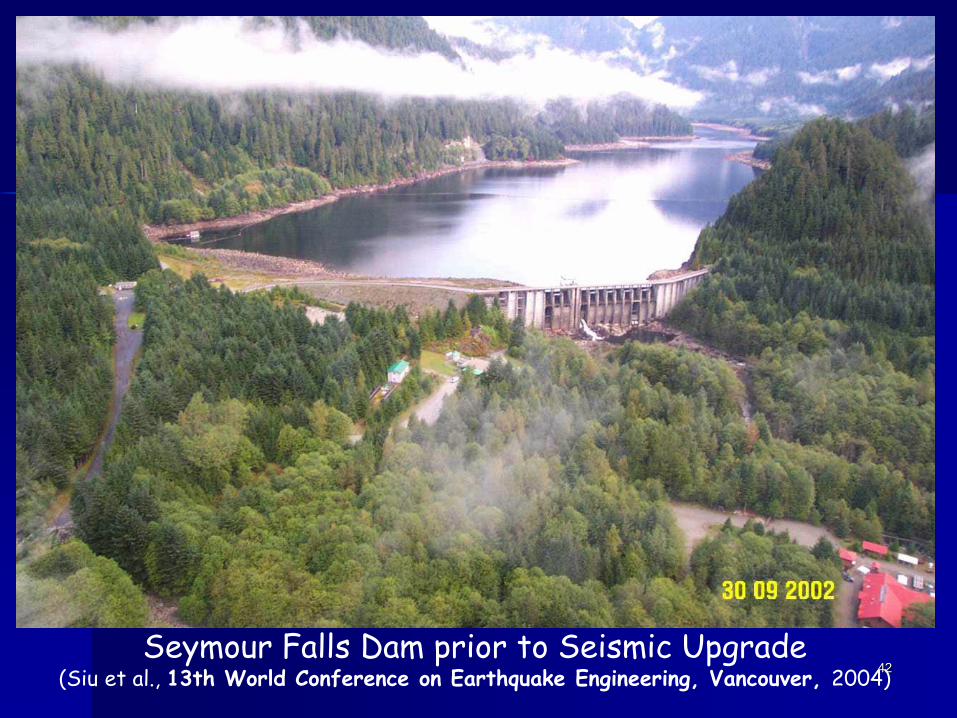
42Seymour Falls Dam prior to Seismic Upgrade
(Siu et al., 13th World Conference on Earthquake Engineering, Vancouver, 2004)

43
Foundation Densification by Explosive Compaction and Deep Dynamic Compaction at Seymour Falls Dam prior to
Construction of New Embankment(Siu et al., 13th World Conference on Earthquake Engineering, Vancouver, 2004)

44
Densification of a high gravel and cobble content layer at Seymour Falls Dam, BC – note gas and water ejecting from blast holes(from Elliott, et al)
45
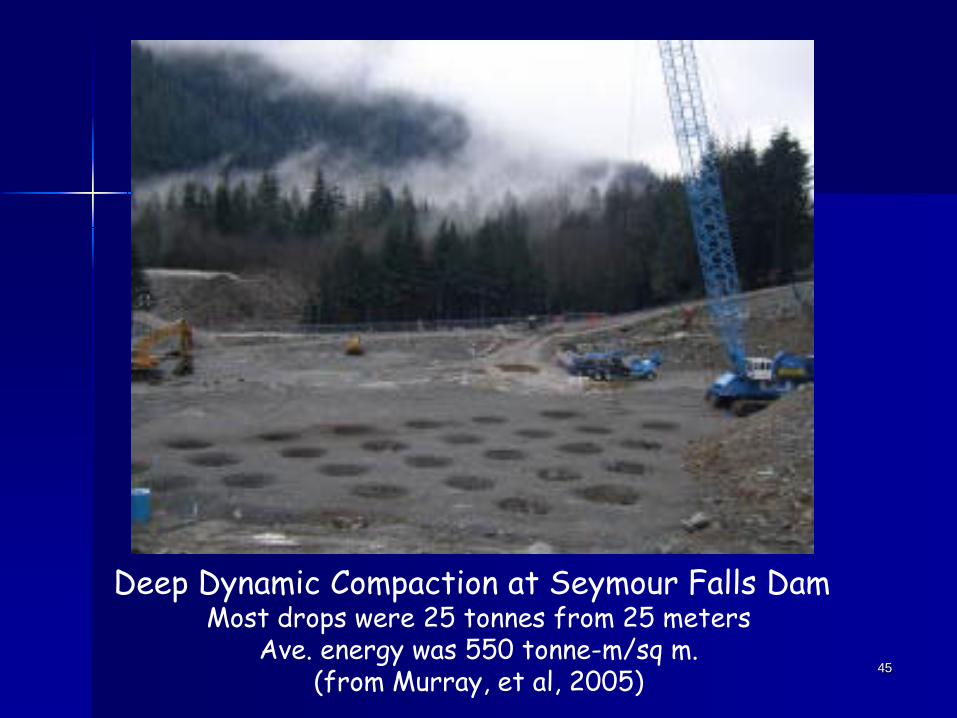
Deep Dynamic Compaction at Seymour Falls DamMost drops were 25 tonnes from 25 meters
Ave. energy was 550 tonne-m/sq m.(from Murray, et al, 2005)
46
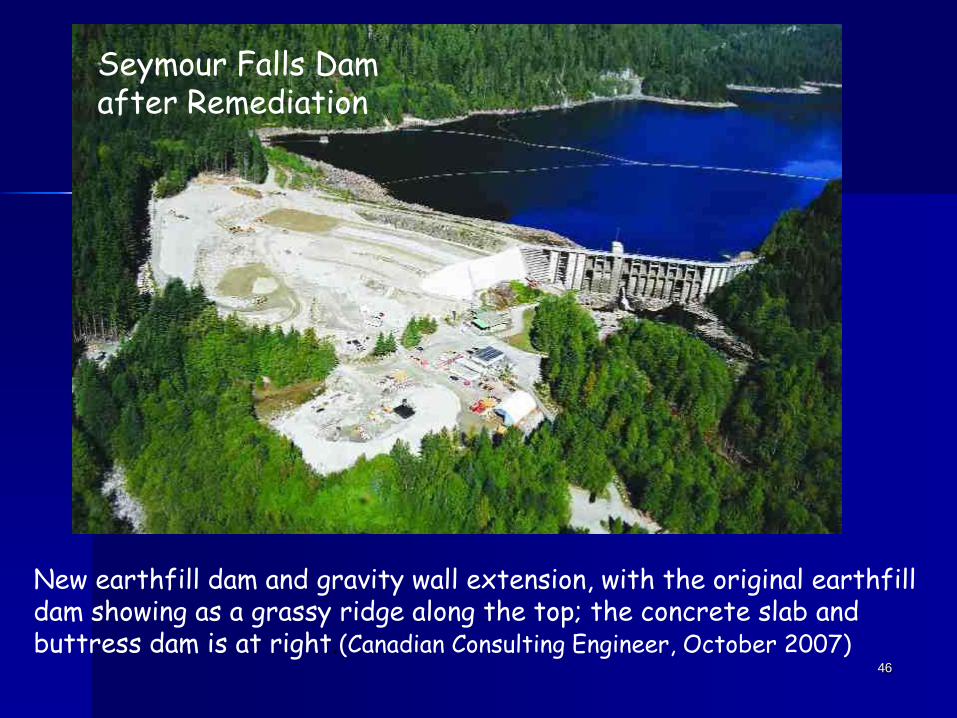
New earthfill dam and gravity wall extension, with the original earthfill dam showing as a grassy ridge along the top; the concrete slab and buttress dam is at right.(Canadian Consulting Engineer, October 2007)
Seymour Falls Dam after Remediation
47
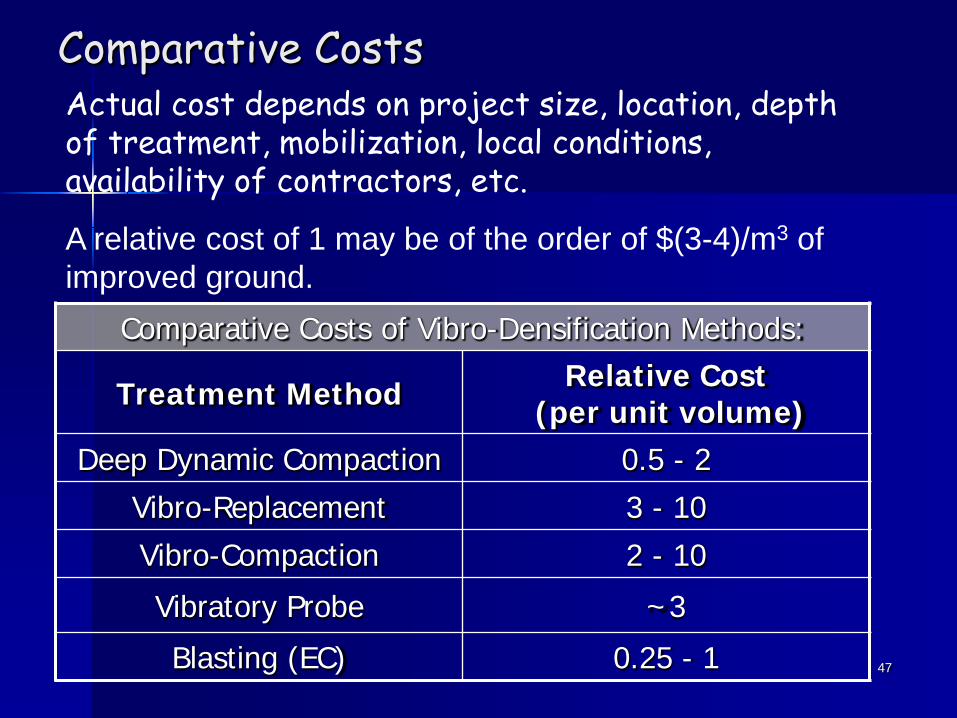
Comparative Costs
Comparative Costs of Vibro-Densification Methods:
Treatment Method Relative Cost(per unit volume)
Deep Dynamic Compaction 0.5 - 2Vibro-Replacement 3 - 10Vibro-Compaction 2 - 10
Vibratory Probe ~3
Blasting (EC) 0.25 - 1
Actual cost depends on project size, location, depth of treatment, mobilization, local conditions, availability of contractors, etc.
A relative cost of 1 may be of the order of $(3-4)/m3 of improved ground.

48
Deep soil mixing at Jackson Lake Dam(First large-scale use of DSM in the U.S.)
49
50
51

52

53

54

55
Schematic of Jet Grouting

56Cement Deep Soil Mix and Jet Grout Columns at a Recent (2006)
Dam Downstream Test Section

57Jet Grout and CDSM Columns at a Recent (2006) Dam Test Section

58
Selection of most appropriate method(s) depends on many factors, including:
– Soil type and suitable methods for improving it– Level of improvement needed– Magnitude of improvement attainable by a
method– Required depth and thickness of treatment– Areal extent of treatment– Accessibility of the site– Environmental considerations– Time and cost considerations– Local experience– Confidence in method effectiveness (QA/QC)– Construction risks– Long-term monitoring and performance
requirements

59
METHODS FOR EVALUATION OF IMPROVED GROUND
― Surface settlement and heave― Backfill quantities― Sampling of admixture treated soil― Penetration tests: SPT, CPT, BPT, DMT― Shear wave velocity― Undisturbed samples― Hydraulic conductivity (in-situ)― Construction data records (power, energy
input, pressures, quantities, rates, etc.)― “Can see a lot just by watching”

60
QA/QC requirements for improved ground During construction, observations should be made and
recorded at each improvement location, including:– Ground surface movements– Volume of backfill material used– Grout take– Amount of energy or pressure expended– Consistency, unit weight, viscosity of mixed in-situ
materials and spoils returned to the ground surface
After construction, in-situ methods such as SPT, CPT and/or shear wave velocity testing can be performed to verify that the level of improvement is achieved.
Laboratory testing can also be used to verify some types of improvement