assessment of fatty acids composition in …
TRANSCRIPT

SINET: Ethiop. J. Sci., 39(1):21-33, 2016 ISSN: 0379–2897 (Print)
© College of Natural Sciences, Addis Ababa University, 2016 2520–7997 (Online)
ASSESSMENT OF FATTY ACIDS COMPOSITION IN COMMERCIALLY AVAILABLE AND WIDELY CONSUMED EDIBLE OILS IN ETHIOPIA: THEIR RELEVANCE AND
HEALTH IMPLICATIONS.
Fsaha Tesfamicael and Estifanos Ele٭
Department of Chemistry, College of Natural and Computational Sciences, Addis Ababa University,
P.O. Box 1176, Addis Ababa, Ethiopia. E-mail: [email protected],
[email protected]/[email protected]
ABSTRACT: The research was designed to study the identities and concentrations of fatty acids in
edible oils that are mainly consumed in Ethiopia. A total of twenty three (23) different commercially available edible oils were analyzed using gas chromatography mass spectrometry (GCMS). Codes for the oils’ brands were used instead of names in order to avoid conflict of interest. The analysis results showed variation in identities and concentrations of fatty acids in the analyzed oil samples. Depending on the type and brand of the oils, different concentrations of saturated fatty acids (SFA) (9.92 ± 0.07 - 47.27 ± 0.54), mono unsaturated fatty acids (MUFA) (24.54 ± 0.46 - 66.84 ± 0.54) and poly unsaturated fatty acids (PUFA) (7.23 ± 0.08 - 59.11 ± 0.61) were obtained. In addition to the fatty acids, additives and impurities (contaminants) were also detected. The ratio of unsaturated to saturated fatty acids (P/S index) in all edible oils was calculated.
Keywords: Edible oils, Fatty acid contents, SFAs, MUFAs, PUFAs, P/S index, GCMS
INTRODUCTION
Lipids are among essential nutrients that can be obtained from food. They serve as membrane bilayer and sources of energy (Dowhan, W. and Bogdanov, M., 2002; McDonald et al., 2010; Gunstone, F.D., 2011; Huang, C. and Freter, C., 2015). Fats and oils belong to this class of food, and they share common molecular structures. They differ from each other only in the form they take at room temperature; fats are solid, where as oils are liquid. Fatty acids are triglyceride molecules which are composed of three fatty acid units connected to a glycerol unit (McDonald et al., 2010; Andersson et al., 2010; Technical Committee, 2016). The fatty acid chains attached to the glycerol units can be identical or different and unsaturated (oleic, linoleic, linolenic etc. acids) or saturated (myristic, palmitic, stearic etc. acids) (Figure 1).
Edible oils are among the most abundant cooking ingredients that contain essential fatty acids that are responsible for growth, (Giese, J., 1996) and are carriers of fat soluble vitamins (A, D, E, and K) (Moreira et al., 1999; Fasina et al., 2006). Generally, fatty acids (FAs) are classified as SFA, MUFA and PUFA (Chowdhury et al., 2007). Most of them are important to humans when they are in
the right amount (Gromadzka, J. and Wardencki, W., 2011).
Production of edible oils from oil seeds and oil-rich fruits are well known around the world. Ethiopia has favorable agro-climatic conditions for cultivation of oil seeds and is also one of the centers of origins for several oil crops such as sesame, niger, soybean, sunflower and cotton seeds (Beyene Tadesse, 2013). There are about 850 small-scale and micro oil processing plants in Ethiopia (Beyene Tadesse, 2013; addismodjo.net, 12 December 2016). They produce sealed and/or unsealed forms of oils. Mostly these oils pass through some form of preparation before being consumed for reasons such as safety, palatability, texture, flavor, to enhance the taste, and to increase the shelf life of the oils (O’Brien, D.R., 2000; Gromadzka, J. and Wardencki, W., 2011). As a result, many unnecessary changes occur in these products that reduce their nutritional qualities (Gromadzka, J. and Wardencki, W., 2011). Hence, extraction of edible oils needs carful processing in order to avoid the co-extraction of unnecessary components. According to the joint WHO/FAO report, the dietary trans fatty acids (TFAs) and SFAs have adverse effects on blood lipoprotein profiles and coronary heart diseases (CHD) (WHO/FAO, 2003; Nishida et al., 2004; Uauy et al. 2009; Joint FAO/WHO CODEX, 2010).
*Author to whom all correspondence should be addressed

22 Fsaha Tesfamicael and Estifanos Ele
Figure. 1: Chemical structure of fatty acids, 2, 3, 4, 5, 6 and 7 are SFAs, 8, 9 and 10 are MUFAs and 11, 12, 13, 14 and 15 are PUFAs.
The WHO/FAO end agreement was to avoid using industrially derived TFA and using food products with low content of SFAs, and replacing them with edible oils rich in PUFA and MUFA (Grompone, A.M., 2005; Mozaffarian et al., 2007; Uauy et al., 2009). High levels of SFAs is better to increase oil stability though it has adverse effects on CHD by increasing the concentration of low density lipoproteins-cholesterol (LDL-C) (WHO, 1990; Pacifici et al., 1994; Gurr, M.I., 1999; Lawton et al., 2000; Dzisiak, D., 2004; Uauy et al., 2009). Consumption of edible oils with high level of PUFAs leads to increase high-density lipoprotein- cholesterol (HDL-C) and decreases LDL-C, while higher intake of MUFAs decreases LDL-C, but does not affect HDL-C levels in the body (Uauy et al., 2009; Joint FAO/WHO CODEX, 2010). The trans fatty acids that emerge from edible oils are also the major risk factors for CHD and other chronic illnesses (Joint FAO/WHO CODEX, 2010; Stephen et al., 2013; Hajimahmoodi et al., 2013; Roe et al., 2013). Reports from the world health organization show CHD will remain one of the major killers in the coming decades (Mackay, J.
and Mensah, G., 2004; Stephen et al., 2013; Orsavova et al., 2015).
The nutritional values of oils and associated health risks can be determined by calculating the ratio of poly unsaturated to saturated fatty acids (P/S index values). Oils and fats with P/S index value higher than one are considered to have healthy nutritional values (Kostik et al., 2013). Several studies indicate that higher values of P/S index indicate a smaller deposition of lipids in the body (Lawton et al., 2000). Seriously, cardiovascular diseases have been documented to be the main cause of death in most Western countries (Mackay, J. and Mensah, G., 2004; Stephen et al., 2013; Orsavova et al., 2015). Even though enough worldwide information is out there, there is no enough documented data on level of fatty acids in edible oils that are sold in Ethiopia. Annually, Ethiopia imports several tons of edible oils which are not well regulated. Therefore, this research finding will became baseline information for consumers, policy makers, researchers, traders, health centers and

SINET: Ethiop. J. Sci., 39(1) 2016 23
manufacturers that can highlight the current status of edible oils.
system equipped with auto-sampler.
Figure 2: Structures of different detected additives and contaminants
The main objective of this work was to identify the fatty acid composition of several edible oils obtained from the market, in order to improve understanding of the society about the oil quality, stability and applicability for human nutrition.
EXPERIMENTAL SECTION
General
All solvents, standards and reagents used were of analytical grade that were purchased from Fisher Scientific UK, Bishop Meadow Road Loughborough, Leics, LEll 5RG, UK. The fatty acid standards were purchased from Sigma-Aldrich Chemie GmbH, Riedstrasse2, D-89555 Steinheim, Germany.
GCMS analysis was carried out using Agilent technologies 7820A GC and 5977E MSD
Chromatographic separations were carried out using HP-5 column with 30 m length, 0.25 mm internal diameter and 0.25 μm column phase thickness. Injection mode was split-less, helium was the carrier gas and 1μl volume of the sample was injected to the inlet heated to 275 °C. Initial oven temperature was 60 °C with 2 min hold time then heated to 200 °C with ramp 10 °C/min and 3 °C/min to 240 °C. The fatty acid methyl esters (FAMEs) were run on GCMS and the results were expressed as mean values ± standard deviation (M ± STD).
NMR spectra were recorded on Bruker Avance 400 MHz spectrometers. For 1H NMR (400 MHz) and 13C NMR (100.6 MHz) spectra, the chemical shifts (δ) are reported in parts per million (ppm) relative to TMS. The δ values are referenced to residual DMSO in DMSO-d6 at 2.50 ppm.
24 Fsaha Tesfamicael and Estifanos Ele
Materials
Twenty three different brands of edible oils (15 locally produced and 8 imported) were purchased from different market places in Addis Ababa during the period from February 2016 to June 2016. All samples were separately processed (esterified) and analyzed in triplicate. In order to avoid conflict of interest, all analyzed samples were given codes instead of the brand names. The codes of the analytical samples and their sources are given in Table 1.
Table 1. Analyzed oils and their sources
Types of edible oils Sources
KN, GN, RN, SN, KpN, FN, HN, NUN, FUN, RUN, SUN,
Niger
FF, VF, PF, SSF Sunflower
VP, OP Palm
ZB, TB, FB, SB Soybean
EX Olive
AM Cotton
Preparation of samples and standards:
Preparation of fatty acid methyl esters (FAMEs)
The transesterification of the oil samples were carried out in methanol (MeOH) using KOH as a base using the standard published procedure (Eder, K., 1995; AOAC., 2001; ISO 12966-2., 2011; Juskelis, R. and Cappozzo, J., 2014).
Method validation (transesterification of methyl ester)
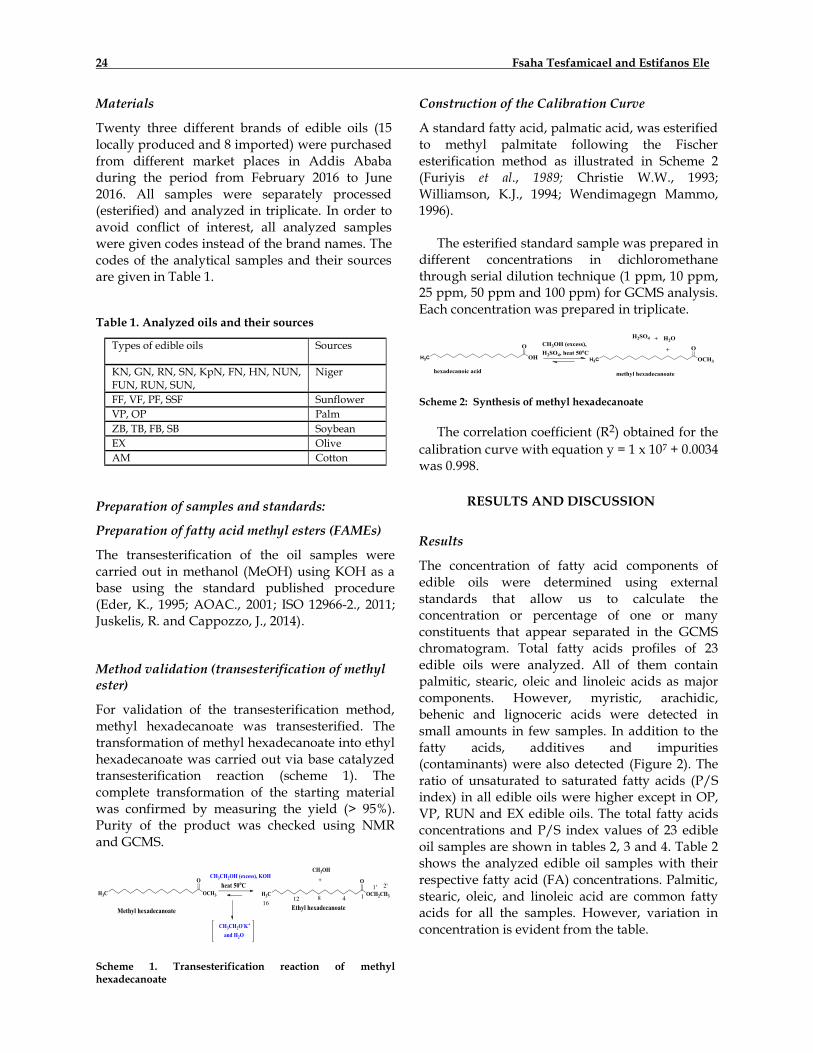
For validation of the transesterification method, methyl hexadecanoate was transesterified. The transformation of methyl hexadecanoate into ethyl hexadecanoate was carried out via base catalyzed transesterification reaction (scheme 1). The complete transformation of the starting material was confirmed by measuring the yield (> 95%). Purity of the product was checked using NMR and GCMS.
Scheme 1. Transesterification reaction of methyl hexadecanoate
Construction of the Calibration Curve
A standard fatty acid, palmatic acid, was esterified to methyl palmitate following the Fischer esterification method as illustrated in Scheme 2 (Furiyis et al., 1989; Christie W.W., 1993; Williamson, K.J., 1994; Wendimagegn Mammo, 1996).
The esterified standard sample was prepared in different concentrations in dichloromethane through serial dilution technique (1 ppm, 10 ppm, 25 ppm, 50 ppm and 100 ppm) for GCMS analysis. Each concentration was prepared in triplicate.
Scheme 2: Synthesis of methyl hexadecanoate
The correlation coefficient (R2) obtained for the
calibration curve with equation y = 1 x 10⁷ + 0.0034 was 0.998.
RESULTS AND DISCUSSION
Results
The concentration of fatty acid components of edible oils were determined using external standards that allow us to calculate the concentration or percentage of one or many constituents that appear separated in the GCMS chromatogram. Total fatty acids profiles of 23 edible oils were analyzed. All of them contain palmitic, stearic, oleic and linoleic acids as major components. However, myristic, arachidic, behenic and lignoceric acids were detected in small amounts in few samples. In addition to the fatty acids, additives and impurities (contaminants) were also detected (Figure 2). The ratio of unsaturated to saturated fatty acids (P/S index) in all edible oils were higher except in OP, VP, RUN and EX edible oils. The total fatty acids concentrations and P/S index values of 23 edible oil samples are shown in tables 2, 3 and 4. Table 2 shows the analyzed edible oil samples with their respective fatty acid (FA) concentrations. Palmitic, stearic, oleic, and linoleic acid are common fatty acids for all the samples. However, variation in concentration is evident from the table.

SINET: Ethiop. J. Sci., 39(1) 2016 25
Table 2: The analyzed edible oil samples with their respective fatty acid (FA) concentrations
Types of edible oils
Concentrations of FAMES ( Mean ± STD)
Myristic acid (%)
Palmitic acid (%)
Stearic acid (%)
Oleic acid (%)
Linoleic acid (%)
Arachidic acid (%)
Behenic acid (%)
Lignoceric acid (%)
01KN - 11.40±0.14 4.07±0.04 49.10±0.46 32.20±0.34 1.18±0.01 1.40±0.01 0.65±0.01
02GN - 9.77±0.10 3.63±0.04 51.00±0.48 31.8±0.34 0.91±0.01 1.93±0.02 0.94±0.01
03RN - 19.00±0.28 5.87±0.07 36.60±0.38 38.50±0.28 - - -
04SN - 13.20±0.08 6.07±0.05 50.10±0.51 27.50±0.24 0.83±0.01 1.40±0.01 0.87±0.01
05KpN - 7.51±0.09 3.49±0.03 36.50±0.32 52.50±0.57 - - -
06FN - 10.20±0.13 3.72±0.07 53.40±0.41 28.90±0.33 1.51±0.04 1.46±0.01 7.43±0.01
07 HN - 11.50±0.10 3.60±0.03 58.50±0.58 26.40±0.29 - - -
08NUN - 13.80±0.18 5.86±0.06 46.70±0.40 31.50±0.34 0.80±0.01 1.34±0.02 -
09FUN - 12.50±0.18 6.19±0.05 24.50±0.46 56.80±0.31 - - -
10RUN - 21.70±0.38 4.12±0.04 48.70±0.41 25.50±0.17 - - -
11 SUN - 10.00±0.08 3.39±0.05 49.30±0.47 32.80±0.32 0.85±0.03 2.34±0.03 1.24±0.01
12FF - 7.46±0.07 3.62±0.04 36.80±0.34 52.10±0.54 - - -
13VF - 6.58±0.05 3.34±0.02 40.60±0.31 49.40±0.61 - - -
14PF - 11.60±0.16 4.25±0.05 35.60±0.33 48.50±0.46 - - -
15SSF - 7.22±0.09 3.48±0.05 30.20±0.26 59.10±0.60 - - -
16VP 0.98±0.02 38.90±0.35 3.99±0.04 47.20±0.48 8.90±0.12 - - -
17OP 0.80±0.01 42.60±0.04 3.87±0.49 45.50±0.08 7.23±0.38 - - -
18ZB - 10.20±0.12 3.41±0.04 57.10±0.53 26.40±0.28 0.77±0.01 1.35±0.01 0.75±0.01
19TB - 11.80±0.12 7.76±0.08 35.20±0.34 45.20±0.46 - - -
20FB 10.50±0.08 3.11±0.01 43.40±0.35 43.10±0.55 - - -
21SB - 12.40±0.15 4.81±0.05 34.50±0.43 48.20±0.37 - - -
22EX - 14.40±0.15 3.50±0.04 66.80±0.54 15.30±0.26 - - -
23AM 0.55±0.00 25.20±0.30 2.29±0.01 28.80±0.13 43.10±0.56 - - -
Table 3 describes the average values of SFA, MUFA and PUFA, and the P/S index values for individual commercial edible oil samples. The P/S indexes that obtained were raging from 0.15-5.52. The value has direct relation to the quality of the oils. Those oils with P/S indexes less than one are not advisable for consumption purposes. Table 4 shows the average values of total SFA, MUFA and PUFA, and the P/S values of the commercial edible oils based on their sources.
Discussion
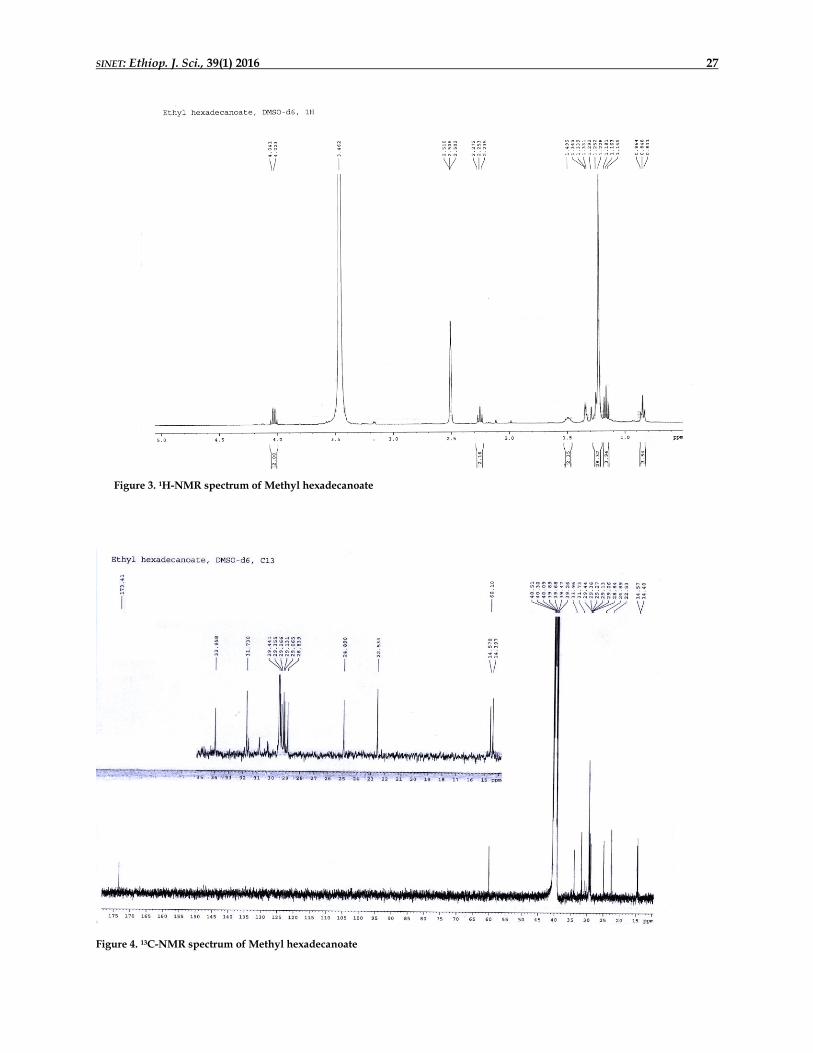
The transesterification reaction was conducted as indicated in methodology section. Both 1H-NMR, and 13C-NMR (Figure 3, 4) are in agreement with the structure of Ethyl hexadecanoate. The proton signal (quartet) at δ 4.03 ppm was assigned for oxygenated methylen group (C-1’).
The triplet at δ 2.25 ppm was assigned for C-2 methylen protons which are attached to carbonyl carbon. The quintet at δ 1.50 ppm was assigned to C-3 methylen protons. The broad and unresolved peaks between δ 1.19 ppm and 1.33 ppm were assigned to C4-C15 protons, and the methyl protons of ethoxy group (C-2’) appeared at δ 1.16 ppm. The triplet at δ 0.83 ppm belongs to terminal C-16 methyl group (Figure 3). All the information obtained confirms that the transesterification reaction (Schem 1) was conducted successfully. Characteristic peaks of 13C were clearly observed. The peak for carbonyl carbon of the ester was appeared at δ 173.41 ppm. The peak at 60.10 ppm was assigned to the oxygenated methylen group (Figure 4).

26 Fsaha Tesfamicael and Estifanos Ele
Table 3. Average values of SFA, MUFA and PUFA, and the P/S index values for individual commercial edible oil samples
Types of edible oils Types of fatty acids and concentrations
%SFA %MUFA %PUFA P/Sindex
01KN (Niger) 18.70±0.21 49.11±0.46 32.22±0.34 1.72
02GN (Niger) 17.18±0.18 51.01±0.48 31.82±0.34 1.85
03RN (Niger) 24.87±0.35 36.64±0.38 38.50±0.28 1.55
04SN (Niger) 22.37±0.16 50.12±0.51 27.54±0.24 1.23
05KpN (Niger) 11.00±0.12 36.53±0.32 52.53±0.57 4.77
06FN (Niger) 24.32±0.26 53.41±0.41 28.91±0.33 1.19
07 HN (Niger) 15.10±0.13 58.54±0.58 26.42±0.29 1.75
08NUN (Niger) 21.80±0.27 46.71±0.40 31.54±0.34 1.44
09FUN (Niger) 18.69±0.23 24.54±0.46 56.80±0.31 3.04
10RUN (Niger) 25.82±0.42 48.73±0.41 25.51±0.17 0.99
11 SUN (Niger) 17.82±0.20 49.31±0.47 32.84±0.32 1.84
12FF (sunflower) 11.08±0.11 36.81±0.35 52.14±0.54 4.71
13VF (sunflower) 9.92±0.07 40.64±0.31 49.43±0.61 4.98
14PF (sunflower) 15.85±0.21 35.64±0.33 48.53±0.46 3.06
15SSF (sunflower) 10.70±0.14 30.21±0.26 59.11±0.61 5.52
16VP (palm) 43.87±0.41 47.24±0.48 8.94±0.11 0.20
17OP (palm) 47.27±0.54 45.53±0.49 7.23±0.08 0.15
18ZB (soya bean) 16.48±0.19 57.14±0.53 26.44±0.28 1.61
19TB (soya bean) 19.56±0.20 35.23±0.34 45.24±0.46 2.31
20FB (soya bean) 13.61±0.09 43.41±0.35 43.12±0.55 3.17
21SB (soya bean) 17.21±0.20 34.54±0.43 48.23±0.37 2.80
22EX (olive) 17.90±0.19 66.84±0.54 15.34±0.26 0.85
23AM (cotton) 28.04±0.31 28.83±0.13 43.11±0.56 1.54
Table 4. Average values of total SFA, MUFA and PUFA, and the P/S values of the commercial oils based on their sources
Origins Mean ± SD P/Sindex
SFA (%) MUFA (%) PUFA (%)
Nigger edible oils(n=11)1.76 0.32±34.97 0.44±45.88 0.23±19.78 ٭
Sunflower seeds (n=4)4.40 0.56±52.30 0.31±35.83 0.13±11.89 ٭
Palm edible oils(n=2)0.18 0.10±8.09 0.49±46.39 0.48±45.57 ٭
Soya bean edible oils (n=4)2.44 0.42±40.76 0.41±42.58 0.17±16.72 ٭ aCotton seed edible oil(n=1)1.54 0.56±43.11 0.13±28.83 0.31±28.04 ٭ aOlive oil(n=1)0.86 0.26±15.34 0.54±66.84 0.19±17.90 ٭
;n is the number of samples analyzed٭a for cotton seed and olive oils single values were considered
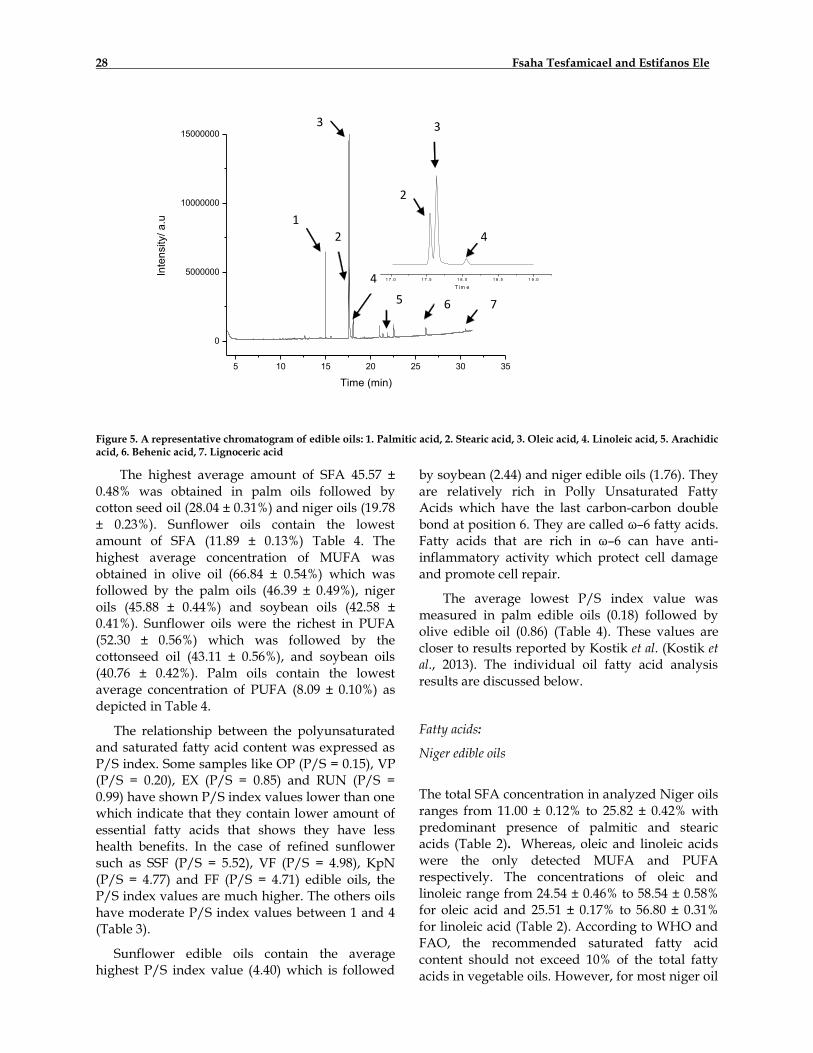
Among the detected SFAs, palmitic acid was obtained in the highest concentration which was followed by stearic acid. Oleic and linoleic acids
were detected in all edible oils. While myristic, arachidic, behenic and lignoceric acids appeared as minor fatty acids in KN, GN, SN, FN, SUN, ZB and NUN edible oils (Table 2, Figure 5).
SINET: Ethiop. J. Sci., 39(1) 2016 27
Figure 3. 1H-NMR spectrum of Methyl hexadecanoate
Figure 4. 13C-NMR spectrum of Methyl hexadecanoate
28 Fsaha Tesfamicael and Estifanos Ele
5 10 15 20 25 30 35
0
5000000
10000000
15000000
1 7 .0 1 7 .5 1 8 .0 1 8 .5 1 9 .0
T im e
Inte
nsity/ a
.u
Time (min)
1
2
3
4
5 6 7
2
3
4
Figure 5. A representative chromatogram of edible oils: 1. Palmitic acid, 2. Stearic acid, 3. Oleic acid, 4. Linoleic acid, 5. Arachidic acid, 6. Behenic acid, 7. Lignoceric acid
The highest average amount of SFA 45.57 ± 0.48% was obtained in palm oils followed by cotton seed oil (28.04 ± 0.31%) and niger oils (19.78 ± 0.23%). Sunflower oils contain the lowest amount of SFA (11.89 ± 0.13%) Table 4. The highest average concentration of MUFA was obtained in olive oil (66.84 ± 0.54%) which was followed by the palm oils (46.39 ± 0.49%), niger oils (45.88 ± 0.44%) and soybean oils (42.58 ± 0.41%). Sunflower oils were the richest in PUFA (52.30 ± 0.56%) which was followed by the cottonseed oil (43.11 ± 0.56%), and soybean oils (40.76 ± 0.42%). Palm oils contain the lowest average concentration of PUFA (8.09 ± 0.10%) as depicted in Table 4.
The relationship between the polyunsaturated and saturated fatty acid content was expressed as P/S index. Some samples like OP (P/S = 0.15), VP (P/S = 0.20), EX (P/S = 0.85) and RUN (P/S = 0.99) have shown P/S index values lower than one which indicate that they contain lower amount of essential fatty acids that shows they have less health benefits. In the case of refined sunflower such as SSF (P/S = 5.52), VF (P/S = 4.98), KpN (P/S = 4.77) and FF (P/S = 4.71) edible oils, the P/S index values are much higher. The others oils have moderate P/S index values between 1 and 4 (Table 3).
Sunflower edible oils contain the average highest P/S index value (4.40) which is followed
by soybean (2.44) and niger edible oils (1.76). They are relatively rich in Polly Unsaturated Fatty Acids which have the last carbon-carbon double bond at position 6. They are called ω–6 fatty acids. Fatty acids that are rich in ω–6 can have anti-inflammatory activity which protect cell damage and promote cell repair.
The average lowest P/S index value was measured in palm edible oils (0.18) followed by olive edible oil (0.86) (Table 4). These values are closer to results reported by Kostik et al. (Kostik et al., 2013). The individual oil fatty acid analysis results are discussed below.
Fatty acids:
Niger edible oils
The total SFA concentration in analyzed Niger oils ranges from 11.00 ± 0.12% to 25.82 ± 0.42% with predominant presence of palmitic and stearic acids (Table 2). Whereas, oleic and linoleic acids were the only detected MUFA and PUFA respectively. The concentrations of oleic and linoleic range from 24.54 ± 0.46% to 58.54 ± 0.58% for oleic acid and 25.51 ± 0.17% to 56.80 ± 0.31% for linoleic acid (Table 2). According to WHO and FAO, the recommended saturated fatty acid content should not exceed 10% of the total fatty acids in vegetable oils. However, for most niger oil

SINET: Ethiop. J. Sci., 39(1) 2016 29
brands concentrations of SFA are higher than the recommended value. The values are also varied which may be arisen from variation in plants growth conditions, seed maturation, and possibly adulteration with chip edible oils. For example RUN Niger oil has high amount of SFA and low amount of PUFA (Table 2) and P/S index less than one, which is an indication for adulteration with other oils.
The high concentrations of linoleic acids in edible oils benefit the consumers by increasing the good cholesterol and decreasing the bad cholesterol. The linoleic acid profiles observed in this study are a bit lower than reported values (Dutta et al., 1994; Getinet Alemaw and Adefris
Teklewold, 1995; Dagne Kifle. and Jonsson, A., 1997; Ramadan, M.F. and Morsel, J.T., 2003). However, the oleic acids content are high when compared to values reported by different researchers and organizations (Dutta, et al., 1994; Getinet Alemaw and Adefris Teklewold, 1995;
Dagne Kifle. and Jonsson, A., 1997; Ramadan, M.F. and Morsel, J.T., 2003). The SFA contents observed in these edible oils are slightly higher than the previous reports (Dutta et al., 1994; Getinet Alemaw and Adefris Teklewold, 1995; Dagne
Kifle. and Jonsson, A., 1997; Ramadan, M.F. and Morsel, J.T., 2003). These variations could be due to variation in growth conditions and adulteration.
Sunflower edible oils
The fatty acid components of the sunflower oils were palmitic, stearic, oleic and linoleic acids wherein the content of linoleic acids was the highest (Table 2). The concentration of SFA ranges from 9.92 ± 0.07% to 15.85 ± 0.21% (Table 3). This value is lower when compared to the SFA concentration in niger oils (Table 3), which can be taken as a measure of its quality. The average linoleic acid (PUFA) concentration of the sunflower edible oils is the highest among analyzed oils (Table 4). This can be clearly seen in the average P/S index value of the oil (4.40, Table 4). The content of saturated fatty acids of some sunflower edible oils was higher than the previously reported literatures (Deffense, E., 1995; Grompone, M.A., 2011) and standards (Joint FAO/WHO CODEX 210-1999, 2015) though its fatty acid profiles are in good agreement with reported data (Hammond et al, 2005). In general, the analyzed sunflower oils have higher contents
of PUFA and lower contents of SFA compared to other oils (Table 4), which is the sign of the healthy oils.
Soybean oils
The major fatty acids that were detected in soybean edible oils were palmitic, stearic, oleic and linoleic acids. In addition, ZB soybean oil contains long carbon chain saturated fatty acids such as arachidic, behenic and, lignoceric acids (Table 2). The SFA levels in soybean oils range from 13.61 ± 0.09% to 19.56 ± 0.20%. The MUFA levels range from 34.54 ± 0.43% to 57.14 ± 0.53%. While the measured values of PUFA are between 26.44 ± 0.28% and 48.23 ± 0.37%. Among the analyzed oil samples, the second highest MUFA was measured for ZB which is 57.14 ± 0.53% (Table 3). The linoleic acid concentration in ZB oil is the lowest (26.40 ± 0.24%) of the soybean oils. The observed variation in concentration might be due to maturity levels of the seeds as well as other environmental and processing factors (Hammond et al, 2005).
The level of saturated fatty acid in soybean oils is in agreement with the literature data (Zambiazi, et al., 2007; Wang, T., 2011; Grompone, M.A., 2011; Kostik et al., 2013; Joint FAO/WHO CODEX 210-1999, 2015). The MUFA and PUFA values are slightly different from the literature data (Hammond et al, 2005; Zambiazi et al., 2007; Wang, T., 2011; Kostik et al., 2013; Joint FAO/WHO CODEX 210-1999, 2015). However, PUFA amounts are within the FAO/WHO codex recommended range (Joint FAO/WHO CODEX 210-1999, 2015).
Palm edible oils
Palm oils contain myristic, palmitic, stearic, oleic and linoleic acid wherein the content of oleic acids was the highest (Table 2). The OP palm oil has the highest concentration of SFA 47.27 ± 0.54% followed by VP oil (43.87 ± 0.41%). Their saturated fatty acid profiles are in good agreement with published literatures data (Siew et al., 1990; Deffense, E., 1995). The SFA contents measured in the palm oils are a bit high (Tavares, M. and Barberio, J.C., 1993; Chowdhury et al., 2007; Zambiazi et al., 2007), and they contain the lowest concentration of PUFA (Table 3) with an indication of health risks.
30 Fsaha Tesfamicael and Estifanos Ele
Cotton edible oils
The single cotton seed oil analyzed contains myristic, palmitic, stearic, oleic and linoleic acids
with the highest linoleic acids content (43.11 ± 0.56%).
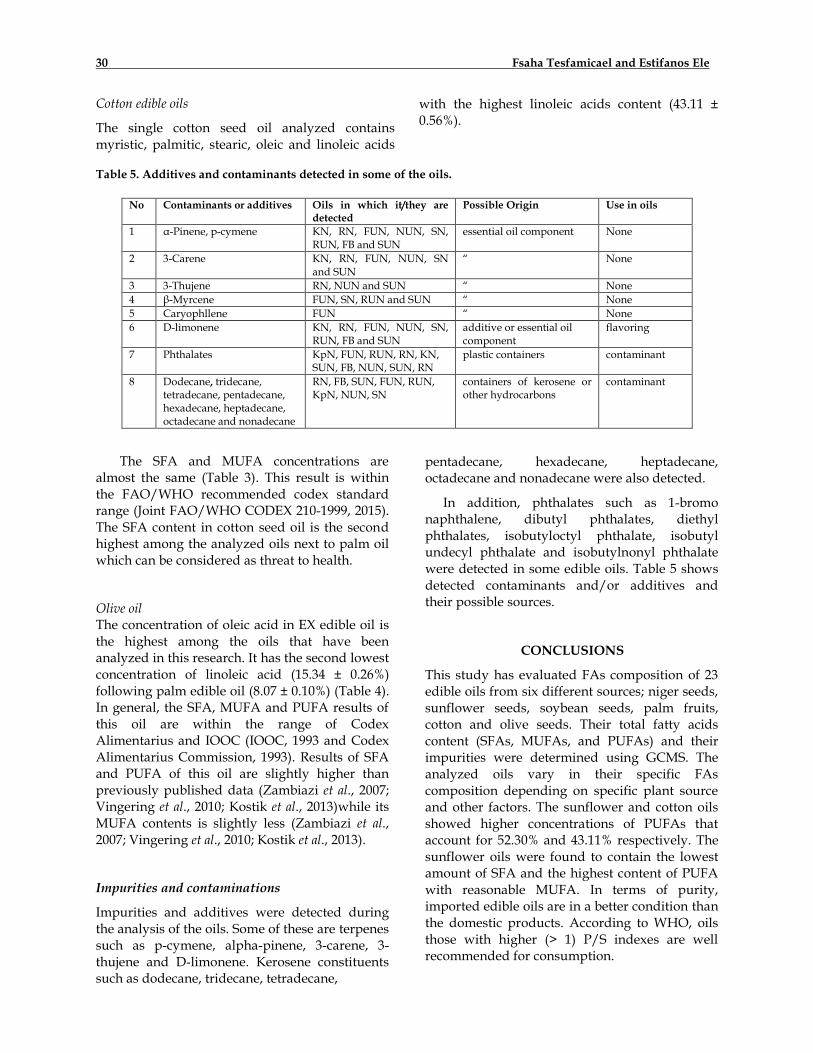
Table 5. Additives and contaminants detected in some of the oils.
No Contaminants or additives Oils in which it/they are
detected Possible Origin Use in oils
1 α-Pinene, p-cymene KN, RN, FUN, NUN, SN, RUN, FB and SUN
essential oil component None
2 3-Carene KN, RN, FUN, NUN, SN and SUN
“ None
3 3-Thujene RN, NUN and SUN “ None
4 β-Myrcene FUN, SN, RUN and SUN “ None
5 Caryophllene FUN “ None
6 D-limonene KN, RN, FUN, NUN, SN, RUN, FB and SUN
additive or essential oil component
flavoring
7 Phthalates KpN, FUN, RUN, RN, KN, SUN, FB, NUN, SUN, RN
plastic containers contaminant
8 Dodecane, tridecane, tetradecane, pentadecane, hexadecane, heptadecane, octadecane and nonadecane
RN, FB, SUN, FUN, RUN, KpN, NUN, SN
containers of kerosene or other hydrocarbons
contaminant
The SFA and MUFA concentrations are almost the same (Table 3). This result is within the FAO/WHO recommended codex standard range (Joint FAO/WHO CODEX 210-1999, 2015). The SFA content in cotton seed oil is the second highest among the analyzed oils next to palm oil which can be considered as threat to health.
Olive oil The concentration of oleic acid in EX edible oil is the highest among the oils that have been analyzed in this research. It has the second lowest concentration of linoleic acid (15.34 ± 0.26%) following palm edible oil (8.07 ± 0.10%) (Table 4). In general, the SFA, MUFA and PUFA results of this oil are within the range of Codex Alimentarius and IOOC (IOOC, 1993 and Codex Alimentarius Commission, 1993). Results of SFA and PUFA of this oil are slightly higher than previously published data (Zambiazi et al., 2007; Vingering et al., 2010; Kostik et al., 2013)while its MUFA contents is slightly less (Zambiazi et al., 2007; Vingering et al., 2010; Kostik et al., 2013).
Impurities and contaminations
Impurities and additives were detected during the analysis of the oils. Some of these are terpenes such as p-cymene, alpha-pinene, 3-carene, 3-thujene and D-limonene. Kerosene constituents such as dodecane, tridecane, tetradecane,
pentadecane, hexadecane, heptadecane, octadecane and nonadecane were also detected.
In addition, phthalates such as 1-bromo naphthalene, dibutyl phthalates, diethyl phthalates, isobutyloctyl phthalate, isobutyl undecyl phthalate and isobutylnonyl phthalate were detected in some edible oils. Table 5 shows detected contaminants and/or additives and their possible sources.
CONCLUSIONS
This study has evaluated FAs composition of 23 edible oils from six different sources; niger seeds, sunflower seeds, soybean seeds, palm fruits, cotton and olive seeds. Their total fatty acids content (SFAs, MUFAs, and PUFAs) and their impurities were determined using GCMS. The analyzed oils vary in their specific FAs composition depending on specific plant source and other factors. The sunflower and cotton oils showed higher concentrations of PUFAs that account for 52.30% and 43.11% respectively. The sunflower oils were found to contain the lowest amount of SFA and the highest content of PUFA with reasonable MUFA. In terms of purity, imported edible oils are in a better condition than the domestic products. According to WHO, oils those with higher (> 1) P/S indexes are well recommended for consumption.
SINET: Ethiop. J. Sci., 39(1) 2016 31
ACKNOWLEDGEMENTS
The authors would like to thank the Department of Chemistry, Addis Ababa University for the support and the Ethiopian Police University College (EPUC) for sponsoring the student (Mr. Fsaha) during his MSc study.
REFERENCES
1. Addis Modjo edible oil complex S.C. (accessed 12
December 2016), addismodjo.net.
2. Barison, A., da Silva, C.W., Campos, F.R., Simonelli, F., Lenz, C.A. and Ferreira, A.G. (2010). A simple methodology for the determination of fatty acid composition in edible oils through 1H NMR spectroscopy. Magn. Reson.Chem. 48: 642-650.
3. AOAC. (2001). Fat (Total, Saturated and Unsaturated) in foods, hydrolytic extraction gas chromatographic method, 18th edition, AOAC official method 996.06, AOAC International, Arlington.
4. Beyene Tadesse. (2013). Final MDG-F Joint Programme Narrative Report; MDG-F-2053-D-ETH; MDGIF and Ethiopia joint programme: Ethiopia, pp. 1-30.
5. Chowdhury, K., Banu, L. A., Khan, S. and Latif, A. (2007). Studies on the fatty acid composition of edible oil. Bangladesh J. Sci. Ind. Res. 42: 311 - 316.
6. Christie, W.W. (1993). Preparation of ester derivatives of fatty acids for chromatographic analysis, in: Christie W.W. (Ed.), Advances in lipid methodology-2, The Oily Press LTD, Dundee, Scotland, pp. 69–111.
7. Codex Alimentarius Commission Doc. CL 1993/15-FO, May 1993 (proposed draft revised standard for olive oils).
8. Codex Alimentarius Commission; Joint FAO/WHO Food Standards Programme. (2015). Standard for named vegetable oils; codex stan 210-1999; Codex Alimentarius international food Standards: Geneva, Switzerland, pp. 1-13.
9. Kifle Dagne and Jonsson, A. (1997). Oil content and fatty acid composition of seeds of Guizotia Cass.(Compositae). J. Sci. Food Agric. 73: 274–278.
10. Deffense, E. (1995). Dry multiple fractionation: trends in productions and applications. Lipid Technol. 7: 34–38.
11. Dowhan, W. and Bogdanov, M. (2002). Functional roles of lipids in membranes. In Biochemistry of Lipids, Lipoproteins and Membranes. D. E. Vance and J. E. Vance, editors. Elsevier Science, Amsterdam, Netherlands, pp. 1–35.
12. Dutta, P.C., Helmersson, S., Eshetu Kebedu, Getinet Alema and Appelqvist, Lars-Åke (1994). Variation in lipid composition of niger seed (Guizationabyssinica Cass.) samples collected from different regions in Ethiopia. J. Am. Oil Chem. Soc. 71: 839-843.
13. Dzisiak, D. (2004). New oils reduce saturated and trans fats in processed foods. Cereal Foods World. 49: 331-333.
14. Eder, K. (1995). Gas chromatography analysis of fatty acid methyl esters. J. Chromatogr B. 671: 113–31.
15. Fasina, O.O., Hallman, H., Craig‐ Schmidt, M. and Clements, C. (2006). Predicting temperature-dependence viscosity of vegetable oils from fatty acid composition. J. Am. Oil Chem. Soc. 83: 899 – 903.
16. Furniss, B.S., Hannaford, A.J., Smith, P.W.G. and Tatchell, A.R. (1989). Fischer esterification mechanism. Vogel's textbook of practical organic chemistry, 5th ed. John Wiley & Sons, Inc. United States, New York.
17. Getinet Alemaw and AdefrtsTeklewold. (1995). An agronomic and seed-quality evaluation of niger (Guizotiaabyssinica Cass) germplasm grown in Ethiopia. Plant Breed. 114: 375-376.
18. Giese, J. (1996). Fat, oil and fat replacer. Food Technology. 50: 78–84.
19. Gromadzka, J. and Wardencki, W. (2011). Trends in edible vegetable oils analysis. Part A. Determination of different components of edible oils-a review. Pol. J. Food Nutr. Sci. 61: 33–43.
20. Grompone, M.A. (2005). Bailey’s industrial Oil and Fat Products: chemistry, properties, and health effects. John Wiley & Sons: Newfoundland, Canada, 2: 665-680.
21. Grompone, M.A. (2011). Sunflower Oil. Vegetable oils in food technology: composition, properties and uses. Gunstone, F.D., Ed. Blackwell Publishing Ltd. Oxford,UK, Pp. 137-160.
22. Gunstone, F.D. (2011). Vegetable oils in food technology: composition, Properties and uses. 2nd ed. Blackwell Publishing Ltd. London, UK, pp. 33-34, 41, 63,108-109, 116, 208, 232, 278-282.
23. Gurr, M.I. (1999). Lipids in Nutrition and Health: a Reappraisal, the Oily Press, Bridge water.
24. Hajimahmoodi, M., Aram, S., Nosrati, M., Moghaddam, G., Sadeghi, N., Oveisi, M.R. Jannat, B. and Mazdeh, F.Z. (2013). Trans Fatty Acid Content of Iranian Edible Oils, Food and Nut. Sci. 4: 1167-1174.
25. Shahidi, F. (2005). IN Edible Oil and Fat Products: Chemistry, Properties, and Health Effects, 6th ed.; John Wiley & Sons: Newfoundland, Canada, 2: 177, 194-201, 220-232, 577-641.
26. Hong Kong Centre for Health Protection: department of health. (2017). Death Rates for

32 Fsaha Tesfamicael and Estifanos Ele
Leading Causes of Death from 2001–2016. (http://www.chp.gov.hk/en/data/4/10/27/117.html)
27. Huang, C. and Freter, C. (2015). Lipid metabolism, apoptosis and cancer therapy. Int. J. Mol. Sci. 16: 924-949.
28. International Olive Oil Council (IOOC), Doc. IOOC/T.15/NC no. 1/Rev. 6, June 10, 1993
29. ISO 12966-2. (2011). Animal and vegetable fats and oils -- Gas chromatography of fatty acid methyl esters - Part 2: Preparation of methyl esters of fatty acids. Geneva
30. Joint FAO/WHO Food Standards Programme, Secretariat of the CODEX Alimentarius Commission. (2010). CODEX Alimentarius (CODEX) Guidelines on Nutrition Labeling CAC/GL 2–1985 as Last Amended 2010. Rome, Italy, PP. 1-183.
31. Juskelis,R. and Cappozzo,J. (2014). Automated Sample Preparation for FAME Analysis in Edible Oils Using an Agilent 7696A Sample Prep WorkBench.Agilent Technologies, Inc. Wilmington, USA, pp. 1-7.
32. Kostik, V., Memeti S. and Bauer, B. (2013). Fatty acid composition of edible oils and fats. JHED 4: 112–116.
33. Latini, G. (2005). Monitoring phthalate exposure in humans. Clin. Chim. Acta. 361: 20–29.
34. Lawton, C.L., Delargy, H.J., Brockman, J., Smith, F.C. and Blundell, J.E. (2000). The degree of saturation of fatty acids influences post-ingestive satiety. Br J Nutr. 83: 473–482.
35. Mackay, J. and Mensah, G. (2004). Atlas of heart disease and stroke. Geneva: World Health Organization, Pp. 93-103.
36. McDonald, P., Edwards, R.A. and Greenhalgh, J.F.D. (2010). Animal Nutrition. 7th ed. Essex: Prentice Hall, Pearson, USA, pp. 1-3,32-34
37. Moreira, R.G., Castell-Perez, M.E. and Barrufet, M.A. (1999). Deep-fat frying fundamentals and applications. Aspen publications: Gaithersburg, MD, PP. 350.
38. Mozaffarian, D., Abdollahi, M., Campos, H., Houshiarrad, A. and Willett,W.C. (2007). Consumption of trans fats and estimated effects on coronary heart disease in Iran. Eur J Clin Nutr. 61:1004–1010.
39. Nishida, C., Uauy, R., Kumanyika, S. and Shetty, P. (2004). Diet, nutrition and the prevention of chronic diseases: report of a joint WHO/FAO expert consultation. Public Health Nutr. 7: 245–250.
40. O’Brien, D.R. (2000). Shortening Technology. Introduction to Fats and Oils Technology, 2ndED., O’Brien, D.R., Farr, W.E. and Wan, P.S., Eds. AOCS press, Champaign, Illinois, pp. 421–426.
41. Orsavova, J., Misurcova, L., Ambrozova, J.V., Vicha, R. and Mlcek, J. (2015). Fatty acids
composition of vegetable oils and its contribution to dietary energy intake and dependence of cardiovascular mortality on dietary intake of fatty acids. Int. J. Mol. Sci. 16: 12871-12890.
42. Pacifici, E.H., McLeod, L.L., Peterson, H. and Sevanian, A. (1994). Linoleic acid hydroperoxide-induced peroxidation of endothelial cell phospholipids and cytotoxicity. Free Radic Biol Med. 17: 285–295.
43. Ramadan, M.F. and Morsel, J.T. (2003). Determination of the lipid classes and fatty acid profile of niger (Guizotiaabyssinica Cass) seed oil. Phytochemical Analysis 14: 366-370.
44. WHO (1990). Diet, nutrition, and the prevention of chronic diseases. World Health Organ Tech Rep Ser. 797: 1–204.
45. Roe, M., Pinchen, H., Church, S., Elahi, S., Walker, M., Farron-Wilson, M., Buttriss, J. and Finglas, P. (2013).Trans fatty acids in a range of UK processed foods. J. food chem. 140: 427-431.
46. Sharman, M., Read, W.A., Castle, L. and Gilbert, J. (1994). Levels of di-(2-ethylhexyl) phthalate and total phthalate esters in milk, cream, butter and cheese. Food Addit Contam. 11: 375-385.
47. Siew, W.L., Chong, C.L., Tan, T.A., Fairuza, S. and Yassin, M. (1990). Identify characteristics of processed palm oils for export. PORIM report, PO(169)90, Malaysian palm oil board, kuala lumpur, pp. 1-17.
48. Stephen, W.C., Tong, S.K., Violette, F.P., Melva Y.Y., Janny, K.M., Xiao, Y. and Ho, Y.Y. (2013). Trans Fatty Acids in the Hong Kong Food Supply. Hindawi Publishing Corporation: J. Chem. 2013: 1-7.
49. Tavares, M. and Barberio, J.C. (1993). Fatty acid composition of Brazilian palm oil, in proceedings of the PORIM international palm oil congress. Brazilian, pp. 328-332.
50. Technical Committee of the Institute of Shortening and Edible Oils. (2016). Food fats and oils, 10th ed.; Institute of Shortening and Edible Oils: Washington DC, USA, PP. 1-3.
51. Uauy, R., Aro, A., Clarke, R., Ghafoorunissa, R., L’Abbe´, M., Mozaffarian, D., Skeaff, M., Stender, S., and Tavella, M. (2009). WHO Scientific Update on trans fatty acids: summary and conclusions. Eur J Clin Nutr. 63: S68–S75.
52. Vingering, N., Oseredczuk, M., Chaffaut, L., Ireland, J., and Ledoux, M. (2010). Fatty acid composition of commercial vegetable oils from the French market analysed using a long highly polar column. OCL. 17:185-192.
53. Wang, T. (2011). Soybean Oil. Vegetable oils in food technology: composition, properties and uses. Gunstone, F.D., Ed. Blackwell Publishing Ltd. Oxford, UK, Pp. 59-65.

SINET: Ethiop. J. Sci., 39(1) 2016 33
54. Wendimagegn Mammo. (1996). Practical organic chemistry II, laboratory manual. AAU, Ethiopia, pp. 16 – 19.
55. WHO/FAO. (2003). Diet, nutrition and the prevention of chronic disease, Report of a Joint WHO/FAO Expert Consultation. WHO Technical Report Series: World Health Organization, Geneva, pp. 56.
56. Williamson, K.J. (1994). Macroscale and microscale organic experiments (2nd ed.). Lexington, Mass.: D.C, Health.
57. Zambiazi, R.C., Roman P., Moema W. and Carla B.M. (2007). Fatty acid composition of vegetable oils and fats. B.CEPPA, Curitiba 25: 111 - 120.